An Analysis of Machining System Capability and Its Link ...620981/FULLTEXT01.pdf · and...
70
An Analysis of Machining System Capability and Its Link with Machined Component Quality Tomas ¨ Osterlind Licentiate Thesis KTH Royal Institute of Technology Department of Production Engineering Stockholm APRIL 2013
Transcript of An Analysis of Machining System Capability and Its Link ...620981/FULLTEXT01.pdf · and...
An Analysis of Machining System Capability and ItsLink with Machined Component Quality
Tomas OsterlindLicentiate Thesis
KTH Royal Institute of TechnologyDepartment of Production Engineering
Stockholm
APRIL 2013

TRITA-IIP-13-03ISSN 1650-1888ISBN 978-91-7501-757-0c©Tomas Osterlind, April 2013KTH Royal Institute of TechnologyDepartment of Production EngineeringSE-100 44 Stockholm, Sweden

Abstract
Machining components out of tolerances is of no use in competitiveproduction. The machining system sets the limitations of dimensionalaccuracy and surface quality of a machined component. The capabilityof the machining system describes these limits in terms of specifiedvalues. This thesis deals with machining system capability analysismainly focused on machine tool static and dynamic stiffness.
The influence of stiffness and flexibility on machining systemcapability is analytically and experimentally investigated. Theexperimental work presented in the thesis complies with the theoriesand shows the relation between machine tool capability and theoutcome on the machine component.
The concept of capability analysis by elastic linked system andthe currently available tools for such an evaluation is presented anddiscussed. The basis of elastic linked system analysis is the use ofmeasurements under loaded condition. The machine tool is loadedwith a known force creating a test condition closer to real machining,compared to current methods of unloaded machine tools. Twomeasurement tools for elastic linked system capability analysis areexplained in the thesis: Loaded Double Ball Bar and ContactlessExcitation and Response System.
The thesis consists of an analytical base and an experimental casestudy on spiral bevel gear face milling. The experiments are discussedand compiled with the given theories.
Keywords: Machining System Capability, Elastic Linked System,Spiral Bevel Gear Face Milling.
iii


Sammanfattning
Inom skarande bearbetning ar komponenter utanfor givna toleranserej acceptabelt i konkurrenskraftig produktion. Bearbetningssystemetsatter begransningarna for maximal geometrisk noggrannhet ochytfinhet. Ett matt pa detta ar bearbetningssystemets kapabilitet.Denna avhandling behandlar kapabilitetsanalys av bearbetningssystemmed fokus pa statisk och dynamisk styvhet.
Hur styvhet och eftergivlighet paverkar kapabiliteten ar utvarderatbade analytiskt och experimentellt. Det experimentella arbetet sompresenteras i avhandlingen overrensstammer med teorierna och pavisarforhallandet mellan bearbetningssystemets kapabilitet och resultatet pabearbetad komponent.
Konceptet for kapabilitetsanalys med elastiskt sammankopplatsystem och tillgangliga testverktyg ar framlagt i avhandlingen. Grundenfor utvardering med ett elastiskt sammankopplat system ar matningarunder belastat tillstand. Verktygsmaskinen belastas med en kand kraftvilket skapar en testsituation som ar mer lik bearbetning, jamfort medtester i obelastat system. Tva verktyg for matning av kapabilitetmed elastisk sammankopplade system ar presenterade i avhandlingen:Loaded Double Ball Bar och Contactless Excitation and ResponseSystem.
Avhandlingen bestar av en analytisk bas och en experimentellstudie i frasning av kronhjul. Experimenten ar diskuterade ochoverrensstammer med de givna teorierna.
Nyckelord: Bearbetningssystems Kapabilitet, ElastiskSammankopplat System, Kronhjulsfrasning
v


Acknowledgements
There are certain persons that deserve an extra thanks for the supportduring the progress of this thesis. It is sometimes said that all goodthings comes in three and so we shall see. I hope you find thelogic behind the usage or resemblance of fictitious characters in myappreciations. The first three persons to receive my gratitude are mysupervisors, de tre vise mannen: Cornel Mihai Nicolescu, Leif Kariand Amir Rashid. They shared their wisdom, thus giving me the giftof knowledge when supervising me in my progress towards a PhD. I givethe next big thank you for a kind introduction of machine tool dynamicsand metal cutting, motivating PhD studies and great hints and advice,from the start of my Master thesis, given by the three musketeers:Lorenzo Daghini, Andreas Archenti and Anders Berglund. Next in linecomes my two closest colleagues (together with whom I somewhat, formthe three nephews): Constantinos Frangoudis and Qilin Fu.
I would also like to quickly say thank you to Thomas Lundholm fortaking me in to Robust Machining and Fredagsrus and Antonio Maffei;thanks for the “work supporting” coffee and small talk.
This work was funded by VINNOVA (The Swedish GovernmentalAgency for Innovation Systems), KTH DMMS and has been supportedby XPRES (Initiative for excellence in production research).
vii


Contents
Abbreviations xv
1 Introduction 11.1 Thesis Background . . . . . . . . . . . . . . . . . . . . . 21.2 Research Questions . . . . . . . . . . . . . . . . . . . . . 31.3 Thesis Structure . . . . . . . . . . . . . . . . . . . . . . 4
2 Machining System 72.1 Capability of Machining System . . . . . . . . . . . . . . 8
2.1.1 Geometric and Kinematic Accuracy . . . . . . . 92.1.2 Thermal Influence . . . . . . . . . . . . . . . . . 102.1.3 Static Stiffness . . . . . . . . . . . . . . . . . . . 112.1.4 Dynamic Flexibility . . . . . . . . . . . . . . . . 13
2.2 Vibrations in Machining Systems . . . . . . . . . . . . . 142.2.1 Forced Vibrations . . . . . . . . . . . . . . . . . 152.2.2 Self Excited Vibrations . . . . . . . . . . . . . . 162.2.3 Impact Testing . . . . . . . . . . . . . . . . . . . 18
2.3 Capability Analysis by Elastic Linked System . . . . . . 192.3.1 Loaded Double Ball Bar . . . . . . . . . . . . . . 202.3.2 Contactless Excitation and Response System . . 24
3 Evaluation and Analysis Methodology of Spiral BevelGear Milling 253.1 Steps to identify the cause of vibration . . . . . . . . . . 253.2 Damping Treatment of Cutter by High Damping Interface 26
ix

x CONTENTS
3.2.1 Viscoelastic Polymer . . . . . . . . . . . . . . . . 263.2.2 Carbon-based Nano-composite Coating . . . . . 26
3.3 Methods/Approach . . . . . . . . . . . . . . . . . . . . . 273.3.1 Experimental Modal Analysis . . . . . . . . . . . 273.3.2 Acoustic Imaging . . . . . . . . . . . . . . . . . . 283.3.3 Machining Tests . . . . . . . . . . . . . . . . . . 293.3.4 Surface Measurement on Work Piece . . . . . . . 30
4 Results 334.1 Experimental Modal Analysis . . . . . . . . . . . . . . . 33
4.1.1 EMA in Machining System . . . . . . . . . . . . 334.1.2 EMA of Cutter . . . . . . . . . . . . . . . . . . . 34
4.2 Acoustic Camera . . . . . . . . . . . . . . . . . . . . . . 354.3 Machining Tests . . . . . . . . . . . . . . . . . . . . . . 36
4.3.1 Full Cutter Tests . . . . . . . . . . . . . . . . . . 364.3.2 Sparse Cutter Tests . . . . . . . . . . . . . . . . 39
4.4 Surface measurements . . . . . . . . . . . . . . . . . . . 414.5 Summery of Results . . . . . . . . . . . . . . . . . . . . 43
5 Discussion and Conclusion 455.1 Experimental tests . . . . . . . . . . . . . . . . . . . . . 455.2 ELS analysis evaluation . . . . . . . . . . . . . . . . . . 465.3 Ideas . . . . . . . . . . . . . . . . . . . . . . . . . . . . . 475.4 Concluding Discussion . . . . . . . . . . . . . . . . . . . 47
6 Future work 49
A Paper A 55
B Paper B 71

List of Figures
1.1 Vibration marks in work piece. . . . . . . . . . . . . . . 2
1.2 Chipping of stick blade. . . . . . . . . . . . . . . . . . . 2
1.3 Kinematic scheme of investigated bevel gear millingmachine. . . . . . . . . . . . . . . . . . . . . . . . . . . . 3
1.4 Clamping of stick blades in cutter body. . . . . . . . . . 3
1.5 Clamping scheme sketch. . . . . . . . . . . . . . . . . . . 3
2.1 Kinematic scheme for a 3-axis serial kinematic structuredmachine tool. . . . . . . . . . . . . . . . . . . . . . . . . 10
2.2 Kinematic scheme for a 3-axis parallel kinematic structuredmachine tool. . . . . . . . . . . . . . . . . . . . . . . . . 10
2.3 Thermal representation in a machining system. . . . . . 11
2.4 Effects of static cutting along a work piece with varyingnominal thickness . . . . . . . . . . . . . . . . . . . . . . 12
2.5 Closed loop system representing machining. . . . . . . . 15
2.6 Simulated cutting force - Slotting operation with endmill, number of teeth=3, depth of cut=2 mm, feed=0.15mm/tooth, specific cutting stiffness=750 N/mm2 . . . . 16
2.7 Stability lobe diagram. . . . . . . . . . . . . . . . . . . . 18
2.8 Schematic representation of Elastic Linked System in3-axis milling machine . . . . . . . . . . . . . . . . . . . 20
2.9 Loaded Double Ball Bar definition of coordinates andangles . . . . . . . . . . . . . . . . . . . . . . . . . . . . 23
2.10 Deformed Loaded Double Ball Bar . . . . . . . . . . . . 23
xi

xii LIST OF FIGURES
2.11 LDBB measurement results from 3-axis milling machine(Paper B). . . . . . . . . . . . . . . . . . . . . . . . . . . 23
2.12 Contactless Excitation and Response System . . . . . . 24
2.13 Response PSD from measurement with spindle speedfrom 0-18000 rpm . . . . . . . . . . . . . . . . . . . . . . 24
3.1 Measurement points for modal analysis in machine tool. 28
3.2 Acoustic image during machining. . . . . . . . . . . . . 29
3.3 Acoustic camera set-up. . . . . . . . . . . . . . . . . . . 29
3.4 Machining test central composite design of experiment. . 30
4.1 Synthesised compliance of work piece - fixture in machinetool . . . . . . . . . . . . . . . . . . . . . . . . . . . . . 34
4.2 Synthesised compliance of free hanging cutter, solid line- y-direction, dashed line - - x-direction . . . . . . . . . 35
4.3 Results from acoustic image during machining. . . . . . 36
4.4 Time signal during machining with full cutters - Originaland Increased contact surface area. . . . . . . . . . . . . 37
4.5 Power Spectral Density of machining noise - Originalcutter. . . . . . . . . . . . . . . . . . . . . . . . . . . . . 38
4.6 Power Spectral Density of machining noise - Cutter withincreased surface contact area. . . . . . . . . . . . . . . 38
4.7 Time signal during machining with sparse cutters -Original and VE-HDI damped. . . . . . . . . . . . . . . 39
4.8 Power Spectral Density of machining noise from sparsecutter - Original and VE-HDI damped. . . . . . . . . . . 40
4.9 Time signal during machining with sparse cutters -Original and CBNC-HDI damped. . . . . . . . . . . . . 40
4.10 Power Spectral Density of machining noise from sparsecutter - Original and CBNC-HDI damped. . . . . . . . . 41
4.11 Surface measurement from the bottom of a machinedgear slot . . . . . . . . . . . . . . . . . . . . . . . . . . . 42
4.12 Surface measurement from the flank of a machined gearslot . . . . . . . . . . . . . . . . . . . . . . . . . . . . . . 42
4.13 Surface profile from the flank of a machined gear slot . . 42

LIST OF FIGURES xiii
4.14 Power spectrum from the flank profile of a machined gearslot . . . . . . . . . . . . . . . . . . . . . . . . . . . . . . 43


Abbreviations
CBNC-HDI Carbon-Based Nano Composite High Damping InterfaceCERS Contactless Excitation and Response SystemCP Cutting ProcessDBB Double Ball BarDOE Design of ExperimentELS Elastic Linked SystemEMA Experimental Modal AnalysisHDI High Damping InterfaceLDBB Loaded Double Ball BarMS Machining SystemPC-HDI Plasma Coating High Damping InterfacePSD Power Spectral DensityVE-HDI Viscoelastic Polymer High Damping Interface
xv


Chapter 1
Introduction
The importance of metal cutting started in the mid 18th century withthe production of steam engines. This led to the first one hundred yearsof major developments of machine tools. Cutting tool material wasthen advanced as steel and harder alloys became popular. The nextmajor development was the introduction of mechatronic componentsand computer numerical controlled machines [1]. Cutting tools havealways been pushed to maximum and the importance of reliable andaccurate cutting and machine tools are as high as ever before, especiallyin production with high tolerances and difficult to cut materials suchas high performance alloys for aerospace and naval components. Oneother issue, still, to be solved is the problem with vibrations in thechip forming process or machining. Today, about fifty years since theground breaking publications of S. A. Tobias [2] and J. Tlusty [3],industry as well as scientists struggle to obtain chatter free machiningwith high material removal rate. This is due to today’s lighter machinetools with high accelerations in combination with complex geometricalshapes, high strength materials and narrow tolerances.
1

2 CHAPTER 1. INTRODUCTION
1.1 Thesis Background
This thesis is based on research on an industrial case of spiral bevel gearface milling. The process is subject to vibration problems, which resultsin quality loss of the machined component and a reduced lifetime of thecutter. The resulting effect of the faulty process is easily identified withthe naked eye, vibration marks in machined part (wave marks at thegear root) as well as cracking and chipping of the stick blades, see figure1.1 and 1.2.
Figure 1.1: Vibration marks inwork piece.
Figure 1.2: Chipping of stickblade.
The kinematic structure of the milling machine tool is based on twopillars, one for the cutter and one for the work piece. An example ofsuch a kinematic scheme can be seen in figure 1.3.
The studied milling cutter consists of a circular cutter body and34 stick blades, which are seated in the cutter body and clamped witha clamp block and screw, see figures 1.4 and 1.5. The cutter usestwo types of stick blades to cut the gear profile; one inner and oneouter. The surface marked in red will be used later, when applyinghigh damping interfaces, and the surface marked in blue for increase ofsurface contact area.

1.2. RESEARCH QUESTIONS 3
Z
X
Y
A
B
Figure 1.3: Kinematic scheme of investigated bevel gear millingmachine.
Stick blade
Clamp block
Screw
Cutter body
x
x
y
y
Figure 1.4: Clamping of stickblades in cutter body.
Figure 1.5: Clamping schemesketch.
1.2 Research Questions
Within the given background two research questions are formulated:
1. What is the relationship between the capability of a machiningsystem and the quality requirement of a component in terms ofdimensional and surface accuracy?

4 CHAPTER 1. INTRODUCTION
How can elastic linked system capability analysis improveunderstanding of this relationship?
2. What is the effect of damping treatment, of clamping interfaces,with regards to the improvement of machine tool dynamic behaviour,on machined components?
The thesis is limited to the investigation of spiral bevel gear facemilling, although the derived theories, results and conclusions are muchmore general and applicable to other machining operations.
1.3 Thesis Structure
This thesis is mainly based on two publications:
Paper AT. Osterlind, A. Archenti, L. Daghini, C. M. Nicolescu,“Improvement of Gear Cutter Dynamics by Use of AcousticImaging and High Damping Interface”, Procedia CIRP, vol. 4,pp. 17-21, 2012.
Paper BA. Archenti, T. Osterlind, and C. M. Nicolescu, “Evaluationand Representation of Machine Tool Deformations,” Journal ofMachine Engineering, vol. 11, no. 4, pp. 105-117, 2011.
Paper A is the major contributor to this thesis. The studied case; facemilling with stick blade cutter, is the base of the theories presentedhere and the source from which most of the conclusions are drawn.Paper B contributes to measurement and evaluation of machine toolstatic stiffness and kinematic errors.
Chapter 1 gives an introduction of the thesis and its scope ofresearch. The investigated case is presented and the research questionsare stated.
Chapter 2 introduces the concept of a machining system andvarious ways in which to qualify its performance. Elastic link system

1.3. THESIS STRUCTURE 5
representation is also included, as well as the tools currently developedwithin the framework. The importance of static and dynamic stiffnessis brought up and explained as well as kinematic and thermal accuracy.
Chapter 3 contains the methods used in this thesis for the evaluationand analysis of spiral bevel gear face milling.
Chapter 4 introduces the results obtained by the methods given inchapter 3.
Chapter 5 presents a discussion and draws conclusions from thecase studies in this thesis.
Chapter 6 concludes the thesis by suggesting future studies andwork that can be carried out to further enhance knowledge of machiningsystems.

6 CHAPTER 1. INTRODUCTION

Chapter 2
Machining System
In this thesis a machining system (MS) is defined as the physicalmodules and the process that are needed to remove a chip by cutting.These are:
• Machine Tool
• Cutting Tool
• Fixture
• Work piece
• Cutting Process
Each module can be divided into subsystems or parts. The machinetool is the main structure in which the machining process is preformed.The machine tool can be built for single-purpose operations (e.g. aradial drilling machine) or as a multi-purpose machine (e.g. 5-axismachining centre). Machine tool requirements include: necessary workspace, movement and force with sufficient accuracy to produce the partof interest. Koenigsberger [4] identified the following three generalrequirements, in 1964, of the machine tool which still hold today:
1. Within permissible limits the specified accuracy of shape,dimensional accuracy and surface finish of the components
7

8 CHAPTER 2. MACHINING SYSTEM
produced on the machine must be obtained consistently and, asfar as possible, independently of the operator’s skill.
2. The operational speeds and rates of metal removal provided by themachine must be in accordance with the latest developments inmaterials and tools and, therefore, ensure the possibility of highproductivity. In addition, the design must be such as to enableit to cope with future developments in these matters in order toprevent the machine from becoming obsolete in a short time.
3. In order to be competitive in operation, the machine must show ahigh technical and economical efficiency.
Cutting tool geometry is governed by the ability to withstand loadswith small deflection while kept in desired size. It also has to withstandthe heat generated by the cutting process. The tool cutting zone hasto remain sharp and resistant to wear, chipping and built-up edge.The fixture has to provide sufficient stiffness and damping in order toaccurately clamp the work piece [5].
2.1 Capability of Machining System
The capability of machining systems can consider a large numberof factors as well as be performed in a vast variation of tests. Tofurther categorise MS capability it will, in this thesis, be sorted intosubcategories of accuracy. The thesis is limited to the accuracy of themachine tool, which is a dominant part of the MS. The accuracy of a MSis defined by its ability to produce parts within design specifications.This is quantified by the deviation of cutting point from the work piece.Machining accuracy is influenced by a large number of factors whichaccording to Weck [6] can be categorised into four design elements:
• Geometry and Kinematic Accuracy
• Thermal Influence
• Static Stiffness
• Dynamic Flexibility

2.1. CAPABILITY OF MACHINING SYSTEM 9
Each one of these is an important design factor, in order to buildan accurate machine tool and will be described hereafter. The focus ofthis thesis is on Static stiffness and Dynamic flexibility and thereforethe other two factors will only be briefly described. To distinguish thestructural resistance to static and dynamic loads the term “stiffness”will be used for the ratio between static load and deformation, while“flexibility” or “rigidity” is used for the deformation resistance ofdynamic forces, i.e. frequency dependent stiffness.
2.1.1 Geometric and Kinematic Accuracy
Geometric deviations between components originate from manufacturingand assembly of the machine tool. These give rise to errors in forinstance straightness and squareness. They originate from the fact thateach component can deviate in 6 degrees (in a Cartesian coordinatesystem: three translational positions; x, y, z, and three angularmisalignments; pitch, yaw and roll), which creates positioning andorientation errors. These errors can be measured with, for instance,laser interferometer, electronic spirit levels and capacitance gages [7].
A machine tool structure is based on a supporting frame on whichfixed and movable parts, functional elements, are connected. Thefunctional elements create a kinematic structure, which can be serial,figure 2.1, or parallel, figure 2.2. Each axis can be moved independentlyin a serial kinematic structure while two or more drives have to becontrolled for a linear movement in a parallel kinematic structure. Theaccuracy of the functional elements contributes to the overall abilityto position and correctly orient the tool and work piece. Geometricand kinematic accuracy in positioning accuracy will be determined toa large extent by its control system. Correct assessment of geometricand kinematic errors is necessary if one is to make error compensationin the machine tool process instructions for tool path [8].
10 CHAPTER 2. MACHINING SYSTEM
x
y
z
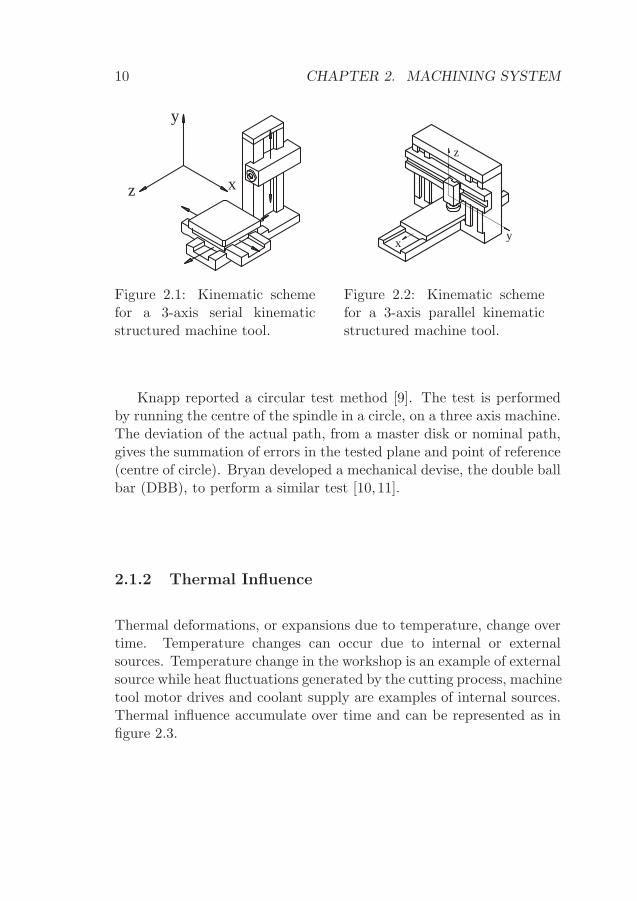
Figure 2.1: Kinematic schemefor a 3-axis serial kinematicstructured machine tool.
x y
z
Figure 2.2: Kinematic schemefor a 3-axis parallel kinematicstructured machine tool.
Knapp reported a circular test method [9]. The test is performedby running the centre of the spindle in a circle, on a three axis machine.The deviation of the actual path, from a master disk or nominal path,gives the summation of errors in the tested plane and point of reference(centre of circle). Bryan developed a mechanical devise, the double ballbar (DBB), to perform a similar test [10, 11].
2.1.2 Thermal Influence
Thermal deformations, or expansions due to temperature, change overtime. Temperature changes can occur due to internal or externalsources. Temperature change in the workshop is an example of externalsource while heat fluctuations generated by the cutting process, machinetool motor drives and coolant supply are examples of internal sources.Thermal influence accumulate over time and can be represented as infigure 2.3.

2.1. CAPABILITY OF MACHINING SYSTEM 11
Machine Tool Sourcese.g. heat from electronic equipment, friction induced heat between movable parts and spindle bearings
Machining Process Sourcese.g. mechanical energy from chip formation transformed into thermal energy
External heat sources
External cooling
Σ Σ
Figure 2.3: Thermal representation in a machining system.
2.1.3 Static Stiffness
Static loads can cause displacements and misalignments of guidingelements and deflection of the cutting tool. Forces creating such loadsare, for example, the weight of moving machine parts, weight of workpiece and the static part of the cutting force. Stiffness is highlydependent on both the structural stiffness of each single part and thecontact stiffness between components [12]. A joint with play, Δχ, has,naturally, no stiffness until the connecting surfaces are in contact:
k(χ) =
{0 if Δχ > 0
k if Δχ = 0
Low stiffness results in unsatisfactory component deformation orrelative displacement between components, thus giving machined partswith low geometric quality. The following equations, and figure 2.4explain the importance of high static stiffness:

12 CHAPTER 2. MACHINING SYSTEM
x x
amaxamin
xmaxxmin
a’max
a’min
f
Figure 2.4: Effects of static cutting along a work piece with varyingnominal thickness
In figure 2.4 x represents the desired, final thickness of the machinedpart, amax/min is the required chip thickness to be removed, a′max/min is
the actual removed chip thickness (different from amax/min) due to staticdeflection and xmax/min is the resulting work piece thickness variationon the part. The following equations give the ratio of deviations interms of stiffness:
kstatic =Fstatic
x→ static stiffness [N/m] (2.1)
kcp =Fstatic
a→ process stiffness [N/m] (2.2)
kcp = kc · fR ⇒ Fstatic = kc · fR · a (2.3)
Δ = amax − amin original waviness (2.4)
x + amax = xmax + a′max x + amin = xmin + a′min
Δ = xmax − xmin + a′max − a′min (2.5)
Δ = δ + a′max − a′min (2.6)
where δ is the final deviation. This gives:
Fmaxstatic = kcp · a′max Fmin
static = kcp · a′min
Fmaxstatic = kstatic · xmax Fmin
static = kstatic · xmin
kcp · a′max = kstatic · xmax kcp · a′min = kstatic · xmin

2.1. CAPABILITY OF MACHINING SYSTEM 13
kcp(a′max − a′min) = kstatic(xmax − xmin) (2.7)
a′max − a′min =kstatickcp
δ (2.8)
Δ = δ +kstatickcp
δ (2.9)
Δ = δ
(kcp + kstatic
kcp
)(2.10)
δ
Δ=
kcpkcp + kstatic
(2.11)
The result given above (in terms of deviation over original waviness)shows that increased stiffness results in a work piece closer to the desireddimension x.
Stiffness (and flexibility) is a vector in working space. It is thereforedesired to know the direction of the principal stiffness axis in a machinetool in order to orient the work piece so that the cutting force vectoris properly aligned and the smallest deformation achieved. The staticaccuracy of a machine tool can be measured by applying a static force,between machine tool and table, and measuring the deformation. Byadding a force to the system, which closes the force loop in a similarway as stationary cutting, both play and backlashes are removed anda measurement condition closer to machining conditions is generated.The loaded double ball bar (LDBB), described in section 2.3.1, is sucha system.
2.1.4 Dynamic Flexibility
As dynamic stiffness is, generally, lower than static stiffness it isdesirable to take it into consideration when designing a machine toolor when selecting cutting parameters. It is characterised by thedynamic stiffness coefficient, Kdynamic = kdynamic/kstatic. It is generallydependent on frequency and/or amplitude and Kdynamic < 1 for moststructures. Dynamic stiffness is defined by the vibrating mass, staticstiffness and damping of the system. Damping is the capability oftransforming mechanical energy of a vibratory motion into other forms

14 CHAPTER 2. MACHINING SYSTEM
of energy (generally heat). Damping in a mechanical system decreasesthe intensity of vibratory motion, close to resonance, an can thereforebe used in MS to prevent vibrations [12]. When machining with arotating tool, the cutter teeth are repeatedly entering and exiting thework piece. This creates impact forces (as the kinetic energy of theimpacting mass is transformed into potential energy in the form ofelastic deformation of the tooth) that, with insufficient damping, leadto tool vibration and bad surface quality of the machined part. Aclassic way to determine the dynamic characteristics of a MS is byimpact testing for experimental modal analysis (EMA).
2.2 Vibrations in Machining Systems
A limiting factor for productivity is vibrations in machining. Someeffects of vibrations in machining are rough surface of the machinedpart, excessive tool wear, increased risk of tool chipping and high noiseintensity on the shop floor. It can also lead to accelerated wear of themachine tool’s functional elements. Tobias, one of the pioneers withinmachine tool vibration and chatter research, introduced the Kδ-factor,which states that stability of the machining process is dependent onboth stiffness and damping; a trade-off between these two factorscan therefore be utilised for process improvement [2]. Tobias’ theoryincludes two types of vibrations (or actually three); forced and selfgenerated vibrations. The third type, free vibrations, occurs due to adisturbance in the process (a hard spot in the work piece or the breakaway of built-up edge from the tool, etc.) but quickly decays back tostationary conditions. The first stability model was later modified bymany researchers (Tlusty included some non-linear effects [13] whileNigm made another representation [14], just to mention some of thefurther developments).
The dynamics of machining can be represented with a closed loopsystem, see figure 2.5.

2.2. VIBRATIONS IN MACHINING SYSTEMS 15
Elastic Structure (ES)
Cutting Process (CP)
Machine Structure: Tool, Tool holder, Work-piece, Clamping etc.
Machining: Chip modulation, Process Damping etc.
R
P
+ + +F-
V’
X”X’+
V
Figure 2.5: Closed loop system representing machining.
In figure 2.5 R represents the reference signal for the position oftool relative to work piece. V is an outer disturbance (for example ascale error). R and V lead to a cutting force that will displace thetool/work piece from the reference and thus gives another position X ′.V is a second outer disturbance which together with X gives the truecutting position X ′′. The shifted cutting location leads to a change incutting force, P which is feed back, leading to a closed loop system.
2.2.1 Forced Vibrations
Forced vibrations in intermittent machining are due to the repeatedentry and exit of cutting teeth. This generates a fluctuating force thatsets the tool or work piece in motion. There can also be other timevarying forces (external and internal) that can excite forced vibrations.Figure 2.6 shows a simulated case of intermittent cutting, with a threetooth end mill performing a slotting operation. The magnitude ofthe impact force is highly dependent on the entrance whereas releaseof potential energy depends on the exit angle of the tooth. Thisimpact can be described as a impulse and thus excites the MS with abroad band source. Sudden release of potential energy has a frequencycontent that decays inversely to the frequency, thus having a lower highfrequency contribution.

16 CHAPTER 2. MACHINING SYSTEM
0 100 200 300 400 500 60040
20
0
20
40
60
80
100
120
Angular position [ ]o
For
ce[N
]FX
FY
F
Figure 2.6: Simulated cutting force - Slotting operation with end mill,number of teeth=3, depth of cut=2 mm, feed=0.15 mm/tooth, specificcutting stiffness=750 N/mm2
Forced vibrations close to a machine tool eigen-frequency lead toserious vibrations and surface deterioration. One way to determineif the vibrations are forced is by recording the process noise underdifferent cutting speeds. If such an ensemble shows the same frequencypeak, at structure resonance, for all speeds, the process is subject toforced vibrations. One way to minimise, or eliminate, forced vibrationsis to increase the number of teeth, that are simultaneously in cut orimprove the damping capacity. An increased number of teeth leads toa smaller impact force, thus reducing the vibration amplitude. Sincedamping is most effective in vibration reduction at resonance, enhanceddamping is recommended to reduce forced vibrations [12, 15].
2.2.2 Self Excited Vibrations
Self excited vibrations in machining or so-called chatter, is a selfgenerative effect that can occur during machining. The oscillation canbe started in numerous ways and will then be sustained by the forcefluctuation in the cutting process [16]. When the tool is set-off anda relative motion between the tool tip and the work piece is present,

2.2. VIBRATIONS IN MACHINING SYSTEMS 17
a force fluctuation is generated by the change in chip thickness. Thiscreates an undulated surface on the machined part. The variation ofchip thickness or chip modulation can be described as a function ofcurrent and previous cut.
Δh(t) = y(t) − μy(t−T ) (2.12)
where h(t) is the change in chip thickness, y(t) is the current cut, μ is anoverlapping factor between subsequent cuts and T is the time for onerevolution (of tool or work piece). The force due to chip modulation isthe described by:
dP(t) = k1 · Δh(t) (2.13)
where k1 is the cutting force coefficient. The dynamic cutting forcescan further be described by adding small disturbances in penetrationrate (of tool penetration into work piece) and rotational oscillations:
dP = k1Δh +2πK
Ω· dxdt
+
(kΩ − Ks
Ω
)dΩ
dt(2.14)
The equation of motion representing the tool tip can be coupledwith the cutting process forces and a stability lobe diagram can becalculated [2].

18 CHAPTER 2. MACHINING SYSTEM
N, r.p.m.0 1000 2000 3000
1
2
3
4
95
105
100
5
K, 1
0 N
/mm
4Fr
eque
ncy,
Hz
b - = 0.5
Figure 2.7: Stability lobe diagram.
The equation in the form of a time-delay differential equationand the minimum stability is found by scanning all possible chatterfrequencies and number of waves cut on the work piece. Figure 2.7,given by [14], presents a stability lobe diagram and it can clearly beseen that the chatter frequency varies with alternating cutting speeds.This characteristic differentiates forced vibrations from chatter.
2.2.3 Impact Testing
Impact testing is a form of measurement procedure to collect datafor modal analysis. In milling it has classically been performed toderive the compliance of the tool tip in order to extract stability lobediagrams. The tested structure is struck by an impulse and the responseis measured. A common way to excite the structure is with an impacthammer and the response is measured with accelerometers. Whenperforming impact testing on cutting tools it can sometimes be difficultto hit the tool tip without the tool bouncing back (or undesired due

2.3. CAPABILITY ANALYSIS BY ELASTIC LINKED SYSTEM 19
to breaking of the cutting edge), thus making a double impact. It isthen recommended to move the driving point closer to the cutting toolsupport structure and calculate the direct response, at tool tip, fromthe mode vectors. One drawback with this method is the lack of spatialresolution and therefore closely coupled modes are hard to separate [15].
2.3 Capability Analysis by Elastic Linked System
Current standards in machine tool testing only cover a part of MSaccuracy. Since no standard, today, consider testing with a structureunder a controlled load, a majority part of MS capability is notevaluated. The concept of elastic linked system (ELS) introducesevaluation of a loaded structure [17], by linking the tool to the workpiece or work-holder, figure 2.8. The basis of the concept rests onapplying a force acting between the machine tool table and spindle,therefore creating a test condition closer to real machining. Theimplementation of such a force can be achieved in different ways,two test devices (described in this thesis) for ELS evaluation areloaded double ball bar (LDBB) and contactless excitation and responsesystem (CERS). Qualification by ELS provides the possibility of findingstatic (by use of LDBB) as well as the dynamic (by using CERS)characteristics. It allows for measurements where the effects of play,rotating tool, backlash, etc. are visible and thus gives a more accuratedescription of the machine tool structure.

20 CHAPTER 2. MACHINING SYSTEM
Elastic link/Force
Figure 2.8: Schematic representation of Elastic Linked System in 3-axismilling machine
2.3.1 Loaded Double Ball Bar
The LDBB was developed in a collaboration between CE JohanssonAB, KTH Royal Institute of Technology and Scania CV AB. Themeasurement procedure follows the same principles as for DBBmeasurements, circular motion with constant speed (ISO 230-4). Themain advantage with the LDBB is that a force can be generated byan air pressure in the probe housing. The pressure can be regulatedto control the force, 1 bar gives 119 N. The force is applied between afixture mounted on the machine table and a tool mounted in the spindle,both fixture and tool deflections are pre-measured and subtracted inthe analysis of results. By sampling displacement and pressure, as wellas measurement time, one can calculate the static stiffness in the plane,as a function of angular position. The measurement range is ±1 mmand it is designed for an accuracy of ±0.5 μm.
The force generated by the LDBB is assumed to be acting in axialdirection, see Paper B. The force in axial direction can be decomposedinto machine coordinate directions, see following calculations and figure2.9 for definitions of angles etc.:
F =
(cos(ϕ) cos(θ), cos(ϕ) sin(θ), sin(ϕ)
)F (2.15)

2.3. CAPABILITY ANALYSIS BY ELASTIC LINKED SYSTEM 21
δx = Fkxt
(cos(ϕ) cos(θ)
)δx′ = Fkxs
(cos(ϕ) cos(θ)
)
δy = Fkyt
(cos(ϕ) sin(θ)
)δy′ = Fkys
(cos(ϕ) sin(θ)
)
δz = Fkzt
(sin(ϕ)
)δz′ = Fkzs
(sin(ϕ
)
where t and s are the index for table fixture and spindle tool and k is thestiffness coefficient. Assuming that the table fixture head is mounted inorigo, 0, the nominal length, L, and the length with an applied force,LF , are then given by:
L = (x2 + y2 + z2)1/2 (2.16)
LF =
[(x + δx + δx′)2 + (y + δy + δy′)2 + (z + δz + δz′)2
]1/2
=
[x2 + F 2 cos2(ϕ) cos2(θ)
(kxt
2 + kxs2 + 2kxt k
xs
)
+ 2xF cos(ϕ) cos(θ)
(kxt + kxs
)
+ y2 + F 2 cos2(ϕ) sin2(θ)
(kyt
2+ kys
2 + 2kyt kys
)
+ 2yF cos(ϕ) sin(θ)
(kyt + kys
)
+ z2 + F 2 sin2(ϕ)
(kzt
2 + kzs2 + 2kzt k
zs
)
+ 2zF sin(ϕ)
(kzt + kzs
)]1/2
(2.17)
x = L · cos(ϕ) cos(θ) y = L · cos(ϕ) sin(θ) z = L · sin(ϕ) (2.18)

22 CHAPTER 2. MACHINING SYSTEM
LF =
[cos2(ϕ) cos2(θ)
(L2 + F 2(kxt
2 + kxs2 + 2kxt k
xs ) + 2LF (kxt + kxs )
)
+ cos2(ϕ) sin2(θ)(L2 + F 2(kyt
2+ kys
2 + 2kyt kys ) + 2LF (kyt + kys )
)
+ sin2(ϕ)(L2 + F 2(kzt
2 + kzs2 + 2kzt k
zs) + 2LF (kzt + kzs)
)]1/2
(2.19)
=
[cos2(ϕ) cos2(θ)
(L2 + F 2(kxt + kxs )2 + 2LF (kxt + kxs )
)
+ cos2(ϕ) sin2(θ)(L2 + F 2(kyt + kys )
2 + 2LF (kyt + kys ))
+ sin2(ϕ)(L2 + F 2(kzt + kzs)
2 + 2LF (kzt + kzs))]1/2
(2.20)
=
[cos2(ϕ) cos2(θ)
(L + F (kxt + kxs )
)2+
cos2(ϕ) sin2(θ)(L + F (kyt + kys )
)2
+ sin2(ϕ)(L + F (kzt + kzs)
)2]1/2
(2.21)
Since table fixture and spindle tool are rotationally symmetric itcan be assumed that kxt = kyt and kxs = kys , they are also assumed to bethe weakest direction compared to z. Measurement in the x− y planeand assuming kxt = kyt = kxs = kys = k gives:
LF =
[(L + 2Fk)2
(cos2(θ) + sin2(θ)
)]1/2
= L + 2Fk (2.22)
The length of the unloaded LDBB is L = 150 mm and the maximumsum of fixture/tool deflection is 14 μm, L � F · k. It is thereforeassumed that the angular rotation of the LDBB, due to deformation,figure 2.10, in the measurement equipment, is negligible.

2.3. CAPABILITY ANALYSIS BY ELASTIC LINKED SYSTEM 23
x
y
z
0 (x,y,z)
Figure 2.9: Loaded Double BallBar definition of coordinatesand angles
(x+ x, y+ y, z+ z)
(x+ x´, y+ y´, z+ z´)
Figure 2.10: Deformed LoadedDouble Ball Bar
Figure 2.11 shows the general behaviour off a three axis millingmachine. The maximum stiffness is found where the deformation is thesmallest and vice versa. The sharp zigzag occurs due to quadrant shiftin the machine tool.
Figure 2.11: LDBB measurement results from 3-axis milling machine(Paper B).

24 CHAPTER 2. MACHINING SYSTEM
2.3.2 Contactless Excitation and Response System
This section describes dynamic measurement withcontactless excitation and response measurement. One major benefitfor using non-contact measurements is that it allows the spindle torotate, this is especially important due to loss of stiffness in thespindle bearing at high speed machining [18]. Magnetic vibratorswith inductive force transducers and capacitive displacement pick-upsto excite a tool dummy and measure its response was suggested byresearchers over forty years ago [19,20]. Archenti et al. used a modifiedcutting tool instead [21]. The advantage with the modified tool is thatboth the magnetic excitation and response measurements, as well ascutting tests can be performed with the same tool which simplifiesthe coupling of dynamic characteristics into theory of metal cuttingstability. The system was named CERS for Contactless Excitation andResponse System, see figure 2.12. Figure 2.13 shows the frequencyresponse from measurements with a random excitation input force atdifferent spindle speeds.
Milling toolExcitation coils
Displacement sensor
Laminated structure
Figure 2.12: ContactlessExcitation and ResponseSystem
Figure 2.13: Response PSDfrom measurement with spindlespeed from 0-18000 rpm

Chapter 3
Evaluation and AnalysisMethodology of SpiralBevel Gear Milling
3.1 Steps to identify the cause of vibration
The case study was initiated due to identification of visual vibrationmarks on the work pieces and chipping and cracking of stick blades.Three different tests where initiated to find the cause of vibration andthree design modifications where evaluated for process improvement.Testing methods where: Experimental Modal Analysis, AcousticImaging and Machining Tests. Surface measurements where performedin order to evaluate the outcome on the machined part.
The following design approaches of the cutter was evaluated, as wellas the original cutter:
• Cutter with increased contact area between stick blade and cutterbody (marked with blue lines in figure 1.4).
• Cutter with applied HDI on the clamp block, between stick bladeand clamp block (marked with red line in figure 1.4).
- HDI by viscoelastic polymer damping.
25

26 CHAPTER 3. EVALUATION AND ANALYSIS ...
- HDI by carbon-based nano-composite coating.
The original cutter was used as a reference for process improvementor deterioration evaluation. In addition to the three cutter designs testswhere also performed with:
• Full cutter (all 34 stick blades mounted).
• Sparse cutter (2 pairs of blades mounted on opposite side of axis,i.e 4 stick blades).
3.2 Damping Treatment of Cutter by HighDamping Interface
A high damping interface is an interlinked element between twocomponents. The components can exist from the start or be anintentionally placed joint, in a part, for damping improvement. Thecutters are redesigned with minimal set-up change in mind. Thereforeit is only the clamp block that is changed. The connecting surface ofthe clamp block to the stick blade is treated to create a high dampinginterface between the parts. The HDI was made by i) Viscoelasticpolymer (VE-HDI) and ii) Carbon-based nano-composite coating layer(CBNC-HDI).
3.2.1 Viscoelastic Polymer
The interlinked element is, in this case, built up by a viscoelasticpolymer metal composite, where the polymer introduces the dampingand the metal retains the stiffness. The damping is mostly effectivewhen the layer is sheared, thus transforming the vibratory energy intoheat losses in the layer.
3.2.2 Carbon-based Nano-composite Coating
The carbon-based nano-composite coating layer, CBNC-HDI, is achievedby chemical vapor deposition activated by plasma discharges (Plasma

3.3. METHODS/APPROACH 27
Enhanced Chemical Vapor Deposition, PECVD), [22]. The thicknessof the layer is about 600 μm. This type of damping layer has beenproven effective on a boring bar in a internal turning operation. Thelayer enhanced the damping properties with small stiffness loss.
3.3 Methods/Approach
3.3.1 Experimental Modal Analysis
Investigations of mode shapes and eigen-frequencies were performedwith the cutter mounted in the machine tool as well as with a freehanging cutter. Testing the cutter in the machine tool gives an overviewof the whole system while free hanging tests give information aboutthe cutter itself. Points used for measurements in the machine toolcan be seen in figure 3.1. Impact testing was also done on the workpiece clamped in the machine tool in order to investigate its influenceon system characteristics. The modal analysis was only performedfor the original cutter, since it was considered non-value adding toinvestigate other design set-ups (due to difficulty in accurate dampingquantification with impact testing).
By checking the free hanging modes of the cutter and linking thatinformation to the machine tool impact test one can exclude cuttingtool information and closer analyse the cutting tool support structureand machine tool.
To investigate the rigidity of stick blade clamping, different torqueswere applied to the clamp screw (in the original cutter) and impacttesting was carried out. Four torques were used, starting from 28 Nmand, in increments of 10 Nm, going up to 58 Nm.

28 CHAPTER 3. EVALUATION AND ANALYSIS ...
1 2 34
56
78
9
10
Figure 3.1: Measurement points for modal analysis in machine tool.
3.3.2 Acoustic Imaging
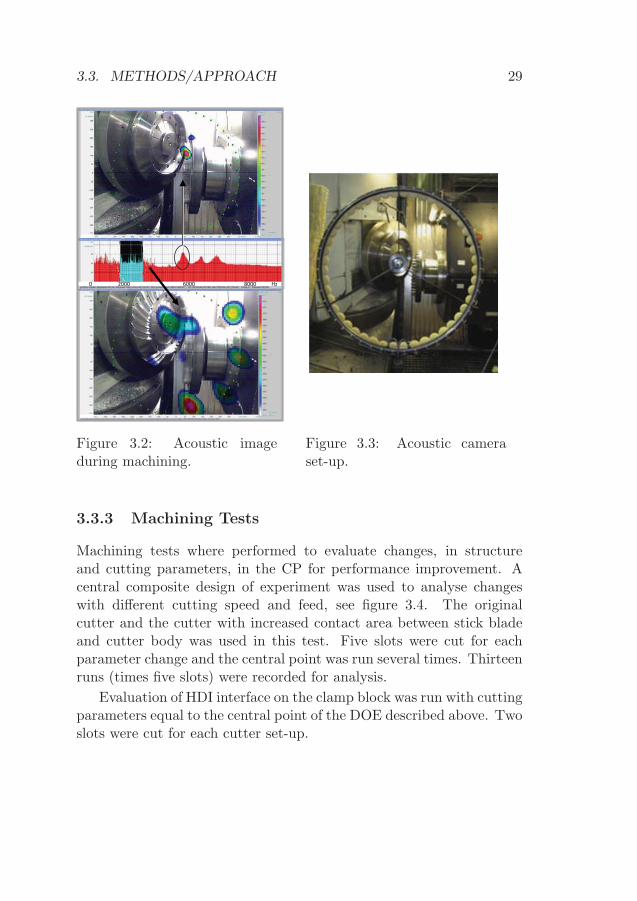
Acoustic imaging is a technique used to map acoustic pressure to animage, which can be layered on top of a photo or video. This techniqueallows for visual source identification and thus limits the frequencyspectra of interest for individual machining systems. Filtering outspectral components with high amplitude and mapping them with animage over the process gives quick determination of vibration frequencyin the contact zone between cutting tool and work piece, see figure 3.2.
The acoustic camera used in this research consists of 48 microphonesin a circular array with a video camera in the middle. The set-up canbe seen in figure 3.3.
3.3. METHODS/APPROACH 29
0 2000 6000 8000 Hz
Figure 3.2: Acoustic imageduring machining.
Figure 3.3: Acoustic cameraset-up.
3.3.3 Machining Tests
Machining tests where performed to evaluate changes, in structureand cutting parameters, in the CP for performance improvement. Acentral composite design of experiment was used to analyse changeswith different cutting speed and feed, see figure 3.4. The originalcutter and the cutter with increased contact area between stick bladeand cutter body was used in this test. Five slots were cut for eachparameter change and the central point was run several times. Thirteenruns (times five slots) were recorded for analysis.
Evaluation of HDI interface on the clamp block was run with cuttingparameters equal to the central point of the DOE described above. Twoslots were cut for each cutter set-up.

30 CHAPTER 3. EVALUATION AND ANALYSIS ...
The sound emitted during machining was recorded by a 1/2 inchfree-field microphone, with a sampling frequency of 12.8 kHz.
0.7 0.8 0.9 1 1.1 1.2 1.3 1.40.8
0.85
0.9
0.95
1
1.05
1.1
1.15
1.2
1.25
Normalised cutter revolution speed [Ω/Ωo]
Nor
mal
ised
feed
spee
d[ f/f o
]Machining test, central composite DOE
Figure 3.4: Machining test central composite design of experiment.
3.3.4 Surface Measurement on Work Piece
By measuring the waviness of the machined part it is possible to obtaininformation about the process. Clear vibration marks can simplybe measured and the corresponding frequency calculated, equation(3.1). When the machined surface looks more stochastic it is usefulto calculate the spatial frequency spectra and from there calculate thevibration frequency of the dominant component.
fc =vcL
(3.1)
where fc is the vibration frequency [Hz], vc is the cutting speed [m/s]and L is the length [m] between wave crests. When calculatingthe frequency from the spatial spectra (components given in 1/m)a simple multiplication of the spatial frequency and cutting speed

3.3. METHODS/APPROACH 31
gives the temporal frequency. It is important that the wavelengthis measured along the cut to obtain correct results. The machinedsurface in this applied case of spiral bevel gear cutting, is sweptthus making measurements more complicated since a standard axialmeasuring tool cannot be used. The surface was measured by creatinga special rubber cast of the work piece, which was then measured witha 3D optical surface profiler using white light interferometry, Zygo -NewViewTM7300.

32 CHAPTER 3. EVALUATION AND ANALYSIS ...
Chapter 4
Results
4.1 Experimental Modal Analysis
4.1.1 EMA in Machining System
The lowest stiffness was, at the tip of the stick blade, 0.4 kN/μm iny-direction (while it was 560 kN/μm on the work piece, point 8). Workpiece and its fixtureing had a low compliance as can be seen in figure4.1. The response above 4000 Hz was almost flat and therefore excludedin the synthesised response.
33

34 CHAPTER 4. RESULTS
0 500 1000 1500 2000 2500 3000 3500 4000 4500 5000
10
10
10
Com
plia
nce
[m/N
]Synthesized Frequency Response Function, Driving point 2
Point 4
Point 3
Point 2
Point 1
0 500 1000 1500 2000 2500 3000 3500 4000 4500 5000
0
5
Frequency [Hz]
Phase
[rad]
Figure 4.1: Synthesised compliance of work piece - fixture in machinetool
4.1.2 EMA of Cutter
The results from free hanging modal analysis of the cutter evaluatedon the tip and root of the stick blade in x- and y-direction (see figure1.4) show two dominant modes, for each direction, in the range 5000to 8000 Hz, figure 4.2. One of the eigen-frequencies is the same forboth x- and y-direction and they show a closely related mode shape.It can also be seen that the rigidity increases with increased clampingforce (high torque on clamping screw). On the other hand it is worthmentioning that the two higher torques, 48 and 58 Nm, damaged thescrew head and are not suitable for industrial usage.

4.2. ACOUSTIC CAMERA 35
0 2000 4000 6000 8000 10000 12000 1400010
10
10
10
10
Com
pliance
[m/N
]
Synthesized Frequency Response Function
28 Nm
38 Nm
48 Nm
58 Nm
0 2000 4000 6000 8000 10000 12000 14000
0
Frequency [Hz]
Phase
[rad]
Figure 4.2: Synthesised compliance of free hanging cutter, solid line -y-direction, dashed line - - x-direction
4.2 Acoustic Camera
The results from the acoustic camera give three peaks in the range 5000to 8000 Hz, which correspond to the three eigen-frequencies from theEMA of the cutter in the previous section. By filtering out the spectraclose to one resonance frequency, one can get an acoustic image thatdisplays a local source at the tool - work piece interaction point, figure3.2. The work piece modes around 1000 to 3000 Hz show an acousticimage that is more smeared out and with a lower pressure, see bottompart of figure 3.2.

36 CHAPTER 4. RESULTS
0 2000 6000 8000 Hz
Figure 4.3: Results from acoustic image during machining.
4.3 Machining Tests
4.3.1 Full Cutter Tests
The recorded time signal, given in figure 4.4, has a similar pattern forall tested cutting parameter combinations, but with differences betweencutter set-ups. The original cutter shows an increased sound power at

4.3. MACHINING TESTS 37
the end of each slotting operation, whereas it diminishes for the cutterwith increased surface contact area. This fact can also be seen in thework piece, since vibration marks are mostly visible in the gear root ofmachined parts.
0 5 10 15 20 250.3
0.2
0.1
0
0.1
0.2
0.3
0.4
0.5
Time [s]
Mic
roph
one
sign
al[V
]
Original cutter
Increased contact area
Figure 4.4: Time signal during machining with full cutters - Originaland Increased contact surface area.
The power spectral density average over all five slots shows thesame result as the time signal. Figures 4.5 and 4.6 plot the maximum,minimum and average value over all runs. As can be seen, the cutterwith increased contact area is less prone to vibrations and also not assensitive to speed/feed changes, as the original cutter.

38 CHAPTER 4. RESULTS
0 1000 2000 3000 4000 5000 600010
8
107
106
105
104
103
10
Frequency [Hz]
V2/H
z
Power Spectral Density
Min value
Mean value
Max value-2
Figure 4.5: Power Spectral Density of machining noise - Original cutter.
0 1000 2000 3000 4000 5000 600010
10
109
108
107
106
105
104
Frequency [Hz]
V2/H
z
Power Spectral Density
Min value
Mean value
Max value
Figure 4.6: Power Spectral Density of machining noise - Cutter withincreased surface contact area.

4.3. MACHINING TESTS 39
4.3.2 Sparse Cutter Tests
The time signal shows a smaller increase of sound power with theVE-HDI damped cutter, in comparison to the original, see figure 4.7.The reason each slotting time is longer than the slotting time with thefull cutter is due to usage of the same feed rate per tooth (or rathertooth pair).
The VE-HDI treated cutter gives lower power in the high frequencyregion, figure 4.8, whereas the power in lower frequencies is identical tothe original cutter. This may be explained by the fact that damping ismostly effective close to resonance frequency.
The VE-HDI element was compressed during machining, whichresulted in loss of improvement, and they could therefore only beused for a short time. The sides of the HDI layer were open and theviscoelastic polymer crept out which explains the improvement loss. Aredesign of the clamping block, with closed sides that prevent leakageoff the HDI element may solve this particular problem.
0 10 20 30 40 50 60 70 800.25
0.2
0.15
0.1
0.05
0
0.05
0.1
0.15
0.2
0.25
Micr
opho
nesig
nal[
V]
Original cutter (sparse)VE-HDI cutter (sparse)
Time [s]
Figure 4.7: Time signal during machining with sparse cutters - Originaland VE-HDI damped.

40 CHAPTER 4. RESULTS
0 1000 2000 3000 4000 5000 600010
8
107
106
105
104
103
Frecuency [Hz]
V2 /
Hz
Power Spectral Density
VE-HDI cutter (sparse)Original cutter (sparse)
Figure 4.8: Power Spectral Density of machining noise from sparsecutter - Original and VE-HDI damped.
0 10 20 30 40 50 60 70 800.25
0.2
0.15
0.1
0.05
0
0.05
0.1
0.15
0.2
Time [s]
Micro
phon
esign
al[V
]
Original cutter (sparse)
CBNC-HDI cutter (sparse)
Figure 4.9: Time signal during machining with sparse cutters - Originaland CBNC-HDI damped.

4.4. SURFACE MEASUREMENTS 41
0 1000 2000 3000 4000 5000 600010
10
10
10
10
10Power Spectral Density
Frequency [Hz]
V2 /H
z
Original cutter (sparse)CBNC-HDI cutter (sparse)
Figure 4.10: Power Spectral Density of machining noise from sparsecutter - Original and CBNC-HDI damped.
Figure 4.9 shows that the CBNC-HDI is effective at the beginning ofthe process but cannot damp out the oscillation at the end when thereis full contact along the tooth cutting edge. The power spectral densityin figure 4.10 shows that the coating damps out frequencies around 5800Hz but does not damp the contribution at 5200 Hz. Weather this isan effect of the chosen thickness of the coating or a result of coatingmixture is out of the scope off this thesis.
4.4 Surface measurements
Figure 4.11 shows a surface measurement from the bottom of amachined gear slot. It can be seen that the vibration marks are clearon the left-hand side and much smaller on the right-hand side. Thisresult is important since it illustrate that it is mainly the inner stickblade that is causing the problem. Figure 4.12 shows a measurementof a machined gear flank of an inner stick blade. The wave pattern can

42 CHAPTER 4. RESULTS
clearly be seen after filtering away high frequency spikes and correctionof curvature. The surface profile shows a periodic behaviour, see figure
Figure 4.11: Surfacemeasurement from the bottomof a machined gear slot
Figure 4.12: Surfacemeasurement from the flank ofa machined gear slot
4.13, and the spatial power spectrum in figure 4.14. The correspondingtemporal frequency is calculated to 5323 Hz.
0 0.5 1 1.5 2 2.58
6
4
2
0
2
4
6Profile measurement
Distance [mm]
Pro
file
heigh
t[μ
m]
Figure 4.13: Surface profile from the flank of a machined gear slot

4.5. SUMMERY OF RESULTS 43
0 2 4 6 8 10 12 14 150
1
2
3
4
5
6
7
8x 10¹⁵
Spatial frequency [1/mm]
[μm
2/
mm
]Spatial Power Spectrum
Figure 4.14: Power spectrum from the flank profile of a machined gearslot
4.5 Summery of Results
The vibration frequency spectra from 5000 to 6000 Hz can be seen inall measurements made on the stick blade, during machining and fromthe work piece. Thus indicating that the stick blade mounting canbe improved for enhanced machining performance. The high frequencycontent can be damped to various levels by the different HDI treatmentsbut the increase in surface contact area proved most effective.

44 CHAPTER 4. RESULTS
Chapter 5
Discussion and Conclusion
5.1 Experimental tests
• The modal analysis of the free hanging cutter suggests that thestick blades can be mounted more rigidly if the torque on theclamping screw is increased.
• Changes in the cutter set-up improved the dynamic characteristic.
Increased surface contact area and VE-HDI gave a significantimprovement.
The CBNC-HDI partly suppressed the problematic frequenciesbut could not eliminate them fully.
• Increasing the surface contact area was highly effective and fairlysimple to achieve.
• Leakage of polymeric HDI element must be prevented for successfulusage of VE-HDI.
• CBNC-HDI has potential in process improvement but furtherintensive investigations are required.
The cutting force acts differently on the inner and outer stick blade.The force will push the outer stick blade inwards into the cutter body
45

46 CHAPTER 5. DISCUSSION AND CONCLUSION
while the inner blade will be pushed towards the clamp block and screw.This makes a weak design for the inner blade since it is more likely tobe constrained by the clamp block instead of the intended seating. Onesuggestion for redesign may be to mirror the slot for the inner bladeso that it creates a V-shape close to the circumference and utilise ahydraulically expanding clamp block to fix the stick blade in position.
The high damping interface, by viscoelastic polymer, cannot besuccessfully used as free layer damping and it requires a redesign of theclamping block to stop the layer from leaking out. This can be costlyand time consuming while the increase in surface contact area is easierto achieve by grinding and sharpening of other stick blades.
5.2 ELS analysis evaluation
Section 2.1.3 explains the importance of static stiffness in amathematical formulation. It can be seen that geometric accuracyis strongly dependent on the static stiffness of the machine tool.The loaded double ball bar, 2.3.1, is a fairly simple measurement(depending on the machine tool kinematic structure) to capture thedirectional stiffness properties. One drawback of today’s system is, incommon with the DBB measurement following ISO 230-4 standard, theassumption of constant speed to obtain the spatial location of the tooltip. This is considered unimportant for DBB measurements but mayplay an important role for LDBB measurements. Constant speed isstill recommended since it allows for identification of servo mismatch,one axis travelling faster than the other.
The experimental investigation in this thesis has a strong connectionto the dynamic flexibility section of MS capability. Vibration markson machined parts is a quality issue for machining. The addeddamping shows improvement of the cutting process and a tool toevaluate damping in machine tools would be handy in the processof designing machine tools. The CERS is one way of tackling thelack of methods/tools for such an evaluation. The ability to excite

5.3. IDEAS 47
with continuous excitation and various signal characteristics makes itsuitable for certain machine tool structures.
The concept of ELS capability analysis has big potential but thecurrently available ELS tools for machining system evaluation are inpractice limited to machine tools with smaller rotating cutting tools,for which they where designed and intended (e.i. an end mill mountedin an BT, CAT or HSK tool holder). A wider range of test tools can bedeveloped to cover more set-ups, but as long as diverse fixtures and tooldesigns are used the problem of a single standardised tool will remain.
Process improvement was achieved without usage of ELS evaluationtools but there is still a lack of understanding of the MS characteristics.A solution for a more stable process is presented but the capability limitis yet unknown.
5.3 Ideas
Changing the machine tool structure in various ways so that a sufficientKδ factor can be achieved is a suitable solution for increased processperformance. Damping is an important factor to take intoconsideration when designing machining systems since the energy froman impact has to be dissipated quickly enough to avoid resonance orchatter problems. The balance between high stiffness and dampinghas to be considered for high dimensional and surface quality in ancompetitive machining system.
Machining process on-line monitoring and analysis can also beincorporated to evaluate the process in real time. This is in order todetect critical vibration levels, machine tool health etc. This can alsobe feed back to the controller to change the process and avoid errorson the machined component.
5.4 Concluding Discussion
By pure definition of MS capability one can easily draw the conclusionthat the higher the machine tool accuracy the closer to the specified

48 CHAPTER 5. DISCUSSION AND CONCLUSION
dimensions of the machined component. It is hard to design a structurewith high stiffness and damping with today’s materials. Placement ofdamping is thus of great importance to achieve high quality surfaceswith high geometrical tolerances and high material removal rate.Capability analysis by elastic linked system can provide a more accurateway to extract machine tool characteristics since the structure is loadedand various effects are thus included, as compared to testing withunloaded structures.

Chapter 6
Future work
The thesis summarises different ways to improve MS performance bychanging structural properties for enhanced Kδ factor. It briefly bringsup chatter theory and stability lobe diagrams which utilise processparameter changes for enhanced productivity. Various measurementmethods/tools for machine tool characterisation are discussed.
The large complexity of MS dynamics will remain a problem aslong as high quality and short machining time is desired. Furtherinvestigations and a unified concept of how to describe, measure andanalyse MS are therefore needed. Testing machine tools without loadsis of limited interest if one is to improve accuracy during machining.This is because of the constantly changing boundary conditions duringthe machining process.
On-line monitoring and virtual machining models are hot topics inthis field of research. The ELS tools is one approach in monitoringmachine tool status and extracting data for model updating of, forinstance, finite element models.
Suggestions for further research are:
A On-line monitoring of MS dynamics
B Improved and new development of MS measurements to accuratelycapture its characteristics under controlled load condition
C High damping interfaces embedded in machine tool structure
49

50 CHAPTER 6. FUTURE WORK
A and B can be coupled together for analysis of process dynamicsand thus give a greater understanding of machining parameters. C canpartly be developed on its own but it can only be fully evaluated if Bis present.

Bibliography
[1] E. Trent and P. Wright, Metal Cutting, 4th ed. Boston:ButterworthHeinemann, 2000.
[2] S. A. Tobias, Machine-tool vibration. Glasgow: Blackie and SonLIMITED, 1965.
[3] J. Tlusty and M. Polacek, “The stability of machine toolsagainst self excited vibrations in machining,” ASME Internationalresearch in production engineering, pp. 465–474, 1963.
[4] F. Koenigsberger, Design Principles of Metal-Cutting MachineTools. Oxford: Pergamon Press, 1964.
[5] A. Rashid, “On passive and active control of machining systemdynamics: Analysis and implementation,” doctoral thesis, TheRoyal Institute of Technology, Stockholm, 2005.
[6] M. Weck, Handbook of Machine Tools, Vol. 4: MetrologicalAnalysis and Performance Tests. John Wiley & Sons, 1984.
[7] G. Chen, J. Yuan, and J. Ni, “A displacementmeasurement approach for machine geometric error assessment,”International Journal of Machine Tools and Manufacture,vol. 41, no. 1, pp. 149–161, Jan. 2001. [Online]. Available:http://linkinghub.elsevier.com/retrieve/pii/S0890695500000493
[8] H. Schwenke, W. Knapp, H. Haitjema, a. Weckenmann,R. Schmitt, and F. Delbressine, “Geometric error
51

52 BIBLIOGRAPHY
measurement and compensation of machinesAn update,”CIRP Annals - Manufacturing Technology, vol. 57,no. 2, pp. 660–675, Jan. 2008. [Online]. Available:http://linkinghub.elsevier.com/retrieve/pii/S0007850608001960
[9] W. Knapp, “Circular test for three-coordinate measuring machinesand machine tools,” Precision Engineering, vol. 5, no. 3, pp.115–124, 1983.
[10] J. Bryan, “A simple method for testing measuring machines andmachine tools Part 1: Principles and applications,” PrecisionEngineering, vol. 4, no. 2, pp. 61–69, 1982.
[11] ——, “A simple method for testing measuring machinesand machine tools. Part 2: Construction details,” PrecisionEngineering, vol. 4, no. 3, pp. 125–138, 1982.
[12] E. I. Rivin, Stiffness and Damping in Mechanical Design. NewYork: Marcel Dekker Inc., 1999.
[13] J. TLUSTY and F. ISMAIL, “Basic Non-Linearity inMachining Chatter,” CIRP Annals - Manufacturing Technology,vol. 30, no. 1, pp. 299–304, 1981. [Online]. Available:http://linkinghub.elsevier.com/retrieve/pii/S0007850607609469
[14] M. Nigm, “A method for the analysis of machine tool chatter,”International Journal of Machine Tool Design and Research,vol. 21, no. 3-4, pp. 251–261, 1981. [Online]. Available:http://linkinghub.elsevier.com/retrieve/pii/0020735781900226
[15] C. M. Harris and A. G. Piersol, HARRIS’ SHOCK ANDVIBRATION HANDBOOK, 5th ed. New York: McGraw-Hill,2002.
[16] C. Brecher, M. Esser, and S. Witt, “Interaction of manufacturingprocess and machine tool,” CIRP Annals - ManufacturingTechnology, vol. 58, no. 2, pp. 588 – 607, 2009. [Online]. Available:http://www.sciencedirect.com/science/article/pii/S0007850609001723

BIBLIOGRAPHY 53
[17] A. Archenti, “A computational framework for control of machiningsystem capability: From formulation to implementation,” doctoralthesis, The Royal Institute of Technology, Stockholm, 2011.
[18] V. Gagnol, T.-P. Le, and P. Ray, “Modalidentification of spindle-tool unit in high-speed machining,”Mechanical Systems and Signal Processing, vol. 25,no. 7, pp. 2388–2398, Oct. 2011. [Online]. Available:http://linkinghub.elsevier.com/retrieve/pii/S0888327011001142
[19] G. Sweeney and S. Tobias, “Survey of basic machine tool chatterresearch,” International Journal of Machine Tool Design andResearch, vol. 9, no. 3, pp. 217–238, Sep. 1969. [Online]. Available:http://linkinghub.elsevier.com/retrieve/pii/0020735769900018
[20] N. Hanna and a.W. Kwiatkowski, “Identification of machinetool receptances by random force excitation,” InternationalJournal of Machine Tool Design and Research, vol. 11,no. 4, pp. 309–325, Dec. 1971. [Online]. Available:http://linkinghub.elsevier.com/retrieve/pii/0020735771900138
[21] A. Archenti, L. Daghini, and C. M. Nicolescu, “Recursiveestimation of machine tool structures dynamic properties,” inCIRP International Conference on High Performance Cutting,2010.
[22] V. Kouznetsov, M. Nicolescu, O. Meza, and L. Hemmingson,“Method, material and apparatus for enhancing dynamicstiffness,” SE Patent WO/2008/105 736, 09 04, 2008.

54 BIBLIOGRAPHY