An Analysis of Impact Factors for Positioning Performance ...
21
Research Article An Analysis of Impact Factors for Positioning Performance in WLAN Fingerprinting Systems Using Ishikawa Diagrams and a Simulation Platform Keqiang Liu, Yunjia Wang, Lixin Lin, and Guoliang Chen School of Environmental Science and Spatial Informatics, China University of Mining and Technology, 1 Daxue Road, Xuzhou City, Jiangsu Province 221116, China Correspondence should be addressed to Yunjia Wang; [email protected] Received 31 October 2016; Revised 10 January 2017; Accepted 24 January 2017; Published 21 February 2017 Academic Editor: Liang Chen Copyright © 2017 Keqiang Liu et al. is is an open access article distributed under the Creative Commons Attribution License, which permits unrestricted use, distribution, and reproduction in any medium, provided the original work is properly cited. Many factors influence the positioning performance in WLAN RSSI fingerprinting systems, and summary of these factors is an important but challenging job. Moreover, impact analysis on nonalgorithm factors is significant to system application and quality control but little research has been conducted. is paper analyzes and summarizes the potential impact factors by using an Ishikawa diagram considering radio signal transmitting, propagating, receiving, and processing. A simulation platform was developed to facilitate the analysis experiment, and the paper classifies the potential factors into controllable, uncontrollable, nuisance, and held-constant factors considering simulation feasibility. It takes five nonalgorithm controllable factors including APs density, APs distribution, radio signal propagating attenuation factor, radio signal propagating noise, and RPs density into consideration and adopted the OFAT analysis method in experiment. e positioning result was achieved by using the deterministic and probabilistic algorithms, and the error was presented by RMSE and CDF. e results indicate that the high APs density, signal propagating attenuation factor, and RPs density, with the low signal propagating noise level, are favorable to better performance, while APs distribution has no particular impact pattern on the positioning error. Overall, this paper has made great potential contribution to the quality control of WLAN fingerprinting solutions. 1. Introduction During the past two decades, there has been an exceptional development in localization and positioning field benefiting from global positioning system (GPS) [1]. However, GPS per- forms weakly when the radio signal is obstructed, for example, in urban canyons and indoor environments. To fill the gap, many indoor positioning systems have been proposed using different methods [2–5], including triangulation, proximity, scene analysis, and pedestrian dead reckoning (PDR). ere are already many commercial off-the-shelf (COTS) systems for indoor localization, such as Situm (https://situm.es/en), Kio-RTLS(http://www.eliko.ee), OpenRTLS (https://openrtls .com), Aero Scout (http://www.aeroscout.com), and Ubi- sense (http://ubisense.net/en). Among these different indoor localization systems, location fingerprinting is a solution using scene analysis method and usually working with wire- less local area network (WLAN) received signal strength indi- cator (RSSI), for example, the Skyhook (http://www.skyhook- wireless.com/) commercial positioning system. e scene analysis algorithm consists of two phases: offline learning and online positioning. Firstly, it builds a location fingerprint database on some reference points (RPs) with given location coordinates during the offline learning phase. en in the online positioning phase, the main work is to search the near- est RP or RPs by using RSSI received on an unknown point. ere are two kinds of common searching algorithms in use: the deterministic [6] and probabilistic [7, 8] algorithms. In a WLAN location fingerprinting system, there are many factors which may have impact on positioning per- formance. For example, location fingerprinting is a cost- saving solution by using previously deployed access points Hindawi Mobile Information Systems Volume 2017, Article ID 8294248, 20 pages https://doi.org/10.1155/2017/8294248
Transcript of An Analysis of Impact Factors for Positioning Performance ...

Research ArticleAn Analysis of Impact Factors for PositioningPerformance in WLAN Fingerprinting Systems UsingIshikawa Diagrams and a Simulation Platform
Keqiang Liu Yunjia Wang Lixin Lin and Guoliang Chen
School of Environmental Science and Spatial Informatics China University of Mining and Technology 1 Daxue RoadXuzhou City Jiangsu Province 221116 China
Correspondence should be addressed to Yunjia Wang wycgcumt163com
Received 31 October 2016 Revised 10 January 2017 Accepted 24 January 2017 Published 21 February 2017
Academic Editor Liang Chen
Copyright copy 2017 Keqiang Liu et al This is an open access article distributed under the Creative Commons Attribution Licensewhich permits unrestricted use distribution and reproduction in any medium provided the original work is properly cited
Many factors influence the positioning performance in WLAN RSSI fingerprinting systems and summary of these factors is animportant but challenging job Moreover impact analysis on nonalgorithm factors is significant to system application and qualitycontrol but little research has been conductedThis paper analyzes and summarizes the potential impact factors by using an Ishikawadiagram considering radio signal transmitting propagating receiving and processing A simulation platform was developed tofacilitate the analysis experiment and the paper classifies the potential factors into controllable uncontrollable nuisance andheld-constant factors considering simulation feasibility It takes five nonalgorithm controllable factors including APs density APsdistribution radio signal propagating attenuation factor radio signal propagating noise and RPs density into consideration andadopted the OFAT analysis method in experimentThe positioning result was achieved by using the deterministic and probabilisticalgorithms and the error was presented by RMSE and CDF The results indicate that the high APs density signal propagatingattenuation factor and RPs density with the low signal propagating noise level are favorable to better performance while APsdistribution has no particular impact pattern on the positioning error Overall this paper has made great potential contribution tothe quality control of WLAN fingerprinting solutions
1 Introduction
During the past two decades there has been an exceptionaldevelopment in localization and positioning field benefitingfrom global positioning system (GPS) [1] However GPS per-formsweaklywhenthe radio signal is obstructed for examplein urban canyons and indoor environments To fill the gapmany indoor positioning systems have been proposed usingdifferent methods [2ndash5] including triangulation proximityscene analysis and pedestrian dead reckoning (PDR) Thereare already many commercial off-the-shelf (COTS) systemsfor indoor localization such as Situm (httpssitumesen)Kio-RTLS(httpwwwelikoee) OpenRTLS (httpsopenrtlscom) Aero Scout (httpwwwaeroscoutcom) and Ubi-sense (httpubisenseneten) Among these different indoorlocalization systems location fingerprinting is a solution
using scene analysis method and usually working with wire-less local area network (WLAN) received signal strength indi-cator (RSSI) for example the Skyhook (httpwwwskyhook-wirelesscom) commercial positioning system The sceneanalysis algorithm consists of two phases offline learningand online positioning Firstly it builds a location fingerprintdatabase on some reference points (RPs) with given locationcoordinates during the offline learning phase Then in theonline positioning phase themain work is to search the near-est RP or RPs by using RSSI received on an unknown pointThere are two kinds of common searching algorithms in usethe deterministic [6] and probabilistic [7 8] algorithms
In a WLAN location fingerprinting system there aremany factors which may have impact on positioning per-formance For example location fingerprinting is a cost-saving solution by using previously deployed access points
HindawiMobile Information SystemsVolume 2017 Article ID 8294248 20 pageshttpsdoiorg10115520178294248
2 Mobile Information Systems
(APs) for communication However these nondedicated APsalso have limitations for localization For example onlya limit number of APs can be detected in a particularenvironment Moreover the RSSI of WLAN is unstationaryduring radio wave attenuating from APs to RPs under theinfluence of environment noise Therefore the number ofAPs and unstationary RSSI may influence the positioningresult Search and summary of the potential impact factorsare thus important to guiding the further impact analysis yeta challenging task which has not been paid much attention
There have been many studies on WLAN location fin-gerprinting in different aspects such as developing diversesystems implementing with novel searching algorithms andconstructing fingerprint database using different approacheswhich will be reviewed in Section 2 in detail However littleresearch effort has been made on impact factors due to somelimitations in conducting analysis experiments Comparingwith factors such as searching algorithm and parameters inan algorithm it is less convenient to conduct experimentsfor analyzing some nonalgorithm factors But nonalgorithmfactors are also important in technique application and sys-tem quality control For instance environment noises causethe instability of WLAN RSSI which may have influenceson positioning results However some environment factorssuch as the crowd temperature and humidity are not easy tocontrol in a real experiment field Moreover the experimentwill be complicated and the number of tests will be extremelylarge when interactions of all factors are taken into accountFor example assuming there are 119896 factors that are regardedas factors of interest and the 119894th factor has 119899119894 levels to beanalyzed the number of tests would be prod119896119894 119899119894 in a factorialexperiment
To address these issues the research objectives of thisstudy are as follows
(1) To summarize the potential factors and provide areference for factors research this paper uses anIshikawa diagram [9] method with considerationof WLAN radio signal transmitting propagatingreceiving and processing in WLAN location finger-printing systems (Section 3)
(2) To facilitate the analysis experiment of factors andimpacts an open-source simulation WLAN locationfingerprinting platform (httpsgithubcomcumtlkqWiFiPosSimu) was developed and this paper classi-fies the factors into four types including controllableuncontrollable nuisance and held-constant factorsconsidering simulation feasibility All the categorizedfactors are presented in another Ishikawa diagram(Section 4)
(3) To promote the application and quality control ofWLAN location fingerprinting this paper selectedfive nonalgorithm controllable factors (APs densityAPs distribution radio signal propagating attenua-tion factor radio signal noise and RPs density) asfactors of interest (Section 4)
(4) To reduce the complexity and number of tests ina factorial experiment the analysis experiment was
conducted using the one-factor-at-a-time (OFAT)method with different test settings to analyze theimpact patterns of the selected factors on positioningerror (Section 5)
2 Related Works
The most famous fingerprint localization system was pro-posed by Bahl and Padmanabhan [6] named RADARIt combined location fingerprinting with triangulation onsignal propagation modeling to determine user location Themedian resolution of the RADAR system is in the range of2 to 3 meters and the accuracy of location fingerprintingmethod is superior to signal propagation modeling In theirfollowing work [10] they enhanced RADAR with a Viterbi-like algorithm which improved the accuracy of user locationby over 33 and helped alleviate problems due to signalaliasing
After RADAR there have been many WLAN locationfingerprinting systems developed Horus [7] system used theprobabilistic algorithm in positioning and the experimentresults showed that accuracy reached over 90 probabilitywithin 21m Castro et al [11] presented a WiFi locationservice called Nibble which used Bayesian networks to inferthe location of a device In their experiment setting thelocation service reached 97 in accuracy Taheri et al [12]described an independent location fingerprinting systemLocus for comparing the performance of various locationfingerprinting algorithms Kontkanen et al [13] showedthat the probabilistic modeling approach offers a theoreticalsolution to the positioning problem and many other issuessuch as calibration active learning error estimation andtracking with history This solution was also used to developthe Ekahau (httpwwwekahaucom) commercial WLANlocation fingerprinting positioning system Ching et al [14]presented the WiPos system using WiFi APs deployed acrossa university and the system involved developing a server anda client running on the Android platform Testing showedthat universityrsquos WiFi network is sufficient to provide ldquoroomto roomrdquo level accuracy
In recent years a number of indoor positioning sys-tems have been developed by integrating other techniqueswith WLAN location fingerprinting to enhance the indoorpositioning performance Wang et al [15] presented a floor-map-aidedWiFipseudo-odometry integration based indoorpositioning system and the field experiment showed that itcould reliably achieve meter-level accuracy Karlsson et al[16] utilized signals of both 24 and 50GHz to obtain moreinformation ofWiFi and a particle filter was used to combinelocation fingerprinting with PDR to improve the accuracyBan et al [17] proposed a high accuracy indoor positioningmethod by using residual magnetism in addition to PDRand WiFi-based localization methods They evaluated themethod in real environments and confirmed that it couldprovide accurate indoor positioning with a mean error lessthan 8m and more accurate position detection than existingtechniques Kim et al [18] combined the magnetic fieldstrength cellular signal strength and WiFi to build a hybridsystem to address some limitations in WiFi localization
Mobile Information Systems 3
and the experiment demonstrated that the performance wasimproved in terms of not only accuracy but also computa-tional efficiency
In addition to the development of different systemsmanyresearchers have conducted research on novel algorithmsBattiti et al [19] presented a neural networkmethod (themul-tilayer perceptron) for building a flexible mapping betweenthe raw signal measurements and the position of the mobileterminal The average accuracy reached approximately 23meters when the environmental changes during the daywere taken into account Youssef et al [20] provided twoimplementations for indoor location determination jointclustering and incremental triangulation and described theperformance regarding accuracy and computation load Theresults of their experiment showed that both techniquesachieved over 90 accuracy within 7 feet with low compu-tation Saha et al [21] assessed the performance of differentclassifiers including neural network nearest neighbor andhistogram matching method The neural network algorithmprovided an error of less than onemeter with 72 probabilityless than 26 meters with over 95 probability and withalmost 98 probability it could infer the location within33 meters A hybrid method that combines the strength ofradio frequency propagation loss with location fingerprintingwas developed by Kwon et al in [22] This hybrid methodexhibited 20 to 40 improvement in positioning accuracyto that of competing methods in real site experiment andreached 5 to 7 meters even for a very sparse placement ofAPs Ito and Kawaguchi [23] proposed the Bayesian-basedlocation estimation systemwhich achieved an accuracy of 30meters with a cumulative probability of 035 in a lecture roomand 081 in a hallway Roos et al [24] studied theWLAN userlocation estimation problem following a machine learningframework and presented a probabilistic model to solvethe estimation problem In their test an average locationestimation error below 2 meters was easy to obtain and thetwo probabilistic methods produced slightly better resultsthan nearest neighbor methods Yu et al [25] utilized asupport vector machine (SVM) algorithm in the locationfingerprinting system and compared it with three kernelfunctions Experimental results indicated that the algorithmcould improve the localization accuracy and among the threekernel functions the radial basis function performs bestFeng et al [26] presented an accurate RSSI-based indoorpositioning system using compressive sensing method andthe experimental results showed that the proposed systemleads to substantial improvement in localization accuracy andcomplexity over the widely used traditional methods Lu etal [27] proposed the extreme learning machine with deadzone to address the problems related to signal variations andenvironmental dynamics in indoor settings And the real-world experimental results demonstrated that the proposedalgorithm could not only provide higher accuracy but alsoimprove the repeatability
Other research aspects such as fingerprinting databasebuilding also attract research interests especially in recentyears Li et al [28] presented a method based on Kriging toreduce the workload and save training time and make finger-printing techniques more flexible and easier to implement
Pan et al [29] presented a system called LeManCoR basedon manifold coregularization which is a machine learningtechnique for building a mapping function between datacould adapt the static mapping function effectively and isrobust to the number of RPs Zhao et al [30] improved aWiFifingerprinting based indoor positioning system by efficientlycombining the universal Kriging interpolation method 119896-nearest neighbor (119896-NN) and naive Bayes classifier and theirlab experiments showed that 28 observation points couldachieve the average positioning error of 1265m Ma et al[31] proposed a fingerprint recoverymethod based on inexactaugmented Lagrange multiplier algorithm The experimentresults indicated that the method could precisely recoverthe fingerprint and achieve good positioning performanceLiu et al [32] designed and tested a fast setup algorithmfor collecting data for fingerprinting database with thehelp of smartphone built-in motion sensors Experimentsshowed that therewas no significant difference onpositioningaccuracy between the fast setup method and the traditionalmethod A novel method called RSSI geography weightedregression was proposed by Du et al [33] to solve thefingerprint database construction problem The extensiveexperiments were performed to validate that the proposedmethod was robust and workforce efficient Further twoautonomous crowdsourcing systems were proposed to buildfingerprint databases on handheld devices by Zhuang et al[34] The proposed systems can run on smartphones buildand update databases autonomously and adaptively accountfor dynamic environments Results in different test scenariosindicated that the average positioning errors of both proposedsystems are all less than 575m
Different from the related papers that focus on buildingindividual systems implementing with different algorithmsand constructing fingerprint databases this paper concernson impact factors In the past some impact factors havebeen studied Prasithsangaree et al [35] presented a study ofthe positioning performance and placement issues includingalgorithm granularity of the grid in the database AP faulttolerance and building architecture Li et al [36] discussedpros and cons of different techniques used inWLAN locationfingerprinting including numbers of RPs in use 119896 parameterin the 119896-NN algorithm distance weighting and universalKriging in generating fingerprinting database and proba-bilistic algorithm in online processing Honkavirta et al [37]provided a comparative survey on WLAN RSSI locationfingerprinting by introducing the mathematical formulationand tuning the parameters in the formulation Althoughpapers [35ndash37] already analyzed some impact factors toour best of knowledge there is no systematic summaryof the impact factors by using Ishikawa diagrams [9] andexperimental analysis of the nonalgorithm factors which arethe main focus of this paper
3 Analysis and Summary of Potential ImpactFactors Using the Ishikawa Diagram
This section first introduces the basic quality control toolIshikawa diagram by presenting an example and the diagram
4 Mobile Information Systems
Problem
Main factor B
Main factor C
Main factor A
Main factor D
Factor A2
Factor A1
Factor B2
Factor B1
Factor D2
Factor D1
Factor C2
Factor C1
Figure 1 An example of the Ishikawa diagram
constructing steps and gives the reasons for choosing thistool It then constructs an Ishikawa diagram for WLANlocation fingerprinting systems and analyzes the potentialimpact factors to positioning performance in a step-by-step manner considering WLAN radio wave transmittingpropagating receiving and processing
31 The Ishikawa Diagram Tool The Ishikawa diagram [9]was developed by Dr Kaoru Ishikawa at the University ofTokyo in 1943 who is also a pioneer in quality managementtechniques in Japan The diagram has been used in processimprovement methods to identify the contributing causesand factors likely to be causing a problem in a systematic wayThere are also some other names for Ishikawa diagrams suchas fishbone diagrams Fishikawa herringbone diagrams andcause-and-effect diagrams Figure 1 shows an example of theIshikawa diagram and the name of fishbone diagram comesfrom its shapeAs illustrated in Figure 1 a completed Ishikawadiagram includes a central ldquospinerdquo and several branchesreminiscent of a ldquofish skeletonrdquoThe ldquofish headrdquo represents themain problem and the potential factors causing a problemareindicated in the ldquofish bonesrdquo of the diagrams In constructingan Ishikawa diagram the first thing is to determine theldquofish headrdquo which presents a problem of interest and thediscussion of factors should focus on the problem The nextstep is to decide how to categorize the main factors Thereare two basic methods to do so including by function and byprocess sequence The third step is to determine the factorsin every main factor by analysis discussion and summarySome factors may have subfactors and all the main factorsfactors and subfactors should be presented in ldquofish bonesrdquo
The Ishikawa diagram is considered one of the seven basictools of quality control [9] Moreover this methodology canbe used to any problem and can be tailored by users to fittheir circumstances Other six quality control tools includecheck sheet control chart histogram Pareto chart scatterdiagram and stratification and these six tools emphasizeprocess control or post hoc analysis However the Ishikawadiagram is an initial step in the screening process of qualitycontrol which can be a useful technique for organizing someof the information generated in preexperimental planning[38] After identifying potential causes and factors in a verysystematic way further testing will be necessary to confirm
the true causes and factors and their impact pattern Inaddition this method encourages group participation andutilizes group knowledge The structure provided by theIshikawa diagram also helps teammembers to think in a verysystematic way and follow a structured approach [39] Basedon the characteristics of the Ishikawa diagram method andthe objectives of this paper the Ishikawa diagram method isadopted
32 The Ishikawa Diagram Construction for WLAN Finger-printing Aspreviously described the first thing in construct-ing an Ishikawa diagram is to present a problem of interestIn this paper the problem should be the positioning perfor-mance of a WLAN RSSI fingerprinting systemThe next stepis to decide how to categorize the factors This paper choosesthe process sequence in aWLANRSSI fingerprinting systemRadio signal goes through four steps in location fingerprint-ing system in either offline or online phase transmittingpropagating receiving and processing These four steps canbe regarded as main factors in the Ishikawa diagram In theWLANfingerprinting system radio signal is first transmittedfrom APs (onlineoffline) propagated from transmitters toreceivers (onlineoffline) through environment received onRPs (offline) or any unknown target location (online) andfinally processed to construct fingerprint database (offline) orcompute location (online) The positioning performance canbe influenced in every step Therefore the potential factorswill be analyzed step-by-step in detail as follows
In the signal transmitting step all factors are about trans-mitters which areAPs inWLANRSSI location fingerprintingsystems As previously mentioned this technique is a cost-saving solution which means it can make full use of alreadydeployed APs such as WiFi hotspots However hotspotsare made by distinct vendors and are diverse with differentdevice parameters such as maximum transmit power Mean-while hotspots may also be placed with different densitiesdistributions and heights As such a receiver may accessdifferent numbers of hotspots in different areas In summarydifferences in APsrsquo device models density distribution andheight may influence the RSSI values in the receiver at thisstep
At the second step the radio signal propagates fromtransmitters to receivers and RSSI may be influenced byindoor physical environments and the radio signals fromother sources For example indoor structure building mate-rial and furniture placement may have impacts on radiosignal attenuation reflection and diffraction [40] Peoplecrowd in indoor environments may absorb and obstructthe radio signal and other dynamic objective measuressuch as temperature and humidity may influence the radiosignal propagating as well Interference may appear betweenWLAN signals from different APs or other sources such as amicrowave oven
In the signal receiving stage sampling RSSI in offlinelearning should be on RPs whose coordinates should beknown previously The differences of operators RPsrsquo densitydistribution and height will influence the complexity leveland RSSI values in fingerprinting databases In the onlinepositioning phase the main work is to search the nearest
Mobile Information Systems 5
WLAN RSSIlocation fingerprintingpositioning performance
Signalpropagating
Signalreceiving
Signaltransmitting
Signalprocessing
Machine learning algorithms
Signal filteringFeature extraction
Feature selection
Building structureBuilding materialFurniture placement
People crowedTemperature
HumidityOther signal sources
APs densityAPs distribution
APs heightsAPs models
OperatorsRPs density
RPs distributionRPs heights
Receivers modelsSampling rates
Number of samples
Figure 2 The Ishikawa diagram for impact factors on WLAN RSSI location fingerprinting positioning performance
RP or RPs by using RSSI sampled on an unknown pointwhich means that the sampling working is also neededonline Thus the receiversrsquo model differences in offline andonline may have impacts For example one smartphone maybe utilized in fingerprint database construction usually butusersrsquo devices are diverse with different brands and modelsin online positioning Additionally different sampling rateand the number of samples may also influence the samplesin fingerprint databases and online positioning results
The last step is signal processing the works in this stepinvolve RSSI fingerprint database constructing (offline phase)and location computing (online phase) In database con-structing phase signal filtering method feature extractionand selection may change the data and data structure in thefingerprint database And these factors also determine thefeatures used in online positioning In online positioningprocessing positioning result is computed from receivedRSSI online and fingerprint database using machine learningalgorithms Hence the main factors of this step are signalfiltering feature extraction feature selection and machinelearning algorithm
To summarize the potential impact factors which influ-ence the WLAN RSSI location fingerprinting performancean Ishikawa diagram is used in Figure 2 The ldquofish headrdquo inFigure 2 is WLAN RSSI location fingerprinting positioningperformance and ldquofish bonesrdquo are main factors and potentialfactors
4 Simulation Platform and Factors ofInterest Selection
According to Section 3 there are many potential impactfactors to WLAN RSSI location fingerprinting positioningperformance To understand the impact pattern betweenfactors and performance a couple of experiments with differ-ent factors settings need to be conducted For this purposethis paper builds a simulation platform used as the test
environment The positioning performance should be mea-surable as well thus this paper chooses the root mean squareerror (RMSE) and cumulative distribution function (CDF)to present the positioning error For the controllable abilityof the simulation platform simulation feasibility should betaken into consideration when choosing factors of interestfor experiments The potential factors are classified into fourtypes including controllable uncontrollable nuisance andheld-constant factors in another Ishikawa diagram and allthe controllable factors are regarded as factors of interest
41 A WLAN Location Fingerprinting Simulation PlatformThe platform simulates a cuboid test field with 10-meterlength 10-meter width and 3-meter height All APs areplaced at 3-meter height on the edges of the testing field andsampling RSSI in offline learning is on grid-shape RPs at one-meter height Figure 3 shows the placement of four APs in thefield and sampling RSSI on a particular RP with coordinatesof (5 5 1)
Radio signal propagating is described by path loss whichis a positive quantity measured in decibel (dB) The commonmodel for radio signal propagating used in indoor is Log-distance path loss model [41ndash44] as follows
PL (119889) = PL (1198890) + 10119899 lg( 1198891198890) + 119883120590119883120590 sim 119873(0 1205902)
(1)
where PL(119889) is the path loss at distance 119889 at near distance 1198890is a known received power reference point and 1198890 is usuallychosen as 1 (m) in indoor environment 119899 is the attenuationfactor and119883120590 is the signal noise error which obeys a normaldistribution with 0 mean value and 120590 standard deviationThus the received power at a distance 119889 can be calculatedusing
119875119903 = 119875119905 minus PL (119889) (2)
6 Mobile Information Systems
0 1 2 3 4 5 6 7 8 9 10
0123
45678
9100
05
1
15
2
25
3
Length (m)Width (m)
Hei
ght (
m)
5
3
Figure 3 Simulation field with the placement of four APs and oneRP
where 119875119905 is transmitted power and 119875119903 is the received powerWhen setting near distance 1198890 = 1 (m) the path loss can
be calculated by free space propagation model in
PL (119889) = 10 lg 119875119905119875119903 = minus10 lg[ 1198661199051198661199031205822
(4120587)2 1198892] (3)
where119875119905 is the transmitted power119875119903 is the received power119866119905is the transmitter antenna gain and119866119903 is the receiver antennagain
For the frequency of WLAN radio signal 119891 =2442 (GHz) the velocity of radio signal is 119888 = 3 times 108 (ms)and the wavelength is 120582 = 119888119891 Given 119866119905 = 119866119903 = 1we get the PL(1198890) = PL(1) = 402 (dB) Usually a realAP devicersquos transmitted power 119875119905 is 20 (dBm) which is 100milliwatts Thus the received power 119875119903 measured by RSSI inthe simulation work can be calculated by
119875119903 (119889) = 20 minus [402 + 10119899 lg (119889) + 119883120590] 119883120590 sim 119873(0 1205902) (4)
As aforementioned there are two kinds of commonly-used algorithms in fingerprinting location deterministic andprobabilistic methods Traditional deterministic algorithmscan be easily implemented based on 119896-NN Probabilisticalgorithms are based on statistical inference of positioningtarget and fingerprint database and they search the posi-tioning result by using the maximum likelihood Concretelysuppose the number of RPs is 119872 P119894 is the 119894th RP S119894 is theRSSI fingerprint on P119894 and the number of APs is 119873 S119894 =(1199041198941 1199041198942 119904119894119873) P119905 is positioning target points and S119905 is theRSSI fingerprint on P119905 thus S119905 = (1199041199051 1199041199052 119904119905119873) Then thepositioning result P119905 of P119905 can be calculated from formula (5)
if it takes the 1-NN as the positioning result 1-NN is also usedby this paper
P119905 = Pargmin119894S119894minusS119905 119894 = 1 2 119872 (5)
In formula (5) the distance is measured by the Euclideandistance of RSSI which is presented as follows
1003817100381710038171003817S119894 minus S1199051003817100381710038171003817 = ( 119873sum119895=1
10038161003816100381610038161003816119904119894119895 minus 11990411990511989510038161003816100381610038161003816119902)1119902 119902 = 2 (6)
Formula (7) shows the positioning result obtained by theprobabilistic algorithm
P119905 = Pargmax119894119875(S119894|S119905) 119894 = 1 2 119872 (7)
According to Bayesrsquo theorem the probability can befurther transformed into
119875 (S119894 | S119905) = 119875 (S119905 | S119894) sdot 119875 (S119894)119875 (S119905)= 119875 (S119905 | S119894) sdot 119875 (S119894)sum119875 (S119905 | S119894) sdot 119875 (S119894)
(8)
In formula (8) 119875(S119905) is the same for all RPs searching and119875(S119894) is prior probability and usually regarded as 1M Thusthe positioning result searching is transformed into formula(9)
argmax119894
119875 (S119894 | S119905) = argmax119894
119875 (S119905 | S119894)= argmax
119894
119873prod119895=1
119875 (119904119905119895 | S119894) (9)
The probability that signal 119904119905119895 appears on the 119894th RP is119875(119904119905119895 | S119894) which can be approximately calculated by para-metric distributions In this paper a Gaussian distribution isselected as shown in formula (10)
119875 (119904119905119895 | S119894) = 1radic2120587 sdot 120575 sdot exp[[minus(119904119905119895 minus 120583)221205752 ]] (10)
where 120583 and 120575 are statistic parameters according to S119894
42 Output Response and Selection of Factors of Interest Forthe response output of WLAN RSSI location fingerprintingperformance the measurement should be based on position-ing error obtained by formula (11)
Δ119901 = 10038171003817100381710038171003817Ptrue minus Ppositioning10038171003817100381710038171003817 (11)
where Δ119901 is the locating positioning error Ptrue is the truecoordinates of a test point and Ppositioning is the positioningresult of the test point
To facilitate description this paper chooses the RMSEas the measurement of positioning results which can becalculated by (12) To give more details about the errors this
Mobile Information Systems 7
paper chooses the error CDF measured by the cumulativenumber of test points (CNTP) in the positioning errorpresentation
RMSE = radic 1119873119873sum119894=1
Δ1199012119894 (12)
where 119873 is the total number of test points and Δ119901119894 is the 119894thlocating positioning error
According to Montgomery [38] impact factors can beclassified as controllable uncontrollable nuisance and held-constant factors and controllable factors are factors of inter-est For the controllable ability of the simulation platformthe simulation feasibility should be taken into consider-ation when choosing factors of interest for experimentsAdditionally because this paper focuses on nonalgorithmfactors signal filtering feature extraction feature selectionand machine learning algorithm are regarded as constantfactors Further this paper chooses two algorithms includingdeterministic and probabilistic algorithms during position-ing using features of RSSImean value and standard deviation
In the signal transmitting step the density of APs relieson the number in sight Since the simulation field is a fix 10 times10 (m2) square the density of APs is measured by the numberof APs (APN) The placement heights of APs always relate tobuilding floor height which means they are similar on thesame floor Therefore this factor can be regarded as a held-constant factor and be set as 3 (m) in simulation platformThis setting also simplifies APsrsquo distribution problem fromthree-dimensional to two-dimensionalThe two-dimensionalAPsrsquo distribution can be described by two aspects (1) distanceof APsrsquo centroid to indoor field centroid which is notated ascentroid distance (CD) and (2) the coefficient of variation(CV) of distances from all APs to the centroid which banbe calculated by formula (8) With regard to APrsquos modelsrsquodifference this paper classifies this factor as nuisance factorwhich is out the research scope
CV = StdMean
times 100 (13)
Radio signal propagating is described by Log-distancepath loss as in formula (1) There are some other propagatingmodels proposed to get more accurate signal strength byimproving formula (1) considering floorsrsquo andwallsrsquo impact toretrieve precise distance for indoor positioning For exampleRADAR [6] system presented a propagating model whichtakes wallsrsquo impact into account In this paper the Log-distance path loss model is selected using coefficients 119899 and120590 to simulate complex indoor environments It is impracti-cable to control physical environment impact factors in anexperiment platform in reality However the influence ofindoor structure building material and furniture placementcan be summarized as signal propagating attenuation factor(notated as 119899) in the radio signal propagating model inthe simulation platform Meanwhile dynamic people crowdtemperature humidity and other signal resources can beregarded as the signal noise standard deviation (notated as120590) in the propagating model as well Thus attenuation factor
Table 1 Empirical coefficient values for indoor propagation invarious types of buildings
Building type 119899 120590Vacuum infinite space 20 0Retail store 22 87Grocery store 18 52At same floor 28 129Through three floors 52 67Office 27 81Office 32 112Office 32 44Office 35 128Office 40 43Factory 21 97Factory 33 68
and signal noise can be chosen as controllable factors in thesignal propagating step and the empirical values of 119899 and 120590are presented in Table 1 according to Rappaport [41]
For the signal receiving the fingerprint sampling can beoperated on RPs in the grid shape Thus the distributioncan be regarded as held-constant factors and the density ofRPs can be measured by RPs grid interval distance (GID)In the simulation platform RPsrsquo heights sample rate andthe number of samples are also regarded as held-constantfactors and are set as 1 (m) 1 (Hz) and 240 (four orientations)respectively Nevertheless operators may be a person or arobot with different receivermodels and these two factors arecomplex in reality In this paper they are classified as nuisancefactors
Figure 4 illustrates the response output and classified fac-tors using another Ishikawa diagram It should be noted thata controllable factor remains constant and does not changethroughout an experiment test while the uncontrollable onemeans a factor varies randomly during the test In reality120590 factor in radio signal propagating is an uncontrollablefactor but for the controllability of the simulation platform120590 is regarded as a controllable factor as shown in Figure 4Table 2 lists all the controllable factors (factors of interest)measurement details and notations
5 Experiment and Results
According to Section 4 a simulation platform was built forexperiment and it took five controllable factors as factors ofinterest In the experiment the OFAT (one-factor-at-a-time)analysis method was adopted which omits the interactionimpact of all controllable factors This section describes thedetails of experiment settings and results
51 Tests Settings in the Analysis Experiment To conduct theOFAT analysis experiment a couple of tests with differentsettings of controllable factors were conducted in the simu-lation system Table 3 shows all the experiment settings Itshould be noted that a (start end and step) notationwas usedto describe a level range and a levels notation was used to
8 Mobile Information Systems
RMSE
Uncontrollablefactors
Nuisancefactors
Controllablefactors
Held-constantfactors
Attenuation factor
Signal noise
RPs density
RPs height
APs density
APs height
APs distribution
RPs distribution
Machine learning algorithm
APs models
Receivers modelsOperators
Sampling rates
Number of samples
Signal filtering
Feature extraction
Feature selection
Figure 4 The Ishikawa diagram for factor classification and response output
Table 2 All the controllable factors (factors of interest) and their measurement details
Controllable factor Measurement detail Measurement notation
APs density Number of APs in the test area APN
APs distribution Distance of APsrsquo centroid to indoor field centroid and the coefficient of variation ofdistances from all APs to the centroid CD and CV
Attenuation factor Attenuation factor in simulation radio signal propagating model 119899Signal noise Signal noise standard deviation in simulation radio signal propagating model 120590RPs density Grid interval distance of RPs when sampling RSSI fingerprint GID
Table 3 Settings for all the factors of interest (controllable factors) in the OFAT analysis experiment
Test ID Factors APs density (APN) APs distribution(CD (m)CV)
Attenuationfactor (119899) Signal noise (120590 (dB)) RPs density GID (m)
1 APs density (APN) Test factor (1 20 1) Open-shape 2 1 5 8 10 15 1
2 APs distribution(CD (m)CV) 5 Test factor (110 different
shapes) 2 1 5 8 10 15 1
3 Attenuation factor(119899) 3 5 10 15 20 Open-shape Test factor(1 55 05) 5 1
4 Signal noise (120590(dB)) 3 5 10 15 20 Open-shape 2 Test factor (1 15 1) 1
5 RPs density GID(m) 5 Open-shape 2 1 5 8 10 15 Test factor01 02 05 1 125 2
25 5
Mobile Information Systems 9
1 2 3 4 5 6 7 8 9 10
12345678910
3
5
10
15
20
APN
Length (m)Width (m)
Figure 5The open-shape distributions for five different APs densi-ties
describe different factor levels For example in the first testAPNwas set with 20 levels as 1 2 20 and 120590was set withfive levels as 1 5 8 10 15 Meanwhile it is inconvenient toshow the CD and CV of APs distribution in a single table cellbecause CD and CV depend on coordinates of APs whichvaries in every test Therefore this paper uses the ldquoopen-shaperdquo to describe APs distribution in the experiment whenthe distribution is not the test factor The ldquoopen-shaperdquo APsdistribution prefers a dispersed shape which simulates theplacement of APs in a real environment for communicationFigure 5 shows the open-shape APs placement when APN isset as 3 5 10 15 and 20which are common settings inTable 3It also should be noted that empirical coefficient values forindoor propagation in Table 1 were taken into considerationin all settings for attenuation factor and signal noise
According to Table 3 the first test factor was APs densitywith APN measurements and in the APs density test APNchanged from 1 to 20 with a step of 1 AP and every APNsetting took the open-shapeAPs distributionThe attenuationfactor 119899 was set as 2 signal noise 120590 changed in five levels thatis 1 5 8 10 and 15 (dB) and GID was 1 (m)
The second test factor was APs distribution measured byCD and CV and it took 110 different shapes of five APs intoconsideration In APs distribution test APN was 5 119899 was 2120590 ranged in five levels 1 5 8 10 and 15 (dB) and GID was1 (m) Figure 6 demonstrates all the 110 different shapes in thesimulation fields
With consideration of empirical coefficient values forindoor propagation in Table 1 the next test factor wasattenuation factor 119899 and 119899 ranged from 1 to 55 with aninterval of 05 in the test The APs were placed in the open-shape and the values changed into 3 5 10 15 and 20 the 120590was set as 5 (dB) and the GID was set as 1 (m)
The test factor signal noise standard deviation 120590 rangedfrom 1 to 15 with a step of 1 (dB) in the signal noise test The
APs were deployed in the same way as with the attenuationfactor test and 119899 was 2 and GID was 1 (m)
The last controllable test factor was RPs density describedby GID between two neighboring RPs In the test of thisfactor the GID varies with eight different settings whichwere 01 02 05 1 125 2 25 and 5 (m) Figure 7 shows thedifferent RPs distributions with different GID values Otherfactors were set as follows five APs in open-shape 119899 was 2and 120590 had five levels including 1 5 8 10 and 15 (dB)
In every OFAT test there was one fact under test and theprocedure on the simulation platform is as follows (1) inputcoordinates of APs GID and test points number (set as 100 inthis study) (2) generate RPs and the fingerprint database ofRPs (3) generate the test points randomly and generate thesignal strength of all the test points (4) test all the testingpoints with deterministic algorithm (5) test all the testingpoints with probabilistic algorithm and (6) output the errorcalculate the statistics and plot the RMSE and CDF graphsThese steps are shown in Figure 8
52 Tests Results in the Analysis Experiment
521 APs Density Figure 9 shows the test results of posi-tioning error by applying the deterministic and probabilisticalgorithms on different APs densities Figure 9(a) shows thetrend of RMSE on different APNs in the simulation test areawith different 120590 levels when 119899 = 2 and GID = 1 (m) In thisfigure we can find that the more APs it can access the betterpositioning result it can achieve when the noise error is lowBut if the noise error is high for example 120590 = 15 (dB)APN becomes less important It should be noted that 120590 =1 (dB) approximates an ideal noise situation and in this idealsituation RMSE is high when APN is less than 3 and theRMSE declines gently when APN increases from 3 to 20Thisline trend indicates that at least 3 APs are needed for RSSIlocation fingerprinting theoretically Figure 9(b) gives moredetails about the error distributionwith different 120590 levels andthe line located in ldquoup-leftrdquo of CDF means better accuracyperformance It can be seen from Figure 9(b) that lines withhigher APN are more towards ldquoup-leftrdquo than ones with lowerAPN but with the increase of noise error the error linesbecome more towards ldquodown-rightrdquo and close to each otherThese lines indicate that largeAPNcan reduce the positioningerror but if the noise becomes higher the influence of APNbecomes less and less
522 APs Distribution Figure 10 shows the test results ofpositioning errors by using the deterministic and probabilis-tic algorithms on 110 different APs distributions measured byCD and CV with model setting as APN = 5 119899 = 2 and GID= 1 (m) Figures 10(a) and 10(c) plot the RMSE on CD andCV respectively at different 120590 levels however we can hardlyfind clear patterns on RMSE with CD and CV in these twofigures except that higher 120590 have higher RMSE levels Figures10(b) and 10(d) plot the CNTP with ordered CD and CV Inthese two figures we can see that lines with lower 120590 are moretowards ldquoup-leftrdquo than the higher 120590 but nomatter 120590 is all thelines are unordered with CD and CVThus similar to RMSE
10 Mobile Information Systems
1 2 3 4 5 6 7 8 9 10
123456789100
10
20
30
40
110
diffe
rent
AP
shap
es
Length (m)
Width (m)1 2 3 4 5 6 7 8 9 10
12345678910
20
40
60
80
110
diffe
rent
AP
shap
es
Length (m)Width (m)
1 2 3 4 5 6 7 8 9 10
1234567
891070
80
90
100
110
110
diffe
rent
AP
shap
es
Length (m)Width (m)
Figure 6 The 110 different shapes of five APs placement
we can hardly summarize the influence trend of CD and CVto error distribution according to Figures 10(b) and 10(d)
523 Attenuation Factor Figure 11 illustrates the test resultsof positioning errors by using the deterministic and proba-bilistic algorithms on attenuation factor 119899 Figure 11(a) showsthe RMSE versus 119899 under 120590 = 5 (dB) and GID = 1 (m) atdifferent APN levels According to this figure we can see thatthe RMSE declines with the increase of 119899 And the largerAPN shows lower RMSE level for example line with APN= 20 locate lower than APN = 3 But APNrsquos impact trendsto less when APN has been already large for instance linesare closer to each other when APN is set to 10 15 and 20comparing to the settings of 3 and 5 Error distributions areshown in Figure 11(b) it can be seen that lines with higher119899 and more APs are more towards ldquoup-leftrdquo which meanshigher n and more APs are good for better performance
However error distributions are similar when APN is largesuch as 10 15 and 20 no matter which algorithm is used
524 Signal Noise Test results of positioning errors by usingthe deterministic and probabilistic algorithms on signal noise120590withmodel settings 119899 = 2 and GID = 1 (m) are illustrated inFigure 12TheRMSE resultswith120590under differentAPN levelsare shown in Figure 12(a) There are growing trends of RMSEresults with the 120590 level in all APN settings in Figure 12(a)which means that the higher noise level in the environmentthe worse positioning performance It is interesting to seethat as 120590 increases all the lines change from close throughapart to close againThese lines indicate that APN can hardlyinfluence the result when the environment has very low orhigh lever noise for example when 120590 is lower than 3 (dB) orhigher than 13 (dB) in Figure 12(a) Figure 12(b) shows theerror distributions of positioning results In this figure signal
Mobile Information Systems 11
1 2 3 4 5 6 7 8 9 10
1234567891001
02
05
1
125
2
25
5
Length (m)Width (m)
GID
(m)
Figure 7 Different RPs distributions with different GID values
Input coordinates ofAPs GID and testpoints number
Generate RPs and thefingerprint databaseof RPs
Generate the testpoints randomly andsignal strength of testpoints
Test all test pointswith deterministicalgorithm
Test all test pointswith probabilisticalgorithm
Output errorstatistics and figures
Figure 8 The flowchart of a factor test using the simulationplatform
noise influence can be clearly seen from the color lines inevery error distribution however the impact of APN is notclear for the similar error distributions especially when APNis larger than 3
525 RPs Density Test results of positioning errors by usingthe deterministic and probabilistic algorithms on RPs densityGID are shown in Figure 13 The model was set as APN =5 and 119899 = 2 and Figure 12(a) illustrates the RMSE resultson GID with different 120590 levels All the lines of RMSE showincreasing trends but this trend becomes smoother when 120590is high This phenomenon is much clearer when taking theerror distributions in Figure 12(b) into consideration When120590 = 1 (dB) all the lines of CNTP with less GID are locatedldquoup-leftrdquo no matter which algorithm is used However if 120590increases these lines tend to move ldquodown-rightrdquo and muchnearer According to Figure 13 reducing GID will not benefitpositioning performance significantly when GID is less than1 (m) and especially when noise is low as 120590 = 1 (dB) It seemsthat 125 (m) is a good choice for GID if noise is high forexample 120590 = 15 (dB)
6 Conclusions and Future Work
WLAN location fingerprinting is a cost-saving solution but itstill faces difficulties in practical applications because of theimpact of the factors such as inhomogeneous APs placementunstationary WLAN RSSI and additional offline learningwork There are many factors that influence positioningperformance in location fingerprinting systems A goodsummary of potential factors and analysis of their impactpatterns can benefit the applications and quality control oflocation fingerprinting The issue is challenging howeverlittle effort has been made on systematical investigation
This paper analyzed the impact factors of positioningperformance in RSSI location fingerprinting systems step-by-step considering the radio transmitting propagatingreceiving and processing and summarized potential factorsby using Ishikawa diagram to provide a reference for furtherresearch To facilitate the analysis experiment of factors andimpacts this paper presented a simulation WLAN locationfingerprinting platform The paper classified all the factorsinto controllable uncontrollable nuisance andheld-constantfactors in another Ishikawa diagram with consideration ofthe feasibility of the simulation platform Finally the paperconsidered five controllable factors (including APs densityAPs distribution radio signal propagating attenuation factorradio signal propagating noise and RPs density) as factors ofinterest and utilized the OFAT analysis method to conductthe experiment to reduce the complexity and number of testsin a factor analysis experiment
The results indicate that high APs density signal propa-gating attenuation factor and RPs density with a low level ofsignal propagating noise are favorable for better positioningperformance while APs distribution has no particular impactpattern on the performance It is not necessary to improveRPs density to get better positioning performance when GIDis less than 1meterMoreover highRPs densitymeans a heavywork for building fingerprinting database
According to the results some observations can be drawnto guide the quality control in applications ofWLAN locationfingerprinting (1) the number of APs must be larger than3 for location fingerprinting and deploying some externalAPs can improve the performance especially in a noisyenvironment no matter what the distribution these APshave However if the environment is very noisy (eg 120590 isabout 15 (dB) according to the experiments) this methodcan hardly be effective (2) an environment with complexstructures such as a unit with many walls and rooms (highattenuation factor) is more preferable for deploying locationfingerprinting than a simple one like an underground parkinglot (low attenuation factor) and (3) improving RPs densitycan benefit positioning but it is useless when the GID is lessthan 1 meter Meanwhile high RPs density means more workfor fingerprinting database building and updating
In the near future real field experiments will be designedand conducted to further verify the conclusions given in thispaper It should be noted that to reduce the complexity andnumber of tests in a factor analysis experiment an OFATmethod was used to omit the factor interactions Although
12 Mobile Information Systems
120590 = 1
120590 = 5
120590 = 8
120590 = 10
120590 = 15
Deterministic algorithm
120590 = 1
120590 = 5
120590 = 8
120590 = 10
120590 = 15
Probabilistic algorithm
0
2
4
6
8
10
RMSE
(m)
2 4 6 8 10 12 14 16 18 200APN
2 4 6 8 10 12 14 16 18 200APN
0
2
4
6
8
10
RMSE
(m)
(a)
Deterministic algorithm Probabilistic algorithm
APN APN
1 2 3 4 5 6 7 8 9 10 11 12 13 14 15 16 17 18 19 201 2 3 4 5 6 7 8 9 10 11 12 13 14 15 16 17 18 19 20
120590 = 1 120590 = 1
120590 = 5 120590 = 5
120590 = 8 120590 = 8
120590 = 10 120590 = 10
120590 = 15 120590 = 15
1 2 3 4 5 6 7 8 9 100Δp (m)
1 2 3 4 5 6 7 8 9 100Δp (m)
0
50
100
CNTP
()
0
50
100
CNTP
()
1 2 3 4 5 6 7 8 9 100Δp (m)
1 2 3 4 5 6 7 8 9 100Δp (m)
0
50
100
CNTP
()
0
50
100
CNTP
()
1 2 3 4 5 6 7 8 9 100Δp (m)
1 2 3 4 5 6 7 8 9 100Δp (m)
0
50
100
CNTP
()
1 2 3 4 5 6 7 8 9 100Δp (m)
0
50
100
CNTP
()
0
50
100
CNTP
()
1 2 3 4 5 6 7 8 9 100Δp (m)
0
50
100
CNTP
()
0
50
100
CNTP
()
1 2 3 4 5 6 7 8 9 100Δp (m)
1 2 3 4 5 6 7 8 9 100Δp (m)
0
50
100
CNTP
()
(b)
Figure 9 Test results of positioning error by using the deterministic and probabilistic algorithms on different APs densities including (a)RMSE versus APN and (b) CNTP versus APN
Mobile Information Systems 13
Deterministic algorithm Probabilistic algorithm
120590 = 1
120590 = 5
120590 = 8
120590 = 10
120590 = 15
120590 = 1
120590 = 5
120590 = 8
120590 = 10
120590 = 15
0
1
2
3
4
5
6
7
RMSE
(m)
0
1
2
3
4
5
6
7
RMSE
(m)
1 2 3 4 5 60CD (m)
1 2 3 4 5 60CD (m)
(a)
Deterministic algorithm Probabilistic algorithm
CD (m) CD (m)0 05 1 15 2 25 3 35 4 45 5 0 05 1 15 2 25 3 35 4 45 5
120590 = 1 120590 = 1
120590 = 5 120590 = 5
120590 = 8 120590 = 8
120590 = 10 120590 = 10
120590 = 15 120590 = 15
1 2 3 4 5 6 7 8 9 100Δp (m)
1 2 3 4 5 6 7 8 9 100Δp (m)
0
50
100
CNTP
()
0
50
100
CNTP
()
0
50
100
CNTP
()
1 2 3 4 5 6 7 8 9 100Δp (m)
1 2 3 4 5 6 7 8 9 100Δp (m)
0
50
100
CNTP
()
0
50
100
CNTP
()
0
50
100
CNTP
()
1 2 3 4 5 6 7 8 9 100Δp (m)
1 2 3 4 5 6 7 8 9 100Δp (m)
0
50
100
CNTP
()
0
50
100
CNTP
()
0
50
100
CNTP
()
0
50
100
CNTP
()
1 2 3 4 5 6 7 8 9 100Δp (m)
1 2 3 4 5 6 7 8 9 100Δp (m)
1 2 3 4 5 6 7 8 9 100Δp (m)
1 2 3 4 5 6 7 8 9 100Δp (m)
(b)
Figure 10 Continued
14 Mobile Information Systems
Deterministic algorithm Probabilistic algorithm
120590 = 1
120590 = 5
120590 = 8
120590 = 10
120590 = 15
120590 = 1
120590 = 5
120590 = 8
120590 = 10
120590 = 15
20 40 60 80 1000CV
01234567
RMSE
(m)
01234567
RMSE
(m)
20 40 60 80 1000CV
(c)
Deterministic algorithm Probabilistic algorithm
CV10 20 30 40 50 60 70 80 90
CV10 20 30 40 50 60 70 80 90
120590 = 1 120590 = 1
120590 = 5 120590 = 5
120590 = 8 120590 = 8
120590 = 10 120590 = 10
120590 = 15 120590 = 15
0
50
100
CNTP
()
0
50
100
CNTP
()
1 2 3 4 5 6 7 8 9 100Δp (m)
1 2 3 4 5 6 7 8 9 100Δp (m)
1 2 3 4 5 6 7 8 9 100Δp (m)
0
50
100
CNTP
()
1 2 3 4 5 6 7 8 9 100Δp (m)
0
50
100
CNTP
()
1 2 3 4 5 6 7 8 9 100Δp (m)
0
50
100
CNTP
()
0
50
100
CNTP
()
1 2 3 4 5 6 7 8 9 100Δp (m)
1 2 3 4 5 6 7 8 9 100Δp (m)
0
50
100
CNTP
()
1 2 3 4 5 6 7 8 9 100Δp (m)
0
50
100
CNTP
()
1 2 3 4 5 6 7 8 9 100Δp (m)
0
50
100
CNTP
()
1 2 3 4 5 6 7 8 9 100Δp (m)
0
50
100
CNTP
()
(d)
Figure 10 Test results of positioning errors by using the deterministic and probabilistic algorithms on different APs distributions including(a) RMSE versus CD (b) CNTP versus CD (c) RMSE versus CV and (d) CNTP versus CV
Mobile Information Systems 15
Deterministic algorithm
APN = 3APN = 5APN = 10
APN = 15APN = 20
APN = 3APN = 5APN = 10
APN = 15APN = 20
1 2 3 4 5
Probabilistic algorithm
n
0
1
2
3
4
5
6
RMSE
(m)
0
1
2
3
4
5
6
RMSE
(m)
2 3 4 51n
(a)
Deterministic algorithm Probabilistic algorithm
n
1 15 2 25 3 35 4 45 5 55
n
1 15 2 25 3 35 4 45 5 55
APN = 3 APN = 3
APN = 5 APN = 5
APN = 10 APN = 10
APN = 15 APN = 15
APN = 20 APN = 20
1 2 3 4 5 6 7 8 9 100Δp (m)
0
50
100
CNTP
()
0
50
100
CNTP
()
1 2 3 4 5 6 7 8 9 100Δp (m)
1 2 3 4 5 6 7 8 9 100Δp (m)
0
50
100
CNTP
()
1 2 3 4 5 6 7 8 9 100Δp (m)
0
50
100
CNTP
()
1 2 3 4 5 6 7 8 9 100Δp (m)
0
50
100
CNTP
()
0
50
100
CNTP
()
1 2 3 4 5 6 7 8 9 100Δp (m)
1 2 3 4 5 6 7 8 9 100Δp (m)
0
50
100
CNTP
()
1 2 3 4 5 6 7 8 9 100Δp (m)
0
50
100
CNTP
()
0
50
100
CNTP
()
1 2 3 4 5 6 7 8 9 100Δp (m)
0
50
100
CNTP
()
1 2 3 4 5 6 7 8 9 100Δp (m)
(b)
Figure 11 Test results of positioning errors by using the deterministic and probabilistic algorithms on different attenuation factors including(a) RMSE versus 119899 and (b) CNTP versus 119899
16 Mobile Information Systems
Deterministic algorithm
0
1
2
3
4
5
6Probabilistic algorithm
RMSE
(m)
3 5 7 9 11 13 151120590 (dB)
0
1
2
3
4
5
6
RMSE
(m)
3 5 7 9 11 13 151120590 (dB)
APN = 3APN = 5APN = 10
APN = 15APN = 20
APN = 3APN = 5APN = 10
APN = 15APN = 20
(a)
Deterministic algorithm Probabilistic algorithm
1 2 3 4 5 6 7 8 9 10 11 12 13 14 15120590 (dB)
1 2 3 4 5 6 7 8 9 10 11 12 13 14 15120590 (dB)
APN = 3 APN = 3
APN = 5 APN = 5
APN = 10 APN = 10
APN = 15 APN = 15
APN = 20 APN = 20
1 2 3 4 5 6 7 8 9 100Δp (m)
0
50
100
CNTP
()
0
50
100
CNTP
()
1 2 3 4 5 6 7 8 9 100Δp (m)
1 2 3 4 5 6 7 8 9 100Δp (m)
0
50
100
CNTP
()
0
50
100
CNTP
()
1 2 3 4 5 6 7 8 9 100Δp (m)
1 2 3 4 5 6 7 8 9 100Δp (m)
0
50
100
CNTP
()
1 2 3 4 5 6 7 8 9 100Δp (m)
0
50
100
CNTP
()
0
50
100
CNTP
()
1 2 3 4 5 6 7 8 9 100Δp (m)
1 2 3 4 5 6 7 8 9 100Δp (m)
0
50
100
CNTP
()
1 2 3 4 5 6 7 8 9 100Δp (m)
0
50
100
CNTP
()
1 2 3 4 5 6 7 8 9 100Δp (m)
0
50
100
CNTP
()
(b)
Figure 12 Test results of positioning errors by using the deterministic and probabilistic algorithms on different signal noise errors including(a) RMSE versus 120590 and (b) CNTP versus 120590
Mobile Information Systems 17
Deterministic algorithm Probabilistic algorithm
120590 = 1
120590 = 5
120590 = 8
120590 = 10
120590 = 15
120590 = 1
120590 = 5
120590 = 8
120590 = 10
120590 = 15
02 05 1 125 2 25 501GID (m)
0
2
4
6
8
10
RMSE
(m)
02 05 1 125 2 2501 5GID (m)
0
2
4
6
8
10
RMSE
(m)
(a)
0 1 2 3 4 5 6 7 8 9 10
Deterministic algorithm
CNTP
()
Probabilistic algorithm
0 1 2 3 4 5 6 7 8 9 100
50
100
GID (m)01 02 05 1 125 2 25 5
GID (m)01 02 05 1 125 2 25 5
120590 = 1 120590 = 1
120590 = 5 120590 = 5
120590 = 8 120590 = 8
120590 = 10 120590 = 10
120590 = 15 120590 = 15
Δp (m)
Δp (m)1 2 3 4 5 6 7 8 9 100
Δp (m)
0
50
100
CNTP
()
0
50
100
CNTP
()
0
50
100
CNTP
()
1 2 3 4 5 6 7 8 9 100Δp (m)
1 2 3 4 5 6 7 8 9 100Δp (m)
0
50
100
CNTP
()
0
50
100
CNTP
()
1 2 3 4 5 6 7 8 9 100Δp (m)
0
50
100
CNTP
()
1 2 3 4 5 6 7 8 9 100Δp (m)
1 2 3 4 5 6 7 8 9 100Δp (m)
0
50
100
CNTP
()
1 2 3 4 5 6 7 8 9 100Δp (m)
0
50
100
CNTP
()
0
50
100
CNTP
()
1 2 3 4 5 6 7 8 9 100Δp (m)
(b)
Figure 13 Test results of positioning errors by using the deterministic and probabilistic algorithms on different RPs densities including (a)RMSE versus GID and (b) CNTP versus GID
18 Mobile Information Systems
it can demonstrate two factorsrsquo interactions in every testa more complicated factor analysis experiment needs to beconducted to extend the OFAT experiment in the future Wealso plan to conduct practical applications ofWLAN locationfingerprinting and control the quality of positioning resultsbased on the outcomes of this paper
Acronyms
WLAN Wireless local area networkAP Access pointOFAT One-factor-at-a-timeGPS Global positioning system119896-NN 119896-nearest neighborCNTP Cumulative number of test pointsCD Centroid distanceGID Grid interval distanceRSSI Received signal strength indicatorRP Reference pointRMSE Root mean square errorPDR Pedestrian dead reckoningCDF Cumulative distribution functionAPN APs numberCV Coefficient of variation
Competing Interests
The authors declare no conflict of interests
Authorsrsquo Contributions
Keqiang Liu and Yunjia Wang conceived the paper anddesigned the experiments Keqiang Liu summarized theimpact factors developed simulation platform and con-ducted the analysis experiment Lixin Lin andGuoliangChenparticipated in analyzing the data Keqiang Liu mainly com-posed this paper and Yunjia Wang Lixin Lin and GuoliangChen contributed in revising All authors participated inelaborating the paper and proofreading
Acknowledgments
The research work presented in this paper is partly supportedby China National Key Research and Development Program(Grant no 2016YFB0502102) theNatural Science Foundationof Jiangsu Province (no BK20161181) the Key Laboratoryof Advanced Engineering Surveying of National Adminis-tration of Surveying Mapping and Geo-Information (Grantno TJES1302) Education Department of Jiangsu (Grantno KYLX 1394) the National Natural Science Foundationof China (no 41371423) and the Priority Academic Pro-gram Development of Jiangsu Higher Education Institutions(Grant no SZBF2011-6-B35) All the authors would liketo thank Professor Songnian Li from Ryerson UniversityCanada for helping them in English writing which greatlyimproved the manuscript
References
[1] P A Zandbergen ldquoAccuracy of iPhone locations a comparisonof assisted GPS WiFi and cellular positioningrdquo Transactions inGIS vol 13 no 1 pp 5ndash25 2009
[2] H Liu H Darabi P Banerjee and J Liu ldquoSurvey of wirelessindoor positioning techniques and systemsrdquo IEEE Transactionson Systems Man and Cybernetics Part C Applications andReviews vol 37 no 6 pp 1067ndash1080 2007
[3] L Pei R Chen J Liu H Kuusniemi T Tenhunen and Y ChenldquoUsing inquiry-based Bluetooth RSSI probability distributionsfor indoor positioningrdquo Journal of Global Positioning Systemsvol 9 pp 122ndash130 2010
[4] L Chen P Thevenon G Seco-Granados O Julien and HKuusniemi ldquoAnalysis on the TOA tracking with DVB-T signalsfor positioningrdquo IEEE Transactions on Broadcasting vol 62 no4 pp 957ndash961 2016
[5] J Liu R Chen L Pei R Guinness and H Kuusniemi ldquoAhybrid smartphone indoor positioning solution for mobileLBSrdquo Sensors (Switzerland) vol 12 no 12 pp 17208ndash17233 2012
[6] P Bahl and V N Padmanabhan ldquoRADAR an in-building RF-based user location and tracking systemrdquo in Proceedings ofthe 19th Annual Joint Conference of the IEEE Computer andCommunications Societies (INFOCOM rsquo00) pp 775ndash784 TelAviv Israel March 2000
[7] M Youssef andAAgrawala ldquoTheHorusWLAN location deter-mination systemrdquo in Proceedings of the 3rd International Confer-ence onMobile Systems Applications and Services (MobiSys rsquo05)pp 205ndash218 ACM Seattle Wash USA June 2005
[8] L Chen L Pei H Kuusniemi Y Chen T Kroger and RChen ldquoBayesian fusion for indoor positioning using bluetoothfingerprintsrdquo Wireless Personal Communications vol 70 no 4pp 1735ndash1745 2013
[9] K Ishikawa Guide to Quality Control Asian ProductivityOrganization Tokyo Japan 1976
[10] P Bahl andV N Padmanabhan ldquoEnhancements to the RADARuser location and tracking systemrdquo Tech Rep MSR-TR-2000-12 Microsoft Research Redmond Wash USA 2000
[11] P Castro P Chiu T Kremenek and R Muntz ldquoA probabilisticroom location service for wireless networked environmentsrdquo inProceedings of the 3rd International Conference on UbiquitousComputing (UbiComp rsquo01) G D Abowd B Brumitt and S AShafer Eds pp 18ndash34 Springer Atlanta Ga USA September-October 2001
[12] A Taheri A Singh and E Agu ldquoLocation fingerprinting oninfrastructure 80211 Wireless Local Area Networks (WLANs)using locusrdquo in Proceedings of the 29th Annual IEEE Inter-national Conference on Local Computer Networks (LCN rsquo04)Tampa Fla USA November 2004
[13] P Kontkanen P Myllymaki T Roos H Tirri K Valtonenand H Wettig ldquoTopics in probabilistic location estimation inwireless networksrdquo in Proceedings of the IEEE 15th InternationalSymposium on Personal Indoor and Mobile Radio Communi-cations (PIMRC rsquo04) pp 1052ndash1056 IEEE Barcelona SpainSeptember 2004
[14] W Ching R J Teh B Li and C Rizos ldquoUniwide WiFi basedpositioning systemrdquo in Proceedings of the IEEE InternationlSymposium on Technology and Society Social Implications ofEmerging Technologies (ISTAS rsquo10) pp 180ndash189 WollongongAustralia June 2010
Mobile Information Systems 19
[15] J Wang A Hu C Liu and X Li ldquoA floor-map-aidedWiFipseudo-odometry integration algorithm for an indoorpositioning systemrdquo Sensors (Switzerland) vol 15 no 4 pp7096ndash7124 2015
[16] F KarlssonM Karlsson B Bernhardsson F Tufvesson andMPersson ldquoSensor fused indoor positioning using dual bandWiFisignal measurementsrdquo in Proceedings of the European ControlConference (ECC rsquo15) July 2015
[17] R Ban K Kaji K Hiroi and N Kawaguchi ldquoIndoor posi-tioning method integrating pedestrian dead reckoning withmagnetic field and wifi fingerprintsrdquo in Proceedings of the 8thInternational Conference on Mobile Computing and UbiquitousNetworking (ICMU rsquo15) pp 167ndash172 IEEE Hakodate JapanJanuary 2015
[18] B Kim M Kwak J Lee and T T Kwon ldquoA multi-prongedapproach for indoor positioning with WiFi magnetic and cel-lular signalsrdquo in Proceedings of the 5th International Conferenceon Indoor Positioning and Indoor Navigation (IPIN rsquo14) pp 723ndash726 Busan Korea October 2014
[19] R Battiti T Nhat and A Villani ldquoLocation-aware computinga neural network model for determining location in wirelessLANsrdquo Tech Rep DIT-02-083 University of Trento TrentoItaly 2002
[20] M A Youssef A Agrawala and A U Shankar ldquoWLANlocation determination via clustering and probability distribu-tionsrdquo in Proceedings of the 1st IEEE International Conferenceon Pervasive Computing and Communications (PerCom rsquo03) pp143ndash150 Fort Worth Tex USA March 2003
[21] S Saha K Chaudhuri D Sanghi and P Bhagwat ldquoLocationdetermination of a mobile device using IEEE 80211b accesspoint signalsrdquo in Proceedings of the IEEE Wireless Commu-nications and Networking Conference The Dawn of PervasiveCommunication (WCNC rsquo03) vol 3 March 2003
[22] J Kwon B Dundar and P Varaiya ldquoHybrid algorithm forindoor positioning using wireless LANrdquo in Proceedings of theIEEE 60th Vehicular Technology Conference (VTCrsquo 04) pp4625ndash4629 Los Angeles Calif USA September 2004
[23] S Ito and N Kawaguchi ldquoBayesian based location estimationsystem using wireless LANrdquo in Proceedings of the 3rd IEEEInternational Conference on Pervasive Computing and Commu-nications Workshops PerCom 2005 Workshops pp 273ndash278Kauai Island Hawaii USA 2005
[24] T Roos P Myllymaki H Tirri P Misikangas and J SievanenldquoA probabilistic approach to WLAN user location estimationrdquoInternational Journal of Wireless Information Networks vol 9no 3 pp 155ndash164 2002
[25] F Yu M H Jiang J Liang et al ldquoAn indoor localization ofWiFi based on support vector machinesrdquo Advanced MaterialsResearch vol 926-930 pp 2438ndash2441 2014
[26] C Feng W S A Au S Valaee and Z Tan ldquoReceived-signal-strength-based indoor positioning using compressive sensingrdquoIEEETransactions onMobile Computing vol 11 no 12 pp 1983ndash1993 2012
[27] X Lu C Yu H Zou H Jiang and L Xie ldquoExtreme learn-ing machine with dead zone and its application to WiFibased indoor positioningrdquo in Proceedings of the 13th Interna-tional Conference on Control Automation Robotics and Vision(ICARCV rsquo14) December 2014
[28] B Li YWangHK Lee AGDempster andCRizos ldquoMethodfor yielding a database of location fingerprints in WLANrdquo
IEE ProceedingsmdashCommunications vol 152 no 5 pp 580ndash5862005
[29] S J Pan J T Kwok Q Yang and J J Pan ldquoAdaptive localizationin a dynamic WiFi environment through multi-view learningrdquoinProceedings of the 22ndNational Conference onArtificial Intel-ligence vol 2 pp 1108ndash1113 AAAI Press Vancouver Canada2007
[30] H Zhao B Huang and B Jia ldquoApplying kriging interpolationfor WiFi fingerprinting based indoor positioning systemsrdquo inProceedings of the IEEEWireless Communications and Network-ing Conference (WCNC rsquo16) pp 1ndash6 April 2016
[31] LMa J Li Y Xu andWMeng ldquoRadiomap recovery and noisereduction method for green WiFi indoor positioning systembased on inexact augmented lagrange multiplier algorithmrdquo inProceedings of the 58th IEEEGlobal Communications Conference(GLOBECOM rsquo15) pp 1ndash5 IEEE San Diego Calif USADecember 2015
[32] H-H Liu C-W Liao and W-H Lo ldquoThe fast collection ofradio fingerprint for WiFi-based indoor positioning systemrdquoin Proceedings of the 11th EAI International Conference onHeterogeneous Networking for Quality Reliability Security andRobustness (QSHINE rsquo15) Taipei Taiwan August 2015
[33] Y Du D Yang and C Xiu ldquoA novel method for constructing aWIFI positioning systemwith efficient manpowerrdquo Sensors vol15 no 4 pp 8358ndash8381 2015
[34] Y Zhuang Z Syed Y Li and N El-Sheimy ldquoEvaluation of twoWiFi positioning systems based on autonomous crowdsourcingof handheld devices for indoor navigationrdquo IEEE Transactionson Mobile Computing vol 15 no 8 pp 1982ndash1995 2016
[35] P Prasithsangaree P Krishnamurthy and P K ChrysanthisldquoOn indoor position location with wireless lansrdquo in Proceedingsof the 13th IEEE International Symposium on Personal Indoorand Mobile Radio Communications (PIMRC rsquo02) pp 720ndash724Lisboa Portugal September 2002
[36] B Li J Salter AGDempster andC Rizos ldquoIndoor positioningtechniques based on wireless LANrdquo in Proceedings of the1st IEEE International Conference on Wireless Broadband andUltra Wideband Communications (AusWireless rsquo06) pp 130ndash136 IEEE Sydney Australia March 2006
[37] V Honkavirta T Perala S Ali-Loytty and R Piche ldquoA com-parative survey of WLAN location fingerprinting methodsrdquo inProceedings of the 6th Workshop on Positioning Navigation andCommunication (WPNC rsquo09) March 2009
[38] D C Montgomery Design and Analysis of Experiments JohnWiley amp Sons 2008
[39] G Ilie and C N Ciocoiu ldquoApplication of fishbone diagram todetermine the risk of an event with multiple causesrdquo Manage-ment Research and Practice vol 2 pp 1ndash20 2010
[40] L Chen S Ali-Loytty R Piche and L Wu ldquoMobile trackingin mixed line-of-sightnon-line-of-sight conditions algorithmand theoretical lower boundrdquo Wireless Personal Communica-tions vol 65 no 4 pp 753ndash771 2012
[41] T S RappaportWireless Communications Principles and Prac-tice vol 2 Prentice Hall PTR Upper Saddle River NJ USA1996
[42] S Y Seidel and T S Rappaport ldquo914 MHz path loss predictionmodels for indoor wireless communications in multiflooredbuildingsrdquo IEEETransactions onAntennas and Propagation vol40 no 2 pp 207ndash217 1992
20 Mobile Information Systems
[43] I Ahmed S Orfali T Khattab and A Mohamed ldquoCharacter-ization of the indoor-outdoor radio propagation channel at 24GHzrdquo inProceedings of the IEEEGCCConference andExhibition(GCC rsquo11) pp 605ndash608 February 2011
[44] D B Faria ldquoModeling signal attenuation in IEEE 80211 wirelessLANsrdquo Tech Rep TR-KP06-0118 Kiwi Project ComputerScience Department Stanford University Stanford Calif USA2005
Submit your manuscripts athttpswwwhindawicom
Computer Games Technology
International Journal of
Hindawi Publishing Corporationhttpwwwhindawicom Volume 2014
Hindawi Publishing Corporationhttpwwwhindawicom Volume 2014
Distributed Sensor Networks
International Journal of
Advances in
FuzzySystems
Hindawi Publishing Corporationhttpwwwhindawicom
Volume 2014
International Journal of
ReconfigurableComputing
Hindawi Publishing Corporation httpwwwhindawicom Volume 2014
Hindawi Publishing Corporationhttpwwwhindawicom Volume 2014
Applied Computational Intelligence and Soft Computing
thinspAdvancesthinspinthinsp
Artificial Intelligence
HindawithinspPublishingthinspCorporationhttpwwwhindawicom Volumethinsp2014
Advances inSoftware EngineeringHindawi Publishing Corporationhttpwwwhindawicom Volume 2014
Hindawi Publishing Corporationhttpwwwhindawicom Volume 2014
Electrical and Computer Engineering
Journal of
Journal of
Computer Networks and Communications
Hindawi Publishing Corporationhttpwwwhindawicom Volume 2014
Hindawi Publishing Corporation
httpwwwhindawicom Volume 2014
Advances in
Multimedia
International Journal of
Biomedical Imaging
Hindawi Publishing Corporationhttpwwwhindawicom Volume 2014
ArtificialNeural Systems
Advances in
Hindawi Publishing Corporationhttpwwwhindawicom Volume 2014
RoboticsJournal of
Hindawi Publishing Corporationhttpwwwhindawicom Volume 2014
Hindawi Publishing Corporationhttpwwwhindawicom Volume 2014
Computational Intelligence and Neuroscience
Industrial EngineeringJournal of
Hindawi Publishing Corporationhttpwwwhindawicom Volume 2014
Modelling amp Simulation in EngineeringHindawi Publishing Corporation httpwwwhindawicom Volume 2014
The Scientific World JournalHindawi Publishing Corporation httpwwwhindawicom Volume 2014
Hindawi Publishing Corporationhttpwwwhindawicom Volume 2014
Human-ComputerInteraction
Advances in
Computer EngineeringAdvances in
Hindawi Publishing Corporationhttpwwwhindawicom Volume 2014
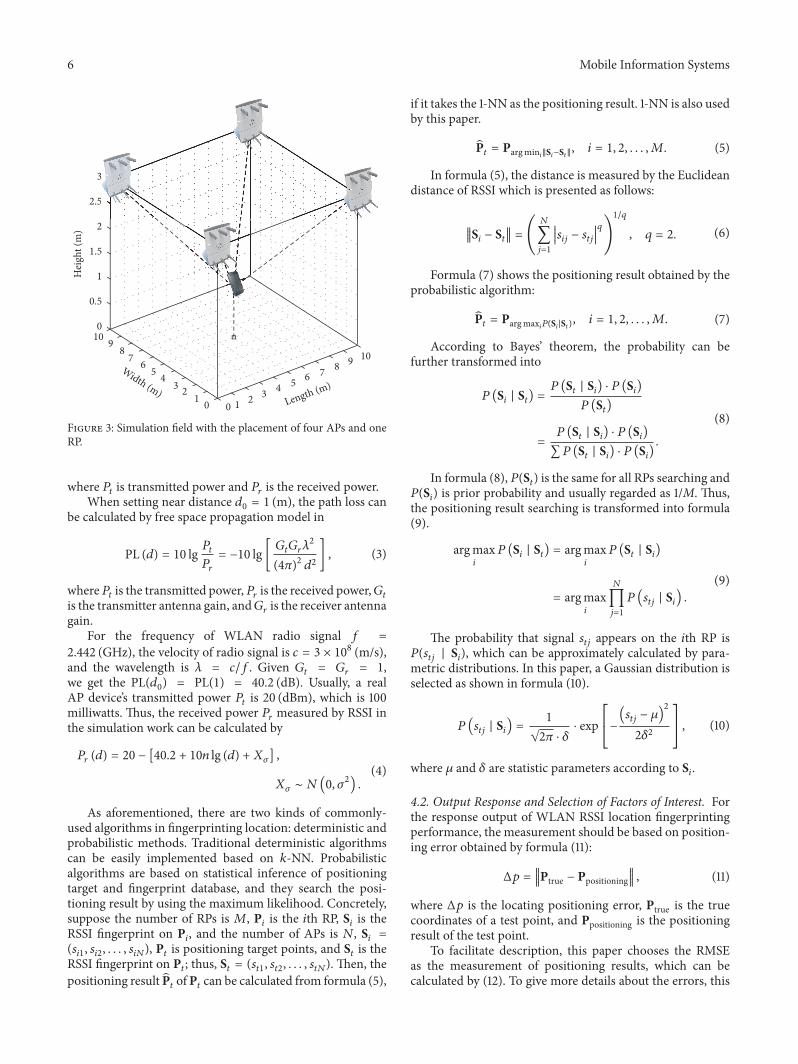
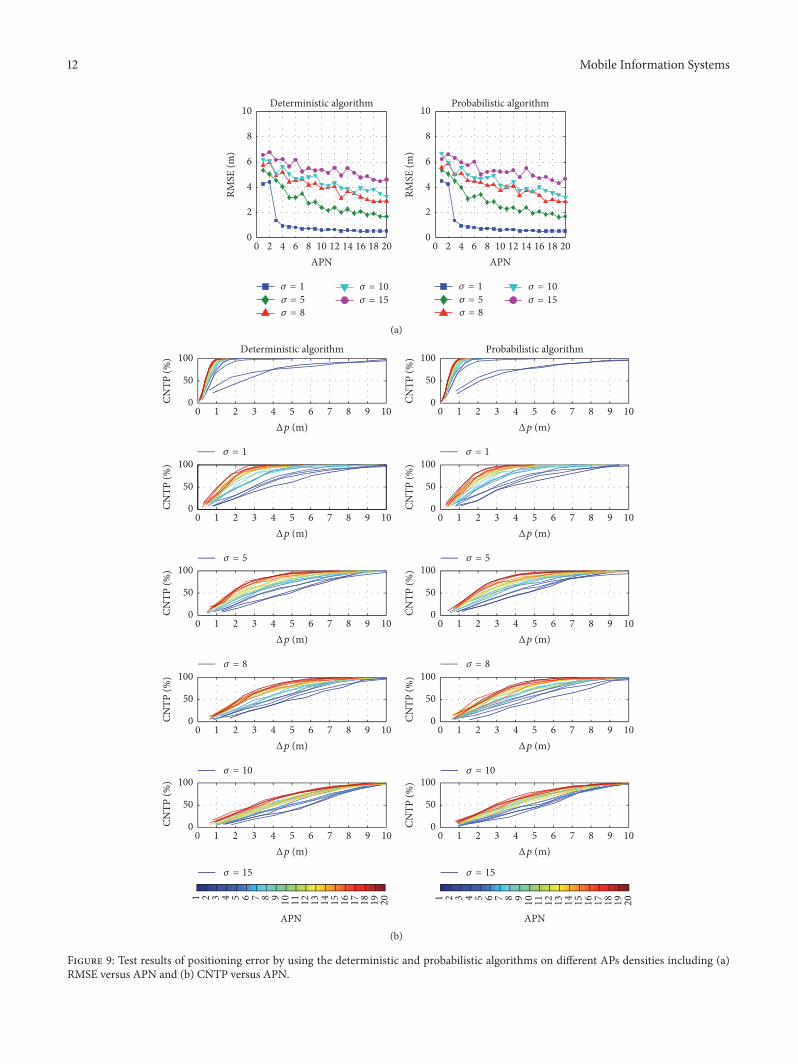
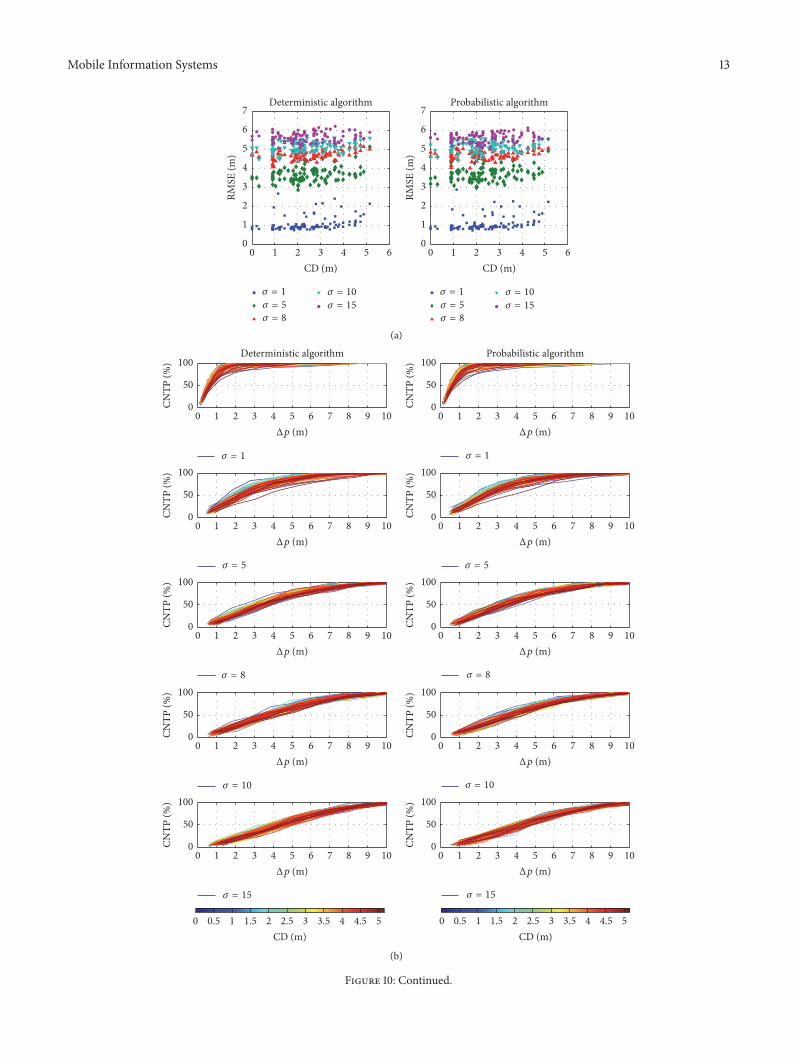
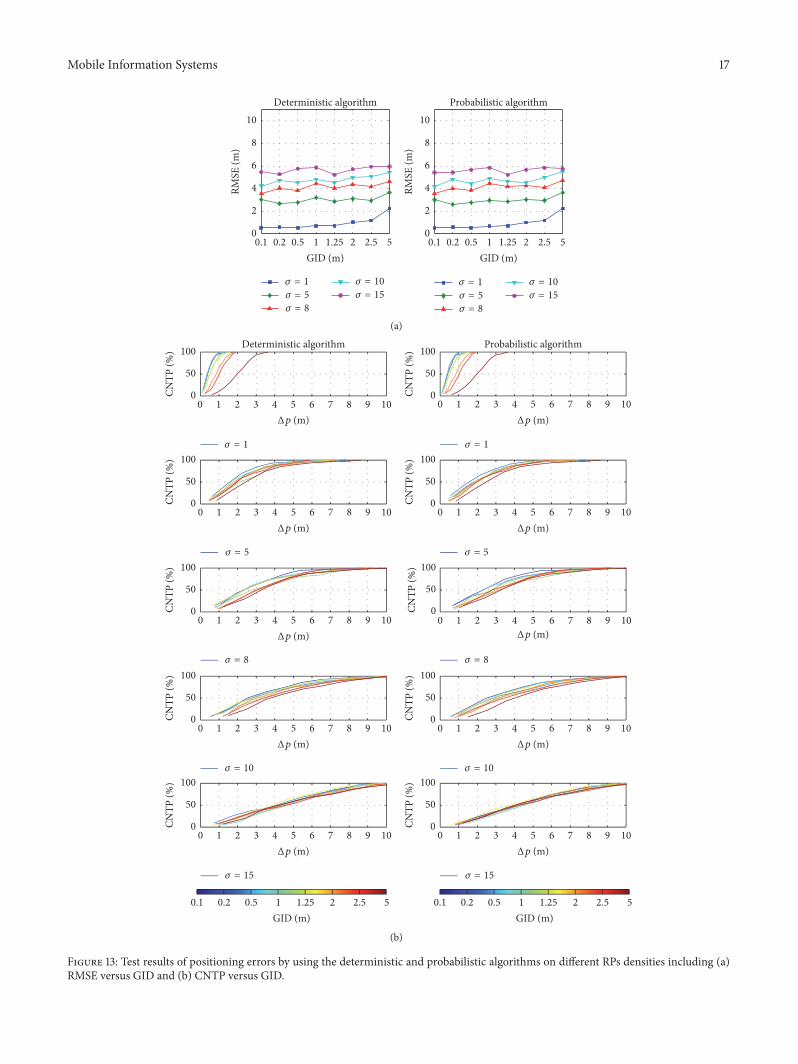