An analysis of heterogenous ensembles at predicting ... - UFPR · Challenges Results are obtained...
18
DENNIS CARNELOSSI FURLANETO MSC IN COMPUTER SCIENCE @ UFPR An analysis of heterogenous ensembles at predicting stock prices of Brazilian power companies
Transcript of An analysis of heterogenous ensembles at predicting ... - UFPR · Challenges Results are obtained...

D E N N I S C A R N E L O S S I F U R L A N E T O
M S C I N C O M P U T E R S C I E N C E @ U F P R
An analysis of heterogenous ensembles at predictingstock prices of Brazilian power companies

Introduction
Prediction of closing prices
One of the most popular problems in the field
The results can be easily visualized
Same ideas can be applied to other time series
Still an open problem
Challenges
Results are obtained using a different set of tools (weka, matlab, python) and evaluated under different metrics (RMSE, MSE, ...)
Some of the results are too good to be true
Completely different results given a different period in time for the time series
Different classifiers obtain different results in different parts of the same time series
There is no public dataset used for tests on the field

Objective of this study
Not to beat or match the state-of-the-art
Would an ensemble of classifiers help to reduce the variation and improve predictive accuracy?
Not obvious – say we have a good and 2 bad models. What happens?
Fusion of models are not widely used
They have been done, but usually for homogenous ensembles

Pipeline
Data Acquisition & preprocessing
Feature Extraction
Normalization
Feature Selection
Train models
Ensemble

Data Acquisition
Data Acquisition & preprocessing
Feature Extraction
Normalization
Feature Selection
Train models
Ensemble


Feature Extraction
Data Acquisition & preprocessing
Exponential Moving Average
Normalization
Feature Selection
Train models
Ensemble
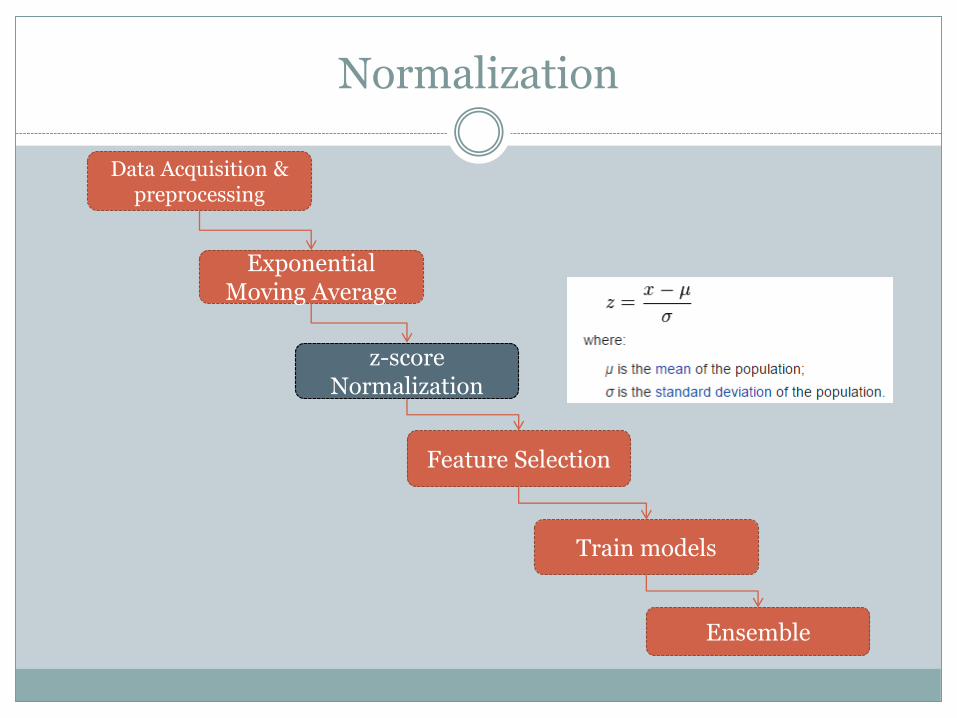
Normalization
Data Acquisition & preprocessing
Exponential Moving Average
z-score Normalization
Feature Selection
Train models
Ensemble
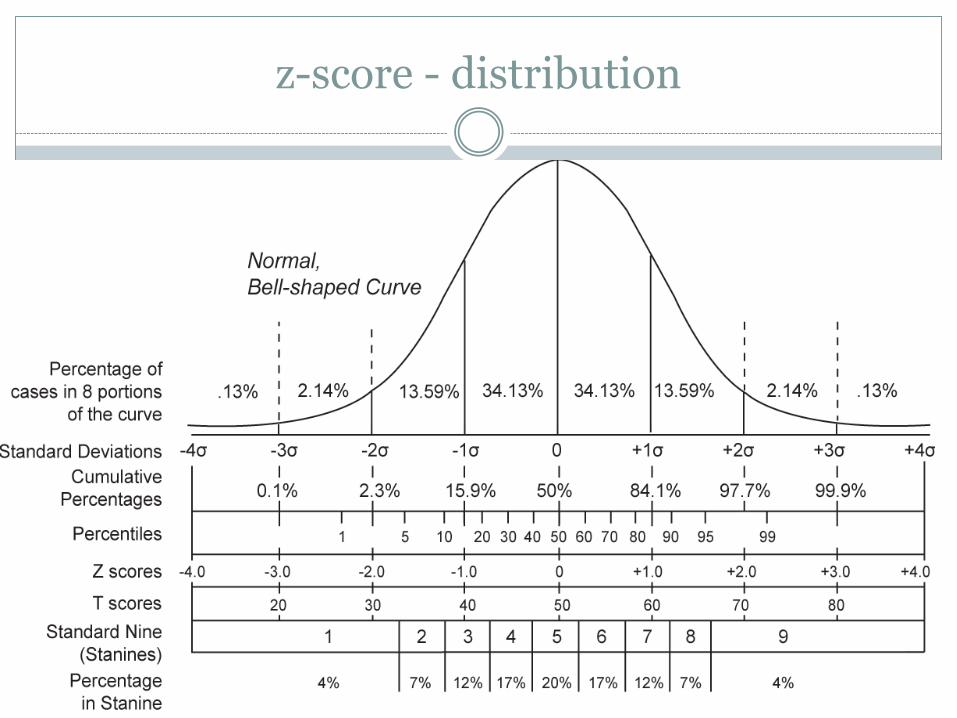
z-score - distribution

Feature Selection
Data Acquisition & preprocessing
Exponential Moving Average
z-score Normalization
Pearson Correlation
Train models
Ensemble
No Correlation
Inversely Correlated
Directly Correlated
-1 0 +1
Chosen Features:• EMA(Stock): 5, 10, 15• EMA(BVSP): 5, 10, 15

Training Models
Data Acquisition & preprocessing
Exponential Moving Average
z-score Normalization
Pearson Correlation
SVM, Ridge and Random Forests
Ensemble
Ridge (Tikhonov Regularization):• Least-squared error – Reg term
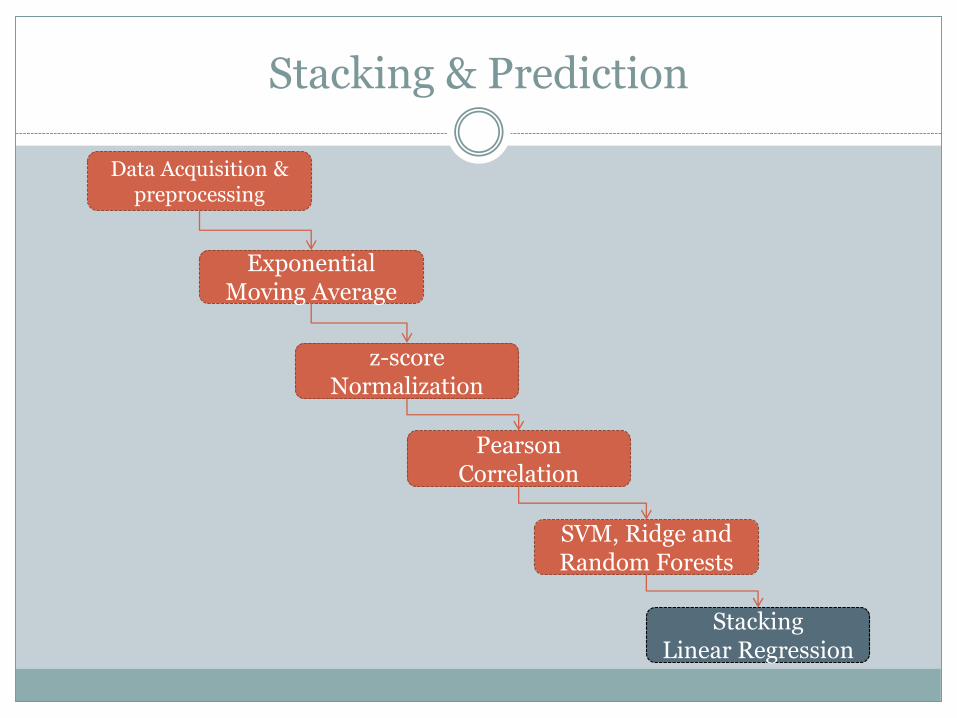
Stacking & Prediction
Data Acquisition & preprocessing
Exponential Moving Average
z-score Normalization
Pearson Correlation
SVM, Ridge and Random Forests
StackingLinear Regression

Dataset
2 stocks – CMIG4, CESP6
BVSP, IEEX and USDBRL
Daily prices between Jan-2008 and Dec-2013
A smal portion of the data points were missing ( ~0.05%)
They were replaced by an interpolated value

How the results were evaluated?
Train/Test routine:
Stored RMSE for each testing iteration
Mean, Std and Median value of RMSEs
% of train/test segments where each model was themost accurate

Results
SVM RidgeRandom
Forest Stacking
CMIG4 16.67% 23.33% 3.33% 55.00%
CESP6 8.33% 16.67% 5.00% 70.00%
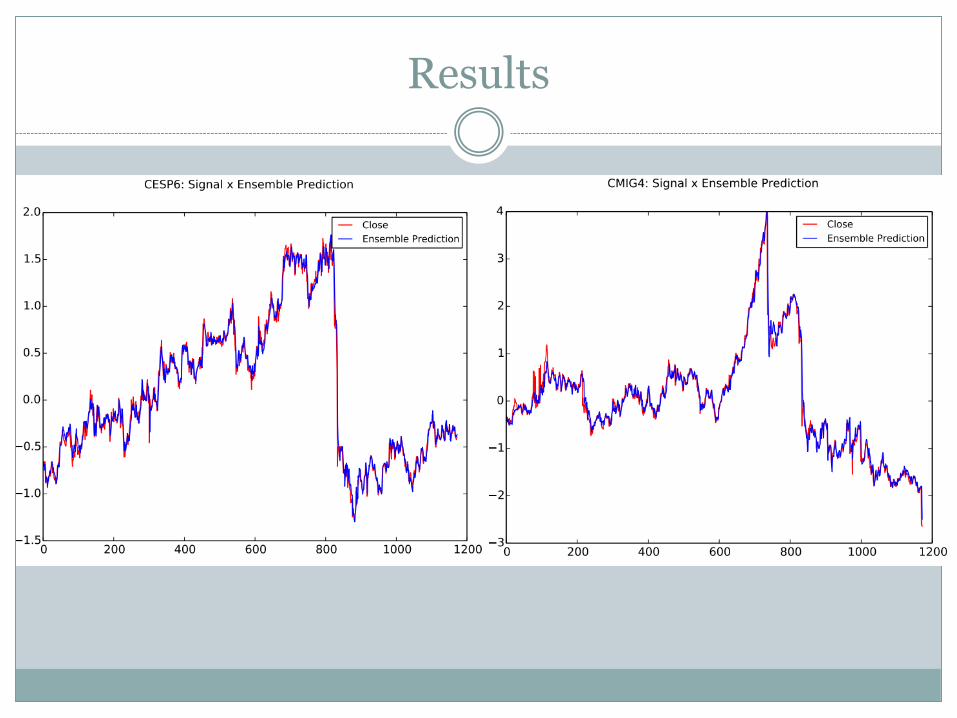
Results