
AN ANALYSIS OF FACTORS CONTRIBUTING AS SELECTION CRITERIA ...docs.trb.org/prp/13-2561.pdf · AN...
17
Saeed and Aaby AN ANALYSIS OF FACTORS CONTRIBUTING AS SELECTION 1 CRITERIA FOR USERS OF EUROPEAN CONTAINER TERMINALS 2 3 Naima Saeed 1 and Bernt Christoffer Aaby 4 Department of Economics, Informatics and Social Science 5 Molde University College- Specialized University in Logistics 6 6402, Molde, Norway 7 Email: [email protected] 8 Phone: +47 71214234 9 Fax: +47 71214100 10 11 Submission Date: 15 th November 2012 12 Word count: 5467 words 13 Tables and figures count: 8*250 = 2000 words 14 Total word count: 7467 words 15 16 17 18 19 20 21 22 23 24 25 1 Corresponding author. TRB 2013 Annual Meeting Paper revised from original submittal.
Transcript of AN ANALYSIS OF FACTORS CONTRIBUTING AS SELECTION CRITERIA ...docs.trb.org/prp/13-2561.pdf · AN...

Saeed and Aaby
1
AN ANALYSIS OF FACTORS CONTRIBUTING AS SELECTION 1
CRITERIA FOR USERS OF EUROPEAN CONTAINER TERMINALS 2
3
Naima Saeed1 and Bernt Christoffer Aaby
4
Department of Economics, Informatics and Social Science 5
Molde University College- Specialized University in Logistics 6
6402, Molde, Norway 7
Email: [email protected] 8
Phone: +47 71214234 9
Fax: +47 71214100 10
11
Submission Date: 15th
November 2012 12
Word count: 5467 words 13
Tables and figures count: 8*250 = 2000 words 14
Total word count: 7467 words 15
16 17
18 19
20
21
22
23
24
25
1 Corresponding author.
TRB 2013 Annual Meeting Paper revised from original submittal.

Saeed and Aaby
2
ABSTRACT 1
This paper examines the selection criteria for container shipping lines when choosing 2 European container terminals. The purpose of the study is to determine the factors that are 3 crucial for shipping lines when choosing European container terminals. Data has been 4 collected via a questionnaire given to shipping lines calling at the Port of Rotterdam, the Port 5 of Antwerp, and the Port of Hamburg, which are the main container hubs in Europe 6 (measured by the number of TEUs handled annually). Descriptive statistics reveal that 7 loading/discharging rate, handling charges, and service quality are the main attributes that 8 influence port selection. The least important selection factors are personal contacts, 9 investments by shipping lines, and value-added activities. The analysis also shows that 10 hinterland connections are more important than value-added activities. This suggests that 11
ports should focus more on developing good hinterland connections than on providing value-12 added activities. Factor analysis of the aggregate data is used to determine whether the 13 attributes could be partitioned into fewer, more meaningful factors. According to the results, 14 12 variables are loaded into two factors, which also seem to contain distinct elements: Factor 15 1 contains “Port attributes” and Factor 2 contains the variables related to “Formal and 16 informal relationships between ports and shipping lines.” This study will be useful for port 17 authorities and terminal operators wishing to improve the efficiency and productivity of their 18 port according to the requirements of their customers (that is, shipping lines). 19
20
Keywords: Container terminal selection; Competition; Factor analysis, Maritime supply 21
chain. 22
23
24
25
26
27
28
29
30
31
32
33
34
35
TRB 2013 Annual Meeting Paper revised from original submittal.

Saeed and Aaby
3
1. INTRODUCTION 1
Nearly 90 percent of the world’s trade volume is handled through ports. Transport 2 sector improvements and expansion have resulted in a larger number of ports through which 3 freight can be efficiently transported. The modernization of the transport sector has led to 4 increased inter-port competition. Nevertheless, the port selection process is a complex and 5 rarely analyzed issue [1]. 6
Components of goods used for modern production processes are often produced as 7 semi-manufactured goods, re-exported in containers, and assembled into final products that 8 may also be exported in a container. Containerized goods are suitable for transshipment, 9 which for ports means more container handling. The growth in semi-manufactured goods and 10 the use of transshipment has helped container throughput to thrive in recent decades. In 1990, 11
world container port throughput volumes were around 85 million TEUs (Twenty Foot 12 Equivalent Units); in the next 20 years they grew six-fold to 531.4 million TEUs [2]. 13
This study focuses on major container ports in Northern Europe acting as 14 transhipment hubs, and examines the selection criteria for container shipping lines when 15 choosing European container terminals. According to our knowledge, this is the first study in 16 which the importance of 'maritime value chain', during the port selection process, is analysed 17 numerically. In the context of maritime value chain, port selection is considered as a part of 18 the whole supply chain. The next section of this paper reviews the literature on the factors 19 that contribute to the selection of any port. The subsequent sections present the case study, 20 methodology, data collection, and results. The final section offers some discussions and 21
conclusions. 22
2. LITERATURE REVIEW 23
This section discusses previous research about ports’ selection criteria, from a user’s 24 perspective. An early study by Bardi [3] found that transit time, reliability, capability, 25 availability, and security were the most important characteristics in the selection of a port. 26 However, two surveys conducted for Distribution Worldwide [4, 5] produced conflicting 27 results. The first survey found that shippers valued service more than cost, while the second 28 found that transport costs and port charges were the most important criteria. 29
Slack [6] explored the criteria that shippers employ in the port selection process. He 30 focused on containerized traffic between the North American Midwest and Western Europe 31
and examined the factors that exporters and freight forwarders considered. Slack’s results 32 indicated that the choice of port appeared to be based more on the price and quality of the 33 service offered by land and ocean carriers than on the attributes of the ports themselves. 34
From semi-structured interviews with industry participants, Hanelt and Smith [7] 35 concluded that each participant valued characteristics differently. The authors argued that 36 certain important factors are beyond the control of a port authority. Although port managers 37 cannot influence the two most important factors (that is, the size of the local market and 38 domestic transportation costs), they can indirectly influence port labor productivity, rail 39
transit times, port access, total transit time, and ocean carrier intermodal networks. They can 40 also directly influence terminal gate capacity, channel and berth depth, indirect port charges, 41 port charges on cargo or carrier, and cargo handling equipment. 42
In a two-part paper, Bird [8, 9] reported on the perception of route competition for 43
seaports in the European Communities Research Project. This project involved 72 interviews 44 with freight forwarders throughout Europe. The second part of the paper presented an 45 analysis of the open-ended tape-recorded responses of the interviewees to six separate sets of 46
propositions. The study found that cost and time are two of the vital topics of concern in a 47
TRB 2013 Annual Meeting Paper revised from original submittal.

Saeed and Aaby
4
freight forwarder’s life. The results indicated that the main reason for port choice is the 1 frequency with which the line uses the terminal. 2
Murphy and Daley’s [10] empirical study of purchasing managers in the United States 3 revealed that shipment information and loss and damage performance are the most important 4 factors in selecting water ports for international shipment, whereas large volume shipments 5 and large and odd-sized freight are the least important factors. When these findings were 6 analyzed by the respondent’s role in transport choice decisions, there was a minimal 7 difference between respondents who were actively involved in the process and those who 8 were less involved. 9
Based on a survey of selected freight forwarders located in one of the centers of port 10 competition in Asia, Tongzon [11] investigated port choice and performance factors. The 11
study found that the factors that have a significant impact on the choice of ports among 12 shippers located in the industrial centers of Malaysia, Singapore, and Thailand are: frequency 13 of ship visits, efficiency, adequacy of port infrastructure, location, competitive port charges, 14 quick response to port users’ needs, and the port’s reputation for cargo damage. Research 15 conducted by Tiwari et al [12] indicated that the shipper’s distance from the port, the number 16 of ship calls at the port, the efficiency of the port infrastructure, and the number of routes 17 offered at the port are all factors that strongly influence the decision to use a port. 18
Nir et al [13] used a revealed preference multinomial logit model to process the 19 analysis of shipper’s choice behavior. The analysis model set up the basic choice model, and 20 also derived the experienced and competitive port choice models. The study results showed 21 that coefficients of travel time and cost are negative and significant. The results also indicated 22
that shippers do not care much about the frequencies and the routes. Ha [14] presented a 23 comparative evaluation of service quality factors at 15 major container ports around the 24 world. He identified important service quality factors and made comparisons among container 25 ports, based on earlier studies and on personal interviews and questionnaires directed to 26 container ship operators and logistics managers. Duncan test analyses suggested that service 27 quality at Northeast Asian ports lags behind that of well-developed major ports elsewhere. 28 According to Malchow and Kanafani [15], the most significant characteristic of a port is its 29 location. They described how the market share predicted for a port can be expected to vary 30 with each commodity type and each carrier, and they also showed how the choice process 31 varies for discretionary cargo. 32
Lirn et al [16] used the analytic hierarchy process (AHP) to reveal and analyze 33 transshipment port selection by global carriers. Forty-seven relevant service attributes were 34
recorded from a literature review. An AHP-designed questionnaire survey was distributed to 35 20 port users and to 20 transshipment service providers (port operators/authorities). The 36 results revealed that global container carriers and port service providers had similar 37
perceptions of the most important service attributes for transshipment port selection. Ng [17] 38 investigated the attractiveness of the major ports in Northern Europe acting as transshipment 39 hubs. Using a Likert-style questionnaire directed at the top 30 shipping lines, the study found 40 that Hamburg and Rotterdam are the most attractive options that act as transshipment hubs 41 within Northern Europe, followed closely by Antwerp and Bremerhaven. Blonigen and 42
Wilson [18] developed a model of port choice and trading volumes and then estimated the 43 impact that ocean transport rates, and the efficiency of U.S. ocean ports and internal transport 44 systems have on port choice and trade volume over a sample of trade flows between over 150 45
different countries and the top U.S. ports between 1991 and 2003. Estimates provided strong 46 evidence for the importance of economic factors in port choice. Distance and transport prices 47
were found to be very significant factors that affect a port’s volume. De Langen [19] dealt 48
with port competition and port selection for cargo to and from Austria and analyzed changes 49 in market share over time of different ports serving Austria. He conducted a survey to analyze 50
TRB 2013 Annual Meeting Paper revised from original submittal.

Saeed and Aaby
5
the port choice decisions of two types of decision makers: shippers and forwarders. De 1 Langen’s results showed that shippers and forwarders have similar views on port selection, 2
but shippers have a less price-elastic demand. 3
Robinson [20] placed the role of seaports within a new paradigm of ports as elements 4 in value-driven chain systems. Magala and Sammons [21] explained the same concept. 5 According to Magala and Sammons [21], the primary concern of a shipper is to move freight 6 from market A to market B, or more specifically, from a point of production to a point of 7 consumption or further processing in the most cost-effective way. In consigning cargo to an 8 end-market, the shipper chooses a logistics pathway that the freight allows. The notion of 9 logistics pathways connotes a sequential set of logistics operations, warehousing, depot 10
operations, port operations, trucking, and freight forwarding that deal with the end-to-end 11 movement of freight. The choice of a port is a by-product of a choice of a logistics pathway in 12 which the total logistics cost is a major supply chain consideration [21]. Garcia-Alonso and 13 Sanchez-Soriano [22] dealt with the analysis of port selection from a hinterland perspective. 14 Their results indicated that the port-province distance remains a relevant variable in the port 15 selection process (even for container traffic), despite all the transport sector improvements. 16 Hence, the concept of hinterland does help explain the evolution of the activity of a port, 17 despite the development of the inter-modal transport and the increase in inter-port 18 competition. 19 TABLE 1: Literature review 20
Author/Year Methodology Factors affecting port selection Bardi (1973) Qualitative analysis Transit time, reliability, capability, availability, security
Foster (1978,1979) Qualitative analysis Service, transport cost, port charges Slack (1985) Qualitative analysis Price & quality of the service offered by land & ocean carriers
Hanelt & Smith (1987)
Qualitative analysis Port labor productivity, rail transit times, port access, total transit time, ocean carrier intermodal networks
Murphy & Daley (1992)
Quantitative (Univariate & Factor analysis)
Shipment information, loss & damage performance
Tongzon (2002) Quantitative (Descrptive
statistics & linear regression)
Frequency of ship visits, efficiency, adequacy of port infrastructure, location, competitive port charges, quick
response to port users’ needs, and the port’s reputation for cargo damage.
Tiwari et al. (2003) Quantitative (Discrete
choice analysis)
The shipper’s distance from the port, the number of ship calls at the port, the efficiency of the port infrastructure, and the
number of routes offered at the port.
Nir et al. (2003) Quantitative (Discrete
choice analysis) Travel time and cost
Ha (2003) Quantitative (Duncan
test analyses) Service quality
Malchow & Kanafani (2004)
Quantitative (Discrete choice analysis)
Port's location
Lirn et al. (2004) Quantitaive: (AHP
analysis)
Handling cost of containers, proximity to main navigation routes, proximity to import/export areas, basic infrastructure
condition and ‘existing feeder network Ng (2006) Quantitative analysis time efficiency, geographical location and service quality
Blonigen and Wilson (2007)
Quantitative (Choice model)
Distance and transport prices
De Langen (2007) Quantitative
(Descriptive statistics) Cost, quality of service, differences per region
Robinson (2002) Qualitative analysis Ports as elements in value-driven chain systems Magala & Sammons
(2008) Qualitative analysis Ports as elements in value-driven chain systems
Garcia-Alonso and Sanchez-Soriano
(2009)
Quantitative (Discrete choice analysis)
Hinterland perspective
Saeed (2009) Quantitative (factor
analysis, Linear regression)
Service quality, loading/discharging rate, and handling charges.
TRB 2013 Annual Meeting Paper revised from original submittal.
Saeed and Aaby
6
Saeed [23] analyzed carriers’ selection criteria for container terminals at two ports in 1 Pakistan. The results of that study indicate that lines selecting a terminal give priority to such 2 attributes as the service quality offered at each terminal, the loading/discharging rate, and 3 handling charges. These lines do not consider whether a terminal is private or under 4 government control; nor do they consider their personal contacts or the duration of their 5 relationship with terminal authorities. Other important findings obtained after estimating the 6 linear model are that the total stay at berth is less for non-geared vessels and for first-7 generation vessels than for others. Large, modern vessels prefer a faster turnaround time, 8 which is why they select terminals that offer a fast handling rate and a shorter stay at berth. 9 Therefore, in order to attract large, modern vessels, terminal operators should consider 10 investing in equipment that will increase the handling speed and reduce the stay of vessels at 11
berth. 12 The present study has used the same methodology as that applied by Saeed [23], 13
except that Saeed’s work was limited to Pakistani ports. Therefore, results obtained from the 14 present study will be helpful for quantitative comparisons between South Asian and European 15 ports, which – combined with the Pakistani case – can have interesting implications for 16 solving specific problems for ports. Moreover, one of the limitations of Saeed’s study is that 17 she did not consider the aspects of maritime supply chain. The present study has included two 18 additional attributes – value-added activities and hinterland connection – that capture the 19 attractiveness of a sea port from the context of maritime supply chain. Table 1 shows that 20 only two previous studies (Saeed [23] and Murphy & Daley [10]) have applied the factor 21 analysis, but their case studies are different. 22
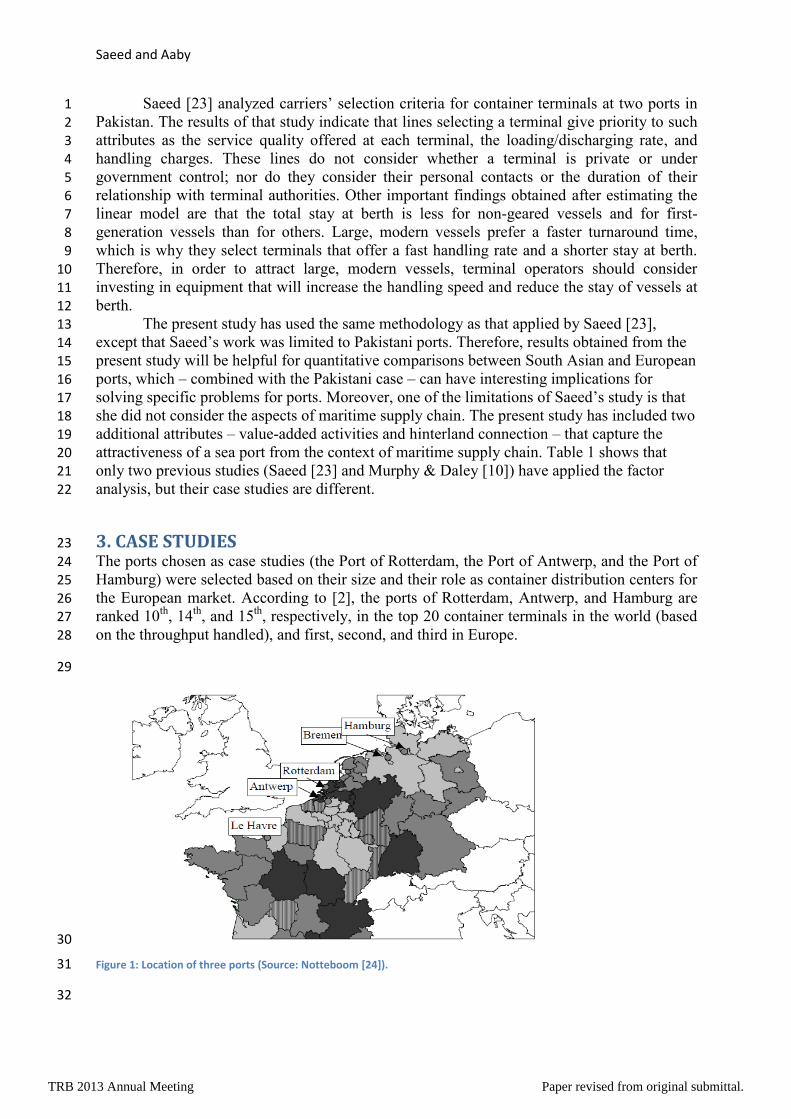
3. CASE STUDIES 23
The ports chosen as case studies (the Port of Rotterdam, the Port of Antwerp, and the Port of 24 Hamburg) were selected based on their size and their role as container distribution centers for 25 the European market. According to [2], the ports of Rotterdam, Antwerp, and Hamburg are 26 ranked 10
th, 14
th, and 15
th, respectively, in the top 20 container terminals in the world (based 27
on the throughput handled), and first, second, and third in Europe. 28
29
30
Figure 1: Location of three ports (Source: Notteboom [24]). 31
32
TRB 2013 Annual Meeting Paper revised from original submittal.

Saeed and Aaby
7
Figure 1 presents the number of TEU handled at the three ports since 2005. The Port 1 of Rotterdam is the leading container port in Europe, measured by the number of TEUs 2
handled at the port per year. 3
4
5
FIGURE 2: Total TEUs handled at three ports (source: Containerisation [25]). 6
7
3.1 Rotterdam 8 The port is located in the city of Rotterdam, South Holland in the Netherlands. In 2011, it was 9 the 10
th largest container port in the world [25]. The port is operated by the Port of Rotterdam 10
(port authority) and has been owned by the municipality of Rotterdam and the Dutch State 11 since 2004, having originally been a municipal body of the municipality of Rotterdam. The 12 port authority aims to enhance the ports position as a logistics hub and a world-class 13 industrial complex. The authority invests in the development of the port, which includes 14 existing and new port areas, public infrastructure, and cargo handling equipment, in order to 15
increase the port’s competitive edge. 16
The port authority leases out port areas on a long-term contract to logistical firms and 17 cargo terminal operators. The port authority main sources of income are through rents and 18
harbor dues and the port authority employs 1,239 people [26]. 19
The port’s location contributes to its status as one of the main distribution centers in 20 Europe. The port serves a hinterland of more than 150 consumers with a combined buying 21 power of US$600 billion. The port serves this market with a multimodal mix of transportation 22
methods, including road, rail, inland shipping, coastal shipping, and pipelines. Its unrestricted 23 location allows it to operate 24 hours a day, seven days a week [27]. Port and industrial 24 complex provides direct employment to 73,529 people, which represents 27 percent of the 25 total employment provided by different sectors in Rotterdam city [28]. The Port of Rotterdam 26 currently has 13 container terminals [25]. 27
The Port of Rotterdam is a landlord port. Under the landlord model, the port authority acts 28
as regulatory body and as landlord, while port operations (especially cargo handling) are 29 carried out by private companies. In the Port of Rotterdam, the large Europe Container 30 Terminal (ECT) has been acquired by Hutchison Port Holdings (HPH), which was obliged by 31 the European Commission to sell ECT a 33 percent share in the Maersk Delta Terminal. Also 32
at Maasvlakte (Rotterdam), P&O Nedlloyd constructed its Euromax Terminal. Thus, the Port 33
TRB 2013 Annual Meeting Paper revised from original submittal.

Saeed and Aaby
8
of Rotterdam currently accommodates a combination of dedicated and common user 1 terminals. Developments are similar in Antwerp and Hamburg [29]. 2
In 2008, the port started building the new port site. The new area will make 1000 hectares 3 available for deep-sea operations and will be able to moor ULCC (Ultra Large Container 4 Carriers) vessels with a 24-hour operating service. These vessels, such as the Emma Maersk, 5 are able to carry over 10,000 TEUs. According to the port authorities, the port will reach its 6
capacity in 2013, and an extension of the port is essential for an increase in capacity [30]. 7
3.2 Antwerp 8
The Port of Antwerp is the second largest container port in Europe and is located in the city 9
of Antwerp on the Belgian coast. The port area is the largest in the world, at over 13,000 10 hectares [31]. The port offers direct transportation to over 500 destinations, 300 of which are 11 called every week [32]. The port offers transportation to the hinterland by road, rail, barges 12 and pipeline. The port is connected to the Rhine and Seine rivers through connections from 13 the River Scheldt. The river connections from Antwerp offer inland sea transportation to 14 several countries outside Belgium, including the Netherlands, Germany, Austria, Switzerland, 15 and France. The port has a large rail network and all terminals are connected. Each week, the 16 rail network distributes cargo to 70 destinations in 19 countries. The port operates 24 hours a 17
day, seven days a week [33]. 18
The Antwerp Port Authority is an independent, municipally-owned company and acts 19
as a landlord. It aims to develop the port infrastructure and maintain the port’s competitive 20
advantages [34]. The Port of Antwerp has eight container terminals [25]. 21
3.3 Hamburg 22
The Port of Hamburg is the third-largest container port in terms of TEUs handled in 2011. 23 The Port of Hamburg, or Hafen Hamburg as it is called in German, is known as Germany’s 24 “gateway to the world” and lies 110 kilometers from the mouth of the River Elbe, where the 25 river runs into the North Sea. The branching of the Elbe has given Hamburg a natural 26 advantage and the inland waterways have made Hamburg an important logistical hub. The 27 location between the North Sea and the Baltic Sea, including the Kiel Canal, connects the port 28
to Scandinavia and the countries surrounding the Baltic Sea [35]. 29
In 2010, more than 100 shipping lines operated from Hamburg and went to around 30
700 different ports. The port has the highest frequency of departures for feeder services in 31
Europe and in 2010 it offered an average of more than 150 weekly feeder departures [36]. 32
The hinterland transportation of containers can be shipped out with several different 33 means of transportation; port users can choose between rail, road, and inland waterways. The 34 port has 375 kilometers of railroad tracks that ensure the efficiency of the transshipment of 35 cargo by rail. As with the Ports of Rotterdam and Antwerp, the Port of Hamburg’s railway 36
network is connected with most of Europe. Port users can choose from more than 90 rail 37 companies that provide connections to the hinterland. The transportation of containers by 38 trucks is the most important means of transportation for the local hinterland at distances less 39
than 150 kilometers. The large network of inland waterways with high capacity provides the 40 foundation for cheap and reliable transportation on barges [37, 38, 39]. The Port of Hamburg 41
has seven container terminals [25]. 42
TRB 2013 Annual Meeting Paper revised from original submittal.

Saeed and Aaby
9
4. PORT SELECTION CRITERIA 1
Ports compete for market share and must offer a service that meets their customers’ 2 requirements. The attributes or characteristics of a port influence their attractiveness. Earlier 3 research on port selection criteria has found many attributes that are influential when shippers 4
and shipping companies choose ports of call. 5
The following attributes are used to examine the selection criteria for European Container 6
Terminals: 7
Service quality 8
Loading/discharging rate 9
Handling charges 10
Number of TEUs handled at the port 11
Number of vessels calling at the port 12
Level of congestion at the port 13
Location 14
Efficiency of the hinterland connections 15
Personal contacts 16
Logistical services provided at the port 17
Storage facilities 18
Value-added services provided at the port 19
Navigational availability (night navigation) 20
Switching cost from one port to another 21
Asset specification (Investment made by port and investment made by shipping line) 22
Structure of port authorities and ownership 23
5. METHODOLOGY AND DATA COLLECTION 24
5.1 Data Collection 25 The main source of data collection in this study is questionnaire distribution. The 26 questionnaire was distributed to container shipping lines calling at three European ports. 27
Seventy-two shipping lines were selected from Containerisation International [25] and invited 28
to take part in the study. The companies were contacted ahead of time to ensure that the 29
survey was sent to someone in management who had strong knowledge of strategy and 30 operations. This criterion was intended to ensure accurate and honest answers by the 31
respondents. 32
The questionnaire was distributed in two steps. The first step was to distribute it to a 33 randomly chosen sample of the population of container shipping lines calling at the case 34 ports. The pilot study was carried out to test the questionnaire and the response rate. The pilot 35
study sample consisted of 15 out of 72 shipping lines and responses were received from eight 36 lines (53 percent response rate). The result of the pilot study motivated further distribution of 37
the survey to the rest of the container shipping lines. 38
The responses to the rest of the survey are as follows: 39
27 qualified replies 40
17 respondents could not be contacted 41
11 were unwilling to answer 42
TRB 2013 Annual Meeting Paper revised from original submittal.

Saeed and Aaby
10
17 failed to reply in time 1 2
The response rate for the study is 37 percent. 3
5.2 Construction of Questionnaire 4 The questionnaire consists of two parts. In Part A, the respondents provided scores that 5 reflected the importance of 17 factors affecting terminal selection. The scale ranged from 1 6
(not important) to 5 (very important). 7
In Part B of the questionnaire, the respondents gave scores that reflected the quality of 8 different attributes affecting the attractiveness of all three ports. This means that each 9 respondent provided three observations on a scale ranging from 1 (strongly disagree) to 5 10
(strongly agree). 11
5.3 Results and Analysis 12
5.3.1 Important Factors in Container Terminal Selection 13 In Part A of the questionnaire, the respondents were asked to rate the importance of different 14 attributes of a port. The respondents could rate the different attributes from not important 15
(one) to very important (five). 16
TABLE 2: Descriptive statistics 17
Min Max Mean Std. Deviation
Loading/discharging rate 1 5 4.62 0.852
Handling charges 1 5 4.62 0.852
Service quality 2 5 4.27 0.874
Navigational availability 2 5 4.15 0.949
Level of Congestion 1 5 4.12 1.071
Efficiency of hinterland transport 2 5 4.04 1.091
Location 2 5 4.00 0.784
Switching cost 2 5 3.69 0.884
Investment made by port 1 5 3.67 0.920
Logistical services 1 5 3.50 1.030
Storage facilities 1 5 3.48 1.051
No of TEUs 1 5 3.48 1.159
Value-added services 1 5 3.30 0.953
investments made by shipping line 2 5 3.27 0.874
Personal contacts 1 5 3.19 0.981
No of ships 1 5 2.96 1.060
Public or private port 1 4 2.70 0.912
TRB 2013 Annual Meeting Paper revised from original submittal.

Saeed and Aaby
11
The descriptive statistics, presented in Table 1, indicate that loading/discharging rate 1 and handling charges are the two main selection criteria that influence a port’s attractiveness. 2 These two attributes have a mean of 4.62 and a standard deviation of 0.852 and, according to 3
the scale, are considered to be very important. 4
The next important selection criteria, according to respondents, are service quality, 5 night navigational availability, level of congestion, efficiency of hinterland transport, and 6 location. The least important selection criteria are public/private port, number of vessels 7 calling at the port, personal contacts, investments made by shipping line, and value-added 8
activities. 9
5.3.2 Factors contributing to the quality of container terminals 10 Factor analysis: In the second section of the questionnaire (Part B), respondents gave scores 11
that reflect the quality of different attributes in affecting the attractiveness of the European 12
container terminals. The scale ranged from 1 (strongly disagree) to 5 (strongly agree). Factor 13
analysis of the aggregate data is used to determine whether these attributes could be 14
partitioned into a smaller number of more meaningful factors. Essentially, factor analysis is a 15
tool for reducing data and removing duplication from a set of correlated variables. After 16
performing factor analysis, we obtained correlated variables with a smaller set of derived 17
variables. The factors obtained are relatively independent of each other. 18
The collected data is first checked for its suitability for factor analysis. This is done by 19
performing the Keiser-Meyer-Oklin (KMO) test and Bartlett’s Test of Sphericity (see Table 2 20 for results). The KMO must have a value above the minimum value of 0.6. In this study, the 21 test showed a value of 0.742. Bartlett’s Test of Sphericity [40] also reached statistical 22 significance. The results of these two tests show that the collected data can be used for factor 23
analysis. 24
The next step is factor extraction, and the Principal Components Analysis (PCA) 25 shows that four components have an eigenvalue higher than one. The PCA is conducted to 26 find the smallest number of factors that can be used to best represent the interrelation among 27
the set of variables [41]. 28
In order to find the right number of components, we also applied Catell’s scree test, 29
which plots all the eigenvalues found in the PCA test into a scree plot. Analysis of the scree 30 plot (see Figure 2) involves looking for a change (or elbow) in the shape of the plot. Only 31 components above this point are retained. Figure 2 shows that there is quite a clear break 32
between the first and second components. Using Catell’s [42] scree test, it was decided to 33
retain two components for further investigation. 34
Having determined the number of factors, the next step is to interpret the factors. To assist in 35
this process, the factors are ‘rotated’. This involves use of the Varimax orthogonal technique. 36
The results of the Varimax rotation are presented in Table 3 (Component Matrix) and Table 4 37
(Rotated Component Matrix). 38
39
TRB 2013 Annual Meeting Paper revised from original submittal.

Saeed and Aaby
12
1
FIGURE 3: Scree plot 2
3
The Component matrix (Table 3) shows the unrotated loadings of each of the items on the 4
two components. Table 3 shows that most of the items load quite strongly (above 0.4) on the 5
two components. This suggests that a two-factor solution is appropriate. 6
7
TABLE 3: Component matrix 8
Component
1 2
Equipment availability 0.785
Vessel’s stay 0.777
Cargo loss & damage 0.765
Container search 0.741
Storage facilities 0.738
Value-added services 0.728
Hinterland connections 0.703
Asset specification 0.693
Handling rate 0.675
Large cargo handling 0.486
Switching cost 0.846
Personal contacts -0.465
9
TRB 2013 Annual Meeting Paper revised from original submittal.

Saeed and Aaby
13
TABLE 4: Rotated component matrix 1
Component
1 2
Equipment availability 0.778
Vessel’s stay 0.771
Cargo loss & damage 0.767
Container search 0.746
Storage facilities 0.738
Value-added services 0.729
Hinterland connections 0.709
Asset specification 0.689
Handling rate 0.673
Large cargo handling 0.493
Switching cost 0.849
Personal contacts -0.465
2
We then re-ran the PCA, specifying the two components to be retained. We also 3 specified the VARIMAX rotation strategy, which is a form of orthogonal rotation. The results 4 are presented in Table 4, which also shows which items/variables load on which components, 5 after rotation. 6
According to the results obtained from the rotated component matrix (see Table 4), 12 7
variables are loaded into two components. 8
The two components also seem to contain distinct elements: The first component contains 9
“Port’ attributes” and the second contains factors related to “Formal and informal 10
relationship between port and shipping line.” 11
Finally, descriptive statistic is again performed on the individual data for each port, 12 collected from Part B of THE questionnaire. The results are presented in Table 6. The results 13
show that attributes affecting the attractiveness of three ports are different for each port. 14
15
16
17
18
19
20
TRB 2013 Annual Meeting Paper revised from original submittal.

Saeed and Aaby
14
TABLE 5: Descriptive statistics for each port 1
Rotterdam Antwerp Hamburg
Mean Values
Handling rate
3.68 3.75 3.33
Vessel’s stay 3.36 3.31 3.48
Container search 3.68 3.44 3.86
Cargo loss & damage 3.73 3.56 3.81
Equipment availability 3.62 3.53 3.45
Storage fascilities 3.52 3.31 3.43
Large cargo handling 4.10 3.44 3.90
Switching cost 2.67 2.93 2.80
Asset specification 3.18 3.00 3.10
Line’s investment 2.59 2.31 2.35
Personal contacts 2.82 2.75 2.90
Terminal’s location 3.86 3.50 3.55
Hinterland connections 4.05 3.25 3.76
Value-added services 3.52 3.25 3.43
2
1. DISCUSSION AND CONCLUSIONS 3
Several recent studies have addressed the issue of maritime value chain. In the context of 4 maritime value chain, port selection is considered as a part of the whole supply chain. The 5 main focus of the researchers, whilst focusing on maritime value chain, is that users selecting 6 a port not only take “port-specific factors” into account, but also consider factors related to 7 the maritime supply chain. These include value-added services offered at ports, logistic 8
activities, and hinterland connection. 9
However, the results of the present study reveal that loading/discharging rate, handling 10 charges, and service quality are the main attributes that influence port selection. According to 11 our research, shipping lines calling at the three North European container ports still give more 12
weighting to “port-specific attributes.” The study included two factors – value-added 13 activities and good hinterland connection – to capture the importance of maritime value 14 chain. The results show that the shipping lines do not consider value-added activities to be as 15
important as hinterland connections when considering ports as part of a maritime supply 16 chain. This finding also reflects the high inland congestion in the Le Havre-Hamburg range. 17 According to [43], when faced with the dramatic container traffic growth of the last two 18 decades, the dense and intricate network of rivers, canals, railways, and highways that 19 developed post-World War II began to choke. Antwerp, Rotterdam, and Hamburg have 20
expanded, or will expand their port capacities, in response to the port congestion problem 21 [44]. However, the findings of this analysis suggest that there is still a need to improve the 22
hinterland connections. 23
An interesting implication of this study is that results obtained from this analysis are 24 consistent with those of previous study [see 23] by the same method. According to that study, 25 the most important selection criteria for shipping lines calling at the four container terminals 26 in Pakistan are the service quality offered at each terminal, the loading/discharging rate, and 27
TRB 2013 Annual Meeting Paper revised from original submittal.

Saeed and Aaby
15
handling charges. Therefore, both of two studies show that shipping lines, whether they are 1 calling at South Asian ports or European ports, give preferences to the same three attributes. 2 Consequently, a port authority should focus on improving service quality and 3 loading/discharging rate at a port in order to gain a competitive advantage. According to the 4 present study, the least important criteria for shipping lines are whether the port is public or 5 private, the number of vessels calling at the port, and personal contacts. This result is 6 consistent with those of the previous study [23], which revealed that the lines calling at 7 Pakistani ports do not consider whether a terminal is private or government control. Similarly, 8 they do not consider their personal contacts or the duration of their relationship with terminal 9 authorities when selecting terminals. This study has only considered large ports in Northern 10 Europe for its analysis. Future research will select smaller ports for analysis, such as ports in 11
Norway. Results will also be compared to investigate the difference, if any, in the opinion of 12
users while selecting large or smaller ports. 13
REFERENCES 14
1. Garcia-Alonso, L. and Sanchez-Soriano, J. Port selection from a hinterland 15 perspective. Maritime Economics & Logistics, No.11(3), 260-269, 2009. 16
2. UNCTAD (United Nations Conference on Trade and Development). Review of 17 Maritime Transport. UNCTAD/RMT/2011. Geneva, 2011. 18
3. Bardi, E.J. Carrier selection from one mode. Transportation Journal, No.13 (1), 23-19 29, 1973. 20
4. Foster, T. Ports: what shippers do look for. Chilton’s Distribution Worldwide, 21 No.77(1), 44-48, 1978. 22
5. Foster, T. What’s important in a port. Chilton’s Distribution Worldwide, No.78 (1),32-23 36, 1979. 24
6. Slack, B. Containerization, inter-port competition and port selection. Maritime Policy 25 and Management, No.12(4), 293-30., 1985. 26
7. Hanelt, R.L. and Smith, D.S. The dynamics of west coast container port 27 competition. Journal of the Transportation Research Forum, No. 28 (1), 82-91, 1987. 28
8. Bird, J. Freight Forwarders Speak: The Perception of Route Competition via Seaports 29 in the European Communities Research Project (Part 1). Maritime Policy and 30 Management, No.15(1), 35-55, 1988a. 31
9. Bird, J. Freight Forwarders Speak: The Perception of Route Competition via Seaports 32
in the European Communities Research Project (Part 11). Maritime Policy and 33 Management, No.15(2), 153-172, 1988b. 34
10. Murphy, P.R. and Daley, J.M. A Comparative Analysis of Port Selection Factors. 35 Transportation Journal, No. 34(1), 15-21, 1992. 36
11. Tongzon, J. Port Choice Determinants in a Competitive Environment. Proceedings of 37
the International Association of Maritime Economists (IAME) Conference, Panama, 38 12-15 November, 2002. 39
12. Tiwari, P., Itoh, H. and Doi, M. Containerized Cargo Shipper’s Behavior in China: A 40 Discrete Choice Analysis. Journal of Transportation and Statistics, No. 6(1), 71-86, 41 2003. 42
13. Nir, S.A., Lin, K. and Liang. Port choice behaviour—from the perspective of the 43
shipper. Maritime Policy and Management, No.30, 165-173, 2003. 44
14. Ha, M-S. A comparison of service quality at major container ports: implications for 45 Korean ports. Journal of Transport Geography, No.11(2), 131-137, 2003. 46
15. Malchow, B.M. and Kanafani, A. A disaggregate analysis of port selection. 47 Transportation Research, No. 40, 317-337, 2004. 48
TRB 2013 Annual Meeting Paper revised from original submittal.

Saeed and Aaby
16
16. Lirn, TC., Thanopoulou, H.A., Beynon, M.J. and Beresford, A.K.C. An Application 1 of AHP on Transhipment Port Selection: A Global Perspective. Maritime Economics 2 and Logistics, No. 6(1), 70-91, 2004. 3
17. Ng, K.Y. Assessing the Attractiveness of Ports in the North European Container 4 Transhipment Market: An Agenda for Future Research in Port Competition. Maritime 5 Economics and Logistics, No. 8(3), 234-250, 2006. 6
18. Blonigen, B.A. and Wilson, W.W. International trade, Transportation Networks and 7 Port Choice. http://www.aeaweb.org/annual_mtg_papers/2007/0105_1430_2103.pdf. 8 Accessed Dec. 15, 2007. 9
19. De Langen, W.P. Port competition and selection in contestable hinterlands: the case of 10 Austria. European Journal of Transport and Infrastructure Research, 7(1), 1-14, 11
2007. 12 20. Robinson, R. Ports as elements in value-driven chain systems: The new paradigm. 13
Maritime Policy and Management, No. 29, 241-255, 2002. 14 21. Magala, M. and Sammons, A. A New Approach to Port Choice Modelling. Maritime 15
Economics & Logistics, No.10, 9-34, 2008. 16 22. Garcia-Alonso, L. and Sanchez-Soriano, J. Port selection from a hinterland 17
perspective. Maritime Economics & Logistics, 11(3), 260-269. 2009. 18 23. Saeed, N. An Analysis of Carrier’s Selection Criteria when Choosing Container 19
Terminals in Pakistan. Maritime Economics & Logistics, No. 11(3), 270–288, 2009. 20 24. Notteboom, T. Port regionalization in Antwerp. In: idem (ed.), Ports are more than 21
piers. 307-328. Liber Amicorum Willy Winkelmans, Antwerp: De Lloyd. 2006. 22
25. Containerisation International. Containerisation International Yearbook 2012. Informa 23 Maritime and Transport, London, 2012. 24
26. http://www.portofrotterdam.com/en/Port-authority/our-company/Pages/default.aspx. 25 Accessed Feb. 13, 2012. 26
27. http://www.portofrotterdam.com/en/Port/port-in-general/Pages/hinterland-27 connections.aspx. Accessed Feb. 13, 2012. 28
28. http://www.rotterdam.nl/Stadsontwikkeling/Document/Economie%20en%20Arbeids29 markt/FactsandFigures%20Rotterdam%20Engels%202012.pdf Accessed Nov. 13, 30 2012. 31
29. http://www.ppiaf.org/sites/ppiaf.org/files/documents/toolkits/Portoolkit/Toolkit/module3/32 port_functions.html Accessed Nov. 9, 2012. 33
30. http://www.portofrotterdam.com/en/Port/port-in-general/Pages/hinterland-34 connections.aspx. Accessed Feb. 13, 2012. 35
31. http://www.portofantwerp.com/en/port-area. Accessed Feb. 13, 2012. 36 32. http://www.portofantwerp.com/en/antwerps-success. Accessed Feb. 13, 2012. 37
33. http://www.portofantwerp.com/en/transport-and-port. Accessed Feb. 13, 2012. 38 34. http://www.portofantwerp.com/en/about-antwerp-port-authority. Accessed Feb. 13, 39
2012. 40 35. http://www.portofhamburg.com/en/list/maritime-hamburg. Accessed Feb. 13, 2012. 41 36. http://www.portofhamburg.com/en/list/Feederverkehre. Accessed Feb. 13, 2012. 42
37. http://www.portofhamburg.com/en/list/Bahnverkehre. Accessed Feb. 13, 2012. 43 38. http://www.portofhamburg.com/en/list/LKW-Verkehre. Accessed Feb. 13, 2012. 44 39. http://www.portofhamburg.com/en/list/Binnenschifffahrt. Accessed Feb. 13, 2012. 45
40. Bartlett, M.S. A note on the multiplying factors for various chi square approximations. 46 Journal of the Royal Statistical Society, No.16, 296-298, 1954. 47
41. Pallant, J. SPSS survival Manual: A step by step guide to data analysis using SPSS for 48
windows. Open University Press, Maidenhead, UK, 2004. 49
TRB 2013 Annual Meeting Paper revised from original submittal.

Saeed and Aaby
17
42. Catell, R.B. The scree test for number of factors. Multivariate Behavioral Research, 1 No.1(2), 245-276, 1966. 2
43. International Transport Forum (ITF) Round Tables, Port Competition and Hinterland 3 Connections, 19
th June 2009, DOI: 10.1787/2074336x . 4
44. Quinn, J.P. European Ports Tackle Congestion. Logistics Management, 44(11), 67–73, 5 2002. 6
7
8
9
10
11
12
13
TRB 2013 Annual Meeting Paper revised from original submittal.


