The Effect of Sensory-Based Interventions ... - prep.asha.org
AN ANALYSIS OF BUSINESS INTERVENTIONS AND THEIR EFFECT ON THE PERCEIVED SUCCESS OF SOUTH AFRICAN
SMALL AND MEDIUM ENTERPRISES
By
EDMUND JOHN FERREIRA
Submitted in accordance with the requirements for the degree of
DOCTOR OF COMMERCE
in the subject
BUSINESS MANAGEMENT
at the
UNIVERSITY OF SOUTH AFRICA
PROMOTERS: PROFESSOR C. NIEUWENHUIZEN
PROFESSOR J.W. STRYDOM (CO-PROMOTOR)
NOVEMBER 2007

ACKNOWLEDGEMENTS
I would like to take this opportunity to thank the following individuals and
institutions:
• My wife, Saretha and my daughter, Mieke, who have always supported my
efforts.
• My mom, Estelle, for motivating me to study since I can remember. I hope
it was a pleasant surprise!
• Professors Cecile Nieuwenhuizen and Johan Strydom, my promoters for
their invaluable guidance, advice, support and continuous encouragement
throughout the study.
• The University of South Africa (Unisa).
• Professor Deon Tustin, Head of the Bureau for Market Research, who
assisted me with the questionnaire and statistical matters.
• Advocate Hein van der Walt of Cofesa who provided the database to use a
population for the study.
• Maria, Elna and Richard from Ask Africa, who not only collected all the
data but also rendered great aftersales service.
• All the respondents who participated in the study for their time and
valuable contribution.
• Moya Joubert, for her professional and critical editing of the manuscript.

Student number: 0572-820-7
I declare that THE EFFECT OF BUSINESS INTERVENTIONS ON THE PERFORMANCE OF SOUTH AFRICAN SMALL AND MEDIUM ENTERPRISES is my own work and that all sources that I have used or quoted have been indicated and acknowledged by means of complete references.
……………………….….…………………
Edmund John Ferreira 27/11/2007

SUMMARY
A prestudy by the author of the assistance available to small business owners
in South Africa revealed that although much assistance is available, many
small businesses still fail. The question that arose was whether small
business owners are receiving the proper assistance in respect of the right
functional areas of the business, for the appropriate duration, at the right
stage of the business life cycle and by the right people. Taking all these
issues into account, the main purpose of this study was to determine what
types of business interventions have the greatest impact on the success of
entrepreneurs and small and medium enterprise owners.
The literature study includes the history of small business development in
South Africa and the interventions that have taken place in this and other
countries. It also provides a definition of a successful small business and the
generic business needs of small business owners.
The sample used in this study was drawn from the members of the
Confederation of Employers of South Africa (Cofesa). The research findings
of this study are reliable for the SME owners who are members of Cofesa.
The Cofesa group is not representative with regards to demographics,
location, economic sectors or qualifications of South African SMEs. The
following are some of the findings of the study of successful small business
owners:
• They generally make use of assistance in the areas of finance, marketing
and human resources.
• Most of them make use of assistance on a continuous basis during all the
stages of the business life cycle, suggesting the way forward for aspirant
business owners who should start making use of assistance even before
starting their businesses.
• Consultants or business specialists are mainly used for assistance.

• More than two-thirds of the business owners thought that their businesses
were more successful after they had received assistance.
• The assistance was neither the cause of failure nor was it the main cause
of their success.
Assistance is a contributing factor to success but not the main reason for it.
The success of a SME will depend mainly on other factors such as type of
product, product quality and marketing. Assistance, however, proves vital and
should first be provided for the areas as identified by the respondents in this
study (mainly finance, marketing and human resources).
Key terms:
Business interventions; Success; SMEs; Assistance; Small business owners;
Types of business interventions; Cofesa; Areas of assistance; Consultants or
business specialists; Failure of SMEs.

i
TABLE OF CONTENTS
PageLIST OF APPENDICES………………………………………………………………
LIST OF TABLES IN TEXT……………………………………………………….....
LIST OF FIGURES IN TEXT………………………………………………………… CHAPTER 1: INTRODUCTION, AIM, METHOD AND LAYOUT OF STUDY
1.1 INTRODUCTION………………………………………………………….....
1.2 DEFINITION OF CONCEPTS……………………………………………...
1.3 RATIONALE FOR THE STUDY……………………………………….......
1.4 PROBLEM STATEMENT…………………………………………………...
1.5 OBJECTIVES OF THE STUDY…………………………………………….
1.5.1 Primary objective…………………………………………………………….
1.5.2 Secondary objectives…………………………….……………………….....
1.6 DEMARCATION OF THE STUDY…………………………………………
1.7 LIMITATIONS OF THE STUDY…………………………………………….
1.8. RESEARCH DESIGN AND METHODOLOGY…………………………...
1.8.1 The literature study…………………………………………………….........
xi
xii
xviii
1
1
4
8
9
10
10
10
10
12
13
13

ii
1.8.2 The empirical study………………………………………………………….
1.8.3 Data collection by means of a questionnaire……………………………..
1.8.4 Data analysis and interpretation……………………………………………
1.8.5 Analysis objectives…………………………………………………………..
1.9 CHAPTER LAYOUT…………….…………………………………………..
CHAPTER 2: THE HISTORY AND DEVELOPMENT OF SMEs IN SOUTH AFRICA 2.1 INTRODUCTION…………………..………………………………………..
2.2 HISTORICAL BACKGROUND……..………………………………………
2.3 ECONOMIC BACKGROUND………..……………………………………..
2.4 THE IMPORTANCE OF SMEs………..…………………………………...
2.4.1 The distribution of South African private sector enterprises……...……..
2.5 THE DEVELOPMENT AND GROWTH OF SMEs…………………….....
2.5.1 Historical overview………………………..………………………………….
2.5.2 Problems in black business……..………………………………................
2.5.3 Stimulating growth in the SME environment………………………………
2.6 FINANCING OF SMEs……………………..……………………………….
2.7 REGULATION OF SMEs……………………..…………………………….
14
15
16
16
18
20
20
20
21
23
26
28
28
42
42
46
50

iii
2.8 THE FAILURE OF SMEs – A WORLD-WIDE PROBLEM………………
2.9 REASONS FOR THE FAILURES………………..………………………..
2.10 OTHER GENERAL PROBLEMS IN THE DEVELOPMENT OF SMEs..
2.11 THE ROLE OF THE SOUTH AFRICAN GOVERNMENT (1994-
2006)……………………………………………………………………….....
2.11.1 South African government policy interventions…………………………..
2.12 THE CURRENT SITUATION.………………………………………………
2.13 CONCLUSION……………………………………………………………….
CHAPTER 3: BUSINESS INTERVENTIONS IN SOUTH AFRICA AND OTHER COUNTRIES
3.1 INTRODUCTION…………………………………………………………….
3.2 DEFINITIONS OF CONCEPTS…………………………………………….
3.2.1 Consulting…………………………………………………………………….
3.2.2 Training………………………………………………………………………..
3.2.3 Supporting…………………………………………………………………….
3.2.4 Adviser……………………………………………………………………......
3.2.5 Mentor…………………………………………………………………………
3.2.6 SME life cycle………………………………………………………………...
3.3 VARIOUS TYPES OF INTERVENTION STRATEGIES……..................
56
59
62
66
70
73
75
76
76
78
78
79
79
79
80
81
81

iv
3.4 ASSISTANCE AND INTERVENTIONS IN OTHER COUNTRIES……..
3.4.1 The USA and Canada………………………………………………………
3.4.2 The UK and Europe….…………………………………………..................
3.4.3 Brazil and Mexico…………………………………………………………….
3.4.4 Australia and New Zealand…………………………………………………
3.4.5 China and Asia…………………………………………………………….…
3.4.6 Africa (excluding South Africa)……………………………………………..
3.5 ASSISTANCE AND INTERVENTIONS IN SOUTH AFRICA……………
3.5.1 Existing government assistance to small business…….………………...
3.5.2 Other types of assistance available………………………………………..
3.5.3 Existing professional assistance……………………………………………
3.5.4 Private business consultations……………………………………………..
3.5.5 Employing experts…………………………………………………………...
3.6 CONCLUSION……………………………………………………………….
CHAPTER 4: SUCCESS FACTORS FOR SMALL AND MEDIUM ENTERPRISES
4.1 INTRODUCTION…………………………………………………………….
4.2 WHEN IS AN SME SUCCESSFUL?......................................................
4.3 THE NEEDS OF SME OWNERS………………………..........................
4.3.1 Access to expertise………………………………………………………….
4.3.2 Access to finance…………………………………………………………….
86
86
91
94
96
98
99
103
103
109
121
125
127
129
131
131
131
137
137
139

v
4.3.3 Information technology………………………………………………………
4.3.4 Education and management training……………………………………...
4.3.5 Working experience………………………………………………………….
4.3.6 Business sense………………………………………………………………
4.3.7 Informal sources……………………………………………………………..
4.3.8 Government assistance……………………………………………………..
4.3.9 The gender issue……………………………………………………………..
4.4 CONCLUSION……………………………………………………………….
CHAPTER 5: RESEARCH METHODOLOGY
5.1 INTRODUCTION…………………………………………………………….
5.2 STEPS IN THE RESEARCH PROCESS………………………………….
5.2.1 Identify the research problem……………………………………...……….
5.2.2 Define the research problem/opportunity………………………………….
5.2.3 Establish the research objectives and formulate the hypotheses………
5.2.4 Determine the research design…………………………………………….
5.2.5 Identify information types and resources………………………………….
5.2.6 Develop a sample plan………………………………………………………
5.2.7 Design a research instrument………………………………………………
5.2.8 Pilot testing of questionnaire………………………………………………..
5.2.9 Collecting/editing data……………………………………………………….
5.2.10 Coding data…………………………………………………………………..
5.2.11 Capturing/cleaning/storing data…………………………………………….
5.2.12 Data analysis…………………………………………………………………
5.2.13 Present research findings…………………………………………………..
139
140
142
142
143
143
145
145
147
147
147
158
158
159
161
161
162
162
163
164
169
169
170
176

vi
5.2.14 Follow-up……………………………………………………………………..
5.3 VALIDITY AND RELIABILITY………………………………………………
5.3.1 Validity………………………………………………………………………...
5.3.2 Reliability……………………………………………………………………...
5.3.3 Sample size……………..……………………………………………………
5.4 CONCLUSION……………………………………………………………….
CHAPTER 6: DATA ANALYSIS AND INTERPRETATION
6.1 INTRODUCTION…………………………………………………………….
6.2 ANALYSIS OF COFESA RESPONDENTS……………………...……….
6.2.1 The location of businesses participating in the study……………………
6.2.2 Types of businesses owned and/or managed by the respondents…….
6.2.3 Respondents’ highest qualifications……………………………………….
6.2.4 Respondents’ occupations before becoming involved in the business...
6.2.5 Summary of characteristics of Cofesa respondents..…………………….
6.3 GENERAL BUSINESS INFORMATION OF THE COFESA
RESPONDENTS……………………………………………………………..
6.3.1 Respondents’ perceptions of the success/failure of their businesses….
6.3.2 Number of employees permanently employed in the businesses……...
6.4 THE AREAS AND DETAILS OF ASSISTANCE PROVIDED TO THE
RESPONDENTS……………………………………………………………..
6.4.1 Areas/functions of the business in which the respondents received or
176
176
177
178
181
183
184
184
185
186
187
189
190
192
192
193
200
201

vii
are receiving external assistance…………………………………………..
6.4.2 Respondents' perceptions of the most important areas of receiving
assistance…………………………………………………………………….
6.4.3 Time in the business cycle when the assistance was provided………...
6.4.4 Ways in which the respondents were assisted…………………………...
6.4.5 Formal training and/or courses attended by respondents……………….
6.4.6 The person/institution who provided the assistance……………………..
6.4.7 Duration of the assistance…………..………………………………………
6.5 SHORTCOMINGS IN THE ASSISTANCE RECEIVED………..………..
6.5.1 General shortcomings……………………………………………………….
6.5.2 Specific shortcomings in each area of assistance……………………….
6.6 FACTORS CONTRIBUTING TO THE SUCCESS OF SMEs…………..
6.6.1 Respondents' perception of the most important factors that contributed
to the success of their business……………………………………………
6.6.2 The respondents' perception of the consequences of the assistance
received……………………………………………………………………….
6.6.3 Respondents' recommendations about when assistance should be
sought…………………………………………………………………………
6.7 CORRELATIONS AND CROSS-TABULATIONS (initial classification).
6.7.1 The areas of assistance and the success of the businesses…………...
6.7.2 The time in the business cycle in which assistance was used and the
success of the businesses………………………………………………….
6.7.3 The way in which the respondents were assisted and the success of
the businesses……………………………………………………………….
6.7.4 The assistance provider and the success of the businesses……………
6.7.5 The duration of actual assistance and the success of the
202
203
208
210
213
215
218
220
221
223
228
228
235
235
239
243
245
246
246

viii
businesses……………………………………………………………………
6.7.6 Shortcomings identified by the respondents and the success of the
businesses……………………………………………………………………
6.7.7 The respondents’ perception of their business being more successful
after having received assistance and the success of the
businesses……………………………………………………………………
6.7.8 The time when assistance should be sought and the success of the
businesses……………………………………………………………………
6.7.9 The qualifications of the respondents and the success of the
businesses…………………………………………………..……………….
6.8 CORRELATIONS AND CROSS-TABULATIONS (adjusted
classification)…………………………………………………………………
6.8.1 The type of business the respondents own/manage and the success
of the businesses…………………………………………………………….
6.8.2 The time in the business cycle in which assistance was used and the
success of the businesses………………………………………………….
6.8.3 The way in which the respondents were assisted and the success of
the businesses……………………………………………………………….
6.8.4 The assistance provider and the success of the businesses……………
6.8.5 The duration of assistance (how long the assistance lasted) and the
success of the businesses………………………………………………….
6.8.6 The number of employees in the business (the size of the business)
and the success of the businesses………………………………………...
6.8.7 The most important area in which assistance was received and the
success of the businesses………………………………………………….
6.8.8 The respondents’ highest qualification and the success of the
businesses……………………………………………………………………
247
248
250
251
252
253
253
255
257
259
261
262
264
266

ix
6.9 THE UNSUCCESSFUL BUSINESSES……………………………………
6.9.1 Unsuccessful businesses and the types of businesses in the different
sectors………………………………………………………………………..
6.9.2 Unsuccessful businesses and the shortcomings identified in the
process of assistance……………………………………………………….
6.9.3 Unsuccessful businesses and the time in the business cycle during
which assistance should be sought………………………………………..
6.9.4 Unsuccessful businesses and the respondents' highest qualification….
6.9.5 The reasons for failure………………………………………………………
6.10 CONCLUSION……………………………………………………………….
CHAPTER 7: CONCLUSIONS AND RECOMMENDATIONS
7.1 INTRODUCTION…………………………………………………………….
7.2 EVALUATING RESEARCH OBJECTIVES……………………………….
7.3 SUMMARY OF CONCLUSIONS…………………………………………..
7.4 RECOMMENDATIONS……………………………………………………..
7.4.1 The areas of assistance……………………………………………………….
7.4.2 Stage in the business life cycle in which assistance should be sought
and the duration thereof……………………………………………………….
7.4.3 Assistance providers…………………………………………………………..
7.4.4 The respondents’ recommendations during their interviews……………...
7.5 RELIABILITY AND VALIDITY OF STUDY………………………………..
268
269
269
270
271
271
274
276
276
277
290
292
292
292
293
295
295

x
7.6 PROPOSALS FOR FURTHER RESEARCH……………………………..
BIBLIOGRAPHY……………………………………………………………………….
297
300

xi
LIST OF APPENDICES
Page APPENDIX A: SURVEY QUESTIONNAIRE……………………………….
APPENDIX B: FIGURES AND TABLES MENTIONED BUT NOT
INCLUDED IN THE CHAPTERS………………………….
325
336

xii
LIST OF TABLES IN TEXT
PageCHAPTER 2
Table 2.1: The distribution of South African private sector enterprises (as
percentages) by sector and size-class, 2002…………………………………….
Table 2.2: The annual new registrations of private companies and close
corporations from 1990 to 2002……………………………………………………
CHAPTER 6
Table 6.1: Location of participating businesses………………………………….
Table 6.2: Types of businesses owned and/or managed by the respondents..
Table 6.3: Comparison of the distribution of SMEs in the sectors of the
economy used in the sample with the distribution of all SMEs in the different
sectors of the economy in South Africa…………………………………………..
Table 6.4: Respondents’ occupations before getting involved in the business.
Table 6.5 Summary of the percentage of "yes" answers from tables 6.47 to
6.54……………………………………………………………………………………
Table 6.6(a): How successful do you think your business is?..........................
Table 6.6(b): How successful do you think your business is?..........................
27
48
186
187
188
190
194
197
197

xiii
Table 6.6(c): How successful do you think your business is?..........................
Table 6.7: The number of permanent employees in the business……………..
Table 6.8: Areas of assistance mentioned under the "other" option…………..
Table 6.9: The ways in which the respondents were assisted…………………
Table 6.10: Formal training and/or courses attended by respondents………..
Table 6.11: Who rendered assistance to the respondents……………………..
Table 6.12: Other sources of assistance specified………………………………
Table 6.13: Other timeframes of assistance specified………………………….
Table 6.14: General shortcomings identified during the process of assistance
Table 6.15: Summary of shortcomings identified during the process of
assistance…………………………………………………………………………….
Table 6.16: Shortcomings as perceived by the respondents for each area…..
Table 6.17: Comparison of the areas in which respondents were assisted
and the shortcomings in those areas……………………………………………..
Table 6.18: Factors that contributed to the success of the respondents'
businesses……………………………………………………………………………
197
200
203
211
214
216
217
220
221
222
224
226
229

xiv
Table 6.19: "Other" factors mentioned that contributed to success……………
Table 6.20: Is your business more successful because of the assistance you
received or are receiving?................................................................................
Table 6.21: According to you, when should a person seek assistance similar
to what you have mentioned?..........................................................................
Table 6.22 Initial classification of ratings…………………………………………
Table 6.23 Adjusted classification of ratings……………………………………..
Table 6.24 Classifications (initial and adjusted) of ratings as percentages…..
Table 6.25: Summary of cross-tabulation of successful/unsuccessful
businesses and areas of assistance………………………………………………
Table 6.26: The time in the business cycle in which assistance was used of
and the success of the businesses………………………………………………..
Table 6.27: Summary of the way the respondents were assisted and the
success of the businesses…………………………………………………………
Table 6.28: Summary of the assistance providers and the success of the
businesses……………………………………………………………………………
Table 6.29: The duration of the actual assistance and the success of the
businesses……………………………………………………………………………
233
235
236
241
242
243
244
245
246
247
247

xv
Table 6.30: The shortcomings identified by the respondents and the success
of the businesses……………………………………………………………………
Table 6.31: The respondents’ perception of their business being more
successful after having received assistance and the success of the
businesses……………………………………………………………………………
Table 6.32: When assistance should be sought and the success of the
businesses……………………………………………………………………………
Table 6.33: The qualifications of the respondents and the success of the
businesses……………………………………………………………………………
Table 6.34: How successful do you think your business is?............................
Table 6.35: Q4. What type of business do you manage or own? Q2. How
successful is your business? Cross-tabulation…………………………………..
Table 6.36: Q6. When did you make use of the assistance? Q2. How
successful is your business? Cross-tabulation…………………………………..
Table 6.37: Q7. How were you assisted? Q2. How successful is your
business? Cross-tabulation………………………………………………………...
Table 6.38: Q2. How successful is your business? Q8. Who presented you
with the assistance? Cross-tabulation…………………………………………….
249
250
251
252
253
255
256
256
260

xvi
Table 6.39: Q9. For how long were you assisted? Q2. How successful is
your business? Cross-tabulation…………………………………………………..
Table 6.40: Q3. How many employees are permanently employed in the
business? Q2. How successful is your business? Cross-tabulation…………...
Table 6.41: Q5. What is the most important area in which you received
assistance? Q2. How successful is your business? Cross-tabulation…………
Table 6.42: Q2. How successful is your business? Q14. What is your highest
qualification? Cross-tabulation…………………………………………………….
Table 6.43: Q2. Unsuccessful businesses Q4. What type of business do you
manage or own? Cross-tabulation…………………………………………………
Table 6.44: Q2. Unsuccessful businesses Q10. What shortcomings can you
identify with this process? Cross-tabulation………………………………………
Table 6.45: Q2. Unsuccessful businesses Q13. According to you, when
should a person seek assistance similar to what you have mentioned?
Cross-tabulation……………………………………………………………………..
Table 6.46: Q2. Unsuccessful businesses Q14. What is your highest
qualification? Cross-tabulation…………………………………………………….
Table 6.47: My business has been profitable during the last financial year…..
Table 6.48: My business has grown over the past three years………………...
261
263
265
266
269
270
270
271
338
338

xvii
Table 6.49: The profit has been increasing over the past three years………...
Table 6.50: I have been paying salaries and wages for at least three-and-a-
half years…………………………………………………………………………….
Table 6.51: I make enough money to live comfortably………………………….
Table 6.52: My business is employing more people now than two years ago..
Table 6.53: The turnover/sales of my business has/have increased over the
past two years……………………………………………………………………….
Table 6.54: My business is unsuccessful…………………………………………
Table 6.55: Respondents' perceptions of the first, second and third most
important areas of receiving assistance………………………………………….
Table 6.56: The different factors contributing to the success of the
respondents' businesses……………………………………………………………
Table 6.57 The areas of assistance (section 1, question 5) and the success
of the businesses (section 1, question 2)…………………………………………
338
339
339
339
339
339
340
342
344

xviii
LIST OF FIGURES
PageCHAPTER 5
Figure 5.1: Steps in the marketing research process…………………………
CHAPTER 6
Figure 6.1: Frequency of the qualifications of the respondents………………..
Figure 6.2: Percentage “yes” answers to statements regarding success of
respondents’ businesses……………………………………………………………
Figure 6.3: Respondents' perception of how successful their businesses
were…………………………………………………………………………………..
Figure 6.4: Areas in which respondents received assistance…………………..
Figure 6.5: Summary of respondents' perceptions of the most important
areas of receiving assistance………………………………………………………
Figure 6.6: The respondents' perceptions of the most important areas of
receiving assistance by using weighted averages……………………………….
Figure 6.7: When the assistance was provided………………………………….
Figure 6.8: Summary of the different ways in which the respondents were
assisted ………………………………………………………………………………
149
189
195
198
202
205
207
209
212

xix
Figure 6.9: Summary of different bodies that rendered the assistance ……….
Figure 6.10: Summary of the duration of assistance shortcomings in those
areas……………………………………………………………………………….....
Figure 6.11: Graphical representation of Table 6.17…………………………….
Figure 6.12: Graphical representation of table 6.18…………………………….
Figure 6.13: The weighted averages of the different factors contributing to
the success of the respondents' businesses……………………………………..
Figure 6.14: Graphical representation of table 6.30……………………………..
Figure 6.15: Comparison of when the assistance was received with the
respondents' suggestion about when the best time would be to receive
assistance……………………………………………………………………………
Figure 6.16: Frequency of the location of respondents' businesses…………..
Figure 6.17: Frequency of the types of businesses of the respondents……….
Figure 6.18: Graphical representation of table 6.56……………………………..
216
219
227
230
232
236
238
336
337
338

1
CHAPTER 1 INTRODUCTION, AIM, METHOD AND LAYOUT OF THE STUDY
1.1 INTRODUCTION
Throughout the world, policy makers are turning to small and medium enterprises
(SMEs) to drive economic growth and development. SMEs are regarded, inter
alia as the primary creators of jobs and economic stability. The vital contribution
that SMEs can make to employment and income generation is recognised
worldwide, and in South Africa in particular (Brink, Ligthelm & Cant, 2003:1).
The South African government has committed itself to the promotion and growth
of the small, medium and micro enterprises (SMME) sector as one means of
reducing unemployment (Nieman, 2001:445). Its aims are to increase the
number of new ventures and create an enabling environment to ensure the
survival and growth of SMEs.
Entities such as Khula Enterprise Finance and the Small Enterprise Development
Agency (Seda) were specifically created by government to promote the SMME
sector. Corporate South Africa and parastatals have embraced procurement
policies that support black economic empowerment (BEE) and foster the
development of a vibrant SMME sector. With all this in place and despite efforts
by the government to establish a support structure for the SMME sector, to date
these efforts have not proved to be that successful. The SME survey 2005
executive summary reports that not only has government failed in addressing the
shortcomings in its support for SMEs identified in 2004, but also that these
shortcomings are even worse outside the four major urban centres (SME Survey,
Executive Summary, 2005).

2
In the Executive Report of the Global Entrepreneurship Monitor (GEM), Maas and
Herrington (2006:18-19) also list the following points indicating the shortcomings
of the initiatives of government and the factors hindering entrepreneurship:
• The education system does not encourage entrepreneurship as a career.
• Regulations create huge administrative burdens and high costs when starting
a business.
• Infrastructure and the necessary skills required for the development of
entrepreneurship are lacking.
• There is no or little support from government and the private sector in the
creation and development of new and existing enterprises.
• Although sufficient funds seem to be available it is difficult to access them.
Apart from government interventions (including all types of assistance, support
and training), SME owners also make use of consultants and advisors such as
attorneys, accountants, banks, and business consultants. Attorneys, accountants
and banks provide a specialised type of service and do not usually interfere with
the core business. Attorneys are usually involved when the business is being
registered, when contracts have to be drawn up, when the form of the business
changes and when insolvencies occur. Accountants are generally responsible for
the bookkeeping aspect and only give a financial reflection of what is happening
in the business. Financial advisors are necessary to give direction in financial
matters. Banks are not really financial advisors, but SME owners need to borrow
money from them. Some banks, however, also assist SME owners with other
matters as discussed in section 3.5.3 in chapter 3 of this study.
Business consultants, on the other hand, are usually contacted for advice on
specific business related matters that the owners do not understand. They assist
with issues such as systems design, productivity improvement, administration,
payroll and expansion of the business. They assist or become part of the

3
business for a specific task, for a specific period or even on a semi-permanent
basis, such as one day per week or month.
Although the initial picture, especially regarding government assistance, does not
seem to be doing well in meeting the desired objectives, there are businesses
that make use of these as well as private consultants that are thriving. Many
SME owners realise that they could be doing better if they were to make use of
consultants in the areas in which they themselves lack knowledge and
experience.
There are many providers that small business owners can make use of to assist
them such as Deloitte and Touché, consulting businesses and employer
associations. Another example is the Confederation of Employers of South Africa
(Cofesa). Cofesa is an employers’ association and primarily gives its members
access to The Commission for Conciliation, Mediation and Arbitration (CCMA)
representation in labour-related cases and provides labour-related advice and
assistance. Since 2003 it has started assisting their members in other functional
areas of business as well, making use of advisors and specialists.
For the purpose of this study the researcher had to find a population of SMEs of
which the owners/managers had been assisted in some way in their businesses.
The South African SME population is extremely unstructured and no
comprehensive list of SMEs or business owners is available. Different sources
such as “BizAssist”, the DTI and “EASYINFO” were investigated to attempt to find
a list of SME owners who had been assisted, but to no avail. Furthermore, most
of the SMEs listed in these sources had not been assisted and those that had
been assisted were mostly only given loans or grants with no mention of business
interventions.
After some time of searching, Cofesa was identified as a population that could be
used. Cofesa is a structured unit, possessing a list with contact details of all their

4
members, most of whom had previously received business assistance. These
business owners actually joined Cofesa with the aim of receiving assistance.
This is exactly what was needed for this study. The researcher needed to
investigate SME owners who had been assisted in order to analyse the way they
had been assisted and try to determine how these interventions affected the
success of their businesses.
Cofesa also demonstrated their goodwill by making the details of their members
available. In realising the importance of this study, Cofesa expressed their
cooperation and support.
Although the Cofesa group is probably not representative with regards to
demographics (it was not measured), location, economic sectors or qualifications
of the general SME market in South Africa (see tables 6.1, 6.3 and figure 6.1),
the choice of Cofesa is based on the fact that this was the only structured,
comprehensive group available to the researcher. It is acknowledged that the
use of the Cofesa list could probably skew the research towards a specific target
group.
In order to ensure a common understanding of the research area and the basic
terminology used in this thesis will now be elucidated.
1.2 DEFINITION OF CONCEPTS
Success
Success can mean a level of social status, the achievement of an objective/goal
or the opposite of failure. The Oxford dictionary defines success as the
accomplishment of an aim or purpose and the attainment of fame, wealth or
social status.

5
The definition of a successful SME that will be used in this study is the following:
A successful SME is one that has been in existence for at least four years, has
been profitable and has shown growth over the preceding three years
(Nieuwenhuizen & Groenewald, 2006:70).
SMEs
SMEs are an extremely heterogeneous group and include a variety of firms that
possess a wide range of sophisticated skills and operate in different markets and
social environments (Hallberg, 1999:2). Table 2.1 in chapter 2 of this study
shows the distribution of private sector enterprises in South Africa (as
percentages) by sector and size-class.
Recently, the European Union (EU) had started standardising the different
concepts of a definition of an SME. Its current definition categorises enterprises
with fewer than 50 employees as "small", and those with 50 to 250 as "medium".
In the USA, when the number of employees is used to define the size of a
business, those with fewer than 100 employees are classified as "small" and
those with fewer than 500, as "medium". Micro-business is defined in both the
EU and the USA, as a business with fewer than 10 employees. A business with
fewer than 10 employees is also known as a Soho (small office/home office).
In South Africa the definition of SMEs differs from one economic sector to the
next. Generally speaking, SMEs are businesses with between five and 250 full-
time paid employees. The annual turnover varies between R3 and R51 million
and the gross assets (excluding fixed property) vary between R1 to R23 million,
depending in which sector or subsector of industry the business is classified
(Goldstuck, 2004:5).

6
Although some of the sources referenced, refer to SMMEs (which include SMEs),
the researcher did not include micro enterprises and survivalists in the study.
Entrepreneur
Different authors have come up with different definitions of the term
“entrepreneur”, and these definitions do not always correspond. For the purpose
of this research, the following definition will be used: An entrepreneur recognises
opportunities for new products and services and obtains the finance and other
resources to produce and deliver them. This person has the ability to create an
enterprise where none existed before. An entrepreneur can thus also be a small
business owner, but a small business owner is not necessarily an entrepreneur.
Such a person might be enterprising, but true entrepreneurs habitually create and
innovate to build and grow something of recognised value (Nieuwenhuizen,
2005a:3).
An entrepreneur creates a growing business and develops the business. If no
growth is evident, the business has no entrepreneurial flair. There is also no
such thing as a typical entrepreneur with a specific profile. There are only certain
characteristics that they have in common (Van Vuuren, 2004:1).
The entrepreneurs researched in this study were all SME owners.
Business Intervention
A business intervention provides executives and business leaders with guidance
to deal with fundamental practical business issues. There are two factors that
are critical to success in any intervention. Firstly, the executives must want to
improve their performance and secondly, there needs to be a specific issue that
can be successfully mastered and worked on through the intervention of a
business expert (Leonard, 2004:32).

7
In their research, Yapp and Fairman (2005:151-156) refer to local authority
interventions to examine compliance with food safety legislation in small
businesses. These interventions were done to change a process, change
behaviour and to enforce safety requirements. In this case the intervention, or
rather enforcement of safety requirements, was done by the Environmental
Health Practitioners employed by the local authority.
Introducing new products, new business methodologies and designing new
business processes, equipment or tools and policy are also seen as business
interventions. The interventions referred to here were promoted to franchisees in
the usual format of email and newsletters as well as by the company’s business
consultants during their visits to the businesses and the franchisees themselves
(Davis, 2004:71).
A business intervention is interference that may affect the interests of others.
According to Pleva (2006:8), an intervention may range from direct provision to
market intervention.
Literature shows that there are different meanings to the word interventions. For
the purpose of this research, most of the different types of interventions were
included. The term was used interchangeably with the term “assistance”. This
includes consulting, training, support and advising the small business owner or
entrepreneur about any facet of the business and its environment at any time with
a view to making the business successful or more successful.

8
1.3 RATIONALE FOR THE STUDY
Worldwide there is evidence of the survival rate of SMEs being extremely low.
Some authors claim that up to 96% of all SMEs fail within 10 years. According to
Brink et al. (2003:1), the estimated failure rate of SMEs in South Africa is
between 70 and 80%. According to the Small Business Administration in the
USA (Longley, 2006), over 50% of small businesses fail in the first year and 95%
within the first five years. Unfortunately the results of studies on this topic are
often contradictory or vague, and flawed statistics may make entrepreneurs and
SME owners’ prospects look worse than they really are. Taking all this into
account, it is generally accepted that the failure rate among SMEs is extremely
high. New start-ups have a slightly higher probability of failure than firms that
have been in business at least four years as they undergo turbulence, while the
latter could experience relatively stable growth (Hallberg, 1999:3).
On the other hand, as indicated in chapter 3, there is so much assistance
available to SMEs in South Africa, ranging from government assistance (through
many entities that were established) to professionals, private consultants
(including business consultants) and advisors.
The above poses two questions, namely: “Why are there so many failures?” and
“Are SME owners receiving the proper assistance to enable them to manage their
businesses effectively to make them successful in the long run?” Not only should
the cause of failure be determined, but the types of interventions that could assist
SMEs in a beneficial way also need to be determined.
If the above questions can be answered, not only consultants, but also the
government, and SME owners in particular could benefit and spend the available
effort, time and money on interventions that would probably increase the success
rate of SMEs and help them grow profitably.
9
SME owners would also be aware of the different types of interventions to make
informed decisions that could enhance their success. They would see that some
types of interventions do not really make a difference and that others can help
them to survive and make them more profitable.
If SMEs are the way to alleviate the unemployment situation as government and
other experts suggest, and the proper and relevant assistance is given to SME
owners, South Africa could hopefully look forward not only to lower
unemployment figures, but also less poverty and a better economic and social
situation.
1.4 PROBLEM STATEMENT
From the above discussion it is clear that business interventions in SMEs do not
always seem to be sufficient, do not always focus on the areas that will
necessarily enhance their success rate and do not necessarily contribute to the
success of South African SMEs. The negative situation of high failure rates as
mentioned previously could possibly be minimised through the right type of
intervention at the right time by the different providers. This relates to the main
problem of the study, namely: that the use of consultants/business interventions
and their link to the perceived success of the performance/survival of SMEs has
not been researched previously in South Africa. The crux of the problem that
needs to be investigated is the manner in which business
consultations/interventions take place and the perceived success of these
interventions for South African SMEs.

10
1.5 OBJECTIVES OF THE STUDY 1.5.1 Primary objective
The primary objective of this study is to analyse business interventions and to
determine their effect on the perceived success of South African SMEs.
Following this primary objective the following secondary objectives can be
realised:
1.5.2 Secondary objectives
The secondary objectives of this study are as follows:
• to determine in which functional areas the SME owners have received
assistance
• to determine the amount of time the consultants (including all those assisting
the SME owner) spend with the business
• to determine during which stage of the business life cycle assistance is
rendered
• to determine a profile of the provider of the assistance
• to identify any shortcomings in the process of assistance
• to determine to what extent the respondents rate Cofesa as a provider of
assistance.
1.6 DEMARCATION OF THE STUDY
In this study the researcher will look at SME owners who are members of Cofesa
and have been assisted, supported, trained or exposed to any form of assistance
in managing their businesses.

11
The population consists of SME owners who are members of Cofesa. Cofesa
has a membership of more than 5 500 employers who are all SME owners. It
has been serving the interests of employers since 1990. Its mission is “to protect
employers’ rights through expert information, assistance and benefits regarding
all labour relations issues”. Cofesa is a powerful source of information and
regularly presents seminars and workshops to keep its members up to date,
making use of the web and e-mail.
Cofesa is primarily a professional service organisation of advisors in different
areas of business. Their members are SME owners who have experienced the
need to be assisted by specialists. Initially, Cofesa focused on labour-related
issues, but during the last six years has been assisting its members in other
functional areas of business as well, making use of advisors and specialists.
Amongst other types of assistance, they have a hotline for entrepreneurs
requiring help in different areas.
The reasons for making use of Cofesa as the population are as follows:
• Most of the 5 500 members are SME owners who have been assisted in
some way or another. Assistance is a prerequisite for this study since the
main objective is to analyse business interventions and effect thereof on the
success of SMEs.
• Although the Cofesa group is probably not representative with regards to
demographics (it was not measured), location, economic sectors or
qualifications, the choice of Cofesa is based on the fact that this was the only
structured, comprehensive group available to the researcher.
• Cofesa also had a list available with contact details of all their members and
demonstrated their goodwill in making this list available to the researcher.

12
1.7 LIMITATIONS OF THE STUDY
Publications in accredited journals and articles in other sources on the results
and consequences of interventions by private consultants are limited.
Consultants are mainly not academics with no or limited interest in publishing
their results. Furthermore, they will not publish results of unsuccessful
interventions. Since it is also not a topic that academics or researchers have
addressed, the results of other studies, references and secondary information are
limited. These limitations are also the reason why the research topic is valid for a
doctoral study.
Limitations regarding the use of the Cofesa population:
• Cofesa is probably not representative (it was not measured) of the SME
owners in South Africa regarding the demographics of the country.
• Although the members of Cofesa own or manage SMEs in many areas
countrywide, the majority of them are in the Gauteng area.
• Although the members of Cofesa own or manage SMEs in all the sectors in
the economy, it is not completely proportional to the sector distribution of
SMEs in South Africa. The agricultural sector (the largest in South Africa) is
not represented well by this population. The manufacturing and community,
social and personal services sectors are proportionally higher represented
than the distribution in South Africa.
These limitations will not make this study representative of SMEs in South Africa.
The benefit of the thesis however lies in the fact that it will provide the start to the
investigation of the contentious issue regarding the use of business consultants
by SMEs in South Africa. This study provides a framework of reference, a guide
and a measure to which future studies on business interventions could be
compared with. The results of this study could already be used by small

13
business owners to guide them in all the aspects of business interventions as
discussed in this study, seeing that no such information is currently available.
1.8. RESEARCH DESIGN AND METHODOLOGY
1.8.1 The literature study
With the limitations on secondary sources as mentioned above, the literature
study that was conducted is divided into three chapters. Chapter 2 deals with the
history and development of entrepreneurs and SMEs in South Africa.
Chapter 3 explains the various concepts associated with interventions and gives
an overview of the different types of interventions and programmes generally
available. Thereafter interventions in other countries are outlined as well as the
establishments, bodies, parties, agencies, centres, associations and individuals
that offer assistance to SME owners. Finally, the South African situation is
reviewed, with specific reference to government, professional and other types of
assistance rendered to SMEs.
Chapter 4 evaluates the various definitions and views of and ideas of success
and when a business can be judged as being successful. The chapter also looks
at the different needs of SME owners and what government could do to assist
them.

14
1.8.2 The empirical study
To determine the success rate of assistance and to try to answer all the
questions arising from the stated problem, all the members of Cofesa were used
as the population.
Historical data were collected by means of questionnaires and the members of
Cofesa were interviewed. The members of Cofesa (5 543) with telephone
numbers formed the population of the study. A random, purposeful sampling
technique was followed. Those SME owners who had any type of assistance
were asked to answer the questions telephonically. Once a total of 2 658 calls
had been made by the call-centre and 200 questionnaires had been completed,
the survey was discontinued.
The figure of 200 cases was deemed to be a sufficient sample (3.6% of the
population) for the purpose of this study. The sample was therefore all owners
and managers who had received assistance in relation to business matters. As
this population has unique characteristics, the sample was deemed to be fairly
representative of the Cofesa members. The size of the sample was also large
enough to perform elementary statistical procedures.
Ask Africa was used to collect the data required. Ask Africa is a professional,
strategic research partner that applies active intellect and connectivity to provide
credible research results and consulting services to its wide range of blue chip
clients (as quoted in correspondence from “Ask Africa”).
The objective of the questionnaire was to answer the primary and secondary
research questions.

15
1.8.3 Data collection by means of a questionnaire
The measurement tool used to obtain information was a questionnaire.
According to Rossouw (2003:129), it is considered an appropriate method of
research if the individual is the unit of analysis. It is one way of ascertaining
opinions, perceptions and reports of individual behaviour. When paired with
sampling techniques, it can facilitate reliable generalisations about total
populations at certain points in time and in particular contexts.
The advantages of using questionnaires are that it is low in cost and does not
require a lot of personnel and organisation. The questions are in writing and the
respondent can read through them a couple of times if it is a complex issue. The
disadvantages, however, are that the response rate (when using mail surveys) is
usually low. The researcher also loses the opportunity to probe, gain any advice
or assistance from the respondent and/or clarify any misunderstanding
(Rossouw, 2003:129).
A questionnaire was drawn up to gather information in order to realise the
objectives of the study. The information contained in the literature study was
used to guide the researcher in drawing up the questionnaire. The researcher
made use of a range of question types including open, closed, dichotomous and
multiple-choice questions.
The questionnaire was edited and tested by academics in the Bureau for Market
Research and Business Management departments at Unisa. This group included
the Head of the Bureau for Market Research, the two supervisors of the thesis
and a professor assisting with research in the department. Thereafter the
questionnaire was sent to the CEO of Cofesa to discuss it with his business
consultants. Finally, the questionnaire was edited by Ask Africa to make it “call
centre friendly”. The data were collected by means of computer-aided telephonic
interviewing (CATI).

16
1.8.4 Data analysis and interpretation
The type of study used was regarded as a combination of quantitative and
qualitative data. Although the sample size was fairly large, the administration
thereof was manageable. The type of analysis was statistical and summarised to
present thoughts and reasoning. A descriptive research study was conducted to
attempt to answer the questions. The details of the research methodology are
provided in chapter 5.
The data collected from the questionnaires were mainly organised into nominal,
ordinal and interval data. Tustin, Ligthelm, Martins, and Van Wyk, (2005:592-
593) describes these data forms as follows:
• nominal data: numbers assigned to individuals such as owners, managers,
partners and members
• ordinal data: numbers used to differentiate between options and also to rank
them in order, for example, the most recent suppliers of assistance
• interval data: data measured on an interval scale of 1 to 7 such as the
respondents’ perception of the success of their businesses
SPSS (originally, Statistical Package for the Social Sciences) 14.0 for Windows
was used to do all the calculations. Data were captured directly onto the SPSS
spreadsheet. A final error check was carried out by comparing the number of
entries on the original with the copied data. There were no incomplete
questionnaires.
1.8.5 Analysis objectives
In analysing the data the focus was on a descriptive analysis, providing a
summary of the sample in terms of the variables of interest. The researcher

17
made use of the following descriptive analysis techniques (Tustin, et al.,
2005:523):
• frequency tables and basic tables
• measures of central location and variability
• measures of skewness and kurtosis
• correlations and cross-tabulations
These techniques are briefly explained below.
• Frequency tables. A graphical representation of the data is provided. The
data may be grouped or ungrouped. The graphical representation may be in
the form of a bar chart, pie chart, histogram and frequency polygon, and/or
frequency distributions (Tustin, et al., 2005:523-538). The researcher used
mainly frequency tables, presenting them graphically in the form of bar charts.
• Measures of central location and variability. There are three measures of
central tendency – the arithmetic mean (average), the median (middle value)
and the mode (most frequent occurring value) (Tustin, et al., 2005:538-548).
The researcher only made use of the arithmetic mean in the study.
• Measures of skewness and kurtosis. The skewness or kurtosis will be
close to zero if the distribution of values is symmetrical and mesokurtical
(normal distribution curve) (Tustin, et al., 2005:554).
• Correlations and cross-tabulations. Welman and Kruger (2001:209-212)
discuss correlation and cross-tabulation as a descriptive analysis technique.
This technique describes the relationships between variables and measures
the extent to which a change in one variable is attributed to a change in
another.

18
1.9 CHAPTER LAYOUT
Since the objectives of the study have been introduced and their importance
discussed, it is necessary to explain the layout of chapters 2 to 7.
Chapter 2 deals with the history and development of entrepreneurs and SMEs in
South Africa. It mainly covers the historical and economic background and the
importance, development and growth of SMEs, financing and regulation, SME
failures and the role of the South African government.
Chapter 3 gives an overview of the different types of interventions and
programmes generally available. Interventions in other countries are described
as well as the establishments, bodies, parties, agencies, centres, associations
and individuals that offer assistance to SME owners. Finally, the South African
situation is reviewed, with the focus on the government and the professional and
other types of assistance offered to SMEs.
Chapter 4 looks at definitions and views of and ideas on success and at what
point a business can be judged as being successful. The different needs of SME
owners are examined as well as what government could do to assist them.
Chapter 5 describes the research methodology used in this study. The steps in
the research process are first discussed within a theoretical framework.
Thereafter the objectives of the study are reviewed and the methodology used in
the study discussed. More specifically, the various stages of the sampling
process are described, including the design of the research instrument, a
discussion of the pilot testing of the questionnaire, the data collection process
and a description of the data analysis process.
Chapter 6 provides information on the data analysis and interpretation thereof. It
includes an analysis of the Cofesa respondent profiles, general business

19
information on them, the areas and detail of the assistance provided,
shortcomings in the assistance received and factors contributing to the success
of SMEs. After the initial description of the issues mentioned, correlations and
cross-tabulations are done, looking at different variables, mainly using the
variable of success with various other variables. In conclusion, the reasons for
some of the businesses failing are discussed.
Chapter 7 deals with the conclusions and recommendations. It summarises the
main findings of the study. On the basis of these findings recommendations are
made that could guide government, other assistance providers and especially
SME owners enabling them to concentrate the available effort, time and money
on those types of interventions that should improve the success rate of SMEs
and help them to grow profitably.

20
CHAPTER 2 THE HISTORY AND DEVELOPMENT OF SMEs IN SOUTH AFRICA 2.1 INTRODUCTION
The literature reveals that the small and medium enterprise (SME) sector plays a
critical role in the economic and social development of a country (Müller, 1990;
UNCTAD, 1999; Campbell, 2003; SBA, 2006). This also applies to South Africa.
The SME sector was neglected for a century, following the discovery of diamonds
and gold and the establishment of a capitalist economy with almost exclusive
white control. Although the large mining and industrial enterprises are vital to the
growth of the economy of a country, there seems to be a great deal of evidence
that SMEs have a high labour absorptive capacity. The cost of creating a job in
the SME sector is lower and its innovative role is vital for the challenges facing
South Africa. The SMME sector has further proven to be a highly significant
vehicle for black economic empowerment (DTI White Paper, 1995:10-12).
2.2 HISTORICAL BACKGROUND
Although the Portuguese were the first Europeans in South Africa, the Dutch
established a supply depot when they arrived at the Cape of Good Hope. This
depot developed into the Cape Colony. At the end of the 18th century, the British
seized the Cape Colony and it became a British Colony. As the number of
European settlers increased, there was increased fighting with the natives over
the rights to land and farming. The Dutch, by then known as the Boers, moved to
the Highveld region and established their own colonies. After two wars with the
British, which the latter won, the Cape Colony and the two Boer republics unified
in 1910 as the Union of South Africa. Blacks, coloureds and Asians had no say
in the Boer republics and their rights continued to be eroded. In 1948 a system of

21
racial discrimination (known as apartheid) was created. In 1961, South Africa
became a republic. The African National Congress (ANC) was the most active
organisation to oppose this system and in 1992 apartheid was dismantled under
FW de Klerk, the State President at the time. In 1994 Nelson Mandela became
President, and today South Africa is a multi-racial, democratic country (Anon,
2005a).
2.3 ECONOMIC BACKGROUND
When the Europeans settled in the Cape, the coloureds there were involved as
workers in agriculture, industry and trade and this led to entrepreneurial activity.
According to Müller (1990:1-3), the colonists needed labour, but found the
Khoikois (a coloured group) too lazy. The fact, however, was that the latter were
not willing to be entrepreneurs if the circumstances and rewards were not
attractive. This shortage of labour led to the need to import slaves in 1658 and
the slave population grew until Britain abolished the slave trade in 1807. Most of
these slaves had the opportunity to earn income through some kind of
entrepreneurial activity. Some were given small plots of land that they could
cultivate and some had their own livestock. Their masters and they themselves
taught one another a variety of skills. These skills included building, painting,
saddle-making and boat-building. Another practice permitted slaves to conduct
trade on their own account in return for some fixed payment to their owners.
Many of them prospered and were able to buy their own and also others’ freedom
(Müller, 1990:1-3).
Until about 1870 the economy of South Africa was almost entirely based on
agriculture. Diamonds were discovered in 1867 and gold in 1886. After these
discoveries the mining industry became the foundation of economic development
and was well established by the beginning of the 20th century. Foreign trade
increased dramatically. By 1907 the mines of the Witwatersrand (central

22
Gauteng today) were producing almost one-third of the world’s gold. The Boers
found themselves as poor farmers in a country in which large scale mining
ventures and foreign capital rendered them irrelevant. Blacks and coloureds
were entirely marginalised. Harsh taxes were imposed, wages were reduced and
the British encouraged the immigration of Chinese to undercut any labour
resistance (Anon, 2005d).
World War I (1914-1918) produced a booming wartime economy, followed by an
international recession. This put pressure on mine-owners and they started
employing lower-paid black, semi-skilled workers. Secondary manufacturing
began in 1923 with the assembly of US automobiles in Port Elizabeth. This was
followed by a national, coal-based electricity network and later an iron and steel
industry in Pretoria. Initially, industry was mainly concentrated on the
Witwatersrand where the gold mines were located, but later spread to the port
cities of Durban and Cape Town (Anon, 2005d).
During the mid 1920s, there was political-economic concern over the lack of
industrialisation in developing countries. The overall framework was to promote
large enterprises, disadvantaging small enterprises in the process. The latter
were left to produce inferior goods, catering for the lower end of the market and
using labour-intensive means of production (Anon, 2005c:28-29). The economy,
however, was becoming diversified, and by 1945, manufacturing was the leading
contributor to the gross national product (GNP) (Anon, 2005d).
The Industrial Development Corporation (IDC) was established in 1940. It was
responsible for encouraging and financing suitable import-substitute industries
throughout South Africa. In 1970 each homeland also created its own
development corporation, which used various economic incentives and tax
concessions to attract South African and overseas capitalists. The homelands
(these constituted 10 reservations or areas within South Africa designated by
government where a majority of black South Africans resided) of Transkei, Ciskei,

23
Kwazulu, Lebowa, and Bophuthatswana succeeded in attracting a large number
of factories (Anon, 2005d).
By the 1970s there was also polarisation of mainstream development policy and
small-scale sector development. This caused these sectors to view each other
as competition, preventing meaningful possible linkages and mutual benefits.
Policy intervention and a variety of measures reinforced this issue. What might
have been necessary was a two-tier approach, catering for both sectors.
Although it was clear that certain policies needed to be changed, targeted
interventions may well have been required to remove bottlenecks and facilitate
development (Anon, 2005c:28-29).
An industrial development plan followed in 1981 divided the country into eight
regions, ignoring homeland boundaries in favour of overall economic
development. All of the IDCs, the Small Business Development Corporation and
the Development Bank of Southern Africa combined their efforts to raise
standards of living through decentralised industrial investment by all ethnic
groups. By the 1990s services made up almost 60%, industry over 35% and
agriculture about 5% of the GNP (Anon, 2005d).
2.4 THE IMPORTANCE OF SMEs
Although Schumpeter (1934) noted that entrepreneurs are central to economic
growth and change, the belief during the 1970s was that the role of small firms
would go on diminishing indefinitely in the face of capital-intensive globalisation.
Research continued and still many of the new findings are surprising and little
appreciated. Governments continue to focus on issues such as a supposed lack
of entrepreneurial cultures, business skills and small business failure rates.
These are either not important or difficult to influence, or both. Bannock (1999)

24
suggested that governments should do something about the heavy compliance
burdens and tax distortions.
According to Byrd and Qinsong (1990:189), the entrepreneur is even more
important in developing countries than developed countries. Vosloo (1994:418)
summarises the importance of the entrepreneur as follows: “People make things
happen. Enterprises begin with people. Enterprising people give rise to
production, which in turn gives rise to employment. Without the spirit of
enterprise as expressed in entrepreneurial activity, there can be no employment
creating economic growth.”
Vosloo (1992:1) observes that the growth pattern and the overall health of an
economy depends largely on dynamic entrepreneurial activity in the SME sector
and adds that the key role of this production factor is often overlooked and
underestimated.
According to most researchers, the role of the small businessperson has
basically been completely ignored for decades. Saayman (1997:10) states that
there are few and mostly old sources describing the influence of the entrepreneur
on the economy. Only a few authors, mostly from the Austrian school, regard the
entrepreneur as valuable.
During the three decades prior to 1990 some of the East Asian countries such as
Japan, China and Korea had extremely high economic growth rates. This was
mainly because of large, medium and small entrepreneurial-driven enterprises.
During the same period, Africa had a poor economic growth rate. The difference
was that the government had taken over the role of entrepreneur in many of the
African states (Saayman 1997:4).
Mantle, Harrod and Nel, (1992:12-13) note that there has always been some
confusion about what constitutes small business or informal business activities

25
and that some activities are even confused with one another. Disregarding
precise definitions, Mantle et al., (1992) conclude that at the time there were no
national statistics (other than manufacturing concerns) available to enable one to
analyse the importance of SMEs in South Africa. When they conducted their
research the informal sector was estimated to account for about 15% of GDP.
This figure comprised of varied contributions according to subsector.
Because of its importance, the South African government has targeted the SME
sector to try and alleviate the problems of economic growth, wealth distribution
and unemployment. Mantle et al., (1992:12-13) mention the following
advantages in this regard:
• The SME sector is more labour-absorptive than other sectors.
• The cost of creating a job is lower than in the large enterprises.
• SMEs allow for more competitive markets.
• They can adapt more rapidly and often use local recycled resources.
• They provide opportunities for the unemployed.
• Fewer skills are required in some cases.
• They play a vital role in technical and other innovation.
The Small Business and Entrepreneurship Council (SBSC) in the USA stated
clearly in their small business survival index, 2003 that small businesses and
entrepreneurs truly are the backbone of the U.S. economy, and the primary
source of job creation. The following facts were provided:
• Businesses with fewer than 500 employees account for 99.7 percent of all
employees.
• These firms employ more than half of private-sector employees.
• Small businesses create between 60 and 80 percent of net new jobs.
• Small businesses create 13 to 14 times the number of patents per employee
compared to large patenting businesses.

26
• 39 percent of high-tech workers are employed by small businesses.
• Small businesses account for 97 percent of all exporting businesses.
Bruce, Deskins, Hill and Rork (2007:2) also found in their study in the USA that
small firm establishment births have a larger impact than any other factor
examined on gross state product (GSP), state personal income (SPI) and total
state employment. The authors also found that small firm establishment birth
rates and deaths rates have equal and opposite effects on state economic
growth. This suggests that economic growth will be faster when the net small
firm establishment birth rate is positive (exceeding the death/failure rate).
Many authors have reported on the importance of SMEs and not only mentioned
that small business was seen as the essential condition for economic growth, but
that the training of their workforce was even more important. SMEs have long
been recognised as the engine of economic growth (Bernier, 2005:540; Pansiri &
Temtime, 2008:251; Lewis, Massey, Ashby, Coetzer & Harris, 2007:551-552).
Although Sikhakhane (2005:1) reported that a study by three US economists
suggested that there is growing evidence that the contribution made by SMEs is
overstated and does not enhance economic growth or create jobs, research done
in countries all over the world clearly shows the importance of SMMEs and
entrepreneurial activity to enhance economic growth, distribute wealth and create
employment.
2.4.1 The distribution of South African private sector enterprises
Roux (2002:38) makes the following observations from data gathered on the
employment offered by the SMME sector in South Africa and shows that there is
clearly a relationship between the size-class of the enterprise and the sector
concentration:

27
• Micro and survivalist enterprises dominate the construction, retail, trade and
transport, storage and communication sectors.
• Small enterprises dominate the mining and quarrying, wholesale, trade, and
catering and accommodation sectors.
• Medium enterprises dominate the agriculture, forestry and fishing,
manufacturing, finance and business services, and community, social and
other personal services sectors.
• Very small enterprises do not dominate in any sector.
Table 2.1 (Roux, 2002:39) shows the distribution of private sector enterprises (as
percentages) by sector and size-class:
Table 2.1: The distribution of South African private sector enterprises (as percentages) by sector and size-class, 2002.
Sector Survivalist
Micro (0)
Micro (1-4)
Very Small
Small Medium Large
Agriculture, forestry and fishing
0.4 3.4 11.1 14.9 21.1 23.8 25.3 100
Mining and quarrying
0.4 0.7 3.3 4.6 6.8 4.9 79.3 100
Manufacturing
0.8 0.7 4.9 6.8 11.3 18.2 57.3 100
Construction
0.4 3.7 14.3 13.4 21.1 20.4 26.7 100
Wholesale trade
1.1 2.8 15.0 19.9 19.0 17.2 25.3 100
Retail trade (incl. motor trade)
32.0 36.1 15.9 11.6 3.9 0.3 0.2 100
Catering and accommodation
12.2 29.2 21.3 18.2 16.4 2.1 0.6 100
Transport, storage and communications
0.7 7.6 12.5 7.0 10.2 15.6 46.4 100
Finance and business service
1.1 2.4 8.6 11.2 16.7 19.8 40.2 100
Community, social and personal services
1.2 1.9 7.8 10.2 19.1 23.6 36.2 100
Total 5.0 8.8 11.5 11.7 14.6 14.6 33.8 100
According to this table, there are more large enterprises than any other size-
class. Medium and small each account for 14.6% of private sector enterprises.
28
2.5 THE DEVELOPMENT AND GROWTH OF SMEs
2.5.1 Historical overview
The so-called “Free Blacks”, a small group, came into existence when some
slaves were liberated soon after their arrival in the Cape of Good Hope in 1658.
They played an important role as entrepreneurs, inter alia, as tailors,
shoemakers, masons, builders, saddlers, hawkers (selling fruit and vegetables)
and other small-scale traders. Fishing was also a vital activity in that fisherman
worked together in groups to find the required capital. The free Blacks, however,
faded into insignificance (Müller, 1990:3-5).
Initially, cross-frontier trade between black and white in the Cape Colony was
forbidden because of the invariable lack of goodwill on both sides during a
transaction. Nevertheless, much trade occurred early in the 19th century. Cross-
border trade was legalised in 1824, and in 1830 all restrictions on cross-border
trading for trading purposes were abolished. These developments were of
utmost importance to the Eastern Cape and especially the ivory trade that came
to the rescue of the 1820 settlers whose agricultural endeavours did not last. The
settlers appeared to benefit more because of the type of merchandise (such as
beads, buttons blankets and clothing) they traded for ivory, but in the end both
parties were better off after the exchange (Müller, 1990:10-12).
A most remarkable development occurred during the 19th century. Black farming
was involved in a transformation from subsistence-oriented to market-oriented
farming when the plough was introduced at various missions. Cultural customs
were broken down; for example, meat was sold instead of given away when an
ox was slaughtered. From the 1830’s the results of the commercialisation of
black farming was apparent and the Commission of Native Affairs of 1865
obtained much evidence of growing entrepreneurial activities amongst blacks in
the Cape Colony.

29
The success of blacks in commercial agriculture in the Cape was replicated
elsewhere in South Africa. In 1870, it was reported in Natal that the black man
was characterised by his energy and industry as a farmer and that the blacks
were ready and fit to become agriculturists. Until the late 1870s, the blacks in
Natal dominated sales of produce to the colony’s markets. The Sotho farmers (a
black ethnic group in the Free State) helped to feed the country’s little towns and
the diamond diggers. Between 1850 and 1880, the Lesotho black farmers also
supplied grain to the diggers during the 1870s. It has been said that in the
Transvaal the Sotho and Tswana supplied food to the miners far more swiftly and
efficiently than the Afrikaner landowners. However, black commercial farming
declined everywhere, and was then regarded as one of the great tragedies in
South African economic history (Müller, 1990:12-15).
The white farmers began complaining because they could not compete or attract
blacks to work for them. They subsequently started to import Chinese and Indian
labourers to assist them. It was also during this time that laws were passed to
prohibit land ownership by blacks. The blacks, however, dissatisfied with the
trade skills their children were taught at mission schools, initiated and financed
their own private schools. They hired white teachers to teach them the
commercial and management skills needed to become business owners rather
than employees. Thereafter, African education was gradually reduced to the
level that made blacks good labourers and junior clerks in government offices
(Ladzani, 2001:1).
During the latter half of the 18th century and beginning of the 19th century, men
such as Cecil Rhodes (De Beers Consolidated Mines), Barney Barnato and
Ernest Oppenheimer (Anglo American Corporation) came to South Africa and
became permanent residents instead of temporary expatriates. The main issue
here is that they brought with them valuable entrepreneurial, managerial and
technical skills, both for mining and other sectors. Even the Jewish immigrants
from Lithuania and other parts of Eastern Europe were valuable additions to the

30
economic and entrepreneurial resources crucial for successful development
(Feinstein, 2005:97).
Owing to the output of the gold mines and World War I, the economy expanded
rapidly until 1920 when the post-war depression struck. It declined for two years
before growth recommenced until 1929 when the worldwide depression also hit
South Africa. During these years, about 15% of the population was reduced to
poor-white status. Since the English-speaking portion of the population was
urban, the burden of adjusting to the changing conditions was borne by the
Afrikaans-speaking farmers. This traumatic experience as well as having to
compete with the blacks for labouring jobs, helps to explain the rise of the
National Party and the future apartheid policies in subsequent years (Jones &
Müller, 1992:20-22).
During this time, some Afrikaners rose up to mobilise their own people (many of
them now poor whites) to go into commerce and industry. In October 1939, the
First National Economic Congress was held with the overriding goal of inciting the
impoverished demoralised people to take on the challenges of entrepreneurship.
However, they needed capital and some structures (such as Federal National
Investments, FVB and the “Reddingsdaadbond” [RDB] were put in place to assist
suitable applicants. They called the economic system they put in place “national
capitalism”. There were some success stories, but many businesses folded, in
Johannesburg alone at least 50. In 1941, probably the most successful South
African entrepreneur, Anton Rupert, together with two other partners bought an
insolvent tobacco company. This was the beginning of the highly successful
Rembrand Group (Dommisse, 2005:53-65).
During this period, the role of agriculture and mining declined while the role of
manufacturing doubled. From 1933 to 1961, the country saw sustained
economic growth and was reported as a developing market economy (Jones &
Müller, 1992:20-22).

31
In Third World developing countries, small-scale industries first became the focus
of attention when these countries realised that the industrialisation process was
not able to absorb all the urban unemployed in the productive labour force.
During the first half of the 20th century until the mid-1960s the focus was on large-
scale industrialisation that was thought to be the foundation of economic growth.
The idea was that expansion, based largely on import substitution, would
increase wage sector employment and generate filter-down effects throughout
society. However, this did not happen quickly enough and alternative solutions to
the objective of achieving redistribution with growth were sought. Attention was
turned to the “informal sector”, a concept first used by Hart (1973) (Da Silva,
1987:14-15).
In 1938, the African Defender (a paper for Bantu Education and Development)
published in Cape Town ran an article entitled “Lesson 18: starting a business”.
In the preface to this article, the author condemned the laws that made it difficult
for blacks to pursue business, and stated that Blacks should have their own
business. The idea behind this was that all black people could earn more money
and have a chance of living well. Businesses owned by non-blacks in black
areas were also denounced. According to the guidelines, a cooperative
enterprise would be necessary for success. This meant, firstly, that members
had to pool their funds because individuals did not have enough money to start a
business successfully. Secondly, expert business management had to be
acquired to develop business strategies to counter competition from other ethnic
groups. Thirdly, a large store was envisaged on the main street with black
managers and personnel selling all kinds of merchandise (Walker, 1995:15-16).
The African Defender also published guidelines for blacks wishing to establish a
one-man concern in a white area but because the law required certain criteria to
do this, explained that it was becoming increasingly more difficult (Walker,
1995:16).

32
According to Mantle et al., (1992:12), the history of black entrepreneurship in
South Africa was brief. After the early 1940s, black small business was subdued
by the governments in power and was not allowed to have manufacturing
concerns or form companies outside their designated areas, let alone in urban
areas. Opportunities for growth were almost impossible because of the “one-
man, one-shop” law according to which blacks could own only one business.
There were also constraints on the ownership of land and this prevented the
blacks from having access to capital. Other laws such as the Group Areas Act
also barred black small businesspeople from trading. These were all government
interventions and caused the country to suffer many economic blows such as
sanctions and lack of international funds.
After the National Party came into power in 1948, African capitalism was
structured by separate development. Black political and economic development
was to be confined to the homelands. Severe restrictions were placed on black
businesspeople in urban areas. Among other things, they were not allowed to
form partnerships, to pursue financial, industrial or wholesale activities and to
own property (Southall, 2003:5).
The development of financial institutions was a primary factor in the rise of
Afrikaner capital in the non-farming economy. During the post-war period,
Afrikaners produced over 80% of all marketed farm output, but their involvement
in other sectors was minor. It was estimated that the proportion of turnover sold
by Afrikaner firms in 1948/1949 was only 1% in mining and only 6% in both
manufacturing and finance. It was 25% in commerce and the majority of these
businesses were either small one-man and family operations or cooperatives.
Afrikaners tried to mobilise their capital for the furtherance of their interests and
the elected white government and local authorities transferred their accounts and
deposits to Volkskas (a local Afrikaner friendly bank). Other Afrikaner institutions

33
and government contracts were also awarded to the same group (Feinstein,
2005:177-179).
From 1961 onwards the country experienced rapid economic (and population)
growth, but then slowed down during the 1970s and 1980s. During the same
period, when all sectors were experiencing growth, the decline of agriculture was
persistent (Jones & Müller, 1992:227-230).
According to Stokes (1971:27) the Afrikaner entered the modern economy with a
vengeance from 1940 to 1970. During this period, large numbers of
entrepreneurs and other businesspeople were produced.
NACOC (the National African Chambers of Commerce) was founded in 1964,
and formed a single federal body, but by 1973 it was hardly recognised outside
its own community. In 1969, NACOC was reorganised into regions under the
umbrella of a Federated Chamber of Commerce and from this process, the
National African Federated Chamber of Commerce and Industry (Nafcoc) was
born. Nafcoc aimed and today still aims to promote and facilitate the
development of business in South Africa, drawing the majority of South Africans
into the mainstream economic activity and decision-making process (Nafcoc,
2006).
The political situation at that time was such that government refused to speak to
its executives. Hetherington (1985:3) praised the dedicated small band of black
businesspeople who led and built Nafcoc for their immense contribution.
Regarding the advanced capitalist nations, most research centred on the
situation in the UK where the economic recession of the 1970s and the
publication of the “Report of the committee of small firms” inspired the interest on
issues surrounding small-scale industry. The focus seemed to be on evaluating
the contribution of the small firm, employment generation and regional
34
development. Many people suggested that small firms provide the
entrepreneurial basis for future development and larger enterprises, play an
important role in the diversification of regional economies and provide a vital
source of technological innovation to lagging regions. It was also suggested that
new small businesses provide regional economies with a considerable degree of
industrial flexibility and improve regional efficiency. Lastly, increased output and
employment for the region were provided (Da Silva, 1987:9).
Until the 1970s, black businesspeople could have only one business, could sell
only necessities and could not form business partnerships. In South Africa
blacks were also limited to certain occupations. By 1952, only 10% of total
reserve trade was controlled by African dealers. Although this type of legislation
dated back to the 1920s, black businesspeople demonstrated entrepreneurial
persistence. Business activities were pursued on a full-time and part-time basis,
both legally and illegally. This led to the development of distinct business niches
and supplied employment for many blacks. For example, segregation led to the
development of the black taxi business. By 1982 there were 9000 registered
black businesses in South Africa, of which about one-quarter were in Soweto
(Walker, 1995:16-18).
In the 1960s, under the leadership of Verwoerd, the government tried to lure
businesspeople to the border areas of the homelands. They would be legible for
tax concessions, cheap finance, subsidies and exemption from minimum wage
stipulations. They would also be able to make use of the cheap labour of the
homelands. In practice, this never happened, primarily because of the costs
involved in decentralising businesses to these border areas (Feinstein,
2005:156).
In the late 1970s and early 1980s, four of the homelands were given their
independence and became separate republics (national states). Their separation
from South Africa, however, was not recognised by the United Nations or the

35
world in general outside South Africa. After the May 1994 elections, the four
independent homelands were reabsorbed into South Africa.
The following were some of the situations that prevailed in the homelands during
the time of their existence:
• On 3 June 1981, the so-called “factory flats”, were opened at Zwelitsha,
Ciskei. These flats were functional buildings that could be used by the
manufacturers. In the years preceding this opening, more than 150 small
business manufacturers come to the fore with their products, after it was
initially thought that there were no SMEs (Hetherington, 1985:86-87).
• During the 1980s, Commercial farmers and manufacturers were also the
wealth creators in Lebowa. The main problem prevented small business from
increasing and expanding was all the laws and regulations (over 2000 of
them) that affected business. Deregulation was the most urgent need. The
issue of not being able to acquire land was also a problem here as in all the
other homelands (Hetherington, 1986:9).
According to Hetherington (1985:192-193), in 1984 there was only one country in
this region that was serious about the development of small business, namely the
Ciskei. Ciskei’s parliament had just passed a Small Business Deregulation Act.
The Ciskei government realised that with their independence three years
previously, they had inherited (from South Africa) socialism and not free
enterprise. Ciskei began to modernise land and tenure structures, privatise
housing and transport and simplify and reduce taxes. This country led the way in
this respect. Free enterprise was starting to replace the bureaucratic control
enforced by the South African government at that time (Hetherington, 1986:13-
18).

36
South Africa and the homelands were not the only countries struggling with rules
and regulations prohibiting small business development. In 1980, the US Federal
Government passed the Regularity Flexibility Act, which was an attempt to root
out institutional biases that work against the small entrepreneur (Hetherington,
1985:193).
By the mid-1970s the Afrikaner movement had accomplished its primary goals.
Although ownership in manufacturing, construction, mining and finance had
increased, ownership in the commercial sector had, however, declined to 16%
because of the larger (efficient and cheaper) chain stores such as OK Bazaars
and Woolworths that had put smaller businesses out of business. The
dominance of the Afrikaners was of considerable significance for the subsequent
formation of economic and social policies. This rise of Afrikaner capitalism was a
key part of the erosion of the original apartheid policies (Feinstein, 2005:179-
180).
The year 1979 was seen as a turning point. By June 1979, Dr Koornhof (then
Minister of Plural Relations) had removed the prohibition of blacks manufacturing
in so-called “white areas” and many steps were taken to recognise the future
permanence of blacks in these areas (Hetherington, 1985:34). During a
conference convened by Dr Koornhof in March 1979, made the following
proposals, inter alia, about black business:
• The rules and regulations (red tape) for a black businessperson to start a
business should be streamlined,
• On-the-spot counselling should be given by the white private sector, with the
possibility of retired businesspeople taking this responsibility,
• White-owned factories should investigate the possibility of outsourcing to
black businesspeople, and
• White business should look into the possibility of participating in joint ventures
and partnerships with black businesspeople.

37
It would seem that Dr Koornhof was passionate about reforming the situation and
helping black small business to flourish. He wanted to bridge the gap between
the haves and the have-nots, reduce the red tape involved and improve the
quality of life of people. The one main issue that still remained at that stage was
the private ownership of property. In late 1979, the Prime Minister held the
Carlton Conference with an all-race private sector. Both these parties placed
much emphasis on the role of small business in the changed future and the next
few years proved just that (Hetherington, 1985:166-167).
During the early 1970s no black companies or manufacturers were permitted in
the townships. The Bantu Investment Corporation (BIC) had encouraged some
black businesspeople to buy out white businesspeople in the homelands. Other
than this, not much had been done for the black business community. There
were no blacks on the BICs board or in its top management (Hetherington,
1985:164-165). At the end of the 1960s the Potchefstroom Small Business
Bureau was established, but it concentrated on the white commercial sector only.
Economic development in the homelands was largely government inspired.
There was not much involvement by the private sector and little attention was
paid to the development of the small indigenous black businessperson
(Hetherington, 1985:28).
During 1978/1979 it was estimated that there were about 30 000 black-owned
businesses in South Africa and the TBVC (Transkei, Bophuthatswana, Venda
and Ciskei) states. Two-thirds were traders and shopkeepers; the rest were in
transport. Although no manufacturers or farmers were mentioned, they were
obviously there (Hetherington, 1985:130).
By early 1979, there were about 20 000 black traders in South Africa, with Nafcoc
having about 4 000 members (also almost all traders). Only in about 1977 did
black businesspeople start thinking about the possibility of manufacturing. During

38
1978 Nafcoc organised a black manufacturer’s conference that 153 black
delegates attended. The following year, an agricultural committee was also
formed for farmers. The Black Bank was formed after Nafcoc mobilised R1
million from small black investors (Hetherington, 1985:29-30).
Nafcoc went from strength to strength and by 1980 could boast 17 regional
chambers. In the 1980s black business started moving forward, and according to
Hetherington (1985:60), the following three facts were widely recognised:
• There is a single economy that cannot prosper unless small business
prospers.
• Lasting economic development must start with small business.
• Free enterprise is the system for creating wealth and improving general living
conditions.
During 1979 the private sector accepted the responsibility of initiating the SBDC.
During this period government also increased its support for training, consulting
and education services to small business. Government embraced and
coordinated with groups in the private sector and asked the private sector for
advice on the promotion of small business. Several commercial banks and the
state development corporations were attending to the needs of small
businesspeople regarding finance and business premises (Hetherington,
1985:22). In 1998, the Small Business Development Corporation (SBDC) was
transformed into Business Partners Limited and the organisation shifted its focus
to small and medium enterprises (Boosting small business, 2006).
Because of the above changes, the Council for the Promotion of Small Business
was established early in 1981, opening eight small business information centres,
assisting university-based small business training and advisory centres and
bringing private sector consultants within the reach of small business. The
necessary support infrastructure and climate were right for small business to take
39
off. By that time, several universities had established small business bureaux.
Following Potchefstroom’s lead, the Council contributed by providing them with
funds to increase their training and consulting human resources. About 10 to 12
universities of different ethnic groups were able to employ about 60 additional
small business consultants. Funds were also made available to assist small
business to utilise private sector consultants, which they did on an increasing
scale. Several large businesses were also playing a supportive role
(Hetherington, 1985:22).
During the 1980s the formal business sector in South Africa not only failed to
create any new job opportunities, but also experienced a decline of approximately
20 000 job opportunities. Most of those workers becoming unemployed
experimented with some form of trading in the informal sector and the spaza
shop (informal small convenience store operation) was born out of these
circumstances. These shops developed and were handling vast turnovers and
became a prominent member in the distribution channel (Terblanché, 1991:1).
Although African industrial enterprise in South Africa came a long way with
traditional rural crafts such as mat- and basket-making at the time of colonial
settlement, small-scale industries first became the focus of attention when it
became evident that the industrialisation process was unable to absorb the large
numbers of unemployed into the labour force (Da Silva, 1987:14).
In 1985, Nafcoc had around 15 000 members, mostly still manufacturers.
Members were coming together all over the country to learn from and support
one another.
According to Phillips (1993:4), prior to 1994, the initiatives for black small
business were inadequate. Any programme of assistance needs to be assessed
against the need for social, political and economical freedom. The environmental
system needed to be integrated and synergised for accelerated development

40
programmes to be more effective. It was not a question of simply allocating more
resources and programmes - other issues needed to be taken into account to
make any assistance more meaningful. Such issues included the adoption of
selective and creative approaches, an improved understanding of all elements of
especially the black-owned component and a cooperative, understanding
government.
History also shows that the economy was built on systematically enforced racial
division in every sphere of society. Segregation in education, health, welfare and
employment caused inequalities and economic inefficiency. Many workers were
therefore poorly equipped for the rapidly changing environment, while SMEs in
South Africa were underdeveloped. Whatever the new system entailed, it would
have to provide fairness and equality and reflect society’s racial and gender
composition- hence the need for affirmative action (Van der Merwe, 1995, 3).
During the 1990s, the present government developed the RDP (Reconstruction
and Development Programme), a statement of intent that outlined definite
principles in promoting SMEs in South Africa. The RDP is an integrated,
coherent socio-economic policy framework that seeks to mobilise all South
Africans and resources towards the final eradication of apartheid and the building
of a democratic, non-racial and non-sexist future (South Africa, 2005a).
The ANC describes the RDP as at the heart of the government’s vision for social
and economic transformation. One of the main priorities is that of building a new
economic order that reverses the past economic distortions. Since the mid-
1990s the inner city of Johannesburg has experienced dramatic racial
transformation, offering black businesspeople an urban environment to start and
grow. The predominantly white-owned businesses preferred to relocate to
decentralised suburban locations because of rising levels of crime and violence
(Rogerson & Rogerson, 1997:85).

41
To summarise the historical overview, during the first half of the 20th century the
focus was on large-scale industrialisation that was thought to be the foundation of
economic growth. The industrialisation process was not able to absorb all the
urban unemployed in the productive labour force and small-scale industries
became the focus of attention. During the second half of the 20th century, the
economy was built on systematically enforced racial division in every sphere of
society, which caused inequalities and economic inefficiency. Because of this,
many (mostly black) workers were poorly equipped for the rapidly changing
environment during the latter part of the century. SMEs in South Africa were
underdeveloped. In 1979, blacks were allowed to do manufacturing in so-called
“white areas” and many steps were taken to recognise the future permanence of
blacks in these areas. The private sector accepted the responsibility of initiating
the SBDC and government also increased its support for training, consulting and
education services to small business.
In contrast to black workers, the Afrikaner (the Afrikaans-speaking white people)
entered the modern economy with a vengeance from 1940 to 1970. During this
period, large numbers of entrepreneurs and other businesspeople were produced
and the country experienced rapid economic and population growth until it slowed
down again during the 1970s and 1980s.
Miller (1998:1) reported that the apartheid history of South Africa profoundly
affected the structuring and functioning of business. Generally, white business is
highly developed, formal and has access to financial and infrastructural support,
while black business is often subsistence-based, informal and struggles to gain
access to support mechanisms. Miller proposed black/white joint ventures as a
mechanism to help alleviate this situation.

42
2.5.2 Problems in black business
Phillips (1993:1) looked at the question whether the general assistance of the
small business sector in South Africa would have served to equalise opportunities
for black businesspeople. To answer this question, the following two main issues
had to be borne in mind:
• The black SME sector of South Africa encountered many difficulties in the
past, experiencing prejudice and discrimination. Historically the apartheid
system repressed the informal activities of black South Africans through such
restrictive legislation as the Group Areas Act, harsh licensing, strict zoning
regulations, and effective detection and prosecution of offenders. (Kingdon. &
Knight, 2004:391-408).
• The second issue is that of commitment to enterprise. Enterprise is extremely
dependent on its perceived role in society. A stereotyped view of values and
behaviour system in the black communities suggests that these are
essentially cooperative or group-focused, rather than individualistic and
competitive. This view will influence enterprise because it could be said that
such a view is unfavourable for self-enterprise and competitive opportunity
search. It also draws from a historical perspective of traditional, tribal-based
and mostly rural communities of Africa. (Because of the changing
environment the researcher suggests further investigation into this issue in
order to substantiate this statement.)
2.5.3 Stimulating growth in the SME environment
Toomey (1998:100) reports that an inadequate analysis of the SMME
environment (relevant because SMEs are included here) in South Africa and the
potential of certain sectors to support SMMEs could endanger the ultimate goal of
developing a thriving SMME sector. Analysis is lacking in the following areas:

43
• The assumption that SMMEs are net job creators is contested.
• Given the limited resources available from the DTI it is questionable policy to
target agriculture and the mining sector as the primary recipients of SMME
support services.
• There is a tendency to focus on retail firms and hawkers at the expense of the
service and manufacturing sectors.
• Supply-sided assistance was implemented instead of demand-sided support
where assistance takes the form of providing one or more ongoing services to
emergent businesses.
The lack of sufficient capital and credit is often a major handicap in the
development of SMEs, especially in their growth stages. In developing countries
worldwide, close to 95% of all SMEs have to rely solely on the personal
resources and initiatives of the owners (Anon, 2005c:22-23).
According to one source (Anon, 2005c:49-50), there are no statistics available to
evaluate the growth potential of SMEs in South Africa, but the following indicators
can be used:
• Innovating firms are likely to grow more rapidly than “traditional” start-ups.
Research shows that South African SMEs are less innovative than in
developed countries.
• Exporting firms are likely to have better growth because of the frequent lack of
domestic markets.
• To grow and realise economies of scale, enterprises need fixed assets.
This justifies the assumption that, on average, South African SMEs have slower
growth figures than First World SMEs.
The question of what would stimulate growth in the SME sector remains and
there are two arguments here. The one is for a free economy with no

44
intervention, but with an environment that is conducive to entrepreneurial
endeavour. The other is for logical intervention from the top, stimulating so-called
“high growth” areas. Both arguments would require a similar management of the
macro economy to enable them to be implemented (Mantle et al., 1992:18).
Mantle et al. (1992:18-19) observed a finite number of options open to anyone
wishing to stimulate the SME sector, irrespective of the economic model used.
These options are as follows:
• removing the legislation and controls that impede growth or hinder the
entrepreneur
• assisting the entrepreneur in financing the business or its expansion, training
the entrepreneur or the staff and providing adequate premises and facilities
• providing a ready market for goods and services from SMEs (i.e. sub-
contracting from big business)
However, according to Mantle et al. (1992:19), the largest, single factor in the
success and failure of a new business is the entrepreneur himself/herself. If the
production factor of entrepreneurship is missing, no other assistance will build a
long-term viable business.
Toomey (1998:87) draws the following conclusions, inter alia, from a table
showing the estimated distribution of private sector enterprises and employment
in South Africa by sector and size-class in 1995:
• South Africa is dominated by the presence of large-scale industry and
accounts for nearly 40% of all employment.
• The most opportunities appear to be in manufacturing, retail and trade. He
remarks that this is probably because of the result of fewer barriers to entry.
• One quarter of all enterprises are classified as survivalists and nearly 55% of
all enterprises employ only family members.

45
• South Africa’s SMME manufacturing sector is underdeveloped in comparison
with other developing countries. This sector is dominated by large
enterprises.
During the early 1990s, Mantle, et al (1992:1) found the following regarding the
start-up and growth of small business in South Africa:
• White businesspeople started up mainly because they wanted job satisfaction
and had experience in the sector.
• Black businesspeople believed there were profits in retail and service-type
activities.
• Physical constraints such as premises, transport and burglaries were a
serious problem at start-up and tended to hinder the growth of the small
business.
• A stagnating economy was the main constraint for growth in white business.
• Financial and training problems were also experienced at start-up.
• Only a few black businesspeople were harassed at start-up.
• Only a few respondents who applied for financial assistance experienced
problems obtaining money.
• Only a few respondents were undergoing training.
• A large number of respondents were aware of the legislation affecting their
business.
During a survey of SMME firms in the Johannesburg area undertaken by the
World Bank in 1999, one of the concerns was the lack off growth after 1994.
Although the sample was limited to one area, the constraints to SMME growth
could still give some indication of the situation of the entire economy. Also
keeping in mind that not all SMMEs had the desire to expand (15% in this
survey), the following constraints were identified (Lewis, 2001:26-30):

46
• The customer base was not large enough.
• Interest rates were high and there was limited or no access to capital.
• There were insufficient government contracts and weak support programmes.
• There was limited international trade.
Literature reveals that the formal business sector in South Africa not only failed to
create any new job opportunities, but also experienced a decline of many job
opportunities during the 1980s. Growth in the SME sector was handicapped by
many factors such as the lack of sufficient capital, regulation and insufficient
management skills.
2.6 FINANCING OF SMEs
Financing is an obvious need for SMEs, but the major obstacle is the lack of
access to credit. The problem here is that the size of loans required by SMEs is
too small for normal commercial lending institutions to service profitably and the
businesses most in need of credit are the ones least able to raise security
(Mantle et al., 1992:97).
During 1979, the private sector accepted the responsibility of initiating the Small
Business Development Corporation (SBDC). Dr. Anton Rupert’s proposal for this
public/private sector joint venture was enthusiastically implemented, its main
functions being to provide finance and infrastructure for SMEs. During this time,
government also increased its support for training, consulting and education
services to SMEs. Government embraced and coordinated with groups within
the private sector and asked for advice from the private sector on the promotion
of SMEs. Several commercial banks as well as the state development
corporations attended to the needs of small businesspeople regarding finance
and business premises.

47
During 1980, the Minister of Finance, Dr. Horwood, budgeted R10 million for use
in encouraging small business. The climate for the development of small
business was gradually improving (Hetherington, 1985:61).
According to Mantle et al. (1992:97), the following bodies were assisting in some
way or other in financing small business:
• The Development Bank had traditionally lent money (after 1983) to the
development corporations in the homelands and independent states.
• The SBDC was established in 1981 as a joint and equal venture between the
public and private sectors. Their main activities included lending money to the
business sector, leasing property to businesses, marketing small business
products to big business, providing information and advisory services,
lobbying for changes in the legislature on small business, providing training
and consulting services and organising and supporting special projects for the
business sector.
• The IDT (Independent Development Trust) focused on housing, education,
health, rural development, welfare and, at a later stage, job creation.
• The NGOs lent money to small business, but mostly through
stokvels/investment clubs that carried the risk of the repayment of the loans.
• Regarding formal financial institutions, only Standard Bank and First
National Bank catered for the small businessperson.
• Informal financing included stokvels, mashonisas, burial societies and
investment clubs.
More recently the following bodies were listed as national finance institutions for
assisting small businesses by the Small Business Development Agency (Seda),
(Seda: 2008):
• Commercial banks
• Khula retail financial intermediaries

48
• Khula guarantee scheme
• Business partners
• Industrial development corporation
• Land bank
• Sizanani advisory services
• Zimele
Providers of financial assistance will be discussed in more detail in chapter 3.
Table 2.2 (Roux, 2002:40) shows the annual new registrations of private
companies and close corporations from 1990 to 2002:
Table 2.2: The annual new registrations of private companies and close corporations from 1990 to 2002
Year Private companies Close corporations 1990 6 369 28 008 1991 6 236 26 426 1992 6 550 27 570 1993 7 164 27 950 1994 9 356 39 170 1995 12 168 52 408 1996 16 151 61 884 1997 20 332 68 067 1998 23 651 73 114 1999 28 717 69 304 2000 32 419 78 730 2001 25 669 94 696 2002 32 178 107 302
The figures show that there was fairly strong growth of new businesses during
that decade, which also indicates a strong move towards entrepreneurship.
Roux (2002:42) also examined the demographic situation in South Africa and
found that Gauteng and the Western Cape were the only two provinces
49
• with a GDP per capita in excess of R20 000
• whose contribution to South Africa’s GDP is greater than their share of the
country’s population,
• where more than 30% of their populations are employed
• that are also the two highest contributors to total employment, jointly
accounting for 56%
The Eastern Cape and Kwazulu-Natal were responsible for 24.3% of South
Africa’s GDP and 37% of the country’s population, but they accounted for only
22.7% of total employment, with less that 12% of their populations employed.
This suggested that incomes were in the hands of a few. The Northern Cape
was the smallest province in terms of GDP, but had the third highest GDP per
capita with almost 20% of its population employed. This suggests relative
economic health (Roux, 2002:42).
In 2002, SMMEs employed 68.2% of people employed in the private sector. This
shows a significant increase from 44% in 1994 and 53.9% in 2001. Small
enterprises made up 21% and medium-sized 18% of total SMME employment.
This growth in employment was much faster than the growth in the contribution
by SMMEs to GDP. In 1995, the contribution of the SMME sector to employment
in the private sector was 1.35 times greater that the contribution of the SMME
sector to GDP. In 2001 this factor was 1.5 (Roux, 2002:36).
Although there are many bodies assisting in financing small business, the lack of
access to credit is still one of the major obstacles. Government entities are still
trying to improve and increase SMME access to grants and other support
mechanisms. New incentive grant schemes and amendments to existing ones
are also being considered (DTI: 2005). It seems that the process of financing
small businesses is still not working effectively.

50
2.7 REGULATION OF SMEs
Regulations are rules and standards imposed by public authorities. Some
regulations are needed to address, for example, market failures and social
needs. Regulations also create important benefits such as safer working
conditions, safer products, more innovation and a more stable business
environment, but regulations also create different costs (Dagut, 2007:5-6).
In 1982 it was recognised that SMEs were not thriving in South Africa and had
not been able to solve the unemployment problem. The main issues were
bureaucratic rules, regulations and tax. There was simply too much red tape
involved. For black small businesspeople it was even worse regarding the rules
and regulations issues. However, this situation was, being studied. During the
early 1980s, the University of Pretoria was commissioned to undertake a study to
rectify this situation. Another study at Unisa also proposed a completely new
body of law, much simplified to govern small business. Although the Registrar of
Companies and the Receiver of Revenue supported this, it was resisted by
certain elements in private sector and professional bodies (Hetherington,
1985:96-97).
Regulation includes many issues such as zoning, licensing, land-use regulations,
remuneration packages, tax and rules and regulations for setting up a small
business (Hetherington 1986:34-37).
The Group Areas and influx control laws still denied black businesspeople equal
opportunities, the licensing procedures were tedious and there was harassment
by the Industrial Councils (Hetherington, 1985:167-169).
If one looks at the history of the USA, prolonged high taxation can never and has
never supported economic growth. Income taxes were actually considered
unconstitutional for more than 100 years after the USA’s independence in 1776.

51
Growth is financed out of profits and if profits are highly taxed, growth is impeded
(Hetherington, 1986:28).
In South Africa, the number of regulatory instruments, including labour and other
regulations, increased from 521 in 2002 to 1 309 in 2004. In 2004 alone,
regulations cost the business sector 6.5% of GDP, or in monetary terms, R79
billion. The regulatory cost per worker is 10 times higher for a business with five
employees than for one with 200 employees (Paton, 2004).
Regulation of SMEs, however, is still a debatable point. The question is how
much should SMEs be regulated? Property developers, formal business and
municipal representatives, for example, talk about interference by SMEs and
unfair operating conditions and demand some form of regulation (Mantle et al.,
1992:83).
During the early 1970s, in an investigation into the economic history of South
Africa, it was noted that the prospects for a continuing virile economy were not
too good. Government intervention was increasing, economic development in
the homelands was almost pure socialism and the SME sector everywhere was
meagre and largely ignored, if not positively discouraged by the authorities
(Hetherington, 1985:2).
One source (Anon, 2005b:29-36) identified the following features of a
socioeconomic environment conducive to SME development:
• macroeconomic stability
• a supportive legal framework
• a favourable human resource environment
• an appropriate and efficient infrastructure
• competitive and cost-effective access to finance

52
If this is so, then one can assume that some regulation is necessary to create
such an environment if it is not naturally the case.
Mantle et al. (1992:2) saw the passing of the Business Act of 1991, which eased
procedures for SMEs to facilitate training, as a significant development in
deregulation. However, deregulation alone is not adequate and should be
coupled with infrastructure developments, training and financial assistance. They
also said that the true problem in regulation was the municipalities. The latter
had passed laws and by-laws to regulate SMEs and the lack of coordination
between municipal departments made it difficult for SMEs to trade. The rules
between municipalities also varied considerably.
In the report published by Mantle et al. (1992), it is stated that a key issue in the
deregulation of SMEs was the abandonment of a large number of zoning,
licensing and land-use regulations which, at the time, were hindering the activities
of SMEs. Although there was an urgent need for legislative reforms, they
suggested that other measures that intended to benefit SMEs should be
considered. The focus had to be on pro-active measures to further stimulate the
growth of the SME sector that included infrastructure development programmes
such as market upgrading and technical assistance by offering advice on suitable
products or methods of food preparation (Mantle et al., 1992:83).
Regarding the issue of regulation, Vosloo (1992: 6) noted the following aspects of
a national strategy for SME development:
• The SME sector can be part of the solution to unemployment, poverty and
unrest.
• Many governments have come to realise that they have a key role to play as
facilitators of entrepreneurial development.
• Specific action is required by government to remove the second-class status
of the SMEs and level the playing fields with the large enterprises.

53
• Affirmative action and economic empowerment can be used to assist
disadvantaged communities.
Van Tonder (2005:6) also reported that unemployment and poverty in South
Africa could be reduced if government implemented certain policy suggestions.
These suggestions were to decrease the cost of capital as well as the cost of
labour regarding specific groups. Less regulation for small businesses with fewer
than 200 employees and lower remuneration packages for young employees
were two of these suggestions. It was also remarked that Cosatu would strongly
oppose such suggestions, but that it would surely reduce unemployment and
poverty. Another member agreed and added that the economic growth rate could
grow from 3 to 4%. The Cosatu representative, however, was concerned about
the first economy not creating more opportunities, but the reason given was all
the limitations preventing them from growing more rapidly and creating
opportunities. Because of these strict regulations, labour was regarded as
expensive and a “trouble factor”. The unemployed were also not skilled enough
to make them employable. It was pointed out that the lack of skills was one
factor causing the then 80% failure rate of small businesses.
Mr Schwenke of Business Partners and Professor Van Aardt (Ueckermann,
2005c:6) both agree that deregulation is necessary, but that employers and
employees still need protection. According to them, it is so difficult to get rid of
employees who perform poorly, that employers are careful to employ people in a
growing economy. In the USA, it is common practice to employ and fire
employees as the economy changes. Employees are also fired more easily in
times of strikes. In South Africa, employers tend to opt for contract appointments
and automation rather than permanent appointments. According to Schwenke, it
is simply too much trouble and there are too many rules. In many cases it is also
difficult for the small business owner to pay a wage negotiated by the unions,
while the owner does not even belong to a union.

54
The tax incentives announced in the 2005 national budget provided small
business with the best tax support they had received in recent years. Claassen,
(2005) mentioned the burdensome regulations for setting up a small business, as
well as the fact that these tax measures were a huge incentive for budding
entrepreneurs. Small businesses also received a double deduction for start-up
costs, but that deduction should not exceed R20 000. Claassen, (2005) also
encouraged new small business owners to exploit tax incentives.
In June 2005, Duvenhage (2005a:8) reported increasing regulation of different
sectors in South Africa. The annual index for freedom and transformation by the
Free Market Foundation in South Africa decreased by one base point to 5.8 in
2004. This index measures the progress of South Africa on its way to freedom
and transformation and includes matters such as financial markets, labour,
education, privatisation, health care, tax and international trade. This decrease
seems to be the issue of increasing regulation that is costing both
businesspeople and the government money, the latter to enforce these
regulations. These regulations affect SMEs the most, and make it even more
difficult for them to contribute to job creation. Excessive regulation is
undoubtedly the reason why South African small businesses contribute less to
the GDP than they do in most other countries. It is also one of the reasons why
South Africa has one of the highest unemployment rates in the world. In July
2005, Duvenhage (2005b:11) once again summarised the problems with
excessive regulation and indicated how South Africa compares unfavourably in
so many areas with other countries worldwide.
During September 2005, the Trade and Industry Minister of South Africa, Minister
Mpahlwa, reported that six pieces of legislation that were burdensome to SMEs
would be reviewed by government with a view to lessening their negative effects.
Although many businesspeople have voiced their concern about the effect of
legislation on their businesses, any changes in the labour law are likely to be
opposed by the trade unions. However, the laws under review included the Basic

55
Conditions of Employment Act, the Skills Development Levies Act, the
Employment Equity Act, the Occupational Health and Safety Act and the
Regional Services Council Act. Mpahlwa also admitted that the government’s
SME development support strategy over the past 10 years had been deficient in
being too supply-side driven. Government provided too much support guided by
their own perceptions of the needs of SMEs. Mpahlwa also stated that, in future,
the market would be used as a mechanism to provide support. There needs to
be integration between national, provincial and local levels of business support
and well as between government and non-governmental agencies in providing
support. To this end, the Small Enterprise Development Agency (Seda) has
been mandated to design and implement a standard and common national
delivery network that will integrate all government-funded small enterprise
support agencies across all spheres of government. In addition, the new Apex
Fund will provide for credit for survivalists and micro-enterprises, while Khula and
other development financiers will be targeting SMEs (Ensor, 2005).
In a survey done by Strategic Business Partnerships (SBP) in 2006 in the tourism
sector in the Gauteng and Mpumalanga areas, nearly 35% of the respondents
indicated that state interface and regulations was one of the factors inhibiting
business growth. Only weakness in the economy was mentioned by more
(42.5%) respondents. Dagut (2007:9) stated that if we wanted to reduce
unemployment and promote black economic empowerment, we should be
making life as easy as possible for labour-intensive small firms. The burden of
regulatory compliance costs is doing exactly the opposite. Finally Dagut
(2007:37) recommends a change of attitude and the development and application
of practical techniques for managing regulatory costs.
During 2005/2006 the national treasury and presidency reviewed tools to improve
the regulatory environment in South Africa. During 2007 the cabinet approved a
pilot of the regulatory impact assessment (RIA), a tool to assess likely

56
consequences of proposed regulation and the actual consequences of existing
regulations (Tshazibana, 2007:5).
Kingdon and Knight (2004:391-408), summarise the situation well by stating that
as long as barriers to entry continue to restrict opportunities in much of the
informal sector, this sector will be unable to absorb significantly more of the
currently jobless. South Africa needs policies that will create employment. The
research indicates that government should try to decrease the obstacles to
entering the productive informal sector.
2.8 THE FAILURE OF SMEs – A WORLD-WIDE PROBLEM
Governments in most countries provide a variety of programmes to assist SME
owners. Although there have been success stories in a few countries such as
Taiwan, Northern Italy and Ireland, the impact of the SME development
programmes on performance has been less than satisfactory (Hallberg, 1999:1).
Despite efforts by the South African government to establish a support structure
for the SME sector, to date these efforts have not met with much success. The
Minister of Trade and Industry admitted that his department had failed in its chief
objective, of supporting and growing the SME sector in South Africa (Erwin, in
Van Eeden, Viviers & Venter 2003:13).
According to Van Eeden et al. (2003:13), the estimated failure rate of SMMEs in
South Africa is between 70 and 80%. As a result a lot of money is being lost on
business ventures because of essentially avoidable mistakes and problems.
They describe the difficulties encountered by small businesses as environmental,
marketing, financial or managerial. Perhaps these mistakes and problems could
be avoided by the use of experts!

57
According to Ahwireng-Obeng, and Piaray (1999:78-83), the South African
government has failed to minimise institutional uncertainty in its efforts to promote
productive entrepreneurship on a large scale as a strategy for combating the
country’s foremost problem of unemployment and inequality. The above authors
also stated that at the level of institutional efficiency, it is just another failing of a
Third World African country. Government has passed controversial labour,
patent and competition laws and imposed new taxes and levies to fund new jobs
– all of which are unfavourable to direct investment. The evidence emanating
from this study is that institutional risks from crime and security, corruption,
dysfunctional government and similar sources are formidable and pose a real
threat to the transition to an open economy with an open political system.
The implications of the above are that entrepreneurs will limit their investment to
establishing branch offices for sales and marketing rather than commit
themselves to expanding existing production units or establishing new ones. The
study shows that there is a need for further reforms. Any hope of an
entrepreneurial revolution to kick-start a continental renaissance will largely
depend on a vastly improved institutional climate (Ahwireng-Obeng & Piaray,
1999:84-85).
While South Africa has one of the highest unemployment rates in the world, it has
emerged as one of the lowest-ranking developing countries in terms of the Total
Entrepreneurial Activity (TEA) index, according to the executive summary in the
2004 Global Entrepreneurship Monitor (GEM) Report. The TEA measures the
proportion of a country’s adults who are involved in starting or running a new
business. In 2004, the TEA index in South Africa was 5.4% compared to an
average of 9.4% in all 34 counties included in the 2004 survey. This survey
confirms that South Africa has a relatively low TEA compared with the other
countries. This has also been the case since 2001 (Orford, 2004:3 & 10).

58
This shows that the government's strategy to flag entrepreneurship as one of its
key public policy interventions to scale down the unemployment rate by 40%
within the next five years is largely failing. The low rating also means that the
country is losing out on "substantial employment and growth opportunities".
Of 38 countries surveyed, South Africa was one of the weaker performers,
especially with regard to the entrepreneurial rate. Problems in the education
system, poor financial management practices and reluctance on the part of banks
to grant entrepreneurs initial start-up capital were seen as factors contributing to
this low ranking. The latter is seen as the main obstacle for potential
entrepreneurs, and banks rightfully cannot take that risk (Naidoo, 2004).
To overcome this situation, the financial services charter compelled banks to
commit investment worth R2billion to black small businesses over the next five
years. An implementation plan was to be presented by June 2004. The plan
looked at ways in which the banks could mitigate risks more cooperatively. The
banks see mentoring (probably meaning advising in this case) as an essential
part of managing risk (Naidoo, 2004).
The results of research by Nhlapo (2004:73) in the Kroonstad area indicate that
there is no synergy between local government and the aspirations of businesses
in terms of the support to businesses and investors. He highlighted the
importance of business and local authorities working together and formulating a
joint vision for making the region economically successful. This could be done by
bringing together expertise, resources and effort that would attract investment to
the region.
The failure of SMEs still seems to be a world-wide problem and governments are
trying to alleviate the problem by establishing programmes to assist SME owners
and set up support structures for the SME sector.

59
2.9 REASONS FOR THE FAILURES
Fifty to sixty percent of enterprises fail within the first three years because of
mismanagement and incapability. Barron, in Van Eeden et al. (2003:13) points
out that the ideas are often good and the people behind them are competent, but
“they do not have a clue on how to run a business”, and have no underlying
appreciation of business fundamentals.
Van Eeden et al. (2003:14) also mention the role of competition, insufficient
demand for products/services and market imperfections as frequently cited
problem areas in small businesses.
South African entrepreneurs view economic uncertainty, crime, corporate tax
rates, and labour laws as the main threats facing the SME sector.
Furthermore, in research conducted by Cape Town’s Graduate School of
Business, it was found that as much as 45% of the black-run businesses
surveyed experienced cash flow problems and failed because they lacked skills
to manage their finances.
One of government’s key strategies was to provide access funding and grant
preferential procurement for small black business in order to combat high
unemployment and address inequality in South Africa. According to John Orford,
a researcher at Cape Town’s Graduate School of Business, these policies fail to
address the underlying managerial weaknesses inherent in these businesses and
might not work in the long term.
An impact study by the Business Place, that was published in January 2004,
revealed that most of the businesses that were assisted had been in business for
more than a year, 35% for more than two years and 17% for more than four
years, indicating some degree of success. Although not proven, one of the main

60
issues that could be a restraining factor is that the entrepreneurs are not oriented
towards growth. The problem could be competitive markets and that they do not
have sufficient skills and knowledge to differentiate or they are in need of better
general and financial management (Verran, 2004).
Orford, Wood, Fisher, Herrrington, and Segal, (2003:48) stated that inadequate
financial management practices among formal black-owned businesses in South
Africa are a major threat to the financial health and survival of these firms. They
also found that there is strong evidence that sound management practices
(keeping a cash book, an accounts receivable record, a record of inventory and
performing proactive debtor management) reduce the probability of cash flow
difficulties. Applying all four of the above practices appears to reduce the
probability of an exhausted overdraft by as much as 61%.
The fact that government expect expertise from SMEs in their complexities in
qualifying for grant funding rather than offering them that expertise also
underlines why government initiatives fail (SME Survey, 2005).
Research-based findings by Massey University in Auckland, New Zealand
confirmed that growth orientated SMEs are held back by lacking knowledge
resources, skill fits and educational input. The first annual report of the Small
Business Advisory Group in New Zealand identified failure on the part of the
majority of small business owners to seek competent advice. Further research
by Business Horizons states that where true entrepreneurs are concerned,
seeking advice runs contrary to the belief in their own ability, with an inclination to
rate their own knowledge above others (Penning, 2004:46).
Penning (2004:46) states that no assistance can substitute missing management
capability and suggests that ideally every business owner should attend a
business course and appreciate the value of management qualifications.
Professionally qualified practitioners rarely feature in bankruptcy findings.

61
According to different researchers such as van Scheers and Radipere (2007: 1)
and Pansiri and Temtime (2008:252) it is evident that small business owners lack
certain managerial skills such as financial management, marketing and human
managerial skills to operate their businesses successfully. The research of
Scheers and Radipere (2007: 1) confirmed that SME owners are in need of
support services and that they are constrained by financial as well as non-
financial factors such as lack of education, inadequate technical skills, poor
access to markets, lack of information and unreliable infrastructure. The
research established that the lack of managerial skills has a negative impact on
the success and viability of small businesses.
To summarise, the following can be cited as the reasons why SME’s fail:
• lack of certain managerial skills and managerial weaknesses
• owners’ lack of underlying appreciation of business fundamentals
• the manner in which advice is given
• inadequate financial management practices and the lack of actual financial
advice given
• cash-flow problems
• the role of competition
• insufficient demand for products/services
• market imperfections
• economic uncertainty
• crime
• corporate tax rates
• labour relations
• failure to seek competent advice
• lack of knowledge resources, skill fits and educational input
The unemployment situation in South Africa has forced government to focus
some of its attention on the issue. One way of addressing this problem was to

62
support SMEs and entrepreneurship in the hope of solving at least part of the
problem. Government has implemented some initiatives over the last few years,
but in general, these have not had the desired results.
Apart from government assistance there are also other types of assistance for
SME owners. The assistance falls mainly under the following categories: legal
assistance, accountants, banks and business consultants. The question can be
asked whether assistance by attorneys, accountants and banks really contributes
to the success of the business, because this type of assistance does not focus on
the core business and the management thereof. The results of this, especially by
business consultants, are rarely published and are therefore not well known.
2.10 OTHER GENERAL PROBLEMS IN THE DEVELOPMENT OF SMEs
“Given the historical devastating consequences of white supremacy capitalism in
the economic destruction of black people, philosophical and ethical issues have
been raised as to whether capitalism should be the basis for the future economic
uplift of Blacks” (Walker, 1995:18).
Regarding the issue of which economic system should be used for developing
SMEs, Vosloo (1992:5) reports that a growing number of public policy analysts
believe that free markets most fruitfully employ economic resources and that
SME entrepreneurship flourishes best when free markets are allowed to function.
These analysts are therefore sceptical about the effectiveness of government
intervention and public expenditure to achieve economic growth.
Mutharika (1992:3-5) refers to the large numbers of failures of new businesses in
Africa and lists the following as factors contributing to these failures:
63
• No enabling environment is created for the indigenous private sector to
survive. Although this is improving, government policies are often too
restrictive or even hostile to SMEs.
• There is little access to start-up capital and operational cash.
• There is a lack of proper business strategy and planning. Technical and
managerial skills are often non-existent.
In a more recent survey, Sherwin (2005:1) reported that eight out of 10 start-up
companies in South Africa would eventually fail. The author also mentioned
obstacles such as outdated plans and technology that could double the time or
money taken to break even. Poor management needs to be looked at as a
problem because management is often a major shareholder in a new business.
The required skills change quickly in the first few years from being an inventor to
managing people and networks and also making international deals.
Entrepreneurs usually do not possess all these skills and have to acknowledge
the fact that they need professional management assistance. Management can
get bogged down with the day-today business and not see the pitfalls by having
an overarching view of the business. Venture capitalists should also realise that
start-up companies not only need money during the start-up phase, but also at
different stages after that. This however, must be looked at and managed
carefully. The time comes when investors have to realise that the business is
simply not working and give up.
With all these regulatory and other matters regarding SME development in mind,
the role of government is probably more important than before if it wishes to
make a difference. Although government has been involved all the time, its focus
needs to be redirected to those issues that will change the environment to meet
the needs of SMEs.

64
These days, SME owners in South Africa have numerous challenges to
overcome. Timm and Terblanche (2006) compiled the following list of most
burning issues that business owners face today:
• A lack of business skills. This is because of a poor education system and
little or no culture of entrepreneurship.
• A lack of finance. Financial institutions will only lend money to low-risk
clients and the cost of banking is high.
• High costs. The cost of raw materials and telecommunications is high.
• Poor skills of employees. The government skills development system is not
assisting SMEs.
• Bargaining councils. They have become huge conspiracies in which
smaller businesses are crushed.
• The CCMA. Time is wasted because employees can take their employers
there for the smallest whim.
• Black economic empowerment. Businesses are still confused by the
multitude of criteria set out in the codes. Many owners also pay consultants
huge sums of money to obtain ratings they do not yet require.
• Crime. Stock theft as an example obviously has a negative effect on some of
the SMEs.
• Exposure. Business owners do not portray themselves well.
The following concerns about the growth and development of SMEs were also
identified by Roux (2002:48), Lewis (2001:26-30) and Sherwin (2005:1):
• The smaller the enterprise size-class, the less significant as an employer it
tends to be in most sectors, but more significant in the construction and retail
trade.
• There are still substantial interprovincial inequalities in terms of economic
performance, job opportunities and poverty.

65
• As the enterprise size-class increases, the percentage owned by Asians,
coloureds and Africans decreases, meaning that most larger enterprises are
owned by whites.
• There is a predominance of African female ownership in certain sectors that is
welcomed, but most of this involvement is in the survivalist or micro-
enterprises. By definition, the wealth and employment generated here are
constrained.
• Ownership constraints are particularly severe for entrepreneurs (especially
women) in rural areas.
• Low-wage competition is discouraged by legislation, thereby discouraging
labour intensive activity.
• There is a small customer base.
• Interest rates are high and there is limited or no access to capital.
• There are insufficient government contracts and weak support programmes.
• International trade is limited.
• Plans and technology are outdated.
• Management skills are inadequate resulting in poor management.
Research shows that the problem is not only one-sided, but that the three role
players, namely the government, the consultant and the business owner also play
a part in the process of interventions.
Mantle et al. (1992:2) indicate that historically, government failed to promote
small business. Although there was talk of financing small business, providing
training was a more urgent need. At that time, many organisations were
providing training to small business owners such as non-governmental
organisations (NGOs), universities, technikons, development agencies, financial
institutions, large corporations and private organisations. There was, however,
no coordination between these interveners and the NGOs.

66
The training provided was mainly in the technical areas of business such as
finance and bookkeeping. Little or no training was provided in the areas of
marketing, market analysis and opportunities. They realised that training courses
should be designed with input from the business owners, the courses needed tot
be practical, and account for the user’s levels of education, and the trainers
should be able to visit and consult businesspeople on site (Mantle et al., 1992:2).
Today there are many government initiatives to assist SME owners, and once
again the 2007 budget made some positive adjustments regarding monetary
issues (Manuel, 2007). The South African government has committed itself to
the promotion and growth of SMMEs.
It is clear from the literature that there are many different factors hampering the
development of SMEs in South Africa. The problem is not simple and all the role-
players, including government, business owners/managers and the providers of
assistance, are part of the problem. Government needs to take care of creating
an environment with less regulation. Business owners/managers need to be
trained and assisted to acquire the needed skills, especially management skills.
Finally, the providers of assistance need to assist the businesses in such a way
that will hopefully enhance the success rate of SMEs in South Africa.
2.11 THE ROLE OF THE SOUTH AFRICAN GOVERNMENT (1994-2006) Sikhakhane (2005:1) reports that SMEs create more jobs than large enterprises
because they use more employees per unit of output. SME supporters also argue
that small businesses increase levels of competition in the economy. This again
benefits consumers because it usually causes prices to decrease and increases
the number of different goods available to them. SMEs are more productive than
larger ones but their development and progress are limited by the lack of financial
suppliers and other institutional failures. There is a belief, not only in South Africa

67
but also in the World Bank and other international aid agencies that SMEs can
contribute to economic growth and the reduction of unemployment. These are
some of the points that government is using to justify its direct support for SMEs.
The DTI White Paper of 1995 outlines a seven-step process leading to the
implementation of an SMME support strategy. It proposes a process of
consultation, study, training of staff and establishment of an SMME support
structure to redress the SMME capacity deficit.
After 1994 the government of South Africa was confronted with the dual
challenge of reintegrating the country into the global economy as well as
positioning itself to deal with the challenges of the new democratic order. With
the objectives of economic growth in mind, the government started promoting the
development of SMMEs. The main objectives were to generate employment,
redistribute income and become globally competitive (Rogerson, 2004:765).
A hierarchy of importance had to be assigned to each of the policy objectives in
order to decide on the distribution of resources. The government’s SMME
strategy sought to meet this range of different and sometimes conflicting
objectives. The main institutional support pillars for implementing the strategy
were Ntsika Enterprise Promotion Agency, which was responsible for non-
financial or business development services and Khula Enterprise Finance which
functions as a wholesale finance institution. This support was to be focused on
improved and decentralised access to information, training, markets, finance and
technology, improvements in business structure and the market environment and
the strengthening of networks between the enterprises. Part of the support
strategy was the establishment of a set of decentralised or localised service
centres (LSCs), which later became local business service centres (LBSCs).
They were to provide relevant services to SMMEs. By 2003, the number of
LBSCs in South Africa had risen to 92. Another support structure that was
established was the set of tender service centres that were to provide, among

68
other services, advice on tendering and tender guidelines and procedures. The
last public sector support structure that was established was the Manufacturing
Advice Centres (MACs). By 2003, 16 MACs had been established, their main
objective being to assist SMME manufacturers in improving their
competitiveness. Other newer support institutions were put forward by the DTI
such as local industrial parks (LIPs) and business incubators. The government
also tried to nurture an enabling environment to support the sustainability of the
SMME economy (Rogerson, 2004:766-768).
Rogerson (2004:768-781) evaluated the outcomes and impacts of these
programmes and found the following:
• Because the statistics and data surrounding the SMME economy are dismal,
it is extremely difficult to, say, make useful deductions or assumptions when
the figures of Stats SA and Ntsika differ substantially.
• Comparing the data with pre-1994, it can be said that positive progress
regarding SMME programmes has been made. An assessment by the World
Bank in 1999 also remarks positively in terms of progress. Bloch and Daze in
(Rogerson, 2004:769), also remark that in the early 1990s there was simply
no existing public SMME support infrastructure for the country.
• Regarding the creation of employment, the contribution of SMMEs to national
employment remains low for at least the following reasons:
- SMMEs try to compete with larger enterprises instead of complimenting
them, say, with specialised products.
- The majority of them lack the dynamism to expand beyond one-person
concerns.
- SMMEs have adopted a strategy of jobless growth. The bulk of
employment is likely to emerge from new microenterprise formations.
• The SMME economy can be a positive factor in contributing to poverty
alleviation. It is not necessarily because of the government programmes but
because of a default option for households and survivalists where other
69
initiatives to alleviate poverty did not work. It has further been argued that the
current support programmes offer little in the way of support for survivalists,
women entrepreneurs and rural SMMEs.
• The broad conclusion regarding empowerment is that too few black SMMEs
are reached, too little funding is available, too many centralised top-down
programmes are considered by the delivery mechanisms and delivery is felt to
fall short of promises, let alone expectations. The number of BEEs with
access the DTI incentives is still unacceptably low.
• All groups have not benefited equally. A large percentage of the clothing
industry, for example, uses SMME programmes. The needs of emerging
SMMEs are poorly met and supported, while exporting or high-growth SMMEs
make more use of these programmes. Urban-based SMMEs have been the
prime beneficiaries in terms of their access and awareness of the support
programmes. Finally, financing is mainly directed at white-owned enterprises.
• Funding allocation is biased in the sense that emphasis is given to SMEs
where white ownership is dominant and not to microenterprises and the
informal economy where previously disadvantaged entrepreneurs are most
important.
• There is also a lack of access to support services. There is a general mistrust
of external support agencies as well as an incapacity to raise awareness by
support institutions about their existence and effectiveness. There also
seems to be an uneven geographical distribution of service providers. The
cost of accessing services is high and the often cumbersome and changing
administrative procedures frustrating.
On the negative side, Sikhakhane (2005:1) reported that a study by three US
economists (Thorsten Beck, Asli Demirguc-Kunt & Ross Levine) suggested that
there is growing evidence that the contribution made by SMEs is overstated and
do not enhance economic growth or create jobs. Also, SMEs do not create better
quality jobs than large enterprises. SMEs are usually created as a last resort and
not as a first choice of employment and therefore have limited growth potential.

70
Evidence is also inconclusive about SMEs being more innovative than large
firms. It is said that large companies may exploit economies of scale and more
easily undertake the fixed cost associated with research and development.
2.11.1 South African government policy interventions
In March 1995, President Nelson Mandela convened the first President’s
Conference on Small Business in Durban. At that time, the government had
committed itself to creating an environment in which SMEs could flourish and
which would encourage the development of an entrepreneurial culture. To this
end, the government established a number of initiatives to stimulate the SMME
sector.
In December 1995 the National Small Business Enabling Act was gazetted. This
created a national framework for SMME support. The framework included the
following:
• the creation of Ntsika Enterprise Promotion Agency (Nepa) – to implement
support strategies in South Africa
• Business Development Services (BudS) – a unit of Nepa to develop and
implement support services to SMMEs
• Local Business Service Centres (LBSCs) – to provide the first tier of generic
business services to SMMEs
• Manufacturing Technology Centres (MTCs) – to render sector-specific
targeted assistance to small manufacturing firms from disadvantaged
communities
• Tender Advice Centres (Tacs) – established only in 1997 to assist SMMEs in
completing the requirements for tendering for government and parastatal
procurement
• BuDS Information and Networking Programme – to provide greater access to
information

71
• National Small Business Council (NSBC) – to provide policy support and a
voice for SMMEs in government
The SBDC and Khula Enterprise Finance Limited, two government-supported
financial institutions, were to provide financial support. Henceforth, the SBDC
would only provide for-profit equity and loan capital for small and medium
enterprises, while Khula would indirectly interact with SMMEs to render its loan
services (Toomey, 1998:95-98).
Owing to the history of South Africa, it is necessary to look at the development of
the SME sector from two perspectives. Because of racial inequalities after the
1800s, the history of “black business“ differs from the history of “white business“.
The business activities of blacks, however, remained virtually obscured from the
historical record (Walker, 1995:13).
SME support policies go back to the early 1960s with the establishment of
homeland development corporations. After 1948, government departments and
supporting institutions were established along racial and ethnic lines. It was only
after the 1994 elections when the ANC party took office that this started changing
and new and non-racial SMME business support programmes and institutions
could be designed (Van der Merwe, 1995:1)
Roux (2002:33) indicates in Ntsika’s annual review that SMMEs play a vital role
in economic development enabling people to meet their basic needs for survival.
It has also been proven in many countries that the SMME sector stimulates
economic growth, redistributes wealth and creates jobs.
Lewis (2001:30) identified policy stability, lower interest rates, education and
training and promoting SMME in public service as the main factors that
government could do to assist SMME growth.

72
Today one may well ask whether government policies are in place to capitalise
on these advantages.
2.11.1.1 Small business and entrepreneurship as a government initiative
In his opening speech at the Second National Conference on Small Business on
5 November 1997, Mr Nelson Mandela referred to the legacy of neglect and
suppression of black business interests. He said that the effects of the past still
continued and that we should deal with them. Apartheid had not only robbed
many blacks of their livelihoods, but had also deprived the entire nation of critical
job creators, robbing itself of a pool of creativity and drive. He stated that the
inherited obstacles such as low levels of education and training, barriers to
markets, inaccessible finance and lack of support institutions had been dealt with
in the foregoing two-and-a-half years and that a foundation for developing the
SME sector in South Africa had been laid. Government had ensured that
parastatals and government departments would make an effort to cooperate with
SMEs and even with insufficient finance and imbalances still to be overcome,
many gains had been made (Mandela, 1997).
During 1996 and 1997, many new institutions were set up to address the
obstacles and implement government policy. Although their services had not
reached all the corners of the country, many small enterprises had found these
new services valuable for expansion. Local Business Centres were also
established to give advice and assistance to SMMEs in all areas, even the most
remote. This was part of the government’s assistance scheme, but it was never
really that successful.
At that stage, a crucial phase in the development of SMEs was reached. The
suggestion was that local government and business build a lasting relationship
benefiting both. Local government was to provide education and training, simplify
tender procedures, promote access to finance and promulgate by-laws that would
be fair and conducive to the prosperity of informal and formal business.

73
During the budget speech in 2001, the South African government acknowledged
that it was committed to the promotion and growth of the SMME sector. Its aims
were to increase the number of new ventures and create an enabling
environment to ensure the survival and growth of SMEs.
Since the new government came into power in 1994, they have been promoting
the development of SMMEs in South Africa, mainly to create jobs, redistribute
wealth and become globally competitive. They created support entities such as
Ntsika and Khula and tried to create an environment to support the sustainability
of SMMEs. Although some positive progress has been made, their contribution
to employment has remained low for different reasons.
The Centre for Development and Enterprise (CDE) stated in a media release on
12 July 2004 that the government’s support for entrepreneurship in South Africa
had been largely misdirected and it was time to accept the failure of the current
approach. The costly new bureaucracy aiming to deliver finance and skills
training to emergent entrepreneurs often missed the target (Bernstein, 2004).
2.12 THE CURRENT SITUATION
According to Schwenke, MD of Business Partners in (Anon, 2005a:40), there has
never been a better time for those considering the option of starting a business,
developing an existing one or doing a management buy-in or buy-out. South
Africa’s economy has proven to be stable and robust, and the growth projections
for 2005 and 2006 predict very well for entrepreneurs. The growing importance
of SMEs is clear, and SMEs currently account for about half of all people in
formal employment in South Africa. This is a remarkable achievement, given the
restrictions entrepreneurs face in this country, namely the real regulatory

74
restraints, the lack of finance and the difficulties in acquiring the appropriate
business skills (Anon, 2005a:40).
According to the 2005 Global Entrepreneurship Monitor (GEM) released by the
University of Cape Town, reasonable progress has been made but South Africa’s
entrepreneurial activity is still far lower than one would expect, given its per capita
income. Schwenke contends that one way to increase entrepreneurship in South
Africa is franchising. It offers an established brand name, infrastructure, support
systems, training and human resource management programmes. There are
also many different opportunities to meet every need, from fast-food franchises to
car fitment centres. In conclusion, he comments that the future of business and
economic growth lies with entrepreneurs and SME owners as large enterprises
restructure and downsize (Anon, 2005d:40).
As indicated in the report of the 2004 SME survey led by Goldstuck (2005:1),
SMEs in South Africa are alive, well and regard themselves as highly competitive.
However, few SME owners give the government credit for their initiatives and
efforts to promote SMEs. He also assumes that given the amount of resources
being ploughed into SME development, the situation reflects poor communication
rather than poor strategy. The survey also shows that less than half of the SME
owners were positive about legislation, the impact of skills development
programmes and the impact of BEE, the latter having more negative than positive
scores. A low 12% positive rating was given for the impact of general
government incentives for SMEs. Because of the many neutral responses (a
quarter to a third) on most issues, government has an opportunity to use
communications to change perceptions (Goldstuck, 2005:1). (Although this
source is not so reliable, it was the only place the researcher could find the SME
Survey 2005: Executive Summary.)

75
2.13 CONCLUSION
Schumpeter (1934) and other authors concur that economic development can be
directly attributed to the level of entrepreneurial activity in a country. More
recently, Roux (2002:47-48) observed that SMMEs in South Africa continue to
make a substantial and ever-increasing contribution to economic activity and
employment.
More recently, many authors such as Bernier (2005:540), Pansiri and Temtime
(2008:251), and Lewis, Massey, Ashby, Coetzer and Harris (2007:551-552)
reported on the importance of SMEs and that small business was seen as the
essential condition for economic growth.
SMMEs also tend to be less capital-intensive than larger enterprises and this is a
useful situation in a country in which there is a shortage of capital and a surplus
of labour (Roux, 2002:47-48).
To ensure that successful entrepreneurial activity contributes to economic
development, government and other role players should create an enabling
environment for entrepreneurs, and provide effective entrepreneurial education
and relevant training and assistance.
Although different role players are offering assistance in many areas, there are
still many failures. This indicates that the type of assistance is inadequate,
irrelevant or not given when needed. The following chapter will focus on the
assistance provided, types of assistance and the impact of this on the success of
SMEs.

76
CHAPTER 3 BUSINESS INTERVENTIONS IN SOUTH AFRICA AND OTHER COUNTRIES
3.1 INTRODUCTION
According to the literature researched it is generally accepted that the failure rate
among SMEs worldwide is extremely high. Furthermore the impact of the SME
development programmes on performance has been less than satisfactory
(Hallberg, 1999:1) and despite efforts by the South African government to
establish a support structure for the SME sector, to date these efforts have not
met with much success (Erwin, et.al., 2003:13).
There are many reasons why SMEs fail, but the main reasons for failure all have
to do with management in some way or another. These include a lack of certain
managerial skills, lack of underlying appreciation of business fundamentals,
inadequate financial management practices, cash-flow problems, labour
relations, lack of knowledge resources, skill fits and educational input.
Seeing that management is the main reason why SMEs fail, the researcher will
briefly refer to the definition of management.
Management refers to a number of issues, such as the people (for example the
CEO and other executives) and also the tasks and activities that managers do
(for example planning, organising, leading and control). These management
tasks and activities are done by different people in different jobs, even if that is
not their main focus. The functional managers, for example the financial,
marketing and human resources managers are all involved in managing their
respective sections and their management function surely includes planning,
organising, leading and control (Hellriegel, Jackson, & Slocum, 2005: 7-8).
77
Herath (2007:896) defines management as the process of using organisation
resources to achieve organisational objectives through the functions of planning,
organising and staffing, leading and controlling.
According to Rossouw and Louw, (2005:16), management is also the “art of
getting things done through people”. This means that the organisational goals
which have been set can only be achieved by getting other people to perform the
tasks rather than managers performing the tasks themselves. Management can
also be described as the process of planning, organising, leading and controlling
human and other resources to achieve the goals of the organisation. This
definition includes the additional management functions and tasks, i.e.
coordinating, disciplining, delegating, communicating and motivating (Rossouw &
Louw, 2005:16-17).
There are many definitions of management, but for the purpose of this study the
researcher will use the definition given by Rossouw and Louw, (2005:16):
“Management is the process of planning, organising, leading and controlling
human and other resources to achieve the goals of the organisation.”
Although management is the main problem leading to SMEs failure, it is not the
focus of this study. Managers/owners of SMEs need assistance and this study
focuses on the effect of assistance or business interventions on the perceived
success of the SMEs.
The remainder of this chapter will focus on business interventions in South Africa
and other countries.
There are many consulting institutes, agencies and consultants that render
assistance to businesses. This assistance covers many facets of business and
its environment all over the world. Some of these include the Small Business
Administration (SBA) in the USA, the Association of Independent Consultants

78
(AIC) in Canada and the Institute of Management Consultants (IMC) which is
found in many countries, including South Africa. The IMCs are all part of an
international network of professionals enabled through the International Council
of Management Consulting Institutes (ICMCI).
The aim of all these bodies and individuals is basically the same worldwide,
namely to assist small business owners in different ways to survive and be more
successful.
In this chapter the different concepts associated with interventions will be defined
and an overview provided of the different types of interventions and programmes
generally available. Interventions in other countries around the world will also be
discussed as well as the establishments, bodies, parties, agencies, centres,
associations and individuals that offer assistance to small business owners.
Finally, the South African situation will be discussed with specific reference to
government, professional and other types of assistance offered to SMEs.
3.2 DEFINITION OF CONCEPTS
3.2.1 Consulting
Consulting contributes situation-specific knowledge. Consulting requires that the
provider should know the particulars of the customer’s business. Strategy
consulting (also called management consulting) is the service of providing advice
to those in charge of running a business. Strategy consulting improves business
performance by identifying opportunities/problems and formulating plans for
capitalising on that knowledge Pleva (2006:8).
Consultants act as advisers to business owners in all sectors of the business
environment. Consulting service providers started thinking about the problem of

79
small businesses with the question: “What problems do businesses face and how
can we solve them?” Framing the issue in this manner led to a two-step solution.
Providers first identified small business constraints, and then directly provided
corresponding services. Following this thinking, they provided strategy consulting
services which are usually referred to as “technical assistance” (Pleva, 2006:12).
3.2.2 Training
Another type of intervention is training. It provides a widely applicable skill and
can be administered in a relatively anonymous classroom setting. Consulting
and training are often bundled together when provided by donors (Pleva, 2006:8).
Training is the systematic and organised process through which the employee (the
business owner in this case) acquires the knowledge, skills, attitudes and
information necessary to achieve the objectives of the business. The aim of training
is to influence and change owners’ working habits and levels of performance in
such a way that they will become more productive (Marx, Van Rooyen, Bosch &
Reynders, 2001:488-490). Training is therefore directed at tasks that are in line
with the objectives of the business. Training is provided by a number of different
institutions, bodies and qualified persons.
3.2.3 Supporting
Intervention by supporting the small business owner could include many things.
It could be to provide the owner with whatever is needed, including money,
necessities, advice, knowledge and anything that would enable the
businessperson to start, maintain or grow the business.
3.2.4 Adviser
A true business advisor is someone to whom business owners look when they
have to make major financial decisions (Weinstein, 2004).

80
A trusted business advisor is accessible for assistance and advice whenever
needed, does what it takes to get the job done, including follow-ups, offers
innovative and creative solutions and helps business owners to figure out how to
help them achieve their goals (Pallais & Good, 1996).
3.2.5 Mentor
Although the Oxford dictionary defines a mentor as an experienced and trusted
adviser, the small business field defines a mentor as a business professional who
is connected with the small business owner in a mentoring relationship. The
mentor is an individual, usually older, always more experienced, who helps and
guides the small business owner in starting, managing and/or growing a business
(Reh, 2006).
The Institute of Business Advisers in South Africa (IBA) sees mentoring as an
ongoing, long-term business counselling relationship between an experienced
business advisor and client which covers a diverse range of topics as a business
develops (IBA, 2001:1).
Mentoring is a process in which “an experienced veteran helps to shape or guide
a newcomer”. It is also seen as someone “who helps another person become
what the person aspires to”. Literature further suggests that mentorship is the
relationship existing between a mentor and his/her “prote´ge´” where the former,
via sharing his/her experiences, acts as a guide to the newcomer in the
organisation (Kakabadse & Louchart, 2006:418).
Although there are a number of definitions for mentoring, most of them mention
the words long-term relationship, where skills and development are shared and in
which certain abilities are acquired (Watson, 2004:60).

81
3.2.6 SME life cycle
SME life cycle refers to the succession of stages a business goes through during
its time of existence. For the purpose of this study, the business life cycle as
described by Nieman, Hough and Nieuwenhuizen (2003:238-240) was used as a
reference. The different stages described in this cycle are
• start-up or infancy stage (the small business owner starts a business by
manufacturing or introducing a new product or service)
• growing or breakthrough stage (the rate of growth accelerates and resources
are under pressure)
• mature stage (products are likely to be established and sold through multiple
distribution channels)
• declining or rejuvenation stage (decline is not inevitable, but the owner needs
to be aware of signs of decline in order to rejuvenate the business)
3.3 VARIOUS TYPES OF INTERVENTION STRATEGIES
Initially, providers categorised consulting as a “non-financial service” and
provided the service directly. In the late 1990s non-financial services were
renamed “business development services” when markets were promoted instead
of providing services directly. More recently, the focus seems to have shifted to
particular problems discovered during the business development era (Pleva,
2006:11).
Government interventions to promote SMEs focused on the provision of credit
through various means such as direct lending, subsidised interest rates and
credit facilities often supplemented by guarantee schemes through banks and
other financial institutions (Hallberg, 1999:9). Another intervention strategy
discussed by Hallberg (1999:10-11) focuses on increasing SME access to

82
markets, on the inputs used by SMEs (such as information and technology) and
on the diverse range of services (financial and non-financial) that support SME
growth and competitiveness. This shifts the focus from direct provision to the
development of markets and networks.
Howard and Hine (2000:4) mention different and specific types of assistance that
could be rendered to small businesses, including financial assistance, taxation
incentives, information and advice, management education and training, export
incentives, government regulatory policies and government procedure
programmes.
As early as 1966, the United Nations attempted to systematically organise
assistance measures for small business. They compiled a list of “measures”
taken by member countries. According to Howard and Hine (2000:3-4) this list
included the following measures:
• consultancy services that disseminate information, give advice and assist with
management
• finance via specialised banks and loans
• training programmes in costing, organisation, management, productivity, etc.
• marketing assistance
• common facilities for setting up facilities
• industrial research for business planning support, information services and
technology research
Studies conducted in the 1980s attempted to group assistance measures into the
four categories of financial assistance, technical assistance (including the choice
of equipment), training (including inventory management skills) and social
promotion (promoting a social environment supportive of entrepreneurship)
(Howard & Hine, 2000:4).

83
During the next decade, assistance measures were grouped into the internal
environment, including the skills of the owner and the external environment (the
marketplace). Meridith and Howard (in Howard & Hine, 2000:5) propose the
following four generic forms that provide small business assistance measures:
• education and training providers
• consulting and business advisory centres
• resource providers
• a combination of the above three
Howard and Hine (2000:13-17) suggest a small enterprise environmental matrix
to show what type of assistance (referring to the above three measures) should
be sought in which circumstances. They use the internal environment (with a
weak to strong axis) and the external environment (with an unsupportive to
supportive axis) to determine the need for training and for resources.
The literature referred to by Howard and Hine (2000:6-7) suggests that
interventions require a diagnostic phase (needs analysis) before any
recommendation and implementation. The latter could include a relevant training
programme.
The literature also suggests that small business owners receive many types of
support. These include accessing mentoring, networking, funding and structured
training. In a survey conducted in Ireland and the Netherlands, networking was
the most cited support, followed by funding and mentoring (De Faoite, Henry,
Johnston, & Van der Sijde, 2004:444).
Outsider assistance programmes that seek to support the entrepreneurial
activities of young people exist worldwide and include Entreprep, YESS!Mini
Society, Junior Achievement International (USA), Atlantic Canada, Youth
Business Initiative (Australia) and Law 44 (Italy) (Greene & Storey, 2001).

84
Online training is another form of assistance found in many countries, including
South Africa. The research results of Webster, Walker and Barrett (2005:248)
indicate that those small business employers with aspirations towards business
growth and who are existing Internet users are more likely to participate in online
training than those without growth aspirations. The “virtual assistant” is also
available on the Internet where many consultants advertise their services to
businesspeople. These are mostly administrative services and include
bookkeeping, typing, secretarial, scanning, diary management, time
management, office and even home organising (Virtual Assistant, 2006). The
SME toolkit is also available on the Internet and offers free business
management for SMEs in accounting, finance, business planning, human
resources, marketing and sales, operations and IT. It offers, inter alia, “how-to”
articles, free business software, online training, self-assessment exercises and
resources to help entrepreneurs in Africa to start, finance, formalise and grow
their businesses (SME Toolkit, 2006).
Many countries, including South Africa, supply monetary assistance to promote
small business development. The budget speeches of 2006 and 2007 made
some positive adjustments regarding monetary issues to promote small business,
but no other form of assistance was mentioned (Manuel, 2006 & 2007).
In the 2007 budget speech, agencies and entities falling under the DTI received
an amount of R1.7 billion to promote industrial development, black economic
empowerment and small business development. It was also mentioned that
entrepreneurship remained a vital ingredient in the growth of the economy. The
only other form of assistance that was mentioned was the small business tax
amnesty that offers those outside the system a new opportunity to become
compliant and benefit from the myriad of support measures offered by
government (Manuel, 2007).
85
One should bear in mind that the lack of micro credit is not the main constraint in
small business development and that there is an increasing shift towards the
recognition of non-financial constraints such as the lack of information,
management and business skills (Jackson, 2004:1). The same author also notes
that the business development services (including services designed to help the
business start, survive and grow) have not been developed as much as the
financial services, and do not have a comprehensive set of good practice
principles such as the financial services. There is also a trend towards focusing
on a smaller number of services and referring clients to specialists for specialised
support where possible (Jackson, 2004:8-11).
Consultants usually cost small business owners huge sums of money. Hamilton
and Smith (1993:17-18) suggest that when a consultant is involved, the client and
not the consultant should invest heavily in the time spent in order to mould the
programme to the client’s style and to enable the client to assume ownership.
Ultimately, the client will want to wean himself/herself away from the consultant’s
help, because the latter’s time costs the small business money. Hence the right
strategy for a small business is to use the consultant in an advisory, overseeing
and monitoring role rather than in hands-on work. For this type of approach to
remain effective the consultant should follow up frequently and give feedback.
The consultant should take responsibility for keeping on top of the project. The
idea is to invest only a little of the consultant’s time on each occasion. Quick
visits and phone calls work well.
Intervention strategies as described in this section consist of the provider, the
type of assistance provided and the method of providing the assistance. Some of
the providers mentioned are the government, consultants, monetary institutions,
advisory centres and resource providers. There are also various types of
assistance that are provided such as credit/finance, tax incentives, other
incentives, information, advice (on any business related issues), education,
training and supplying common facilities for setting up business. Finally, the

86
assistance described here is provided through personal mentoring, networking
and training (including online training).
Research done in manufacturing SMEs in the UK indicated that formal training
(including qualification courses at Universities/colleges, formal courses by outside
providers, distance learning courses, formal in-house courses and Internet-based
courses) is shown to be more significantly associated with performance than
informal training (including coaching, informal training seminars and networking).
While managers may perceive that informal training is more relevant, this study
highlighted the importance of targeted, formal interventions to specific problems
(Jayawarna, Macpherson, & Wilson, 2007: 334-335).
3.4 ASSISTANCE AND INTERVENTIONS IN OTHER COUNTRIES
This section looks at examples of assistance, interventions, advisers and related
issues in the USA, UK, Europe (Ireland, the Netherlands, Spain & Germany),
Brazil, Australia, China and Asia, and Swaziland, Botswana and Malawi in Africa.
3.4.1 The USA and Canada
The SBA was officially established in 1953, but its philosophy and mission
originated earlier in a number of predecessor agencies. It started mainly as a
response to the pressures of the Great Depression and World War II. In 1932
President Hoover founded the Reconstruction Finance Corporation (RFC) to
alleviate the financial crisis of the Great Depression. This was the “grandparent”
of the SBA. It was basically a federal lending programme for small and large
businesses affected by the Depression. The Smaller War Plants Corporation
(SWPC) was created by Congress in 1942 to assist small businesses to
participate in war production and to enable them to compete with the large
industries. It provided loans to entrepreneurs, encouraged credit availability to

87
them and supported their interests to federal procurement agencies and large
businesses. After the War, the SWPC was dissolved and its lending and contract
powers handed over to the RFC. Even during this period, there was a problem
with small business failure. The lack of information and expertise was believed to
be the main cause. The Office of Small Business (OSB) produced brochures and
conducted management counselling for individual entrepreneurs. The RFC was
abolished by President Eisenhower in 1952, and the SBA created to continue the
functions of the earlier agencies. Since then, the SBA has grown in terms of total
assistance provided and its array of programmes tailored to encourage small
businesses in all business areas (SBA, 2006).
Since its establishment, the SBA, has supported several consultative
programmes such as the Service Corps of Retired Executives (Score), Small
Business Development Centers (SBDC) and the Small Business Institute (SBI)
(Jones, Vaught, Timmerman & Trewatha, 1990:2).
Score has been extremely effective. Because 80% of its clients are start-ups, it
makes use of monthly workshops to meet their needs. Most of the clients state
that they would recommend the service to a friend starting a new business, and
nearly two-thirds of them would recommend Score to friends with existing
businesses in order to correct present problems. A study presented a positive
picture of the ability of Score to correctly identify the problems and concerns
faced by business owners and to provide the advice needed by the owners to
solve problems effectively (Jones et al., 1990:2-3).
In the areas the respondents thought the various consultants would provide the
best service, the SBDC was noted as being ideal when the business is young or
first starting out. Another strong point is its ability to provide quality help with
financial records as well as assisting with management problems (Jones et al.,
1990:3).

88
The private consultant, however, was seen as being particularly helpful in finding
sources of credit and capital. This group also scored high on advertising,
international selling and help with financial records. Starting a business,
however, was not regarded as a particular strength of the private consultant
(Jones et al., 1990:5).
The results of this study support the suppositions that the use of consultants in
the workplace is vital for the success of many business firms. Careful
consideration of the problem to be solved, however, is important in the choice of
consultants. There is always the need to properly assess potential client
problems in determining whether consultants can provide the necessary aid
(Jones et al., 1990:6).
The USA has recognised the importance of providing training, counselling and
advice. They have pioneered mentoring programmes, utilising retired
businesspeople to assist new businesses with managerial and technical advice.
They have also established venture capital forums that bring together
entrepreneurs and potential investors. The trend in recent years has been
towards combining available support mechanisms to offer a more comprehensive
integrated package of support for start-up companies. For example, they provide
on-site assistance, gather and channel funding sources and adopt an
entrepreneurial approach to service delivery (Madell & Adam, 2002:8). Gavron
(in Madell & Adam, 2002:8) recommends the provision of pre-start up advice and
training, encouraging a network of mentors and the promotion of best-practice
schemes.
A small business survey conducted in Northeast Iowa (USA) on the small
business consulting needs and opinions of consultants showed that the major
external problems were interest rates, inflation and taxes, while internal problems
were declining sales, cash flow and marketing. To overcome these problems,
small business owners indicated the following:

89
• This is necessary to maintain counselling seminars (being presented by the
SBDC) with the emphasis on basic marketing and advertising. This is to
alleviate the effect of external forces and to solve internal problems.
• It is essential to increase publicity to improve SBDC awareness and
emphasise the pragmatic nature of counselling.
• Although newsletters provide general information on tax, inflation and interest
rate issues, the small business owner needs practical tips on selling,
advertising and accounting.
• There is a need to utilise private consultants and management assistant
teams in conjunction with universities in order to complement one another’s
strengths and support one another’s weaknesses (Pelham, 1985:11).
In the same study, Pelham (1985:11) found that half of small business owners
cited internal problems as the primary cause of small business failure, while only
one-third blamed external factors. These owners suggested improvements in
management training. Other studies also seem to support the latter statement.
Regarding the effectiveness of consultants, some blame the lack of
communication in layperson’s terms from the academic community to small
businesspeople. Others say that the stereotype of consultants is often an
individual who is unable to understand the practical managerial issues and whose
consulting focus is strategic rather than tactical. According to the responses in
this survey, private consultants were ranked as “very effective” where university
sponsored consultants were second in the level of “very effective”. The main
reason for not using consultants was the belief that problems are best solved
internally.
Finally, the problem areas in which consultants were mainly used were sales and
marketing, followed by advertising/promotion, forecasting and budgeting. Studies
in Alaska and Wyoming indicated similar outcomes, where accounting and
marketing problems were the most common (Pelham, 1985:10).

90
According to the executive report of the London Development Agency (LDA,
2005), New York City has a Department of Small Business Services whose aim is
to promote small business development and entrepreneurship. It is coordinated
by NYC Business Solutions, which acts as a first point of access for information
and advice for small business. It was only launched in September 2004. There
are also specific funding programmes as well as assistance to access public
sector procurement and contracts for minority entrepreneurs and women.
Today in the USA, as in so many other countries, there are many consulting firms
available to SMEs for assistance. The services they provide include the following
(Business Consultants, 2006):
• start-ups
• budgeting
• productivity improvement
• helping business owners grow their business
• management assistance
• business strategy
• forecasts
• research services on new innovations, trends and trademarks
Entrepreneurial activity is the highest in the poorer countries of the world (such as
South Africa with an average US$3 750 per capita income), but appears to
decline as income per capita increases to between US$25,000-35,000.
Thereafter entrepreneurial activity increases as income per capita rises above
US$40 000 (such as the USA with an average US$40 000 per capita income).
The Total Entrepreneurial Activity (Tea) rate of South Africa was 5.4%, which is
well below the expected Tea rate, where the Tea rate of the USA was nearly
double that of South Africa (Orford, 2004:11-12). Here a positive relationship can
be seen between the Tea in the USA and the levels of consulting services as
described above.

91
In Canada, the Association of Independent Consultants (AIC) helps businesses
find specialists, experts and contractors in many fields. The AIC holds
educational networking meetings and workshops and the website has articles on
consulting, discussion boards and a searchable database of consultants. Is
caters for hiring, becoming and growing people as consultants (AIC, 2006).
3.4.2 The UK and Europe
3.4.2.1 The UK
The governments of most industrial countries offer “soft” business support (using
taxpayers’ money) including advisory assistance, the dissemination of best
practice, encouragement of partnerships and gateway services. The research of
Wren and Storey (2002:354) in the UK showed that the assistance provided in
this case had a significant positive effect on the survival of medium-sized SMEs
but a negative and insignificant effect on the smaller and also the larger SMEs.
Wren and Storey’s (2002:336-337) research focuses on the marketing initiative.
Marketing assistance had significant positive effects on turnover and
employment, especially on small SMEs, with less positive effects on medium-
sized firms and an insignificant effect on the sales of large firms. A marketing
strategy was given to the firms involved. They were also offered subsidised
advice in areas of promotion, pricing, distribution and after-sales service, and
market research on product demand, competitors and emerging markets. Most
of the projects involved were undertaken for the purpose of expansion.
The participants first had to apply for assistance. They were approved once a
business review had been carried out to assess the suitability for participation in
the scheme. A private consultant was appointed to assist the business, and
finally, the business had to decide whether or not to implement the

92
recommendations of the consultant. Government assisted in the form of offering
grants at certain rates (Wren & Storey, 2002:337-338).
Research by Keogh and Mole (2005) in the UK explored the changes in the role
of the public sector small business adviser. Previous studies have shown that
business advice offered to small businesses differs significantly from adviser to
adviser. In their findings, the researchers identified that the public sector adviser
would try to advise a wide variety of type of firms and mention that there are large
differences in skill levels, even with innovative SMEs. They suggest that there
are two sets of issues that are important for business advice, namely “technical
skills” (knowledge of finance, marketing and human resources for example) and
“soft skills” (professionalism, knowledge management and understanding the
process). Their paper implies that the adviser should emphasise the “soft skills”
at the expense of the “technical skills”. This research is still in process.
In another working paper by Akunuri and Nwankwo (2005) (also in the UK) it is
reported that a draft of business support programmes targeting the SME sector is
being formulated and implemented. The assistance programmes provided by
public sector are laudable but leave many unanswered questions. There seems
to be a need for more collaboration between business support providers and
SMEs.
Devins, Gold, Johnson and Holden (2005:540) attempted to develop a model for
managing learning in micro businesses. Although they refer to “micro business”,
these businesses would be classified as small businesses in South Africa. Their
paper highlights the lack of information exploring management development and
learning in the micro business as well as the lack of policy interventions that
connect with micro businesses. A key challenge lies in the ability to design
interventions that are cost effective and reflect the heterogeneity of micro
businesses. There is a need to design, develop, deliver and evaluate offerings
that are in tune with the interests of micro and small business managers. Closer

93
relationships between flexible assistance providers and the managers/owner
should provide the foundation to interventions.
A micro business by necessity has to interact with professional service providers
such as bankers and accountants. Devins, et al. (2005:544) suggest that these
providers could influence practice in micro businesses if they are in tune with the
interests of the micro business manager at a given point in time.
In another study done in the UK, Stumpf and Longman (2000:125) in Kakabadse
and Louchart (2006: 426-427), stress the importance of building a sound
relationship between the consultant and the client by making use of the following
phases: Firstly a “ready-receiver” who will be willing to invest time in conversation
with the consultant must be created. Then a common interest between the
consultant and the client must be developed. This common interest allows the
consultant to gain the respect of his client and appears even more credible. The
consultant gains a good understanding of the client’s business. Thereafter the
real and relevant customer needs must be identified. The consultant must build
trust to get the needed data from the client in order to solve the problems at
hand. A client’s willingness to share information depends on the consultant’s
ability to build trust. Gathering data is the key point of the success of a
consultancy project. A long-term relationship must be built and maintained.
3.4.2.2 Ireland and the Netherlands
In a survey undertaken in Ireland and the Netherlands, evidence suggests that
the Irish and Dutch rate supports such as mentoring, networking, training and
incubation space favourably (De Faoite et al., 2004:445). The entrepreneurs
studied in this case received support from a wide range of organisations including
government, trade associations and tertiary institutions. Networking and
mentoring were among the most frequently accessed informal supports and were
well received by these groups. Financing was mainly accessed during the start-

94
up phase of the business. However, the groups complained that the services
offered by the entrepreneurship support programme were not that effective in
practice or did not materialise at all. This could mean that the programmes were
not meeting the needs or that academics were not well suited to deliver
entrepreneurial support (De Faoite et al., 2004:445-447).
3.4.2.3 Spain
Research was conducted in Spain on the impact of the work done by external
consultants and the client’s degree of satisfaction. The only way to determine the
effectiveness of the assistance was to find out whether the recommendations of
the adviser had been implemented. The aim of the adviser is not only to draw up
a plan but also to set up a relationship with the client on the basis of mutual
collaboration so that the client learns how to resolve problems in the future. This
basically means training. The adviser should help the client to understand and
learn so that the client can be self-dependent in future (Soriano, Roig, Sanchis, &
Torcal, 2002: 100).
3.4.2.4 Germany
Germany focuses on the provision of research incentives, advice services and
financial assistance to promote set-up and developing businesses. The form of
assistance is geared to improving productivity and their ability to be competitive.
They also have adult education centres to assist business start-ups (Madell &
Adam, 2002:7).
3.4.3 Brazil and Mexico
Although this research focused on SMEs in remote areas in Brazil, it is still
interesting to note the results. The researchers indicate that there is a “hidden
demand”, which means that the small businesses need consultancy, but they do

95
not apply for the available services and are generally incorrect in their
assessments of the problems they have and how their problems should be
prioritised. After a diagnostic consultancy they are better able to evaluate
problems and make use of consultants more efficiently (Schwartz & Bar-El
2004:503). Other researchers have also found the diagnostic consultancy to be
as efficient in increasing the added value of existing business support
programmes in disadvantaged areas (Schwartz & Bar-El 2004:517).
The business-related difficulties that hinder small business development in Brazil
in this instance are management, business skills, marketing deficiencies, human
resources, development of external linkages and network relations, the
bureaucratic institutional environment and the inability of existing financial
institutions to cater for their needs (Schwartz & Bar-El 2004:505-506).
Finally, the business owners all have problems. Almost none of them made use
of the assistance provided by the public institution but almost all expressed a
willingness to make use of such assistance. The lack of access (in distance or
cost) was the most probable cause (Schwartz & Bar-El 2004:511-513).
The countries of Brazil and Mexico have also embraced SMEs as a potential
mechanism to create and distribute wealth. However, both these countries face
enormous social and economical challenges that have slowed down the
efficiency and effectiveness of SME support programs. These challenges include
very immature capital markets, bureaucratic regulation and technological
dependence (Rivera, 2007:161). Although there are many support programs, the
number of programs seems to make their operation and coordination very
difficult. Information is scattered and it is not known, for example, how much
money as a percentage of GDP is spent to support SMEs. Rivera (2007:144)
actually suggests that effective SME programs need to be created.
96
3.4.4 Australia and New Zealand
Small business is integral to the economic and social fabric of Australia and
account for 96% of all businesses in the country. Despite this, as in so many
other countries, the failure rate in Australia is also unacceptably high. Many
failures could be avoided by honing proprietors’ management skills. Many small
business owners indicate that government should do more to ensure that people
receive at least basic training in business management before they start a
business. They also request better access to business management and training
advice and continuity of access to business mentors and advisers (Campbell,
2003:8691-8692).
The Employment, Workplace Relations and Education References Committee
further recommended that the Commonwealth examine the feasibility of
establishing a national mentoring service for small business. Recommendations
include one-stop shops (delivering a wide range of services under one roof) for
government assistance, access to finance, and even the formation of an
indigenous small business association and improved arrangements for advice
and assistance for indigenous entrepreneurs. One of their main problems is also
the burden of complex government regulation, which entrepreneurs see as a
major deterrent to employment (Campbell, 2003:8692-8693).
Clegg, Rhodes, Kornberger, and Stilin (2005:219-223) researched the
characteristics and challenges of business coaching in Australia. Business
coaching is a form of organisational intervention and differs from managing
consulting and other forms of coaching by combining business planning with
facilitation techniques to assist clients in defining and achieving their goals.
Usually a third party from outside the business works on a one-to-one basis or
with small groups to diagnose the current business situation, elaborate on future
goals, identify resources and assess and plan for the process of achieving those
goals. Business coaches establish collaborative partnerships with their clients
97
and provide a process through which the client can solve their own problems.
This is a shift from institutionalised learning to informal work-based learning. This
is the first research project of its kind in Australia. Although business coaching is
still in the early stages of development, it is emerging as a potentially valuable
form of organisational intervention.
The Department of Business, Economic and Regional Development (operating in
the Northern Territory Government of Australia) offers a free and confidential
business information service to prospective, new and existing businesses.
Information is provided in areas such as business planning, insurance, licence
and permits, marketing, business structures, intellectual property, taxation and
sourcing finance. It also encourages business owners to make use of
independent business advisers for assistance because business owners tend to
become so immersed in their daily operations (Anon, 2006a).
Business Mentors New Zealand is a mentoring program in New Zealand. The
concept is centred on large and successful businesses becoming patrons and
business people becoming volunteer mentors. The mentoring sessions last form
1.5 to 2 hours and many of the mentoring relationships can be active for a
number of years (Anon, 2006b: 60).
A similar study to this one was done in New Zealand, exploring the business
assistance realities for SMEs (Lewis, et al., 2007:551-563). The researchers
found that:
• The owners or managers interacted with the assistance providers in different
ways, ranging from frequently and with regularity and purpose to infrequently
and only in response to a problem, stimulus or opportunity.
• The sources most frequently used were not necessarily perceived as being
the most useful and vice versa. (However, accountants were the one source

98
that the respondents contacted and made use of most and that they found
the accountants the most useful of the assistance providers.)
• Most of the respondents viewed their interactions as being for operational
purposes (short-term needs) as opposed to strategic purposes (long term
needs).
• Seeking assistance was not part of regular routine.
• The nature of interactions did not fall in any definite patterns related to firm
size or other characteristics. However, some similarities were noticed in
seeking assistance at a similar phase in the life cycle (being mostly at the
start of the business life cycle and then again at a more mature stage of the
business).
Other interesting facts regarding this study of Lewis, et al. (2007:564) were the
following:
• Not all SME owners will seek assistance.
• The time taken, the cost and the outcome of the interactions will influence the
perceptions of success and inclination to use that source again.
3.4.5 China and Asia
In Taiwan, Province of China, SMEs play a central role in the industrial and
export growth of the economy. Taiwan has a highly effective technology
extension and contract research service that has allowed it to exploit the inherent
flexibility of SMEs to meet the changing demand conditions and develop market
niches. Government-supported technological and scientific research institutes
have been indispensable in the high technological development. Over and above
this, the China Productivity Centre (CPC), the Industrial Technology Research
Institute (ITRI) and a number of industrial technology institutes covering different
industries provides management and technological assistance. These institutes
render assistance in the form of training, quality systems, technology

99
development and the acquisition of foreign technology. Some enterprises are
linked to research centres to solve complex technical problems. Government
also assists by encouraging private industry and partly funding contract research
to universities. The ITRI undertakes research considered too risky for the private
sector, and provides space and facilities for joint research and development
between its researchers and local business and for business incubation and
training facilities (Unctad [United Nations Conference on Trade and
Development], 1999:18-19).
SMEs are also promoted in Taiwan through the Centre Satellite Factory
Programme. It integrates smaller factories around a principal one, involving
vendor assistance and productivity-raising efforts as well as a rational sharing of
tasks between participating enterprises. The author also indicates that policy
makers should help SMEs by creating an environment that stimulates and
supports learning, innovation and constant upgrading (Unctad, 1999:19).
In places such as Singapore, India, Malaysia and Indonesia, clans of ethnic
groups form associations that become the vehicles through which entrepreneurial
skills and vocational education are passed on to successive generations of
fledgling entrepreneurs. The latter are provided with specialised training,
mentorship on marketing, sourcing, customer care and technical assistance
(Nicolaides & Reddy, 2004:205).
3.4.6 Africa (excluding South Africa)
Mutharika (1992:6-7) proposes the following to enhance the success of small
business in Africa and that these issues be considered by African governments
and the International Council for Small business (ICSB):
• Technical assistance and advisory services should be provided to new and
old businesses. Advice should include the determination of the size of the

100
business, the capital needed and the technical and managerial skills required
for success.
• Detailed information should be made available on the demand and supply
situation of products and services.
• Governments should create an enabling environment for small businesses.
• The ICSB should launch a campaign to encourage different industrial
chambers to assist small business more than is presently the case.
The following overview of assistance and advice in Swaziland, Botswana and
Malawi also adds to the body of knowledge:
3.4.6.1 Swaziland
In 1973, Sedco (the Small Enterprises Development Company) was established
in Swaziland to assist and counsel entrepreneurs. Initially no manufacturer could
be located, but after some publicity, some were selected and were given
practical, individual, on-the-spot and continuing training. Buildings were erected
on several locations where a superintendent was available to assist and counsel,
manufacturing entrepreneurs. In some cases, large pieces of equipment were
purchased and rented to entrepreneurs because they could not afford to buy the
equipment. Six years later, 150 Swazis were running their own manufacturing
businesses with a success rate of over 80% at that time. This success rate
seems to have been caused by the continuous, practical and on-the-spot
counselling (Hetherington, 1985:30-31).
Sedco, a wholly government owned entity, is still operating in the SME sector
today, providing mini factories, business development services and marketing
assistance to SME owners in Swaziland. It also offers training in business
management and legal and general counselling at subsidised rates. Swaziland
also sees the small business sector as vital to job creation and economic growth.
In 2004, the role of Sedco changed and it is now developing intermediary

101
institutions able to nurture SMEs into profitable businesses. Sedco will also
support SMEs seeking loans from the commercial banks under the scheme
(Swaziland, 2005).
The Small and Medium Enterprise Department was established in 2001. Its
objective was to unify and coordinate the functions of organisations such as
Sedco and to facilitate the free flow of SMEs’ day-to-day business, enhance
working relations between them and to strategise their business environment
(Swaziland, 2005).
3.4.6.2 Botswana
The government of Botswana established the Botswana Entrepreneurial
Development Unit (Bedu) in 1974 to provide local firms with financial and non-
financial assistance. The Local Preference Scheme (now the Local Procurement
Programme) followed in 1978 which procures up to 30% of the government
annual procurement for local firms. There are currently many financial and non-
financial organisations committed to the provision of assistance to start up and
establish firms (Temtime, Chinyoka & Shunda, 2004:569)
Financial assistance has been granted in different ways and the creation of many
jobs was projected during the late 1990s. (However, proof that this has actually
happened is not forthcoming.) A lack of coordination of investments was put
forward as a problem at that time. During the late 1990s the Citizen
Entrepreneurial Development Agency (Ceda) replaced the Financial Assistance
Policy and sustainable enterprise development became its main objective. Loans
instead of outright grants are now given. There are also many other financial aid
schemes and funds available to business owners in Botswana (Temtime et al.,
2004:569-570).

102
The Botswana Confederation of Commerce, Industry and Manpower, Enterprise
Botswana, Small Business Clinic and the Department of Industrial Affairs all
assist small business owners in various ways such as industrial relations
assistance, management counselling, business principles and even technical
training. Despite all these efforts, the pace of small business development is far
from satisfactory. This research report concludes by suggesting an integrated
model of appropriate continued small business assistance to achieve sustainable
development (Temtime et al., 2004:573-578).
3.4.6.3 Malawi
Small business development is also emphasised by the Malawi government and
donors to create employment and increase income are actively encouraged.
Many agencies exist in Malawi to assist the small business sector. Masten and
Kandoole (2000: 289-298) identified numerous capacity constraints and made
suggestions to improve the effectiveness of the agencies. The diverse source of
SME assistance and know-how was suggested as one cause of the capacity
limitation of the agencies.
The assistance and interventions in different countries all over the world do not
differ much at all. It seems that most of them offer advisory, consulting, training,
counselling and mentoring services to SME owners. Of course they also offer
financial assistance such as loans and grants as well as an infrastructure such as
the mini factories in Swaziland and South Africa. The functional areas where
assistance is provided mostly includes management, marketing, quality systems
and improving productivity in general. Some countries also assist the SME
owners with technology and technical assistance.

103
3.5 ASSISTANCE AND INTERVENTIONS IN SOUTH AFRICA 3.5.1 Existing government assistance to small business
According to a study by Madell and Adam (2002:9), local authorities should be
empowered to render business development and support services at a local
community level, and measures should be identified to increase the participation
of established local business in the provision of advice and support to emerging
enterprises.
In South Africa, the following bodies are amongst those established by
government to support small businesses:
3.5.1.1 The Small Enterprise Development Agency (Seda)
Seda was officially launched on 13 December 2004 as an agency of the
Department of Trade and Industry. It was established to coordinate the design
and implementation of development support programmes and the creation of a
service delivery network for small businesses throughout South Africa. Seda
incorporated the previously existing small business support institutions (Ntsika
Enterprise Promotion Agency and the Namac Trust). The existing Local
Business Service Centres and Tender Advice Centres, which were supported by
Ntsika, were also incorporated by Seda. The assistance they offered to small
business owners and entrepreneurs included help with business plans, technical
advice and marketing, as well as information on export support, tenders and
incentives (Damane, 2005).
More recently, in April 2007, Seda reported that it had eight provincial offices
managing the work of 40 branches all over the country with the head office in
Gauteng. It mentioned its website (www.seda.org.za) as another instrument
assisting small businesses as well as a newsletter that is sent to subscribers on a

104
monthly basis. Seda also has an information centre where assistance is mainly
provided telephonically. The most common enquiries include financing an
enterprise, drawing up a business plan, concessions, business opportunities,
suppliers, tender information, how to recruit clients and how to register an
enterprise (Damane, 2007:36).
3.5.1.2 Ntsika (now incorporated by Seda)
Ntsika, for example, was established in 1997 in terms of the National Small
Business Act, to deal with non-financial constraints faced by SMMEs in South
Africa. It mission is to render an efficient and effective promotion and support
service to the SMME sector through intermediary organisations and to contribute
towards equitable economic growth in South Africa. It does so by means of an
extensive consultative process driven by the broad spectrum of SMME needs,
national imperatives and government priorities. Its functions are as follows:
• to identify and develop SMMEs to service identified market opportunities
• to identify and develop markets with the objective of increasing opportunities
for SMMEs
• to facilitate business linkages between SMMEs and identified market
opportunities
• to coordinate, conduct and provide research, information and expert advice
on SMME development
• to promote the products and services of Ntsika through interaction with a
broad range of stakeholders with the objective of creating business
opportunities for themselves
According to Ladzani (2001:8), Ntsika did not effectively link training programmes
to aftercare and the mentoring of trainees and market opportunities. It was also
largely unsuccessful in marketing services to target groups. With no aftercare,

105
the training it provides remains invisible. Ladzani (2001:11) recommends that
overinvestment in training should not be done at the expense of aftercare.
3.5.1.3 Gauteng Manufacturing Advisory Centre (Gaumac)
As part of Gauteng Provincial Government’s infrastructure initiative, Blue IQ,
Gaumac was established. The Blue IQ initiative, which targets economic
infrastructure development, forms part of the industrial regeneration of areas
experiencing economic decline in the province. It focuses on enhancing the
manufacturing competitiveness of SMEs employing fewer than 200 people in the
province. Gaumac was officially launched during the 2001, “Blue IQ means
business” week. Gaumac’s mission is to assist small and medium manufacturing
enterprises in Gauteng to have ready access to high-quality business and
technical support services to improve their productivity and enhance their
competitiveness. Gaumac is supported by local government and funded by the
department of trade and industry (DTI).
3.5.1.4 Sector Education and Training Authority (Seta)
According to Butcher (2002:40), providing access to funding and advisory support
is not enough. These need to be coupled with skills development. Setas are
already playing an important role in this regard. Many Setas are aggressively
targeting SMMEs. There are currently 23 active Setas in South Africa.
As explained in the South African Qualifications Authority (Saqa) information
manual (2006) a Seta includes employers, trade unions, and government
departments. The functions of a Seta include developing and implementing
sector skills plans and registering and promoting learnerships.
Setas were formally established in March 2002. Initially, the majority of the 25
Setas did not have the appropriate systems and procedures in place to deal with

106
their core functions. Seta boards were also trying to define their areas of
responsibility. It took them two to three years before they were in a position to
deliver on their mandate. After five years, some Setas continued to struggle
financially and because of weak and inefficient systems, while the situation is
changing for those Setas that have developed their own internal capacity in the
intervening years.
After three years, some amendments were made to the Skills Development Act,
seeking to rein in the Setas and ensure stricter controls around their
management, functioning and overall performance. This led to recommendations
about the consolidation of the 25 Setas. After some deliberation and a process of
public hearings, the Minister decided on a number of minor mergers, reducing the
number of Setas to 23 (Grawitzky, 2007:17).
3.5.1.5 Khula
Khula Enterprise Finance Limited is an agency of the Department of Trade and
Industry. It was established in 1996 to facilitate access to finance for SMMEs.
Khula is a wholesale finance institution which means that it does not provide
finance directly, but through institutions such as commercial banks, retail financial
intermediaries and micro credit outlets. It also provides mentorship services to
assist small business owners and entrepreneurs to manage their businesses
(Khula, 2007).
According to Lebelo (2004:8), Khula had been criticised in the past for poor
achievement, but added that the slow supply of funds by institutions to assist new
enterprises did not make its task any easier. The problem could also have been
that many of the mediators did not know how to utilise the guarantee system
properly. Once again the MD of Khula at that time (and still today in 2007), Mr
Sithole, was preparing a plan of action to present to the directors of Khula
regarding the acceleration of the availability of finance. He also admitted the

107
mistakes made in the past, but gave the assurance that they had learned by their
mistakes.
According to Madell and Adam (2002:9), non-governmental role players should,
however, also be encouraged to establish and manage business support centres.
Subsidies may be necessary where these business centres operate in poor areas
where customers are able only to pay a minimal consultancy fee. The authors
also suggest that local authorities consider establishing a network of referral
centres.
During June 2005, the largest private and self-financed supplier of financial
services in South Africa, Real people, received a loan of R20 million from Khula.
This was used to assist the small business sector, especially the disadvantaged
groups in South Africa with different products and loans. This also gave Khula
the opportunity to expand its efforts to black small business, especially those
needing less than R1 million. The executive director of Real People, Mr Johan
van Rooyen, also promised general and strategic assistance to small business to
ensure long-term success (Ueckermann, 2005b:6).
3.5.1.6 Gauteng Enterprise Propeller (Gep)
Gep was established early in 2005 with a budget of R60 million for supplying
financial services and R15 million for supplying non-financial services to the small
business sector. As a result, it foresees that 800 000 jobs must be created by
2014, by assisting 30 000 SMEs (Ueckermann, 2006:11). A budget of R300
million for 2006 to 2008 was set aside for this. Partnerships would be established
with banks to match funding provided by local government. The sectors that
would be targeted included telecommunications, financial services, construction
and retail services. The ultimate goal of this was to contribute to economic
growth, which would assist help to alleviate the poverty and unemployment
problems in South Africa (Waluda, 2005:1).

108
However, during early 2006, the president of the SMME Forum to the Gep, Mr
Khaas, accused the Gauteng Provincial Government’s department of financial
and economic affairs and their respective agencies of not doing their part to
promote small business. In fact, they were alleged to have played a major role in
many failures (Ueckermann, 2006:11).
During the middle of 2007, the MEC for Finance and Economic Affairs, Paul
Mashatile, appointed additional members to serve on the Gep Board. The new
Board appointees have a wealth of experience and leadership and comprise
experts in the SMME development arena. Their goal is to support SMMEs from
the second to the first economy and to see them grow and become major players
in the economic mainstream (Gep, 2007).
3.5.1.7 Business Referral and Information Network (Brain)
This is an online initiative launched by the DTI. It offers basic information and
essential service links to entrepreneurs. The website includes information about
government incentives and SMME support agencies as well as links to business
centres throughout South Africa (Boosting small business, 2006).
3.5.1.8 The Western Cape government
In the Western Cape government launched a scheme to promote
entrepreneurship amongst the unemployed. They made R1000 available to each
of 1 000 unemployed people in the province. Applicants were chosen on the
basis of their business ideas and were given a loan for six months. During these
six months, their businesses were evaluated by a panel of experts and the winner
received R5 000 towards his or her new business. Mentoring was also provided
by the Red Door initiative, a one-stop shop for small business in the Western
Cape to receive advice (South Africa, 2005b:2)

109
Although the present government is still relatively new, its capacity is limited and
support programmes tend to be driven from national level. According to the
literature reviewed by Monkman, (2003:9) numerous problems are responsible
for the unsatisfactory impact of government financial support of SMEs. Some of
these problems are as follows:
• The weak management and poor corporate governance of Khula, especially
during 1999-2001 is a problem.
• There are not enough service providers to assist entrepreneurs.
• The larger enterprises tend to be better served because their outcomes are
more predictable.
• Donors are increasingly bypassing government.
• Market awareness and the usage of DTI and agency programmes are low.
• SMEs have the perception that there is no outreach to them.
• Cumbersome administration and discontinuity of programmes are evident.
• There is a lack of management support accompanying a loan application.
• Access to finance programmes tends to be overly supply-driven.
3.5.2 Other types of assistance available
For a small business to get started or an existing business to be encouraged to
grow, it is desirable for some form of affordable mentoring or guidance to be
available to the entrepreneur (Tsehloane & Nelson, 1992).
Different skills are needed at different stages of a business. Nieuwenhuizen,
(2005a:9) explains that entrepreneurial skills in medium and large businesses are
also different from those in micro and small business level. At the small business
level, a fine balance between entrepreneurial and managerial skills is essential.
As businesses become larger, specialisation becomes necessary with different
departments for functions such as finance, human resources and administration.

110
Not only do different sizes and different stages of business influence the skills
needed, but also the cultural, social and educational background of the
entrepreneur needs to be taken into account when developing training and
support systems (De Faoite, et al., 2004:440).
3.5.2.1 The Institute of Management Consultants of South Africa (IMCSA)
IMCSA is a professional body in South Africa representing the management
consulting profession. The Institute was inaugurated on 28 April 1972. It seeks
to make the profession recognised, respected and accepted as providing a
valuable and vital service to organisations in South Africa and the Southern
African region. It acts as the certifying body for the profession, representing and
enhancing the profession to clients, authorities and the community (IMCSA,
2006).
3.5.2.2 International Executive Service Corps (IESC), South Africa
This corps consists of volunteer executives. They are retired people who have
spent their working lives in business, commerce, technology and other activities.
They make their expertise and experience available to small business owners.
The IESC in South Africa provides a mentoring and guidance service to budding
black entrepreneurs who request it at a modest fee and in some cases at no cost
at all. Typically, the retired person would be from the industry concerned. The
main objective is to enable the entrepreneur to gain entry into the mainstream of
formal business activities and to be confident in his or her ability to compete on
equal terms with white-owned businesses (Tsehloane & Nelson, 1992).
According to the IESC, South Africa (Tsehloane & Nelson, 1992), the following
were identified as areas of concern for many small businesses:
111
• starting up, including some knowledge and skills about the type of business,
the equipment needed and marketing
• bookkeeping to keep track of the financial situation and remain informed
about the profitability or non-profitability of the business
• costing of goods and services
• pricing, quality and delivery, especially when supplying larger companies as a
subcontractor
• subcontracting which could have many pitfalls
• payment of installation/service work
• marketing and selling (the owner cannot do everything)
• financing and a business plan
3.5.2.3 Coaches and Mentors South Africa (Comensa)
A professional body representing business coaches and mentors in South Africa
was launched in Johannesburg and Cape Town in April 2006, and in Durban in
May of the same year. Comensa is affiliated to the European Mentoring and
Coaching Council (EMCC) and the Worldwide Association of Business Coaches
(WABC). The main objective of Comensa is to raise and develop the profile of
mentors and business coaches in South Africa in order to improve the quality of
service rendered to business owners. At the time the article was published,
Comensa had 500 members on its books, but no mentor or coaches listed on the
website (Mwanambuyu, 2006).
3.5.2.4 Industrial Development Corporation (IDC)
A multimillion rand agreement to support SMEs was concluded in July 2005
between the IDC and Thales International Offsets in collaboration with Calyon
Investment Bank. This is a five-year loan facility that will be used to promote and
sustain SME development in historically poorer provinces (Eastern Cape,
Northwest, Limpopo and Free State) as well as enterprises adjacent to townships

112
and rural areas. The focus would be on job creation, BEE and assistance to help
sustain and develop the economy (Big deal for small business, 2005).
3.5.2.5 Business Partners Limited
Business Partners Limited is a specialist investment company providing debt and
equity investment, mentorship and property management services for SMEs in
South Africa. Professional mentorship and consulting services are provided by
the Business Partners Mentor and Consulting Services Division (Business
Partners, 2006).
According to Mr Paul Malherbe, executive head of Business Partners Mentors,
most small enterprises fail because of poor management which has financial and
human resource implications. This is why they use experienced mentors to guide
inexperienced entrepreneurs through the business process, trying to decrease
the number of small business failures and providing specialist assistance to
enable the enterprise to grow. In this way the entrepreneur has access to the
same skills and knowledge as corporate enterprises. Business Partners renders
specialist assistance in the following areas: developing a business plan,
formulating business strategies, managing and optimising growth, increasing
market share, communicating with the target market, diversifying, expanding and
managing crisis. Mentors who are specialists in their fields provide assistance on
an ad hoc basis (Malherbe, 2004:11).
Business Partners announced during May 2005 that they had allocated R357
million for BEE in their investment budget for 2005/2006. This budget focuses on
SMEs, making investment financing more accessible to this sector. About
R297.5 million would go towards empowering women entrepreneurs. Business
Partners sees BEE as a priority and the SME sector as one of empowerment, job
creation and economic growth. The financial assistance will be for new

113
businesses, growth, purchasing transactions, concessions, management buy-ins
and buy-outs, tenders and contracts (Schwenke, 2005:6).
According to Schwenke, managing director of Business Partners, investing in
SMEs could be especially profitable if lenders work closely with SMEs and help
run the businesses. Business Partners does not simply provide businesses with
loans and leave them to fend for themselves. He further states that they provide
finance and take a portion of the equity in the business to compensate for the
risk. Legal, accounting and business experts provide guidance and mentor the
owners (Malherbe, 2004:11). Mentors are prepared to help entrepreneurs to
improve efficiency, profitability and grow their businesses (Business Partners,
2006).
3.5.2.6 Strategic alliance partners and networks
The importance of strategic alliance was clearly demonstrated in the survey
conducted by Burke and Jarrat (2004:9-10). Linking up with a major supplier
could prove extremely valuable for an SME. The advice of the major supplier
seems to be spot-on. The respondents (all small business owners) regard
networks and networking as the most credible source of advice, even though they
may be from different industries. The respondents feel less threatened and more
secure in what they are doing.
3.5.2.7 Business Beat
Business Beat is a project of the Deloitte and Touche Business Equity Initiative
(BEI), their objective being to develop the SME sector, focusing on previously
disadvantaged communities. They support corporates, franchisors and public
sector programmes that encourage the development of SMEs by creating
profitable business opportunities and assisting with the development of
entrepreneurs from the targeted groups to manage their businesses efficiently

114
(Business Beat, 2004). According to Mr Godfrey of Deloitte and Touche (2004),
this service was not that successful. It focused on the business plan, but
because the service providers were ineffective, Deloitte and Touche had to spend
too much time to elevate the plans to a 100% level. The initiative was thus
disbanded. A Business Beat centre has been initiated in Cape Town where
students and consultants share their knowledge with entrepreneurs on an ad hoc
basis. They also encourage banks to assist the entrepreneurs. As in the
previous case, the success rate was poor.
3.5.2.8 The Business Place
The Business Place is situated in the centre of Johannesburg. One of its
objectives is to render support services to the micro-enterprise sector. An impact
study was undertaken to measure, among other things, the perception and
feedback of the increasing utilisation of the Business Place and its positioning for
this sector. The results were published in January 2004 and showed that
although not all entrepreneurs become successful, the Business Place has
helped many clients to achieve some noteworthy results. The success could not
be attributed to one factor, but clients themselves have indicated that the
Business Place helped them. Of the sample, 81% made more than one visit, and
92% indicated that they would return in the future (Verran, 2004).
The Business Place offers information and advice on the client’s problem or
need. If the client cannot be assisted by the assistants on the premises, he or
she is referred to other consultants, business owners or institutions that have
indicated their willingness to assist such entrepreneurs (Verran, 2004).
According to Rikhotso (2004), in order to succeed, entrepreneurs need training in
business management, especially in financial matters. They generally have few
skills in bookkeeping, creditor’s control and financial management. Most of
Rikhotso’s clients come to him because they require money, but after a few

115
consultations, he finds that what they need is business management skills to
expand their businesses and make them sustainable.
3.5.2.9 Pro-active Risk Management (PRM) Services
PRM is a multi-disciplinary financial business partner that provides knowledge
and expertise in financial, labour and business matters. The typical market is
small enterprises with 1 to 50 employees, in any form of business. The services
and products PRM provides include the following: day-to-day bookkeeping,
debtors and creditors, accounting services, VAT returns, financial statements,
management accounts, cash flow and forecasts and budgets. According to PRM,
these functions are probably not the primary functions of the business but are
critical for success. The experts at PRM are convinced that it costs much less to
outsource these functions to a professional group than to appoint a full-time
accountant. This area is so specialised that professional people should handle it.
They claim that their experience in this field could make the difference in a
business, whether it is a medical practitioner, dentist, lawyer restaurant owner,
shop owner or manufacturing concern (Van Oordt, 2004).
3.5.2.10 Employer associations
Cofesa (the Confederation of Employers of South Africa) as an example of an
employer association consists of a team of professional advisers that assists
small business owners countrywide with all aspects of labour legislation. This
assistance includes wage negotiations, disciplinary hearings, conciliation and
arbitration, as well as labour court cases. Regarding the Skills Development Act,
Cofesa’s call centre can be contacted for related requirements. A panel of
experts deals with all facets of skills development. Cofesa advisers also draft
employment equity reports and plans for members. Finally, Cofesa’s hotline and
advisers also assist members to identify health and safety risks (Cofesa, 2006).

116
There are many such employer associations. A long list is provided on the
following website: http://www.workinfo.com. These associations are common
meeting grounds for companies in a specific industry. Knowledge, ideas and
experience are exchanged and stimulated. Most of them provide a platform for
the employer to get close to matters affecting the industry, provide a
representative strength to promote and protect their interests. The Electrical
Engineering and Allied Industries Association and the Johannesburg Chamber of
Commerce and Industry are two examples.
3.5.2.11 Industry associations
Industry associations were identified as both credible and valuable sources of
market intelligence, marketing and technical/logistical advice. They provide a
window to the broader marketplace and their advice is regarded as being specific
to the competitive environment, in contrast to business networks that afford
businesspeople the opportunity to discuss shared experience and general trends
(Burke & Jarrat, 2004:9).
3.5.2.12 The South African Bureau of Standards (SABS)
The SMME Development Department with the SABS has initiated the Missing
Link Programme, which provides SMMEs with the knowledge, skills and
capabilities necessary to manufacture high-quality products that conform to
national and international standards. The Department also provides access to
other key facilities and services through the 50% Subsidy Scheme for SABS
laboratory services, capability report, SABS ISO 9000 and SABS ISO 14000.
The training programmes are offered in the following industries and focus on
required standards and specifications for the specific industry: industrial
chemicals, welding, clothing, civil engineering and marine products (Anon,
2000:100).

117
3.5.2.13 Sanlam
One of the main objectives of Sanlam’s Entrepreneurs Development Programme
is to establish 50 business ventures by the end of 2006. This will give budding
entrepreneurs the opportunity and exposure to training, financial assistance and
mentorship they will need to be successful. The entrepreneurs are chosen
through a selection process in which 50 are chosen. After placing them,
Business Partners Mentors appoints mentors to assist the entrepreneurs for a
period of 12 months (Ueckermann, 2005d:6).
3.5.2.14 Southern Sun
Southern Sun has initiated an “Adopt a guesthouse” project in which it assists
tourism entrepreneurs (five guesthouses owned and managed by women) in the
areas of business, financial management and marketing skills, bringing them up
to world class quality level (Ueckermann, 2005e:10).
3.5.2.15 South Africa Breweries (SAB): KickStart
KickStart is a project in the form of a competition held by SAB Ltd. It is aimed at
inculcating a culture of entrepreneurship in young people between the ages of 18
and 35, promoting awareness through training and providing grants as start-up
capital and mentorship and assistance during the start-up phase of a business.
Potential entrepreneurs enter the competition and are selected in the different
regions of South Africa. They are trained for 10 to 14 days, and then required to
draw up a business plan. The business plans are presented to a panel of judges
and the winners receive grants in the form of capital. A mentor is also contracted
to assist the potential entrepreneur for at least six months (South African
Breweries Limited, 2006).

118
3.5.2.16 Sasol
In 1998, ChemCity was created by Sasol as one of its subsidiaries to render
assistance to SMME development and job creation. Sasol helps develop
ChemCity-branded SMMEs in downstream chemical and related industries.
Sasol does this by identifying entrepreneurs and business propositions that have
what it takes to become a viable SMME. ChemCity provides assistance through
financing, Sasol’s resources and coaching. It concentrates on empowered
SMMEs owned and managed by black economic empowerment groupings,
ensuring they are sustainable and working closely together with them. In
collaboration with their partners ChemCity offers the following services, inter alia
(ChemCity: 2006):
• general consulting services
• industry and competitor analysis
• marketing
• sourcing of technology
• technical development
• business plans
• feasibility studies
• sourcing of finance
• plant cost estimations
3.5.2.17 Zimele
Zimele is an enterprise development and empowerment initiative of Anglo
American. It invests across a wide range of industries with no particular area of
focus. It facilitates BEE, provides finance to black-owned emerging companies,
assists in the development of entrepreneurship and facilitates procurement and
outsourcing of non-core activities. In addition, to providing finance Zimele also
provides a list of other types of assistance, including seeking and evaluating

119
viable business opportunities, assessing business proposals and plans, assisting
with business formation, systems and information, nurturing entrepreneurs
through the transfer of business and managerial skills and providing access to
Anglo American’s administrative resources such as legal, tax and human
resources, at no cost (Zimele, 2005).
3.5.2.18 Inzuzo
In 2000, Intekom of South Africa launched a business-to-business Internet portal,
branded “Inzuzo” (the Zulu word for “gain”) to promote business interests and
growth in the SME sector. The idea was to improve the success rate of small
business and to help entrench this sector in the economy. Businesses are able
to list or edit their products and service details online at no cost in order to
increase their exposure. Inzuzo is an online information directory of where to go,
for what. This source of information includes daily updated financial and
investment news and advice on starting, running and marketing a small business.
It also includes information on raising capital, management and commerce
strategies, finance, accounting, tax-related issues, government regulations and
legal issues. Information on numerous other issues and business tools is also
available here. This creates an information and communications forum for SMEs,
a virtual community for the small business owner (Intekom, 2000).
3.5.2.19 Friends, family members, customers and staff
The survey by Burke and Jarrat (2004:9) also revealed that this group is regarded
as credible source of information and advice for strategic decisions. The
Chamber of Commerce is also deemed to be a valuable source of the shared
experience of other business practitioners. Personal friends can be of assistance
if they have had business experience, but the data gathered in the survey
emphasises the value of advice from quite informal sources seemingly unrelated

120
to the specific business. This value is built on respect, trust, experience and
business success.
3.5.2.20 Outsourcing
Outsourcing is not a direct intervention, but in the context of this study, it is a type
of intervention because someone outside the business, usually an expert in that
particular field, does something for the business. Outsourcing can be seen as
contracting with consultants and other service providers outside a business to
perform specific tasks for the business. Portions of work are transferred to
external sources as opposed to completing the work internally.
According to Stark and Du Plessis (2004:2), Business Process Outsourcing
(BPO) is increasingly being used as a management tool by organisations
competing in the New Economy (referring to information, digital, network, e-
conomy, etc). Executives are also being advised to outsource all non-critical
business systems and focus on their core competencies (Ellram & Billington,
2001). Once again, Hodgson, Schoppemann and Benson (in Stark and Du
Plessis, 2004:6) pose the question whether this model will benefit the customer.
They conclude by saying that because of the move from the Old to the New
Economy the emphasis has moved from a sheer cost benefit to strategic balance
in the organisation and the decision process related to business outsourcing is
complex and impacts on various levels of the organisation.
3.5.2.21 International assistance to South Africa
Through a strategic partnership with Business Unity South Africa (Busa) the
Netherlands Embassy is planning to significantly expand business assistance
activities in South Africa. This assistance involves drawing on a pool of 4 500
retired business executives to advise businesses in 70 countries. Plans are also
under way to introduce training and tailor-made courses (Holmes, 2006).

121
The trade Facilitation Office Canada and the International Trade Centre in
Geneva are helping African SMEs to develop their ability to trade. This support
programme includes the Programme for Building African Capacity for Trade,
focusing on strengthening institutional support, enhancing enterprise
competitiveness and promoting solid opportunities (Holmes, 2006).
Sweden has been offering financial support to South Africa across a spectrum of
development activities, but recently announced that the funding will be replaced
by a new Swedish support mechanism for SME development (Holmes, 2006).
3.5.3 Existing professional assistance
Professional assistance includes the assistance available from consultants in a
specific business function or area such as accountants, attorneys and even
banks.
3.5.3.1 Accountants
In a survey done by Burke and Jarrat (2004:9) accountants were perceived as
providing sound advice on purchasing decisions (e.g. hire purchase or loan),
reporting practices and tax matters. They also tended to be consulted only on
strategy decisions post-event. Respondents indicated that accountants lacked
the in-depth knowledge of their business to be a credible source of strategic
advice, they do not understand the marketing process fully and they are too
financially oriented. This indicates the contrast perceived between the value of
specific advice sought in areas of expertise and the value of more strategic
advice from the same source.
There are even more accountants, tax consultants and financial advisers than
legal consultants and they all render a similar service. As indicated by Van Oordt
(2004), this area is extremely specialised and professional people should handle

122
it. Small business owners can either do accountancy or they cannot and if the
latter is the case they require assistance. Accountancy is not a task one can try
to do oneself. Most small business owners make use of accountants to do their
books and related tasks, because, as indicated by Van Oordt, it costs much less
to outsource this function to a professional than to appoint a full-time accountant.
3.5.3.1 Attorneys
Attorneys such as the privately owned “FDE Attorneys, Notaries and
Conveyancers” offer a variety of services and ad hoc advisory consultations.
These services include the following (FDE Attorneys, 2004):
• conveyancing and notarial services
• commercial law services
• insolvencies and related services
• litigation services
• matrimonial law and related services
• deceased estates and other general services concerning related legal
matters
Many other similar firms can be contacted by small business owners for
assistance with legal matters. The type of service offered is usually a once-off
type of intervention or consultation, for example, when the business is registered,
when contracts have to be drawn up, when the form of business changes and
when insolvencies are involved. It does not interfere with the management of the
business and therefore cannot really have any impact on the business’s success.
3.5.3.2 Banks
Peter Carruthers (2004) wrote that South African banks are not financial advisers,
irrespective of what they communicate to the public. He is of the opinion that

123
South African banks exist to sell as much money as they can, at the lowest
possible risk, and at the highest possible interest rate. Regarding small business
owners he explains that they should be knowledgeable about banking aspects
such as sureties, personal assets, interest rates and overdrafts. He says that
small business owners should become their own bankers so that their current
banker can never threaten their future. This single strategy has saved hundred of
businesses from premature closure when their own bankers wanted immediate
repayment of all outstanding debts.
ABSA is committed to the small business sector in South Africa and has
introduced specialised support for small business customers through their branch
network countrywide. Their portfolio managers tend to financial needs for
finance, investments and other business products and services. ABSA says that
it can assist the small business customer during any stage of the business, such
as the business decision, a newly started business, in business for some time
and needing to expand.
Apart from all the usual banking services, ABSA has a Business Banking
ToolBox, which is a complete guide to business in 10 booklets. The bank claims
that the booklets provide an ideal opportunity to gain a thorough understanding of
what is involved in starting and then managing one’s own business. The titles of
the booklets are as follows (ABSA Business, 2004):
• Considering your own business
• Checklist for buying a business
• Franchising
• Principles of finance
• Your business and your bank
• The Business Plan
• Key issues in small business management
• Legal issues

124
• Tax and small business
• Cash-flow programme and manual.
Gavin Clarke, divisional head of small business at ABSA, reported in 2004 that if
SMEs are carefully managed, the sector could be a profitable one in the long
term. ABSA has worked closely with Khula. This has prompted banks to
become more involved in helping SME clients in the hope of achieving similar
results. Clarke also states that banks are starting to provide more free
information to SME clients to help them run their businesses, and could
eventually provide consultants offering free services to SMEs. “An SME that is
getting good advice and mentorship is less of a risk and banks are starting to
realise this” (Clarke, 2004).
First National Bank assists small business owners in all stages of the business.
Its range of business banking products and services includes insightful business
tips, transactional banking, insurance, financing, investing, sales and
procurement.
Nedbank focuses on providing small and medium businesses with financial
support and solutions essential for growth and development. Regardless of the
type of business activities, it claims to have the products and services to suit
each unique client’s needs.
Van der Merwe (2004) also found in her research that commercial banks do not
believe that it is their responsibility to train and educate entrepreneurs on
business, management and entrepreneurial skills.
Pretorius and Shaw (2004:221) conclude in their article on business plans and
bank decision making, that banks finance business ventures with poor potential
for success if the applicant is creditworthy or has the necessary security rather
than assisting applicants with good plans and ventures with potential, but who

125
lack sufficient security. Lack of finance is often mentioned as a stumbling block
for start-ups and this research showed that only one-quarter of applicants for
bank loans were reported to be successful in South Africa. Banks are less likely
to grant loans than to offer credit through credit cards and overdrafts.
3.5.4 Private business consultations
The task of the private business consultant is a daunting one. The adviser has to
demonstrate expertise across a generic wide-ranging sector and in a sense
challenge the managing directors in their castles, and they actually have no
legitimate power to do so. Advisers need not only a significant level of specialist
knowledge, but the literature also suggests that personal advisers also have a
prime initial task to demonstrate their competence, face to face (Mole, 2002:156).
In the survey by Burke and Jarrat (2004:9), specialist advisers were not always
seen as credible in providing practical strategic market-oriented advice because
of their lack of knowledge about the particular industry or business, or both.
Consultation is a two-way interaction process of seeking, giving and receiving
help. Resources need to be mobilised internally and externally to deal with
problems and change whatever is necessary. One of the major issues of small
business consulting centres on the inability of the owner is to clearly see what
problems are affecting the business. The key to process consultation lies not
only in finding the remedy for the problem, but to sharpen the owner’s ability to
assess problems in the business (Matthews, 1990:5-6).
The following are examples of successful private business consultations:
3.5.4.1 Patchall Systems
Patchall (name changed for the sake of confidentiality) is a manufacturer of
rubber patches, valves and solutions. In September 1999, the owner required

126
assistance from Cofesa in certain labour matters. During the investigation, the
consultant found that the cause of the decline in productivity was not only a
labour force matter, but also that the company lacked properly managed
systems. While the business was growing, the owner had become so tied up in
his job as owner/manager, that he lost control of most of the activities. The
consultant started assisting the owner in implementing administrative, production
and human resource management systems. This assistance lasted for nearly
four years and the business became more profitable than before. The owner
actually employed the consultant on a contractual basis to assist him on a weekly
basis (Nieuwenhuizen, 2005b).
The following are three examples in which small business owners successfully
made use of a consultant. In all instances, the consultant was requested to
assist in changing the employee’s contracts and putting the control systems in
place. The common problem seemed to have been that the owners had become
so tied up in the day-to-day activities that they either neglected or did not have
the skills to put administrative and control systems in place. This led to an
increase in costs in all the cases (Nieuwenhuizen, 2005b).
3.5.4.2 BMB Electronics (a telecommunications company)
After analysing the situation, a cost analysis and cost breakdowns were done.
New documentation was designed and a management control system
implemented to control costs. Owing to these changes, the company profits
increased dramatically. The consultant first assisted the owner on a weekly basis
and thereafter on a monthly basis, until he felt comfortable to continue on his
own.
3.5.4.3 Chemvul (a rubber product manufacturing company)
After analysing the situation, the following was done:

127
• Labour costs were allocated to specific outputs.
• Restructuring meetings were held with staff and the owner.
• Information was analysed to achieve optimum utilisation of resources.
• Improved systems were implemented and contractors trained.
The consultant was initially involved for about a month. Thereafter he was
contracted to assist the owner for one day a week, and after about six months,
was asked to assist whenever the owner needed him. During this period, the
owner could also contact the consultant telephonically to obtain immediate
assistance when required.
3.5.4.4 Christensen tools (Pty) Ltd (manufacturer and supplier of specialist
tools, equipment and bags)
In this example the consultant gathered information, allocated labour costs to
specific outputs, analysed information to achieve optimum utilisation of resources
and implemented new cost structures. Although the process was the same as in
the previous example at that stage the owner had no further need for assistance,
other than with regard to labour-related issues.
In all of the above examples, the consultant was involved with the owner on a
continuous basis and “became part of the business” for some time.
3.5.5 Employing experts
Although employing an expert is not the same as making use of a consultant, the
small business owner sees that there is a need for expert knowledge, skill or
input to become or be more successful. Two examples are discussed below.

128
3.5.5.1 Pacmar
Pacmar founder and MD, Kabous Marra, started off as a food technology student.
At that stage, he had many years of beverage experience under his belt. After
qualifying and working in the dairy, fruit wine and fruit juice industries in various
development and quality control positions, he decided to start his own business.
Together with previous colleagues and other experts in this field, he started a
business as beverage producer and contract packer (Neall, 2002:13).
The issue here was not that he was making use of assistance, but that he was
actually employing experts in their particular fields to do the job. This combined
technical expertise gave the business a synergetic strength that few competitors
could emulate. Today this is a vibrant company and its success is ascribed to
quality, service, relationship and price (Neall, 2002:13-16).
3.5.5.2 JOBFOOD.COM
Bosman, MD of JOBFOOD.COM admits that one may feel that the business is
“one’s baby” but there are times when one needs to let go. It is dangerous to try
to control all aspects of it at all times. Remember where the core competence
lies. At some stage one will need specialist assistance to complement one’s own
skills. One needs to bring in the best and give them some leeway (Bosman,
2002:8).
Assistance to small businesses in South Africa is provided by many different
bodies and entities classified under government assistance (such as Seda,
Ntsika and Gaumac), assistance from professional bodies (such as IMCSA, IESC
and Comensa), professional assistance (from accountants, attorneys and banks),
and private business consultations (done privately by consultants). Some
businesses were also identified that employ experts as part of the staff
component and this was also classified as another form of assistance.

129
3.6 CONCLUSION
In countries worldwide, SME support and service are provided by various
governments, bodies and individuals. Support comes in many different forms.
These include direct financial assistance for start-ups to assisting with
management problems in existing businesses. The importance of providing
training, counselling and advice is widely recognised.
The present South African government has acknowledged the importance of
SME development and has established many bodies to support the start-up and
growth of SMEs. Although much of this support is in the form of financial
assistance, the impact thereof is still unsatisfactory. The literature also reveals
that the government’s capacity is limited and support programmes tend to be
driven at national level.
The majority of support bodies in South Africa are in the Gauteng area.
However, these bodies are fragmented and in the hands of so many role players,
and the interventions aimed at personal motivation and entrepreneurial skills tend
to be the exception rather than the rule (Nieman in Nicolaides & Reddy,
2004:207). Not much is done to ensure entrepreneurial activity for the
impoverished masses.
The literature reveals that there are many different types of interventions and
programmes available in South Africa that SME owners can use to help them
start a business, survive and grow the business. However, the problem is still
there and certain questions remain unanswered in respect of most interventions.
How successful are these interventions? Do they increase productivity, return on
investments, return on assets, return on equity, profit/loss accounts, market share
and/or sales growth? Do they cause the business to grow? Are the interventions
according to the specific needs of SMEs and do those who supply the assistance

130
know what the needs are? Which interventions would probably enhance the
success rate of SMEs in South Africa?
The literature does not satisfactorily reveal the detail and the success of
interventions. There does not seem to be quality control or feedback regarding
the assistance (financial and non-financial) provided by government or the private
sector. The literature does, however, reveal the fact that while a substantial
amount of both financial and non-financial assistance is offered, the failure rate of
SMEs is extremely high. This seems to be a worldwide phenomenon.
The next chapter looks at the meaning of success, when a business can be
judged as being successful, the different needs of the SME owners and what
government could do to assist SME owners.

131
CHAPTER 4
SUCCESS FACTORS FOR SMALL AND MEDIUM ENTERPRISES
4.1 INTRODUCTION
Chapters 2 and 3 covered the history of SME development in South Africa as well
as the different types of assistance provided to SME owners. The questions that
remain are whether the assistance provided actually meets the needs of SME
owners, causes the SMEs to be more successful and enables them to grow in the
long run. Although some research has been done on SME interventions, it is still
not clear exactly what type of assistance in all its facets does actually enhance
the success rate of SMEs.
This chapter looks at the different definitions of, and views and ideas on success,
and when a business can be judged to be successful. The different needs of
SME owners and what government could do to assist them will also be
examined.
4.2 WHEN IS AN SME SUCCESSFUL?
There seem to be many definitions of, and views and ideas about the success of
an SME. Because the owners of such businesses have different reasons for
starting an SME, their goals and their views on success also differ. Whatever
their view of success, it needs to be measured to determine whether or not they
are successful. There are also different ways to measure the level or degree of
success. The literature reveals that success comes in many forms and with
many measurements.

132
“Making a living is important but going beyond that is not often seen of great
concern by SMEs.” A study in Finland showed that entrepreneurs are likely to
measure their performance (success) by other criteria and find success in job
satisfaction and satisfied customers (Reijonen & Komppula, 2007:689). In this
study many small-firm entrepreneurs set non-financial goals and mentioned a
“no-growth” objective. At the same time they did not regard maximisation of profit
as an important goal. The desire for independence is the biggest motivational
factor for the small firm owners (Reijonen & Komppula, 2007:693).
Bill Gates, the owner of Microsoft, is an example of monetary success, Sister
Theresa, who did mercy work in Calcutta, India, was a spiritual success and
Stephen King, the author of numerous thrillers is a literary success. Egelhoff
(2006:1-2) also considers many of his teachers to be great successes although
none of them were wealthy. He states that money is the most common measure
but not the best. His further thoughts on success involve being able to look at
what you have accomplished, that at least one person is better off because of
your efforts and that you have somehow made a difference, be it long or short
term (Egelhof, 2006:1-2).
According to Cornwall (2006:1), it is often assumed that the primary reason for
starting a business is money and that profit is the only measure of success. He
says that this thought is really another myth about entrepreneurship.
Entrepreneurs evaluate and measure success in different ways as indicated
below.
• the jobs they create
• the satisfaction of their customers
• creating an environment that fosters human development and provides for
the common good
• self-satisfaction

133
• self-fulfilment
Rodriquez (2006:1) also gives different answers to the question of what success
is, including the following:
• achieving independence, control and security
• power, acclaim and money
• having friendship
• rising from failure
Although financial success is clearly fundamentally important to all entrepreneurs
it is often viewed as a natural outcome of pursuing what each entrepreneur views
as his or her real success (Cornwall, 2006:1).
Rodriquez (2006:1) states that it is tough to define success but that a business
usually passes through several milestones, which when achieved, prove that the
business is on the right track. These milestones serve as indicators that the
business is growing and expanding in the right direction. He discusses the
following three indicators:
• Achieving the break-even point. Profit only comes after the break-even
point has been exceeded. The business owner must calculate the break-
even point, showing what level of sales is needed to offset all fixed costs of
doing business and the variable costs of producing products. This is the
point where expenses equal income, showing zero profit. Achieving this
point on a monthly basis is an indication that the business may be viable.
• Earning a living wage. If a business can provide the owner with a living
wage, it is starting to do well. This could mean that there is no profit yet.

134
• Achieving real profit. According to Rodriquez (2006:2), real profit is when
the business is providing cash after all costs, including salary. At this point
the business is more valuable than its assets. It is generating a return on
investment and has a positive cash flow.
Conradie and Fourie (2002:136) include direct labour cost in the calculation of the
break-even point. Thus, if the owner’s wage/salary is seen as a direct labour
cost, it will be included in calculation of the break-even point. This means that
when break-even is reached, there is zero profit and zero loss, but the owner has
received a living wage as described by Rodriquez in the previous section.
Rodriquez does not seem to include the owner’s wage/salary as a cost item.
Another definition by Driver, Wood, Segal and Harrington (2001:11-16) of a
successful business is one that has survived from the start-up phase to the new-
firm phase. The start-up phase includes businesses that have not paid
salaries/wages at all or have paid them for only three months, while new firms are
businesses that have paid salaries and wages for more than three months but for
less than three-and–a-half-years.
According to Foxcroft, Wood, Kew, Herrington and Segal (2002:31), a business
that has paid salaries and wages for more than three-and-a-half-years is an
established firm. A business that has become an established business is also a
successful business.
Nieman and Bennett (2002) state in their lecturer’s guide, that a business is
reasonably successful because it has been in business for five years.
Success can also be defined in terms of return on investments, return on assets,
return on equity, profit/loss accounts, market share and sales growth. Factors
such as customer satisfaction, customer loyalty, image and product service

135
innovation may also be considered, but Garg, Joubert and Pellissier (2004:7-19)
found that they are not valid dimensions for measuring business performance.
They did, however, find that business growth and profitability (the ability to
generate income) show a high degree of correlation, indicating that business
growth is aligned with profitability, that growth for profitability is a major concern
and that profitability still remains the key measure of business performance in the
South African banking sector.
Because financial success is fundamentally important to all SME owners and
seems to be a common denominator in most of the definitions of a successful
business, it is doubtful whether a business will continue in the long run if it does
not make a profit. The other factors referring to a successful business differ from
one owner to the next, and are often subjective and fairly difficult to measure.
As indicated in the definitions of success, some business owners see themselves
as successful if they can earn a living wage, while others regard themselves as
successful only once they make much more. If making money or profit equals
being successful, business owners need to measure how much money is made
to determine how successful they are.
The amount of money made is measured by looking at the business’s profit. To
maximise profit, business owners strive to achieve the maximisation of the
surplus of sales income received over the total costs incurred (Marx et al.,
2001:117).
Profit maximisation can also be related to the capital employed, which is a more
meaningful concept than the isolated profit figures. This refers to the rate of
return (Marx et al., 2001:118) or the return on investment (Conradie & Fourie,
2002:14), also known as profitability. The reason why it is more meaningful is
that the percentage ratio is calculated between the net profit earned in a specific
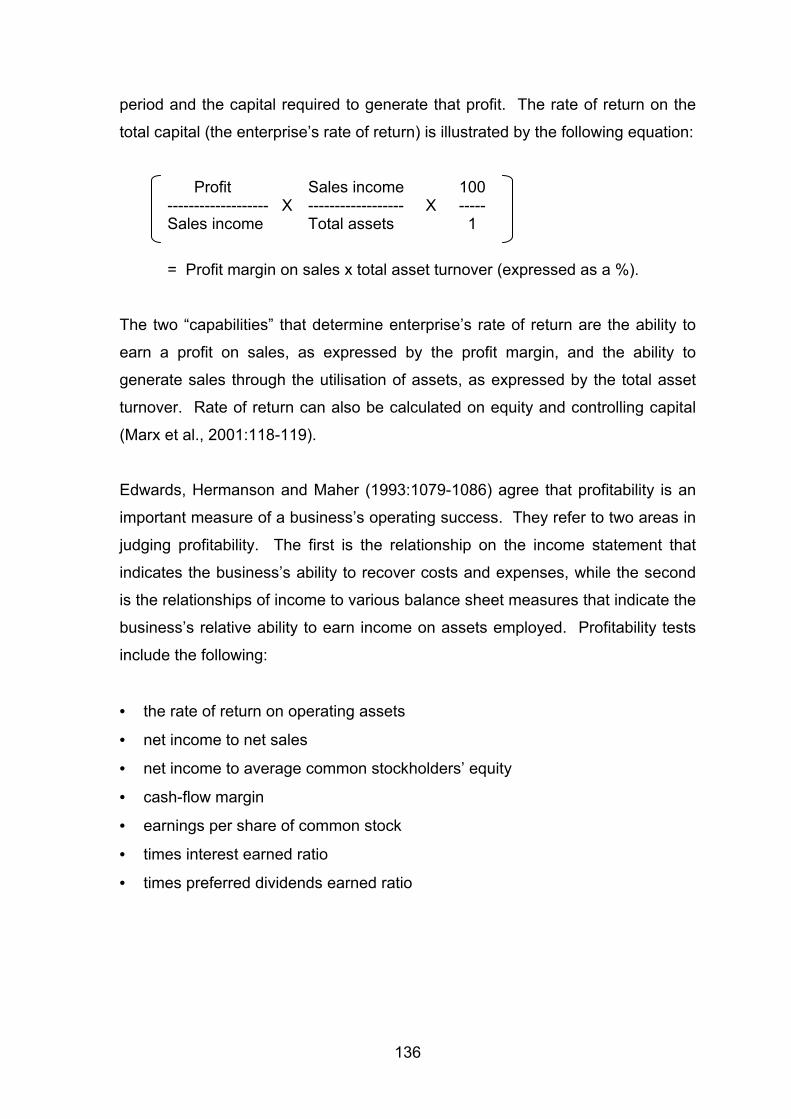
136
period and the capital required to generate that profit. The rate of return on the
total capital (the enterprise’s rate of return) is illustrated by the following equation:
Profit Sales income 100 ------------------- X ------------------ X ----- Sales income Total assets 1
= Profit margin on sales x total asset turnover (expressed as a %).
The two “capabilities” that determine enterprise’s rate of return are the ability to
earn a profit on sales, as expressed by the profit margin, and the ability to
generate sales through the utilisation of assets, as expressed by the total asset
turnover. Rate of return can also be calculated on equity and controlling capital
(Marx et al., 2001:118-119).
Edwards, Hermanson and Maher (1993:1079-1086) agree that profitability is an
important measure of a business’s operating success. They refer to two areas in
judging profitability. The first is the relationship on the income statement that
indicates the business’s ability to recover costs and expenses, while the second
is the relationships of income to various balance sheet measures that indicate the
business’s relative ability to earn income on assets employed. Profitability tests
include the following:
• the rate of return on operating assets
• net income to net sales
• net income to average common stockholders’ equity
• cash-flow margin
• earnings per share of common stock
• times interest earned ratio
• times preferred dividends earned ratio

137
In finding an appropriate definition to describe a successful SME for this study the
following two definitions were mainly studied and the second one selected for the
purpose of this study:
(1) A successful SME owner is one who creates work at least for himself or
herself but also for others, who has supported this for at least a period of
one year, whose business is profitable, who functions autonomously and
who generates an income for himself or herself. Owners do not
necessarily specify growth as an objective but see themselves as
successful if their businesses are profitable (Nieuwenhuizen, 1999:12).
(2) A successful SME is one that has been in existence for at least four years,
has been profitable and has shown growth over the preceding three years
(Nieuwenhuizen and Groenewald, 2006:70).
If this is the definition of a successful SME, in this study the researcher will
endeavour to determine what type of interventions could cause SMEs to be
successful or more successful.
The literature on this topic is limited and not specific about what type of
interventions actually cause success. However, there are some sources dealing
with the needs of SME owners and these needs should indicate to some extent
what options could assist them.
4.3 THE NEEDS OF SME OWNERS
4.3.1 Access to expertise
SMEs consider access to expertise to be the single most critical resource for their
business. A study conducted in 2005 revealed that according to 91% of more

138
than 6 000 SME owners, expertise is important in starting and running their
businesses, while only 2% believed it not to be (Goldstuck, 2005:1).
Nieuwenhuizen (1999:58-159) identifies the use of experts as one of the success
factors of a SME. She comments that successful entrepreneurs usually have
enough knowledge and skills to ensure reasonable success. They are fully
aware of their own deficiencies and make use of experts for advice and
assistance to improve their performance. Successful entrepreneurs see
themselves as competent in the entrepreneurial, management and
technofunctional roles. However, later in her study (p. 166) she warns about the
manner in which advice is given. She recommends that SME owners need to be
assisted to implement the advice as they do not always have the ability,
understanding and knowledge to do it themselves.
Nieuwenhuizen (1999:168) proved in her research that “knowledge and skills
regarding the business” and “the use of competent consultants” are closely
related. She also identified the use of competent consultants as a vital success
factor that is strongly related to an enterprise’s success.
In a survey by Burke and Jarrat (2004:8), the respondents agreed that they would
act upon advice given to them that is practical and based on hard experience. It
all has to do with “profitability” and “relatability”. The problem they had was that
such information is not always available to SMEs and the information available is
strategic and refers to big business.
A study in the USA involving successful entrepreneurs revealed the following
responses to a question on the importance of proper advisors (Entrepreneur
Interview Series, 2004):

139
• “is essential to the success”
• “is very important towards achieving success”
• “are KEY to the success”
• “if you want your business to grow, find someone who knows about business”
• “is very important”
• “advisors are critical”
• “it helps big time”
• “mentors are an essential key to your success in business”
• “extremely important”
• “proper advisors are crucial”
All these responses seem to be extremely positive and the businesspeople
concerned do not seem to doubt the significance of proper advisors.
4.3.2 Access to finance
Access to finance was not far behind (in the same study in the previous section),
with 88% of the respondents claiming it to be crucial for the business. Roy Ross,
Director: Business Banking of Standard Bank also confirms that the main
constraint to the development of the SME sector is the knowledge and skills of
the entrepreneur rather than access to finance. It is equally important to know
how to access finance as it is to know where to get it (Goldstuck, 2005:1).
A combination of expertise and financial resources appears to be the bedrock on
which the growth of the SME sector should be built.
4.3.3 Information technology
Burke and Jarrat (2004:10) found that the rate of technological change per se
was a driver of information search. It is not the technological nature of the
information that is the issue, but the competitive advantage that may result from

140
following that information or advice. The point is that keeping up with new
technology can provide an advantage.
4.3.4 Education and management training
The high school education system in South Africa basically teaches pupils to
conform, and entrepreneurs are generally not conformists. It is about
reproducing what they have learnt and not about their own original thoughts and
creativity. Entrepreneurs usually succeed in doing something different from their
competitors. They make a plan, improvise and invent. The more educated a
pupil becomes the less likely he or she is to start his or her own business. There
are many entrepreneurs who do not have degrees or even a grade 12
(Hetherington, 1986:23).
During a study in the USA, successful entrepreneurs were asked what value they
place on formal and informal education for a future businessperson. They were
also asked about the importance of a college degree such as an MBA.
Regarding formal education, most of the respondents mentioned business
experience, on-the-job experience, the real world and informal education as vital
factors. Formal education did not seem that important to most of them
(Entrepreneur Interview Series, 2004).
Entrepreneurs would benefit from education, especially management training. In
South Africa, there is the need to increase the learning and training opportunities
for new entrepreneurs and to develop networks to assist them. In ancient times
in countries such as Greece, Persia, India and Babylon, a business was passed
down from a father to his sons who were encouraged to continue and maintain a
competitive edge in the market. In this way entrepreneurial training was directly
influenced by personal relationships rather than by formal education. Soon
craftsmen gathered and created associations to protect their interests and
common trades. These groups appointed experts in their fields to conduct quality

141
control and serve as mentors to new entrepreneurs. They offered strong support
in the form of advice and assistance (Nicolaides & Reddy, 2004:204-205).
Anyone cannot simply decide to open a business and be successful in doing so.
An entrepreneur needs to be at least educated, trained or skilled in some way
and together with that make use of experts/specialists in those areas in which he
or she is incompetent. It is vital for entrepreneurial training to form the
cornerstone of a supportive environment, because it equips SME
owners/managers with the skills necessary to succeed. A training perspective is
that failure can be avoided by exploring the circumstances from which failure
arises. Success often depends on management’s ability to respond quickly to
changing circumstances (Van Eeden et al., 2003:14).
Although there are many competent businesspeople with outstanding ideas,
many of them do not know how to manage a business and have no underlying
appreciation of business fundamentals. These businesses then fail because of
poor management skills and a lack of business knowledge. Established
businesses often fail as a result of the entrepreneur’s inability to adapt to the
changing needs of the business (Nieuwenhuizen, 2005a:6).
More often than not, increasing productivity lies in the human resource
component of the business. It is thus necessary for entrepreneurs to understand
how practices and processes designed to utilise the knowledge, skills and
abilities of the employees can lead to greater productivity and performance
(Ciavarella, 2003).
Van der Merwe (2004) reports that women on the Women Entrepreneurship
Programme (WEP) at the University of Pretoria have a greater need for ongoing
support once they have started their businesses because they lack management
experience and access to networks. The WEP was developed to train and assist
entrepreneurs to start and grow their businesses. Because training programmes

142
generally place little emphasis on the provision of after-care training, care and
advisory service for the ongoing firms, the WEP also takes care of post-care
training in the form of business mentors and advisors, and this is what makes it
unique. Further research into the WEP will, inter alia, also determine how after-
care support and mentoring can be established.
Walker, Redmond, Webster, & Le Clus (2007: 294-304), explored the claim that
small business owners are “too busy to be trained”. In Western Australia they
found that small business owners/managers are not too busy to be trained given
certain conditions. They will participate in training opportunities if they are
directly applicable to current situations in their businesses and if the delivery
process is carefully structured in terms of locations, time of day and length of
session.
4.3.5 Working experience
An impact study by the Business Place revealed that the most likely SME owners
to succeed are those with some work experience, some access to own capital
and some understanding of their market and customer base (Verran, 2004).
Man (2006:317) found in a study on the patterns of entrepreneurial learning that
entrepreneurial learning was affected by various input factors of which most
importantly different forms of experience which those entrepreneurs developed
before or along with the learning experience. These business people improved
and reflected upon experience and successfully transferred prior experience in
current practices.
4.3.6 Business sense
According to Dyer (1997:9), successful entrepreneurship requires clarity of vision
and purpose, a keen sense of business opportunities to realise the vision, bold

143
ideas on how to exploit perceived opportunities and well-managed action to
follow up on those ideas. He further explains the two key thrusts or dimensions
that can be distinguished in terms of the overall process of entrepreneurship.
The “opportunity orientation” of a business is measured by the degree to which
the business owner or manager effectively identifies new opportunities, generates
new ideas to respond to these opportunities, develops the selected ideas into
marketable products or services, and implements the ideas. The “systems
orientation” of a business is measured by the degree to which the business
effectively develops organisational systems; processes structures to manage its
activities; categorises similar types of opportunities; identifies patterns across
different categories of opportunities; realises benefits from managing economies
of scale; anticipates and manages risks; and creates strategies for the realisation
of value from future streams of opportunity.
4.3.7 Informal sources
Informal sources such as business alliances and the Chamber of Commerce are
preferred over the more formal sources, the latter being generally regarded as
providing information and advice that are not specific to the context in which
SMEs operate. The formal providers appear concerned about the legal
implications of their advice. This cautiousness tends to render the information
provided through these sources irrelevant in the strategic decision-making
process. These findings correlate with those of Hill et al. (1999) supporting the
importance of personal business relationships in providing information for
decision making. Such relationships are built on trust and the advice given is in
the interest of the business partner (Burke & Jarrat, 2004:10).
4.3.8 Government assistance
Assistance does not only come from consultants but also from government.
According to the 2004 SME Survey, 62% of respondents experienced

144
government initiatives as negative and the impact of government initiatives on the
effect of the competitiveness of SMEs was found to be minimal. This
corresponds to the 2005 figures (Anon, 2005).
A study by Goldstuck (2005:1) recommends that government should restructure
support plans to provide expertise in a meaningful fashion for SMEs. She states
that one of the reasons many government initiatives fail is because of the level of
expertise expected from SMEs when dealing with the complexities of qualifying
for grant funding. Government should provide the expertise instead of
demanding it. Orford (2004:51) also suggests that government should reduce
direct provision of support in favour of facilitating commercially-driven private
sector provision of business development services.
As stated earlier, access to expert knowledge and financing remain the principal
factors that enable SME owners to run their businesses successfully.
Government, however, expects SME owners to have a certain level of
knowledge, for example, of complex regulatory issues, when this is not the case.
Secondly, financing plays a key role, not only when starting a business (mainly
the focus of government grants), but also in respect of its competitiveness and
survival. This is probably one of the reasons why so many government
programmes fail (Ueckermann, 2005a:8).
More than 20 years ago, Hetherington (1985:22) observed that finance was
seldom the most significant factor to ensure the success of SME owners. More
recently, Jackson (2004:8-11) agreed, and remarked that the needs of SMEs are
more in the areas of bookkeeping, securing raw materials, the type of equipment
to purchase, costing and marketing and the fact that these needs are best met by
regular visits from sympathetic, experienced businesspeople. These visits should
be at the place of work with a person-to-person discussion. He further believes
that retired directors who were active in the specific field could meet this need.

145
4.3.9 The gender issue
This study did not determine or take the gender of the business owner into
account, but it seems that “special assistance” is necessary when assisting
female business owners. According to Tillmar (2007:93-95), business advisors
need adequate training in gender issues to ensure an unbiased approach. They
need to take into account that apart from the general problems small business
owners face, women also need to handle the gender-system in society and the
expressions of this that they encounter.
4.4 CONCLUSION
Entrepreneurs make use of advisors such as attorneys, accountants, banks and
business consultants. Information on the number or of consultants required by
SME owners, their status, what they do for the businesses and the value their
service adds, is not known and merits further research.
Although little information is available on the process and importance of the use
of advisors, entrepreneurs generally agree that they need assistance and
expertise to start as well as on-going support once the business is up and
running.
Finance does not seem to be the primary need to ensure improved performance,
but amongst other things, human resources factors, advice based on experience,
keeping up with new technology and the fact that informal sources are preferred
over more formal sources.
According to Madell and Adam (2002:13), it is clear that South Africa can benefit
much from experiences in business support policies and strategies elsewhere in
the world. South Africa should reform its business support policies and strategies

146
in order to meet the objectives of increasing economic growth and reducing
employment and inequalities in our society. This would involve establishing a
network of business support agencies that includes professional, technical,
academic and other institutions. It would also entail placing greater emphasis on
promoting entrepreneurship and discouraging public sector emphasis on linking
business development to social welfare programmes. In conclusion, additional
legislative and funding policy changes are required to make the environment
more conducive to local economic development.
The next chapter will describe the research methodology used in this study.
147
CHAPTER 5
RESEARCH METHODOLOGY
5.1 INTRODUCTION
This chapter deals with the research methodology used in this study. The
research methodology forms the backbone of and guides the planning,
organisation, analysis and interpretation of the data. The methodology dictates
the data gathered, dictates the approach to be adopted so that meanings that lie
below the surface of these data become manifest, and draws a conclusion or
series of conclusions that leads to the expansion of knowledge (Leedy, Newby &
Ertmer, 1997:9).
It is necessary to understand how the data were gathered in order to assess the
research findings, interpretations, recommendations and conclusions and judge
the validity and reliability of the data (Ali, 2003:293).
The steps in the research process will be discussed within a theoretical
framework. The objectives of the study will then be reviewed and the
methodology used in the study discussed.
5.2 STEPS IN THE RESEARCH PROCESS
The literature review revealed different steps by different authors in the research
process. Tustin et al.’s (2005) model was chosen for this study because it was
found to be systematic, complete and easy to use for the research problem in
question.

148
This model is depicted in figure 5.1. Firstly, the theory of the model will be
discussed and then the application thereof.

149
Figure 5.1: Steps in the research process
8. Collection/
editing
9. Coding
10. Capturing/cleaning/storing
Source: Adapted from Tustin et al. (2005:76)
2. Define research problem/
opportunity
1. Identify research problem
3. Establish research objectives
4. Determine research design
5. Identify information types and resources
Primary
research
Secondary
research
6. Develop 7. Design sample research plan instrument
DATA
11. Data analysis
12. Present research findings
13. Follow-up

150
Step 1: Identify the research problem or opportunity
Step 1 involves identifying a problem or opportunity. The problem/opportunity
usually arises from the continually changing and uncertain business environment
in which businesses operate. This step requires an understanding of the
decisions to be made and the problems or opportunities to be identified (Tustin et
al., 2005:77).
The first three steps guide the research and are critical in the process. If they are
correct, the research has a good chance of being useful and appropriate. If not,
the research will be a waste and irrelevant (Tustin et al., 2005:77).
Step 2: Define the research problem or opportunity
Steps 1 and 2 should be viewed together. Once a problem/opportunity has been
identified, the researcher comes into the picture. The researcher and the
relevant manager in the business clearly establish the problems that have been
observed and then define precisely what the research problem is. The
management decision problem is translated into a research problem for the
researcher. This means that the researcher obtains information effectively and
efficiently to help management make a decision and take action to solve the
problem.
This process of defining the research problem requires more insight and creativity
than any other step in the process. This is a critical part of the process. The
researcher might have to do additional exploratory research to define the exact
nature of the problem and gain a better understanding of the environment.
McDaniel and Gates (Tustin et al. 2005:79) identify the following three key
questions to be answered at this stage:

151
• Why is the information required? The researcher needs to know why the
information is required and what decisions will be made on the basis of the
results. The more information available to the researcher, the easier it will be
to identify the essence of the problem.
• Does the information already exist? If sufficient secondary data are available,
it might not be necessary to collect primary data.
• Can the question really be answered? The researcher should be sure that the
required information is available or can be readily obtained, otherwise time
and effort will be wasted in pursuit of the wrong problem.
See section 5.2.2 for the answers to the above questions.
Step 3: Establish the research objectives
These objectives reflect the exact information (what management need to know
in research terms) required to address the problem/opportunity and make a
decision. It must be specific and unambiguous. According to Aakar, Kumar and
Day (Tustin et al. 2005:81), research objectives have three components:
• the research question that specifies the information the decision maker needs
• the development of hypotheses that are essentially alternative answers to the
research question (information needs to be gathered to test the hypotheses)
• the scope and boundaries of the research
The research objectives and hypotheses are explained in section 5.2.3.
Step 4: Determine the research design
The research design is the plan to be followed to realise the research objectives
and answer the hypotheses. It specifies the methods and procedures for
collecting and analysing the required information. Different factors such as

152
research costs, the quality of the research information provided and the time
constraints influence this design. Tustin et al. (2005:83) provide the following
classification of research approaches or research design types by data collection
method:
• Exploratory research. This is done by collecting internal and external
secondary data. Data can be collected by means of in-depth interviews, focus
groups, online chat rooms and e-focus groups.
• Descriptive research. Data can be collected by means of personal
interviews, mall intercepts, telephone interviewing, mail surveys, facsimile
surveys, panels, Web-based surveys, e-mail surveys and online panels.
• Causal research. Data are collected through experimentation.
Some authors like Aaker and Day (1990:25) include in this step the design of the
questionnaire, specifying the sampling plan and designing the experiment.
Malhotra (1993:25) includes the following eight steps in the design phase:
(1) secondary data analysis
(2) qualitative research
(3) methods of collecting quantitative data
(4) definition of information needed
(5) measurement and scaling procedures
(6) questionnaire design
(7) sampling process and sample size
(8) plan of data analysis
Although all these steps are part of the research design, the researcher in this
study will handle these issues as separate steps as indicated in Tustin et al.’s
(2005:76) model.
153
The research design is explained in section 5.2.4.
Step 5: Identify the information types and sources
The method(s) of data collection now needs to be stipulated. Data should be
valid, reliable and easy to obtain within a realistic timeframe, affordable and
relevant to the problem. Data sources are divided into the two main groups of
secondary and primary data and there are numerous ways to in which to gain
access to them.
Secondary data are already available in the form of existing information. Primary
data are collected specifically to address the research objective if secondary data
are insufficient (Tustin et al., 2005:88-89).
When the researcher has to collect primary data, he or she should choose the
most appropriate research approach (quantitative or qualitative research) as well
as the most appropriate primary data collection method.
Quantitative research usually involves collecting primary data from large numbers
of individuals with the intention of projecting the results to a wider population
where the aim is to generalise about the specific population. Qualitative research
generates data that are frequently difficult to quantify. This research approach is
often expressed as personal value judgements and it is difficult to draw any
collective general conclusions. The difference between quantitative and
qualitative research methods is based on sampling methodology and not the type
of data generated (Tustin et al., 2005:89-91).
Information types and resources are identified in section 5.2.5.
154
Step 6: Developing a sampling plan
Although sampling is part of step 4 (the research design) it remains a separate
step in the process. A sample is a subset of the population. Diamantopolous
and Schlegelmilch (1997:18-19) explain the following five steps of sampling:
• Define the population or universe. This is the group from which the
sample will be drawn.
• Specify the sample frame. This is where the listing or directory from which
the sample will be drawn is specified.
• Select the sampling method. The researcher must specify whether a
probability or non-probability approach will be applied as well as the way in
which the sample units will be selected.
• Determine the sample size. The researcher specifies the number of sample
elements to be included in the final sample.
• Draw the sample. The operational procedure for the selection of the sample
is specified.
The detail of the sample plan is discussed in section 5.2.6.
Step 7: Designing the research instrument
A questionnaire or interview sheet is designed to collect information from the
sample population. Only essential questions are included. They may be
structured and/or unstructured. The types of responses may be open or closed
ended. Closed-ended responses can be categorised into dichotomous, multiple-
choice and scaled responses (Tustin et al., 2005:98).
Malhotra (1993:319) notes that there are no scientific principles that guarantee an
optimal or ideal questionnaire and because of this questionnaire design skill is
acquired through experience. It is an art rather than a theory. There are,

155
however, useful guidelines in designing questionnaires that new researchers can
use. Malhotra (1993:319) also presents a series of steps for questionnaire
design. They are as follows:
1. Specify the information needed.
2. Specify the type of interviewing method.
3. Determine the content of individual questions.
4. Design the questions to overcome the respondent’s inability and
unwillingness to answer.
5. Decide on the question structure.
6. Determine the question wording.
7. Arrange the questions in proper order.
8. Identify the form layout.
9. Reproduce the questionnaire.
10. Pre-test the questionnaire.
A questionnaire was compiled and used as instrument to collect data. The
design details are discussed in section 5.2.7. A copy of the survey questionnaire
is included in appendix A of this study.
Step 8: Collecting and editing data
The data collection process is also referred to as fieldwork. It involves all the
functions relating to conducting interviews such as the selection, training and
supervision of the people who collect data. One must also keep in mind that the
nature of fieldwork varies with the mode of data collection, the latter referring to
in-house, telephone, mail and mall interviews, focus groups and online.
Fieldwork also involves control, which means determining whether the interview
actually took place and verifying the information collected, and includes following
up incorrect and uncertain responses. This is referred to as editing.

156
The data collection process is discussed in section 5.2.9.
Step 9: Coding data
The responses on the completed questionnaires are coded. This involves
allocating numerical values to the responses and thus transforming them into
computer-readable format that can be transferred to a computer.
See section 5.2.10 for details.
Step 10: Data capturing, cleaning and storing
When the coded data are typed into a computer this is referred to as data
capturing. This can be done by using computer data-capturing packages such as
spreadsheets (such as Excel and Quattro Pro) or Statistical Package for Social
Sciences (SPSS) Data Entry. Once this has been done, any mistakes must be
corrected. This process is referred to as data cleaning. There are techniques for
finding or verifying mistakes. Finally, the data are stored electronically.
See section 5.2.11 for details.
Step 11: Data analysis
The purpose of data analysis is to interpret and draw conclusions from the mass
of collected data. Clear analysis objectives must be set which serve as a guide
to the analysis process (Diamantopolous & Schlegelmilch, 1997:62-63).
According to Tustin et al. (2005:103-106) the focus of any analysis can only take
on one of three basic forms. These are as follows:

157
• Descriptive analysis. The aim is to provide a summary of the sample in
terms of the variables of interest. A number of statistical techniques can be
used for this purpose. They include frequency distributions, location
measures (mode, median and mean), variability measures (index of diversity,
range, variance and standard deviation) and skewness and kurtosis
measures.
• Estimation. The aim of an estimation focus is to use the information
available from the sample to estimate the situation that is likely to exist in the
population as a whole.
• Hypotheses testing. The aim is to test specific proportions of the variables
of interest and use the evidence provided by the sample to draw conclusions
about these proportions for the population as a whole.
See section 5.2.12 for details on the data and method of data entry as well as the
data analysis techniques used in this study.
Step 12: Presentation of research findings
The results have to be communicated by writing a research report. When
structuring the report, factors such as the type of audience/client, the research
topic and space/time constraints should be taken in to consideration, because
they will have an impact on the format of the final report.
Step 13: Follow-up
Tustin et al. (2005:107-108) suggest that it is essential to establish whether the
research findings presented to a client or management are actually accepted and
used. Research that reduces uncertainty and influences decisions is far more
likely to be utilised. Research will make a contribution to management decision
making when it is relevant, timely, efficient and accurate.

158
In the remainder of this chapter the researcher will attempt to explain the
research methodology, based on the model of Tustin et al. (2005:76), used
for this specific project.
5.2.1 Identify the research problem
On analysing the situation in South Africa, the researcher found that a great deal
of assistance, mostly in the form of financial assistance, is available to SME
owners. With this in mind, the failure rate of SMEs in South Africa is still
extremely high. This, however, appears to be a universal phenomenon.
5.2.2 Define the research problem/opportunity
In the researcher’s opinion, the assistance, support and training suggested by the
South Africa government and provided by many consultants, advisors, specialists
and trainers of SME owners are not always adequate, do not always focus on
those areas that will necessarily enhance their success rate and do not
necessarily contribute to their success.
This problem led to the researcher posing the following questions:
• In which areas, and how, are SME owners being assisted?
• To what extent do consultants assist entrepreneurs and SME owners or
become part of their businesses?
• What are the consequences of consultants assisting entrepreneurs and SME
owners? Are they successful?
• Are there any shortcomings in this process of assistance?
• What types of assistance contribute to the success of SME owners?
This information is required so that assistance to SME owners is more
meaningful and enables them to be more successful. Specific and meaningful

159
information on this issue is lacking as indicated in the literature study. At this
stage it is impossible to say whether or not the question can be answered, but it
is surely worth the time and effort to find out.
5.2.3 Establish the research objectives and formulate the hypotheses
This section reviews the research objective formulated in chapter 1. The primary
objective of the study was to analyse business interventions and to determine
their effect on the perceived success of South African SMEs.
The secondary objectives of this study are as follows:
• to determine in which functional areas the SME owners are receiving
assistance
• to determine the amount of time the consultants (including all those assisting
the SME owner) spend with the business
• to determine during which stage of the business life cycle assistance is
rendered
• to determine a profile of the provider of the assistance
• to identify any shortcomings in the process of assistance
• to determine to what extent the respondents rate Cofesa as a provider of
assistance.
The following null hypotheses (Ho) relating to the research problem were tested
against alternative hypotheses (Ha):
Ho1: There is no relationship between the types of businesses owned/managed
by the respondents and the success of the businesses.
Ha1: There is a relationship between the types of businesses owned/managed by
the respondents and the success of the businesses.

160
Ho2: There is no relationship between the period in the business cycle in which
the assistance was provided and the success of the businesses.
Ha2: There is a relationship between the period in the business cycle during
which the assistance was provided and the success of the businesses.
Ho3: There is no relationship between the way the respondents were assisted
and the success of the businesses.
Ha3: There is a relationship between the way the respondents were assisted and
the success of the businesses.
Ho4: There is no relationship between those who provided the assistance and the
success of the businesses.
Ha4: There is a relationship between those who rendered the assistance and the
success of the businesses.
Ho5: There is no relationship between the period of time of assistance and the
success of the businesses.
Ha5: There is a relationship between the period of time of assistance and the
success of the businesses.
Ho6: There is no relationship between the size and the success of the
businesses.
Ha6: There is a relationship between the size and the success of the businesses.
Ho7: There is no relationship between the most important areas in which
assistance was received and the success of the businesses.
Ha7: There is a relationship between the most important areas in which
assistance was received and the success of the businesses.
Ho8: There is no relationship between the qualifications of the respondents and
the success of the businesses.

161
Ha8: There is a relationship between the qualifications of the respondents and
the success of the businesses.
5.2.4 Determine the research design
To realise the research objectives, the researcher firstly conducted exploratory
research by collecting secondary data. The purpose of this was to gain a deeper
understanding and broaden the scope of the research problem. Secondly,
descriptive research was undertaken to attempt to answer the questions that
arising from the research problem.
Although some of the following steps are seen part of the research design, they
will be covered separately.
5.2.5 Identify information types and resources
The researcher explored a wide variety of secondary resources, including
accredited journal articles, other articles found in newspapers and on the Internet,
and government and other reports such as the Gem and SME Survey of
Goldstuck (2005 & 2004). This literature review provided the background
information on the type of assistance available to SME owners. However, it often
failed to reveal how successful these interventions had been.
Primary data were collected by making use of questionnaires and interviewing
the members of Cofesa. All 5 543 members of Cofesa had an equal chance of
being called and those SME owners who had received any type of assistance
were asked to answer the questions telephonically. Once the number of
respondents who fulfilled this requirement reached 200, the process was
discontinued. These 200 can be seen as the sample for the study. The data
were automatically captured on the SPSS spreadsheet.

162
5.2.6 Develop a sample plan
The sample was drawn from all the members (5 543) of Cofesa. To obtain a
sample size of 200 (discussed later in this chapter), 2 658 of the members were
contacted randomly in the different regions of South Africa (quota sampling). A
filter question on making use of any assistance was asked to determine whether
the respondents’ input would be useful for this study. This was done
telephonically. It can therefore be stated that the researcher made use of quota
and random sampling to obtain the results from the 200 SME owners.
5.2.7 Design a research instrument
A questionnaire was compiled and used as the instrument to collect data (see
appendix A for a copy of the survey questionnaire). The questionnaire consisted
of 18 questions. The researcher made use of a range of question types, which
included open-ended, closed, dichotomous and multiple-choice questions. Four
of the questions had the option of "other", making them open-ended as well. The
questionnaire was separated into six distinct areas of investigation:
• Introduction
• Screener section
• Section 1: general business information
• Section 2: shortcomings
• Section 3: successful interventions
• Section 4: demographics
In compiling the questionnaire, the researcher’s chief concern was to keep the
interviews as straightforward as possible and make it easily understandable
without compromising the objective of the study. The options to choose from in
the dichotomous and multiple-choice questions were structured in such a way
that the respondent was not able to choose two options where only one was

163
required. It was also not possible to give any other answer than that of the
options given on the seven-point scale.
The questions were precoded to facilitate calculations on a spreadsheet.
5.2.8 Pilot testing of questionnaire
Data collected must be directly relevant to the research problem (Tustin et al.,
2005:387). This is an important factor to be considered in compiling a
questionnaire and the questionnaire should be designed in such a way that the
research objectives are realised (Ali, 2003:308).
To ensure that the questionnaire achieved the study objectives, it was edited and
tested in the following ways:
Firstly, the questionnaire was edited and quality tested by researcher’s
colleagues in the Market Research and Business Management Departments at
Unisa. This group included the Head of the Bureau for Market Research, the two
supervisors of the thesis and another professor who assists with research in the
Department.
They not only tested for precision of expression, relevance and objectivity, but
also made sure that the questions were simple and easily understandable.
Additionally, they checked and tested for data-capturing relevance.
Secondly, the questionnaire was sent to the CEO of Cofesa to discuss it with his
business consultants. They made sure that the questions would be simple,
understandable and relevant to the study objectives.
Thirdly, the questionnaire was edited by Ask Afrika (introduced at the end of this
section) to make it “call centre ready”.

164
A number of respondents from the population were randomly selected, called and
interviewed. The pilot phase was successful in terms of the responses obtained.
The sample provided, was extremely accurate in terms of the phone numbers
and there were few unusable phone numbers (wrong numbers, etc). Although
two hundred and one (201) calls were required to obtain nine completed
interviews, 41% of the managers/owners indicated that they were busy and
requested the interviewer to call back at a later stage. In the case of 23% of the
numbers called, there was no answer and the phone just rang. Otherwise, the
refusal rate was low and the interviews were successful.
After a few respondents were called and interviewed, the questionnaire was
found to be too long. Respondents were not willing to be interviewed for 15 to 20
minutes. They were too busy managing their businesses and were not willing to
spend so much time answering questions. Subsequently, it was shortened to last
an average of ten minutes per interview. This was acceptable to more of the
business owners. The shortened questionnaire was used for the remainder of
the data collection process.
5.2.9 Collecting/editing data
5.2.9.1 Collecting data
Data were collected by means of questionnaires and the members of Cofesa
were interviewed.
Initially the researcher attempted to collect the required data by making use of a
web-based questionnaire. An electronic mail message was sent to the entire
population, requesting each member to go to the specified website displaying the
questionnaire and complete it electronically. The questionnaire was designed in
such a manner that members could complete it quite easily and within a relatively
short time (about 15 minutes on average). Once the questionnaire was

165
completed, the member would submit it by clicking on a “submit” button. The
data were automatically transferred to a spreadsheet on another website from
where calculations would have been done.
This method of collecting the data was not successful at all. The same electronic
mail message was sent to the members twice in two weeks. During the three
weeks that followed after the last message was sent, only four members had
responded by completing the questionnaires. The researcher then decided to
change the data collection method. Each member of the population would be
called telephonically and interviewed.
The data were collected by means of computer-aided telephonic interviewing
(CATI). CATI can be described as the use of computers to automate the key
activities of a telephone interviewing facility. The CATI system uses computers to
assist in conducting the interviews. A computer controls the questionnaire, so
skip patterns are executed exactly as intended, responses are within range, and
there are no missing data. Answers are entered directly into the computer which
enables the researcher to start the data analysis immediately. The system also
handles the administrative and telephonic functions associated with interviewing,
such as sample management, quota control, call disposition monitoring,
productivity reporting, Rapid Dial or predictive dialling, interviewer monitoring and
rating, and voice capture. CATI requires that the computers used be linked
through a network to a main server that functions as a central storage location for
sample and data (Sawtooth Technologies, 2008).
Ask Africa, which is a professional, strategic research partner that applies active
intellect and connectivity to provide credible research results, was used to collect
the data required. Ask Afrika’s interview quality is underpinned by rigorous
standards. This includes the thorough training of interviewers, the use of an
interview protocol developed according to international standards, as well as a
specialist team of quality assessors monitoring each survey from start to finish.

166
The researcher was also provided with audio recordings of a sample of
completed interviews. This provided enhanced insight into the interviewing
process and involvement for the researcher in the data collection phase of the
research (Ask Afrika, 2008).
For this study the most advanced CATI software was used by Ask Afrika to
conduct the research and ensure reliable results (Ask Afrika, 2008). The
advanced technology in the call centre ensures quality sampling through random
probability without replacement design, which means that each telephone
number in the population is attempted at least 10 times before a new number is
entered into the sample pool. Telephone interviews are conducted with CATI
software, which provides comprehensive control of projects while affording
complete flexibility that allows users to meet the demands of the target audience.
The researcher is of the opinion that he obtained the best quality, verifiable data
available.
Ask Afrika made use of Ronin’s Results for Research® CATI package which
randomly selects the sample or the numbers that are called. The system
generates a set of completely random numbers in the range 0 – 32 767. Each
time the random set is created regardless of the initial seed value (Ronin manual,
1999:315).
As the above indicates, the members of Cofesa were randomly called (ensuring
that there was no bias and that all the respondents had an equal chance of
selection) within each region and asked whether they would be willing to
participate in this study. Those who agreed to be interviewed, were then asked
whether they had received any form of assistance in relation to business matters,
including training or advice, specialist consultations and expert assistance from a
family member, friend or organisation. The respondents who had received
assistance were then interviewed. Once a total of 200 respondents were
interviewed, the process was terminated. This is 3.6% of the entire population.

167
Also see sec. 5.3.3 where the sample size was calculated using a statistical
formula.
The sample was extremely accurate and a response rate of 3.6% for this target
audience (owners and managers) was good, since owners and managers are
generally busy at work and at times difficult to get hold of. However, to improve
the response rate, it is advisable to send out letters before the phone call is made
to make the managers/owners aware of the survey and also to prepare them for
it. This also shortens the introduction, which in turn shortens the length of the
interview.
There was no need for a weighting process. The data were used as captured in
the survey where, n=200. With such a small and unique universe, a sample of
200 is sufficient. However, if there had been a need to compare it to StatsSA
data, a broader demographic section, asking specific questions, would have been
required.
Two months after the initial interviews, the “unsuccessful” business
owners/managers (those respondents who ranked their businesses from 1 to 3
on an interval scale of 1 to 7 of how successful they thought their businesses
were) were called again and asked the following questions:
• Why are you not as successful as you would like to be?
• What could you do to rectify the problem?
• Would assistance of any kind make a difference?
• If so, in what way would you like to be assisted?
The purpose of the above questions was to gather additional information from the
respondents on the reasons for them being not as successful as they might have
been.

168
5.2.9.2 Fieldwork
The call centre supervisor received a detailed brief containing all relevant
information on the study. Interviewers were briefed and thoroughly trained.
There was continuous contact between the call centre, the project manager, and
the statistician of Ask Africa and the researcher to ensure that everything went
according to plan.
Quality control included listening to recordings of interviews by using Amethyst.
Of the interviews, 15% (30 in total) were assessed. The following elements were
assessed as follows:
Overall
The quality of benchmark of 85% was exceeded; the eventual quality score was
97%.
General aspects (97%)
• Introducing the purpose of call accurately
• Coding accurately
• Clarifying answers when needed
• Ending off professionally
• Clarifying sample details
• Adhering to interviewer notes, etc
Scales (97%)
• Clarifying when needed and coding accurately

169
Professionalism (95%)
• Building a good rapport; using respondent’s surname effectively
• Satisfactory interaction
Options (96%)
• Introducing options clearly, clarifying when needed and coding accurately
Since the interviewers used on the study were experienced interviewers all
aspects of interviewing were well handled and no areas of development were
identified.
5.2.10 Coding data
The coding of the data was done in conjunction with designing the questionnaire.
It was automatically linked to the responses when received in computer-readable
format on an SPSS spreadsheet.
5.2.11 Capturing/cleaning/storing data
Since the data were on an SPSS spreadsheet, the researcher was able to do the
calculations. In finding and verifying mistakes, the researcher checked whether
there was a discrepancy between the total number of cases in the data matrix
and the size of the sample. Because of the way in which the questionnaire was
developed it was not possible to submit out-of-range variables. Mistakes were
corrected and the data electronically stored.

170
5.2.12 Data analysis
The researcher used a variety of data analysis techniques that were the most
appropriate to interpret the data, draw conclusions from the data and realise the
research objectives.
5.2.12.1 Data and method of data entry
The data collected from the questionnaires were mainly organised into nominal,
interval and ratio data. Tustin et al. (2005:592-593) describe these data forms as
follows:
• Nominal data. Nominal data are numbers assigned to individuals such as
“owners”, ”managers” and ”other” such as employees or secretaries
(questions 1, 3, 4, 6, 7, 8, 9, 13 and 14 of the questionnaire).
• Ordinal data. Numbers were used to differentiate between options and to
rank them in order. For example, the most important areas are those in which
the respondents received assistance (questions 5 and 11 of the
questionnaire).
• Interval data. Interval data measured on an interval scale of 1 to 7 such as
the respondents' opinions of how successful they are (question 2 of the
questionnaire). SPSS 14.0 for Windows was used to do all calculations. The
data were directly copied into SPSS.
5.2.12.2. Data analysis techniques
The study was classified as quantitative and qualitative. The sample size was
quite large but the administration thereof was manageable. The type of analysis

171
was statistical and summarised to present thoughts and reasoning. A descriptive
research study was conducted in an attempt to answer the research questions.
The following techniques were used:
• frequency tables and basic tables
• measures of central location and variability
• measures of skewness and kurtosis
• correlations and cross-tabulations
For the "delighted", "satisfied", "dissatisfied" splits for satisfaction with the
success of the business, the researcher could not perform any test of significance
owing to the fact that the base size was too small for the “dissatisfaction”
category. An acceptable base size for significance differences is 30, while for
accurate and reliable significance tests a base size of 50 is required.
a. Frequency Tables
A graphical representation of the data is given. The frequency distribution can be
one-way or cross-tabulated with another variable. It can be grouped or
ungrouped. The graphical presentation can be in the form of a bar chart, pie
chart, histogram and frequency polygon, and/or frequency distributions.
Frequency distributions can be described and compared with one another by
referring to their key properties. From these key properties, summary measures
can be calculated, capturing the essential characteristics of the different
distributions. The summary measures can also be used to make inferences
about the population from which the data were collected (Tustin et al., 2005:523-
538).
The researcher used mainly frequency tables, presenting them graphically in the
form of bar charts.

172
Since not all statistical tests are equally relevant, the appropriate tests must be
used. The researcher did the following:
• To indicate in which areas SME owners were being assisted, the information
was captured on the questionnaires and divided into the different categories
as indicated. The categories were arranged from most assistance to least or
no assistance. The respondents were also asked to indicate the first, second
and third most important areas of assistance. This, firstly, highlights the
areas where SME owners are being assisted, and secondly, those areas they
think are the most important in which they require assistance.
Descriptive statistics was used to summarise the data collected and to
describe the general characteristics thereof.
• It was necessary to establish during which stage of the business life cycle
the assistance was rendered, the ways the assistance was provided, who
rendered the assistance and the period of assistance. Descriptive statistics
was used here to describe the general characteristics of the data collected.
• General shortcomings as well as specific shortcomings in each area of
assistance were identified where possible by the business owners
themselves. The researcher simply grouped similar shortcomings together to
determine their frequency.
b. Measures of central location and variability
There are three measures of central tendency – arithmetic mean (average), the
median (middle value) and the mode (most frequent occurring value) (Tustin, et
al., 2005:538-548).

173
The researcher used of the mean to indicate the respondents” perception of the
how successful their businesses were, showing it on a distribution curve. The
standard deviation was also calculated. It measures statistical dispersion and
indicates how widely the values in a data set are spread.
c. Measures of skewness and kurtosis
The skewness or kurtosis will be close to zero if the distribution of values is
symmetrical and mesokurtical (normal distribution curve) (Tustin, et al.,
2005:554).
d. Correlations and Cross-tabulations
Welman and Kruger (2001:209-212) discuss correlation and cross-tabulation as a
descriptive analysis technique. This technique describes the relationships
between variables and measures the extent to which a change in one variable is
attributed to a change in another.
The researcher attempted to make comparisons (associations between variables)
and looked at the following relationships:
• the success of the businesses and the areas of assistance
• the success of the businesses and the time in the business cycle assistance
was utilised
• the success of the businesses and the way they were assisted
• the success of the businesses and who presented the assistance
• the success of the businesses and the period of assistance
• the success of the businesses and shortcomings identified
• the success of the businesses and the perception that the business was more
successful because of the assistance rendered

174
• the success of the businesses and the stage at which assistance should have
been sought
To determine the success of the businesses, the respondents had to indicate on
a rating scale of 1 to 7 how successful they thought their businesses were. The
categories of “delighted/satisfied/dissatisfied” regarding “success of the business”
were used for the above correlations. However, the base size of the “dissatisfied”
category was too small (only 17) to enable the researcher to conduct any tests of
significance. An acceptable base size for significance differences is 30, while
accurate and reliable significance tests require a base size of 50.
The responses were recategorised into “least successful/satisfied/very
successful”, producing more equal frequencies of the three categories. Because
the base sizes were >50, reliable significance tests could be performed.
To determine and measure the strength of the association of the variables a
proportional reduction of error (PRE) measure, known as lambda (symbolised by
the Greek letter λ) and as Goodman-Kruskal lambda, was calculated. Lambda, a
measure of association, reflects the proportional reduction in error when values of
the independent variable are used to predict values of the dependent variable.
Lambda has a possible range of 0 to 1. A value of 0 means that the information
supplied by the independent variable does not improve the ability to predict the
dependent - hence there is no association between the variables. A value of 1
means that the independent variable predicts the dependent variable perfectly
and that there is an association between the variables.
Values between 0 and 1, say 0.7, have a direct and meaningful interpretation.
These values can be seen as indices of the extent to which one variable helps to
predict another. When multiplied by 100, the value of the lambda indicates the
percentage reduction in error and therefore the strength of the association. A

175
lambda of 0.7 would be interpreted by concluding that knowledge of the
independent variable improves the ability to predict the dependent variable by a
factor of 70%. In other words, the researcher is 70% better off knowing the
independent variable (such as the size of the business) when attempting to
predict the dependent variable (such as the success of the business) than we
are, not knowing the independent variable.
Computation of lambda: In its customary, asymmetric form, lambda = [(SUM(fi) -
Fd]/(n - fd) where f<SUB)I< sub> is the largest frequency for each class of the i
classes of the independent variable, and Fd the largest marginal value of the
dependent variable, and n is sample size. SPSS (which was used to compute
lambda) computes the significance of lambda on the basis of a complex formula
for lambda's standard error (Anon, 2007).
Lambda was used to determine and measure the strength of the relationships
between the following variables:
• the type of business the respondents owned/managed and the success of the
businesses
• the period in the business cycle in which assistance was used of and the
success of the businesses
• the way the respondents were assisted and the success of the businesses
• the assistance provider and the success of the businesses
• the timeframe of assistance (how long the assistance lasted) and the success
of the businesses
• the number of employees in the business (the size of the business) and the
success of the businesses
• the most important area in which assistance was received and the success of
the businesses
• the highest qualification of the respondents and the success of the businesses
• the highest qualification of the respondents and the sectors in the economy
176
Chi-square was not used in this study because the cross-tabulation matrix was
unbalanced in most of the above cases. The differences in some of the cell
values were too large, violating one of the assumptions of Chi-square.
Finally, additional cross-tabulations were done between the “unsuccessful”
businesses and various other variables.
Based on the information as indicated above, conclusions were drawn up and
recommendations made.
5.2.13 Present research findings
The researcher decided to present the research findings as a doctoral thesis and
in the form of one or more articles to be submitted for publishing.
5.2.14 Follow-up
In this study, there was nothing to follow up because there was no request for the
research. However, the researcher hopes that the results will reduce uncertainty
and influence decisions about the assistance rendered to SMEs in South Africa.
5.3 VALIDITY AND RELIABILITY
“Validity“ and “reliability“ are the two words most encountered in research
methodology and are the key to assessing the trustworthiness of any research
(Leedy, Newby & Ertmer in Ali, 2003:316).

177
5.3.1 Validity
Validity, in its simplest form, has to do with determining whether or not the
measuring instrument tests what it is supposed to test (Statsoft, in Ali, 2003:316).
The term “validity” is applied to measuring instruments that show the extent to
which differences in scores on the measurement reflect true differences between
individuals, groups or situations in the characteristic they seek to measure, or
reflect true differences in the same individual, group or situation from one
occasion to another, rather than constant or random errors (Tustin et al.,
2005:296).
Malhotra (1993:224-225) distinguishes two concepts of validity relevant in
experimentation, namely internal validity and external validity.
• Internal validity simply means that the change in the independent variable
was brought about by a change in the dependent variable and by no other
variable (Welman & Kruger, 2001:97-98). According to Malhotra (1993:224-
225), internal validity shows whether the observed effects on the test units
could have been caused by variables other than the treatment. If the
observed effects are influenced or confounded by extraneous variables, it is
difficult to draw valid inferences about the causal relationship between the
independent and dependent variables. Internal validity is the minimum that
must be present in an experiment before any conclusion can be drawn about
treatment effects. Control of extraneous variables is a necessary condition for
establishing internal validity.
• External validity shows whether the cause-and-effect relationships found in
the experiment can be generalised to a larger population of interest (Malhotra,
1993:224-225). For example, to what populations, geographic areas,
treatment variables and measurement variables can the measured effects be
projected (Tustin et al., 2005:296)?

178
Tull and Hawkins (1993:317-319) further distinguish between the following three
basic types of validity:
• Content validity evaluates the appropriateness of the measuring instrument.
It refers to the accuracy with which a measuring instrument measures the
factors or situations being studied. Do the questions asked draw the right
information from the respondents?
• Criterion-related validity involves inferring an individual's score or standing
on some measurement, a criterion, from the measurement at hand.
• Construct validity involves understanding the meaning of the measurements
obtained.
The validity of the study is discussed in sec. 7.5 of chapter 7.
5.3.2 Reliability
Reliability refers to the extent to which the scores obtained may be generalised to
different measuring occasions, measurement/test forms and measurement/test
administrators (Welman & Kruger, 2001:139). Joppe, in Golafshani (2003:598)
also defines reliability as the extent to which results are consistent over time, and
an accurate representation of the total population being studied is referred to as
reliability. If the results of a study can be produced using a similar methodology,
then the research instrument is considered to be reliable. According to Ali
(2003:319), reliability is mainly concerned with the accuracy, consistency and
predictability of the research findings.
The research findings of this study are reliable for the SME owners who are
members of Cofesa. The Cofesa group under investigation is however not

179
representative with regards to demographics, location, economic sectors or
qualifications (see tables 6.1, 6.3 and figure 6.1) of South African SMEs. The
choice of Cofesa is based on the fact that this was the only structured,
comprehensive group available to the researcher. The South African SME
population is extremely unstructured and no comprehensive list was available
other than Cofesa. Other sources such as “BizAssist”, the DTI and “EASYINFO”
were investigated to attempt to find a comprehensive list of SME owners who had
been assisted in some way, but to no avail. Furthermore, most of the SMEs
listed in these sources had not been assisted and those that had been, were
mostly only given loans or grants, with hardly any mention of business
interventions. A more representative population with such an address or
telephone list is really hard to find.
Cofesa was identified as a structured unit, possessing a list with contact details of
all their members, most of whom had previously received business assistance.
These business owners joined Cofesa with the aim of receiving assistance.
Cofesa also demonstrated their goodwill in making the details of their members
available. In realising the importance of this study, Cofesa expressed their
cooperation and support.
The majority of the population that was used for this study met the main
requirement needed, i.e. that they had been assisted in some way or another. It
is acknowledged that this skews the research towards a specific target group, but
those SME owners/managers who had not been assisted would not have been of
much use to the researcher. The researcher however acknowledges the fact that
such a group could have been useful as a control group to measure the results
obtained in this study against.
The benefit of the thesis however lies in the fact that it will provide the start to the
investigation of the contentious issue regarding the use of business consultants
by SMEs in South Africa. Although this study is not representative of the SMEs

180
in South Africa, it provides a framework of reference, a guide and a measure to
compare the results of future studies on business interventions with. The results
of this study could already be used by small business owners to guide them in all
the aspects of business interventions as discussed in this study, seeing that no
such information is currently available. The population of SME owners in South
Africa is very large and this study could be duplicated with other groups, if it is at
all practical and possible.
Data analysis verification
The following procedures were performed to ensure that the data, tabulations and
other outputs were verified:
To validate the data set and to check for reliability, the Cronbach alpha value was
calculated. The Cronbach alpha value in this case was 0.68, which, according to
Nunnally (1978:245), is an acceptable reliability coefficient.
Cronbach's alpha measures how well a set of items (or variables) measures a
single unidimensional latent construct. When data have a multidimensional
structure, Cronbach's alpha is usually low. Technically speaking, Cronbach's
alpha is not a statistical test - it is a coefficient of reliability (or consistency).
If one conducts an evaluation survey, it is certainly reassuring to know that the
instrument you are using always elicits consistent and reliable responses even if
the questions are replaced with other similar questions? If the variable generated
from such a set of questions returns a stable response, the variable is said to be
reliable. Cronbach's alpha is an index of reliability associated with the variation
accounted for by the true score of the "underlying construct". The construct is the
hypothetical variable that is being measured (Hatcher, in Santos & Reynaldo,
1999:2).

181
An alpha coefficient ranges in value from 0 to 1 and may be used to describe the
reliability of factors extracted from dichotomous (i.e. questions with two possible
answers) and/or multipoint formatted questionnaires or scales (i.e. rating scale: 1
= poor, 7 = excellent). The higher the score, the more reliable the generated
scale is. According to Nunnally (1978:245), 0.7 is an acceptable reliability
coefficient, although lower thresholds are also acceptable.
In this study, completeness was validated, that is, all the tables necessary to
answer objectives were present. The base for each table was validated and was
correct. The standard breaks (splits) were validated and were correct. There
were no blank tables. Frequency counts prior to running tables, to ensure the
accuracy of data and to determine base sizes for subgroups were validated. All
the statistical techniques used were accurate and appropriate.
5.3.3 Sample size
The sample size (n = 200) in this study was sufficient. This is because it was
calculated as follows (Mason, Lind & Marchal, 1999:290-292):
n = p(1 – p) z 2 E = (.1)(.9)(1.96)2 (.05)2 = 0.345744 .0025 = 138.3
where:
n = sample size
p = probability level
z = standard normal value corresponding to the desired level of confidence
E = maximum allowable error

182
The minimum sample needed for this study is thus 139.
The size of a sample is not only influenced by the purpose of the study and the
population size, but also by the level of confidence desired, the margin of error
the researcher will tolerate and the variability in the population being measured.
In this sample, the 95% level of confidence was selected, which means that 95
out of 100 such samples will have the true population value within the range of
precision specified. The 95% level of confidence corresponds to a z value of
±1.96 (Mason, et al., 1999:290).
The maximum allowable error (E) is the amount that is added or subtracted from
the sample mean to determine the end points of the confidence interval. It is the
current error that the researcher is willing to tolerate. It is also one half the width
of the corresponding confidence interval. The larger the allowable error, the
smaller sample is permitted and vice versa (Mason, et al., 1999:290).
The degree of variability refers to the distribution of attributes in the population.
The more heterogeneous a population, the larger the sample size required to
obtain a given level of precision. The more homogeneous or concentrated a
population, the smaller the sample size (Israel, 1992:2).
A proportion (p) of 10% was selected for determining the sample size for this
study as the population is fairly homogeneous. The respondents were all
members of Cofesa, they were all SME owners and all of them had been assisted
in one way or another. SME owners who had been assisted was the crucial
attribute of interest needed for this study.
Israel (1992:3) suggests that for small populations (like the one used in this
study) the sample size could even be reduced slightly. This is because a given
sample size provides proportionally more information for a small population than

183
for a large population (for example, all the SMEs in South Africa). With such a
small and unique universe, a sample of 200 was deemed to be more than
sufficient. However, if there had been a need to compare it to StatsSA data for
South African SMEs for example, a broader demographic section would have
been required.
5.4 CONCLUSION
Based on the above information, conclusions will be drawn and
recommendations made on what types of assistance could probably enhance the
success rate of SME owners. This information should be sufficient to determine
what types of assistance government and consultants should consider when
rendering their assistance and services to SME owners.
The next chapter interprets and analyses the findings of the empirical research.

184
CHAPTER 6 DATA ANALYSIS AND INTERPRETATION
6.1 INTRODUCTION
This chapter interprets and analyses the findings of the empirical research. The
responses gathered from the respondents will first be discussed and analysed.
Once the statistical analysis has been completed, the extent to which the
objectives of this study were met will be indicated.
The results of the research are presented and analysed by means of tables,
graphs and other descriptive statistics. The aim of this is to realise the primary
and secondary research objectives, thereby resolving the research problem.
In order to accomplish this, an analysis of the respondent profiles is provided in
section 6.2. The general business information of the respondents is provided in
section 6.3. Section 6.4 describes the areas and details of the assistance
rendered to the respondents. The shortcomings in the assistance received by
the respondents are presented in section 6.5, followed by a discussion of the
characteristics of successful interventions in section 6.6. Sections 6.7 and 6.8
describe the relationships between different variables. Finally, issues regarding
the unsuccessful businesses in this study are discussed in section 6.9.
The data were collected by means of computer-aided telephonic interviewing
(CATI). The sample was drawn from all the members of Cofesa. The total of 5
543 members was included in the population. The members were randomly
called and asked whether they would be willing to participate in the study. Those
who agreed to be interviewed were then asked (the screening question) whether
they had received any form of assistance relating to business matters. The
respondents who had received assistance were then interviewed. Using random

185
sampling, a total of 2 658 calls were made (this is 47.9% of all the members) by
the callcentre in order to obtain 200 completed questionnaires. This was 3.6% of
the entire population. These 200 are referred to as the “respondents”.
The number of 200 was deemed to be a sufficient sample size
to represent this universe because the target population was owners and
managers who had received assistance relating to business matters. It is a
unique sample representing a small universe (5 543 cases).
Since the data were captured on a SPSS spreadsheet, the calculations could be
done by means of the SPSS program. A variety of data analysis techniques were
used that were the most appropriate to interpret the data, draw conclusions from
the data and realise the research objectives. All the respondents answered all
the questions, yielding a 100% response rate.
6.2 ANALYSIS OF COFESA RESPONDENTS
This section reports on the profiles of the Cofesa respondents. The respondents
were asked to answer a number of questions to enable the researcher to develop
a profile of the respondents involved in the study. The figures in the tables are
reported directly from the captured respondent questionnaires (appendix A).
The recorded frequencies of the demographic details are referred to as the
characteristics of the respondents' profiles. The following characteristics are
reported on here:
• the location of businesses participating in the study
• the types of businesses owned and/or managed by the respondents
• the respondents’ highest qualifications
• the respondents’ occupations prior to becoming involved in the business

186
The respondents who were interviewed were either the owners or managers of
SMEs. No other employees of the businesses such as secretaries or assistants
were interviewed.
6.2.1 The location of businesses participating in the study
SME owners and members of Cofesa were randomly contacted countrywide.
Table 6.1 (also see figure 6.17 in appendix B) shows the number of businesses
of the entire population (all the members of Cofesa) as well as the number of
businesses of the sample used in this study. It also indicates that the sample is
similar to the population regarding the location of the businesses in South Africa,
corresponding with the non-probability quota-sampling method.
Table 6.1: Location of participating businesses
Location Sample Entire population Frequency Percent Frequency Percent
Valid Gauteng 81 40.5% 2 103 37.9%Western Cape 36 18.0% 819 14.8%Kwazulu-Natal 14 7.0% 642 11.6%Garden Route 13 6.5% 337 6.1%Pretoria (Northern Gauteng)
10 5.0% 277 5.0%
Free State 10 5.0% 465 8.4%Limpopo 9 4.5% 215 3.9%Eastern Cape 7 3.5% 187 3.4%Mpumalanga 6 3.0% 223 4.0%Other 6 3.0% 79 1.4%Northern Cape 4 2.0% 139 2.5%North West 4 2.0% 57 1.0% Total 200 100.0% 5 543 100.0%
Observations
Figure 6.1 indicates that 40.5% of the 200 businesses participating in the study
were located in Gauteng, 18% in the Western Cape and 7% and 6.5% in
Kwazulu-Natal and the Garden Route respectively. Most of the other regions in
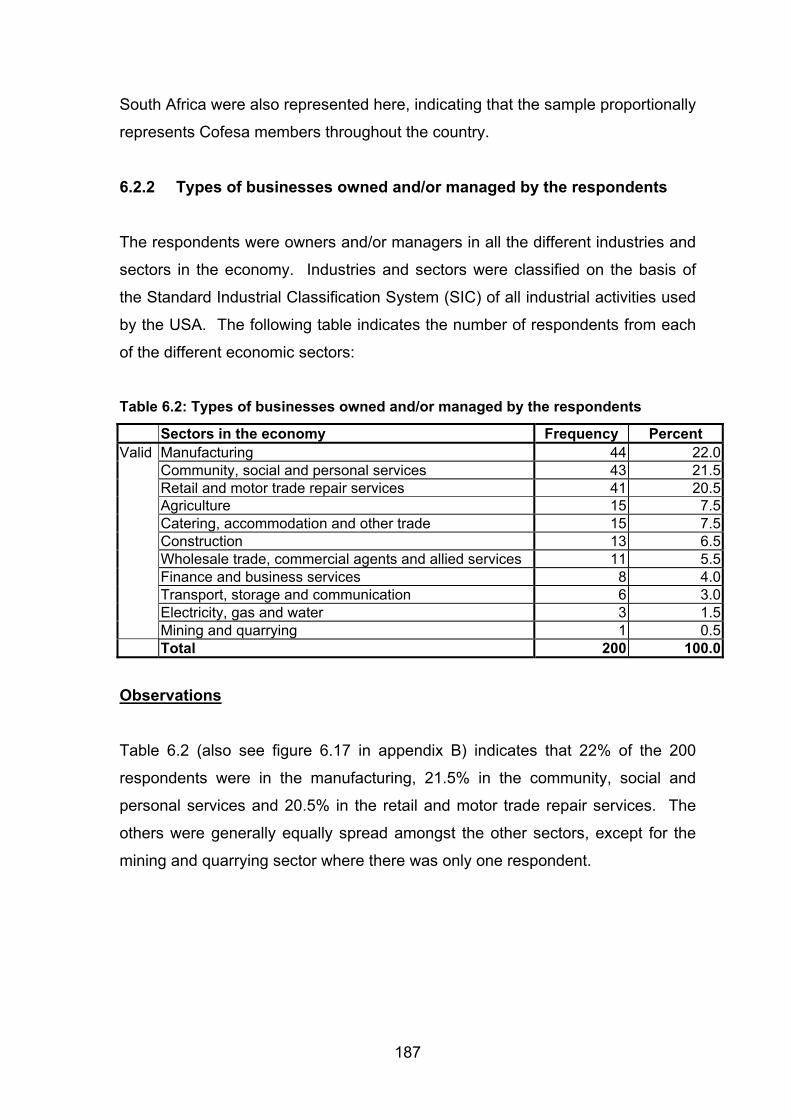
187
South Africa were also represented here, indicating that the sample proportionally
represents Cofesa members throughout the country.
6.2.2 Types of businesses owned and/or managed by the respondents
The respondents were owners and/or managers in all the different industries and
sectors in the economy. Industries and sectors were classified on the basis of
the Standard Industrial Classification System (SIC) of all industrial activities used
by the USA. The following table indicates the number of respondents from each
of the different economic sectors:
Table 6.2: Types of businesses owned and/or managed by the respondents
Sectors in the economy Frequency Percent Valid Manufacturing 44 22.0
Community, social and personal services 43 21.5Retail and motor trade repair services 41 20.5Agriculture 15 7.5Catering, accommodation and other trade 15 7.5Construction 13 6.5Wholesale trade, commercial agents and allied services 11 5.5Finance and business services 8 4.0Transport, storage and communication 6 3.0Electricity, gas and water 3 1.5Mining and quarrying 1 0.5
Total 200 100.0
Observations
Table 6.2 (also see figure 6.17 in appendix B) indicates that 22% of the 200
respondents were in the manufacturing, 21.5% in the community, social and
personal services and 20.5% in the retail and motor trade repair services. The
others were generally equally spread amongst the other sectors, except for the
mining and quarrying sector where there was only one respondent.

188
The table below shows the comparison of the distribution of SMEs in the sectors
of the economy used in the sample with the distribution of all SMEs in the
different sectors of the economy in South Africa.
Table 6.3: Comparison of the distribution of SMEs in the sectors of the economy used in the sample with the distribution of all SMEs in the different sectors of the economy in South Africa
Sectors in the economy Percent of Cofesa sample
Percent in South Africa
Manufacturing 22.0 12.3Community, social and personal services 21.5 7.7Retail and motor trade repair services 20.5 20.1Agriculture 7.5 34.4Catering, accommodation and other trade 7.5 5.5Construction 6.5 4.7Wholesale trade, commercial agents and allied services 5.5 5.6Finance and business services 4.0 7.0Transport, storage and communication 3.0 2.4Electricity, gas and water 1.5 Not availableMining and quarrying 0.5 0.3Total 100 100
Source: HRD Review (2003)
From the comparison it is clear that the profile of the sample to some degree
reflects the situation in all the SMEs in South Africa. The sample, however, does
not represent the agricultural sector as well as it could. The sample also has
larger representation in the manufacturing and community, social and personal
services sectors. This is because of the composition of the population (Cofesa
members).
Cofesa members mainly own/manage SMEs with high employment, for example
manufacturing. Some sectors have their own employers’ organisations. The
agricultural sector, for instance, has several employers’ organisations.

189
6.2.3 Respondents’ highest qualifications
The respondents were asked about their highest qualification. Figure 6.1
indicates the respondents’ different qualification levels.
Figure 6.1: Frequency of the qualifications of the respondents
2.0%
29.5%
12.5%
42.5%
9.0%
3.5%1.0%
0%
5%
10%
15%
20%
25%
30%
35%
40%
45%
Bel
ow g
rade
10
Gra
de 1
0 to
12
Cer
tific
ate
3-ye
ardi
plom
a/de
gree
Hon
ours
deg
ree
Mas
ter's
deg
ree
Doc
tora
teLevel of qualifications
Perc
enta
ge
Observations
As can be seen in figure 6.1, 42.5% of the 200 respondents had a three-year
diploma or degree, while a substantial number (29.5%) had completed grade 10
to 12. Of the respondents, 13.5% had a higher qualification than a three-year
diploma or degree, and 2% had below grade 10 schooling.
This also shows that 56% of the respondents had at least a tertiary qualification,
including 13.5% with a postgraduate qualification.
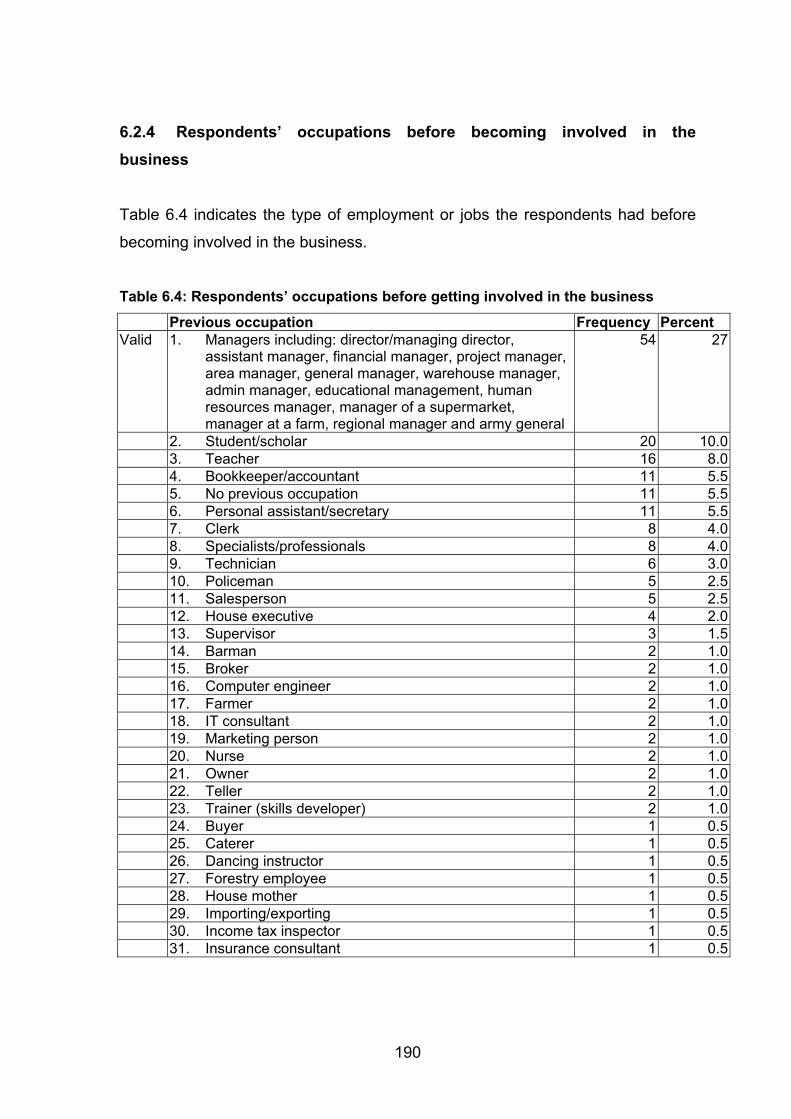
190
6.2.4 Respondents’ occupations before becoming involved in the business
Table 6.4 indicates the type of employment or jobs the respondents had before
becoming involved in the business.
Table 6.4: Respondents’ occupations before getting involved in the business
Previous occupation Frequency Percent Valid 1. Managers including: director/managing director,
assistant manager, financial manager, project manager, area manager, general manager, warehouse manager, admin manager, educational management, human resources manager, manager of a supermarket, manager at a farm, regional manager and army general
54 27
2. Student/scholar 20 10.0 3. Teacher 16 8.0 4. Bookkeeper/accountant 11 5.5 5. No previous occupation 11 5.5 6. Personal assistant/secretary 11 5.5 7. Clerk 8 4.0 8. Specialists/professionals 8 4.0 9. Technician 6 3.0 10. Policeman 5 2.5 11. Salesperson 5 2.5 12. House executive 4 2.0 13. Supervisor 3 1.5 14. Barman 2 1.0 15. Broker 2 1.0 16. Computer engineer 2 1.0 17. Farmer 2 1.0 18. IT consultant 2 1.0 19. Marketing person 2 1.0 20. Nurse 2 1.0 21. Owner 2 1.0 22. Teller 2 1.0 23. Trainer (skills developer) 2 1.0 24. Buyer 1 0.5 25. Caterer 1 0.5 26. Dancing instructor 1 0.5 27. Forestry employee 1 0.5 28. House mother 1 0.5 29. Importing/exporting 1 0.5 30. Income tax inspector 1 0.5 31. Insurance consultant 1 0.5

191
32. Laboratory assistant 1 0.5 33. Medical insurance underwriter 1 0.5 34. Nursery employee and landscaper 1 0.5 35. Personnel consultant 1 0.5 36. Printer 1 0.5 37. Scuba diving instructor 1 0.5 38. Self employed person 1 0.5 39. Shop assistant 1 0.5 40. Transport 1 0.5 41. Verification officer 1 0.5 Total 200 100.0
Observations
The 200 respondents were involved in no fewer than 41 different occupations
prior to becoming involved in the current businesses. Those categories that
represented the largest number were managers in different areas (27%),
students/scholars (10%), teachers (8%), bookkeepers/accountants, those with no
previous occupation and personal assistants/secretaries each 5.5% respectively.
Although managers represented a large group, they still came from many
different areas of business. Although scholars also represented a high
percentage, their background of study was unknown. Because they had become
involved in business it could be assumed that they had elementary business
management and accounting as part of their courses. The third largest group
was that of teachers who probably represent different subject fields and not a
specific area of study or employment other than teaching.
It is interesting to note that so many ex-teachers start another business.
Although there could be many reasons for this, retrenchments, unacceptable
working conditions, low pay in the teaching profession and political issues could
be some of the reasons. Opportunity cost is also low, making it easier for them to
leave the teaching occupation.

192
If one examines the variety of responses, there seems to be no indication that
SME owners in this study come from a specific background of previous
employment.
6.2.5 Summary of characteristics of Cofesa respondents
The respondents in this study were located primarily in the Gauteng area, with
the Western Cape, Kwazulu-Natal and the Garden Route areas a distant second
most popular location. The types of businesses owned and/or managed by the
respondents were mostly manufacturing, retail and motor trade repair services
and community, social and personal services. Most of the respondents had a
three-year diploma or degree while a substantial number had completed grade 10
to 12. Finally, the respondents were employed in many different areas before
they became involved in the current businesses. The only area of occupation
that was mentioned significantly more than the others was that of "manager",
where the respondents referred to their previous occupations as being a manager
in different functional areas and on different levels.
6.3 GENERAL BUSINESS INFORMATION OF THE COFESA RESPONDENTS
Since the primary objective of this study was to analyse business interventions
and to determine their effect on the perceived success of South African SMEs, it
was necessary to find respondents with successful businesses who had been
assisted in some way or other. Successful businesses are identified in this
section. The size of the businesses is also reported here.

193
6.3.1 Respondents’ perceptions of the success/failure of their businesses
The respondents were asked to answer "yes" or "no" to the statements below.
By examining their answers it was possible to determine whether or not they
were successful.
• My business has been profitable during the last financial year.
• My business has grown over the past three years.
• The profit has been increasing over the past three years.
• I have been paying salaries and wages for at least three-and-a-half years.
• I make enough money to live comfortably.
• My business is employing more people now than two years ago.
• The turnover/sales of my business have increased over the past two years.
• My business is unsuccessful.
Most of these statements were deduced from the definitions used for a
"successful business" as discussed in chapter 4 of this study. The following three
definitions were used as the primary source for the selection of these statements:
(1) A successful new business is one that has survived from the start-up
phase to the new-firm phase. The start-up phase includes businesses that
have not paid salaries/wages at all or have paid them for only three
months, while new firms are businesses that have paid salaries and wages
for more than three months but for less than three-and-a-half years (Driver,
et al., 2001:11-16).
(2) A successful SME owner is one who creates work at least for himself or
herself but also for others, who has supported this for at least a period of
one year, whose business is profitable, who functions autonomously and
who generates an income for himself or herself. Owners do not

194
necessarily specify growth as an objective but regard themselves as
successful if their businesses are profitable (Nieuwenhuizen, 1999:12).
(3) A successful SME is one that has been in existence for at least four years,
has been profitable and has shown growth in the preceding three years
(Nieuwenhuizen & Groenewald, 2006:70).
Tables 6.47 to 6.54 (see appendix B) show the respondents’ responses to the
statements mentioned above. The tables indicate how many of the 200
respondents answered "yes" and how many answered "no" to each statement.
Table 6.5 is a summary of the information contained in these tables.
Table 6.5 Summary of the percentage of "yes" answers from tables 6.47 to 6.54
Statement Percent
My business has been profitable during the last financial year 76.5
My business has grown over the past three years 85
The profit has been increasing over the past three years 64
I have been paying salaries and wages for at least three-and-a-half years 93
I make enough money to live comfortably 68.5
My business is employing more people now than two years ago 59.5
The turnover/sales of my business has/have increased over the past two years
79
Figure 6.2 graphically illustrates percentage of "yes" answers in table 6.5.

195
Figure 6.2 Percentage “yes” answers to statements regarding success of respondents’ businesses
59.5%
64.0%
68.5%
76.5%
79.0%
85.0%
93.0%
0% 10% 20% 30% 40% 50% 60% 70% 80% 90% 100%
My business is employing more people now thantwo years ago
The profit has been increasing over the past threeyears
I make enough money to live comfortably
My business has been profitable during the lastfinancial year
The turnover/sales of my business has/haveincreased over the past two years
My business has grown over the past three years
I have been paying salaries and wages for at leastthree-and-a-half years
Stat
emen
ts
Yes answers
Observations
The responses to the first seven statements were overwhelmingly positive. Most
of them had been paying salaries and wages for at least three-and-a-half years,
had grown over the past three years and had been profitable during the previous
financial year. The turnover/sales of their businesses had also increased over
the past two years. If this is compared with the definitions of a successful
business, it is clear that the majority of the respondents feel that they were
running successful businesses.
Although the first statement, “most of them had been paying salaries and wages
for at least three-and-a-half years” is mentioned as an indicator of success, it is
only an indication that the business had been in existence for that period of time.
The high “yes” percentage answers to the following three statements however is

196
an indication that most of the businesses in this study were successful. This
verifies the majority of positive responses (although these responses were only
perceptions) to question 2 of the questionnaire where the respondents were
asked to indicate, on a continuous rating scale of 1 to 7, how successful they
thought their businesses were (see figure 6.3).
The researcher did not do a factor analysis because of the internal consistency
between the variables indicated in figure 6.2.
Only 9% of the respondents indicated that their businesses were unsuccessful.
Overall, the responses seem to be extremely positive. If they had been
unsuccessful and stopped doing business, they would obviously not have been
around to be interviewed. However, one must keep in mind that the economy
grew continuously in the preceding few years and this situation probably
enhanced the respondents' chances of being generally successful.
The respondents were also asked to indicate, on a continuous rating scale of 1 to
7, how successful they thought their businesses were. A rating of 1 indicated a
perception of "not being successful at all" while a rating of 7 indicated a
perception of being "very successful". Table 6.6(a) depicts frequencies of the
respondent's perceptions of how successful their businesses were on a scale of 1
to 7. Table 6.6(b) shows the grouped (explained in the next section) frequencies
and percentages of the responses, while table 6.6(c) shows the descriptive
statistics of these responses.
Once the respondents provided the ratings, the line was divided into the following
three categories of satisfaction:

197
• Scores of 1-3 were classified as "dissatisfied".
• Scores of 4-5 were classified as "satisfied".
• Scores of 6-7 were classified as "delighted".
Table 6.6(a): How successful do you think your business is?
Frequency Percent Valid percent Cumulative
percent Valid 1 2 1.0 1.0 1.0 3 15 7.4 7.5 8.5 4 42 20.8 21.0 29.5 5 83 41.1 41.5 71.0 6 42 20.8 21.0 92.0 7 16 7.9 8.0 100.0Total 200 100.0
Table 6.6(b): How successful do you think your business is?
Frequency Percent Valid Dissatisfied (0-3) 17 8.5 Satisfied (4-5) 125 62.5 Delighted (6-7) 58 29.0 Total 200 100.0 Table 6.6(c): How successful do you think your business is?
Statistics
N Valid 200 Missing 2Mean 4.97Std. error of mean .078Std. deviation 1.098Variance 1.205Skewness -.378Std. error of skewness .172Kurtosis .802Std. error of kurtosis .342Range 6Minimum 1Maximum 7

198
Observations
Table 6.6(b) indicates that 29% of the respondents were "delighted", and another
62% were "satisfied" with their business performance, adding up to a total of 91%
of the respondents having the perception that their businesses were successful.
Only 9% of the respondents were "dissatisfied" with their business performance
and indicated that their businesses were unsuccessful.
Figure 6.3 graphically illustrates the respondents’ perception of how successful
their businesses were. A seven-point Likert scale was chosen where the
respondents were to indicate on a scale of 1 to 7 how successful they thought
their businesses were. 1 would indicate that the owner thought the business was
not successful at all and 7 would indicate that the owner thought that the
business was very successful.
Figure 6.3: Respondents' perception of how successful their businesses were
2 0
15
42
83
42
16
0
10
20
30
40
50
60
70
80
90
1 2 3 4 5 6 7
Freq
uenc
y

199
Observations
The arithmetic mean or the average score, which is the most commonly used
measure of central tendency, was 4.97. Standard deviation measures statistical
dispersion and indicates how widely the values in a data set are spread. The
standard deviation in this case was 1.098. This means that 83.5% of the scores
or values fell between one standard deviation to both sides of the mean. The
standard deviation was very small, which indicates that the majority of
respondents fell around the mean of 4.97.
Table 6.6(c) shows a negative value (-.378, negatively skewed) for the
coefficients of skewness and a positive value (.802, positive kurtosis or
leptokurtic) for the coefficient kurtosis. The negatively skewed distribution
indicates that the larger frequencies were towards the higher end of the variable.
The skewness of the sample indicates that perceived successful small business
owners/managers dominated the data and the results. Although this makes
comparisons with unsuccessful businesses impossible, the focus of this study
was on the interventions of the perceived successful business owners. The
researcher needed successful businesses what had been assisted for the
purpose of this study. This issue was also addressed in section 7.2, where the
objectives of this study are evaluated.
To validate the data set and check for reliability, the Cronbach alpha value was
calculated. The Cronbach alpha value in this case was 0.68, which, according to
Nunnally (1978:245), is an acceptable reliability coefficient. Cronbach's alpha
measures how well variables measure a single unidimensional latent construct.
When data have a multidimensional structure, Cronbach's alpha will usually be
low. Technically speaking, Cronbach's alpha is not a statistical test - it is a
coefficient of reliability (or consistency).

200
The alpha coefficient ranges in value from 0 to 1 and may be used to describe
the reliability of factors extracted from dichotomous (i.e., questions with two
possible answers) and/or multipoint formatted questionnaires or scales (i.e. rating
scale: 1 = poor, 7 = excellent). The higher the score, the more reliable the
generated scale is. Nunnally (1978:245) indicated 0.7 to be an acceptable
reliability coefficient, although lower thresholds are also acceptable. The value in
this case of 0.68 is extremely close to 0.7 and is acceptable. This means that the
generated scale is reliable.
6.3.2 Number of employees permanently employed in the businesses
The respondents were asked about the size of their businesses in terms of the
number of permanent employees working for them. The responses are indicated
in table 6.7. This information was elicited to determine whether the researcher
was indeed looking at SMEs as per definition. The definition used for an SME in
this study refers to a figure of fewer than 250 full-time paid employees.
Table 6.7: The number of permanent employees in the business
Frequency Percent Valid Fewer than 10 85 42.5 11 to 49 86 43.0 50 to 100 19 9.5 More than 100 but fewer than 250 10 5.0 Total 200 100.0
Observations
The sample included 42.5% businesses with fewer than 10 employees and a
similarly large percentage of 43% of the businesses with 11 to 49 employees,
indicating that the majority of businesses in this study (85.5%) had fewer than 50
employees. Only 9.5% of the respondents had between 50 and 100 employees
and 5% more than 100 but fewer than 250 employees. The respondents in this

201
study were clearly owners and/or managers of SMEs as per the definition of
SMEs in South Africa.
6.4 THE AREAS AND DETAILS OF ASSISTANCE PROVIDED TO THE RESPONDENTS
All the respondents had received some form of assistance at some stage of their
business venture. This was determined at the beginning of each interview by
asking the respondents the following question:
"Since opening your business, have you received any form of assistance in
relation to business matters? This assistance is any form of assistance such as
training or advice, specialist consultations, expert assistance from a family
member or friend or organisation." Interviews were terminated when respondents
indicated that they had had no such experience.
This section focuses on the details of the assistance received by the respondents
and includes the following information on the assistance rendered:
• the functional areas in which assistance was received
• the most important functional areas in which assistance was received
• the time in the business cycle when the assistance was received
• the ways in which the respondents were assisted
• who presented the assistance
• the timeframe of the assistance received

202
6.4.1 Areas/functions of the business in which the respondents received or are receiving external assistance
SME owners were assisted in many areas of the business. Figure 6.6 indicates
in which functional areas of the business the respondents received or are
receiving assistance. The areas are ranked from the highest to the lowest. The
highest is that area or function in the business in which most respondents sought
assistance and the lowest that area in which the smallest number of respondents
sought assistance. Each respondent was asked to indicate the three most
important areas in which assistance had been received. The first, second and
third most important areas mentioned were added together and the totals for
each area displayed in the table.
Figure 6.4: Areas in which respondents received assistance
90.5%
44.0%
33.0%24.5% 23.0% 21.0% 20.5%
13.5%8.5% 8.5%
0%
10%
20%
30%
40%
50%
60%
70%
80%
90%
100%
Finance
/acco
unting
Marketi
ng
Human res
ource
s
Admini
strati
on
Produc
tion/o
perat
ions
Lega
l asp
ects
Health and
safet
y
Busines
s plan IT
Systems
Areas of assistance
Perc
enta
ge

203
Observations
It is clear that assistance was generally sought on the subject of finance. Of the
200 respondents, 90.5% had received assistance in finance, 44% in marketing
and 33% in human resources. Less than 25% of the respondents had sought
assistance in most of the other areas and less than 10% in the areas of IT,
systems, and others.
In 7.5% of the cases, respondents sought assistance in areas not mentioned in
the list provided. These areas are listed in table 6.8.
Table 6.8: Areas of assistance mentioned under the "other" option
Frequency Percent Valid Management 4 2.0 Training and productivity 4 2.0 Customer service 2 1.0 Human relations 2 1.0 Finance 1 0.5 What to do 1 0.5 Total 14 7.0
Observations
Once again these could probably have been listed under the options provided,
such as "customer service" and "human relations", which could have been listed
under marketing and human resources. The small amount of "other" options
given does not merit further discussion.
6.4.2 Respondents' perceptions of the most important areas of receiving assistance
In the previous section the respondents indicated in which areas they had been
receiving assistance. They were also asked to indicate the three most important
areas in which they received assistance. They were requested to indicate the

204
most important, the second most important and the third most important areas in
which they had received assistance.
Figure 6.5 (also see table 6.55 in appendix B) shows the respondents’ responses
for each area of assistance listed in question 5 of the questionnaire. Every area
of assistance is examined separately in this table.
Each subsection in the table indicates the area of assistance. It also specifies
the frequency and percentage of responses that indicated that specific area of
assistance as being the first, second and third most important areas of assistance
received.

205
Figure 6.5: Summary of respondents' perceptions of the most important areas of receiving assistance
0 20 40 60 80 100
Systems
IT
Business plan
Health and safety
Administration
Legal aspects
Production/operations
Human resources
Marketing
Finance/accounting
Frequency
First choiceSecond choiceThird choice
Observations
Of the 200 respondents, 90.5% mentioned that finance/accounting was the
most important, second most important or third most important area in which they
had received assistance. Of these, 44% ranked finance/accounting as the most
important, 30% ranked it as second most important, and 26% ranked it as third
most important area in which they had received assistance.

206
Of the 200 respondents, 44% mentioned that marketing was the most, second
most or third most important area in which they had received assistance. Of
these, 38.6% ranked marketing as the most important, 30.7 as second most
important and 30.7% as third most important area in which they had received
assistance.
Of the 200 respondents, 33% chose human resources as the most, second most
or third most important area in which they had received assistance.
The remainder of the areas could also be interpreted in the same way. The least
important areas of assistance as perceived by the respondents were those of
systems and IT.
Summary of respondents' perceptions of the most important areas of receiving assistance (see fig. 6.5)
(1) Ranked most important area of receiving assistance
Finance/accounting was the area that the most respondents (40%) ranked first as
the most important area in which they had received assistance. The area that the
second most respondents (17%) ranked first was marketing.
(2) Ranked second most important area of receiving assistance
Finance/accounting was also the area that was ranked second most important by
27% of the respondents. The area of marketing was once again the second most
important choice, with 13.5% of the respondents ranking it second.

207
(3) Least most important area of receiving assistance
According to the respondents, systems and IT were the least important areas in
which they had received assistance.
However, to give another view of the respondents' perceptions of the most
important areas of receiving assistance, the weighted averages for each area
were calculated by multiplying the number of first choices by 3, the number of
second choices by 2 and the number of third choices by 1. Figure 6.6 shows the
result.
Figure 6.6: The respondents' perceptions of the most important areas of receiving assistance by using weighted averages
34.1%
15.8%
11.6%7.8% 7.4% 7.4% 6.6%
4.5%2.5% 2.4%
0%
5%
10%
15%
20%
25%
30%
35%
40%
Finance
Marketi
ng
Human res
ource
s
Produc
tion/o
perat
ions
Admini
strati
on
Lega
l asp
ects
Health and
safet
y
Busines
s plan
Systems IT
Areas of assistance
Freq
uenc
y

208
Observation
Once again financial issues had the largest number by a factor of more than
100% than the second one, namely marketing. This is of major concern.
Although the areas of finance/accounting, marketing and human resources were
high on the list of assistance received, they were also the areas in which the most
shortcomings were identified. This issue is discussed under the “observation” of
Figure 6.11 later in this chapter.
6.4.3 Time in the business cycle in which the assistance was provided
Any SME goes through a number of stages in its life cycle. Life cycle refers to
the succession of stages a business passes through during its time of existence.
For the purpose of this study, the business life cycle as described by Nieman,
Hough and Nieuwenhuizen (2003:238-240) was used as a reference. The
different stages described in this cycle are start-up, growing and
mature/declining. However, the names of these stages were altered to ensure
that the respondents all had the same interpretation of each stage, and to obtain
accurate information.
The life cycle was divided into four time zones as indicated below and in figure
6.7.
• before starting your business (this was included to elicit specific information
on this time)
• during the first six months (correlating with the start-up phase)
• during the first two years (correlating with the growing phase)
• after the first two years (correlating with the mature or declining phase)
An option of "continuously" was also added to accommodate those respondents
who had been assisted continuously and not only during one or two phases.

209
Each stage poses different problems, and depending on the knowledge and skills
of the business owner or manager, assistance might or might not have been
needed. The respondents were asked to indicate when they had made use of
the assistance referred to in the previous point. Figure 6.9 shows the responses
in this regard.
Figure 6.7: When the assistance was provided
8.0%12.0%
6.0%
15.5%
58.5%
0%
10%
20%
30%
40%
50%
60%
70%
Before startingthe business
During the first6 months
During the first2 years
After the first 2years
Continuously
Stages in business life cycle
Perc
enta
ge
Observations
The majority of respondents indicated that assistance was sought during every
phase. Of the respondents, 58.5% sought assistance on a continuous basis
during the entire life cycle of the business. Since the majority of these
businesses were successful, this type of continuous assistance could be one of
the causes.

210
If the phases are studied separately, 15.5% sought assistance only after the first
two years of being in business, 6% only during the first two years, 12% only
during the first six months and 8% only before starting a business.
This section indicates at what stage of the business cycle the assistance was
actually provided. However, that stage might not have been the best time or the
only time. A post facto evaluation was also done. The respondents were
required to indicate during which stage of the business cycle they thought the
best time would be to seek assistance. The response to this issue is dealt with in
section 6.6.3.
6.4.4 Ways in which the respondents were assisted
Since all the respondents were assisted in some way, they were asked to
indicate what type of assistance they had received. This means the following:
• Were they given advice by anyone including specialists, consultants and
experts?
• Were they trained on the job?
• Did they outsource any part of the business to specialists?
• Did they make use of consultants in their businesses?
• Did they attend formal training courses?
Their responses are indicated in table 6.9.

211
Table 6.9: The ways in which the respondents were assisted I was given advice
Frequency Percent Valid YES 95 47.5 NO 105 52.5 Total 200 100.0
I was trained on the job Frequency Percent Valid YES 47 23.5 NO 153 76.5 Total 200 100.0
I outsourced some functions to external specialists Frequency Percent Valid YES 47 23.5 NO 153 76.5 Total 200 100.0
I made use of consultants to assist me Frequency Percent Valid YES 64 32.0 NO 136 68.0 Total 200 100.0
I attended formal training/course(s) Frequency Percent Valid YES 34 17.0 NO 166 83.0 Total 200 100.0
Other Frequency Percent Valid YES 5 2.5 NO 195 97.5 Total 200 100.0

212
Figure 6.8 is a summary of the tables above, showing the different ways in which
the respondents were assisted.
Figure 6.8: Summary of the different ways in which the respondents were assisted
47.5%
32.0%
23.5% 23.5%
17.0%
2.5%
0%5%
10%15%20%25%30%35%40%45%50%
I was
giv
enad
vice
I mad
e us
e of
cons
ulta
nts
I out
sour
ced
toex
tern
alsp
ecia
lists
I was
trai
ned
onth
e jo
b
I atte
nded
form
altra
inin
g/co
urse
s
Oth
er
Method of assistance
Per
cent
age
Observations
The respondents made use of all the different ways of assistance mentioned.
Nearly half of them (47.5%) were given advice or sought advice from someone
(possibly consultants, specialists or even family members) as a means of
assistance. Another 32% specifically made use of consultants to assist them. Of
the respondents, 23.5% indicated that they were trained on the job and another
23.5% indicated that they had outsourced some functions to external specialists.
Only 17% of the respondents had attended formal training courses.
In this case, the respondents could choose more than one option. There were
292 responses in total. This means that 92 additional responses were made.

213
Respondents who made use of two or even three of the given options made
these 92 responses.
Only five respondents chose the option “other". The other ways in which they
were assisted were as follows:
• a friend
• external auditors
• self-training
• refinancing the loan to make the payments
• a government subsidy
6.4.5 Formal training and/or courses attended by respondents
The 34 respondents from the previous section who indicated that they had
attended formal training or formal courses were also asked to specify the type of
training or the name of the course attended. Of these, 32 responded and the
training/courses are listed in table 6.10.

214
Table 6.10: Formal training and/or courses attended by respondents
The name of the training/course attended Frequency Percent Valid Marketing 4 2.0 Accounting (Pastel) 2 1.0 B.Com 2 1.0 Business 2 1.0 Client relationship 2 1.0 Computer 2 1.0 Health and safety 2 1.0 Veterinary studies 2 1.0 A course at Spoornet 1 0.5 Audit tax 1 0.5 Franchise training 1 0.5 General workshops 1 0.5 Hospitality 1 0.5 Can’t remember 1 0.5 In-house at Protea Hotel 1 0.5 Investment 1 0.5 Management 1 0.5 Manufacturing 1 0.5 MBL 1 0.5 Project management 1 0.5 Retail 1 0.5 Teacher 1 0.5 Total 32 16.0Total 200 100.0
Observations
The formal training or courses attended by the respondents were dissimilar. Four
of the 32 who responded were trained in or had done a marketing course. Two
each had done training/courses in accounting, B.Com, business, client
relationship, computer, health and safety and veterinary studies. Only one
respondent each had attended 13 other and different formal training/courses,
ranging from in-house courses at larger companies to a master’s degree in
business leadership and teacher training.

215
It would seem that the respondents did not attempt to be trained in the areas they
regarded as the most important and did not seek much assistance in these areas,
namely accounting, finance, marketing and human resources (see fig. 6.6). One
can only assume that they focused on the core business or service they provided
and preferred to make use of external assistance in managing these specialist
functional areas.
6.4.6 The person/institution who provided the assistance
Assistance is available in so many different forums and can be sought from so
many different sources. The literature (ch. 3, sec. 3.5) reviewed that SME
owners can be assisted by different government bodies, training institutions,
consultants, advisors (such as attorneys, accountants, banks) and general
business consultants.
Table 6.11 indicates the different sources from which the respondents received
assistance.

216
Table 6.11: Who rendered assistance to the respondents Another business
Frequency Percent Valid YES 61 30.5 Total 200 100.0
Consultant/specialist Frequency Percent Valid YES 86 43.0 Total 200 100.0
Trainer Frequency Percent Valid YES 13 6.5 Total 200 100.0
Educational institution Frequency Percent Valid YES 18 9.0 Total 200 100.0
Other Frequency Percent Valid YES 43 21.5 Total 200 100.0 Figure 6.9: Summary of different bodies that rendered the assistance
43.0%
30.5%
21.5%
9.0%6.5%
0%5%
10%15%20%25%30%35%40%45%50%
Con
sulta
nt/s
peci
alis
t
Ano
ther
bus
ines
s
Oth
er
Edu
catio
nal
inst
itutio
n
Trai
ner
Assistance providers
Freq
uenc
y

217
Observations
From the information in table 6.11 it is clear that the respondents generally used
consultants or specialists when seeking assistance. Consultants or specialists
were used by 43% of the respondents, 30.5% of them made use of assistance
from another business, 9% from educational institutions and 6.5% from trainers.
Another 21.5% of the respondents made use of assistance from other sources.
Some of the respondents mentioned sources of assistance such as accountants,
bookkeepers and financial advisors under the "other" option in question 8 of the
questionnaire (appendix A). The “other sources” were not investigated but one
can assume that some of these could also have been specialists and would have
increased the number of respondents using specialists.
Some of the respondents (10.5%) used more than one source of assistance.
The other sources of assistance used by the respondents are listed in table 6.12.
Table 6.12: Other sources of assistance specified
Frequency Percent Valid Friend or partner or family members 13 6.5 Accountant or CA 4 2 Cofesa 4 2 Manager or owner 4 2 Bank 3 1.5 Member of the franchise 3 1.5 Social institute 2 1 Bookkeeper 1 0.5 Don't know 1 0.5 Financial advisor 1 0.5 In-house training 1 0.5 Internet 1 0.5 Lawyers 1 0.5 Plastic Federation 1 0.5 Pretoria Day-care Mother Society 1 0.5 Self-training 1 0.5 Technician 1 0.5 Total 43 21.5

218
Observations
As table 6.12 indicates, 6.5% of the respondents made use of assistance from
friends, partners or family members. Two percent used accountants, 2% Cofesa
and another 2% assistance from the manager/owner (referring to another person
in the business).
As mentioned earlier in this section, some of these sources of assistance, such
as accountants, bookkeepers and financial advisors, should probably have been
mentioned under "specialists" in table 6.11.
6.4.7 Duration of the assistance
SME owners seek assistance from different sources at different stages of their
business life cycle. In this section the duration of the assistance was determined.
Figure 6.10 indicates the responses in this area.
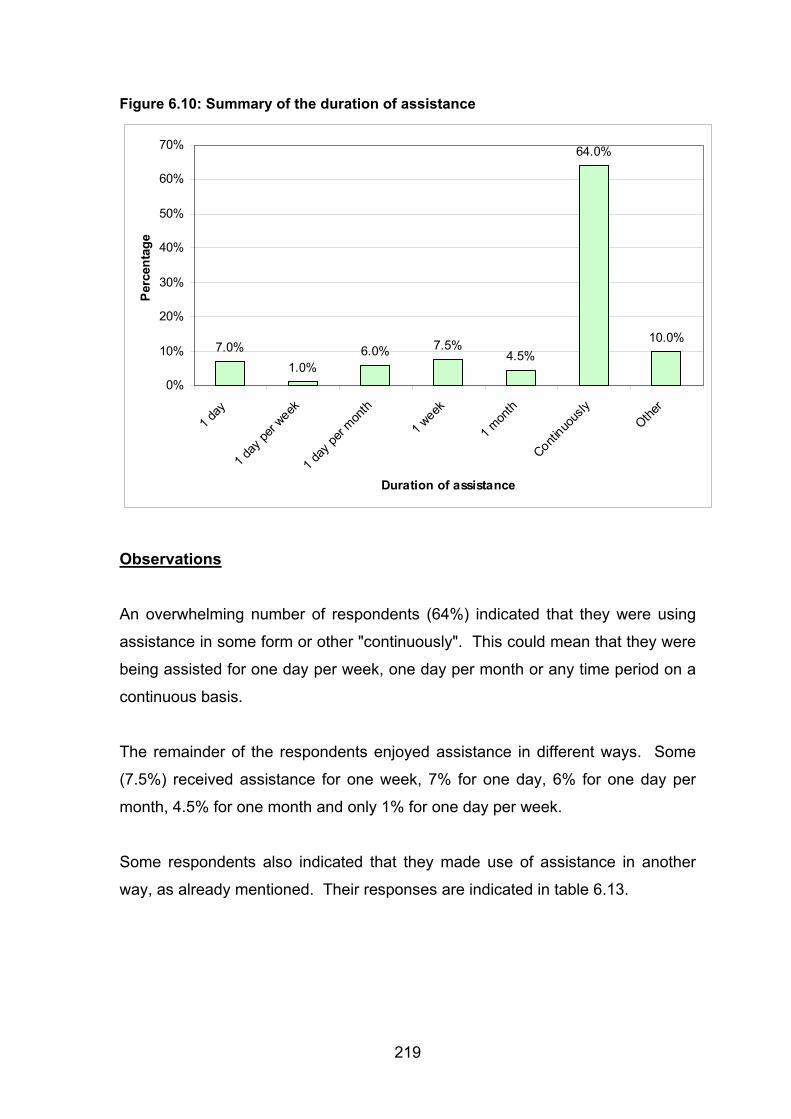
219
Figure 6.10: Summary of the duration of assistance
7.0%1.0%
6.0% 7.5%4.5%
64.0%
10.0%
0%
10%
20%
30%
40%
50%
60%
70%
1 day
1 day
per w
eek
1 day
per m
onth
1 week
1 mon
th
Continuo
usly
Other
Duration of assistance
Per
cent
age
Observations
An overwhelming number of respondents (64%) indicated that they were using
assistance in some form or other "continuously". This could mean that they were
being assisted for one day per week, one day per month or any time period on a
continuous basis.
The remainder of the respondents enjoyed assistance in different ways. Some
(7.5%) received assistance for one week, 7% for one day, 6% for one day per
month, 4.5% for one month and only 1% for one day per week.
Some respondents also indicated that they made use of assistance in another
way, as already mentioned. Their responses are indicated in table 6.13.

220
Table 6.13: Other timeframes of assistance specified
Frequency Percent Valid 9 years 2 1.0 4 years 1 0.5 3 years 2 1.0 Every year 1 0.5 3 months/3-4 times a year 3 1.5 6 months/twice a year 2 1.0 18 months 1 0.5 2-3 days 2 1.0 It depends on how soon different companies pay 1 0.5 Only when we need something 4 2.0 Not often 1 0.5Total 20 10.0
Observations
The "other" timeframes specified by the respondents ranged from nine years to
"not often". While some specified the period of time they had been assisted such
as three and four years, others indicated that they were assisted for two to four
times every year. The most frequent "other" option (mentioned by four
respondents) was "only when we need something".
6.5 SHORTCOMINGS IN THE ASSISTANCE RECEIVED
The literature study on the assistance available to SME owners in South Africa
indicated that SME owners are being assisted in many different ways and by
many different bodies. The question that arose is whether this assistance is
actually enhancing the success rate of SMEs. The literature researched did not
disclose this, which is why the shortcomings (if any) were investigated in the
whole process of assistance.
Assistance that is unsuccessful or inadequate could either result in business
failure or the owner seeking alternative assistance. All the respondents in this
study had received assistance and the majority of the respondents had
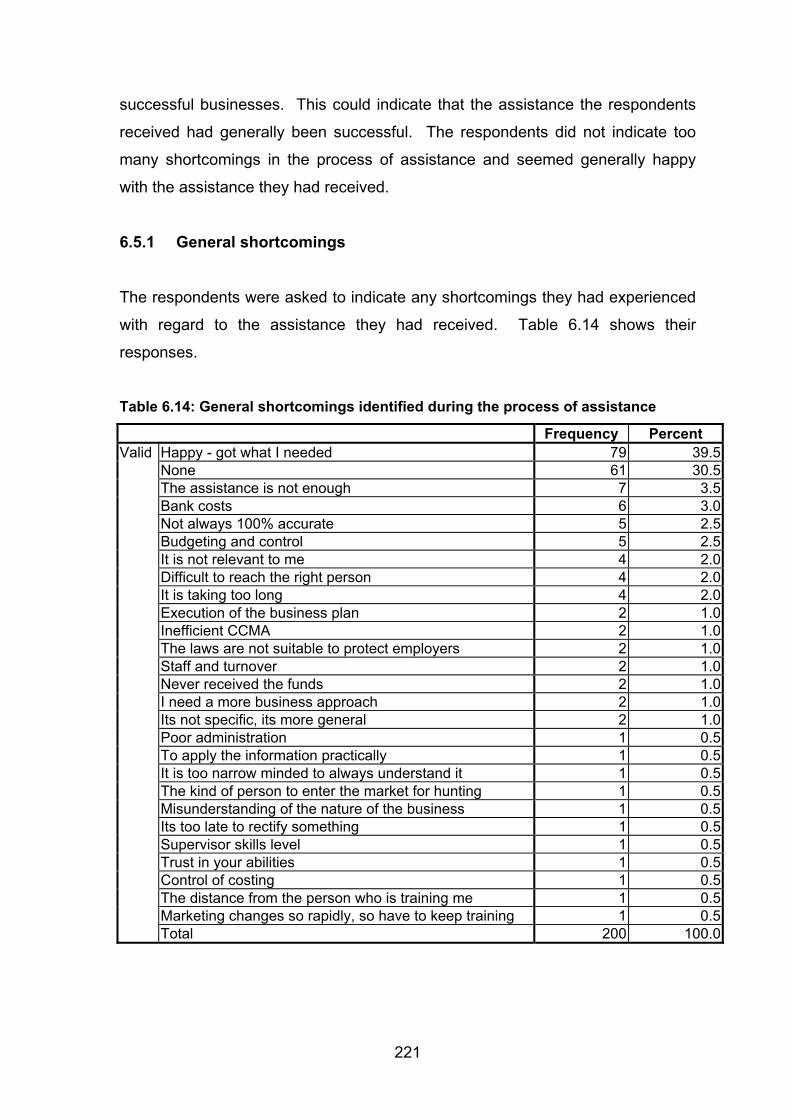
221
successful businesses. This could indicate that the assistance the respondents
received had generally been successful. The respondents did not indicate too
many shortcomings in the process of assistance and seemed generally happy
with the assistance they had received.
6.5.1 General shortcomings
The respondents were asked to indicate any shortcomings they had experienced
with regard to the assistance they had received. Table 6.14 shows their
responses.
Table 6.14: General shortcomings identified during the process of assistance
Frequency Percent Valid Happy - got what I needed 79 39.5 None 61 30.5 The assistance is not enough 7 3.5 Bank costs 6 3.0 Not always 100% accurate 5 2.5 Budgeting and control 5 2.5 It is not relevant to me 4 2.0 Difficult to reach the right person 4 2.0 It is taking too long 4 2.0 Execution of the business plan 2 1.0 Inefficient CCMA 2 1.0 The laws are not suitable to protect employers 2 1.0 Staff and turnover 2 1.0 Never received the funds 2 1.0 I need a more business approach 2 1.0 Its not specific, its more general 2 1.0 Poor administration 1 0.5 To apply the information practically 1 0.5 It is too narrow minded to always understand it 1 0.5 The kind of person to enter the market for hunting 1 0.5 Misunderstanding of the nature of the business 1 0.5 Its too late to rectify something 1 0.5 Supervisor skills level 1 0.5 Trust in your abilities 1 0.5 Control of costing 1 0.5 The distance from the person who is training me 1 0.5 Marketing changes so rapidly, so have to keep training 1 0.5 Total 200 100.0

222
Observations
Of the 200 responses, 39.5% respondents indicated that they were "happy with
the assistance" they had received and that they "got what the needed", while
30.5% could not identify any shortcomings in the assistance they had received.
Of the respondents, 3.5% also indicated that the assistance was inadequate.
If the respondents who were happy with the assistance they had received and
those who got what they wanted are ignored, the remainder (30%) of the
respondents identified shortcomings in the process of assistance. The list of
shortcomings is indicated in table 6.14. This list could probably be summarised
as follows in table 6.15:
Table 6.15: Summary of shortcomings identified during the process of assistance
Area of shortcoming Frequency Percent Valid Assistance not 100% accurate, efficient, relevant,
applicable or enough 30 15
Cost related shortcomings, including budgeting and control
14 7
Time issues (assistance being too long, too late and needed too often because of environmental changes)
5 2.5
Other such as legal shortcomings, internal staff issues and poor administration
11 5.5
Observations
The main shortcoming identified (table 6.15) by 15% of the respondents was that
the assistance provided had not always been 100% accurate, efficient, relevant,
applicable or enough. The reasons for this were not identified, but these
respondents should have endeavoured to communicate this to the providers for
more efficient assistance in the future.
Another 7% of the respondents identified cost-related issues as a shortcoming. A
few also mentioned that the assistance they had received was too long, sought
too late and one even mentioned that rapidly changing marketing had forced

223
him/her to "keep training". Additional issues such as legal shortcomings, internal
staff issues and poor administration were also mentioned.
Although 30% of the respondents identified shortcomings in the process of
assistance, only 8.5% of the respondents were unsuccessful. These
shortcomings should be investigated and rectified, but they did not seem to
influence the success rate of the businesses that much, since so many of the
respondents were still successful.
Even the unsuccessful businesses were generally satisfied with the assistance
they received and few of them identified any shortcomings. Table 6.44 shows the
cross-tabulation of unsuccessful businesses and the shortcomings identified by
the owners of these businesses.
6.5.2 Specific shortcomings in each area of assistance
The areas or functions in which the respondents were assisted as mentioned in
section 6.3.1 (Areas/functions of the business in which the respondents received
or are receiving external assistance) were also studied separately to determine
what type of shortcomings were identified in each area or function. Table 6.16
indicates the shortcomings for each area, as perceived by the respondents.

224
Table 6.16: Shortcomings as perceived by the respondents for each area
Shortcomings for finance/accounting Frequency Percent Valid Happy - got what I needed 29 36.3 None 25 31.3 The assistance is not enough 4 5.0 Not always 100% accurate 3 3.8 Bank costs 3 3.8 Budgeting and control 3 3.8 It’s not specific, it’s more general 2 2.5 It is taking too long 2 2.5 Never received the funds 2 2.5 It is not relevant to me 1 1.3 Difficult to reach the right person 1 1.3 The assistance is not enough 1 1.3 To apply the information practically 1 1.3 Trust in your abilities 1 1.3 I need a more business approach 1 1.3 Its too late to rectify something 1 1.3 Total 80 100.0 Shortcomings for marketing Frequency Percent Valid Happy - got what I needed 15 44.1 None 9 26.5 Not always 100% accurate 3 8.8 Bank costs 2 5.9 Inefficient CCMA 1 2.9 The distance from the person training me 1 2.9 Marketing changes so rapidly, so have to keep training 1 2.9 Execution of the business plan 1 2.9 Control of costing 1 2.9 Total 34 100 Shortcomings for human resources Frequency Percent Valid Happy - got what I needed 8 36.4 None 6 27.3 Difficult to reach the right person 2 9.1 The laws are not suitable to protect employers 2 9.1 It is not relevant to me 1 4.5 The assistance is not enough 1 4.5 Inefficient CCMA 1 4.5 Budgeting and control 1 4.5 Total 22 100.0

225
Shortcomings for production/operations Frequency Percent Valid None 7 43.8 Happy - got what I needed 5 31.3 It is not relevant to me 1 6.3 Staff and turnover 1 6.3 It is taking too long 1 6.3 Supervisor skills level 1 6.3 Total 16 100 Shortcomings for legal aspects Frequency Percent Valid None 8 53.3 Happy - got what I needed 3 20.0 Difficult to reach the right person 1 6.7 Not always 100% accurate 1 6.7 Bank costs 1 6.7 Budgeting and control 1 6.7 Total 15 100.0 Shortcomings for administration Frequency Percent Valid Happy - got what I needed 7 70.0 It is taking too long 1 10.0 None 1 10.0 Poor administration 1 10.0 Total 10 100.0 Shortcomings for health and safety Frequency Percent Valid Happy - got what I needed 4 44.4 None 3 33.3 The assistance is not enough 1 11.1 Staff and turnover 1 11.1 Total 9 100.0 Shortcomings for business plan Frequency Percent Valid Happy - got what I needed 3 50.0 Execution of the business plan 1 16.7 None 1 16.7 I need a more business approach 1 16.7 Total 6 100.0

226
Shortcomings for IT Frequency Percent Valid It is not relevant to me 1 33.3 Happy - got what I needed 1 33.3 none 1 33.3 Total 3 100.0 Shortcomings for systems Frequency Percent Valid Happy - got what I needed 3 100.0 Observations
The most shortcomings were found in the areas of finance, marketing and human
resources. However, these were also the areas in which respondents had
received the most assistance. The least shortcomings were found in the areas of
IT and systems. In table 6.17 and in the graphical representation below, the two
variables, “Assistance received in each area” and ”Shortcomings in each area”
are compared.
Table 6.17: Comparison of the areas in which respondents were assisted and the shortcomings in those areas
Percentage of shortcomings in each area
Percentage of assistance in each area
Valid
IT 1.5 3.0Systems 1.5 3.0Business plan 3.0 4.7Health and safety 4.5 7.1Legal aspects 7.6 7.3Production/operations 8.1 8.0Administration 5.1 8.5Human resources 11.1 11.5Marketing 17.2 15.3Finance/accounting 40.4 31.5

227
Figure 6.11: Graphical representation of Table 6.17
0 10 20 30 40 50
IT
Systems
Business plan
Health and safety
Legal aspects
Production/operations
Administration
Human resources
Marketing
Finance/accountingB
usin
ess
area
s
Percentage
Percentage ofshortcomings ineach area
Percentage ofassistance ineach area
Observations
The graph clearly indicates a relationship between the assistance provided in
each area of the business and the shortcomings in that specific area. In most
areas the number of shortcomings is in proportion to the amount of assistance
rendered.
However, there are some areas in which the percentage shortcomings were
higher than in others. The areas in which the percentage of shortcomings was
the highest are finance/accounting (40.4%), marketing (17.2%) and human
resources (11.1%). Although the areas of finance/accounting, marketing and
human resources were high on the list of assistance received they were also of
the areas in which the most shortcomings were identified. The question that
arises is whether the SMEs were receiving the type of assistance they really
need.

228
On the lower end of the scale are the areas of IT and systems, indicating that
there were few or no shortcomings in the process of assistance.
There appears to be a general failure in respect of the assistance in
finance/accounting and marketing. Although only 31.5% of the respondents
received assistance in finance/accounting, 40.4% of the shortcomings was
identified in this area. A similar but less severe difference was found in marketing
where 15.3% of the respondents received assistance in marketing and 17.2% of
the shortcomings was identified in the marketing area. Finance/accounting and
marketing were the areas with the highest priorities of assistance and also the
areas in which there was the greatest mismatch between what was expected and
what was received. These areas need more specific assistance focusing on
solutions to their problems.
Although not much assistance was rendered in the areas of IT and systems, it
was mostly relevant, efficient, and accurate and/or what was needed.
6.6 FACTORS CONTRIBUTING TO THE SUCCESS OF SMEs
Most of the businesses in this study were successful. There could be many
factors contributing to the success of these businesses.
6.6.1 Respondents' perception of the most important factors that contributed to the success of their business
The respondents were asked to indicate the three most important factors they
thought contributed to their success. They were given some options and also
afforded the opportunity to specify any other contributing factors. Their
responses are indicated in table 6.18. The numbers shown in that table under

229
the "frequency" heading refer to the total number of times the respondents
mentioned the specific factor as first, second and third most important factor.
The areas are ranked from highest to lowest, the highest being that area or
function in the business that the respondents indicated as the most important
factor contributing to their success, and the lowest that area they thought
contributed least to their success.
Table 6.18: Factors that contributed to the success of the respondents' businesses
Frequency Percent Valid
The type of product 148 74.0%Marketing 107 53.5%The location of the business 55 27.5%Good human relationships 54 27.0%Your persistence 49 24.5%The need of the community 31 15.5%Your involvement in the business 27 13.5%Financial management 22 11.0%Endurance to continue 19 9.5%Positive approach 13 6.5%The assistance you received 4 2.0%Creativity 4 2.0%Other 66 33.0%

230
Figure 6.12: Graphical representation of table 6.18
33.0%
2.0%
2.0%
6.5%
9.5%
11.0%
13.5%
15.5%
24.5%
27.0%
27.5%
53.5%
74.0%
0% 10% 20% 30% 40% 50% 60% 70% 80%
Other
The assistance you received
Creativity
Positive approach
Endurance to continue
Financial management
Your involvement in the business
The need of the community
Your persistence
Good human relationships
The location of the business
Marketing
The type of product
Percentage
Observations
According to the respondents, the type of product, including the quality of the
product they provided, was by far the most important factor contributing to the
success of their businesses. Of the 200 respondents, 74% chose this factor as
one of the most important factors.
The second most important factor chosen by 53.5% of the respondents as
contributing to their success was marketing. Three factors were perceived as
similarly important (the % in brackets indicating the percentage of respondents
choosing that factor). The factors were the location of the business (27.5%),
good human relationship, (also seen as a form of marketing), (27%) and the
persistence of the owner (24.5%). Marketing had already been identified as an
important factor for success - hence SMEs need for more relevant marketing
assistance.

231
The factors that the respondents perceived as least important were a positive
approach (6.5%), creativity (2%) and the assistance they had received or are
receiving (2%).
As mentioned at the beginning of this section, the respondents were also asked
to indicate the three most important factors they thought contributed to their
success. Table 6.56 (see appendix B) indicates the different factors contributing
to the success of the respondents' businesses as well as the responses showing
the number of respondents choosing the specific factor as first, second and third
most important. To make this information more meaningful, the weighted
averages were calculated and are presented in figure 6.13.

232
Figure 6.13: The weighted averages of the different factors contributing to the success of the respondents' businesses
323
214
108 107 102
60 5539 29 22
7 6
125
0
50
100
150
200
250
300
350
The ty
pe of p
roduct
Marketi
ng
Good h
uman
relatio
nships
Your p
ersiste
nce
The lo
catio
n of th
e bus
iness
The ne
eds o
f the c
ommun
ity
The in
volve
ment in
busin
ess
Financia
l man
agem
ent
Endura
nce t
o conti
nue
Positiv
e appro
ach
Creativ
ity
The as
sistanc
e you r
eceiv
ed or
are re
ceivin
gOthe
r
Factors contributing to success
Wei
ghte
d av
erag
es
Observation
The two most important contributing factors are quite clear. According to the
respondents they were the type of product and the marketing. The following
three factors were all similarly rated. These factors were persistence, good
human relations and the location of the business. The only other outstanding
factor was the "other" choice.

233
One should bear in mind that the respondents were asked to give only three
factors contributing to the success of their businesses and that the concentration
of responses was around the first or similar factors, as indicated in table 6.56.
It is worth noting that 33% of the respondents also mentioned other factors
contributing to their success. These are indicated in table 6.19.
Table 6.19: "Other" factors mentioned that contributed to success
Other Frequency Percent Valid Price of product/service 11 5.5 Quality staff (including commitment and honesty) 11 5.5 Cash flow 3 1.5 Human resources 3 1.5 The availability of after-sales staff 3 1.5 Cleanliness 2 1.0 Clientele or client base 2 1.0 Good system or information on the system 2 1.0 Keeping up to date with technology 2 1.0 Management 2 1.0 Product knowledge 2 1.0 Research and development or demand for the product 2 1.0 Sales 2 1.0 Timeous approach 2 1.0 Communication 1 0.5 Correct ratio of labour rates 1 0.5 Creditworthiness 1 0.5 Economic growth 1 0.5 Flexibility 1 0.5 Health and safety 1 0.5 I don't know 1 0.5 Internal control 1 0.5 International approach 1 0.5 Manufacturing 1 0.5 Profit 1 0.5 Resource management 1 0.5 Team work 1 0.5 The love and care of children 1 0.5 The vet 1 0.5 Type of business 1 0.5 Weather conditions 1 0.5Total 66 33.0
234
Observations
The price of the product/service and quality staff (including the traits of
commitment and honesty) were by far the most important "other" factors
influencing the success of a business. These two factors were each mentioned
by 5.5% of the respondents. Others worth mentioning were cash flow, human
resources and the availability of after-sales staff, as mentioned by 1.5% of the
respondents.
The fact that the respondents did not regard the assistance they had received or
were receiving as an important contributing factor to their success does seem
inconsistent, seeing that most of them thought that assistance was important and
that they needed assistance on a continuous basis. Again assistance was seen
as a support function.
They might have regarded assistance as being important but the assistance was
not the factor that made them successful. The factors mentioned such as
product quality and marketing were critical to their success.
Another interesting fact is that although the respondents deemed finance to be
one of the most important areas in which assistance was needed, they did not
see it as a contributing factor to their success. Finance by itself could probably
not determine the success of the business in the same way as the right product
at the right quality and with the right marketing strategies. Finance is a vital
supporting factor and the finances of the business could be managed as well as
possible, but if the business did not work in terms of the factors mentioned, the
best financial practices would not have saved it.
Success depends on many factors as indicated by the respondents of which
assistance probably plays a minute role. Unfortunately there was no control
group who did not receive assistance to measure against. The period of the

235
study also coincided with high economic growth which suggests higher success
levels anyway. This could imply that the respondents could have been
successful without having received assistance in any case. However, the fact
that they sought assistance indicated that there was a need for assistance.
6.6.2 The respondents' perception of the consequences of the assistance received
The question was then put to the respondents whether they thought that the
assistance they had received actually caused their businesses to be more
successful. Table 6.20 shows their responses.
Table 6.20: Is your business more successful because of the assistance you received or are receiving?
Frequency Percent Valid Yes 144 72.0 No 56 28.0 Total 200 100.0
Observations
Of the 200 respondents, 72% mentioned that their businesses were more
successful because of the assistance they had received.
6.6.3 Respondents' recommendations about when assistance should be sought
Earlier during the study (question 6 of the questionnaire in appendix A) the
respondents were asked when they had actually received the assistance they
had mentioned.
The respondents in this study were generally successful and all of them had been
assisted in some way. Because of this one may assume that they were in some

236
position to indicate the best time to seek assistance. This question was put to
them and their responses can be seen in table 6.21 and figure 6.14.
Table 6.21: According to you, when should a person seek assistance similar to what you have mentioned?
Frequency Percent Valid Before starting your business 69 34.5 During the first six months 18 9.0 During the first two years 6 3.0 After the first two years 3 1.5 During all phases of the business 104 52.0 Total 200 100.0 Figure 6.14: Graphical representation of table 6.21
34.5%
9.0%
3.0% 1.5%
52.0%
0%
10%
20%
30%
40%
50%
60%
Before startingyour business
During the first 6months
During the first 2years
After the first 2years
During allphases of the
business
Freq
uenc
y

237
Observations
Of the 200 respondents, 52% indicated that SME owners should seek assistance
similar (see sec. 6.4) to what they had mentioned. Another 34.5% indicated that
SME owners should seek assistance before starting their businesses, and while
only 12% thought that assistance is only needed during the first six months (9%)
and first two years (3%). Assistance after the first two years of the existence of a
SME does not seem to have value, since only 1.5% of the respondents felt that it
should be sought at that stage.
It was interesting to compare the two answers to questions 6 and 13 in the
questionnaire. In question 6, the respondents were asked to indicate "when they
actually received the assistance" they had mentioned, while in question 13, they
were asked how they felt about "when the best time would be" to seek and
receive assistance as an SME owner. Figure 6.15 provides a graphical
comparison of these two responses.
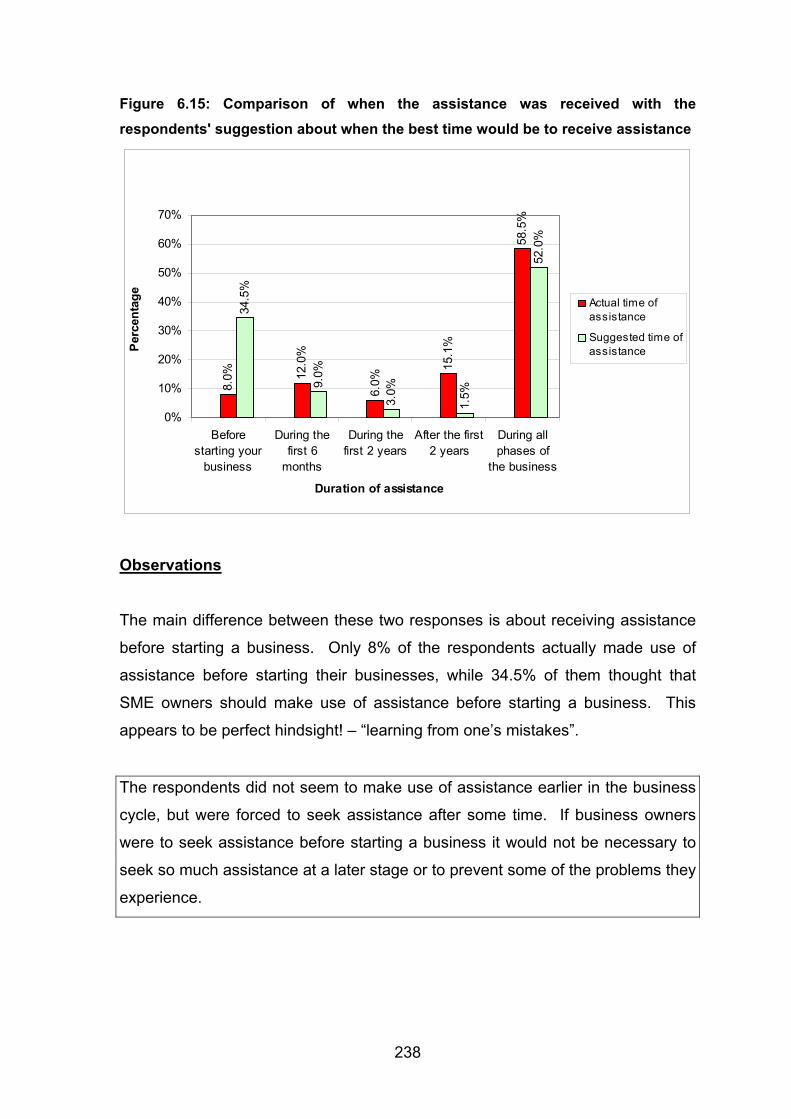
238
Figure 6.15: Comparison of when the assistance was received with the respondents' suggestion about when the best time would be to receive assistance
8.0% 12
.0%
6.0%
15.1
%
58.5
%
34.5
%
9.0%
3.0%
1.5%
52.0
%
0%
10%
20%
30%
40%
50%
60%
70%
Beforestarting your
business
During thefirst 6
months
During thefirst 2 years
After the first2 years
During allphases of
the business
Duration of assistance
Perc
enta
ge Actual time ofassistance
Suggested time ofassistance
Observations
The main difference between these two responses is about receiving assistance
before starting a business. Only 8% of the respondents actually made use of
assistance before starting their businesses, while 34.5% of them thought that
SME owners should make use of assistance before starting a business. This
appears to be perfect hindsight! – “learning from one’s mistakes”.
The respondents did not seem to make use of assistance earlier in the business
cycle, but were forced to seek assistance after some time. If business owners
were to seek assistance before starting a business it would not be necessary to
seek so much assistance at a later stage or to prevent some of the problems they
experience.

239
The second largest difference was the in timeframe of "after two years". Although
many (15.5%) made use of assistance during this time, few (1.5%) thought that
this was the time to seek assistance.
An equally large percentage of 58.5% of the 200 respondents had actually
received assistance and 52% suggested that SME owners should be assisted
during all phases of the business.
From the above it is clear that there was general consensus among the
respondents that successful businesses should make use of assistance during all
the stages of the life cycle of the business.
6.7 CORRELATIONS AND CROSS-TABULATIONS (initial classification)
In this section the researcher used cross-tabulation tables (contingency tables) to
indicate different relationships between two or more categorical (nominal or
ordinal) variables.
A cross-tabulation (cross-tab) is a table in which each cell represents a unique
combination of values. This technique describes the relationships between
variables and measures the extent to which a change in one variable is attributed
to a change in another (Welman & Kruger, 2001:209-212). This allows you to
visually analyse whether one variable’s distribution is contingent on another’s. It
provides you with a visual view of comparative data (Byrne, 2007:41).
If the proportions of individuals in the different columns vary between rows, it
implies that the table shows contingency between the two variables. If there is no
contingency, then the two variables are independent. The degree of association
between the two variables can be assessed by a number of coefficients: the
simplest is the phi coefficient. If both variables are nominal and dichotomous, phi

240
coefficient is a measure of the degree of association between two binary
variables.
Cross-tabulations involve numerous statistics. In section 6.8, a proportional
reduction of error (PRE) measure known as lambda (symbolised by the Greek
letter λ) will be used to determine and measure the strength of the association
between the variables.
Lambda has a possible range of 0 to 1. A value of 0 means that the information
supplied by the independent variable does not improve the ability to predict the
dependent variable. Hence there is no association between the variables. A
value of 1 means that the independent variable predicts the dependent variable
perfectly and that there is an association between the variables (Anon, 2007).
Values between 0 and 1, say 0.7 have a direct and meaningful interpretation.
These values can be seen as indices of the extent to which one variable helps to
predict another. When multiplied by 100, the value of lambda indicates the
percentage reduction in error and therefore the strength of the association. A
lambda of 0.7 would be interpreted by concluding that knowledge of the
independent variable improves the ability to predict the dependent variable by a
factor of 70%. In other words, the researcher is 70% better off knowing the
independent variable (such as size of the business) when attempting to predict
the dependent variable (such as the success of the business) than someone else
who does not know what the independent variable is (Anon, 2007).
Chi-square was not used because the cross-tabulation matrix was unbalanced in
most of the above cases. The differences in the cell values were too large,
violating one of the assumptions upon which chi-square is based.

241
Several cross-tabulations were done. These are discussed below. All the tables
that are not displayed but are referred to in this section are provided in appendix
B: Tables mentioned but not included in chapters.
Important note on the correlations and cross-tabulations in this section:
In most of the correlations and cross-tabulations, the variable for the success of
the businesses will be used. The respondents were required to answer question
2 of the questionnaire, indicating on a scale of 1 to 7 how successful they thought
their businesses were. The responses are provided in figure 6.4.
In the first part of this section (sec. 6.7: correlations and cross-tabulations
[initial classification]) the responses/ratings were divided into the following
categories:
Table 6.22 Initial classification of ratings
Rating by respondents
Classification as a measure of success
Frequency Percentage
1-3 Dissatisfied (unsuccessful) 17 8.5
4-5 Satisfied 125 62.5
6-7 Delighted 58 29
These categories were used to do some correlations and cross-tabulations.
However, owing to the fact that the base size was too small (only 17) for the
“dissatisfied” category, it was not possible to perform any test of significance. An
acceptable base size for significance differences is 30, and for accurate and
reliable significance tests a base size of 50 is required.
The categories of “delighted/satisfied/dissatisfied” were used for the first part
because it was necessary to distinguish between the "unsuccessful" (dissatisfied
category) and the "successful" businesses and more meaningful comparisons
could be made.

242
In the second part of this section (sec. 6.8: correlations and cross-tabulations
[adjusted classification]) the responses/ratings were divided into the following
categories:
Table 6.23 Adjusted classification of ratings
Rating by respondents
Classification as a measure of success
Frequency Percentage
1-4 Least successful 59 29.5
5 Satisfied 83 41.5
6-7 Very successful 58 29
The seven-point Likert scale (see figure 6.3 – Respondents’ perception of how
successful their businesses were) was specifically chosen in order to assist in the
categorisation of the perceived success variables. With a mean of 4.97, a
median of 5, a mode of 5 and a skewness of -.378, it was necessary to
categorise the data as indicated in table 6.23.
This reason for dividing the responses into these categories with more equal
frequencies is to enable the researcher to perform tests of significance. This will
be possible because the base sizes of the different categories are similar. Since
the base sizes are now > 50, reliable significance tests can be performed.
The classifications are also changed as indicated above. The reasons for
changing the classifications are as follows:
• Changing "dissatisfied" to "least successful". A respondent choosing a rating
of 1 to 3 could be regarded as dissatisfied and unsuccessful. The new
classification includes the 4 ratings. On a scale of 1 to 7, a rating of 4 is
surely not unsuccessful. This category is therefore called "least successful" in
a relative sense to the others.

243
• Those respondents who rated their success as a 6 or 7 were obviously not
only delighted, but also "very successful", and this group constitutes a large
enough number to work with.
• The respondents who rated their success as 5 were also obviously "satisfied".
To summarise the change in the classification structure, note the following:
Table 6.24 Classifications (initial and adjusted) of ratings as percentages
Rating by
respondents
(initial)
Rating by
respondents
(adjusted)
Classification
(initial)
Classification
(adjusted)
Percentage
(initial)
Percentage
(adjusted)
1-3 1-4 Dissatisfied Least successful 8.5 29.5
4-5 5 Satisfied Satisfied 62.5 41.5
6-7 6-7 Delighted Very successful 29 29
Although the data was manipulated to get an even distribution, the focus was on
the more successful, or as indicated in table 6.24, the satisfied and very
successful responses. The “unsuccessful” responses will be discussed
separately in section 6.9.
6.7.1 The areas of assistance (sec. 1, Q5) and the success of the businesses (sec. 1, Q2)
Table 6.57 (appendix B) illustrates the relationship between areas of assistance,
and the extent to which the respondent felt that his/her business was successful.
However, the following was done to simplify the discussion of this section, and
make it more meaningful:
Table 6.31 was created, classifying the "delighted" and "satisfied" splits for
satisfaction with the success of the business as "successful businesses" and
the "dissatisfied" splits as "unsuccessful businesses". The responses were

244
ranked from most assistance received to least assistance received. For the
remainder of this section (secs. 6.7.1-6.7.6), the principle will be used of
combining the "delighted" and "satisfied" splits as "successful businesses".
The reason for using only two categories in this section is that the researcher did
not see the need to distinguish between the different levels of success. It was a
matter of comparing the successful businesses with the less successful
businesses in each correlation.
Table 6.25: Summary of cross-tabulation of successful/unsuccessful businesses and areas of assistance
Successful businesses
Unsuccessful businesses Total
n % n % n % Financial 76 95.0% 4 5.0% 80 100%Marketing 32 94.1% 2 5.9% 34 100%Human resources 20 90.9% 2 9.1% 22 100%Production/operations 14 87.5% 2 12.5% 16 100%Legal aspects 13 86.7% 2 13.3% 15 100%Administration 9 90.0% 1 10.0% 10 100%Health and safety 6 66.7% 3 33.3% 9 100%Business plan 6 100.0% 0 0.0% 6 100%Systems 3 100.0% 0 0.0% 3 100%IT 2 66.7% 1 33.3% 3 100%
Observations
Of the respondents who mentioned financial as the number one area in which
they had received assistance, 95% felt that their businesses were successful and
only 5% felt that their businesses were unsuccessful.
Those who mentioned marketing as the number one area in which they had
received assistance, 94.1 % of them felt that their businesses were successful,
while 5.9% felt that their businesses were unsuccessful.

245
6.7.2 The time in the business cycle in which assistance was used (sec. 1, Q6) and the success of the businesses (sec. 1, Q2)
Table 6.26 illustrates the relationship between the time in the business cycle in
which assistance was used and the success of the businesses.
Table 6.26: The time in the business cycle in which assistance was used of and the success of the businesses
Successful businesses
Unsuccessful businesses Total
Count % Count % Count % Before starting your business 16 100.0% 0 0.0% 16 100%During the first 6 months 20 83.3% 4 16.7% 24 100%During the first 2 years 10 83.3% 2 16.7% 12 100%After the first 2 years 30 96.8% 1 3.2% 31 100%Continuously 107 91.5% 10 8.5% 117 100%Group total 183 100.0% 17 100.0% 200 100%
Observations
Of the 117 respondents who had used assistance continuously throughout the life
cycle of the business, 91.5% had successful businesses. Another 31
respondents made use of assistance after the first two years. Of these, 97% had
successful businesses. Of the 24 that used assistance during the first six
months, 83% had successful businesses.
All of the respondents who made use of assistance before starting their
businesses were successful. Although these are small numbers, they do indicate
that seeking assistance before the problem arises helps SMEs to be successful –
hence the adage of “prevention is better than cure” still applies.

246
6.7.3 The way in which the respondents were assisted (sec. 1, Q7) and the success of the businesses (sec. 1, Q2)
Table 6.27 indicates only the "yes" answers to the options given regarding the
way in which the respondents were assisted and the successful and unsuccessful
businesses.
Table 6.27: Summary of the way the respondents were assisted and the success of the businesses
Successful Unsuccessful Total n % n % n %
I was given advice
85 89% 10 11% 95 100%
I was trained on the job
44 94% 3 6% 47 100%
I outsourced some functions to external specialists
45 96% 2 4% 47 100%
I made use of consultants to assist me
60 94% 4 6% 64 100%
I attended formal training/course(s)
32 94% 2 6% 34 100%
Group total 266 100% 21 100% 287 100%
Observations
Although some options were used more than others, all the businesses showed a
similarly high percentage of success. Only in the category of "I was given advice"
did the respondents (89%) indicate a lower than 90% success rate for their
businesses.
6.7.4 The assistance provider (sec. 1, Q8) and the success of the businesses (sec. 1, Q2)
Table 6.28 indicates only the "yes" answers to the options regarding the
presenters of the assistance and the successful and unsuccessful businesses.

247
Table 6.28: Summary of the assistance providers and the success of the businesses
Successful Unsuccessful Total n % n % n %
Another business 57 93% 4 7% 61 100%Consultant/specialist 79 92% 7 8% 86 100%Trainer 13 100% 0 0% 13 100%Educational institution 17 94% 1 6% 18 100%Group total 166 100% 12 100% 178 100%
Observations
More than 90% of the businesses that had made use of other businesses and
consultants/specialists for assistance were successful.
6.7.5 The duration of actual assistance (sec. 1, Q9) and the success of the businesses (sec. 1, Q2)
Table 6.29 indicates the duration of assistance and the successful and
unsuccessful businesses.
Table 6.29: The duration of the actual assistance and the success of the businesses
Successful Unsuccessful Total n % n % n %
1 day 11 78.57% 3 21.43% 14 100%1 day per week 2 100.00% 0 0.00% 2 100%1 day per month 10 83.33% 2 16.67% 12 100%1 week 15 100.00% 0 0.00% 15 100%1 month 8 88.89% 1 11.11% 9 100%Continuously 118 92.19% 10 7.81% 128 100%Other 19 95.00% 1 5.00% 20 100%
Group total
183 91.50% 17 8.50% 200 100%

248
Observations
The numbers of respondents who made use of assistance for one day per week,
one week, only one day and for one day per month are so small that they are not
really meaningful.
Of the 118 respondents who received continuous assistance, 92.19% had
successful businesses, which proves the point that continuous assistance does
help SMEs to survive and grow.
6.7.6 Shortcomings identified by the respondents (sec. 1, Q10) and the success of the businesses (sec. 1, Q2)
Table 6.30 indicates the shortcomings identified by the respondents and the
success of their businesses.

249
Table 6.30: The shortcomings identified by the respondents and the success of the businesses Successful Unsuccessful n % n % Happy - got what I needed 73 39.89% 6 35.29%None 55 30.05% 6 35.29%Bank costs 6 3.28% 0 0.00%Budgeting and control 4 2.19% 1 5.88%It is taking too long 4 2.19% 0 0.00%Not always 100% accurate 4 2.19% 1 5.88%The assistance is not enough 6 3.28% 1 5.88%Difficult to reach the right person 4 2.19% 0 0.00%It is not relevant to me 4 2.19% 0 0.00%It is not specific, its more general 2 1.09% 0 0.00%Never received the funds 2 1.09% 0 0.00%Control of costing 1 0.55% 0 0.00%Execution of the business plan 2 1.09% 0 0.00%I need a more business approach 1 0.55% 1 5.88%Inefficient CCMA 1 0.55% 1 5.88%It is too narrow-minded to always understand it 1 0.55% 0 0.00%It is too late to rectify something 1 0.55% 0 0.00%Marketing changes so rapidly, so have to keep training 1 0.55% 0 0.00%Misunderstanding of the nature of the business 1 0.55% 0 0.00%Staff and turnover 2 1.09% 0 0.00%Supervisor skills level 1 0.55% 0 0.00%The distance from the person training me 1 0.55% 0 0.00%The kind of person to enter the market for head-hunting 1 0.55% 0 0.00%The laws are not suitable to protect employers 2 1.09% 0 0.00%To apply the information practically 1 0.55% 0 0.00%Trust in your abilities 1 0.55% 0 0.00%Poor Administration 1 0.55% 0 0.00%Group total 183 100.00% 17 100.00%
Observations
The respondents identified many different shortcomings. Although 128 of the
respondents indicated that there were no shortcomings in the assistance they
had received, 9.4% of these still had unsuccessful businesses. Although
numerous shortcomings were identified, the businesses were generally
successful.

250
6.7.7 The respondents’ perception of their business being more successful after having received assistance (sec. 3, Q12) and the success of the businesses (sec. 1, Q2) (Table 6.31)
From here on and for the remainder of this section, the
“delighted/satisfied/dissatisfied” responses regarding success were used to
indicate whether the assistance received by the respondents had actually
influenced the success of their businesses.
Table 6.31: The respondents’ perception of their business being more successful after having received assistance and the success of the businesses
Delighted Satisfied Dissatisfied Group total n % n % n % n %
Yes 46 79.3% 87 69.6% 11 64.7% 144 72%No 12 20.7% 38 30.4% 6 35.3% 56 28%
Group total
58 100% 125 100% 17 100% 200 100%
Observations
Of the respondents, 79.3% who were delighted with the success of their
businesses also indicated that the business was more successful because of the
assistance they had received, while only 20.7% indicated that they the success of
their business was not because of the assistance they had received.
Of the respondents, 69.6% who were satisfied with the success of their
businesses indicated that the business was more successful because of the
assistance they had received, while 30.4% indicated that they the success of
their business was not because of the assistance they had received.
Of the 17 respondents who were dissatisfied with the success of their
businesses, 64.7% indicated that their businesses were actually more successful
than before because of the assistance, while six indicated that the assistance
they had received did not influence the success of their business.

251
6.7.8 The time when assistance should be sought (sec. 3, Q13) and the success of the businesses (sec. 1, Q2) (Table 6.32)
Table 6.32 shows the responses regarding when assistance should be sought
(not when it actually happened) and the success of the businesses. Once again
the “delighted/satisfied/dissatisfied” responses regarding success were used to
make some observations.
Table 6.32: When assistance should be sought and the success of the businesses
Delighted Satisfied Dissatisfied Group total n % n % n % n %
Before starting your business
21 36.2% 42 33.6% 6 35.3% 69 34.5%
During the first 6 months
5 8.6% 12 9.6% 1 5.9% 18 9.0%
During the first 2 years
3 5.2% 3 2.4% 6 3.0%
After the first 2 years
3 2.4% 3 1.5%
During all phases of the business
29 50.0% 65 52.0% 10 58.8% 104 52.0%
Group total
58 100% 125 100% 17 100% 200 100%
Observations
Of the 58 respondents who were delighted with the success of their businesses,
36.2% indicated that assistance should be sought before starting a business,
while 50% indicated that assistance should be sought during all the phases of the
business cycle. Only a few respondents (8.6%) suggested that assistance
should be sought during the first six months, while no-one suggested seeking
assistance after the first two years. The responses were similar from those
respondents who were satisfied with the success of their businesses. The small
differences are hardly worth mentioning.

252
Of the 17 respondents who were dissatisfied with the success of their
businesses, 58.8% suggested seeking assistance during all the phases of the
business cycle, while 35.3% proposed asking for assistance before starting a
business.
6.7.9 The qualifications of the respondents (sec. 4, Q14) and the success of the businesses (Sec. 1, Q2) (Table 6.33)
Table 6.33 depicts the highest qualifications of the respondents and the success
of the businesses. The researcher used the “delighted/satisfied/dissatisfied”
responses regarding success to make the observations.
Table 6.33: The qualifications of the respondents and the success of the businesses
Delighted Satisfied Dissatisfied Total n % n % n % n %
Below grade 10 3 5.2% 1 0.8% 4 2.0%Grade 10 to 12 20 34.5% 35 28.0% 4 23.5% 59 29.5%Certificate 9 15.5% 13 10.4% 3 17.6% 25 12.5%3-year diploma/degree
18 31.0% 62 49.6% 5 29.4% 85 42.5%
Honours degree 5 8.6% 10 8.0% 3 17.6% 18 9.0%Master’s degree 2 3.4% 4 3.2% 1 5.9% 7 3.5%Doctorate 1 1.7% 1 5.9% 2 1.0%
Group total
58 100% 125 100% 17 100% 200 100.0%
Observations
Of the 58 respondents who were delighted with the success of their businesses,
34.5% had a qualification of grade 10 to 12, 31% a three-year diploma/degree
and 15.5% a certificate.
Of the 125 respondents who were satisfied with the success of the business,
49.6% had a three-year diploma/degree, 28% a qualification of grade 10 to 12
and 10.4% a certificate.

253
It is quite significant to note that nearly half of the respondents who were satisfied
with the success of their businesses had a three-year diploma/degree. This is
much higher than any other category in this table.
Of the 17 respondents who were dissatisfied with the success of their business,
29.4% had a three-year diploma/degree, 23.5% a qualification of grade 10 to 12,
17.6% a certificate and another 17.6% an honours degree.
This shows that there was no difference between the level of education and
success.
6.8 CORRELATIONS AND CROSS-TABULATIONS (adjusted classification)
In this second part of correlations and cross-tabulations (as explained at the
beginning of sec. 6.7) the ratings that were provided are divided into the following
three categories of business success:
Table 6.34: How successful do you think your business is? Frequency Percent Valid Least successful (1-4) 59 29.5 Satisfied (5) 83 41.5 Very successful (6-7) 58 29.0 Total 200 100.0
To determine and measure the strength of the association of the variables, a
proportional reduction of error (PRE) measure known as ”lambda” or “Goodman-
Kruskal lambda”, was calculated.

254
6.8.1 The type of business the respondents own/manage (sec. 1, Q4) and the success of the businesses (sec. 1, Q2) (Table 6.35)
Table 6.35 represents the cross-tabulation of the success of the businesses and
the type of business the respondents own/manage. The null hypothesis (Ho1) is
that there is no relationship between the types of businesses owned/managed by
the respondents and the success of the businesses.
A lambda value of 0.055, with an approximate significance level of 0.247, was
calculated. When looking at the 5% level of significance, the probability is thus
0.247 and is larger than 5% (p>0.05). In other words, Ho1 is accepted at the 5%
level of significance.
Hence, owing to the acceptance of the null hypothesis (Ho1), this test indicates
that the type of business the respondents own/manage does not improve the
ability to predict the success of the business. Thus there is no relationship
between these two variables.
Using inferential statistics it is now clear that the type of business does not seem
to make any significant difference with regard to the success of the businesses,
using this survey of Cofesa members.

255
Table 6.35: Q4. What type of business do you manage or own? Q2. How successful is your business? Cross-tabulation Count
Q4. What type of business do you manage or own? To=tal
a A
gric
ultu
re
b M
inin
g an
d
quar
ryin
g
c M
anuf
actu
ring
d E
lect
ricity
, gas
a
nd w
ater
e C
onst
ruct
ion
f Ret
ail a
nd m
otor
tra
de re
pair
serv
ices
g W
hole
sale
trad
e,
com
mer
cial
age
nts,
etc
h C
ater
ing,
acc
omm
odat
ion
and
oth
er tr
ade
i Tra
nspo
rt, s
tora
ge a
nd
com
mun
icat
ion
j Fin
ance
and
bus
ines
s
serv
ices
k C
omm
unity
, soc
ial
l and
per
sona
l ser
vice
s
Q2. How successful is your business?
Least successful 6 1 15 0 2 15 6 2 2 3 7 59
Satisfied 5 0 17 2 7 19 4 7 3 3 17 84
Very successful 4 0 12 1 4 7 1 6 1 2 19 57
Total 15 1 44 3 13 41 11 15 6 8 43 200
Directional Measures
Value
Asymp. Std.
Error(a) Approx.
T(b) Approx.
Sig. Nominal by Nominal
Lambda Symmetric .055 .047 1.158 .247
Q2. How successful is your business? Dependent .052 .067 .751 .453
Q4. What type of business do you manage or own? Dependent
.058 .051 1.103 .270
Goodman and Kruskal tau
Q2. How successful is your business? Dependent .051 .019 .435(c)
Q4. What type of business do you manage or own? Dependent
.015 .008 .059(c)
a Not assuming the null hypothesis. b Using the asymptotic standard error assuming the null hypothesis. c Based on chi-square approximation
6.8.2 The time in the business cycle in which assistance was used (sec. 1, Q6) and the success of the businesses (sec. 1, Q2) (Table 6.36)
Table 6.36 represents the cross-tabulation of the success of the businesses and
the time in the business cycle in which assistance was used. The null hypothesis

256
(Ho2) states that there is no relationship between the periods in the business
cycle in which the assistance was provided and the success of the businesses.
A lambda of 0.01 with an approximate significance level of 0.617 was calculated.
When looking at the 5% level of significance, the probability is thus 0.617 and is
larger than 5% (p>0.05). In other words, Ho2 is accepted at the 5% level of
significance.
Hence, owing to the acceptance of the null hypothesis (Ho2), this test indicates
that the time in the business life cycle in which the respondents used assistance
did not improve the ability to predict the success of the business. Thus there is no
relationship between these two variables.
It would seem that the time in the business life cycle in which assistance is
provided does not make any significant difference with regard to the success of
the businesses.
Table 6.36: Q6. When did you make use of the assistance? Q2. How successful is your business? Cross-tabulation Count
Q6. When did you make use of the assistance? Total
Before starting your
business
During the first 6
months
During the first 2 years
After the first 2 years
Continu= ously
Q2. How successful is your business?
Least successful 1 9 3 8 38 59
Satisfied 9 7 6 13 49 84Very successful 6 8 3 10 30 57
Total 16 24 12 31 117 200

257
Directional Measures
Value
Asymp. Std.
Error(a) Approx.
T(b) Approx.
Sig. Nominal by Nominal
Lambda Symmetric .010 .020 .500 .617
Q2. How successful is your business? Dependent
.017 .034 .500 .617
Q6. When did you make use of the assistance? Dependent
.000 .000 .(c) .(c)
Goodman and Kruskal tau
Q2. How successful is your business? Dependent
.018 .010 .530(d)
Q6. When did you make use of the assistance? Dependent
.008 .007 .588(d)
a Not assuming the null hypothesis. b Using the asymptotic standard error assuming the null hypothesis. c Cannot be computed because the asymptotic standard error equals zero. d Based on chi-square approximation
6.8.3 The way in which the respondents were assisted (sec. 1, Q7) and the success of the businesses (sec. 1, Q2) (Table 6.37)
Note: This cross-tabulation was done by making use of only 135 of the 200
respondents. These 135 chose only one method of assistance. The other 65
were not included because they mentioned more than one method of assistance.
Some attempts were made to group together the different combinations, but there
were so many that it did not produce any meaningful results. The test was done
anyway because the 135 were still relatively evenly spread over the three
classifications of the variable regarding the success of the business with all the
frequencies >30.
Table 6.37 represents the cross-tabulation of the success of the businesses and
the way in which the respondents were assisted. The null hypothesis (Ho3) is that
there is no relationship between the way in which the respondents were assisted
and the success of the businesses.

258
A lambda of 0.012 with an approximate significance level of 0.731 was
calculated. When looking at the 5% level of significance, the probability is thus
0.731 and is larger than 5% (p>0.05). In other words, Ho3 is accepted at the 5%
level of significance.
Hence, owing to the acceptance of the null hypothesis (Ho3), this test indicates
that the method of assistance does not improve the ability to predict the success
of the business. Thus there is no relationship between these two variables.
It would seem that the way in which the respondents were assisted did not make
a significant difference with regard to the success of the businesses.
Table 6.37: Q7. How were you assisted? Q2. How successful is your business? Cross-tabulation Count
Q7. How were you assisted? Total
Given advice
Trained on the job
Outsourced functions
Consul= tants
Formal training
Q2 How successful is your business?
Least successful 15 5 8 13 5 46
Satisfied 17 7 17 11 5 57
Very successful 14 7 1 6 4 32
Total 46 19 26 30 14 135
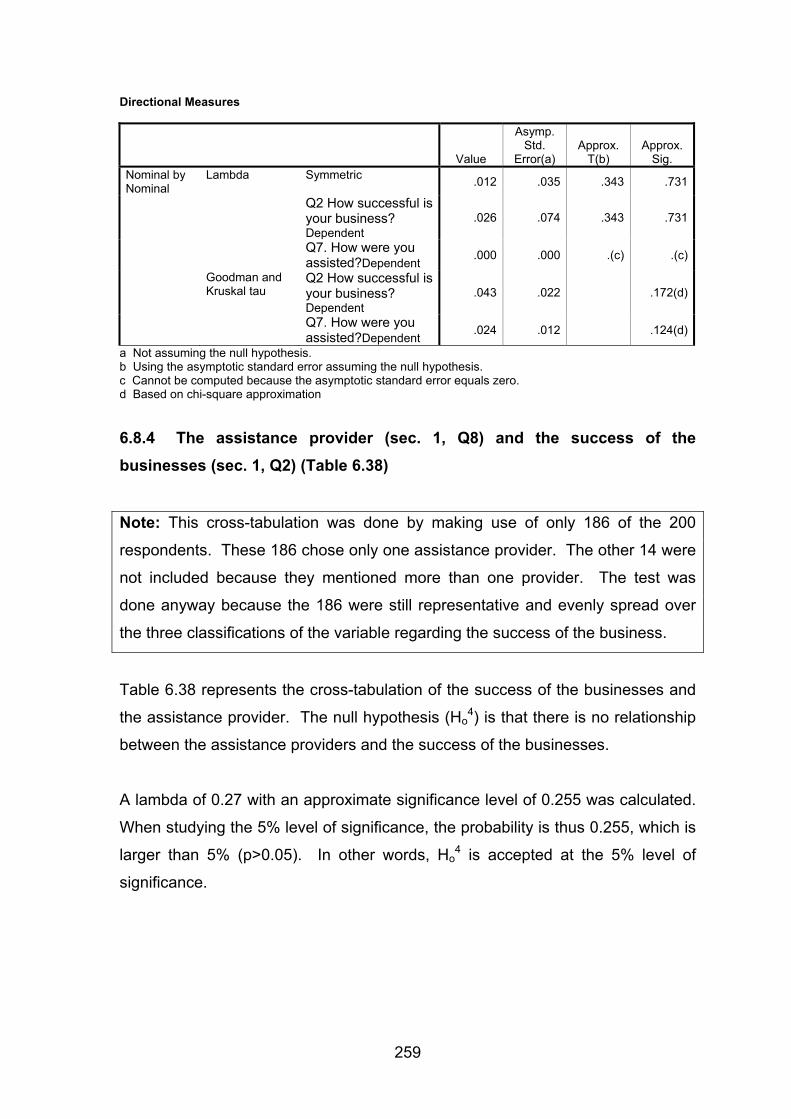
259
Directional Measures
Value
Asymp. Std.
Error(a) Approx.
T(b) Approx.
Sig. Nominal by Nominal
Lambda Symmetric .012 .035 .343 .731
Q2 How successful is your business? Dependent
.026 .074 .343 .731
Q7. How were you assisted?Dependent
.000 .000 .(c) .(c)
Goodman and Kruskal tau
Q2 How successful is your business? Dependent
.043 .022 .172(d)
Q7. How were you assisted?Dependent
.024 .012 .124(d)
a Not assuming the null hypothesis. b Using the asymptotic standard error assuming the null hypothesis. c Cannot be computed because the asymptotic standard error equals zero. d Based on chi-square approximation
6.8.4 The assistance provider (sec. 1, Q8) and the success of the businesses (sec. 1, Q2) (Table 6.38)
Note: This cross-tabulation was done by making use of only 186 of the 200
respondents. These 186 chose only one assistance provider. The other 14 were
not included because they mentioned more than one provider. The test was
done anyway because the 186 were still representative and evenly spread over
the three classifications of the variable regarding the success of the business.
Table 6.38 represents the cross-tabulation of the success of the businesses and
the assistance provider. The null hypothesis (Ho4) is that there is no relationship
between the assistance providers and the success of the businesses.
A lambda of 0.27 with an approximate significance level of 0.255 was calculated.
When studying the 5% level of significance, the probability is thus 0.255, which is
larger than 5% (p>0.05). In other words, Ho4 is accepted at the 5% level of
significance.

260
Hence, owing to the acceptance of the null hypothesis (Ho4), this test indicates
that the assistance provider does not improve the ability to predict the success of
the business. Thus there is no relationship between these two variables.
It would seem that the assistance provider did not seem to make any significant
difference with regard to the success of the businesses.
Table 6.38: Q2. How successful is your business? Q8. Who presented you with the assistance? Cross-tabulation Count
Q8. Who provided the assistance? Total
Another business
Consultant/ specialist Trainer
Educational institution Other
Q2. How successful is your business?
Least successful 16 21 0 2 17 56
Satisfied 24 32 5 6 11 78Very successful 11 20 3 4 14 52
Total 51 73 8 12 42 186 Directional Measures
Value
Asymp. Std.
Error(a) Approx.
T(b) Approx.
Sig. Nominal by Nominal
Lambda Symmetric .027 .024 1.138 .255
Q2. How successful is your business? Dependent
.056 .048 1.138 .255
Q8a. Another business Dependent .000 .000 .(c) .(c)
Goodman and Kruskal tau
Q2. How successful is your business? Dependent
.028 .014 .229(d)
Q8a. Another business Dependent .012 .008 .370(d)
a Not assuming the null hypothesis. b Using the asymptotic standard error assuming the null hypothesis. c Cannot be computed because the asymptotic standard error equals zero. d Based on chi-square approximation

261
6.8.5 The duration of assistance (how long the assistance lasted) (sec. 1, Q9) and the success of the businesses (Sec. 1, Q2) (Table 6.39)
Table 6.39 represents the cross-tabulation of the success of the businesses and
the duration of assistance. The null hypothesis (Ho5) is that there is no
relationship between the duration of assistance and the success of the
businesses.
A lambda of 0.032 with an approximate significance level of 0.155 was
calculated. When analysing the 5% level of significance, the probability is thus
0.155 and is larger than 5% (p>0.05). In other words, Ho5 is accepted at the 5%
level of significance.
Hence, owing to the acceptance of the null hypothesis (Ho5), this test indicates
that the duration of assistance does not improve the ability to predict the success
of the business. Thus there is no relationship between these two variables.
It would seem that the duration of assistance does not seem to make any
significant difference to the success of the businesses.
Table 6.39: Q9. For how long were you assisted? Q2. How successful is your business? Cross-tabulation Count
Q9. For how long were you assisted? Total
1 day
1 day per
week
1 day per
month 1 week1
month Continuously Other
Q2. How successful is your business?
Least successful 6 0 6 4 1 39 3 59
Satisfied 3 1 3 9 5 52 11 84
Very successful 5 1 3 2 3 37 6 57
Total 14 2 12 15 9 128 20 200

262
Directional Measures
Value
Asymp. Std.
Error(a) Approx.
T(b) Approx.
Sig. Nominal by Nominal
Lambda Symmetric .032 .022 1.421 .155
Q2. How successful is your business? Dependent
.052 .036 1.421 .155
Q9. For how long were you assisted? Dependent .000 .000 .(c) .(c)
Goodman and Kruskal tau
Q2. How successful is your business? Dependent
.032 .016 .388(d)
Q9. For how long were you assisted? Dependent .008 .005 .675(d)
a Not assuming the null hypothesis. b Using the asymptotic standard error assuming the null hypothesis. c Cannot be computed because the asymptotic standard error equals zero. d Based on chi-square approximation
6.8.6 The number of employees in the business (the size of the business) (sec. 1, Q3) and the success of the businesses (Sec. 1, Q2) (Table 6.40)
Table 6.40 represents the cross-tabulation of the success of the businesses and
the number of employees permanently employed in the business. The null
hypothesis (Ho6) is that there is no relationship between the size and the success
of the businesses.
The calculations show that 29.5% of the respondents had less successful
businesses, 41.5% had successful businesses and 29% had very successful
businesses.
A lambda of 0.078 with an approximate significance level of 0.131 was
calculated. When examining the 5% level of significance, the probability is thus
0.131, which is larger than 5% (p>0.05). In other words, Ho6 is accepted at the
5% level of significance.
Hence, owing to the acceptance of the null hypothesis (Ho6), this test indicates
that there is no relationship between the size and success of the businesses.

263
The conclusion is that the size of the business does not make any significant
difference to the success of a business.
Table 6.40: Q3. How many employees are permanently employed in the business? Q2. How successful is your business? Cross-tabulation Count
Q3. How many employees are permanently
employed in the business? Total
Fewer than 10 11 to 49 50 to 100
More than 100
Q2. How successful is your business?
Least successful 30 25 3 1 59Satisfied 40 33 5 6 84Very successful 15 28 11 3 57
Total 85 86 19 10 200 Directional Measures
Value
Asymp. Std.
Error(a) Approx.
T(b) Approx.
Sig. Nominal by Nominal
Lambda Symmetric .078 .050 1.509 .131
Q2. How successful is your business? Dependent
.052 .034 1.509 .131
Q3. How many employees are permanently employed in the business? Dependent
.105 .094 1.064 .287
Goodman and Kruskal tau
Q2. How successful is your business? Dependent
.038 .018 .020(c)
Q3. How many employees are permanently employed in the business? Dependent
.027 .015 .014(c)
a Not assuming the null hypothesis. b Using the asymptotic standard error assuming the null hypothesis. c Based on chi-square approximation

264
6.8.7 The most important area in which assistance was received (sec. 1, Q5) and the success of the businesses (sec. 1, Q2) (Table 6.41)
Table 6.41 represents the cross-tabulation of the success of the businesses and
the most important area in which assistance was received. The null hypothesis
(Ho7) is that there is no relationship between the most important areas in which
assistance was received and the success of the businesses.
A lambda of 0.085 with an approximate significance level of 0.005 was
calculated. When examining the 5% level of significance, the probability is thus
0.005 and is smaller than 5% (p<0.05), meaning that (Ho7) is rejected at the 5%
level of significance.
The null hypothesis (Ho7) is rejected in favour of the alternative hypothesis (Ha
7),
indicating that there is a relationship between the most important areas in which
assistance was received and the success of the businesses.
The area in which assistance was received does seem to make a significant
difference to the success of the businesses.
Although so many respondents received assistance with finance, 27.5% still
chose finance as the most important area of assistance in the “least successful”
category. The other three areas that showed large percentage differences were
systems (66.6%), administration (60%) and production/operations (56.2%) – in
other words the percentages of businesses that regarded these areas as the
most important areas of assistance and are categorised as “least successful”
businesses.
The above-mentioned areas probably contributed to the businesses being less
successful and/or are the areas in which the respondents felt they needed
assistance when their businesses were not doing well. The areas of firstly
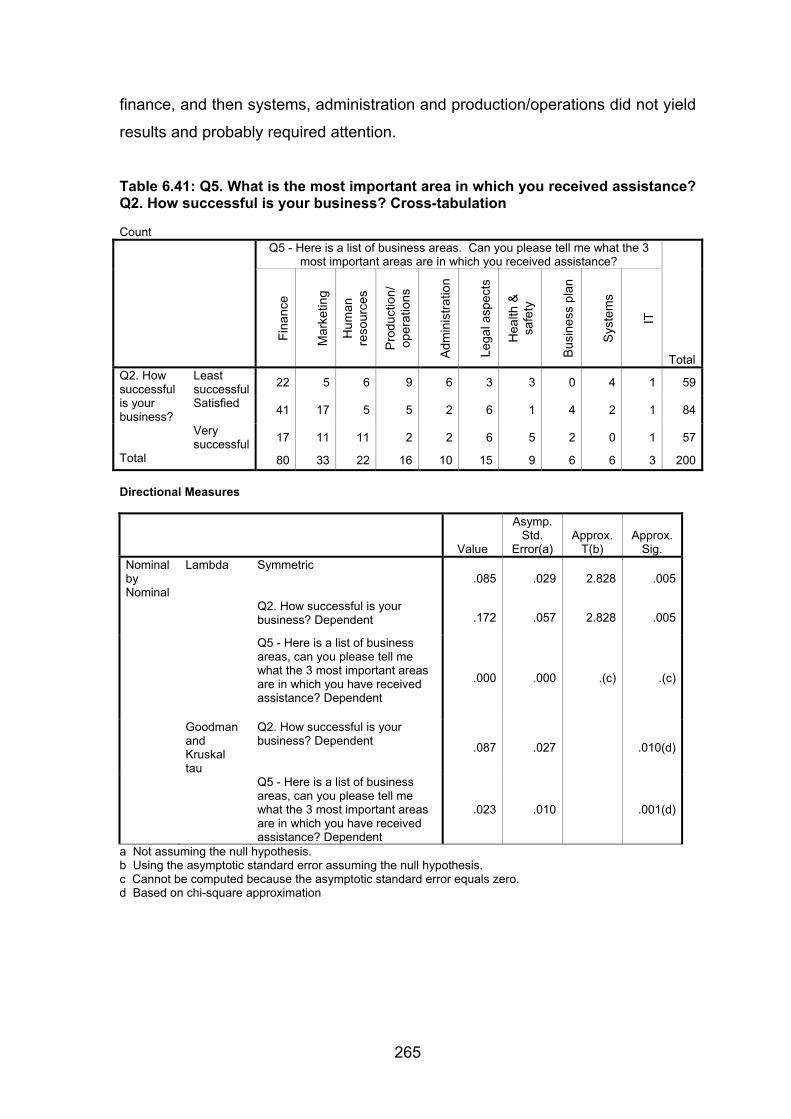
265
finance, and then systems, administration and production/operations did not yield
results and probably required attention.
Table 6.41: Q5. What is the most important area in which you received assistance? Q2. How successful is your business? Cross-tabulation Count
Q5 - Here is a list of business areas. Can you please tell me what the 3 most important areas are in which you received assistance?
Total
Fina
nce
Mar
ketin
g
Hum
an
reso
urce
s
Pro
duct
ion/
op
erat
ions
Adm
inis
tratio
n
Lega
l asp
ects
Hea
lth &
sa
fety
Bus
ines
s pl
an
Sys
tem
s
IT
Q2. How successful is your business?
Least successful 22 5 6 9 6 3 3 0 4 1 59
Satisfied 41 17 5 5 2 6 1 4 2 1 84
Very successful 17 11 11 2 2 6 5 2 0 1 57
Total 80 33 22 16 10 15 9 6 6 3 200 Directional Measures
Value
Asymp. Std.
Error(a) Approx.
T(b) Approx.
Sig. Nominal by Nominal
Lambda Symmetric .085 .029 2.828 .005
Q2. How successful is your business? Dependent .172 .057 2.828 .005
Q5 - Here is a list of business areas, can you please tell me what the 3 most important areas are in which you have received assistance? Dependent
.000 .000 .(c) .(c)
Goodman and Kruskal tau
Q2. How successful is your business? Dependent .087 .027 .010(d)
Q5 - Here is a list of business areas, can you please tell me what the 3 most important areas are in which you have received assistance? Dependent
.023 .010 .001(d)
a Not assuming the null hypothesis. b Using the asymptotic standard error assuming the null hypothesis. c Cannot be computed because the asymptotic standard error equals zero. d Based on chi-square approximation
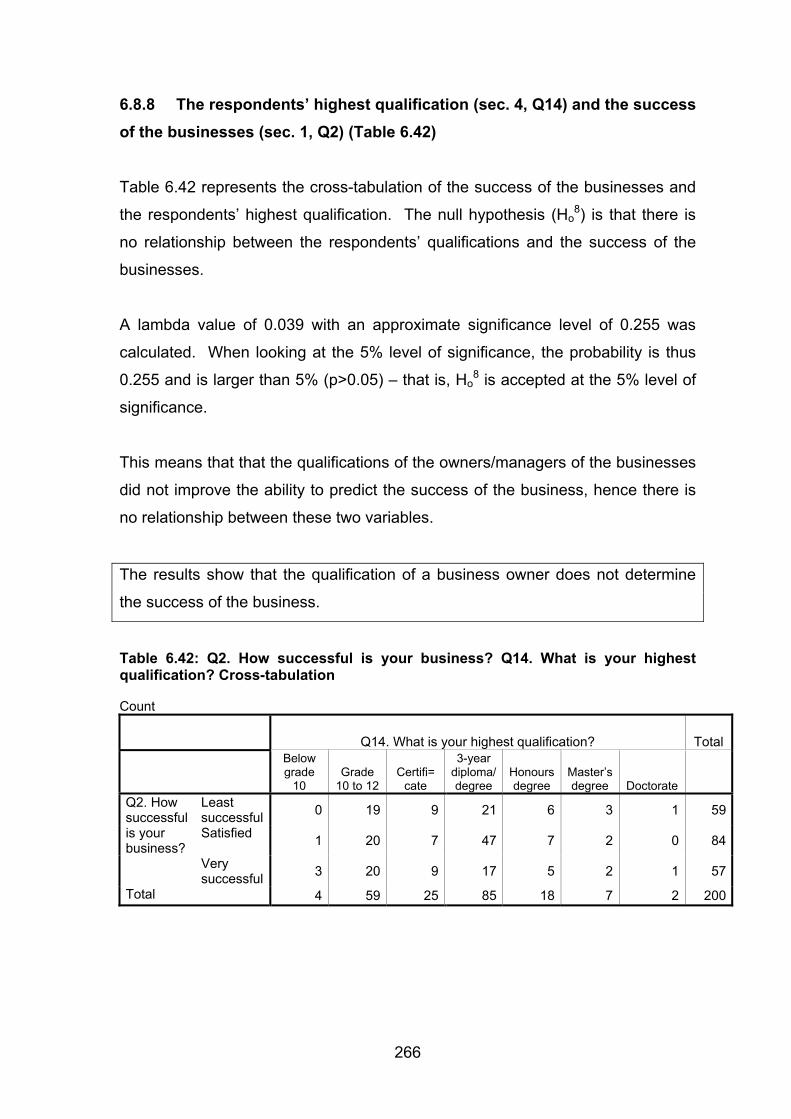
266
6.8.8 The respondents’ highest qualification (sec. 4, Q14) and the success of the businesses (sec. 1, Q2) (Table 6.42)
Table 6.42 represents the cross-tabulation of the success of the businesses and
the respondents’ highest qualification. The null hypothesis (Ho8) is that there is
no relationship between the respondents’ qualifications and the success of the
businesses.
A lambda value of 0.039 with an approximate significance level of 0.255 was
calculated. When looking at the 5% level of significance, the probability is thus
0.255 and is larger than 5% (p>0.05) – that is, Ho8 is accepted at the 5% level of
significance.
This means that that the qualifications of the owners/managers of the businesses
did not improve the ability to predict the success of the business, hence there is
no relationship between these two variables.
The results show that the qualification of a business owner does not determine
the success of the business.
Table 6.42: Q2. How successful is your business? Q14. What is your highest qualification? Cross-tabulation Count
Q14. What is your highest qualification? Total
Below grade
10 Grade
10 to 12 Certifi=
cate
3-year diploma/degree
Honours degree
Master’s degree Doctorate
Q2. How successful is your business?
Least successful 0 19 9 21 6 3 1 59
Satisfied 1 20 7 47 7 2 0 84
Very successful 3 20 9 17 5 2 1 57
Total 4 59 25 85 18 7 2 200

267
Directional Measures
Value
Asymp. Std.
Error(a) Approx.
T(b) Approx.
Sig. Nominal by Nominal
Lambda Symmetric .039 .034 1.138 .255
Q2. How successful is your business? Dependent .052 .043 1.181 .238
Q14. What is your highest qualification? Dependent .026 .052 .493 .622
Goodman and Kruskal tau
Q2. How successful is your business? Dependent .044 .020 .128(c)
Q14. What is your highest qualification? Dependent .025 .015 .002(c)
a Not assuming the null hypothesis. b Using the asymptotic standard error assuming the null hypothesis. c Based on chi-square approximation

268
Summary of the results of the hypotheses tests:
Ho accepted:
• There is no relationship between the types of businesses owned/managed by
the respondents and the success of the businesses (Ho1).
• There is no relationship between the periods in the business cycle in which
the assistance was provided and the success of the businesses (Ho2).
• There is no relationship between the way the respondents were assisted and
the success of the businesses (Ho3).
• There is no relationship between those who provided the assistance and the
success of the businesses (Ho4).
• There is no relationship between the period of time of assistance and the
success of the businesses (Ho5).
• There is no relationship between the size and the success of the businesses
(Ho6).
• There is no relationship between the qualifications of the respondents and
the success of the businesses (Ho8).
Ha accepted
• There is a relationship between the most important areas in which assistance
was received and the success of the businesses (Ho7).
6.9 THE UNSUCCESSFUL BUSINESSES
Although there were only 17 (8.5%) unsuccessful businesses (those respondents
who chose 1, 2 or 3 on a scale of 1-7 of how successful their businesses were) in
the sample, the researcher thought it relevant to look at some statistics regarding
these. Cross-tabulation tables were used to indicate relationships between the
unsuccessful businesses and the different variables as indicated.

269
6.9.1 Unsuccessful businesses (sec. 1, Q2) and the types of businesses in the different sectors (sec. 1, Q4)
Table 6.43 shows the unsuccessful businesses and the types of businesses
owned/managed by the respondents.
Table 6.43: Q2. Unsuccessful businesses Q4. What type of business do you manage or own? Cross-tabulation
Q4. What type of business do you manage or own?
Agriculture Mining and quarrying Manufacturing
Retail and motor trade
repair services
Finance and business services
Community, social and personal services Total
Unsuccessful businesses 2 1 4 8 1 1 17
Total in sectors 15 1 44 41 8 43 200
Percentage in sector 13.33 100.00 9.09 19.51 12.50 2.33 8.50
Observations
Table 6.43 indicates that 8 of the 17 unsuccessful businesses in the sample were
in the retail and motor trade repair services sector. There were also four
unsuccessful businesses from the manufacturing sector and two from the
agricultural sector.
There were no unsuccessful businesses in the following sectors of this sample:
electricity, gas and water, construction, wholesale trade, commercial agents and
allied services, catering, accommodation and other trade, transport, storage and
communication, and community, social and personal services.
6.9.2 Unsuccessful businesses (sec. 1, Q2) and the shortcomings identified with the process of assistance (sec. 2, Q10)
Table 6.44 shows the unsuccessful businesses and the shortcomings the
respondents identified in the process of assistance.

270
Table 6.44: Q2. Unsuccessful businesses Q10. What shortcomings can you identify with this process? Cross-tabulation
What shortcomings can you identify in this process? Total
The assistance
is not enough
Happy - got what I needed
Inefficient CCMA
Not always 100%
accurate None
I need a more
business approach
Budgeting and
control Unsuccessful businesses 1 6 1 1 6 1 1 17
Observations
Although these businesses were unsuccessful, the respondents were generally
happy with the assistance they had received and very few of them identified any
shortcomings. The single shortcomings identified are hardly worth mentioning.
It would seem that the assistance (regarding whatever aspect) was not the cause
of their failure. (The causes of their failures are discussed in sec. 6.9.5.)
6.9.3 Unsuccessful businesses (sec. 1, Q2) and the time in the business cycle during which assistance should be sought (sec. 3, Q13)
Table 6.45 shows the unsuccessful businesses and their owners' indication of the
best time in the business life cycle in which to seek assistance.
Table 6.45: Q2. Unsuccessful businesses Q13. According to you, when should a person seek assistance similar to what you have mentioned? Cross-tabulation
Q13. According to you, when should a person seek assistance similar to
what you have mentioned? Total
Before starting your
business During the first six
months During all phases of
the business Unsuccessful businesses 6 1 10 17

271
Observations
It is clear that unsuccessful business owners would seek assistance before
starting their businesses as well as during all phases of the business life cycle.
This is in line with the responses of the successful business owners.
6.9.4 Unsuccessful businesses (sec. 1, Q2) and the respondents' highest qualification (sec. 4, Q14)
Table 6.46 shows the unsuccessful businesses and the highest qualifications of
the owners.
Table 6.46: Q2. Unsuccessful businesses Q14. What is your highest qualification? Cross-tabulation
Q14. What is your highest qualification? Total
Grade 10
to 12 Certificate
3-year diploma/ degree
Honours degree
Master’s degree
Docto= rate
Unsuccessful businesses 4 3 5 3 1 1 17
Total 59 25 85 18 7 2 200Percent 6.78 12.00 5.88 16.67 14.29 50.00 8.50
Observations
Whatever the qualification, there was a proportionally equal number of
unsuccessful businesses in each case.
The qualifications of the owners did not seem to make a difference in the success
of a business.
6.9.5 The reasons for failure
The respondents hardly had any problems with the assistance they had received.
Hence the researcher decided to try and find out the reasons for their failure.

272
Two months after the initial interview, all the unsuccessful business
owners/managers were called again and asked the following questions (with the
responses) regarding their businesses:
• Why are you not as successful as you would like to be?
Various problems were mentioned that prevented these businesses from being
as successful as they probably could have been.
The main problem or the problem that most of them mentioned related to the
employees. The respondents complained about local labour being too expensive
and about the low productivity of the workers.
The second most mentioned problem was cheap imports from China.
Businesses can import certain goods from China at a lower cost than they can be
manufactured in South Africa. This obviously refers indirectly to the high cost of
local labour. This problem is also further influenced by the value of the rand. If
the rand is strong, imports become even less expensive, while local
manufacturing costs remain the same.
The remainder of the problems that the respondents mentioned were as follows:
- There is not much work around.
- The image of the business is old and the shareholders do not want to
invest more.
- The business is near a taxi rank and clients are scared to go there (this
problem obviously relates to location).
- Crime cannot be ignored.
- The CCMA renders poor service (also a labour/regulatory problem).
- Telkom’s service is poor – there are no lines for long periods of time.

273
- The roads are bad.
- There is price regulation in the medical profession.
• What can you do to rectify the problem?
The respondents did not know what to do to solve the labour problems of high
cost and productivity. Many blamed the government for not doing enough for
SMEs and suggested that government should address issues that hinder
business and ensure less “red tape”. Some suggested a surcharge on imports.
The respondents in the medical profession suggested putting an end to price
regulation. The respondent with the location problem realised that he would have
to relocate his business, while another respondent actually changed his product.
One business was actually sold.
• Would assistance of any kind make a difference?
The respondents all agreed that assistance from Cofesa, specialists or
consultants would not make a difference in their cases. They needed assistance
from government in the specific issues of labour, imports and price regulation.
Only one respondent thought that a management programme could probably
help him to manage his business more profitably.
Research conducted in Canada has indicated that inexperienced management is
the main reason for failure. The managers of unsuccessful firms usually lack
experience, knowledge or vision to run their businesses. In the initial stages of
the business life cycle, failures are caused by basic internal skills such as general
and financial knowledge, control, communications, supervision of staff and
market development. As the business grows, additional new problems arise
associated with the increased complexity of running a growing firm. The issues
prevalent in this stage are poor use of outside advisors, a lack of emphasis on

274
quality, an unwillingness to delegate responsibility, the departure of key
personnel and personal problems with the owner/manager (Cruise, 2001:12-14).
The respondents from Cofesa generally blamed the government for their failures
and expect government to do something about it. The problems they referred to
were mainly about human resources (labour issues) and finance (imports and
price regulation). This correlates with the areas in which assistance is sought by
most of the respondents in this study (see sec. 6.4.1). When studying the
Canadian research into failures, it is obvious that inexperienced management is
the main reason for failure. Is this not the Cofesa respondents’ problem as well?
Surely the South African government could assist with some of the problems
mentioned? However, when looking at the Canadian research, it is possible that
the Cofesa respondents do not acknowledge their own shortcomings in managing
their businesses and probably need assistance in this matter instead of blaming
only government.
In a small business survey conducted in Northeast Iowa (USA) on small business
consulting needs, Pelham (1985:11) found that half of small business owners
cited internal problems (such as cash flow sales and marketing) as the primary
cause of small business failure, while only one-third blamed external factors
(such as interest rates, inflation and taxes).
6.10 CONCLUSION
In this chapter, Microsoft Excel and SPSS 14.0 for Windows were used to
conduct the statistical analysis of the questionnaire. The results were presented
according to the questions posed in the questionnaire, indicating the frequencies
of the results. Thereafter cross-tabulations were done between some of the
variables. The responses on the success of the respondents’ businesses were
then recategorised to enable the researcher to determine and measure the

275
strength of the association of the variables by making use of lambda (also known
as the Goodman-Kruskal lambda). Finally, a further investigation into the
unsuccessful businesses was made in order to determine the reasons for their
limited success.
Interesting and useful information emerged from this study. The evaluation of the
study objectives, concluding remarks and recommendations will be discussed in
the next chapter.

276
CHAPTER 7 CONCLUSIONS AND RECOMMENDATIONS
7.1 INTRODUCTION
Policy makers worldwide are turning to small business to drive economic growth
and development. Small business, inter alia, is reported as the primary creator of
jobs and economic stability. In South Africa, the government has committed itself
to the promotion and growth of the small, medium and micro enterprises (SMME)
sector to stimulate economic growth as a means of reducing unemployment. The
aims of government are to increase the number of new ventures and to create an
enabling environment to ensure the survival and growth of small and medium
enterprises (SMEs).
Many support entities were created specifically to promote the SMME sector.
Corporate South Africa and parastatals have embraced procurement policies that
support black economic empowerment (BEE) and foster the development of a
vibrant SMME sector. Apart from government interventions, SME owners also
make use of consultants and advisors such as attorneys, accountants, banks and
business consultants to assist them in various areas of their business.
With all this “assistance” in place, to date these efforts have not proved to be very
successful because there are still too many failures. The question that motivated
the researcher to do this study is: “Is the assistance rendered to SME owners
accurate, efficient, relevant and applicable to enable them to manage their
businesses effectively to make them successful in the long run?” If not, what
type of intervention could have a positive effect on their success?
If the above question can be answered, not only consultants, but also the
government and SME owners, in particular could save a lot of money and spend

277
the available effort, time and money on those types of interventions that would
probably increase the success rate of their businesses and help them grow
profitably.
The research results were discussed in chapter 6. In this final chapter the
researcher evaluates the research objectives, draws conclusions and makes
recommendations. The chapter concludes with proposals for further research.
7.2 EVALUATING RESEARCH OBJECTIVES
In this section the primary and secondary objectives of the study are evaluated
against the outcomes of the research findings. The objectives will be stated and
the outcome of the research results discussed, indicating whether or not the
objective was realised. The primary objective will be evaluated first, whereafter
the researcher will evaluate the secondary objectives as stated in chapter 1.
Interventions include all different types of assistance such as consulting, training,
support and advising the SME owner about any facet of the business and its
environment, be it before starting the business or during its existence, with the
aim of making the business successful or more successful. SME owners in
South Africa are assisted by different government bodies, training institutions,
consultants, advisors and general business consultants. There are also
shortcomings in the process and because of this, all assistance does not
necessarily have a positive impact on the success of a business.
The study first provided valuable information on the profiles of the Cofesa
respondents, including the location of their businesses, the types of businesses
they own and/or manage, their highest qualifications and their occupations before
becoming involved in the business.

278
Secondly, it provided the researcher with the general business information of the
respondents including their perceptions of the success of their businesses, the
number of employees permanently employed in the businesses, the areas and
detail of assistance they received, the areas in which they received assistance,
their perception about the most important areas of receiving assistance, the time
in the business cycle in which the assistance was provided, the ways in which the
respondents were assisted, the formal training and/or courses attended by
respondents, the person/institution who rendered the assistance and the duration
of assistance.
The researcher also managed to determine the shortcomings that the
respondents identified regarding the assistance received. Finally, the most
important factors contributing to the success of their businesses, the
consequences of the assistance received as well as the respondents’
recommendations about when assistance should be sought were presented.
PRIMARY OBJECTIVE
The primary objective of this study was to analyse business interventions and to determine their effect on the perceived success of South African
SMEs.
As indicated in the literature study, many SMEs are unsuccessful and there are
probably many reasons for their failures. On the other hand, there are so many
interventions taking place and there are so many providers of assistance. The
question that arose is how these interventions take place and whether they play
any role in the success of small businesses.

279
The interventions, according to this study, were mostly done in the functional
areas of finance, marketing and human resources. The interventions were
mostly done on a continuous basis throughout the business life cycle. Although
only 8% of the respondents actually made use of assistance before starting their
businesses, more than one third of them suggested that new business owners
should make use of assistance before they start their businesses. The
interventions were mainly done and assistance was mainly provided by
consultants, specialists and other businesses. The respondents thought that the
process of assistance was very good and hardly had any negative comments
regarding it.
All the respondents had received assistance and most of them had successful
businesses. One may therefore assume that they were successful because of
the assistance they received. However, when the respondents were asked about
the most important factors that had contributed to the success of their business,
they mentioned the type and quality of the product, marketing and the location of
the business. Except for “marketing”, the factors that contributed to their success
did not correlate at all with the areas in which assistance was received.
Although the respondents regarded finance as one of the most important areas in
which assistance is needed, they did not see it as a contributing factor to their
success. Finance per se probably does not determine the success of a business
in the same way as the right product at the right quality and the right marketing
strategies.
Finance is a key supporting factor, and the finances of the business should be in
place and should be properly managed. Many SME owners also required
assistance with finance, but if the business does not work in terms of the success
factors mentioned, the best financial practices will not save the business.

280
Assistance is a contributory factor to success but not the reason for it. The
success of an SME mainly depends on other factors such as the type of product,
product quality and marketing. Assistance, however, is important and should first
be provided in those areas that determine the success of a business, and
thereafter and continuously in the areas identified by the respondents in this
study (mainly finance, marketing and human resources).
In this study there was no control group of, firstly, unsuccessful businesses and
secondly, business owners who had not received any assistance, to measure
against. (Unsuccessful businesses that are still in business hardly exist.) The
period of the study also coincided with high economic growth which suggests
higher success levels anyway. This could imply that the respondents could have
been successful without having received assistance in any case. However, the
fact that they sought assistance indicated that there was a need for assistance.
The following secondary objectives are evaluated:
SECONDARY OBJECTIVE To determine in which functional areas the SME owners have received
assistance.
The survey findings revealed that 90.5% of the respondents were actually
assisted or are being assisted in the financial area of the business. The other
areas in which much assistance was received were those of marketing (44%) and
human resources (33%). It is also the area in which the respondents identified
the most shortcomings, indicating that the financial service rendered was
inadequate.
It is clear that most of the respondents needed some sort of assistance in the
area of finance. The study also revealed that finance was by far the area that the
respondents felt was the primary area in which assistance was required, once

281
again placing marketing and human resources second and third. The
respondents also indicated that they were extremely satisfied with the assistance
they had received. This indicates that financial assistance in different forms
seems to be available in South Africa and that it is meeting the needs of SMEs.
Numerous government entities assist SMEs in the different areas of finance.
Most of the professional assistance rendered by banks, attorneys and
accountants also focuses on the supply of finance and accounting.
These findings correspond with other studies done regarding the areas of
assistance, such as the following:
• Penning (2004:46), stated that according to a survey in 2002, the most
frequent skill deficiency in the SME sector in New Zealand was marketing,
while another study done in New Zealand by Lewis, et al. (2007:555-557)
indicated that accountants were the source that respondents contacted and
made use of the most.
• In a study done by Berry, Sweeting and Goto (2006:36-38) in the UK,
external accountants were the most common sources of business support.
Most of the respondents in this study (70%) made use of accountants for
statutory advice and less than half of this percentage (33%) saw the role of
accountants as one of business management advisors.
As is the case with this study and also in other studies it is found that SME
owners and managers mostly need assistance with finance (mostly referring to
accounting) and marketing.

282
SECONDARY OBJECTIVE To determine the amount of time the consultants (including all those assisting the
SME owner) spend with the business
From the study it is evident that most of the respondents (64%) made use of
assistance “continuously”. This could imply, for example, that they make use of
assistance for one day a month or for one week a month. Whatever the case,
they do so on a continuous basis.
“Continuous assistance” is absolutely in line with other studies done such as the
following:
• According to Hetherington (1985:30-31) the success rate seems to have
been caused by the “continuous”, practical and on-the-spot counselling by
the Small Enterprises Development Company established in Swaziland (sec.
3.4.6).
• In all of the “success” cases described in sec. 3.5.4, the consultant was
involved with the owner on a continuous basis and “became part of the
business” for some time.
• Van der Merwe (2004) reports that women on the Women Entrepreneurship
Programme (WEP) at the University of Pretoria have a greater need for “on-
going support” once they have started their businesses because they lack
management experience and access to networks (sec. 4.3.4).
• The Business Mentors New Zealand, a mentoring program, indicated that
their mentoring sessions last from 1.5 to 2 hours and that many of the
mentoring relationships can be active for a number of years (Anon, 2006b:
60).

283
SECONDARY OBJECTIVE To determine during which stage of the business life cycle the assistance is
rendered.
The survey findings revealed that most of the respondents (58.5%) made use of
assistance on a continuous basis throughout the business life cycle. The
remainder made use of assistance before starting their businesses, during the
first six months and during and after the first two years.
However, it was interesting to note how these statistics of the actual duration of
assistance differed from that revealed by the respondents when they were asked
when they thought the best time would be to make use of assistance. Although
most of them still suggested that they would make use of assistance during all
the phases of the business life cycle, one-third of the respondents indicated that
they would have made use of assistance before they started their business.
The researcher can only assume the following reasons for this change of mind
among the respondents:
• Respondents who did not make use of assistance earlier in the business cycle
were forced to seek assistance after some time.
• If business owners seek assistance before starting a business it would not be
necessary to seek so much assistance at a later stage.
• Once the respondents have experienced the benefit of assistance, they can
advise other new business owners to make use of assistance at an earlier
stage, that is, especially before starting a business.
Most successful businesses make use of assistance on a continuous basis
during all the stages of the business life cycle.

284
The fact that SME owners should make use of assistance before or at the start of
the business life cycle corresponds with other research in this field, as highlighted
below:
• In the USA and Canada, the Small Business Development Centre was noted
as being best suited to providing consultancy services when the business was
young or first starting out (Jones et al., 1990:3).
• In a study with entrepreneurs from Dhaka, Bangladesh, the analysis involved
a comparison of the creation of new venture by entrepreneurs, who received
outside assistance, and those who did not receive any assistance. The
researcher found an overall positive influence of outsider assistance on these
entrepreneurs in the creation of new ventures, that is, early in their venture
creation (Sarder, 2002:1).
• In Australia where the failure rate is also unacceptably high, many SME
owners indicate that government should do more to ensure that people
receive at least basic training in business management before they start a
business (Campbell, 2003:8691-8692).
• In another study done in New Zealand by Lewis, et al. (2007:564) the
respondents mostly received assistance at the start of the business cycle and
then again at a more mature stage of the business.
SECONDARY OBJECTIVE To determine a profile of the provider of the assistance.
The respondents mainly approached consultants/specialists for assistance.
Surprisingly, many of the respondents also made use of other businesses to
assist them. The respondents did not make much use of educational institutions
and trainers to assist them.

285
The assistance referred to in the previous section, was provided in different ways.
In some cases only advice and no specific type of assistance such as training
and consulting was given to the respondents. For example, of the 43% who
indicated that they made use of consultants, 25% of those only made use of
advice given by the consultants.
Although not many of the respondents indicated that they made use of
educational institutions and trainers to assist them, 23.5% were trained on the job
and 17% attended formal training courses.
SECONDARY OBJECTIVE To identify any shortcomings in the process of assistance.
Seventy-two percent of the respondents thought that their businesses were more
successful after having received assistance. The results also show that 91.5% of
the respondents had successful businesses. This could indicate that the
assistance helped them to be successful, but if one looks at the responses
gathered by asking the respondents what factors contributed to their success,
only 2% of them indicated that it was the assistance they received. One-third of
those who indicated that they were satisfied with the assistance they had
received indicated that their businesses were not more successful because of the
assistance. Although the assistance probably played some part in their success,
their success was mostly the results of other factors.
Even the owners of the unsuccessful businesses were generally satisfied with the
assistance they had received and very few of them identified any negative issues
regarding the assistance they had received.

286
Seventy percent of the respondents indicated that they were either satisfied with
the assistance they had received and got what they needed or identified no
shortcomings in the assistance they had received.
However, the following shortcomings (grouped by the researcher under the
related headings) were identified by the respondents:
Shortcomings relating
to the type of
assistance
• The assistance is not enough
• The assistance is not always 100% accurate
• It is not relevant to me
• I need a more business approach
• It is not specific, it is more general
• Difficult to apply the information in a practical manner
• Misunderstanding of the nature of the business
Shortcomings relating
to the period of
assistance
• It takes too long
• It is too late to rectify something
• Marketing changes so rapidly, so have to keep
training
Shortcomings relating
to the person providing
the assistance
• Difficult to reach the right person
• It is too narrow minded to always understand it
• The distance from the person training me
Shortcomings relating
to the cost issues • Bank costs too high
• Never received the funds (presumably from
government incentives or banks)
• Control of costing
Shortcomings relating
to the governmental
bodies and related laws
• Inefficient CCMA
• The laws are not suitable to protect employers
• Poor administration

287
The success rate would probably increase if the shortcomings were taken into
account during the process of assistance in some of the cases where the above
shortcomings were identified.
One may conclude that the assistance was not the cause of any failures nor was
it the main cause of their success, but it does play a supporting role in managing
an SME successfully.
Although the respondents of this study did not rate the assistance they received
as an important factor contributing to their success, it was found in a study by
Berry, et al. (2006:43), that SMEs whose owners/managers made use of a range
of business advice were also those that were growing (one of the characteristics
of a successful SME as defined in chapter 1) most quickly.
The South African government has established many bodies to support the start-
up and growth of SMEs. Although much of this support is in the form of financial
assistance, its impact is still unsatisfactory.
The support bodies in South Africa are extremely fragmented and in the hands of
so many role players. The interventions aimed at personal motivation and
entrepreneurial skills are the exception rather than the rule (Nieman in Nicolaides
& Reddy, 2004:207).
One may conclude that the shortcomings identified by the respondents did not
seem to have an influence on the success of their businesses. Even the
unsuccessful SME owners were satisfied with the assistance they had received.
Their failures must have been caused by other factors as described in section
6.9.5.

288
SECONDARY OBJECTIVE (as required by Cofesa) To determine to what extent the respondents rate Cofesa as a provider of
assistance.
No specific question was asked about the assistance provided by Cofesa. The
purpose of this was to find out how Cofesa members rate or whether they even
perceive Cofesa to be one of the assistance providers.
According to the Cofesa website, this organisation is primarily a professional
service organisation of advisors in different areas of business. Their members
are small businesspeople who have acquired the assistance of specialists.
Initially Cofesa focused on labour-related issues, but in the last six years, it has
been assisting its members in other functional areas of business as well, making
use of advisors and specialists. In addition to other types of assistance, they
have a hotline for entrepreneurs requiring help in different areas.
The researcher was under the impression that the members of Cofesa were
informed about the fact that they could be assisted in different areas of business
and not only labour-related issues. If they had been informed, they were not
making much use of this service. Only 2% of the respondents indicated that they
used Cofesa as a source of assistance.
Finally, Cofesa members generally did not know that they could be assisted by
Cofesa in different areas of business or they did not to want be assisted by
Cofesa. They primarily became members of Cofesa to obtain access to CCMA
representation in labour-related cases and to obtain labour-related advice and
assistance.

289
Summary of the results of the study:
Of the 200 respondents in this study, 91.5% indicated that they had successful
businesses, located all over South Africa, most of them (40.5%) in the Gauteng
area. Their businesses were in all the sectors of the economy, but primarily in
manufacturing, community service, community, social and personal services and
retail and the motor trade repair services. Most of them employed fewer than 50
people. The reader is reminded that the sample is not representative of the
entire population of SMEs in South Africa, but was used for the reasons
mentioned in section 5.3.2.
The businesses generally received assistance in the areas of finance, marketing
and human resources and the respondents also indicated that these were the
most important areas receiving assistance. Most of them received assistance on
a continuous basis, but when they were asked what they would suggest about
the period of assistance, more than one-third indicated that they would have
sought assistance before starting their businesses. Many simply received advice
from others, but also made use of consultants/specialists, outsourced some
functions and received training. The assistance was mainly sought from
consultants/specialists, and many sought assistance from other businesses.
(Surprisingly few mentioned Cofesa as an assistance provider.)
Only a few respondents identified shortcomings in the process of assistance.
Even the unsuccessful ones were satisfied with the assistance they had received.
All the respondents had received assistance and most of them perceived their
businesses as being successful. Although the respondents regarded finance as
one of the most important areas in which assistance is needed, they did not see it
as a contributing factor to their success. Finance per se probably does not
determine the success of a business in the same way as the right product at the
right quality and the right marketing strategies.

290
Assistance is a contributory factor to success but not the reason for it. The
success of an SME mainly depends on other factors such as the type of product,
product quality and marketing. Assistance, however, is important and should first
be provided in those areas that determine the success of a business, and
thereafter and continuously in the areas identified by the respondents in this
study (mainly finance, marketing and human resources).
7.3 SUMMARY OF CONCLUSIONS
Cross-tabulations were done to determine whether there were any relationships
between the chosen variables. The following conclusions were drawn:
• All of the respondents who had used assistance before they started their
businesses were successful.
• All the respondents who were trained on the job were successful.
• The type of business, the length of time of assistance, the presenter of the
assistance, the length of time of assistance and the size of the business do
not seem to make any significant difference with regard to the success of the
businesses.
• The qualifications of the business owner did not determine the success of the
business.
Although this study indicates that a qualification does not make a difference to
the success of a business, one must keep in mind that the qualifications
obtained by the respondents were probably not business related. An example

291
of this is the 16 business owners in the sample who had been teachers prior
to starting their businesses.
South Africa’s aspirant SME owners simply do not have the skills and attitude
to succeed. They need training, a relevant qualification and/or continuous
assistance in order to be successful. Not only would a qualification in the
relevant field (say, small business management) be helpful, but also
knowledge and experience in the field of business.
• The primary reason for unsuccessful businesses in this study was the labour-
related issues, including the high cost and low productivity of labour.
The SME population in South Africa is huge and diverse. The sizes of the SMEs
range from one-person concerns to businesses with up to 250 employees. The
businesses are all in different stages of development, some are more complex
than others, requiring more refined and extensive skills. The businesses are also
located in many different areas with different characteristics and needs.
Additionally, the business owners/managers are all different people with a variety
of skills. Because of all these differences, the need for assistance in all areas
varies a great deal and the researcher will not attempt to generalise.
Because of the population used for this study, the results and conclusions are not
representative of the SMEs in South Africa. However, this study gives a clear
indication of the factors that contributed to the success of the business owners
who are members of Cofesa. It also shows clearly what type of assistance is
needed once the basic factors for success are in place. The fact that SME
owners are being assisted by consultants does not make them successful. Other
factors determine their success.

292
7.4 RECOMMENDATIONS
Based on the results of the study, the following recommendations are made:
7.4.1 The areas of assistance
Most of the respondents in this study had successful businesses at the time of
the study. The areas which assistance was mainly sought were finance,
marketing and human resources. However, most of them also mentioned that
other factors were responsible for their success. It is recommended that SME
owners should first seek assistance in those areas that seem to have caused
these respondents to be successful. The primary areas are the following:
• the type and quality of product
• marketing
• the location of the business
• good human relationships
Once these are in place, the SME owner would probably need assistance in the
other areas, as indicated by the respondents of this study. These areas are
finance, human resources and the other less important areas, as mentioned in
chapter 6.
7.4.2 Stage in the business life cycle in which assistance should be sought and the duration thereof
Assistance should be sought even before starting a SME. During this stage,
aspirant SME owners should make sure about the product/service they wish to
sell, the quality of the product, the marketing strategies and the location of the
business. If these issues are not in order before starting a business, it will be
difficult to make a success of the business.

293
It is strongly recommended that SME owners should also seek assistance before
starting a business as well as on a continuous basis. The continuous assistance
could range from, say, one day a week to one day a month. A provider of such
assistance could even be employed on the basis of one day a week or one day a
month in order to be available continuously.
7.4.3 Assistance providers
Obviously this would depend on the specific need of the business owner. Before
starting a business, aspirant business owners should seek assistance (in the
form of advice) from business consultants and even other business owners. The
literature study identified many such providers as highlighted in section 3.5.
Business owners might also need more information on the actual management of
a business. To satisfy this need, aspirant business owners would probably
benefit by undergoing some training in the management of a small business or
study a business management course. Once again there are many providers
that can be contacted to satisfy this need.
More dedicated courses offered by tertiary institutions are needed to equip
aspirant SME owners with the relevant knowledge and skills to start, manage and
grow a successful SME.
Vocational training programs should be tailor-made to meet the needs of the
SME sector. It is obvious from this research that consultants are under-utilised
by SMEs. The reasons for this might be the lack of awareness about the role of
consultants, the inaccessibility of consultants or the cost of consultants for this
sector (Pansiri & Temtime, 2008:259).

294
The South African government can and should learn from the USA where the use
of the Small Business Administration (SBA) is highly successful in providing
assistance to small businesses (discussed in sec. 3.4.1).
Finally, consultants and other providers must make sure that their assistance
meets the need of the business owner. According to Abraham and Allio (2006:6),
many consulting projects are only “band-aids that fail to add long-term value for
clients”. Often business owners are left alone to implement recommendations
made by the consultants. The skill and knowledge transfer between the
consultant and business owner is not sufficient, leaving the client continually
dependent on consulting advice and technology. Lastly, the researchers found
that there is huge variability in the quality of consulting advice and the expertise
of consultants, mainly because of low entry barriers to the consulting profession.
Consultants are often managers who have lost or left their jobs to become
consultants, often taking on assignments far outside their experience or expertise
Concerning strategic business advice, Abraham and Allio (2006:4-12), found that
there is rising consumer dissatisfaction with much of the “strategic-business-
advice industry”, the latter referring to the institutions and thinkers that publish the
business journals, do corporate consulting, edit the business books, teach the
MBAs, perform the business research, and write the journal articles related to
strategy. Top managers are not happy and are frustrated with most of the
strategic-business-advice. The main problems seem to be that clients are not
involved in implementation and that consultants do not satisfy the real needs.
The suggestions are that consultants should focusing on the real need and not on
what they have to sell, create more value by transferring process skills to clients
and share more responsibility for implementation, creating value with their clients.

295
7.4.4 The respondents’ recommendations during their interviews
Government should somehow keep record of new businesses starting up and
offer assistance and support before new business owners apply for or request
assistance. Business owners often only realise that they need assistance when it
is probably too late. According to the respondents, this would ensure that all
possible aid is provided to SMEs to enable them to succeed.
Government assistance should also be supplied to new business owners who
made use of their own money to start their businesses. Some of the respondents
were people who had either been retrenched or had used their pension funds to
start a SME. They felt that they did not receive the necessary assistance from
government because they had made use of their own money to start a business.
They felt that no financial aid was available to them.
It is furthermore recommended that SME owners should not attempt to handle
every aspect of and function in the business themselves. They should focus on
their core business and seek assistance in those areas indicated in this study,
especially when their business is growing.
The aim of the Small Business Administration (SBA) in the USA and other similar
institutions is basically the same all over the world, namely to assist SME owners
in different ways to survive and be more successful. South Africa is in dire need
of such an institution.
7.5 RELIABILITY AND VALIDITY OF THE STUDY
Reliability refers to the extent to which the scores obtained may be generalised to
different measuring occasions, measurement/test forms and measurement/test
administrators (Welman & Kruger, 2001:139). Joppe, in Golafshani (2003:598)

296
also defines reliability as the extent to which results are consistent over time,
while an accurate representation of the total population under study is referred to
as reliability. If the results of a study can be produced using a similar
methodology, then the research instrument is considered to be reliable.
According to Ali (2003:319), reliability is mainly concerned with the accuracy,
consistency and predictability of the research findings.
The research findings of this study are reliable for the SME owners who are
members of Cofesa (see details in sec. 5.3.2).
Validity in its simplest form indicates whether or not the measuring instrument
tests what it is supposed to test (Statsoft, in Ali, 2003:316). The term applies to
measuring instruments that show the extent to which differences in scores on the
measurement reflect true differences between individuals, groups or situations in
the characteristic they seek to measure, or reflect true differences in the same
individual, group or situation from one occasion to another, rather than constant
or random errors (Tustin et al, 2005:296).
To validate the data set and to check for reliability, the Cronbach alpha value was
calculated. The Cronbach alpha value in this case was 0.68, which according to
Nunnally (1978:245) is an acceptable reliability coefficient.
Completeness was validated, that is all the necessary tables to answer objectives
were present. The base for each table was validated and is correct. The
standard breaks (splits) were validated and are correct. There are no blank
tables. Frequency counts prior to running tables, to ensure the accuracy of data
and to determine base sizes for subgroups, were validated. All the statistical
techniques used were accurate and appropriate.

297
7.6 PROPOSALS FOR FURTHER RESEARCH
This study covered a wide area in which different aspects of assistance were
researched. The details of some of these results could and should be
researched to supply SMEs with even more useful information on the entire
process of assistance. These include the following:
• Although the study revealed that finance was the area in which most of the
respondents received assistance, the details of the assistance were not
determined. Assistance in finance has many forms, from receiving money to
starting the business to receiving advice to manage the financial issues of the
business. The researcher suggests that further research could be undertaken
to determine the specific assistance the respondents needed in the area of
finance to make them more successful. If they receive money, as the
tendency seems to be, they should be assisted by showing them how to use
the money wisely. Simply giving money to an aspirant SME owner would lead
to more unsuccessful businesses (Wood, in Van Vuuren, 2007:4).
• The respondents did not make much use of educational institutions and
trainers to assist them. The reasons for this could be investigated. This
information could help educational institutions such as Unisa to adjust their
small business qualifications to suit the need in this industry. (Unisa is a
distance learning institution in which business owners can study part time
while managing their businesses.)
• Aspirant business owners often do not know what type of business they
should start, what product they should produce or sell or what service they
should render. The primary factor contributing to the success of a business
identified by the respondents in this study is the type of product. If they can
start by getting the product right, they have a much better chance of
succeeding. Research could be done to determine the following:
298
- in which sectors of the economy there is a need for a specific product or
service
- what the needs are in specific areas of the country regarding products
and services
• Although some research has been conducted in other countries such as
Canada on this issue (Cruise, 2001:24), the type of assistance that would be
needed during the different stages of the business life cycle could also be
further researched.
• Many of the unsuccessful respondents complained about the labour situation
in South Africa, especially about high labour costs, the low productivity of the
labour force and insufficient assistance from the CCMA and government. The
influence of institutions such as the CCMA on SMEs needs to be investigated.
Research should be conducted on labour practices as well as on the
efficiency of the government institutions that are involved in assisting SMEs.
• Further research is also needed to determine the success factors for SMEs in
South Africa.
• Finally, Cofesa and other similar institutions should conduct research on the
marketing of their services, especially to their members and other SME
owners.
Only when more is known about the support available to SMEs in South Africa
will there be a better chance of them succeeding.
This research outlined the process of interventions. It also indicated that
interventions per se will not cause SMEs to be successful. Success is
determined firstly by success factors as indicated by the respondents. Once
these factors are in order, assistance in functional areas such as finance and

299
marketing probably contributes to the success of the business. Seeing that
management was identified as the main cause of failure of SMEs, SME owners
and managers need assistance in all the above matters, even before starting a
business and continuously during the life-cycle of the business. As there was no
control group to measure against, it was not possible to indicate whether the
SMEs in this study were more successful because of the assistance they
received.
The study has value for both the presenters of assistance (including tertiary
institutions) and SME owners/managers. This study will surely assist with helping
both these parties to rethink their approach to the entire consulting process. In
managing a business, owners and managers hardly have all the management
skills needed to be successful. This study will give owners and managers of
SMEs a definite guideline to follow in making use of assistance and interventions
so that the businesses they own or manage have a better chance of survival.

300
BIBLIOGRAPHY
Aaker, D.A. & Day, G.S. 1990. Marketing research. 4th edition. New York:
Wiley.
Abraham, S. & Allio, R.J. 2006. The troubled strategic-business-advice industry:
why it’s failing decision makers. Strategy and leadership, Vol. 34, No. 3.
Absa Business. 2004. From:
http://www.absa.co.za/Business/0,2999,2327,00.html (accessed 11 October
2004).
Ahwireng-Obeng, F. & Piaray, D. 1999. Institutional obstacles to South African
entrepreneurship. South African Journal of Business Management 30(3):78-85.
AIC. 2006. Association of Independent Consultants. From:
http://www.aiconsult.ca (accessed 25 July 2006).
Akunuri, J.S. & Nwankwo, S. 2005. Marketing “assistance” to SMEs: what small
business really, really want. Paper presented at the Institute for Small Business
and
Entrepreneurship, United Kingdom.
Ali, F. 2003. New marketing opportunities for fixed line telecommunication
operators in South Africa: a strategic evaluation. D.Com. thesis, University of
South Africa, Pretoria.
Anon. 2000. SMMEs and the SABS: a good partnership. Black Business
Quarterly 2(4):100.

301
Anon. 2005a. Expertise the bedrock for growth. Business Day, 26 June. From:
http://www.businessday.co.za/Articles/TarkArticle.aspx?ID=1506183 (accessed
20 July 2006).
Anon. 2005b. It’s the season to be entrepreneurial. Finance Week – South
Africa, 28 March–1 April.
Anon. 2005c. SMEs’ access to finance in South Africa. From:
http://www.finance.gov.za/documents/sme/25_56.pdf (accessed 10 October
2005).
Anon. 2006a. Business Consultations. From:
http://www.nt.gov.au.business/assistance.cfm?assistanceid=6 (accessed 3
August 2006).
Anon. 2006b. Kiwi business owners need you! New Zealand business. July.
New Zealand: Profile Publishing Ltd.
Anon. 2007. Nominal association: phi, contingency coefficient, Tschuprow's T,
Cramer's V, lambda, uncertainty coefficient. From:
http://www2.chass.ncsu.edu/garson/pa765/assocnominal.htm (accessed 18
September 2007).
Ask Africa. 2008. Data Collection.
http://www.askafrika.co.za/data_call%20centre.htm(accessed 27 February 2008).
Australia. Official Hansard. 2003. Report of the Employment, Workplace
Relations and Education References Committee. Australia: Government Printer,
No. 1, 6 February (Presenter: G. Campbell.)
Bannock, G. 1999. Entrepreneurship and SME research: on its way to the next
millennium. Aldershot, UK: Ashgate.

302
Bernier, C. 2005. The impact of size and of institutional mechanisms. Industrial
Relations (0034379X), Summer 2005, Vol. 60 Issue 3.
Bernstein, A. 2004. Talk to South Africa's new “struggle heroes” - entrepreneurs.
Sapa Media Release, 12 July.
Big deal for small business. 2005. Finance 24.com. From:
http://www.fin24.co.za/articles (accessed 28 October 2005).
Berry, A.J., Sweeting, R. & Goto, J. 2006. The effect of business advisors on the
performance of SMEs. Journal of small business and enterprise development,
Vol. 13, No. 1.
Boosting small business. 2006. From:
http://www.southafrica.info/doing_business/economy/development/smallbusiness
.htm (accessed 19 July 2006).
Bosman, E. 2002. Lessons learned from building a business. Entrepreneurship
1.
Brink, A., Ligthelm, A. & Cant, M. 2003. Problems experienced by small
business in South Africa. Paper presented at the Annual Conference of Small
Enterprise Association of Australia and New Zealand, University of Ballarat,
Australia.
Bruce, D., Deskins, J.A., Hill, B.C. & Rork, J.C. 2007. SBA small business
research summary. Small business and state growth: an econometric
investigation, February, No. 292. Maryville, TN: SBA.
Budget Speech 2001. Highlights. From:
http://www.finance.gov.za/,14March2001 (accessed 15 July 2004).

303
Burke, G.I. & Jarrat, D.G. 2004. The influence of information and advice on
competitive strategy definition in small and medium-sized enterprises. Qualitative
Market Research: An International Journal 7(2).
Business Beat. 2004. From: http://www.buisnessbeat.co.za (accessed 15 July
2004).
Business Consultants. 2006. From: http://www.onlybusinessconsultants.com
(accessed 2 August 2006).
Business Partners. 2006. From: http://www.businesspartners.co.za (accessed
19 July 2006).
Butcher, C. 2002. SA’s largest employers. PMR, June.
Byrd, W.A. & Qinsong, L. (eds). 1990. China’s rural industry: structure
development and reform. New York: Oxford University.
Byrne, G. 2007. A statistical primer: understanding descriptive and inferential
statistics. Evidence based library and information practice, 2:1.
Campbell, G. see Australia. Report of the Employment, Workplace Relations
and Education References Committee.
Carruthers, P. 2004. Entrepreneurs. From: http://www.smart-
entrepreneurs.co.za/banks.html (accessed 11 October 2004).
ChemCity. 2006. From:
http://www.chemcity.co.za/sasol_chemcity/frontend/n(accessed
avigation.jsp?navid=1&rootid=1 (accessed 26 October 2006).

304
Ciavarella, M, A. 2003. The adoption of high-involvement practices and
processes in emergent and developing firms: a descriptive and prescriptive
approach. Human Resource Management 42(4).
Claassen, L. 2005. Small firms must exploit tax breaks. Business Day. From:
http://www.businessday.co.za/Aricles/Tarkarticle.aspx?ID=1499910 (accessed 7
June 2005).
Clarke, G. 2004. Long-term rewards in helping small businesses. Sunday
Times, 11 July.
Clegg, S.R., Rhodes, C., Kornberger, M. & Stilin, R. 2005. Business coaching:
challenges for an emerging industry. Industrial and commercial training, Vol. 37,
No. 5.
Cofesa. 2006. From: http://www.cofesa.co.za (accessed 19 July 2006).
Conradie, W.M. & Fourie, C.M.W. 2002. Basic financial management for
entrepreneurs. Lansdowne: Juta.
Cornwall, J. 2006. What is success? The entrepreneurial mind, Belmont
University. From: http://forum.belmont.edu/cornwall/archives/000359.html
(accessed 1 November 2006).
Cruise, K.N. 2001. Management skills for small business. A report submitted to
the Small Business Policy Branch Industry. Canada, 30 March.
Da Silva, M. 1987. Small-scale industry in black South Africa. MA dissertation,
University of the Witwatersrand, Johannesburg.

305
Dagut, S. 2007. Analysing red tape constraints and regulatory costs for small
enterprises. In 2007 Annual business summit: DTI. Bela Bela: DTI.
Damane, A.N. 2007. Inligting ontsluit klein sake se vooruitgang. Geld, in
Rapport, 22 April.
Davis, P. 2004. Retrieving corporate policy: managing minority dissent.
Corporate governance, Vol. 5, No. 4.
De Faoite, D., Henry, C., Johnston, K. & Van der Sijde, P. 2004. Entrepreneurs’
attitudes to training and support initiatives: evidence from Ireland and The
Netherlands. Journal for Small Business and Enterprise Development 11(4).
Department of Trade and Industry. 1995. National strategy for the development
and promotion of small business in South Africa. Pretoria: Government Printer,
Directorate of Communications. Government Notice 213.
Department of Trade and Industry. 2005. Integrated strategy on the promotion
of entrepreneurship and small enterprises. From:
http://www.dti.gov.za/smme/strategy.pdf. (accessed 3 March 2008).
Devins, D., Gold, J., Johnson, S. & Holden, R. 2005. A conceptual model of
management learning in micro business – Implications for research and policy.
Education + Training, Vol. 47, No. 8/9.
Diamantopolous, A. & Schlegelmilch, B.B. 1997. Taking the fear out of data
analysis. London: Dryden.
Dommisse, E. 2005. Anton Rupert: a biography. Cape Town: Tafelberg.

306
Driver, A., Wood, E., Segal, N. & Harrington, M. 2001. Global entrepreneurship
monitor: South African executive report. Cape Town: Graduate School of
Business.
DTI, see Department of Trade and Industry.
Duvenhage, H. 2005a. Regulering maak Suid Afrika minder vry. Sake-Rapport,
12 June:8.
Duvenhage, H. 2005b. SA is nog nie sakevriendelik. Sake-Rapport, 24 July:11.
Dyer, T. 1997. Become a professional entrepreneur. Entrepreneur 16(6), July
1997.
Edwards, J.D., Hermanson, R.H. & Maher, M.W. 1993. Principles of financial
and managerial accounting. Revised edition. Boston, Massachussetts: Irwin.
Egelhoff, T. 2006. How to succeed in the millennium. Small town
marketing.com business article of the week. From:
http://www.smalltownmarketing.com/millennium.html (accessed 1 November
2006).
Ellram, L. & Billington, C. 2001. Purchasing leverage consideration in the
outsourcing decision. European Journal of Purchasing and Supply Management
7:15-27.
Ensor, L. 2005. State looks to lighten small business load. Business Day.
From: http://www.businessday.co.za/Printfriendly.aspx?ID=BD4A65387 (7 July
2005).

307
Entrepreneur Interview Series. 2004. From: http://www.zeromillion.com
(accessed 8 October 2004).
FDE Attorneys, Notaries and Conveyancers. 2004. From:
http://www.fdeattorneys.co.za/products.htm (accessed 8 October 2004).
Feinstein, C.H. 2005. An economic history of South Africa: conquest,
discrimination and development. United Kingdom: Cambridge University Press.
Foxcroft, M., Wood, E., Kew, J., Herrington, M. & Segal, N. 2002. Global
entrepreneurship monitor: South African executive report. Cape Town: Graduate
School of Business.
Garg, A.K., Joubert, R.J.O. & Pellissier, R. 2004. Measuring business
performance: a case study. Southern African Business Review 8(1) May.
GEP. 2007. From: http://www.gep.co.za/index.php (accessed 17 October 2007).
Godfrey, C., Executive Director of Business Beat at Deloitte & Touche. 2004.
Statement to author, 15 July. Johannesburg.
Goldstuck, A. 2004. SME survey 2004. Johannesburg, World-wide Works.
Government Gazette 26 November 2003 see South Africa. Department of
Labour, 2003.
Goldstuck, A. 2005. Most SMEs seek access to expertise, not BEE: SME
Survey 2005. From: http://www.theworx.biz/sme05b.htm. (accessed 26 February
2008).

308
Grawitzky, R. 2007. SETAs: a vehicle for the skills revolution? A report
commissioned by the Development Policy Research Unit (DPRU) UCT. South
Africa, July.
Greene, F.J. & Storey, D.J. 2001. The value of outsider assistance in supporting
new venture creation by young people. Babson College Research Topic. From:
http://www.babson.edu/entrep/fer/Babson2001/XVIII/XVIIIA/XVIIIA/xviii-a.htm
(accessed 20 July 2006).
Hallberg, K. 1999. Small and medium scale enterprises: a framework for
intervention. Small Enterprise Unit Private Sector Development Department.
The World Bank research paper, 21 May.
Hamilton, B.E. & Smith, P.G. 1993. Implementing TQM on a shoestring. Journal
of Management Consulting 7(4), Fall.
Hellriegel, D., Jackson, S.E. & Slocum, J.W. 2005. 10th ed. Management – a
competency-based approach. Canada: Thompson.
Herath, S.K. 2007. A framework for management control research. Journal of
management development, Vol. 26, No. 9.
Hetherington, I. J. 1985. The development of small business in South Africa.
[s.n.]
Hetherington, I. J. 1986. The development of small business in South Africa
(part 2). [s.n.]
Hill, J., McGowan, P., Drummond, P. 1999. The development and application of
a qualitative approach to researching the marketing networks of small firm
entrepreneurs. Qualitative Market Research 2(2):71-81.

309
Holmes, M. 2006. Canada’s pact for African SMEs. Business Day, 22 March.
Howard, D. & Hine, D. 2000. The small enterprise environmental matrix: a tool
for strategically positioning small business assistance programs. Journal of
Enterprising Culture 8(1).
HRD Review. 2003. Data tables. From:
http://hrdwarehouse.hsrc.ac.za/Table.jsp?chid=136&tabid=2554 (accessed 7
September 2007).
IBA. 2001. The Institute of Business Advisers South Africa. Membership
Information 20/09/2001, ref S2L.
IMCSA. 2006. Institute of Management Consultants of South Africa. From:
http://www.imcsa.org.za (accessed 25 July 2006).
Intekom launches definite new portal for South Africa’s SME sector. 2000.
Comtex. From: http://www.web7.infotrac.galegroup.com/itw/infomark (accessed
27 October 2005).
Israel, G.D. 1992. Determining sample size. Program evaluation and
organisational development, IFAS, University of Florida. PEOD-6. November.
Jackson, P, L, M. 2004. Entrepreneurial support in South Africa: A case study of
a small enterprise support centre in Johannesburg. MSc dissertation, University
of Birmingham, UK.
Jayawarna, D., Macpherson, A. & Wilson, A. 2007. Training commitment and
performance in manufacturing SMEs. Journal of small business and enterprise
development, Vol. 14, No. 2.

310
Jones, S. & Müller, A. 1992. The South African economy, 1910-90. London:
Macmillan.
Jones, S., Vaught, B.C., Timmerman, L.K. & Trewatha, R.L. 1990. An evaluation
of consultant services for small business. Small Business Institute Directors
Association. Southwest Missouri State University.
Kakabadse, N.K. and Louchart, E. 2006. Consultant’s role: a qualitative inquiry
from the consultant’s view. Journal of management development, Vol. 25, No. 5.
Keating, R.J. United States. Small business and entrepreneurship council.
2003. Small business survival index 2003: Ranking the policy environment for
entrepreneurship across the nation, September. Washington, D.C.: Small
business survival committee.
Keogh, W. & Mole, K. F. 2005. The changing role of the public sector small
business advisor. Paper presented at the Institute for Small Business and
Entrepreneurship, United Kingdom.
Khula. 2007. From: http://www.khula.org.za (accessed 22 October 2007).
Kingdon, G.G. & Knight, J. 2004. Unemployment in South Africa: the nature of
the beast. World development, Vol. 32, Issue 3.
Ladzani, W. 2001. Small business development in South Africa under the
majority rule. Paper presented at Annual Conference of Small Enterprise
Association of Australia and New Zealand (SEAANZ), Wellington, New Zealand.
LDA, see London Development Agency.
Lebelo, M. 2004. Khula-hoof wil help. Sake-Rapport, 14 Maart.

311
Leedy, P., Newby, J. & Ertmer, P.A. 1997. Practical research, planning and
design. 6th edition. New Jersey: Prentice-Hall.
Leonard, O. 2004. Mind over management. Engineering management journal,
Vol. 14, Issue 1.
Lewis, J.D. 2001. Policies to promote growth and employment in South Africa.
Trade and industrial policy strategies. Annual Forum 10-12 September.
Lewis, K., Massey, C., Ashby, M., Coetzer, A. & Harris, C. 2007. Business
assistance for SMEs: New Zealand owner-managers make their assessment.
Journal of small business and enterprise development, Vol. 14, No. 4.
London Development Agency. 2005. Enterprise support in seven world cities.
Executive summary of a Report by the LDA, March, London.
Longley, R. 2006. SBA says 50% fail during first year. Why small businesses
fail: SBA. From: http://usgovinfo.about.com/od/smallbusiness/a/whybusfail.htm
(accessed 1 August 2006).
Maas, G & Herrigton, M. 2006. Global Entrepreneurship Monitor: South African
executive report. The UCT Centre for Innovation and Entrepreneurship.
Madell, C. & Adam, A. 2002. Local economic and business development in
South Africa. Key areas of strategic focus and co-operation. Paper presented at
the Planning Africa Conference, 18-20 September, Durban.
Malherbe, P. 2004. Mentor help kleinsake. Sake-Rapport, 25 April.
Malhotra, N.K. 1993. Marketing research: an applied orientation. New Jersey:
Prentice-Hall.

312
Man, T.W.Y. 2006. Exploring the behavioural patterns of entrepreneurial
learning – a competency approach. Education + Training, Vol. 48, No. 5.
Mandela, N. 1997. Speech by President Nelson Mandela at the Second
National Conference on Small Business, 5 November, Durban.
From: http://www.anc.org.za/ancdocs/history/mandela/1997/sp971105.html
(accessed 15 September 2007).
Mantle, C., Harrod, J. & Nel, B. 1992. Profile of small business in South Africa
and ways of stimulating the sector. Rivonia: BMI (Pty) Ltd.
Manuel, T. 2005. Budget Speech 2005. From: http://www.treasury.gov.za
(accessed 22 February 2005).
Manuel, T. 2006. Budget Speech 2006. From: http://www.treasury.gov.za
(accessed 18 October 2006).
Manuel, T. 2007. Budget Speech 2007. From: http://www.treasury.gov.za
(accessed 14 August 2007).
Marx, S., Van Rooyen, D.C., Bosch, J.K. & Reynders, H.J.J. (eds). 2001.
Business management. 2nd edition. Pretoria: Van Schaik.
Masten, L. & Kandoole, B. 2000. The transfer of business assistance strategies
to emerging countries: the case of Malawi. The Journal of Technology Transfer
25(3).
Matthews, C. H. 1990. Small business consultation: issues for the SBI case
experience. Changing profiles: challenges and opportunities for non-traditional
small business owners, employees, and markets: Paper presented at the Small
Business Institute Directors' Association conference, Houston, Texas.

313
Miller, P.K. 1998. Black/white joint small business ventures in South Africa.
D.B.L. thesis, University of South Africa, Pretoria. Abstract from ProQuest
Dissertations and Theses, Item: 732959791.
Mole, K. 2002. Business advisor’s impact on SMEs: an agency theory approach.
International Small Business Journal 20(2).
Monkman, D. 2003. A review of DTI’s SME financial assistance programmes
and its proposal to create a new integrated financial institution. A report
commissioned by FinMark Trust. 27 January, Saxonworld.
Müller, A. 1990. Black and coloured entrepreneurship in historical perspective.
The South African Journal of Economic History, 5.
Mutharika, B.W. 1992. The survival of small enterprise in Africa: challenges for
ICSB in the 1990’s, in Prosperity for Africa the small business way.
Johannesburg: ICSB.
Mwanambuyu, D. 2006. New body to provide mentoring to business owners.
From: http://www.businessowner.co.za (accessed 25 July 2006).
Nafcoc. 2006. Nafcoc’s proud history. From:
http://www.nafcoc.org.za/?m=About%20NAFCOC (accessed 1 August 2006).
Naidoo, S. 2004. Global survey rates South Africa at bottom of entrepreneurship
scale. Business Day, 27 January.
Neall, B. 2002. Sweet fruits of entrepreneurship. Food review 29(3), March.

314
Nhlapo, S. 2004. An investigation into factors that influence the success of small
businesses in the Kroonstad area. M.Tech dissertation, University of South
Africa, Florida.
Nicolaides, A. & Reddy, K. 2004. South African entrepreneurs and their support
networks – lessons from the Orient. Paper presented at the third international
conference in entrepreneurship: sustainable globalisation. Tswane University of
Technology, Pretoria.
Nieman, G. 2001. Training entrepreneurs and small business enterprises in
South Africa: a situational analysis. Education and Training 43(8/9).
Nieman, G. & Bennett, A. (eds). 2002. Lecturer’s guide to business
management: a value chain approach [CD-ROM]. Pretoria: Van Schaik.
Nieman, G., Hough, J. & Nieuwenhuizen, C. (eds). 2003. Entrepreneurship – a
South African perspective. Pretoria: Van Schaik.
Nieuwenhuizen, C. 1999. Kriteria vir die finansiering van kleinnyweraars. Ph.D.
proefskrif, Potchefstroomse Universiteit vir Christelike Hoër Onderwys,
Potchefstroom.
Nieuwenhuizen, C. 2005a. The nature of entrepreneurship and the significance
of entrepreneurial business for the economy. Inaugural lecture, October,
University of South Africa, Pretoria.
Nieuwenhuizen, C. 2005b. Cofesa consultant. Personal interview, 18 February,
Roodepoort.
Nieuwenhuizen, C. & Groenewald, D. 2006. Level of creativity and risk among
successful entrepreneurs. Southern African Business Review 10(1), April.

315
Nunnally, J.C. 1978. Psychometric theory. 2nd edition. New York: McGraw-Hill.
Orford, J. 2004. Global entrepreneurship monitor South African report. From:
http://www.gemconsortium.org (accessed: 20 October 2006).
Orford, J., Wood, E., Fisher, C., Herrrington, M. & Segal, N. 2003. Global
entrepreneurship monitor: 2003 South African executive report. Cape Town:
Graduate School of Business.
Pallais, D.M. & Good, E.L. 1996. What do clients want? Journal of
Accountancy, December.
Pansiri, J & Temtime, Z.T. 2008. Assessing managerial skills in SMEs for
capacity building. Journal of management development, Vol. 27, No. 2.
Paton, C. 2004. Myriad laws burden economy. Financial Mail, 19 November.
Pelham, A. M. 1985. Small business consulting needs and opinions of
consultants. Small Business Institute Directors Association. Iowa: University of
Northern Iowa.
Penning, R. 2004. Building management capability. New Zealand business.
October. New Zealand: Profile Publishing Ltd.
Phillips, B. 1993. Equalising opportunity through small business development: a
South African perspective. The review of black political economy 22(2):141, Fall.
Pleva, P. 2006. Under what conditions should donors promote consulting
services in developing countries? M. thesis, Tufts University, Medford,
Massachussetts.

316
Pretorius, M. & Shaw, G. 2004. Business plans in bank decision-making when
financing new ventures in South Africa. South African Journal of Economic and
Management Sciences 7(2).
Reh, F.J. 2006. Mentors and mentoring: what is a mentor? About Management.
From: http://management.about.com (accessed 20 October 2006).
Reijonen, H. & Komppula, R. 2007. Perception of success and its effect on
small firm performance. Journal of small business and enterprise development,
Vol. 14, No. 2.
Rikhotso, M. 2004. The Business Place consultant. Personal Interview, 29 July,
Johannesburg.
Rivera, J.M.C. 2007. An ex-post comparative analysis of SME formation in
Brazil and Mexico. International journal of emerging markets, Vol. 2, No. 2.
Rodriques, G. 2006. Three indicators of a successful business.
PowerHomeBiz.com – Making small business big business. From:
http://www.powerhomebiz.com/vol15/3indicators.htm (accessed 2 November
2006).
Rogerson, C.M. & Rogerson, J.M. 1997 . The changing post-apartheid city:
emergent black-owned small enterprises in Johannesburg. Urban Studies 34(1).
Rogerson, C.M. 2004. The impact of the South African government’s SMME
programmes: a ten-year review (1994-2003). Development Southern Africa,
December.
Ronin manual: Results for research. Volume 3, Technical reference. 1999.
USA: Ronin Corporation.

317
Rossouw, D. (ed). 2003. Intellectual tools: skills for the human sciences.
Pretoria: Van Schaik.
Rossouw. D. & Louw, H. 2005. Focus on management principles – a generic
approach. Lansdowne: Juta.
Roux, A. 2002. SMME profile. Small, medium and micro-sized enterprises in
the South African economy: growth, size and trends. Ntsika annual review 2002,
Stellenbosch.
Saayman, A. 1997. Die rol van die entrepreneur in die ekonomie. M.Com.
dissertation, University of Pretoria, Pretoria.
Santos, A. & Reynaldo, J. 1999. Cronbach’s alpha: a tool for assessing the
reliability of scales. Journal of Extension 37(2), April.
Sarder, J.H. 2002. The influence of outsider assistance on nascent
entrepreneurs. Babson College Research Topic, 2002. From:
http://www.babson.edu/entrep/fer/BABSON2002/I/I_S10/i-s10.htm (accessed 15
May 2007).
Sawtooth Technologies. 2008. WinCati for Computer-Assisted Telephone
Interviewing. From: http://www.sawtooth.com/products/cati/index.htm#whatis
(accessed 27 February 2008).
SBA. 2006. 50 years of service to America’s small business. From:
http://www.sba.gov/aboutsba/history.html (accessed 25 July 2006).
Schumpeter, J, A. 1934. The theory of economic development. [s.l.].

318
Schwartz, D. & Bar-El, R. 2004. Targeted consultancy services as an instrument
for the development of remote SMEs. International Small Business Journal
22(5).
Schwenke, J. 2005. Groot geld kom vir SEB. Sake-Rapport, 8 May:6.
Seda. 2008. National finance institutions. From:
http://www.seda.org.za/content.asp?subID=313. (accessed 22 February 2008).
Services Sector Education and Training Authority. 2004. From:
http://www.serviceseta.org.za. (accessed 26 July 2004).
Sherwin, H. 2005. Lessons from start-ups: lessons learnt from investigating
start-ups. From: http://www.financialmail.co.za (accessed 6 May 2005).
Sikhakhane, J. 2005. Study questions economic gospel of SMEs. Business
report 2005. From: http://www.busrep.co.za (accessed 3 May 2005).
SME Survey, Executive Summary. 2005. From: http://www.theworx.biz/
(accessed 1 August 2007).
SME Toolkit. 2006. From: http://africa.smetoolkit.org (accessed 21 June 2006).
Soriano, D.R., Roig, S., Sanchis, J.R. & Torcal, R. 2002. The role of consultants
in SMEs: the use of services by Spanish industry. International Small Business
Journal 20(1).
South Africa. Department of Labour. 2003. National Small Business
Amendment Act 2003. (General Notice No. 26 of 2003.) Government Gazette,
461(25763), 26 November.

319
South Africa. 2005a. Reconstruction and Development Programme: a policy
framework. From: http://www.polity.org.za/html/govdocs/rdp/rdp1.html#1.1
(accessed 1 June 2005).
South Africa. 2005b. Further initiatives to encourage entrepreneurs in South
Africa. South Africa online: the good news. From:
http://www.soutafrica.co.za/the_good_news_72_12_.html. (accessed 6
September 2005).
South African Breweries Limited. 2006. KickStart. From:
http://www.sabkickstart.co.za (accessed 19 October 2006).
South African Qualifications Authority. Information manual. 2006. Department
of Education and Labour. From: http://www.saqa.org.za (accessed 19 July
2006).
Southall, R. 2003. The ANC and black capitalism in South Africa. Paper
presented at the anthropology and development studies seminar, Rand Afrikaans
University, Johannesburg.
Stark, O.A. & Du Plessis, P.J. 2004. Defining the decision criteria relevant to
business process outsourcing in the New Economy. Management
Dynamics/Bestuursdinamika, 13(1).
Stokes, R.G. 1971. The Afrikaner entrepreneur. Partial fulfilment of Ph.D.
thesis, Duke University, London.
Swaziland Business Yearbook 2005, see Small and medium business
development.

320
Swaziland. Small and medium business development. Business Yearbook
2005. From: http://www.swazibusiness.com/sbyb2005/index.php?f=06 (accessed
3 August 2006).
Temtime, Z.T., Chinyoka, S.V. & Shunda, J.P.W. 2004. A decision tree
approach for integrating small business assistance schemes. Journal of
Management Development 23(6).
Terblanché, N.S. 1991. The spaza shop: South Africa’s first own black retailing
institution. International Journal of Retail and Distribution Management 19(5).
From: http://0-www.emeraldinsight.com.oasis.unisa.ac.za (accessed 11 August
2005).
Tillmar, M. 2007. Gendered small-business assistance: lessons form a Swedish
project. Journal of European industrial training, Vol. 31, No. 2.
Timm, S. & Terblanche, B. 2006. Skills biggest problem. From:
http://www.BusinessOwner.co.za (accessed 8 August 2006).
Toomey, D.C. 1998. South African small business growth through interim
linkages. D.Phil. thesis, Rhodes University, Grahamstown.
Tsehloane, R. & Nelson, A. 1992. Affordable mentoring for SMEs: the role of
retired executives, in Prosperity for Africa, the small business way: Proceedings
of 5th annual conference of the International council for small business - Southern
Africa. Johannesburg: ICSB.
Tshazibana, F. 2007. Initiatives on reviewing business regulations. In 2007
Annual business summit: DTI. Bela Bela: DTI.

321
Tull, D.S. & Hawkins, D.I. 1993. Marketing research: measurement and method.
6th edition. New Jersey: Prentice-Hall.
Tustin, D.H., Ligthelm, A.A., Martins, J.H. & Van Wyk, H de J. 2005. Marketing
research in practice. Pretoria: Unisa Press.
Ueckermann, H. 2005a. Kennis bo-aan kleinsakelui se lysie. Sake-Rapport, 12
June:8.
Ueckermann, H. 2005b. Klein sake kry toegang tot R20 m. Sake-Rapport, 5
June:6.
Ueckermann, H. 2005c. Kleinsakeman sal baat by verslapping. Sake-Rapport,
22 May:6.
Ueckermann, H. 2005d. Sanlam gaan 50 help om eie saak te begin. Sake-
Rapport, 5 June:6.
Ueckermann, H. 2005e. Southern Sun help gastehuis in Soweto. Sake-
Rapport, 30 October:10.
Ueckermann, H. 2006. Gauteng help KMO’s nie. Sake-Rapport, 5 March:11.
Unctad. 1999. Policies and non-fiscal measures for upgrading SME clusters: an
assessment. TD/B/COM.3/22. Geneva, 25 May.
Van der Merwe, M. 1995. The role of small, medium and micro-enterprises in
the economic reconstruction of South Africa: the creation of an institutional
framework for the advancement of SMME development, in The role of small,
medium and micro-enterprises in the economic reconstruction of Southern Africa.
Bloemfontein: Kagiso.
322
Van der Merwe, M. 2004. Measuring the impact of the Woman Entrepreneurship
Programme on potential, start-up and established women entrepreneurs in South
Africa. Paper presented at ACES Conference, Port Elizabeth.
Van Eeden, S., Viviers, S. & Venter, D. 2003. A comparative study of selected
problems encountered by small businesses in the Nelson Mandela, Cape Town
and Egoli metropoles. Management Dynamics/Bestuursdinamika 12(3).
Van Oordt, H. 2004. Pro-active risk management services. From:
http://www.financial-labour-insurance-tax.com/ (accessed 8 October 2004).
Van Tonder, J. 2005. ANC-voorstelle kry dalk anders as beplan beslag. Sake-
Rapport, 22 May:6.
Van Vuuren, J. 2004. Entrepreneurs se sake groei. Sake-Rapport, 7 Maart.
Van Vuuren, J. 2007. Entrepreneurs het meer as net geld nodig. KleinSake
Rapport, 5 Augustus.
Verran, J. 2004. The business place impact study. Report. January 2004.
Virtual Assistant. 2006. From: http://www.va4u.com (accessed 21 June 2006).
Vosloo, W.B. 1992. Fundamentals of a strategy for entrepreneurship and SME
development. In Prosperity for Africa the small business way. Johannesburg:
ICSB.
Vosloo, W.B. 1994. Entrepreneurship and economic growth. Pretoria: HSRC
Publishers.
Walker, E., Redmond, J., Webster, B. & Le Clus, M. 2007. Small business
owners. Journal of small business and enterprise development, Vol. 14, No. 2.

323
Walker, J.E.K. 1995. Prologue to capitalism, free enterprise and black
entrepreneurship: a comparative history of black business in the United States
and South Africa. Paper presented at the University of the Witwatersrand
institute for social research, Johannesburg.
Watson, G.E.H. 2004. A situational analysis of entrepreneurship mentors in
South Africa. M.Com. dissertation, University of South Africa, Pretoria.
Webster, B., Walker, E. & Barrett, R. 2005. Small business and online training in
Australia: who is willing to participate? New Technology, Work and Employment
20(3).
Weinstein, S. 2004. Who will take the reins? Some tips for solving the partner-
admission crisis. Journal of Accountancy, August.
Welman, J.C. & Kruger, S.J. 2001. Research methodology. 2nd edition. Cape
Town: Oxford.
Wren, C. & Storey, D.J. 2002. Evaluating the effect of soft business support
upon small firm performance. Oxford Economic Papers 54(2).
Yapp, C. & Fairman, R. 2005. Assessing compliance with food safety legislation
in small businesses. British food journal, Vol. 107, No. 3.
Zimele. 2005. From: http://www.zimele.co.za (accessed 17 November 2005).

324
APPENDIX

325
APPENDIX A: SURVEY QUESTIONNAIRE
(Researcher registered for degree purposes at UNISA.)
(Cofesa database used as population for survey.)
(Ask Afrika telephonically collected the data required.)
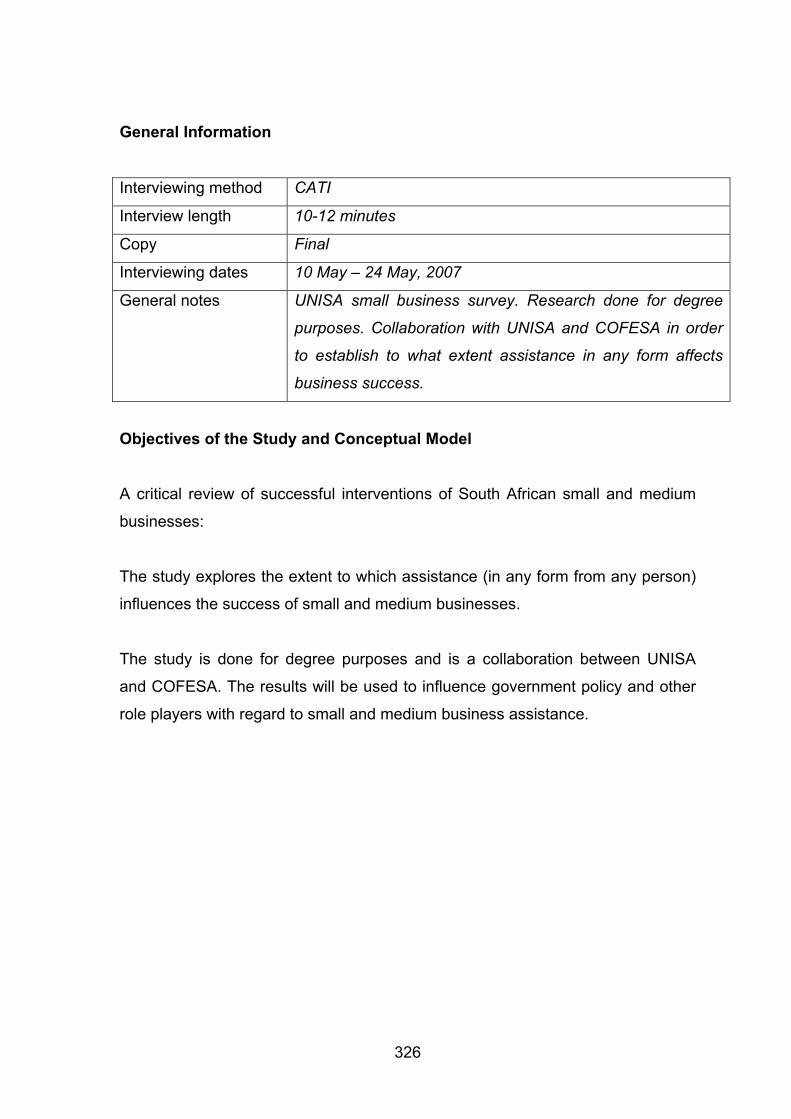
326
General Information
Interviewing method CATI
Interview length 10-12 minutes
Copy Final
Interviewing dates 10 May – 24 May, 2007
General notes UNISA small business survey. Research done for degree
purposes. Collaboration with UNISA and COFESA in order
to establish to what extent assistance in any form affects
business success.
Objectives of the Study and Conceptual Model
A critical review of successful interventions of South African small and medium
businesses:
The study explores the extent to which assistance (in any form from any person)
influences the success of small and medium businesses.
The study is done for degree purposes and is a collaboration between UNISA
and COFESA. The results will be used to influence government policy and other
role players with regard to small and medium business assistance.

327
Introduction
Good day, my name is <name>, and I’m calling from Ask Afrika an independent research company, we are not selling anything. We are currently conducting a survey on behalf of UNISA and in co-operation with COFESA. The results will be used to establish what support government should render to make entrepreneurs, such as yourself, more successful. By allowing us to interview you, you will contribute to this process. The interview will take approximately 10 minutes. I1. Would you be willing to participate?
1 Yes Continue to the screener section
2 No Thank respondent and terminate interview,
capture reason.
Screener Section
S1. Are you the manager or owner of the business?
1 Manager Continue to S2
2 Owner Continue to S2
3 Other (e.g. employee,
secretary etc.)
Ask to speak to Manager or Owner. If not
available try to make an appointment for another
time that is convenient. If manager or owner is not
available terminate interview.
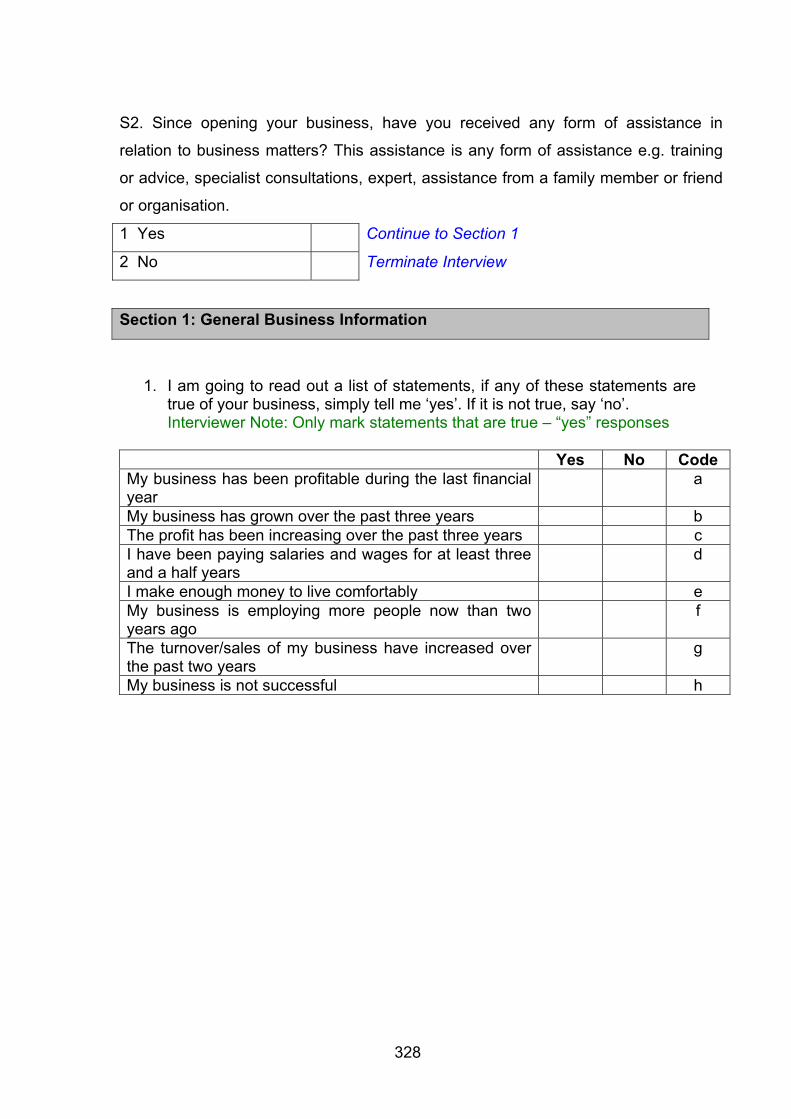
328
S2. Since opening your business, have you received any form of assistance in
relation to business matters? This assistance is any form of assistance e.g. training
or advice, specialist consultations, expert, assistance from a family member or friend
or organisation.
1 Yes Continue to Section 1
2 No Terminate Interview
Section 1: General Business Information
1. I am going to read out a list of statements, if any of these statements are true of your business, simply tell me ‘yes’. If it is not true, say ‘no’. Interviewer Note: Only mark statements that are true – “yes” responses
Yes No Code
My business has been profitable during the last financial year
a
My business has grown over the past three years b The profit has been increasing over the past three years c I have been paying salaries and wages for at least three and a half years
d
I make enough money to live comfortably e My business is employing more people now than two years ago
f
The turnover/sales of my business have increased over the past two years
g
My business is not successful h
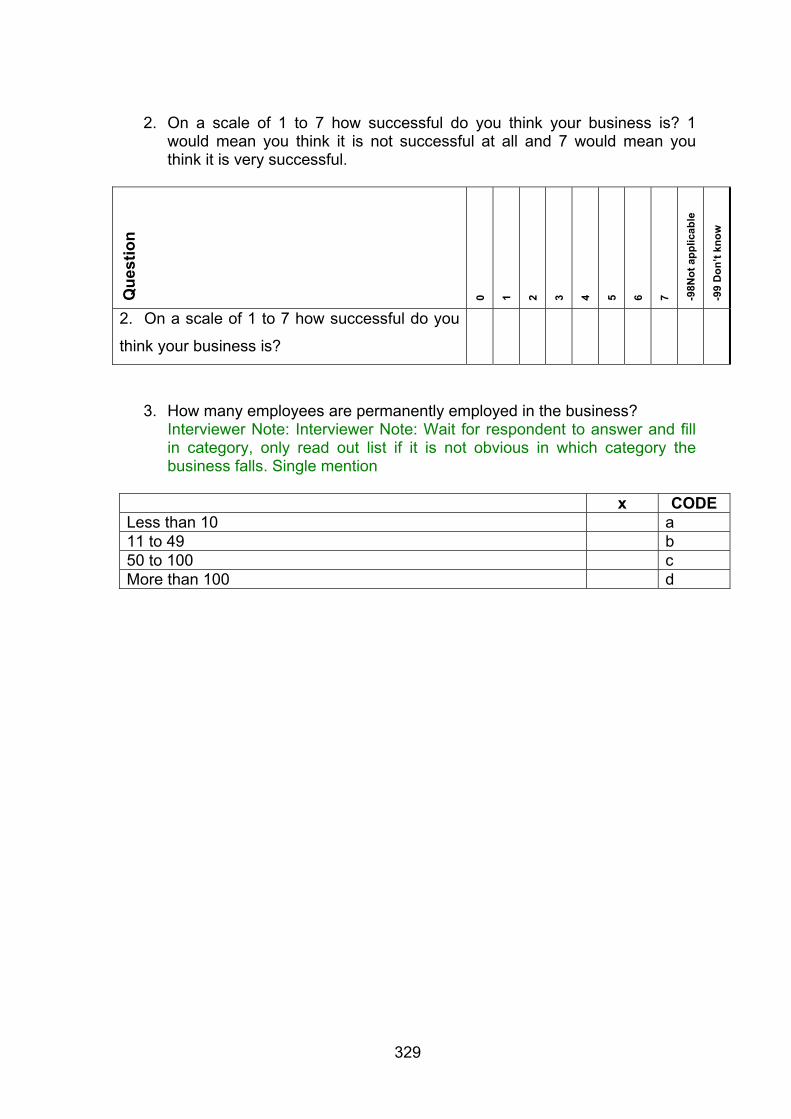
329
2. On a scale of 1 to 7 how successful do you think your business is? 1
would mean you think it is not successful at all and 7 would mean you think it is very successful.
Que
stio
n
0 1 2 3 4 5 6 7 -98N
ot a
pplic
able
-99
Don
’t kn
ow
2. On a scale of 1 to 7 how successful do you
think your business is?
3. How many employees are permanently employed in the business? Interviewer Note: Interviewer Note: Wait for respondent to answer and fill in category, only read out list if it is not obvious in which category the business falls. Single mention
x CODE
Less than 10 a 11 to 49 b 50 to 100 c More than 100 d
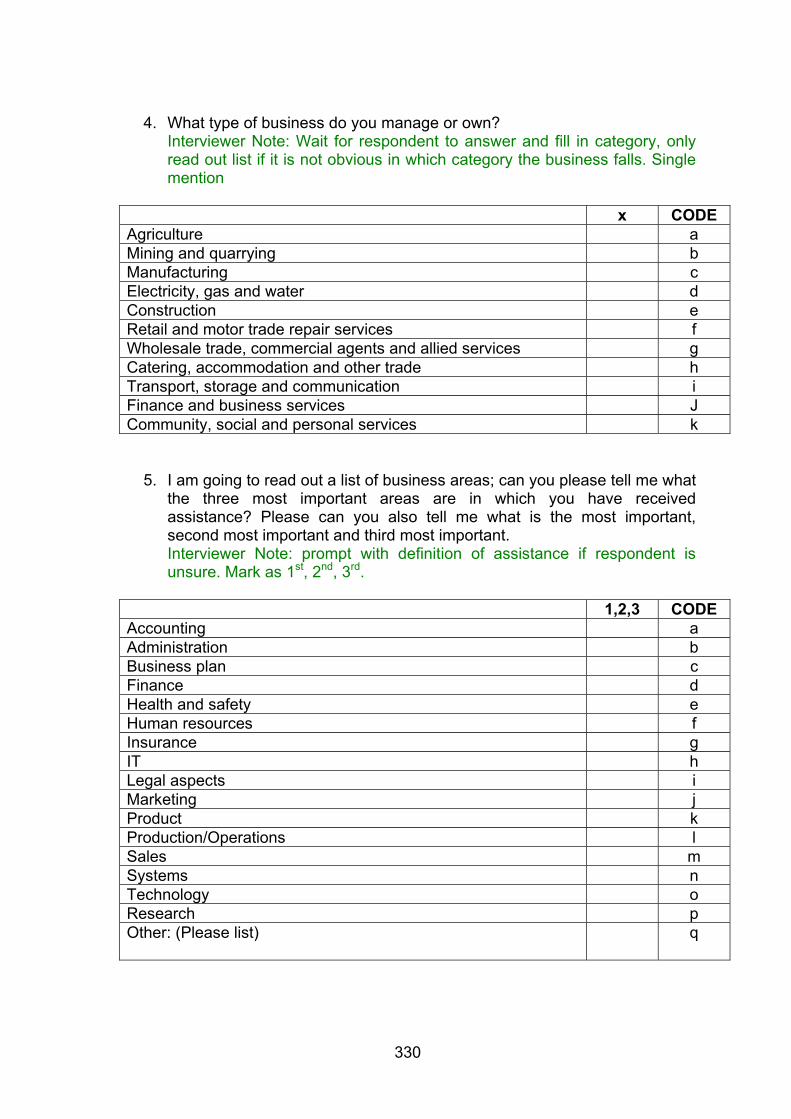
330
4. What type of business do you manage or own?
Interviewer Note: Wait for respondent to answer and fill in category, only read out list if it is not obvious in which category the business falls. Single mention
x CODE
Agriculture a Mining and quarrying b Manufacturing c Electricity, gas and water d Construction e Retail and motor trade repair services f Wholesale trade, commercial agents and allied services g Catering, accommodation and other trade h Transport, storage and communication i Finance and business services J Community, social and personal services k
5. I am going to read out a list of business areas; can you please tell me what the three most important areas are in which you have received assistance? Please can you also tell me what is the most important, second most important and third most important. Interviewer Note: prompt with definition of assistance if respondent is unsure. Mark as 1st, 2nd, 3rd.
1,2,3 CODE
Accounting a Administration b Business plan c Finance d Health and safety e Human resources f Insurance g IT h Legal aspects i Marketing j Product k Production/Operations l Sales m Systems n Technology o Research p Other: (Please list)
q

331
6. When did you make use of the assistance?
Interviewer Note: If participant asks to which of the three mentioned it applies, ask for the most important mentioned. Read out list. Single mention.
x CODE
Before starting your business a During the first six months b During the first 2 years c After the first 2 years d Continuously e
7. In what way were you assisted? Interviewer Note: If participant asks to which of the three mentioned it applies, ask for the most important mentioned. Read out list. Multi-mention
x CODE
I was given advice a I was trained on the job b I outsourced some functions to external specialists c I made use of consultants to assist me d I attended formal training/course(s). Please specify the name of the course
e
Other: (Please specify)
f

332
8. Who presented you with the assistance?
Interviewer Note: If participant asks to which of the three mentioned it applies, ask for the most important mentioned. Read out list. Multi-mention
x
Another business Continue to question 9 Consultant/specialist Continue to question 9 Trainer Continue to question 9 Educational institution Continue to question 9 Other (Please specify here)
Continue to question 9
9. How long were you assisted for? Interviewer Note: Read out list. Single mention. If participant asks to which of the three mentioned it applies, ask for the most important mentioned
x
1 day 1 day per week 1 day per month 1 week 1 month Continuously (For example: one day per week/month for a whole year) Any other: (Please specify)
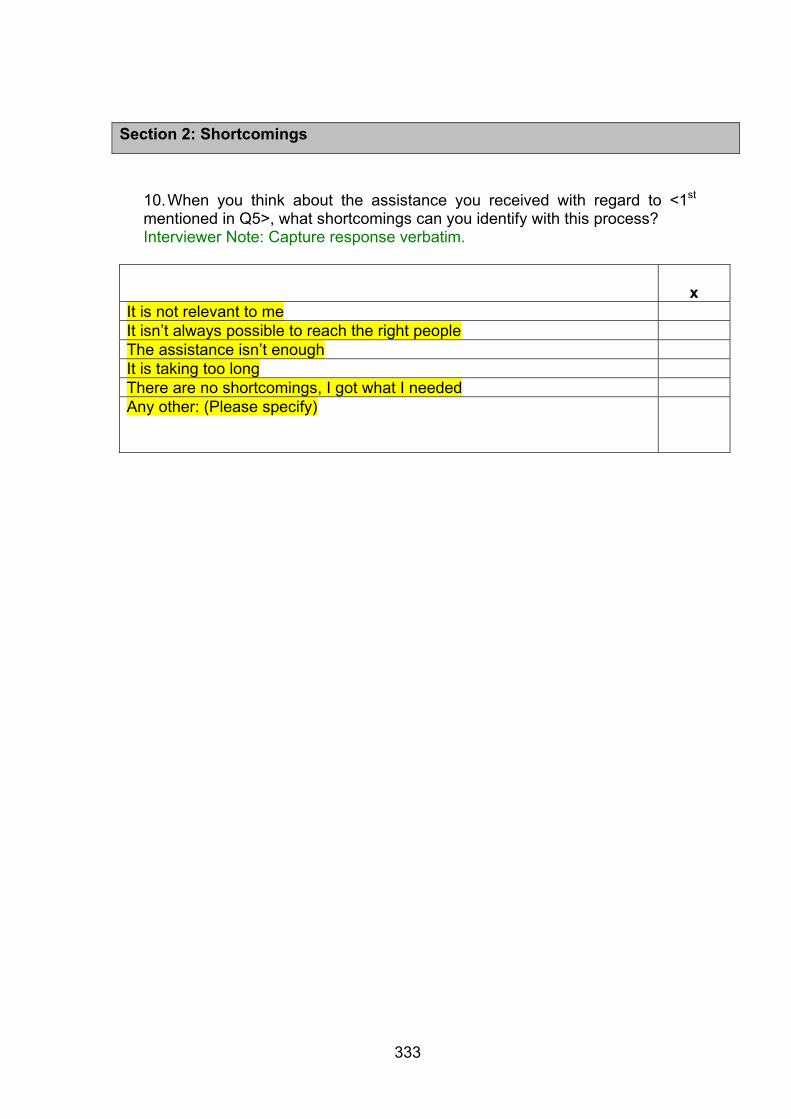
333
Section 2: Shortcomings
10. When you think about the assistance you received with regard to <1st mentioned in Q5>, what shortcomings can you identify with this process? Interviewer Note: Capture response verbatim.
x It is not relevant to me It isn’t always possible to reach the right people The assistance isn’t enough It is taking too long There are no shortcomings, I got what I needed Any other: (Please specify)

334
Section 3: Successful Interventions
11. Can you please tell me what the three most important things are that contributed to the success of your business? This can be anything, for example the type of product you sell, your persistence, intense marketing or the location of your business. Please tell me what is the 1st, 2nd and 3rd most important Interviewer Note: Keep spontaneous, prompt with examples if necessary.
1,2,3 CODE
The type of product a The assistance you received or are receiving b Your persistence c The location of the business d The need of the community e Marketing f Client services g Financial management h Your involvement in the business i Endurance to continue j Creativity k Positive approach l Quality of service/product m Good human relationships n Other (Please specify)
o
12. Is your business more successful due to the assistance you received or
are receiving?
x Trigger Yes Continue to Question 14 No Continue to Question 15

335
13. According to you, when should a person seek assistance similar to that
you have mentioned? Interviewer Note: Read out list. Single mention.
x CODE Before starting your business a During the first six months b During the first 2 years c After the first 2 years d During all phases of the business e
Section 4: Demographics
14. What is your highest qualification? Interviewer Note: Read out list. Single mention.
x CODE
Below grade 10 a Grade 10 to 12 b Certificate c 3 year Diploma/Degree d Honours degree e Masters degree f Doctorate g
15. What was your occupation before you got involved in this business? Capture response verbatim:
Name: Thank you for your time. Have a nice day

336
APPENDIX B: FIGURES AND TABLES MENTIONED BUT NOT INCLUDED IN THE CHAPTERS Figure 6.16: Frequency of the location of respondents' businesses
40.5%
18.0%
7.0% 6.5% 5.0% 5.0% 4.5% 3.5% 3.0% 3.0% 2.0% 2.0%
0%
5%
10%
15%
20%
25%
30%
35%
40%
45%
Gauteng
Western
Cape
Kwazulu
-Nata
l
Garden
Route
Pretori
a
Free Stat
e
Limpo
po
Easter
n Cap
e
Mpumala
nga
Other
Northern
Cap
e
North W
est
Location
Perc
enta
ge

337
Figure 6.17: Frequency of the types of businesses of the respondents
22.0% 21.5% 20.5%
7.5% 7.5% 6.5% 5.5%4.0% 3.0%
1.5% 0.5%0%
5%
10%
15%
20%
25%
Man
ufac
turin
g
Com
mun
ity, s
ocia
l and
per
sona
lse
rvic
es
Ret
ail a
nd m
otor
trad
e re
pair
serv
ices
Agr
icul
ture
Cat
erin
g, a
ccom
mod
atio
n an
d ot
her
trade
Con
stru
ctio
n
Who
lesa
le tr
ade,
com
mer
cial
age
nts
and
allie
d se
rvic
es
Fina
nce
and
busi
ness
ser
vice
s
Tran
spor
t, st
orag
e an
dco
mm
unic
atio
n
Ele
ctric
ity, g
as a
nd w
ater
Min
ing
and
quar
ryin
g
Types of businesses
Perc
enta
ge

338
Figure 6.18: Graphical representation of table 6.56
0% 5% 10% 15% 20% 25% 30% 35%
Other (please specify)
Creativity
The assistance received
Endurance to continue
Positive approach
Financial management
The need of the community
Your involvement in the business
The location of the business
Good human relationships
Your persistence
Marketing
The type of productFa
ctor
s co
ntrib
utin
g to
suc
cess
Percentage
First choiceSecond choiceThird choice
Table 6.47: My business has been profitable during the last financial year
Frequency Percent Valid YES 153 76.5 NO 47 23.5 Total 200 100.0 Table 6.48: My business has grown over the past three years
Frequency Percent Valid YES 170 85.0 NO 30 15.0 Total 200 100.0 Table 6.49: The profit has been increasing over the past three years
Frequency Percent Valid YES 128 64.0 NO 72 36.0 Total 200 100.0

339
Table 6.50: I have been paying salaries and wages for at least three-and-a-half years
Frequency Percent Valid YES 186 93.0 NO 14 7.0 Total 200 100.0 Table 6.51: I make enough money to live comfortably
Frequency Percent Valid YES 137 68.5 NO 63 31.5 Total 200 100.0 Table 6.52: My business is employing more people now than two years ago
Frequency Percent Valid YES 119 59.5 NO 81 40.5 Total 200 100.0 Table 6.53: The turnover/sales of my business has/have increased over the past two years
Frequency Percent Valid YES 158 79.0 NO 42 21.0 Total 200 100.0 Table 6.54: My business is unsuccessful
Frequency Percent Valid YES 18 9.0 NO 182 91.0 Total 200 100.0
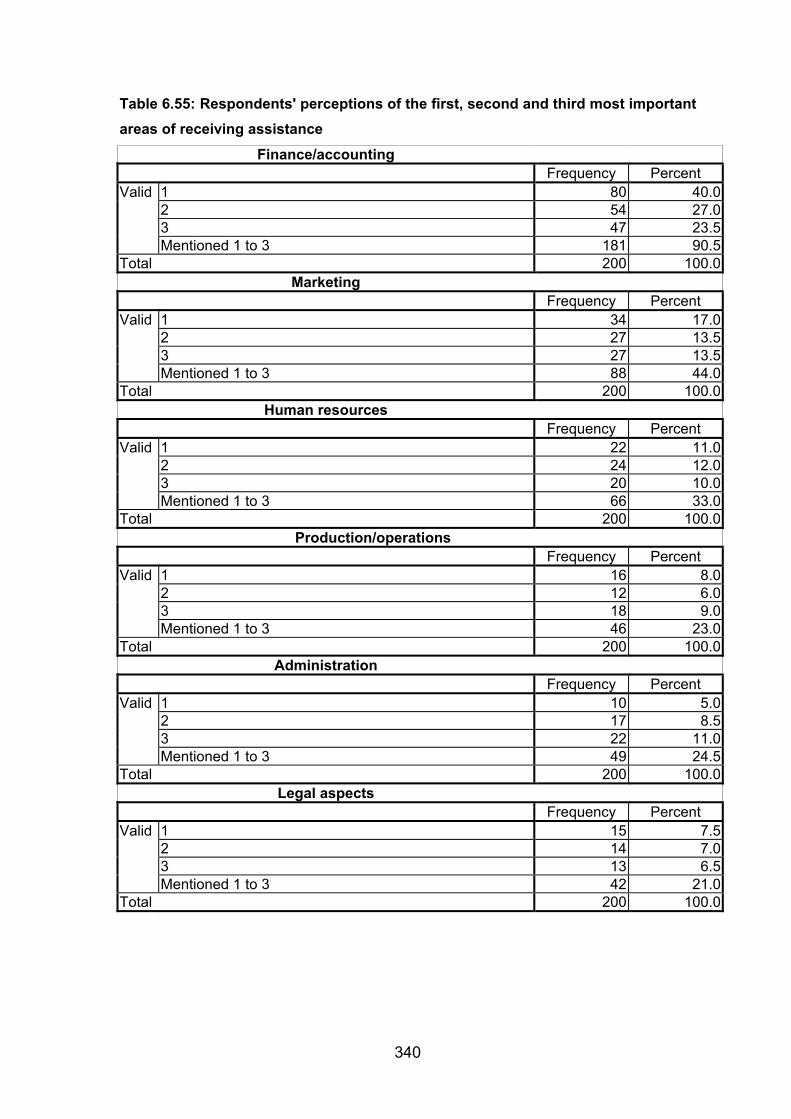
340
Table 6.55: Respondents' perceptions of the first, second and third most important areas of receiving assistance
Finance/accounting Frequency Percent Valid 1 80 40.0 2 54 27.0 3 47 23.5 Mentioned 1 to 3 181 90.5Total 200 100.0
Marketing Frequency Percent Valid 1 34 17.0 2 27 13.5 3 27 13.5 Mentioned 1 to 3 88 44.0Total 200 100.0
Human resources Frequency Percent Valid 1 22 11.0 2 24 12.0 3 20 10.0 Mentioned 1 to 3 66 33.0Total 200 100.0
Production/operations Frequency Percent Valid 1 16 8.0 2 12 6.0 3 18 9.0 Mentioned 1 to 3 46 23.0Total 200 100.0
Administration Frequency Percent Valid 1 10 5.0 2 17 8.5 3 22 11.0 Mentioned 1 to 3 49 24.5Total 200 100.0
Legal aspects Frequency Percent Valid 1 15 7.5 2 14 7.0 3 13 6.5 Mentioned 1 to 3 42 21.0Total 200 100.0

341
Health and safety
Frequency Percent Valid 1 9 4.5 2 18 9.0 3 14 7.0 Mentioned 1 to 3 41 20.5Total 200 100.0
Business plan Frequency Percent Valid 1 6 3.0 2 13 6.5 3 8 4.0 Mentioned 1 to 3 27 13.5Total 200 100.0
Systems Frequency Percent Valid 1 3 1.5 2 6 3.0 3 8 4.0 Mentioned 1 to 3 17 8.5Total 200 100.0
IT Frequency Percent Valid 1 3 1.5 2 5 2.5 3 9 4.5 Mentioned 1 to 3 17 8.5Total 200 100.0

342
Table 6.56: The different factors contributing to the success of the respondents' businesses
The type of product Frequency Percent Valid 1 65 32.5 2 45 22.5 3 38 19.0 Mentioned 1 to 3 148 74.0Total 200 100.0
Marketing Frequency Percent Valid 1 35 17.5 2 37 18.5 3 35 17.5 Mentioned 1 to 3 107 53.5Total 200 100.0
Your persistence Frequency Percent Valid 1 20 10.0 2 18 9.0 3 11 5.5 Mentioned 1 to 3 49 24.5Total 200 100.0
Good human relationships Frequency Percent Valid 1 20 10.0 2 14 7.0 3 20 10.0 Mentioned 1 to 3 54 27.0Total 200 100.0
The location of the business Frequency Percent Valid 1 14 7.0 2 19 9.5 3 22 11.0 Mentioned 1 to 3 55 27.5Total 200 100.0
Your involvement in the business Frequency Percent Valid 1 10 5.0 2 8 4.0 3 9 4.5 Mentioned 1 to 3 27 13.5Total 200 100.0

343
The needs of the community
Frequency Percent Valid 1 7 3.5 2 15 7.5 3 9 4.5 Mentioned 1 to 3 31 15.5Total 200 100.0
Financial management Frequency Percent Valid 1 5 2.5 2 7 3.5 3 10 5.0 Mentioned 1 to 3 22 11.0Total 200 100.0
Positive approach Frequency Percent Valid 1 4 2.0 2 1 0.5 3 8 4.0 Mentioned 1 to 3 13 6.5Total 200 100.0
Endurance to continue Frequency Percent Valid 1 2 1.0 2 6 3.0 3 11 5.5 Mentioned 1 to 3 19 9.5Total 200 100.0
The assistance you received or are receiving Frequency Percent Valid 1 1 0.5 3 3 1.5 Mentioned 1 to 3 4 2.0Total 200 100.0
Creativity Frequency Percent Valid 2 3 1.5 3 1 0.5 Mentioned 1 to 3 4 2.0Total 200 100.0

344
Other (Please specify)
Frequency Percent Valid 1 17 8.5 2 25 12.5 3 24 12.0 Mentioned 1 to 3 66 33.0Total 200 100.0 Table 6.57 The areas of assistance (section 1, question 5) and the success of the businesses (section 1, question 2) Split between Delight, Satisfaction and
Dissatisfaction with the success of his/her business Group Total
Delighted (3) Satisfied (3) Dissatisfied (4) n (2) % n (2) % n (2) % n (2) % Accounting (1)
1 9 47.4% 28 59.6% 2 25.0% 39 52.7%
2 6 31.6% 11 23.4% 5 62.5% 22 29.7% 3 4 21.1% 8 17.0% 1 12.5% 13 17.6%Group Total 19 100.0% 47 100.0% 8 100.0% 74 100.0%Table Total 58 100.0% 125 100.0% 17 100.0% 200 100.0%
Split between Delight, Satisfaction and
Dissatisfaction with the success of his/her business Group Total
Delighted Satisfied Dissatisfied n % n % n % n % Administration 1 2 11.1% 7 26.9% 1 20.0% 10 20.4% 2 7 38.9% 6 23.1% 4 80.0% 17 34.7% 3 9 50.0% 13 50.0% 22 44.9%Group Total 18 100.0% 26 100.0% 5 100.0% 49 100.0%Table Total 58 100.0% 125 100.0% 17 100.0% 200 100.0% Split between Delight, Satisfaction and
Dissatisfaction with the success of his/her business Group Total
Delighted Satisfied Dissatisfied n % n % n % n % Business plan 1 2 15.4% 4 28.6% 6 22.2% 2 7 53.8% 6 42.9% 13 48.1% 3 4 30.8% 4 28.6% 8 29.6%Group Total 13 100.0% 14 100.0% 27 100.0%Table Total 58 100.0% 125 100.0% 17 100.0% 200 100.0%

345
Split between Delight, Satisfaction and
Dissatisfaction with the success of his/her business Group Total
Delighted Satisfied Dissatisfied n % n % n % n % Finance 1 8 32.0% 28 49.1% 2 40.0% 38 43.7% 2 10 40.0% 16 28.1% 26 29.9% 3 7 28.0% 13 22.8% 3 60.0% 23 26.4%Group Total 25 100.0% 57 100.0% 5 100.0% 87 100.0%Table Total 58 100.0% 125 100.0% 17 100.0% 200 100.0%
Split between Delight, Satisfaction and
Dissatisfaction with the success of his/her business Group Total
Delighted Satisfied Dissatisfied n % n % n % n % Health and safety
1 5 35.7% 1 4.5% 3 60.0% 9 22.0%2 6 42.9% 11 50.0% 1 20.0% 18 43.9%
3 3 21.4% 10 45.5% 1 20.0% 14 34.1%Group Total 14 100.0% 22 100.0% 5 100.0% 41 100.0%Table Total 58 100.0% 125 100.0% 17 100.0% 200 100.0% Split between Delight, Satisfaction and
Dissatisfaction with the success of his/her business Group Total
Delighted Satisfied Dissatisfied n % n % n % n % Human resources
1 11 47.8% 9 23.1% 2 50.0% 22 33.3%2 6 26.1% 18 46.2% 24 36.4%
3 6 26.1% 12 30.8% 2 50.0% 20 30.3%Group Total 23 100.0% 39 100.0% 4 100.0% 66 100.0%Table Total 58 100.0% 125 100.0% 17 100.0% 200 100.0%
Split between Delight, Satisfaction and
Dissatisfaction with the success of his/her business Group Total
Delighted Satisfied Dissatisfied n % n % n % n % Insurance 1 1 20.0% 2 13.3% 3 15.0% 2 1 20.0% 5 33.3% 6 30.0% 3 3 60.0% 8 53.3% 11 55.0%Group Total 5 100.0% 15 100.0% 20 100.0%Table Total 58 100.0% 125 100.0% 17 100.0% 200 100.0%

346
Split between Delight, Satisfaction and
Dissatisfaction with the success of his/her business Group Total
Delighted Satisfied Dissatisfied n % n % n % n % IT 1 1 25.0% 1 9.1% 1 50.0% 3 17.6% 2 2 50.0% 3 27.3% 5 29.4% 3 1 25.0% 7 63.6% 1 50.0% 9 52.9%Group Total 4 100.0% 11 100.0% 2 100.0% 17 100.0%Table Total 58 100.0% 125 100.0% 17 100.0% 200 100.0% Split between Delight, Satisfaction and
Dissatisfaction with the success of his/her business Group Total
Delighted Satisfied Dissatisfied n % n % n % n % Legal aspects 1 6 60.0% 7 28.0% 2 28.6% 15 35.7% 2 1 10.0% 11 44.0% 2 28.6% 14 33.3% 3 3 30.0% 7 28.0% 3 42.9% 13 31.0%Group Total 10 100.0% 25 100.0% 7 100.0% 42 100.0%Table Total 58 100.0% 125 100.0% 17 100.0% 200 100.0%
Split between Delight, Satisfaction and
Dissatisfaction with the success of his/her business Group Total
Delighted Satisfied Dissatisfied n % n % n % n % Marketing 1 6 33.3% 10 33.3% 16 32.0% 2 5 27.8% 12 40.0% 17 34.0% 3 7 38.9% 8 26.7% 2 100.0% 17 34.0%Group Total 18 100.0% 30 100.0% 2 100.0% 50 100.0%Table Total 58 100.0% 125 100.0% 17 100.0% 200 100.0%
Split between Delight, Satisfaction and
Dissatisfaction with the success of his/her business Group Total
Delighted Satisfied Dissatisfied n % n % n % n % Product 1 1 50.0% 5 33.3% 6 31.6% 2 1 50.0% 5 33.3% 1 50.0% 7 36.8% 3 5 33.3% 1 50.0% 6 31.6%Group Total 2 100.0% 15 100.0% 2 100.0% 19 100.0%Table Total 58 100.0% 125 100.0% 17 100.0% 200 100.0%

347
Split between Delight, Satisfaction and
Dissatisfaction with the success of his/her business Group Total
Delighted Satisfied Dissatisfied n % n % n % n % Production/ Operations
1 1 14.3% 7 38.9% 2 100.0% 10 37.0%2 2 28.6% 3 16.7% 5 18.5%3 4 57.1% 8 44.4% 12 44.4%
Group Total 7 100.0% 18 100.0% 2 100.0% 27 100.0%Table Total 58 100.0% 125 100.0% 17 100.0% 200 100.0%
Split between Delight, Satisfaction and
Dissatisfaction with the success of his/her business Group Total
Delighted Satisfied Dissatisfied n % n % n % n % Sales 1 4 57.1% 10 47.6% 1 50.0% 15 50.0% 2 1 14.3% 6 28.6% 1 50.0% 8 26.7% 3 2 28.6% 5 23.8% 7 23.3%Group Total 7 100.0% 21 100.0% 2 100.0% 30 100.0%Table Total 58 100.0% 125 100.0% 17 100.0% 200 100.0%
Split between Delight, Satisfaction and
Dissatisfaction with the success of his/her business Group Total
Delighted Satisfied Dissatisfied n % n % n % n % Systems 2 1 100.0% 1 50.0% 3 1 100.0% 1 50.0%Group Total 1 100.0% 1 100.0% 2 100.0%Table Total 58 100.0% 125 100.0% 17 100.0% 200 100.0% Split between Delight, Satisfaction and
Dissatisfaction with the success of his/her business Group Total
Delighted Satisfied Dissatisfied n % n % n % n % Technology 1 3 30.0% 3 20.0% 2 2 50.0% 2 20.0% 1 100.0% 5 33.3% 3 2 50.0% 5 50.0% 7 46.7%Group Total 4 100.0% 10 100.0% 1 100.0% 15 100.0%Table Total 58 100.0% 125 100.0% 17 100.0% 200 100.0%

348
Split between Delight, Satisfaction and
Dissatisfaction with the success of his/her business Group Total
Delighted Satisfied Dissatisfied n % n % n % n % Research 1 2 28.6% 1 100.0% 3 37.5% 2 2 28.6% 2 25.0% 3 3 42.9% 3 37.5%Group Total 7 100.0% 1 100.0% 8 100.0%Table Total 58 100.0% 125 100.0% 17 100.0% 200 100.0%