An alternative to Red-Yellow-Green Board Reports -...
43
An alternative to Red-Yellow-Green Board Reports Dan Watson, MBA Valerie Craig, RN, MSN, MAOM Richard Scoville, PhD Tuesday, December 12 Session A9/B9
Transcript of An alternative to Red-Yellow-Green Board Reports -...
An alternative to Red-Yellow-GreenBoard ReportsDan Watson, MBA
Valerie Craig, RN, MSN, MAOM
Richard Scoville, PhD
Tuesday, December 12
Session A9/B9
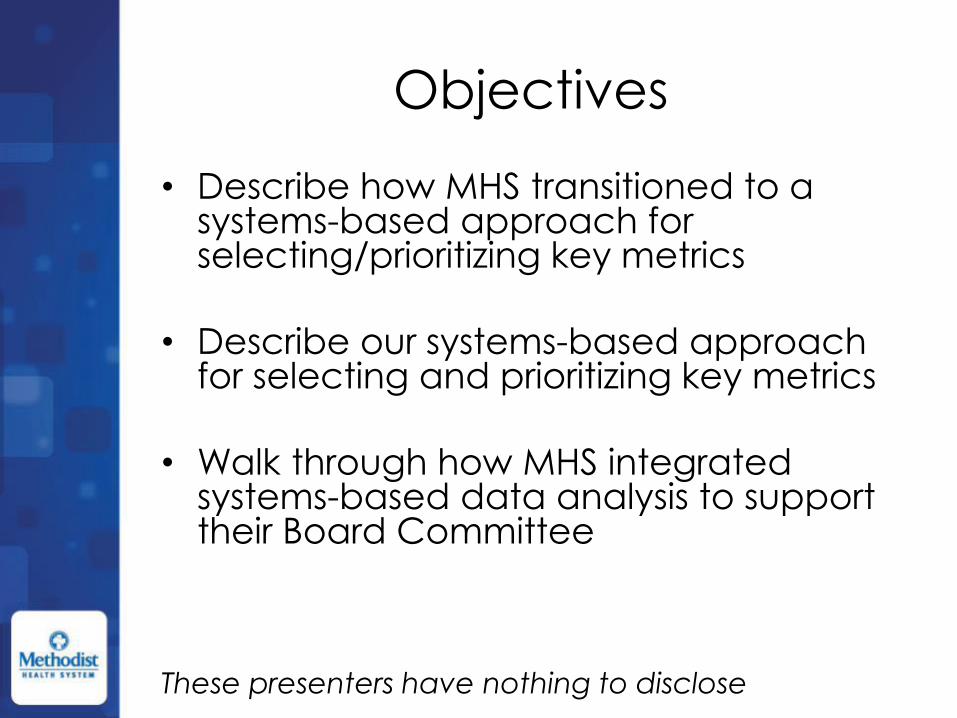
Objectives
• Describe how MHS transitioned to a systems-based approach for selecting/prioritizing key metrics
• Describe our systems-based approach for selecting and prioritizing key metrics
• Walk through how MHS integrated systems-based data analysis to support their Board Committee
These presenters have nothing to disclose

Methodist Health System
10 Hospitals
31 Family Health Centers
6 Ambulatory Sites (imaging, urgent care)
1,500 beds
3

About Methodist Health System • Founded in 1927
• 8,500+ employees
• 1,500+ physicians on staff
• 290+ affiliated physicians
• 536,000 patient visits
• $140 million in unreimbursed charity care
• One of Dallas Business Journal’s Top 10 “Best Places to Work” (13 years running)
• First and only member of the Mayo Clinic Care Network in Texas
Fellowships– Gastroenterology
– Nephrology
– Surgical critical care
– Hepato-pancreato-biliary surgery
Residencies– General surgery
– Internal medicine
– Obstetrics-gynecology
– Family medicine
4


in 2014
THE SYSTEM QUALITY REVIEW COMMITTEE


…to best quartile…


Who’s Who & Does it Matter?

Change to report
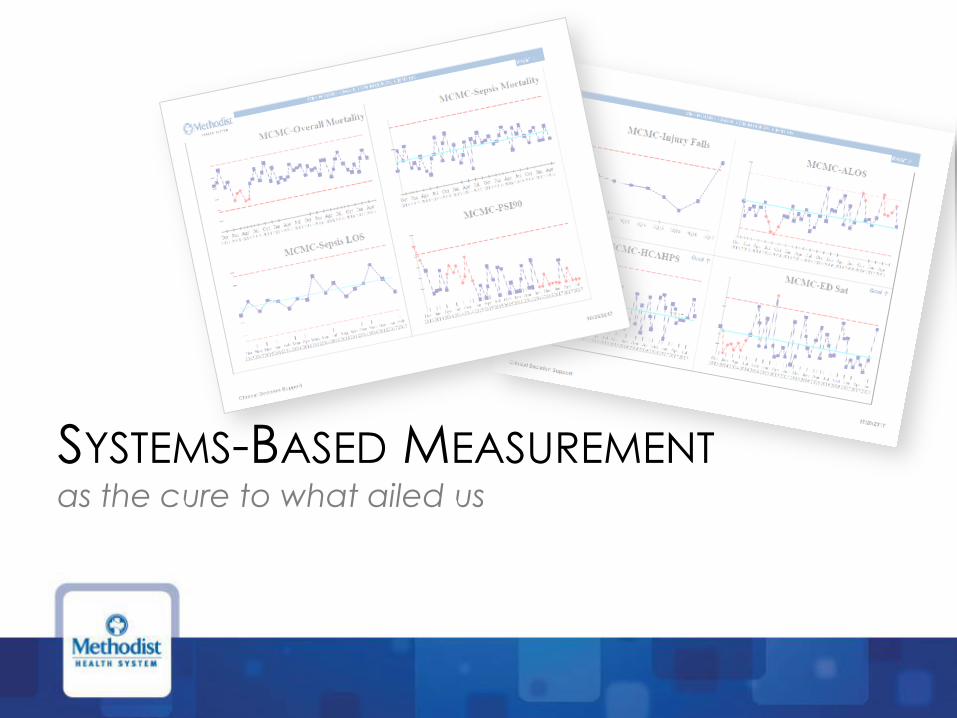
as the cure to what ailed us
SYSTEMS-BASED MEASUREMENT
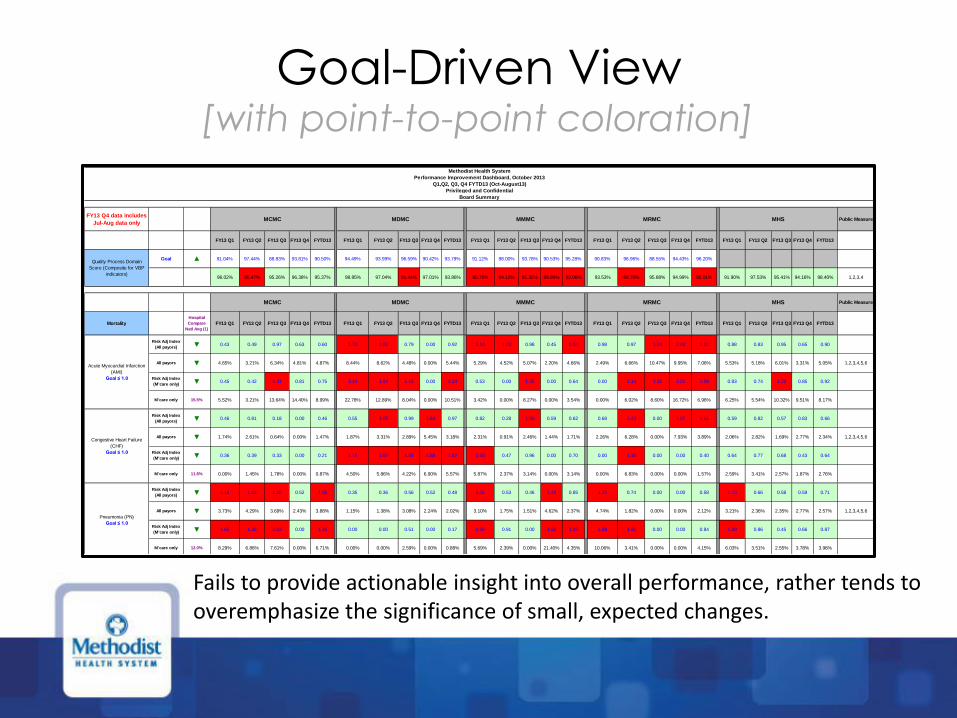
Goal-Driven View[with point-to-point coloration]
FY13 Q4 data includes
Jul-Aug data onlyPublic Measure
FY13 Q1 FY13 Q2 FY13 Q3 FY13 Q4 FYTD13 FY13 Q1 FY13 Q2 FY13 Q3 FY13 Q4 FYTD13 FY13 Q1 FY13 Q2 FY13 Q3 FY13 Q4 FYTD13 FY13 Q1 FY13 Q2 FY13 Q3 FY13 Q4 FYTD13 FY13 Q1 FY13 Q2 FY13 Q3 FY13 Q4 FYTD13
Goal ▲ 91.04% 97.44% 88.83% 93.81% 90.50% 94.49% 93.99% 96.59% 90.42% 93.79% 91.12% 98.00% 93.78% 90.53% 95.28% 90.83% 96.96% 88.55% 94.43% 96.20%
96.02% 95.47% 95.26% 96.38% 95.37% 98.85% 97.04% 91.44% 97.01% 93.86% 90.75% 94.12% 91.32% 89.99% 92.06% 93.53% 89.70% 95.88% 94.99% 92.01% 91.90% 97.53% 95.41% 94.16% 98.40% 1,2,3,4
Public Measure
Mortality
Hospital
Compare
Natl Avg (1)
FY13 Q1 FY13 Q2 FY13 Q3 FY13 Q4 FYTD13 FY13 Q1 FY13 Q2 FY13 Q3 FY13 Q4 FYTD13 FY13 Q1 FY13 Q2 FY13 Q3 FY13 Q4 FYTD13 FY13 Q1 FY13 Q2 FY13 Q3 FY13 Q4 FYTD13 FY13 Q1 FY13 Q2 FY13 Q3 FY13 Q4 FYTD13
Risk Adj Index
(All payors)▼ 0.43 0.49 0.97 0.63 0.60 1.73 1.02 0.79 0.00 0.92 1.14 1.24 0.98 0.45 1.04 0.98 0.97 1.34 2.48 1.32 0.88 0.83 0.95 0.65 0.90
All payors ▼ 4.65% 3.21% 6.34% 4.81% 4.87% 8.44% 8.62% 4.48% 0.00% 5.44% 5.29% 4.52% 5.07% 2.20% 4.66% 2.49% 6.66% 10.47% 9.95% 7.06% 5.53% 5.18% 6.01% 3.31% 5.05% 1,2,3,4,5,6
Risk Adj Index
(M'care only)▼ 0.45 0.42 1.41 0.81 0.75 3.14 1.04 1.16 0.00 1.24 0.53 0.00 1.35 0.00 0.64 0.00 1.14 1.32 3.21 1.59 0.83 0.74 1.28 0.85 0.92
M'care only 15.5% 5.52% 3.21% 13.64% 14.40% 8.99% 22.78% 12.89% 8.04% 0.00% 10.51% 3.42% 0.00% 8.27% 0.00% 3.54% 0.00% 6.02% 8.60% 16.72% 6.96% 6.25% 5.54% 10.32% 9.51% 8.17%
Risk Adj Index
(All payors)▼ 0.46 0.81 0.18 0.00 0.46 0.55 1.05 0.99 1.63 0.97 0.82 0.28 1.00 0.59 0.62 0.68 1.43 0.00 1.67 1.11 0.59 0.82 0.57 0.83 0.66
All payors ▼ 1.74% 2.61% 0.64% 0.00% 1.47% 1.87% 3.31% 2.89% 5.45% 3.18% 2.31% 0.91% 2.46% 1.44% 1.71% 2.26% 6.28% 0.00% 7.93% 3.89% 2.06% 2.82% 1.69% 2.77% 2.34% 1,2,3,4,5,6
Risk Adj Index
(M'care only)▼ 0.36 0.39 0.33 0.00 0.21 1.16 1.57 1.24 1.88 1.52 1.43 0.47 0.96 0.00 0.70 0.00 1.15 0.00 0.00 0.40 0.64 0.77 0.68 0.43 0.64
M'care only 11.6% 0.00% 1.45% 1.78% 0.00% 0.87% 4.50% 5.86% 4.22% 6.90% 5.57% 5.87% 2.37% 3.14% 0.00% 3.14% 0.00% 6.83% 0.00% 0.00% 1.57% 2.59% 3.41% 2.57% 1.87% 2.76%
Risk Adj Index
(All payors)▼ 1.18 1.02 1.20 0.52 1.06 0.35 0.36 0.56 0.52 0.48 1.36 0.53 0.46 1.19 0.85 1.38 0.74 0.00 0.00 0.58 1.10 0.66 0.58 0.59 0.71
All payors ▼ 3.73% 4.29% 3.69% 2.43% 3.88% 1.15% 1.38% 3.08% 2.24% 2.02% 3.10% 1.75% 1.51% 4.62% 2.37% 4.74% 1.82% 0.00% 0.00% 2.12% 3.21% 2.36% 2.35% 2.77% 2.57% 1,2,3,4,5,6
Risk Adj Index
(M'care only)▼ 1.65 1.25 1.63 0.00 1.16 0.00 0.00 0.51 0.00 0.17 1.95 0.91 0.00 1.93 1.03 1.88 1.08 0.00 0.00 0.84 1.39 0.86 0.45 0.66 0.87
M'care only 12.0% 8.29% 6.86% 7.61% 0.00% 6.71% 0.00% 0.00% 2.59% 0.00% 0.88% 5.69% 2.39% 0.00% 21.40% 4.35% 10.06% 3.41% 0.00% 0.00% 4.15% 6.03% 3.51% 2.55% 3.78% 3.96%
MCMC
Congestive Heart Failure
(CHF)
Goal ≤ 1.0
Acute Myocardial Infarction
(AMI)
Goal ≤ 1.0
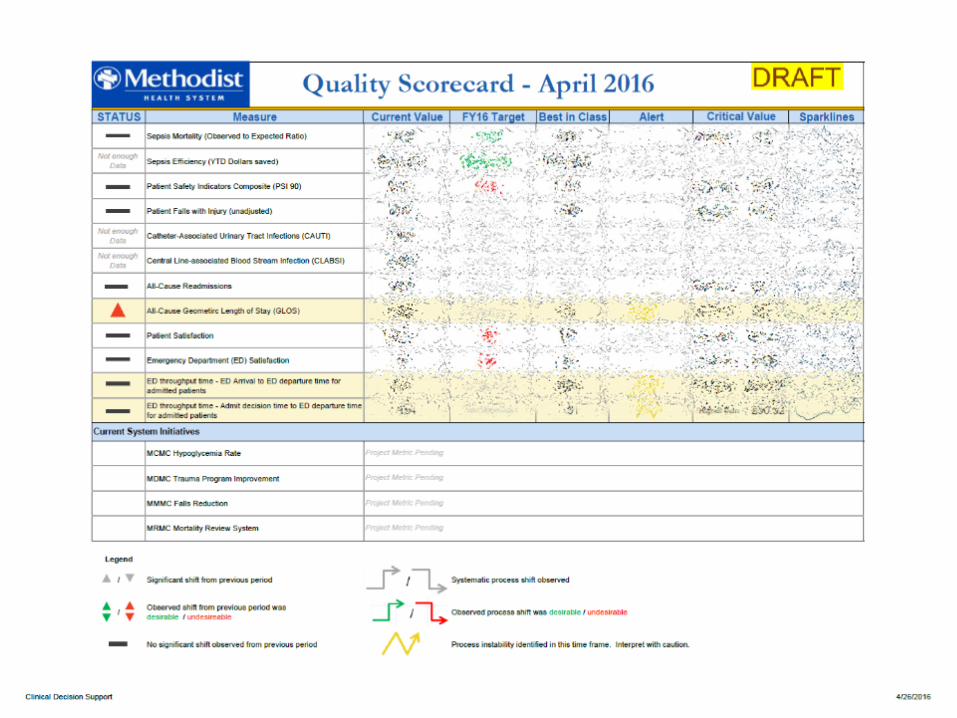
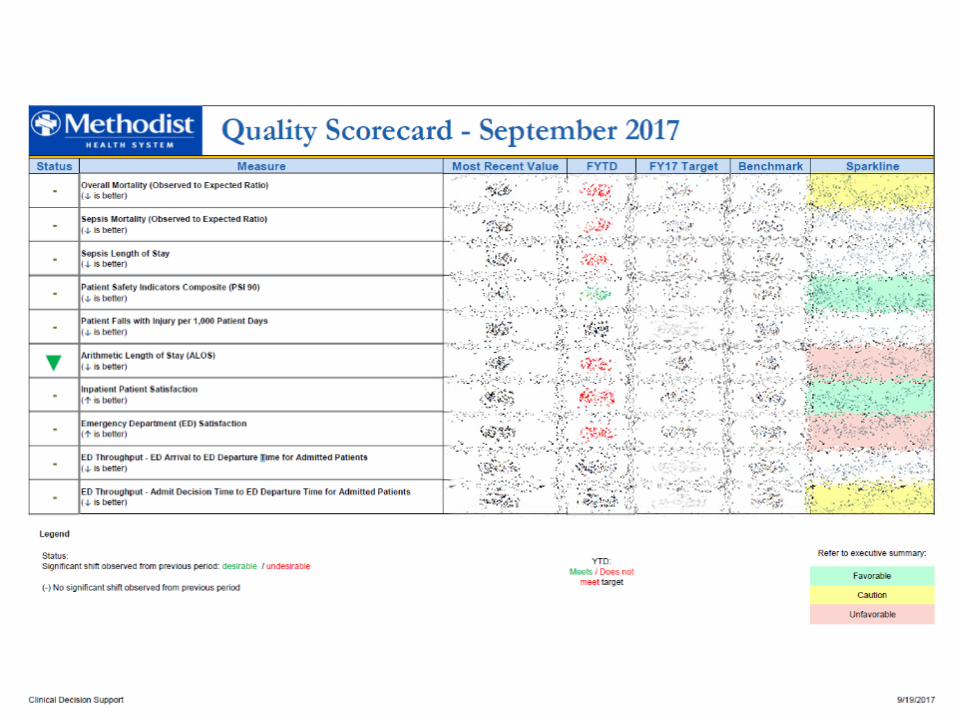
Methodist Health System
Performance Improvement Dashboard, October 2013
Privileged and Confidential
Board Summary
Q1,Q2, Q3, Q4 FYTD13 (Oct-August13)
MDMC
Quality Process Domain
Score (Composite for VBP
indicators)
MHSMMMC MRMC
MMMC MRMC
Pneumonia (PN)
Goal ≤ 1.0
MCMC
MHSMDMC
Fails to provide actionable insight into overall performance, rather tends to overemphasize the significance of small, expected changes.
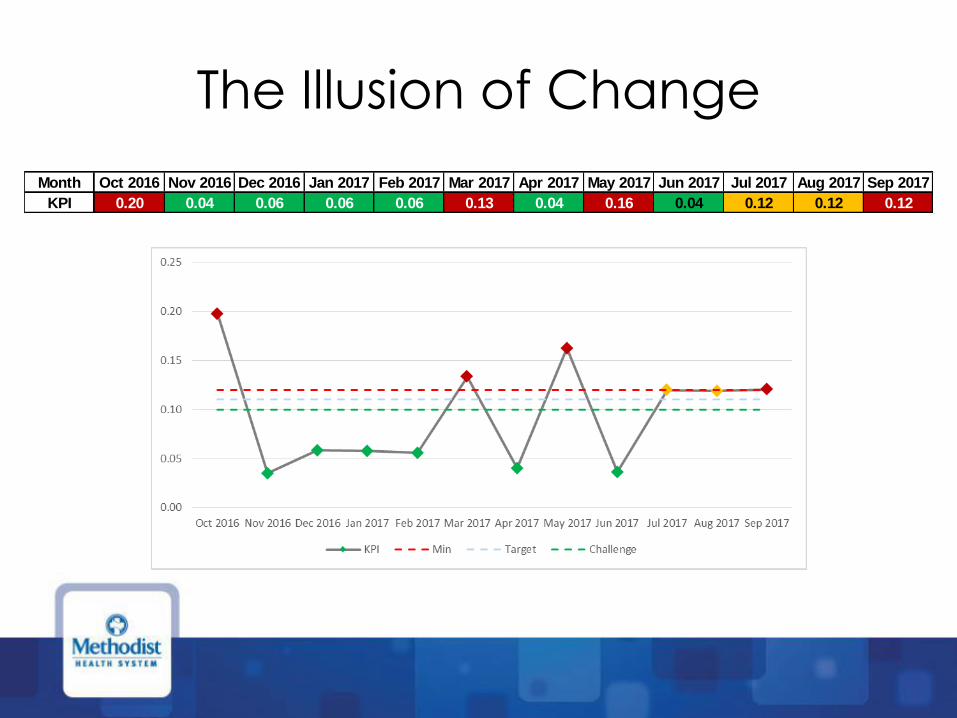
The Illusion of Change
Month Oct 2016 Nov 2016 Dec 2016 Jan 2017 Feb 2017 Mar 2017 Apr 2017 May 2017 Jun 2017 Jul 2017 Aug 2017 Sep 2017
KPI 0.20 0.04 0.06 0.06 0.06 0.13 0.04 0.16 0.04 0.12 0.12 0.12

Expected Variation is Not Difficult

Making decisions based on expected
variation can be intuitive

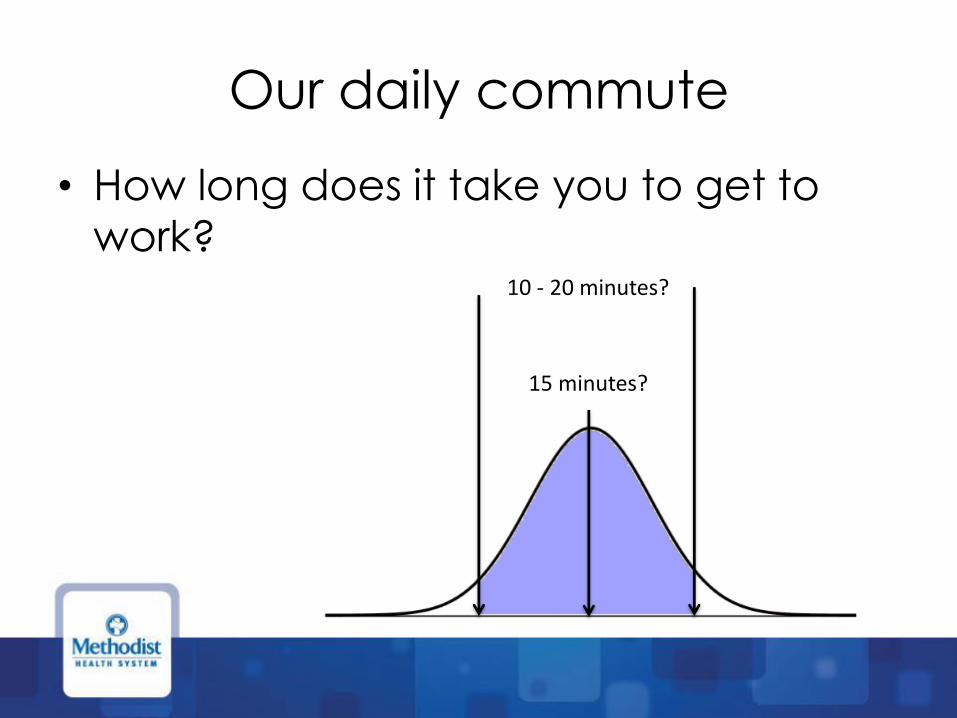
Our daily commute
• How long does it take you to get to
work?
15 minutes?
10 - 20 minutes?
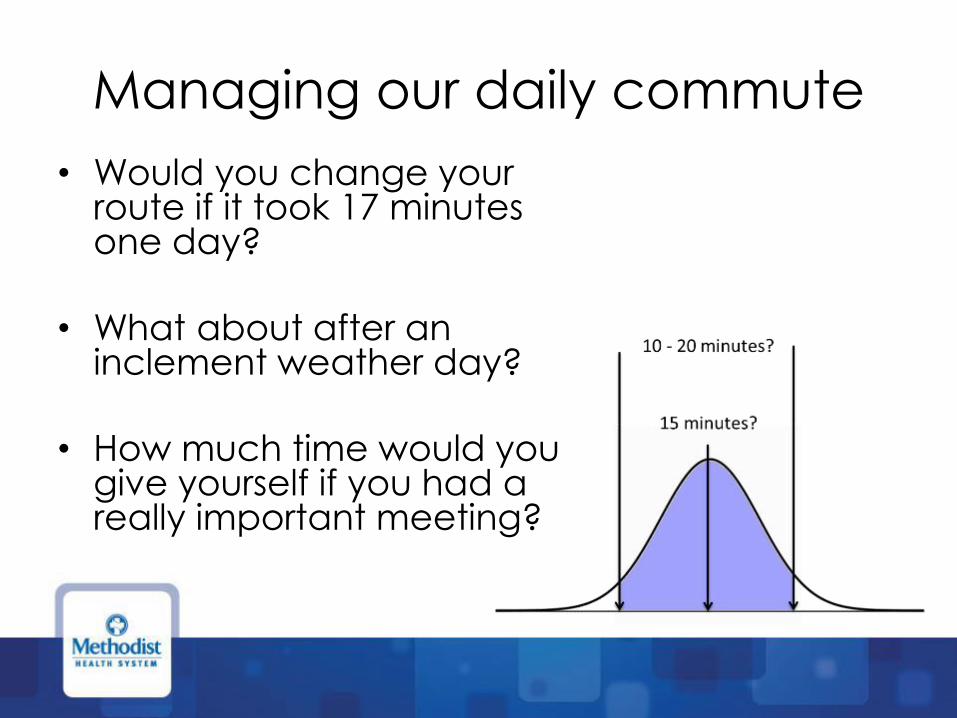
• Would you change your route if it took 17 minutes one day?
• What about after an inclement weather day?
• How much time would you give yourself if you had a really important meeting?
Managing our daily commute

“No different” is an acceptable &
actionable conclusion


Math to the Rescue!
The “Swiss Army Knife”
of Control Charts
Ask not what your
chart can do for you,
but what you can do
with your chart
Don’t waste too much time
on tools and techniques. You
can learn the lot in 15
minutes
~Dr. Deming [from David Kerridge]
The value of the
data
doesn’t come
from the chart…
it comes from
how we use it.

patience, picked battles, and persistence on process
THE PATH TOWARDS OUR SOLUTION

A woodsman was once asked,
“What would you do if you had just five minutes to chop down a tree?”
“I would spend the first two and a half minutes sharpening my axe.”

Simple ≠ Summary
• Summarizing can obscure useful info
• But we can describe complexity simply
• We can differentiate performance to goal from system performance
Also, it’s 5*

Prioritize Performance
• Remove items we’re not working on
• Support System Performance over
Point-to-Point Comparison
• Define data well, but as reference
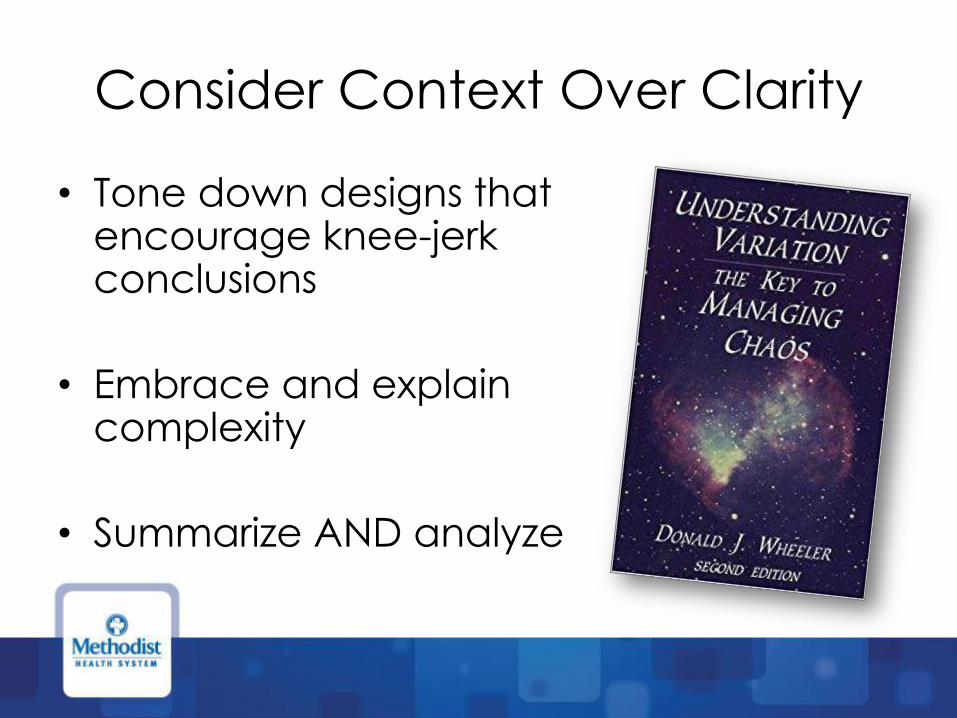
Consider Context Over Clarity
• Tone down designs that encourage knee-jerk conclusions
• Embrace and explain complexity
• Summarize AND analyze
Accentuate Action
• Prioritize key system initiatives
• Recognize hard work
• Avoid sharing effects without causes
First pass…
Current
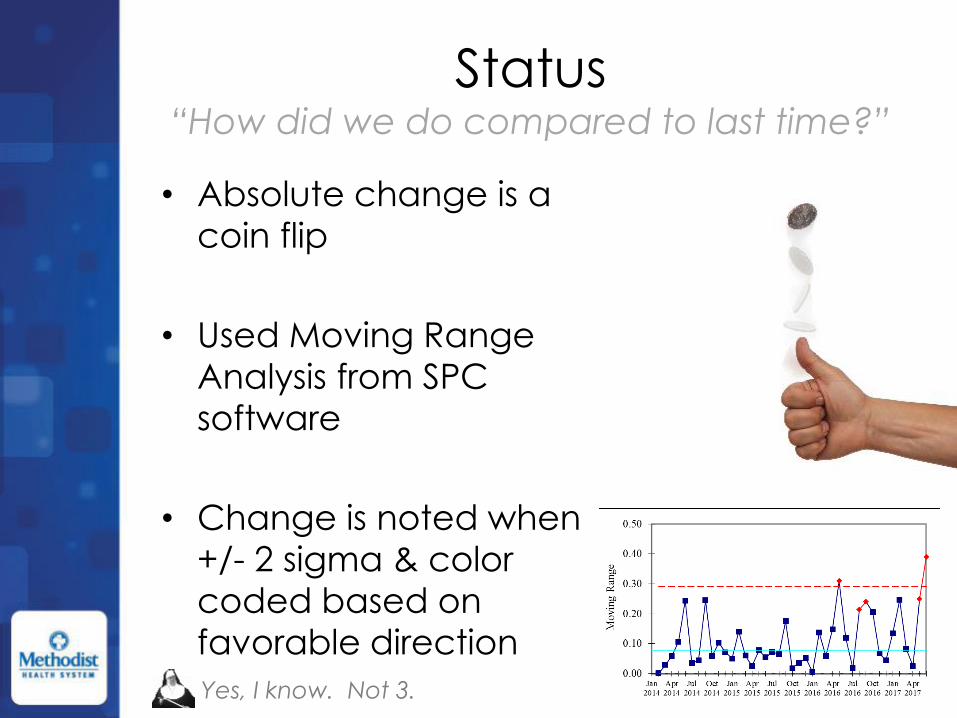
Status“How did we do compared to last time?”
• Absolute change is a
coin flip
• Used Moving Range
Analysis from SPC
software
• Change is noted when
+/- 2 sigma & color
coded based on
favorable direction
Yes, I know. Not 3.
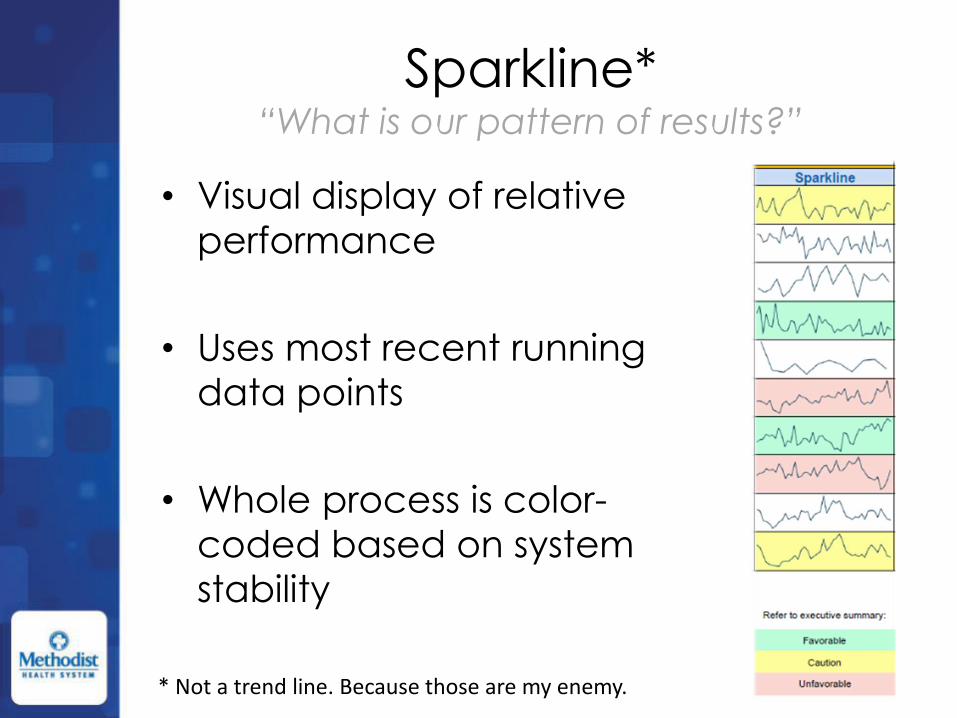
Sparkline*“What is our pattern of results?”
• Visual display of relative
performance
• Uses most recent running
data points
• Whole process is color-
coded based on system
stability
* Not a trend line. Because those are my enemy.
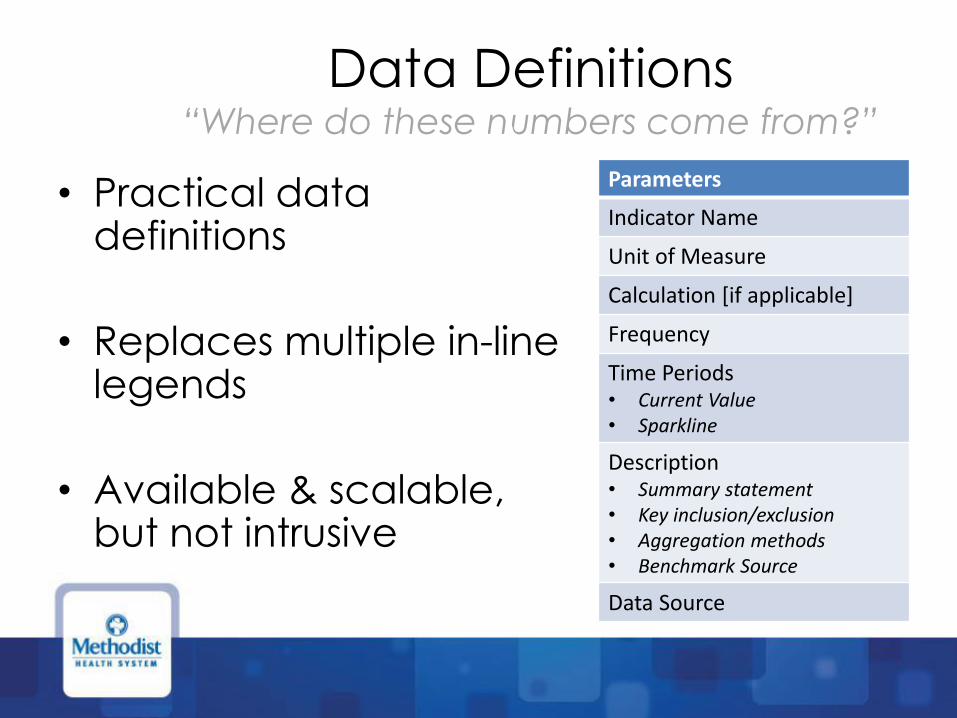
• Practical data definitions
• Replaces multiple in-line legends
• Available & scalable, but not intrusive
Parameters
Indicator Name
Unit of Measure
Calculation [if applicable]
Frequency
Time Periods• Current Value • Sparkline
Description• Summary statement• Key inclusion/exclusion• Aggregation methods• Benchmark Source
Data Source
Data Definitions“Where do these numbers come from?”
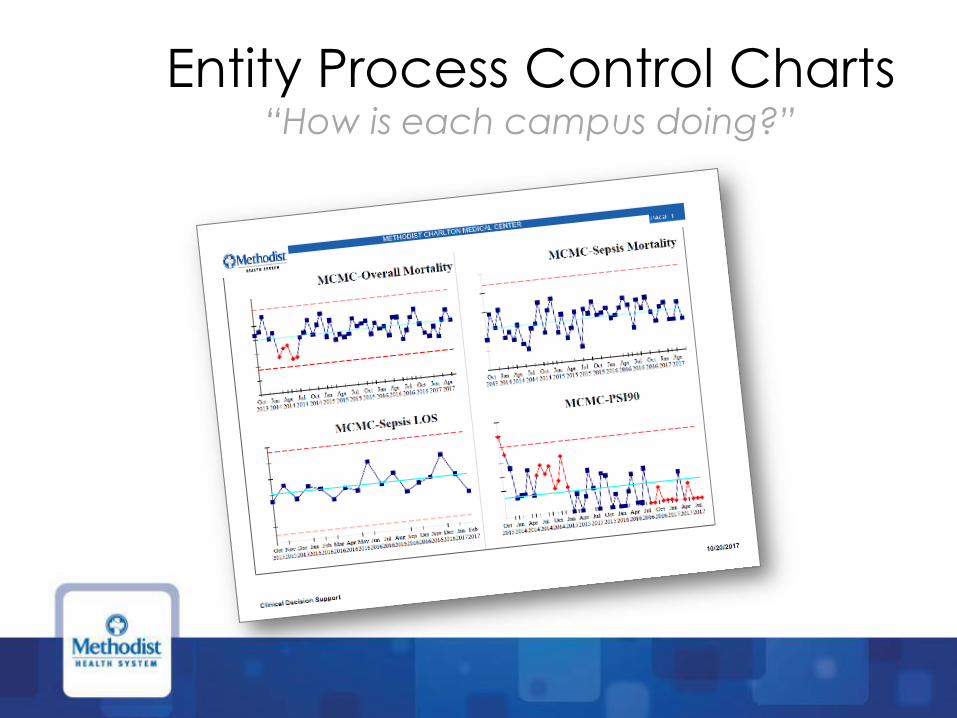
Entity Process Control Charts“How is each campus doing?”

The cutting room floor…
• You say ‘trend’, I say ‘shift.’ Let’s call the whole thing off
• Special cause is special causeYour fancy symbols don’t impress me
• Critical Values Managing KPI like lab values
was a bridge too far
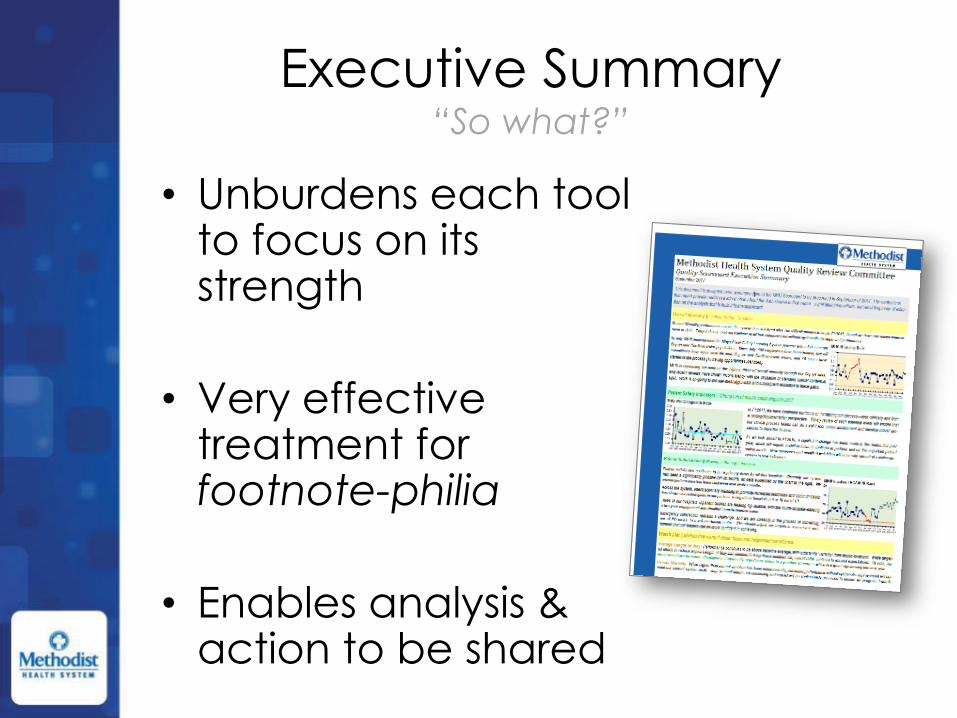
Executive Summary“So what?”
• Unburdens each tool to focus on its strength
• Very effective treatment for footnote-philia
• Enables analysis & action to be shared
Lessons Learned
• Simple is hard
• Focus on your
stakeholders’ end goal
• Be patient and ready to compromise
Next Steps
• Center line assessment
• Routine re-assessment of content
• Bring Balance