An Agriculture Economy interaction Model for … Full Paper.pdf · An Agriculture Economy...
22
1 An Agriculture Economy interaction Model for Egypt “Analysis of the Proposed Free Trade Agreement with USA” Motaz Khorshid Professor, Cairo University Former Minister of Higher Education and State for Scientific Research Cairo, Egypt Mobile: + (20122)2440988 Mail: [email protected] Saad Nassar Professor, Cairo University Mobile: + (20122)2159790 Mail: [email protected] Victor Shaker Lecturer, Cairo University Mobile: + (20122)5935577 Mail: [email protected] International Conference on Economic Modeling (EcoMod2016) Portugal, July 6-8, 2016
Transcript of An Agriculture Economy interaction Model for … Full Paper.pdf · An Agriculture Economy...
1
An Agriculture Economy interaction Model for Egypt
“Analysis of the Proposed Free Trade Agreement
with USA”
Motaz Khorshid
Professor, Cairo University
Former Minister of Higher Education
and State for Scientific Research
Cairo, Egypt
Mobile: + (20122)2440988
Mail: [email protected]
Saad Nassar
Professor, Cairo University
Mobile: + (20122)2159790
Mail: [email protected]
Victor Shaker
Lecturer, Cairo University
Mobile: + (20122)5935577
Mail: [email protected]
International Conference on
Economic Modeling (EcoMod2016)
Portugal, July 6-8, 2016
2
Introduction Free Trade Agreements (FTA) have become a common feature of the current global
trading system. They proved to be an important policy to widen markets and strengthen trade and investment relations under the umbrella of the world trade organization (WTO). They go further however beyond what is agreed upon in WTO in many respects.
The purpose of this research paper is to assess the economy wide consequences of the proposed FTA between Egypt and the United States, which represents an important stepping stone towards a regional free trade agreement with the countries of the Middle East and North Africa (MENA) within the United States bilateral negotiation.
Preferential trade agreements, such as FTAs, have both negative and positive effects, therefore they are known as “second-best” initiatives; thus, entering into FTAs is a serious matter for a developing country. An assessment of benefits and estimation of the costs should be undertaken by each country before concluding the negotiations. Although the Egyptian economy has witnessed significant progress in some development areas, evidences indicate that Egypt is in a pressing need to strengthen the environment of international trade and foreign direct investments.
Unlike the previous studies, which are mainly based on qualitative analysis, partial equilibrium or general equilibrium static models, the current research relies on dynamic computable general equilibrium (CGE) modeling tradition that captures the interaction between the agriculture sector and the rest of the economy in a consistent and comprehensive manner along with an enhanced inter-period dynamic mechanism.
The paper is organized around five sections. Section one, outlines the main characteristics and specific feature of Egypt-USA free trade agreement. Section two, introduces the structure, components and disaggregation level of the issue-specific social accounting matrix (SAM) for Egypt. In Section three, the economic rationale and mathematical specification of the agriculture economy wide interaction model are explained. Section four summarizes the policy experiments based on the developed model. Finally, the last section outlines the findings and suggests policy recommendations in light of the experimental results of the model. The main features of Egypt-USA free trade agreement
The proposed FTA between Egypt and The United States is similar to recent agreements concluded with some MENA countries and has three basic parts; removing most of tariffs in the bilateral trade, broad commitments to open markets and provisions to support those commitments and protections for labor and the environment. With respect to market access, it suggests that Egypt and The United States should provide immediate duty-free access for all trade between them. Under deep agreement however, both countries should remove non-tariff barriers.
In addition, the proposed agreement is expected to contain broad commitments to open markets in sectors such as banking, insurance, securities, and telecommunications. Furthermore, it will also include protections for investors and intellectual property rights in addition to transparent Sanitary measures, government
3
procurement disciplines, streamlined and transparent customs procedures, commitments to combat bribery and tools to enforce the trade agreement. Concerning labor and environmental Protections, each government is required to effectively enforce its own laws in order to attract trade and investment.
It is noteworthy that the parties to a free-trade agreement can in fact determine what the content of the agreement should be, as long as the outcome is in conformity with the WTO rules. An Agriculture Economy Interaction Social Accounting Matrix
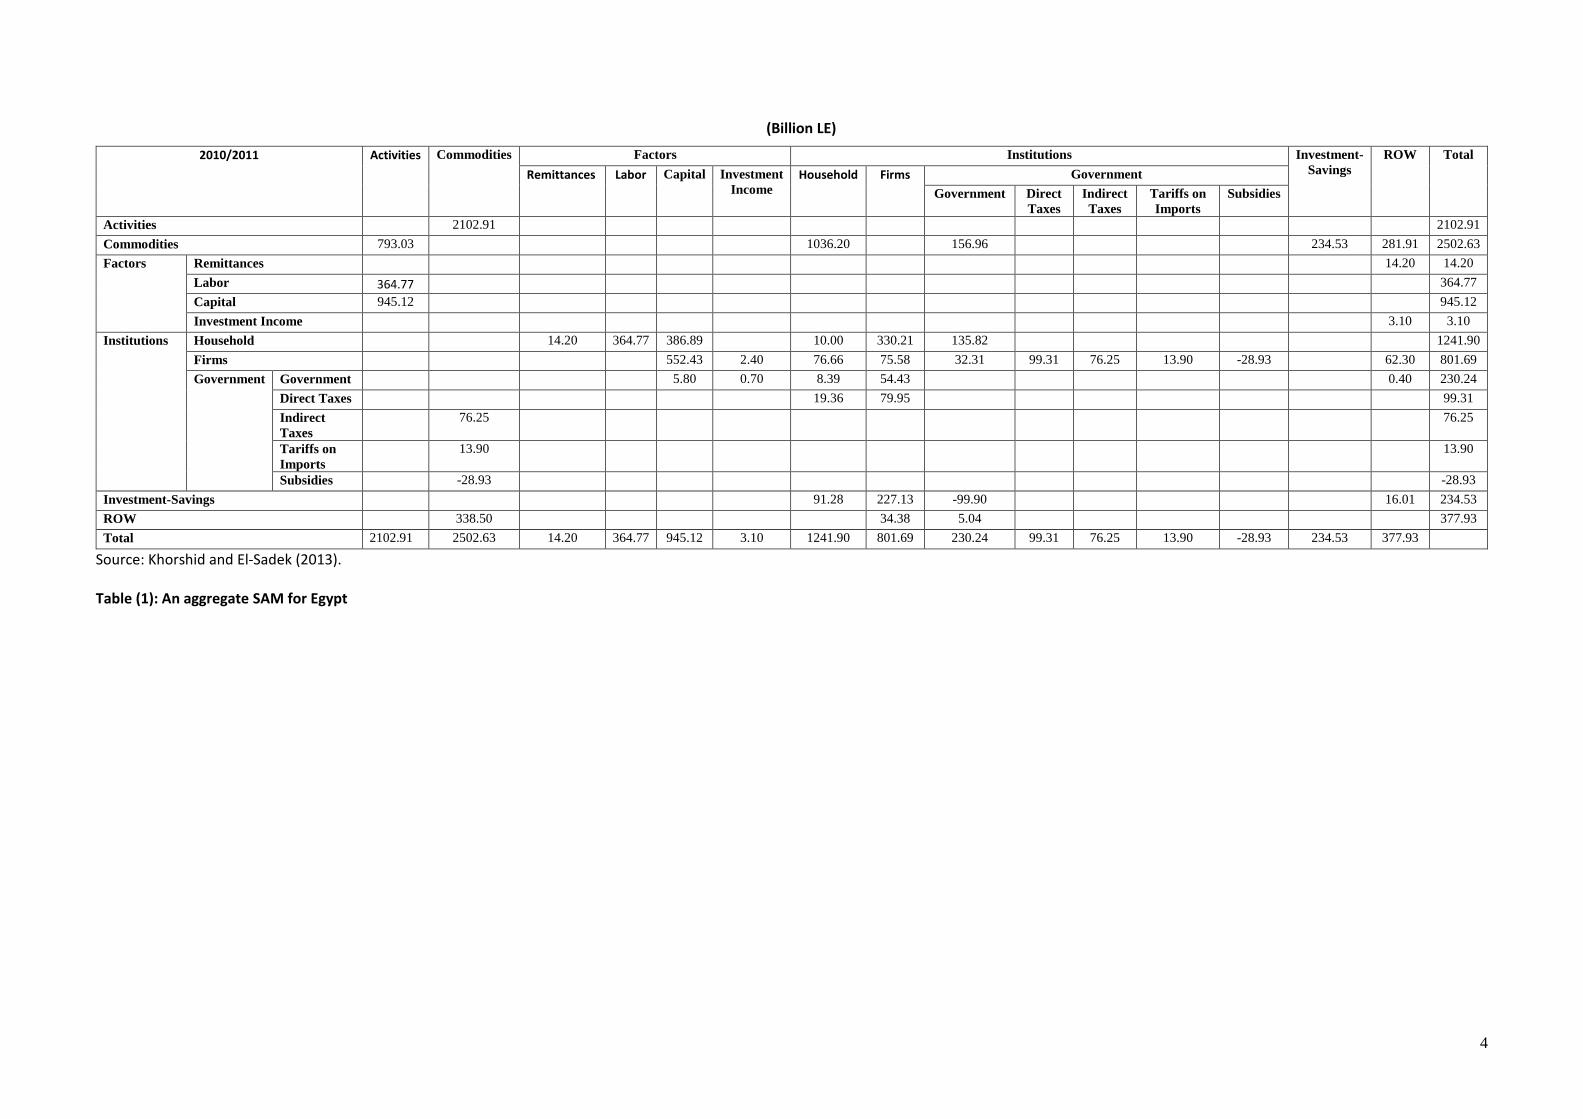
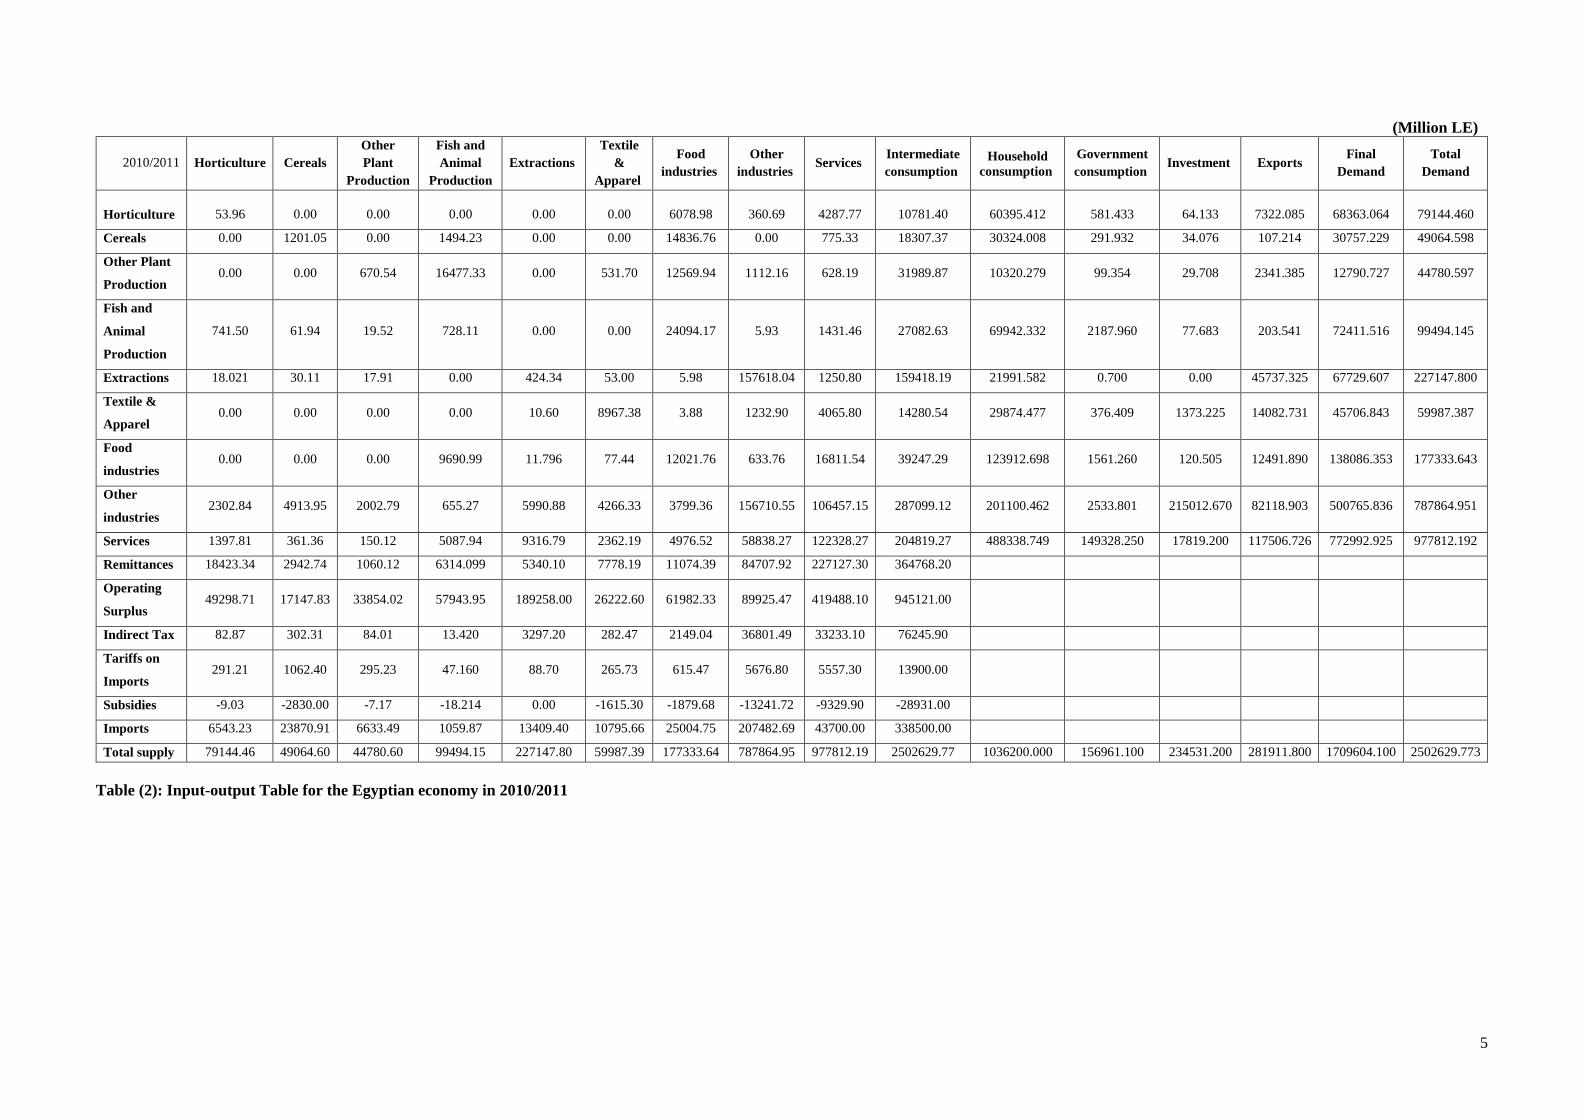
An aggregate version of SAM for Egypt - constructed by Khorshid and El- sadek (2013) – is shown in Table (1). In order to achieve the analytical purpose of the paper and capture the interaction among the agriculture sector and the rest of the economy, the agriculture activity and commodity is disaggregated into four sectors (Horticulture, cereals, other plant production and animal &fish production). Other activities of the economy are divided into sectors relevant to the agricultural sectors such as textile & Apparel, food industries and other industries. Based on the above rationale, an Input-output table is constructed (Table (2)).
In addition, the commodity accounts in the SAM are grouped into four types (composite, domestic, imported and exported) with each divided according to the production activities, Factors are represented in the SAM by two accounts; labor compensation and capital services. They are further disaggregated by economic sector and production activity. The economy includes three domestic institutions; households, firms and government. The government is broken down into five accounts. One account for general government income and spending and three tax accounts (direct, indirect and import taxes) in addition to one subsidy account.
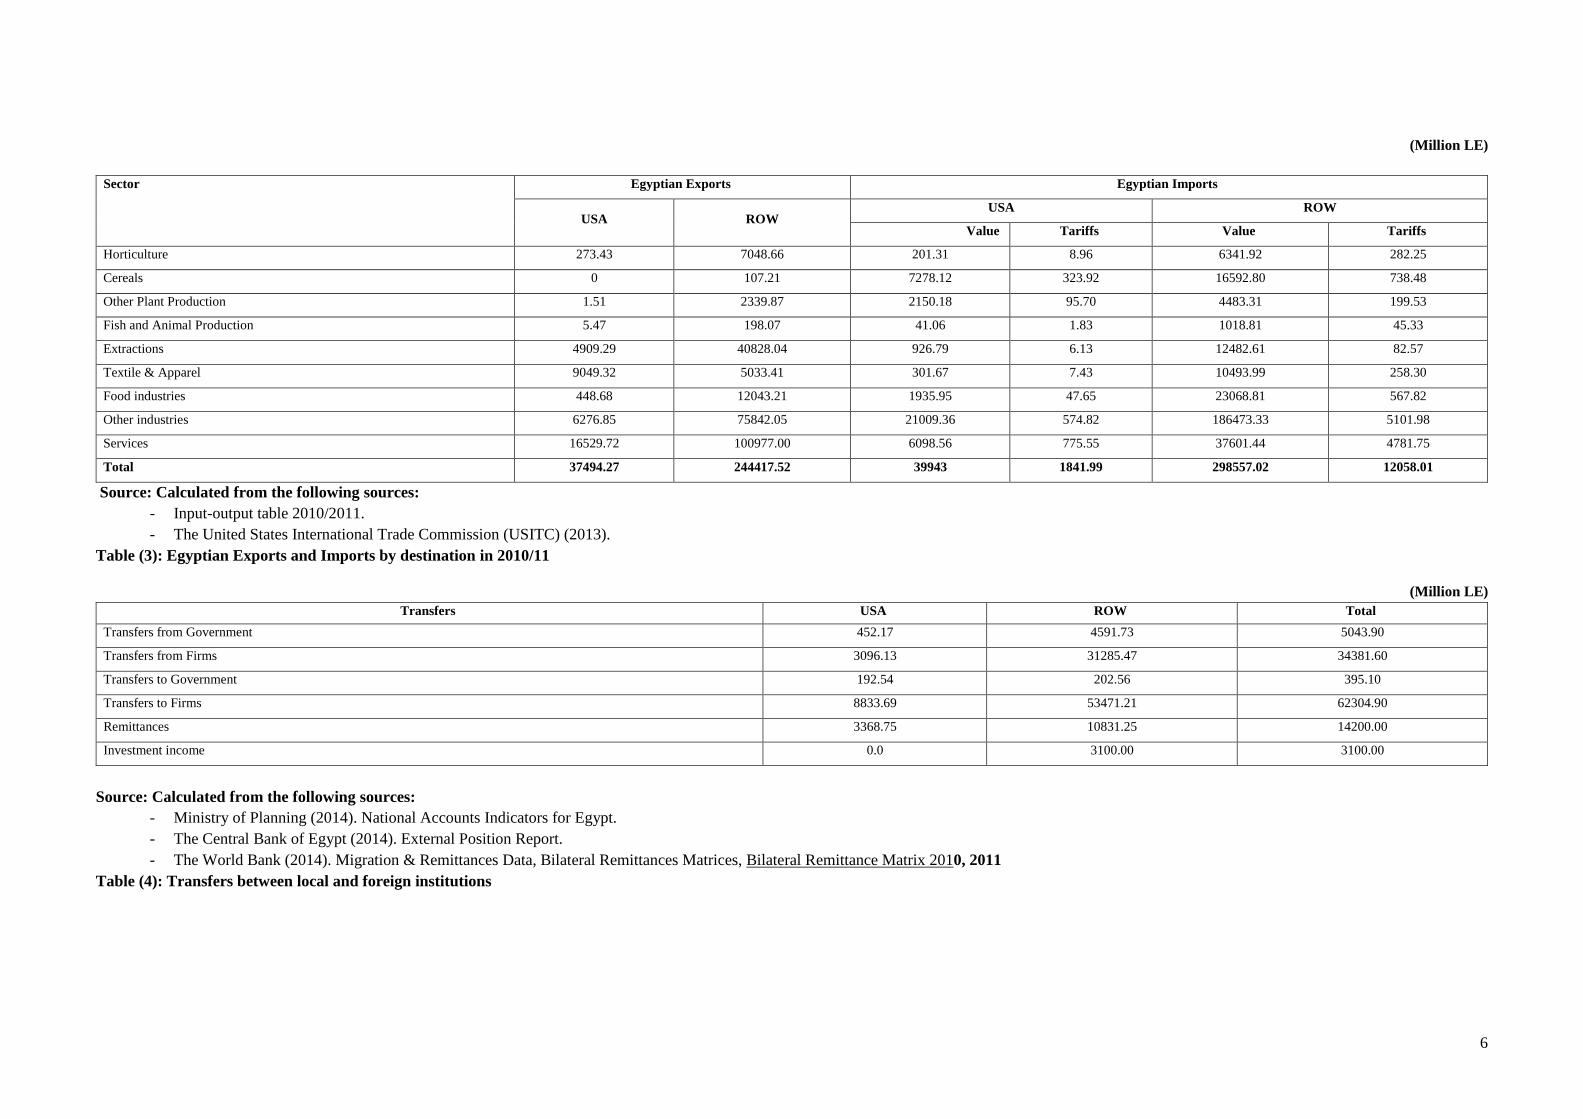
Finally, the SAM includes a capital account representing savings of domestic institutions and investment spending. Again, to meet the analytical purposes of the model, the SAM includes two accounts for the rest-of-world (the United States and other countries of the world). Foreign trade and current transfers with the rest of the world are broken down using the available data presented in tables (3),(4) .In total, the SAM used in the model consists of 107 accounts and 297 cells. It is constructed for the fiscal year 2010/2011 and it is computed in LE millions.
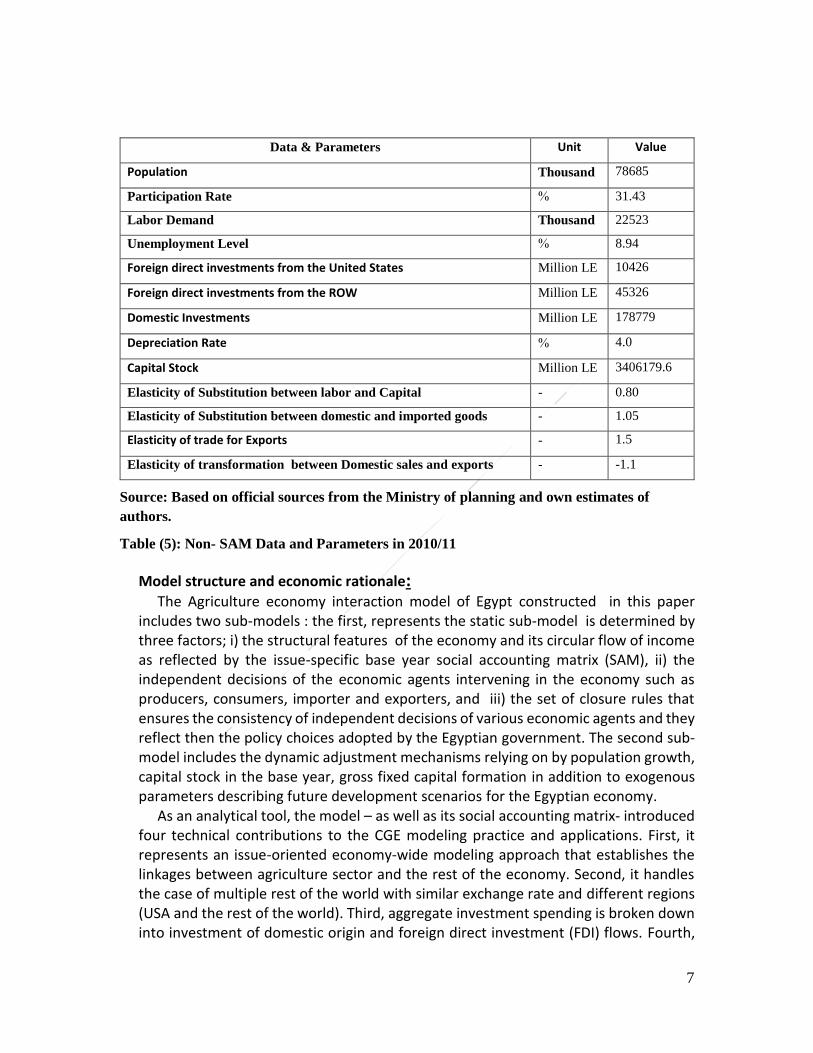
Besides the constructed SAM, There is a pressing need for additional data and parameters for model calibration and estimation. Table (5) shows the most important data and information in this regard. It is also noteworthy that the total investments in the economy are divided into domestic investment and foreign direct investment.
4
(Billion LE)
Source: Khorshid and El-Sadek (2013). Table (1): An aggregate SAM for Egypt
2010/2011 Activities Commodities Factors Institutions Investment-
Savings
ROW Total
Remittances Labor Capital
Investment
Income
Household Firms Government
Government Direct
Taxes Indirect
Taxes Tariffs on
Imports Subsidies
Activities 2102.91 2102.91
Commodities 793.03 1036.20 156.96 234.53 281.91 2502.63
Factors Remittances 14.20 14.20
Labor 364.77 364.77
Capital 945.12 945.12
Investment Income 3.10 3.10
Institutions Household 14.20 364.77 386.89 10.00 330.21 135.82 1241.90
Firms 552.43 2.40 76.66 75.58 32.31 99.31 76.25 13.90 -28.93 62.30 801.69
Government Government 5.80 0.70 8.39 54.43 0.40 230.24
Direct Taxes 19.36 79.95 99.31
Indirect
Taxes
76.25 76.25
Tariffs on
Imports
13.90 13.90
Subsidies -28.93 -28.93
Investment-Savings 91.28 227.13 -99.90 16.01 234.53
ROW 338.50 34.38 5.04 377.93
Total 2102.91 2502.63 14.20 364.77 945.12 3.10 1241.90 801.69 230.24 99.31 76.25 13.90 -28.93 234.53 377.93
5
(Million LE)
2010/2011 Horticulture Cereals
Other
Plant
Production
Fish and
Animal
Production
Extractions
Textile
&
Apparel
Food
industries
Other
industries Services
Intermediate
consumption
Household
consumption
Government
consumption Investment Exports
Final
Demand
Total
Demand
Horticulture 53.96 0.00 0.00 0.00 0.00 0.00 6078.98 360.69 4287.77 10781.40 60395.412 581.433 64.133 7322.085 68363.064 79144.460
Cereals 0.00 1201.05 0.00 1494.23 0.00 0.00 14836.76 0.00 775.33 18307.37 30324.008 291.932 34.076 107.214 30757.229 49064.598
Other Plant
Production 0.00 0.00 670.54 16477.33 0.00 531.70 12569.94 1112.16 628.19 31989.87 10320.279 99.354 29.708 2341.385 12790.727 44780.597
Fish and
Animal
Production
741.50 61.94 19.52 728.11 0.00 0.00 24094.17 5.93 1431.46 27082.63 69942.332 2187.960 77.683 203.541 72411.516 99494.145
Extractions 18.021 30.11 17.91 0.00 424.34 53.00 5.98 157618.04 1250.80 159418.19 21991.582 0.700 0.00 45737.325 67729.607 227147.800
Textile &
Apparel 0.00 0.00 0.00 0.00 10.60 8967.38 3.88 1232.90 4065.80 14280.54 29874.477 376.409 1373.225 14082.731 45706.843 59987.387
Food
industries 0.00 0.00 0.00 9690.99 11.796 77.44 12021.76 633.76 16811.54 39247.29 123912.698 1561.260 120.505 12491.890 138086.353 177333.643
Other
industries 2302.84 4913.95 2002.79 655.27 5990.88 4266.33 3799.36 156710.55 106457.15 287099.12 201100.462 2533.801 215012.670 82118.903 500765.836 787864.951
Services 1397.81 361.36 150.12 5087.94 9316.79 2362.19 4976.52 58838.27 122328.27 204819.27 488338.749 149328.250 17819.200 117506.726 772992.925 977812.192
Remittances 18423.34 2942.74 1060.12 6314.099 5340.10 7778.19 11074.39 84707.92 227127.30 364768.20
Operating
Surplus 49298.71 17147.83 33854.02 57943.95 189258.00 26222.60 61982.33 89925.47 419488.10 945121.00
Indirect Tax 82.87 302.31 84.01 13.420 3297.20 282.47 2149.04 36801.49 33233.10 76245.90
Tariffs on
Imports 291.21 1062.40 295.23 47.160 88.70 265.73 615.47 5676.80 5557.30 13900.00
Subsidies -9.03 -2830.00 -7.17 -18.214 0.00 -1615.30 -1879.68 -13241.72 -9329.90 -28931.00
Imports 6543.23 23870.91 6633.49 1059.87 13409.40 10795.66 25004.75 207482.69 43700.00 338500.00
Total supply 79144.46 49064.60 44780.60 99494.15 227147.80 59987.39 177333.64 787864.95 977812.19 2502629.77 1036200.000 156961.100 234531.200 281911.800 1709604.100 2502629.773
Table (2): Input-output Table for the Egyptian economy in 2010/2011
6
(Million LE)
Sector Egyptian Exports Egyptian Imports
USA ROW USA ROW
Value Tariffs Value Tariffs
Horticulture 273.43 7048.66 201.31 8.96 6341.92 282.25
Cereals 0 107.21 7278.12 323.92 16592.80 738.48
Other Plant Production 1.51 2339.87 2150.18 95.70 4483.31 199.53
Fish and Animal Production 5.47 198.07 41.06 1.83 1018.81 45.33
Extractions 4909.29 40828.04 926.79 6.13 12482.61 82.57
Textile & Apparel 9049.32 5033.41 301.67 7.43 10493.99 258.30
Food industries 448.68 12043.21 1935.95 47.65 23068.81 567.82
Other industries 6276.85 75842.05 21009.36 574.82 186473.33 5101.98
Services 16529.72 100977.00 6098.56 775.55 37601.44 4781.75
Total 37494.27 244417.52 39943 1841.99 298557.02 12058.01
Source: Calculated from the following sources:
- Input-output table 2010/2011.
- The United States International Trade Commission (USITC) (2013).
Table (3): Egyptian Exports and Imports by destination in 2010/11
(Million LE)
Transfers USA ROW Total
Transfers from Government 452.17 4591.73 5043.90
Transfers from Firms 3096.13 31285.47 34381.60
Transfers to Government 192.54 202.56 395.10
Transfers to Firms 8833.69 53471.21 62304.90
Remittances 3368.75 10831.25 14200.00
Investment income 0.0 3100.00 3100.00
Source: Calculated from the following sources:
- Ministry of Planning (2014). National Accounts Indicators for Egypt.
- The Central Bank of Egypt (2014). External Position Report.
- The World Bank (2014). Migration & Remittances Data, Bilateral Remittances Matrices, Bilateral Remittance Matrix 2010, 2011
Table (4): Transfers between local and foreign institutions
7
Data & Parameters Unit Value
Population Thousand 78685
Participation Rate % 31.43
Labor Demand Thousand 22523
Unemployment Level % 8.94
Foreign direct investments from the United States Million LE 10426
Foreign direct investments from the ROW Million LE 45326
Domestic Investments Million LE 178779
Depreciation Rate % 4.0
Capital Stock Million LE 3406179.6
Elasticity of Substitution between labor and Capital - 0.80
Elasticity of Substitution between domestic and imported goods - 1.05
Elasticity of trade for Exports - 1.5
Elasticity of transformation between Domestic sales and exports - -1.1
Source: Based on official sources from the Ministry of planning and own estimates of
authors.
Table (5): Non- SAM Data and Parameters in 2010/11
Model structure and economic rationale: The Agriculture economy interaction model of Egypt constructed in this paper
includes two sub-models : the first, represents the static sub-model is determined by three factors; i) the structural features of the economy and its circular flow of income as reflected by the issue-specific base year social accounting matrix (SAM), ii) the independent decisions of the economic agents intervening in the economy such as producers, consumers, importer and exporters, and iii) the set of closure rules that ensures the consistency of independent decisions of various economic agents and they reflect then the policy choices adopted by the Egyptian government. The second sub-model includes the dynamic adjustment mechanisms relying on by population growth, capital stock in the base year, gross fixed capital formation in addition to exogenous parameters describing future development scenarios for the Egyptian economy.
As an analytical tool, the model – as well as its social accounting matrix- introduced four technical contributions to the CGE modeling practice and applications. First, it represents an issue-oriented economy-wide modeling approach that establishes the linkages between agriculture sector and the rest of the economy. Second, it handles the case of multiple rest of the world with similar exchange rate and different regions (USA and the rest of the world). Third, aggregate investment spending is broken down into investment of domestic origin and foreign direct investment (FDI) flows. Fourth,
8
the model provides modified mathematical forms of the constant elasticity of substitution (CES), the constant elasticity of transformation (CET), and the Armington elasticity functions.
In the model, output is determined through maximizing profit subject to a two-stage constant elasticity of substitution function (CES). At the first level, total output is distributed between gross value added and intermediate inputs. Demand for labor and capital services is computed as a function of the value added generated in each production activity at the second level.
Return on Capital (or gross operating surplus in real term) is computed using base year capital stock, gross fixed capital formation and consumption of fixed capital (depreciation). When determining demand for labor broken down by economic sector or production activity and estimating the supply of labor (based on population growth rate and labor participation rate), Unemployment rate can be computed.
Demand for goods and services is satisfied by imports and domestic sales using the composite commodity approach. According to Armington assumption, domestically consumed goods are composed of domestic sales and imported goods using a CES function. This approach allows for imports to be an imperfect substitute to domestic supply depending on relative prices and the elasticity of substitution.
Supply of exports of goods and services are imperfect substitutes as well, and they are computed from a constant elasticity of transformation function (CET). The supply of exports interacts with world demand on the Egyptian export – affected by the elasticity of trade as well as the ratio of supply price of exports and their international price - to determine the equilibrium volume of exports.
Government revenue consists mainly of the operating surplus of public enterprises, domestic and foreign transfers and income from various taxes. Direct taxes are computed as a function of the revenues of households and firms sectors, indirect taxes and tariffs depend on the domestic and imported goods and the level of production. Finally, transfers to government from the outside world are fixed in foreign currency.
Government income is used to pay wage bill, purchase goods and services and carry out transfers to other institutions. Final consumption of the government is fixed in real term, whereas other expenditures are fixed in nominal term (or current prices). In the model, government spending is treated as a policy measure (or exogenous). Given government income and expenditure variables, public savings are determined as the difference between revenues and current expenditure (or as a clearing variable).
Household income includes the compensation of employees, workers' remittances, operating surplus of private companies and other current. Current expenditures and transfers of households sector are calculated as a fixed share of their income, while spending on final goods and services are modeled using a linear expenditure system (LES).
Public and private enterprises revenues include operating surpluses of productive activities, with a share determined according to the distribution of ownership at the sector level. In addition, there are different types of transfers from domestic and foreign institutions. The current expenditures of the firms are determined as a percent of their income. These expenditures include payment of direct taxes and transfers to
9
households, government sector and the outside world in addition to accumulated savings. Market clearing Mechanism:
Based on the economic structure and policy measures adopted by Egypt’s government, a set of market closure rules have been defined. These rules are classified according to markets of goods and services, market factors and the macroeconomic closure rules.
There are nine markets for goods and services. In these markets, the exchange occurs at flexible prices to clear the market and this is in line with the price liberalization policy currently adopted in Egypt. Factors Markets include labor and capital. Government wage bill is fixed in real terms, Labor demand in the public and private sectors is determined by the level of output and the form of the production function. Return on capital (or gross operating surplus in real term) is considered as an exogenous variable. In the inter-period dynamic part, it is computed however as function of last year capital stock, gross fixed capital formation and the consumption of fixed capital.
The model is composed of a static and a dynamic sub-models. The static model is composed of 851 equations and the nominal exchange rate is selected as the numeraire of the model. The model inter-period sub-model. The model has been implemented on a computer using the general algebraic software modeling system (GAMS). Development of policy scenarios
Given the above economic rationale, the model is used to capture and assess the impact of the deep agreement which captures the effects of removing tariffs on trade between Egypt and the United States in addition to reducing non-tariff measures and increasing FDI inflows from the United States by 20%.
It is absolutely clear that the deep type is the common approach in the recent U.S agreements with the countries of the region. In this regard, the deep agreement scenario will be compared with the reference path which reflects the case of no applied policies. Findings and policy recommendations
Impact on Real GDP Looking at the impact of the proposed agreement on the sources of GDP at factor
cost (in constant prices), results in table (6) indicate that the deep agreement will lead to an increase in the output by 0.28% in both the short and medium/long run with a value of 4.83, 6.73 billion pounds and an increase in the AAGRs of 1.40%, 0.53%, respectively as compared to the reference path. It should be noted that the positive impact of the deep agreement is mainly due to the positive impact of export promotion to the United States in addition to the increase in the U.S. direct investment flows.
At the sectoral level, the results indicate that there is an increase in output across all sectors in the short term and the majority of them in medium /long term at rates ranging from 0.08% to 0.60% in the short term, and 0.23% to 0.99% in the medium/long run as compared to the reference path. On the other hand, the other industries sector witnessed a decline in the output in medium /long run by 0.62%
10
compared to the reference path. The increase in the output is concentrated in extractions, textiles and apparel, the other plant production, food industries and animal and fish production sectors. The decline occurred in the other industries sector could be explained in the light of the tariff and non-tariff barriers facing this sector.
With regard to the structural changes in production, there is a slight decline in the share of services sector in the output in the short run estimated at 0.22% compared to the reference path, while the medium/long run has witnessed a decline in its share in addition to the share of other industries sector with around 0.23%, 1.03% respectively compared to the reference path. Real Imports and exports
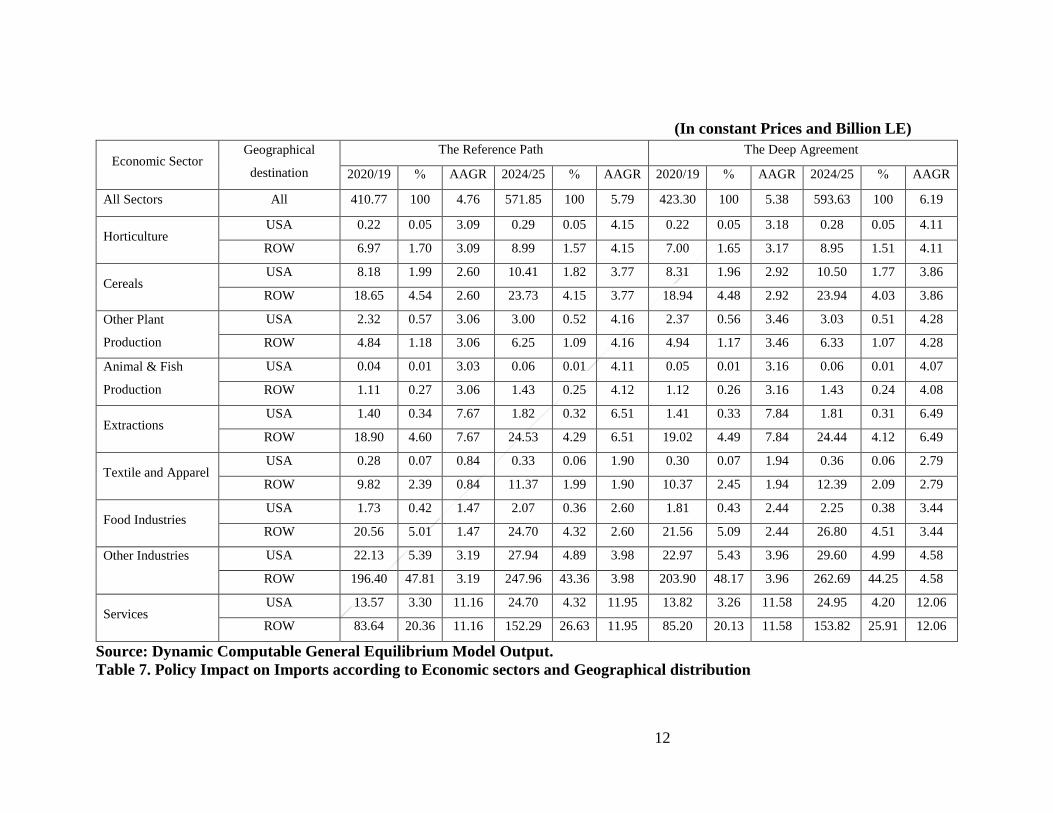
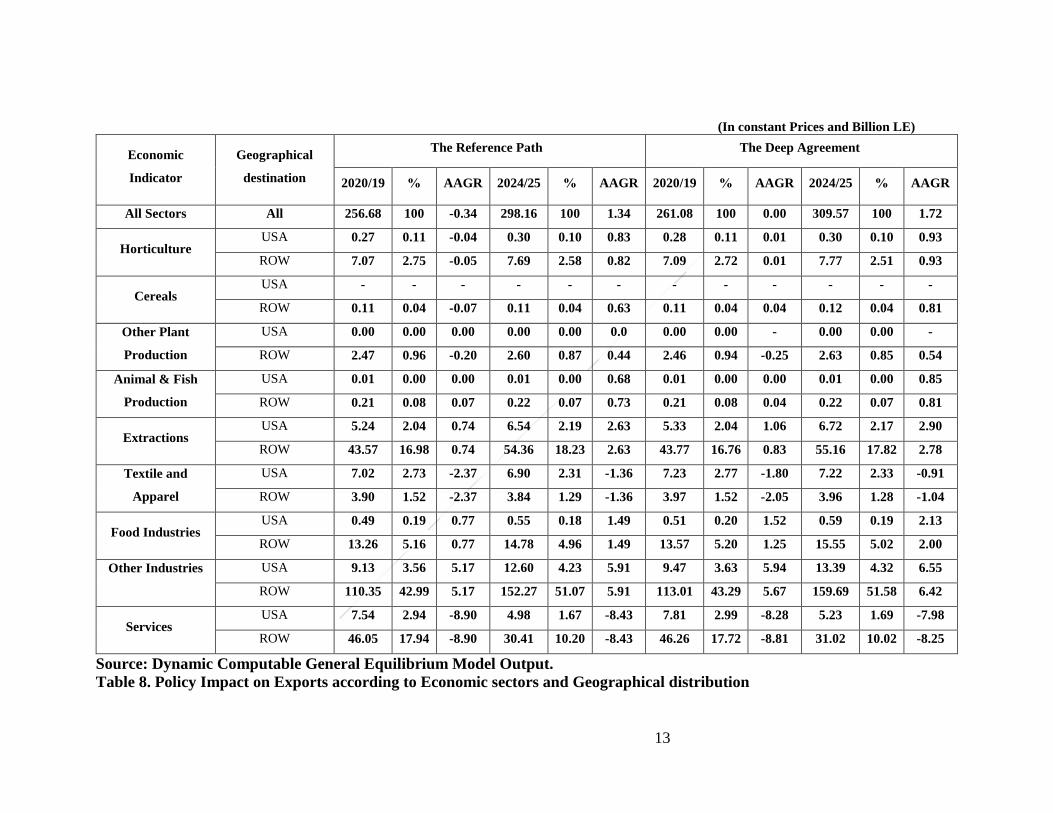
There is an increase in imports in the short run, while medium/long term witnessed a decrease in the primary sectors– table (7). The increased imports were in textiles and apparel, food industries, and the other industries sectors in medium/long run. These sectors are facing increased domestic and foreign demand. On the export side, evidences indicate that with the exception of some agricultural sectors (other plant production, animal & fish production), the exports witnessed an increase at the sectoral level in both short and medium / long run which concentrated mainly on extractions and industry sectors as well as the service sector with comparison of the Reference path – table (8).
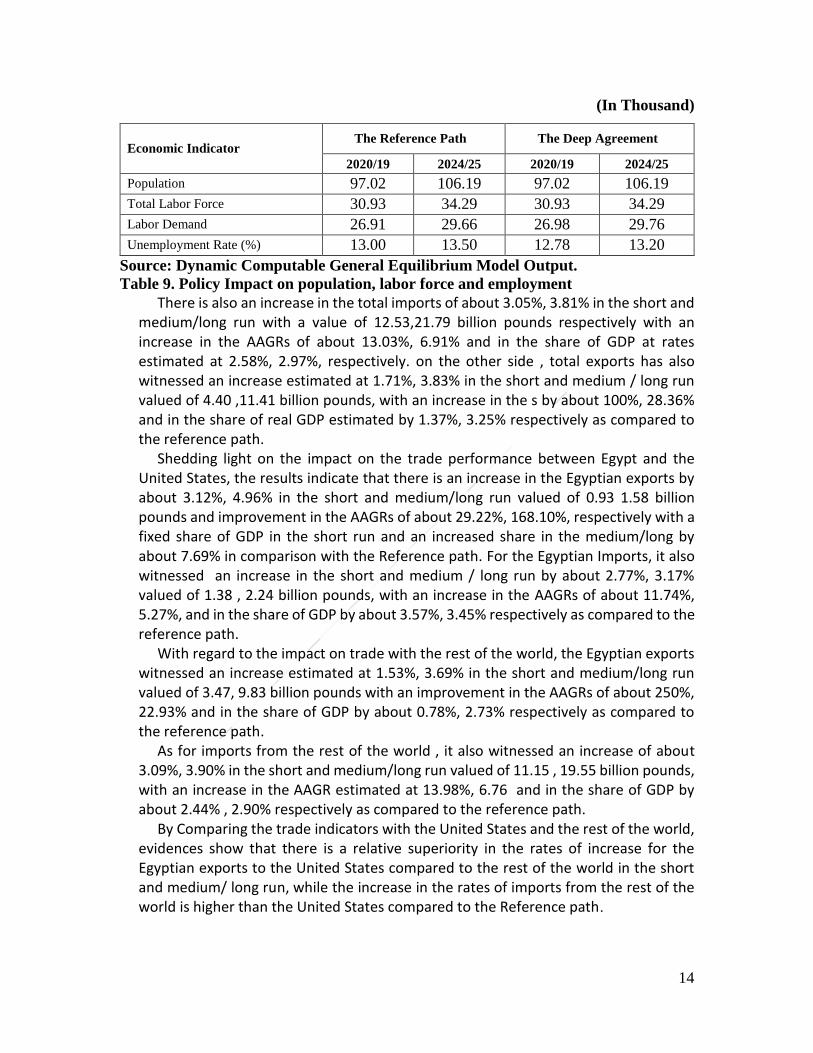
Based on the results in table (9), deep agreement is expected to have a positive impact on the labor demand. This is particularly clear from the decline in the unemployment rate by about 1.71%, 2.20% in the short and medium/long term respectively compared to the reference path.
it is worth pointing out that the positive effect of deep agreement on production and employment is mainly due to the positive effects of the increase in US direct investment flows as well as the increase in Egyptian exports to the United States that outweigh the negative effects of the gradual reduction of the non-tariff measures on Egyptian trade as well as the full removal of tariffs on imports from the United States.
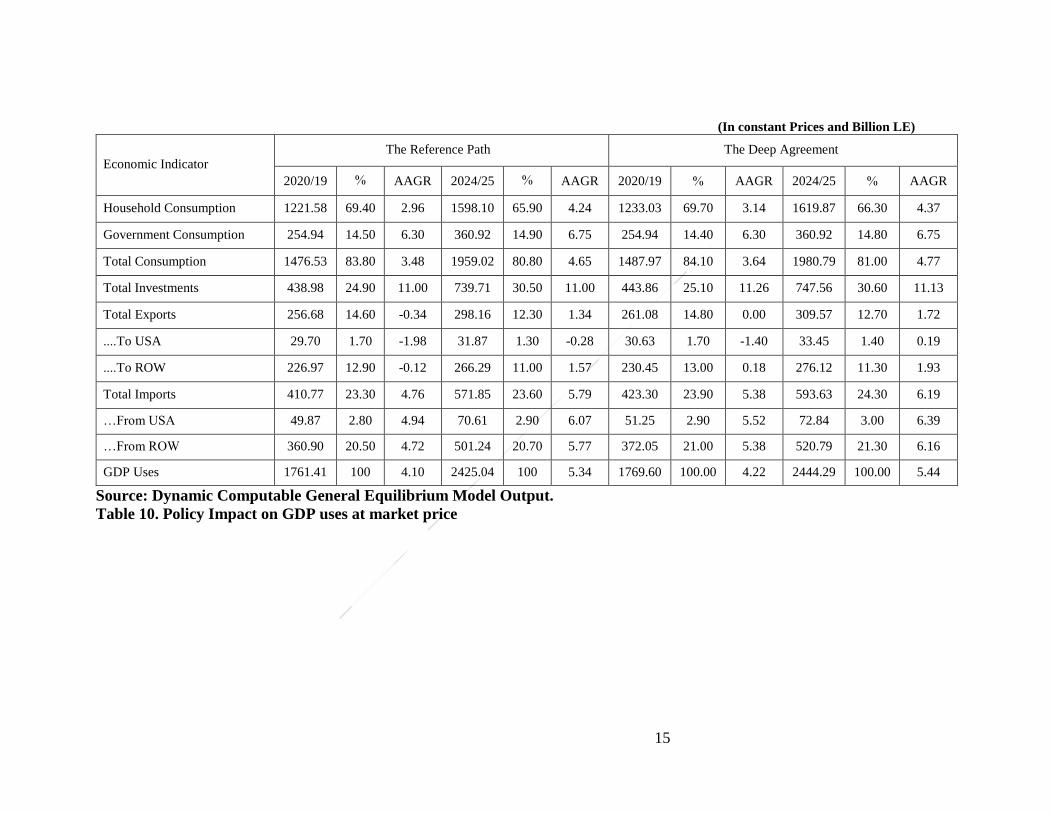
Demand for commodities Table (10) illustrates the impact of the proposed agreement on GDP uses at
constant prices.it clarifies that the deep agreement will lead to an increase in household consumption by about 0.94%, 1.36% in the short and medium / long run respectively valued at about 11.44, 21.77 billion pounds respectively, with an increase in the average annual growth rates (AAGRs) of about 6.08%, 3.07%, and in the share of GDP by about 0.43%, 0.61% respectively with comparison to the reference path.
Assuming that the government consumption is fixed in real term, total consumption witnessed an increase estimated at 0.77%, 1.11% with an increase in the AAGRs estimated at 4.60%, 2.58%, and in the share of GDP by about 0.36%, 0.25% in the short and medium / long term respectively as compared to the reference path.
For the investment, the increase achieved in the US direct investment flows to Egypt led to an increase in the total investment by about 1.11%, 1.06% in the short and medium/long run value of 4.87, 7.85 billion pounds respectively with an increase in the AAGRs estimated at around 2 0.36%, 1.18%, and in the share of GDP by about 0.80%, 0.33% respectively, compared to the reference path.

11
(In constant Prices and Billion LE)
Economic Indicator The Reference Path The Deep Agreement
2020/19 % AAGR* 2024/25 % AAGR 2020/19 % AAGR 2024/25 % AAGR
Gross Domestic Production at Factor
Price 1708.72 100 4.28 2406.18 100 5.68 1713.55 100.00 4.34 2412.91 100.00 5.71
Agriculture 234.02 13.7 3.08 306.13 12.7 4.29 234.77 13.70 3.12 308.17 12.80 4.36
Horticulture 81.89 4.8 2.94 107.31 4.5 4.25 82.13 4.80 2.98 107.85 4.50 4.29
Cereals 25.80 1.5 3.28 34.08 1.4 4.49 25.85 1.50 3.32 34.30 1.40 4.56
Other Plant Production 44.00 2.6 2.86 56.67 2.4 4.03 44.19 2.60 2.96 57.23 2.40 4.13
Animal & Fish Production 82.32 4.8 3.24 108.07 4.5 4.42 82.59 4.80 3.28 108.79 4.50 4.48
Extractions 281.12 16.5 5.12 410.95 17.1 6.49 282.80 16.50 5.26 414.90 17.20 6.61
Industry 411.48 24.1 6.24 633.77 26.3 7.64 412.30 24.10 6.30 632.10 26.20 7.61
Textile and Apparel 37.35 2.2 1.98 47.82 2.0 3.53 37.57 2.20 2.10 48.10 2.00 3.58
Food Industries 92.19 5.4 3.06 120.30 5.0 4.26 92.57 5.40 3.12 121.24 5.00 4.33
Other Industries 281.93 16.5 8.10 465.64 19.4 9.33 282.16 16.50 8.14 462.76 19.20 9.26
Services 782.11 45.8 3.42 1055.33 43.9 4.79 783.69 45.70 3.48 1057.74 43.80 4.83
*AAGR: Average Annual Growth Rate
Source: Dynamic Computable General Equilibrium Model Output.
Table 6. Policy Impact on GDP at factor Price
12
(In constant Prices and Billion LE)
Economic Sector Geographical
destination
The Reference Path The Deep Agreement
2020/19 % AAGR 2024/25 % AAGR 2020/19 % AAGR 2024/25 % AAGR
All Sectors All 410.77 100 4.76 571.85 100 5.79 423.30 100 5.38 593.63 100 6.19
Horticulture USA 0.22 0.05 3.09 0.29 0.05 4.15 0.22 0.05 3.18 0.28 0.05 4.11
ROW 6.97 1.70 3.09 8.99 1.57 4.15 7.00 1.65 3.17 8.95 1.51 4.11
Cereals USA 8.18 1.99 2.60 10.41 1.82 3.77 8.31 1.96 2.92 10.50 1.77 3.86
ROW 18.65 4.54 2.60 23.73 4.15 3.77 18.94 4.48 2.92 23.94 4.03 3.86
Other Plant
Production
USA 2.32 0.57 3.06 3.00 0.52 4.16 2.37 0.56 3.46 3.03 0.51 4.28
ROW 4.84 1.18 3.06 6.25 1.09 4.16 4.94 1.17 3.46 6.33 1.07 4.28
Animal & Fish
Production
USA 0.04 0.01 3.03 0.06 0.01 4.11 0.05 0.01 3.16 0.06 0.01 4.07
ROW 1.11 0.27 3.06 1.43 0.25 4.12 1.12 0.26 3.16 1.43 0.24 4.08
Extractions USA 1.40 0.34 7.67 1.82 0.32 6.51 1.41 0.33 7.84 1.81 0.31 6.49
ROW 18.90 4.60 7.67 24.53 4.29 6.51 19.02 4.49 7.84 24.44 4.12 6.49
Textile and Apparel USA 0.28 0.07 0.84 0.33 0.06 1.90 0.30 0.07 1.94 0.36 0.06 2.79
ROW 9.82 2.39 0.84 11.37 1.99 1.90 10.37 2.45 1.94 12.39 2.09 2.79
Food Industries USA 1.73 0.42 1.47 2.07 0.36 2.60 1.81 0.43 2.44 2.25 0.38 3.44
ROW 20.56 5.01 1.47 24.70 4.32 2.60 21.56 5.09 2.44 26.80 4.51 3.44
Other Industries
USA 22.13 5.39 3.19 27.94 4.89 3.98 22.97 5.43 3.96 29.60 4.99 4.58
ROW 196.40 47.81 3.19 247.96 43.36 3.98 203.90 48.17 3.96 262.69 44.25 4.58
Services USA 13.57 3.30 11.16 24.70 4.32 11.95 13.82 3.26 11.58 24.95 4.20 12.06
ROW 83.64 20.36 11.16 152.29 26.63 11.95 85.20 20.13 11.58 153.82 25.91 12.06
Source: Dynamic Computable General Equilibrium Model Output.
Table 7. Policy Impact on Imports according to Economic sectors and Geographical distribution
13
(In constant Prices and Billion LE)
Economic
Indicator
Geographical
destination
The Reference Path The Deep Agreement
2020/19 % AAGR 2024/25 % AAGR 2020/19 % AAGR 2024/25 % AAGR
All Sectors All 256.68 100 -0.34 298.16 100 1.34 261.08 100 0.00 309.57 100 1.72
Horticulture USA 0.27 0.11 -0.04 0.30 0.10 0.83 0.28 0.11 0.01 0.30 0.10 0.93
ROW 7.07 2.75 -0.05 7.69 2.58 0.82 7.09 2.72 0.01 7.77 2.51 0.93
Cereals USA - - - - - - - - - - - -
ROW 0.11 0.04 -0.07 0.11 0.04 0.63 0.11 0.04 0.04 0.12 0.04 0.81
Other Plant
Production
USA 0.00 0.00 0.00 0.00 0.00 0.0 0.00 0.00 - 0.00 0.00 -
ROW 2.47 0.96 -0.20 2.60 0.87 0.44 2.46 0.94 -0.25 2.63 0.85 0.54
Animal & Fish
Production
USA 0.01 0.00 0.00 0.01 0.00 0.68 0.01 0.00 0.00 0.01 0.00 0.85
ROW 0.21 0.08 0.07 0.22 0.07 0.73 0.21 0.08 0.04 0.22 0.07 0.81
Extractions USA 5.24 2.04 0.74 6.54 2.19 2.63 5.33 2.04 1.06 6.72 2.17 2.90
ROW 43.57 16.98 0.74 54.36 18.23 2.63 43.77 16.76 0.83 55.16 17.82 2.78
Textile and
Apparel
USA 7.02 2.73 -2.37 6.90 2.31 -1.36 7.23 2.77 -1.80 7.22 2.33 -0.91
ROW 3.90 1.52 -2.37 3.84 1.29 -1.36 3.97 1.52 -2.05 3.96 1.28 -1.04
Food Industries USA 0.49 0.19 0.77 0.55 0.18 1.49 0.51 0.20 1.52 0.59 0.19 2.13
ROW 13.26 5.16 0.77 14.78 4.96 1.49 13.57 5.20 1.25 15.55 5.02 2.00
Other Industries
USA 9.13 3.56 5.17 12.60 4.23 5.91 9.47 3.63 5.94 13.39 4.32 6.55
ROW 110.35 42.99 5.17 152.27 51.07 5.91 113.01 43.29 5.67 159.69 51.58 6.42
Services USA 7.54 2.94 -8.90 4.98 1.67 -8.43 7.81 2.99 -8.28 5.23 1.69 -7.98
ROW 46.05 17.94 -8.90 30.41 10.20 -8.43 46.26 17.72 -8.81 31.02 10.02 -8.25
Source: Dynamic Computable General Equilibrium Model Output.
Table 8. Policy Impact on Exports according to Economic sectors and Geographical distribution
14
(In Thousand)
Economic Indicator The Reference Path The Deep Agreement
2020/19 2024/25 2020/19 2024/25
Population 97.02 106.19 97.02 106.19
Total Labor Force 30.93 34.29 30.93 34.29
Labor Demand 26.91 29.66 26.98 29.76
Unemployment Rate (%) 13.00 13.50 12.78 13.20
Source: Dynamic Computable General Equilibrium Model Output.
Table 9. Policy Impact on population, labor force and employment
There is also an increase in the total imports of about 3.05%, 3.81% in the short and medium/long run with a value of 12.53,21.79 billion pounds respectively with an increase in the AAGRs of about 13.03%, 6.91% and in the share of GDP at rates estimated at 2.58%, 2.97%, respectively. on the other side , total exports has also witnessed an increase estimated at 1.71%, 3.83% in the short and medium / long run valued of 4.40 ,11.41 billion pounds, with an increase in the s by about 100%, 28.36% and in the share of real GDP estimated by 1.37%, 3.25% respectively as compared to the reference path.
Shedding light on the impact on the trade performance between Egypt and the United States, the results indicate that there is an increase in the Egyptian exports by about 3.12%, 4.96% in the short and medium/long run valued of 0.93 1.58 billion pounds and improvement in the AAGRs of about 29.22%, 168.10%, respectively with a fixed share of GDP in the short run and an increased share in the medium/long by about 7.69% in comparison with the Reference path. For the Egyptian Imports, it also witnessed an increase in the short and medium / long run by about 2.77%, 3.17% valued of 1.38 , 2.24 billion pounds, with an increase in the AAGRs of about 11.74%, 5.27%, and in the share of GDP by about 3.57%, 3.45% respectively as compared to the reference path.
With regard to the impact on trade with the rest of the world, the Egyptian exports witnessed an increase estimated at 1.53%, 3.69% in the short and medium/long run valued of 3.47, 9.83 billion pounds with an improvement in the AAGRs of about 250%, 22.93% and in the share of GDP by about 0.78%, 2.73% respectively as compared to the reference path.
As for imports from the rest of the world , it also witnessed an increase of about 3.09%, 3.90% in the short and medium/long run valued of 11.15 , 19.55 billion pounds, with an increase in the AAGR estimated at 13.98%, 6.76 and in the share of GDP by about 2.44% , 2.90% respectively as compared to the reference path.
By Comparing the trade indicators with the United States and the rest of the world, evidences show that there is a relative superiority in the rates of increase for the Egyptian exports to the United States compared to the rest of the world in the short and medium/ long run, while the increase in the rates of imports from the rest of the world is higher than the United States compared to the Reference path.
15
(In constant Prices and Billion LE)
Economic Indicator The Reference Path The Deep Agreement
2020/19 % AAGR 2024/25 % AAGR 2020/19 % AAGR 2024/25 % AAGR
Household Consumption 1221.58 69.40 2.96 1598.10 65.90 4.24 1233.03 69.70 3.14 1619.87 66.30 4.37
Government Consumption 254.94 14.50 6.30 360.92 14.90 6.75 254.94 14.40 6.30 360.92 14.80 6.75
Total Consumption 1476.53 83.80 3.48 1959.02 80.80 4.65 1487.97 84.10 3.64 1980.79 81.00 4.77
Total Investments 438.98 24.90 11.00 739.71 30.50 11.00 443.86 25.10 11.26 747.56 30.60 11.13
Total Exports 256.68 14.60 -0.34 298.16 12.30 1.34 261.08 14.80 0.00 309.57 12.70 1.72
....To USA 29.70 1.70 -1.98 31.87 1.30 -0.28 30.63 1.70 -1.40 33.45 1.40 0.19
....To ROW 226.97 12.90 -0.12 266.29 11.00 1.57 230.45 13.00 0.18 276.12 11.30 1.93
Total Imports 410.77 23.30 4.76 571.85 23.60 5.79 423.30 23.90 5.38 593.63 24.30 6.19
…From USA 49.87 2.80 4.94 70.61 2.90 6.07 51.25 2.90 5.52 72.84 3.00 6.39
…From ROW 360.90 20.50 4.72 501.24 20.70 5.77 372.05 21.00 5.38 520.79 21.30 6.16
GDP Uses 1761.41 100 4.10 2425.04 100 5.34 1769.60 100.00 4.22 2444.29 100.00 5.44
Source: Dynamic Computable General Equilibrium Model Output.
Table 10. Policy Impact on GDP uses at market price
16
As a result, the real GDP increased by about 0.46%, 0.79% valued at approximately 8.18,19.24 billion pounds in the short and medium/long run respectively with an increase in the AAGR estimated at 2.93%,1.87%, respectively as compared to the reference path . The positive effect of the deep agreement can be explained in the light of the positive effects of the policies aiming to reduce non-tariff measures, increase US direct investment flows and promote Egyptian exports to the United States.
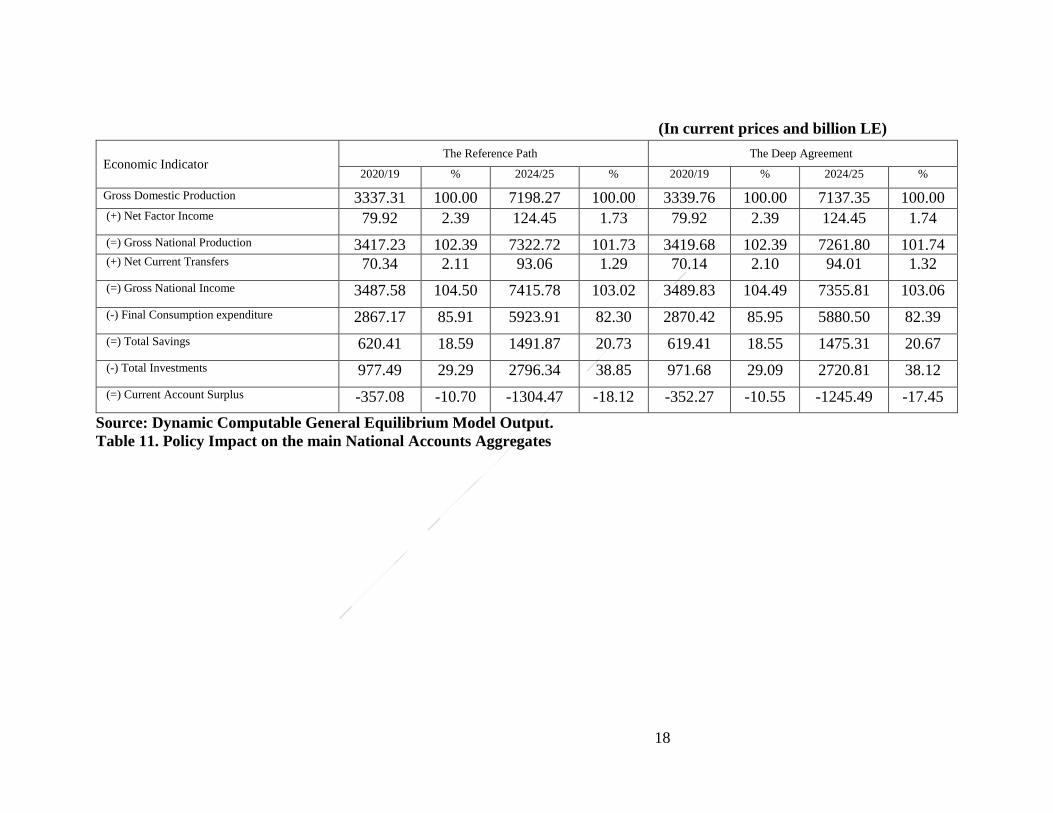
Income Generation and Allocation The impact of the deep agreement on the main aggregates of national accounts- in
current prices - can be examined from table (11). The nominal GDP increased in the short run and retreated in the medium/long run by 0.07%, 0.85% respectively with a value of 2.45, 60.92 billion pounds compared to the reference path. Under the unchanged net factor income, GNP experienced a decline with the same value. The decline in net remittances in the short run and its increase in the medium/long run by 0.29%, 1.02% with a value of 0.20, 0.95 billion pound respectively led to an increase in the gross national income in the short term and a decrease in the medium / long run by 0.06%, 0.81% with a value of 2.25, 59.97 billion pound respectively as compared to the reference path.
Consequently, final consumption witnessed an increase in the short run and a decline in the medium/long run by 0.11%, 0.73% with a value of 3.26, 43.41 billion pounds respectively in addition to the decline in total savings of about 0.16%, 1.11% with a value of 1.0, 16.56 billion pound in the short term and medium/long respectively compared to the reference path.
In the light of the decline in total investment amounted to 0.59%, 2.70% with a value of 5.81, 75.53 billion pound respectively, the performance of the current surplus improved by about 1.35%, 4.52% with a value of 4.81 , 58.97 billion pound respectively as compared to the reference path. The results also indicate that the most influential factor in declining the national income was the reduction in import tariffs as a result of the removal of tariffs on imports from the United States in exchange for a slight improvement in labor compensation and operating surplus.
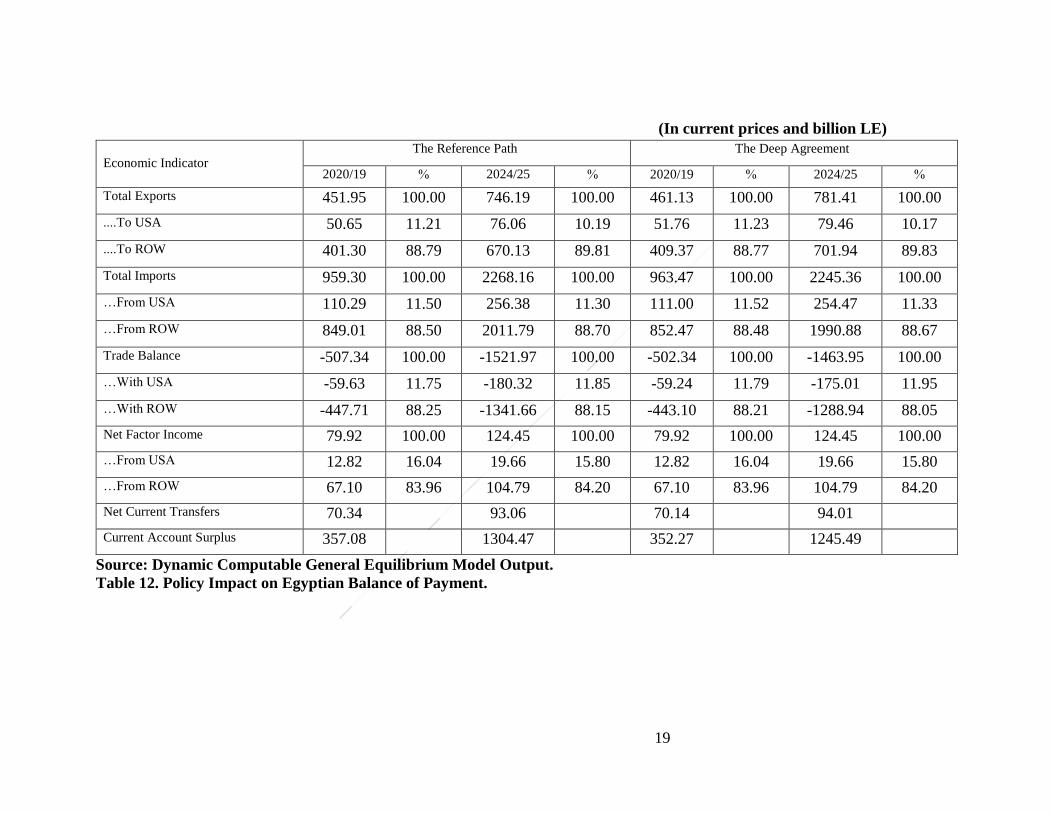
External Balance The performance of the trade balance and the current balance of payments, as
shown in table (12) indicate that there is an improvement in the performance of the trade balance through the declining in the deficit by about 0.99%, 3.81% valued at 5.01,58.02 billion pounds in the short and medium/long run respectively in comparison with the reference path. Under the unchanged net factor income and the decline in net transfers in the short term and its increase in the medium/ long run; the performance of the current account surplus has improved by about 1.35%, 4.52% valued of 4.81, 58.97 billion pounds in the short and medium/long run respectively as compared to the reference path. The positive effect of the deep agreement on the performance of the current surplus is due to the fact that the positive effect of reducing non-tariff measures outweigh the negative ones. For the Egyptian balance of trade with the United States, it is clear that there is a decline in the trade deficit with the U.S by about 0.67%, 2.94% valued of 0.40, 5.30 billion pounds respectively; however, the trade balance with the rest of the world showed a decline in the deficit by about 1.03%,
17
3.93% valued of 4.61, 52.72 billion pounds respectively as a result of increasing Egyptian exports compared to imports as compared to the reference path.
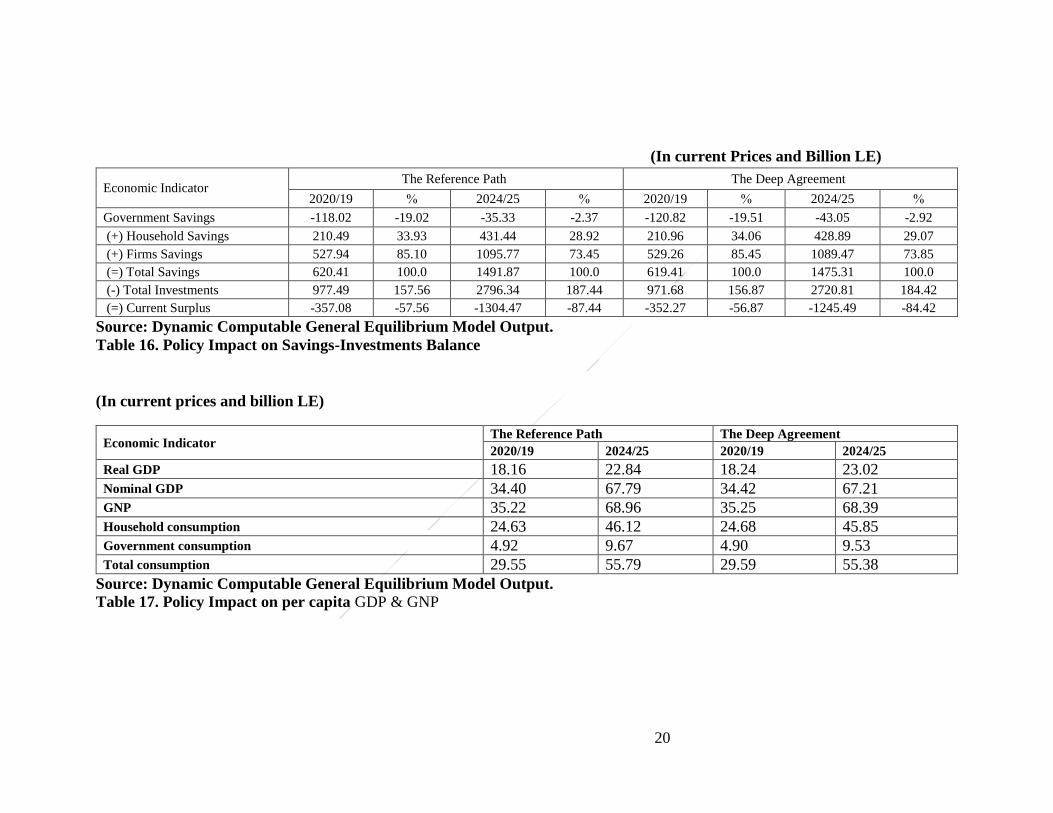
Saving Behavior To think about the saving - investment balance at current prices, table (13) indicates
that there is a realized deterioration in government saving (as a result of the deterioration in the government budget because of the supremacy of the negative effects of the removal of tariffs on imports from the United States). on the other hand , the savings of households and firms improved in the short run by 0.22%, 0.25% with a value of 0.46 ,1.33 billion pounds respectively and deteriorated in the medium/long run by about 0.59%, 0.57% with a value of about 2.54 , 6.29 billion pounds respectively with an increase in their share of the total savings in the short term by about 0.38%, 0.41%, and in the medium / long run by about 0.53%, 0.54% respectively as compared to the reference path.
Accordingly, the total savings deteriorated by about 0.16%, 1.11% in the short and medium / long run with a value of 1.0 , 16.56 billion pounds respectively as compared to the reference path. On the other hand, total investment dropped by 0.59%, 2.70% in the short and medium / long run with a value of 5.81 , 75.53 billion pounds, and the decline in the share of total savings estimated at 0.43%, 1.61%, respectively, as compared to the reference path.
Based on these results , the performance of current surplus improved by about 1.35%, 4.52% in the short and medium/long run, valued at about 4.81 , 58.98 billion pounds with a decline in its share of the total savings by 1.19%, 3.45% respectively as compared to the reference path. Per-capita indicators
Regarding per-capita indicators, the findings in the table (14) indicate that there is an improvement in the per-capita GDP in real term by about 0.46%, 0.79% in the short and medium/long run respectively compared to the reference path. The share of the nominal GDP, GNP and the gross household consumption increased in the short run and decreased in the medium /long run, while the share of government consumption has witnessed a decline on both the short and medium/ long run compared to the Reference path. Concluding Remarks
The first aspect to note is that the aggregate and sectoral impacts are quite modest due to the small share of the bilateral trade and investment flows with the United States. It is also found that reducing non-tariff measures and attracting U.S. FDI flows is expected to provide positive gains in the medium/long run with an increase in the AAGR of GDP in real term accounting for 1.87% compared with the reference path. It becomes clear that the structural changes caused by the deep agreement is limited particularly in the medium-long run. For Egypt’s external balance, the evidences show that there is a clear improvement in trade balance and the current account surplus.
18
(In current prices and billion LE)
Economic Indicator The Reference Path The Deep Agreement
2020/19 % 2024/25 % 2020/19 % 2024/25 %
Gross Domestic Production 3337.31 100.00 7198.27 100.00 3339.76 100.00 7137.35 100.00
(+) Net Factor Income 79.92 2.39 124.45 1.73 79.92 2.39 124.45 1.74
(=) Gross National Production 3417.23 102.39 7322.72 101.73 3419.68 102.39 7261.80 101.74
(+) Net Current Transfers 70.34 2.11 93.06 1.29 70.14 2.10 94.01 1.32
(=) Gross National Income 3487.58 104.50 7415.78 103.02 3489.83 104.49 7355.81 103.06
(-) Final Consumption expenditure 2867.17 85.91 5923.91 82.30 2870.42 85.95 5880.50 82.39
(=) Total Savings 620.41 18.59 1491.87 20.73 619.41 18.55 1475.31 20.67
(-) Total Investments 977.49 29.29 2796.34 38.85 971.68 29.09 2720.81 38.12
(=) Current Account Surplus -357.08 -10.70 -1304.47 -18.12 -352.27 -10.55 -1245.49 -17.45
Source: Dynamic Computable General Equilibrium Model Output.
Table 11. Policy Impact on the main National Accounts Aggregates
19
(In current prices and billion LE)
Economic Indicator The Reference Path The Deep Agreement
2020/19 % 2024/25 % 2020/19 % 2024/25 %
Total Exports 451.95 100.00 746.19 100.00 461.13 100.00 781.41 100.00
....To USA 50.65 11.21 76.06 10.19 51.76 11.23 79.46 10.17
....To ROW 401.30 88.79 670.13 89.81 409.37 88.77 701.94 89.83
Total Imports 959.30 100.00 2268.16 100.00 963.47 100.00 2245.36 100.00
…From USA 110.29 11.50 256.38 11.30 111.00 11.52 254.47 11.33
…From ROW 849.01 88.50 2011.79 88.70 852.47 88.48 1990.88 88.67
Trade Balance -507.34 100.00 -1521.97 100.00 -502.34 100.00 -1463.95 100.00
…With USA -59.63 11.75 -180.32 11.85 -59.24 11.79 -175.01 11.95
…With ROW -447.71 88.25 -1341.66 88.15 -443.10 88.21 -1288.94 88.05
Net Factor Income 79.92 100.00 124.45 100.00 79.92 100.00 124.45 100.00
…From USA 12.82 16.04 19.66 15.80 12.82 16.04 19.66 15.80
…From ROW 67.10 83.96 104.79 84.20 67.10 83.96 104.79 84.20
Net Current Transfers 70.34 93.06 70.14 94.01
Current Account Surplus 357.08 1304.47 352.27 1245.49
Source: Dynamic Computable General Equilibrium Model Output.
Table 12. Policy Impact on Egyptian Balance of Payment.
20
(In current Prices and Billion LE)
Economic Indicator The Reference Path The Deep Agreement
2020/19 % 2024/25 % 2020/19 % 2024/25 %
Government Savings -118.02 -19.02 -35.33 -2.37 -120.82 -19.51 -43.05 -2.92
(+) Household Savings 210.49 33.93 431.44 28.92 210.96 34.06 428.89 29.07
(+) Firms Savings 527.94 85.10 1095.77 73.45 529.26 85.45 1089.47 73.85
(=) Total Savings 620.41 100.0 1491.87 100.0 619.41 100.0 1475.31 100.0
(-) Total Investments 977.49 157.56 2796.34 187.44 971.68 156.87 2720.81 184.42
(=) Current Surplus -357.08 -57.56 -1304.47 -87.44 -352.27 -56.87 -1245.49 -84.42
Source: Dynamic Computable General Equilibrium Model Output.
Table 16. Policy Impact on Savings-Investments Balance
(In current prices and billion LE)
Economic Indicator The Reference Path The Deep Agreement
2020/19 2024/25 2020/19 2024/25
Real GDP 18.16 22.84 18.24 23.02
Nominal GDP 34.40 67.79 34.42 67.21
GNP 35.22 68.96 35.25 68.39
Household consumption 24.63 46.12 24.68 45.85
Government consumption 4.92 9.67 4.90 9.53
Total consumption 29.55 55.79 29.59 55.38
Source: Dynamic Computable General Equilibrium Model Output.
Table 17. Policy Impact on per capita GDP & GNP
21
It is also expected that the deep agreement has positive effects on real household consumption, real Investment, terms of trade and employment; however, aggregate national saving is negatively affected.
At the sectoral level, the more dynamic sectors will demand resources from the less dynamic ones, which will reduce their output since they become relatively less profitable. The analytical results show that the other industries sector is the most negatively affected sector due to the proposed agreement. However; primary sectors (agriculture and extraction) and agriculture-related industries will benefit the most especially in the medium/long run.
Policy recommendations could be summarized as follows: First, Gains from the deep agreement are conditional on the reduction or elimination of non-tariffs measures and increasing foreign direct investments inflows, Greater gains could be achieved if it is accompanied by reducing other non-tariff measures and adopting further and deeper domestic reforms. Second, Deep agreement contributes positively to economic growth on both the short and medium/long run. Third, Loss in fiscal revenues may be mitigated through domestic tax reform, revenue enhancing policies of trade-induced growth and compensatory mechanisms. Fourth, Policy analysis stresses the need to develop advanced analytical tools or models that capture the interdependence between the agricultural sectors and the rest of the economy.
References
Breisinger, C.; Thomas, M. and Thurlow, J. (2009). “Social Accounting Matrices and Multiplier Analysis: An introduction with exercises”. Intl Food Policy Res Inst. (Vol. 5).
Burfisher, M. E. (2011). “Introduction to Computable General Equilibrium Models”. Cambridge University Press, England.
Cardenete, M. A.; Guerra, A. I. and Sancho, F. (2012). “Applied General Equilibrium: An Introduction. Springer Texts in Business and Economics”. Springer-Verlag. Berlin.
Drud, A. and Kendrick, D. (1986).” HERCULES: A System for Large Economy-wide Models”. Analytical Support Unit, Development Research Department, The World Bank.
Khorshid, M. (1995).”An Agriculture Economy wide Simulation Model for Egypt: Database, Structure and Policy Analysis”. Finance And Industry, Kuwait, No. 13, pp.15- 102.
Khorshid, M. (1994). “A Dynamic Multi-sector Economy-wide Model for Egypt: Database, Structure and Policy Analysis”. The IBK Papers, The Industrial Bank of Kuwait, No. 41: 1-68.
Khorshid, M. (1996). “A Multi-sector Population Economy wide Simulation Model for Egypt. Finance and Industry”. The Industrial Bank of Kuwait. No. 12: 39-155.
Khorshid, M. (2002). “Issue-Oriented Social Accounting Matrices for Development Policy: Experience from the Middle East and North Africa Region”. The International Conference on Input-Output Techniques, Montreal, Canada, October 10-15.
22
Khorshid, M. (2008).”Social Accounting Matrices for Modeling and Policy Analysis-Development Issues from the Middle East”. The International Conference on Policy Modeling, Berlin, Germany, July 2-4.
Khorshid, M. and El sadek, A. (2012).”A multi-sector ICT Economy Interaction Model For Egypt – The Path to Information Society”. The International Conference on Economic Policy Modeling (EcoMod12), Seville, Spain, July 4-6.
Khorshid, M. and El sadek, A. (2011).”An ICT Economy Interaction Model for Egypt – Impact on Growth and Productivity”. The International Conference on Economic Policy Modeling (EcoMod11), Azores, Portugal, June 27-29.
Khorshid, M. and El-Sadek, A. (2010).”An ICT Economy Wide Interaction Social Accounting Matrix for Egypt – Structure, Economic Rationale and Analytical Indicators”. The International Conference on Policy Modeling (EcoMod10), Istanbul, Turkey, July 7-10.
Khorshid, M. and El-Sadek, A. (2013).” Egypt’s Post Revolution Development Path From A Dynamic Economy Wide Model: A Goal Seeking Analysis”. The International Conference on Economic Policy Modeling (EcoMod13), Prague, July 1-3.
Khorshid, M. and El-Sadek, A. (2014).” Egypt’s Post Revolution Development Path From A Dynamic Economy Wide Model: A Three-Year Economic Recovery Plan”. The International Conference on Economic Policy Modeling (EcoMod14), Bali, Indonesia, July 16-18.
Kotschwar, B. and Schott, J. (2010). “Reengaging Egypt: Options for US-Egypt Economic Relations”. Peterson Institute for International Economics, Washington, D.C., USA.
Ministry of Planning (2014). “National Accounts Indicators for Egypt”. Cited from http://www.ad.gov.eg/Ar/Default.aspx
Ministry of Trade and Industry (2015).”Trade Statistics”. Cited from http://www.tpegypt.gov.eg/Arabic/TradeStatistics.aspx.
The Central Bank of Egypt (2014). “External Position Report”. Cited from http://www.cbe.org.eg/English/Economic+Research/Publications/
The United States International Trade Commission (USITC) (2015). “US Trade Data”. Cited from http://www.usitc.gov.
United Nations Conference on Trade and Development (UNCTAD) (2015). “Trade & Foreign direct investment Indicators”. Cited from http://unctadstat.unctad.org/.
US. Bureau of Economic Analysis (2015) .”International Economic Accounts” .Cited from http://www.bea.gov/international/index.htm.
World Bank (2014). “Migration & Remittances Data, Bilateral Remittances Matrices, Bilateral Remittance Matrix 2010, 2011”. Cited from http://econ.worldbank.org/.
World Trade Organization (WTO) (2015). “Regional Trade Agreements”. Cited from http://www.wto.org/.