
An agency of the Government of Ontario Research in Support of PSE Public Policy in Ontario...
22
An agency of the Government of Ontario Research in Support of PSE Public Policy in Ontario Presentation to CUPA June 23 2009
-
Upload
ernest-warren -
Category
Documents
-
view
214 -
download
0
Transcript of An agency of the Government of Ontario Research in Support of PSE Public Policy in Ontario...

An agency of the Government of Ontario
Research in Support of PSE Public Policy in Ontario
Presentation to CUPA
June 23 2009

HEQCO’s Mandate • Provide an annual evaluation of the performance of the PSE
sector • Annual review and research plan
• Drawing on the evaluation, identify and explore policy options • Generally in annual review and research plan
• Make policy recommendations to Minister and Ministry • HEQCO initiated, based on research work plan • At Minister’s request• In both cases, communication and public release protocol in place

Topic for today
• Highlight work on PSE participation and attainment • Policy objective is that the province meets its
projected human capital needs• Compete and prosper in a global, information economy• Significant non-economic returns to PSE• Address accessibility for under-represented groups
• Two steps• Look at the current stock of human capital • Look at prospects for adding to this stock

THE CURRENT STOCK OF HUMAN CAPITAL

Metrics and Targets
• Suggested Metrics • Ideally, all reported educational attainment including multiple
credentials • But census data restricted to highest level of educational attainment
• Suggested Targets1. First among provinces in PSE attainment2. PSE attainment rates equal to those in leading OECD countries
• For discussion• Target aggregate PSE attainment or distinguish among credentials? • If latter, how to choose individual targets?
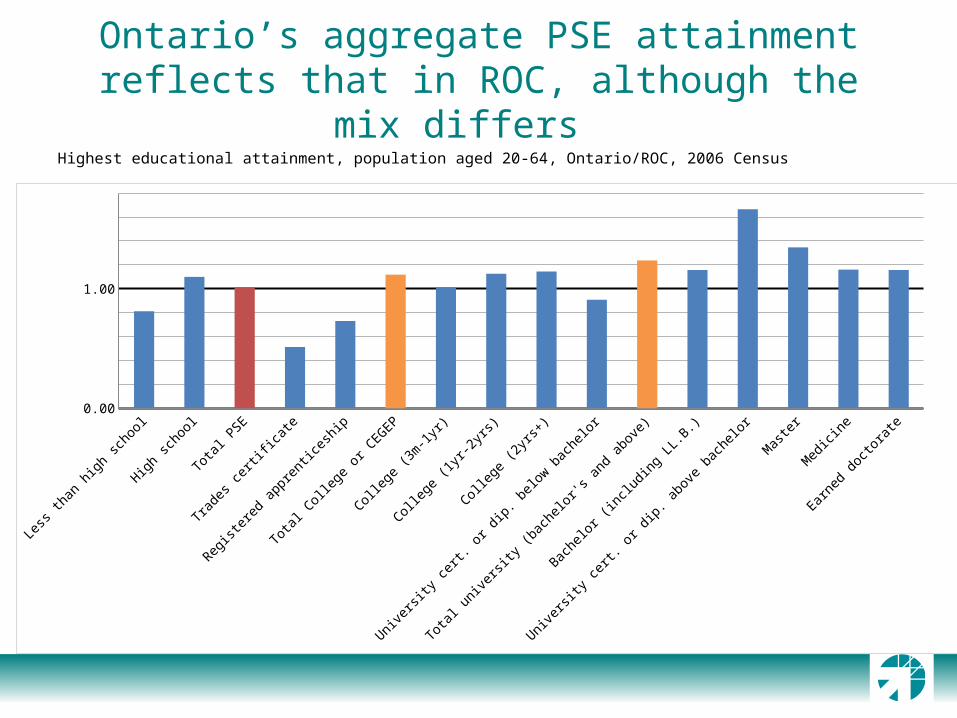
Ontario’s aggregate PSE attainment reflects that in ROC, although the mix differs
Highest educational attainment, population aged 20-64, Ontario/ROC, 2006 Census
Less t
han high
school
High sc
hool
Total
PSE
Trades
certificat
e
Regist
ered ap
prentices
hip
Total
College
or CEG
EP
College
(3m-1yr)
College
(1yr-
2yrs)
College
(2yrs
+)
Universi
ty cer
t. or d
ip. belo
w bachelo
r
Total
universi
ty (bach
elor's
and ab
ove)
Bachelo
r (inclu
ding LL.B
.)
Universi
ty cer
t. or d
ip. above
bachelo
r
Master
Medicin
e
Earn
ed docto
rate
0.00
1.00

• University and non-university attainment for main OECD countries, percentage of population aged 25-64, 2006
Canada appears to lead OECD nations in aggregate PSE attainment, due mainly to a large lead in non-university
credentials
Australi
a
Austria
Belgium
Canad
a
Denmark
Finlan
dFra
nce
German
y
Greece
Hungary
Icelan
d
Irelan
dIta
lyJap
anKorea
Luxe
mbourg
Mexico
Netherl
ands
New Ze
aland
Norway
Slova
k Rep
ublicSp
ain
Swed
en
Switz
erlan
d
United Kingd
om
United St
ates
OECD av
erage
0
5
10
15
20
25
30
35
2324
Tertiary-type B education (Non-university) Tertiary-type A education (University)

But there are problems with international comparisons
• Composition of non-university sector varies among nations
• Improvements in comparability expected shortly
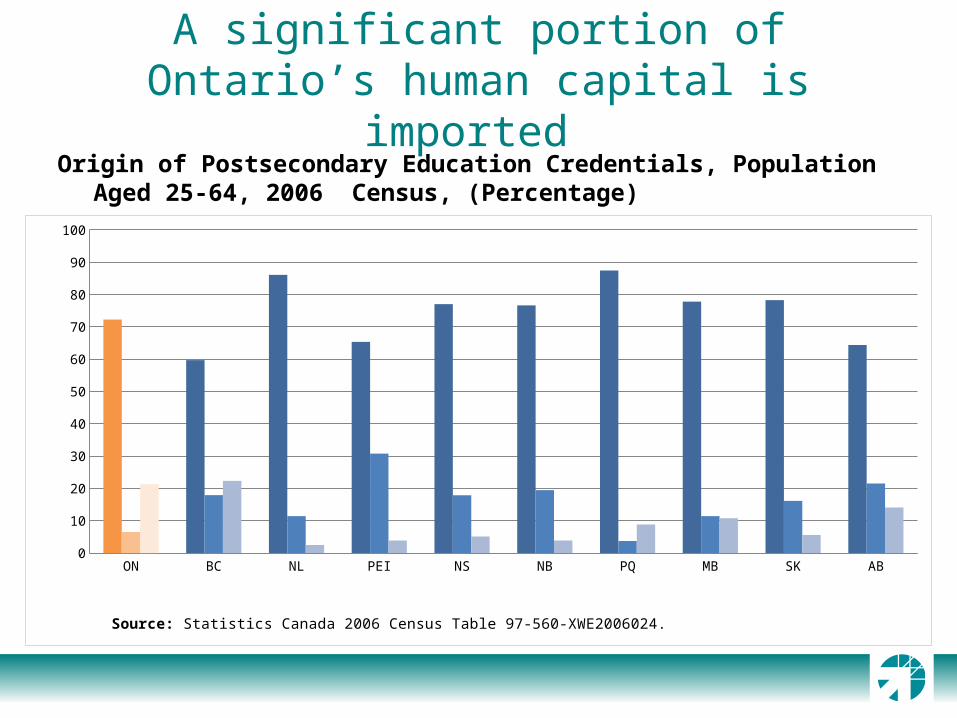
A significant portion of Ontario’s human capital is imported
Origin of Postsecondary Education Credentials, Population Aged 25-64, 2006 Census, (Percentage)
ON BC NL PEI NS NB PQ MB SK AB0
10
20
30
40
50
60
70
80
90
100
Own Province Other Province Outside Canada
Source: Statistics Canada 2006 Census Table 97-560-XWE2006024.
Which is significant since it poses different policy challenges
• Issues with credential recognition and upgrading • Very early mining of disaggregated data from the
2006 census points to anomalies in links between PSE attainment and labour market outcomes for immigrants

ADDING TO THE CURRENT STOCK OF HUMAN CAPITAL
Metrics and Targets for Participation
• Suggested metrics• Apprenticeship, college and university participation rates• Graduation rates
• Suggested targets 1. Participation and completion rates at least equal to those in leading
provinces 2. Rates equal to those in OECD nations 3. Completion rates equal to the estimated number of new jobs in next decade
requiring PSE
• For discussion• Target aggregate PSE participation rates, or distinguish among sectors and
expected credentials? • If latter, how to choose individual targets?
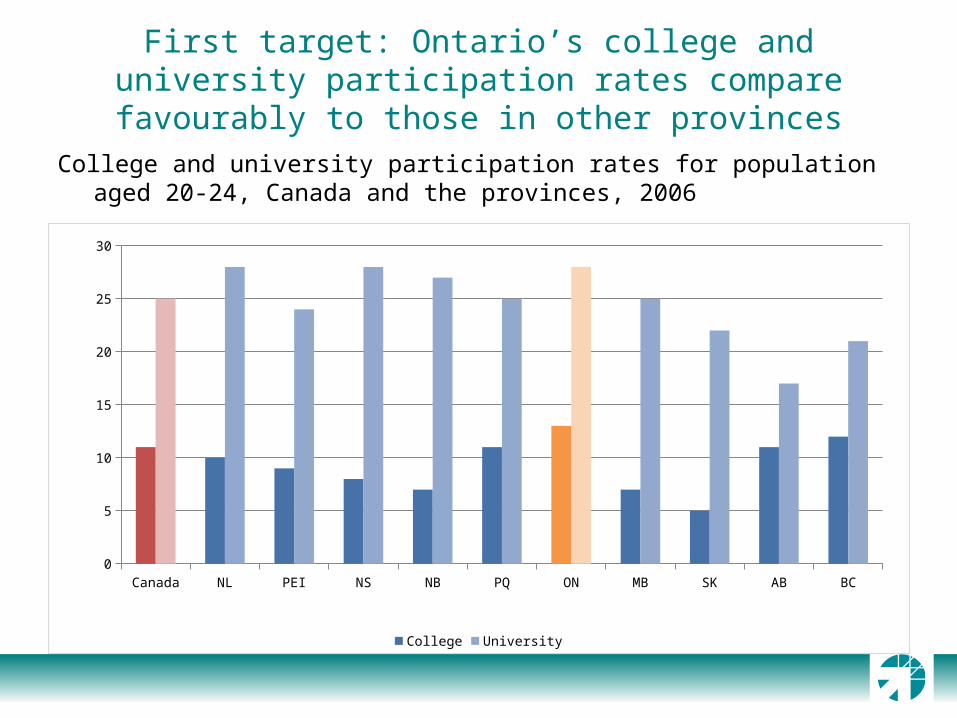
First target: Ontario’s college and university participation rates compare favourably to those in other provinces
Canada NL PEI NS NB PQ ON MB SK AB BC0
5
10
15
20
25
30
College University
College and university participation rates for population aged 20-24, Canada and the provinces, 2006
Second target: International comparisons
• Unable to judge as same issues of comparability

Third target: compare completion rates to predicted labour market needs
• Consensus for Canada is that two-thirds to three-quarters of new jobs created in next decade (2006-2016) will require PSE
• Often suggested that Ontario must increase its PSE participation rate• Florida and Martin• Toronto Star

But this interpretation is unduly pessimistic
• It is a fact that 40% of Ontarians aged 20-24 were registered in college or university in 2006 (Labour Force Survey) • Commonly cited participation statistic
• But it is also a fact that 40% of Ontarians aged 20-24 in 2006 had already graduated from an apprenticeship program, college or university (Census)• Apprenticeship 3.8%• College 18.2%• University 18.4%
• Might be led to conclude from these numbers that the eventual PSE attainment rate of Ontarians aged 20-24 in 2006 will be 80%
• But have to allow for • Double counting• Drop outs
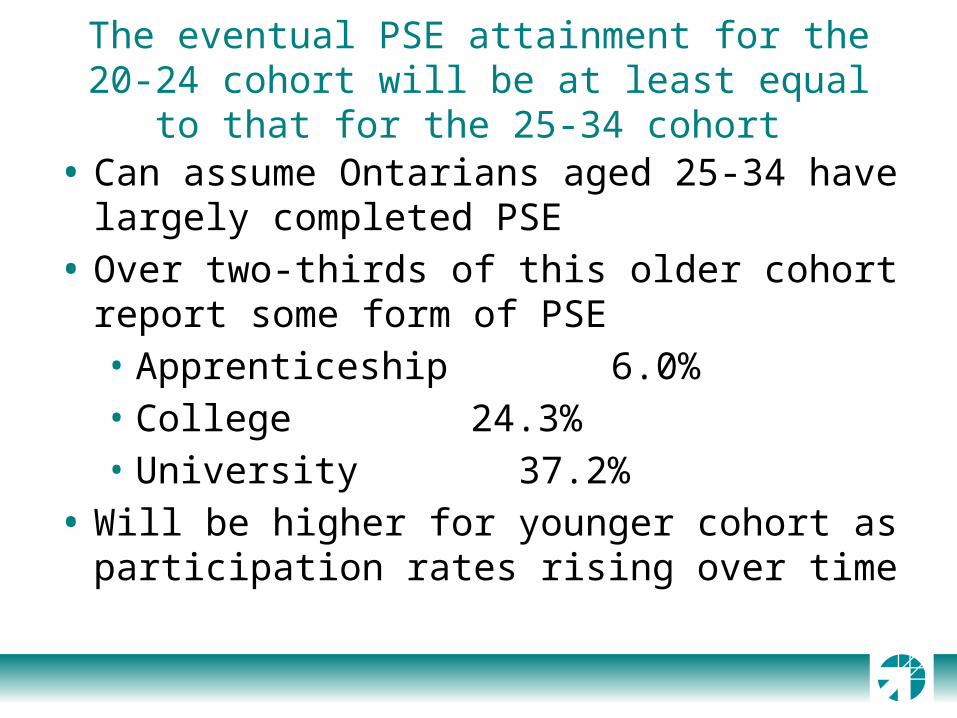
The eventual PSE attainment for the 20-24 cohort will be at least equal to that for the 25-34 cohort
• Can assume Ontarians aged 25-34 have largely completed PSE
• Over two-thirds of this older cohort report some form of PSE• Apprenticeship 6.0%• College 24.3%• University 37.2%
• Will be higher for younger cohort as participation rates rising over time
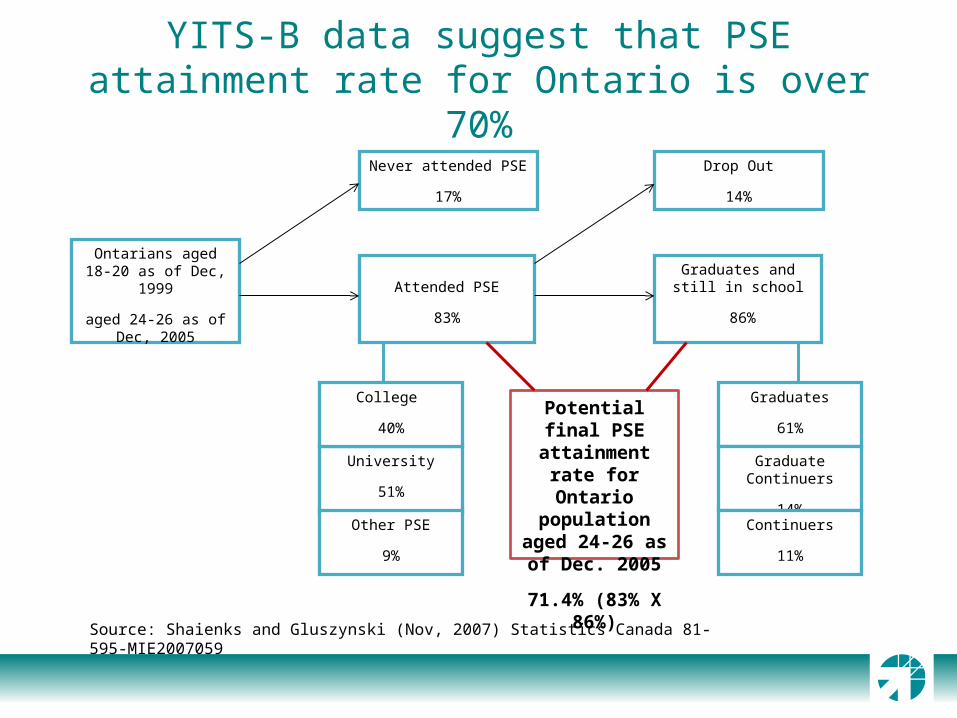
YITS-B data suggest that PSE attainment rate for Ontario is over 70%
Ontarians aged 18-20 as of Dec, 1999
aged 24-26 as of Dec, 2005
Attended PSE
83%
Never attended PSE
17%
University
51%
College
40%
Other PSE
9%
Drop Out
14%
Source: Shaienks and Gluszynski (Nov, 2007) Statistics Canada 81-595-MIE2007059
Graduates
61%
Graduate Continuers
14%
Continuers
11%
Graduates and still in school
86%
Potential final PSE attainment rate for Ontario population
aged 24-26 as of Dec. 2005
71.4% (83% X 86%)
Thus we can bracket probable attainment rates for cohort aged 20-24
• Not lower than 67% • At least as high as attainment rates for Ontarians aged 25-34
• Below 80%• 80% figure ignores double counting and probable drop outs
• YITS number (71.4%) within this range • Possible upward bias due to falling report rates

In sum• Ontario’s aggregate human capital stock compares favourably to those in
other provinces• Thanks in significant measure to immigration
• Meaningful international comparisons or PSE attainment are not possible• The rate at which Ontario is adding to its aggregate capital stock compares
favourably to rates in other provinces • As with PSE attainment, meaningful international comparisons of
participation rates are not possible • Probable PSE attainment rates for the 20-24 cohort appear in line with
projected labour market requirements• These observations apply to aggregate PSE attainment levels and
participation rates; no attention to sector and program mix

But significant challenges remain (for system and hence for HEQCO)
• Unique challenges to increasing participation and graduation rates of traditionally under-represented groups
• Ensuring adequate and sustainable funding• Dealing with capacity constraints, particularly in GTA• Balancing undergraduate accessibility with graduate
expansion and research expectations • Aligning with anticipated knowledge and skill requirements • Determining appropriate college-university interaction• Ensuring effective accountability
• MAINTAINING AND ENHANCING QUALITY!

Thank you