An Actuarial Approach to Measuring Media Effectiveness · PDF file8 Proctor & Gamble 60-65...
44
An Actuarial Approach to Measuring Media Effectiveness Adam Driussi
Transcript of An Actuarial Approach to Measuring Media Effectiveness · PDF file8 Proctor & Gamble 60-65...
An Actuarial Approach to Measuring Media Effectiveness
Adam Driussi

• The Media Market• Case Study – MortgageCo
• Approach• Modelling Results• Model Applications
• Conclusions
Presentation Outline

• Financial results of advertising spend are rarely measured with the same degree of rigour and science as other lines of expenditure• Quite often, very little science is applied to the planning of media investments going forward
Introduction

“I know that half my advertising is wasted, I just don’t know which half”
Lord Leverhulme
Introduction

Australian companies spent over $10.4bn on advertising in 2004
Annual Media Spend
0.0
2.0
4.0
6.0
8.0
10.0
12.0
1992 1993 1994 1995 1996 1997 1998 1999 2000 2001 2002 2003 2004
Year
Med
ia S
pend
($bn
)
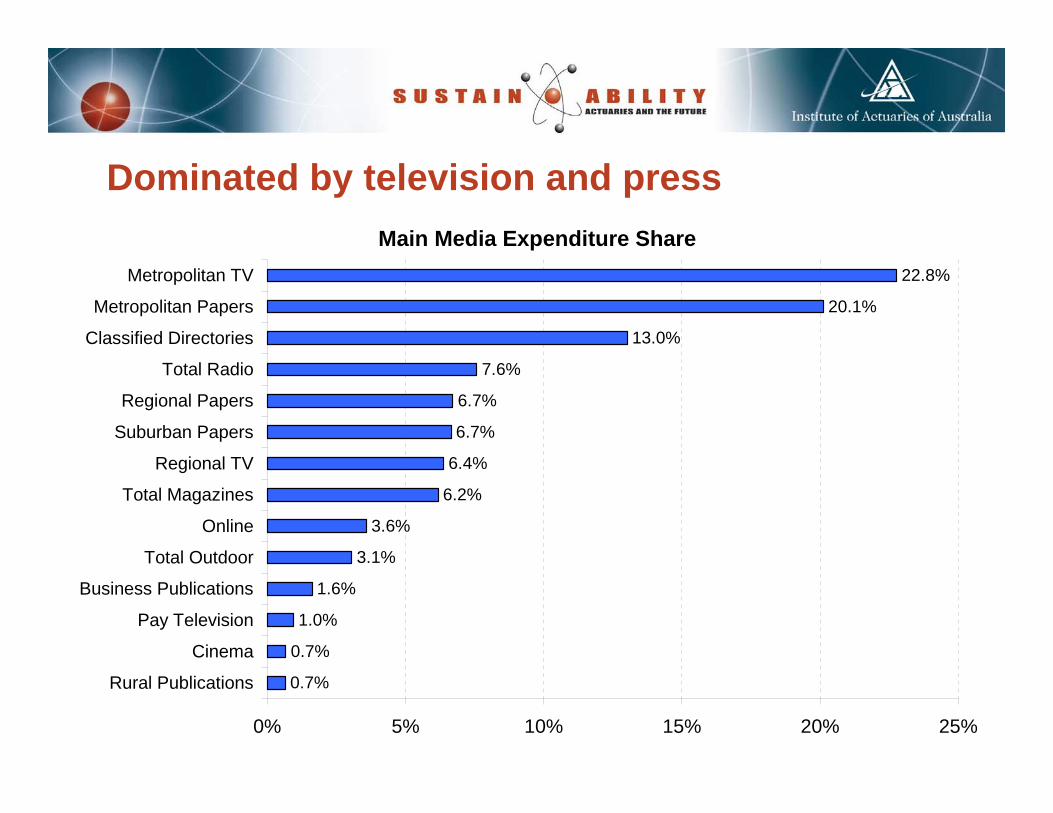
Dominated by television and pressMain Media Expenditure Share
0.7%
0.7%
1.0%
1.6%
3.1%
3.6%
6.2%
6.4%
6.7%
6.7%
7.6%
13.0%
20.1%
22.8%
0% 5% 10% 15% 20% 25%
Rural Publications
Cinema
Pay Television
Business Publications
Total Outdoor
Online
Total Magazines
Regional TV
Suburban Papers
Regional Papers
Total Radio
Classified Directories
Metropolitan Papers
Metropolitan TV
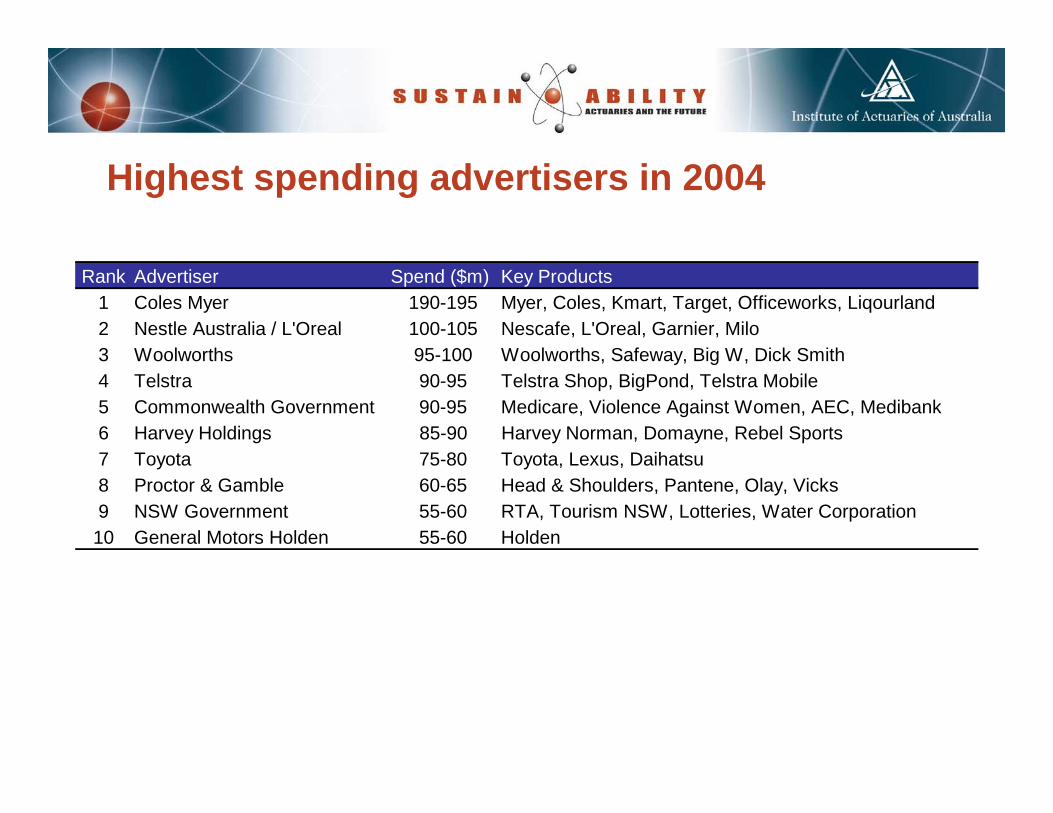
Highest spending advertisers in 2004
Rank Advertiser Spend ($m) Key Products1 Coles Myer 190-195 Myer, Coles, Kmart, Target, Officeworks, Liqourland2 Nestle Australia / L'Oreal 100-105 Nescafe, L'Oreal, Garnier, Milo3 Woolworths 95-100 Woolworths, Safeway, Big W, Dick Smith4 Telstra 90-95 Telstra Shop, BigPond, Telstra Mobile5 Commonwealth Government 90-95 Medicare, Violence Against Women, AEC, Medibank6 Harvey Holdings 85-90 Harvey Norman, Domayne, Rebel Sports7 Toyota 75-80 Toyota, Lexus, Daihatsu8 Proctor & Gamble 60-65 Head & Shoulders, Pantene, Olay, Vicks9 NSW Government 55-60 RTA, Tourism NSW, Lotteries, Water Corporation
10 General Motors Holden 55-60 Holden

Only 3 financial institutions make the Top 50…
$40-45m and 25th overall
$35-40m and 32nd overall
$25-30m and 43rd overall

It is estimated that consumers see 10,000 advertising messages per day
• 99% of Australian homes have television• Newspapers reach 84% of population• Commercial radio reaches 78% of Australians each week• The reach of magazines as an industry continues to increase• 75% of Australians have internet access

Increasingly, marketers are being held accountable for their investments
• Advertisers across the board are seeking more robust data to support their spending decisions• Numerous challenges involved for marketers• Many existing media effectiveness models, however, suffer from a number of limitations

Limitations of existing media models
• Often based on subjective inputs• Limited separation between brand building and response objectives• Often no explicit relationship between cause and effect• Many models focus predominantly on television• Typically a limited feedback loop (or control cycle) to assess the on-going effectiveness of the model• Typically offered by media agencies who are incentivised to maintain and grow media expenditure!

Case Study: MortgageCo

Inputs OutcomesEx
tern
al F
acto
rs(U
ncon
trol
labl
e)In
tern
al F
acto
rs
(Con
trol
labl
e) Media Used
Offer & Creative
Market Conditions
Competitor Activity
Enquiries
Brand Tracking
Performance Efficiency
&Brand Growth
Sales
Inputs OutcomesEx
tern
al F
acto
rs(U
ncon
trol
labl
e)In
tern
al F
acto
rs
(Con
trol
labl
e) Media Used
Offer & Creative
Market Conditions
Competitor Activity
Enquiries
Brand Tracking
Performance Efficiency
&Brand Growth
Sales

Historical leads generated by week
Jul
Aug
Sep Oct
Nov
Dec Jan
Feb
Mar
Apr Ma
Jun
Jul
Aug
Sep Oct
Nov
Dec Jan
Feb
Mar
Apr Ma
Jun
Jul
Aug
Sep Oct
Nov
Dec Jan
Feb
Mar
Apr
2002 2003 2004 2005
Week
Lead
s G
ener
ated
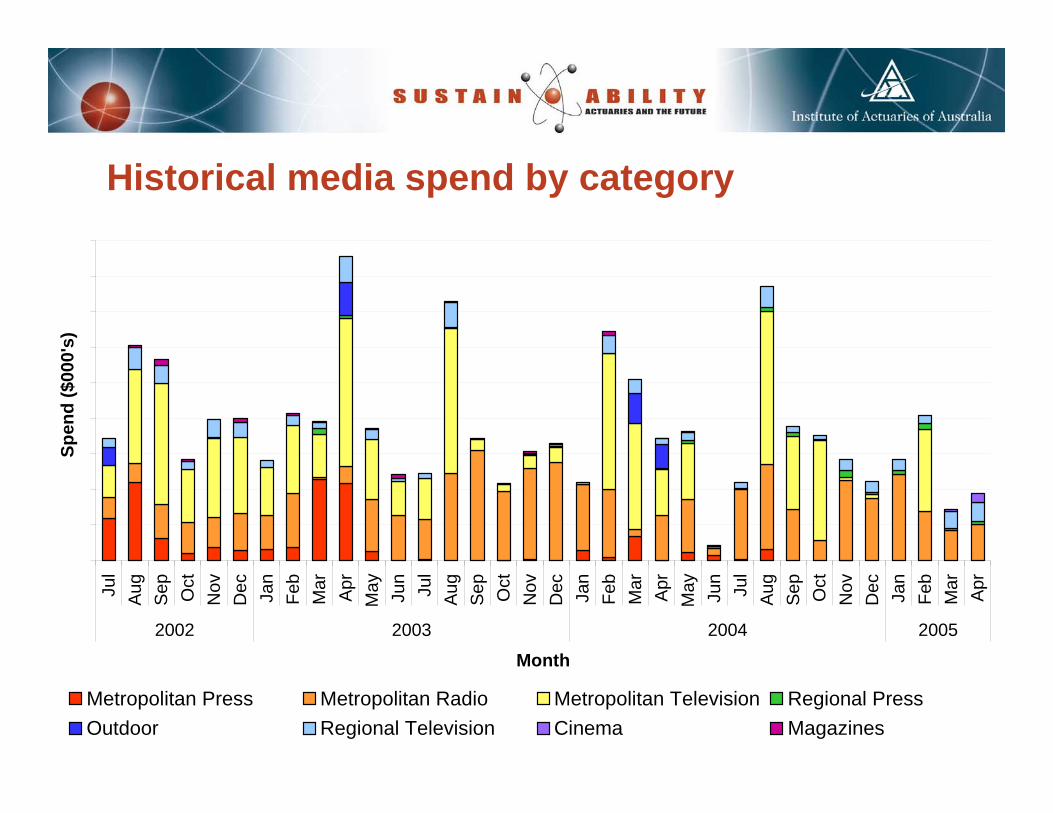
Historical media spend by category
Jul
Aug
Sep
Oct
Nov
Dec Jan
Feb
Mar Apr
May Jun
Jul
Aug
Sep
Oct
Nov
Dec Jan
Feb
Mar Apr
May Jun
Jul
Aug
Sep
Oct
Nov
Dec Jan
Feb
Mar Apr
2002 2003 2004 2005
Month
Spen
d ($
000'
s)
Metropolitan Press Metropolitan Radio Metropolitan Television Regional PressOutdoor Regional Television Cinema Magazines
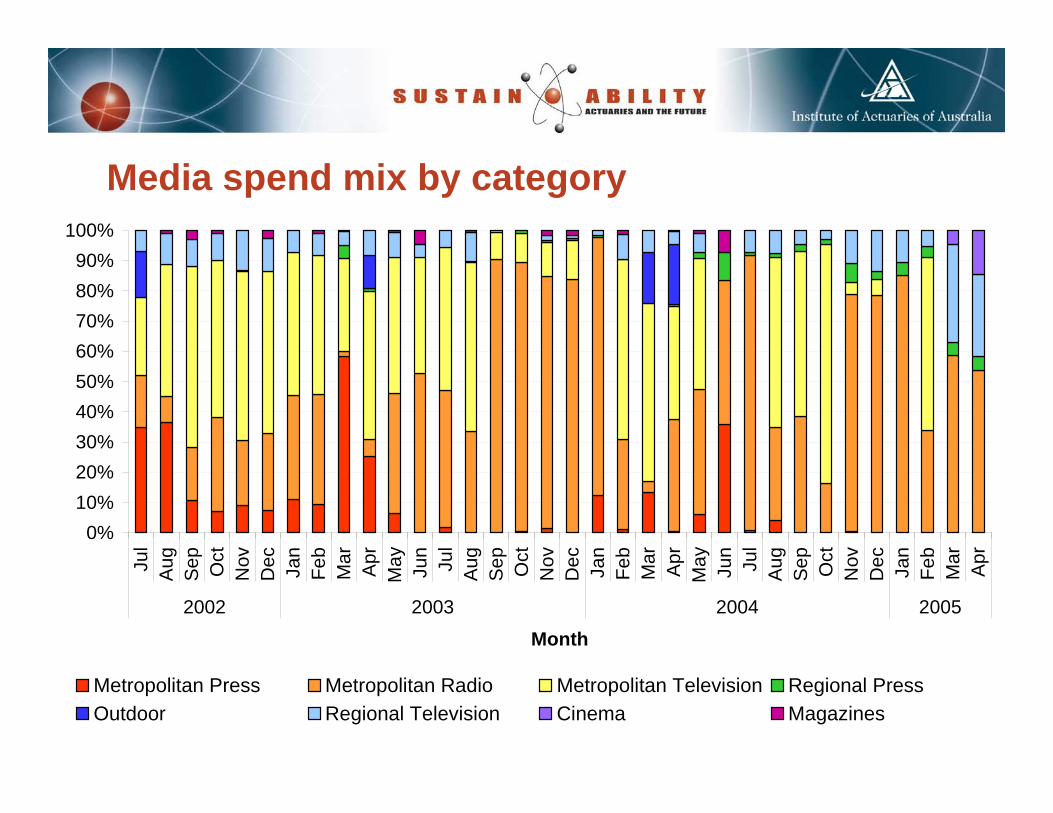
Media spend mix by category
0%10%20%30%40%50%60%70%80%90%
100%
Jul
Aug
Sep Oct
Nov
Dec Jan
Feb
Mar
Apr
May Jun
Jul
Aug
Sep Oct
Nov
Dec Jan
Feb
Mar
Apr
May Jun
Jul
Aug
Sep Oct
Nov
Dec Jan
Feb
Mar
Apr
2002 2003 2004 2005
Month
Metropolitan Press Metropolitan Radio Metropolitan Television Regional PressOutdoor Regional Television Cinema Magazines

There are a range of other external factors which also need to be controlled for• The level of activity in the market (i.e. market size)• Seasonality• Competitor activity

Approach
• A wide range of factors were tested simultaneously for their impact on lead volumes, including many out of MortgageCo’s control• We extracted detailed information from MortgageCo’ssystems including particulars relating to MortgageCo’shistoric media schedule and to each lead generated
There are a variety of potential measures of exposure to measure media response
• Spend• Opportunities to see/hear • Impacts• Reach • Frequency
Each media channel has its own variation for determining impacts
• Television – TARPs• Radio – Listenership• Press and Magazines – Readership• Online – Impressions• Cinema – Cinema audiences• Billboards – RTA (and equivalent) traffic data• Bus Panels – Traffic data and relevant bus routing maps are helpful in estimating impacts for bus panels.
Media data collated for MortgageCo and each competitor
• Television• Radio• Press• Community Press• Magazines• Online• Cinema• Outdoor
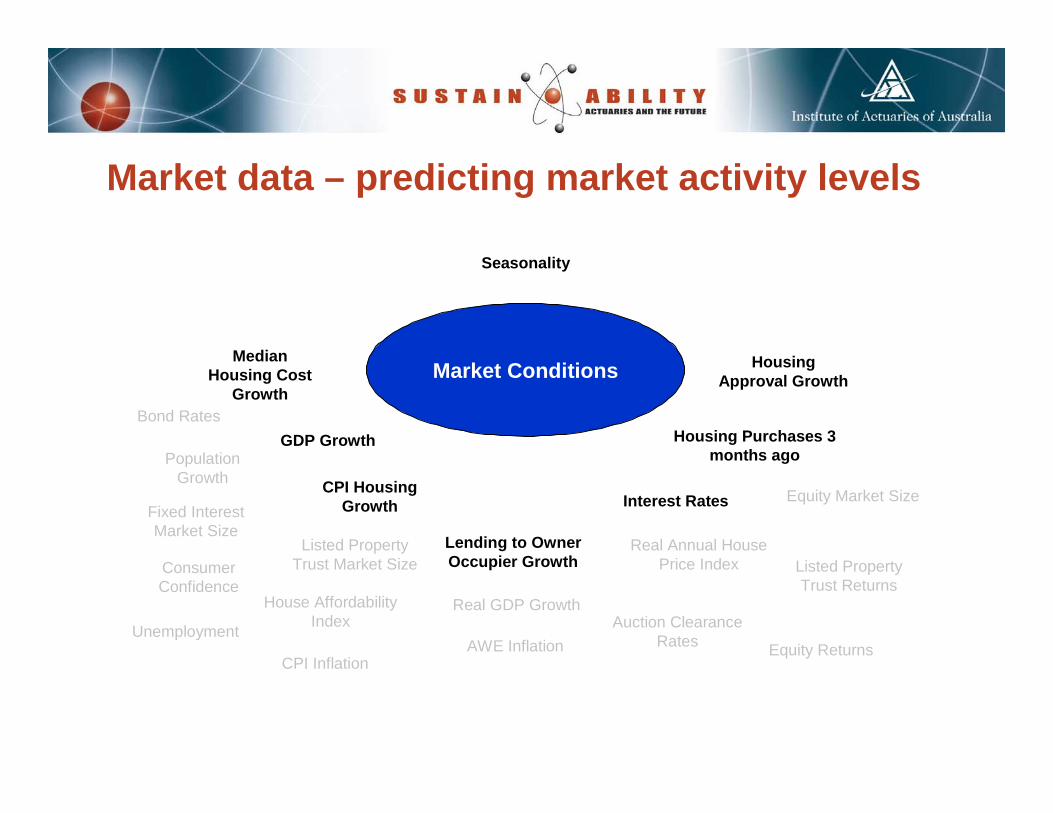
Market data – predicting market activity levels
Market Conditions
Seasonality
Median Housing Cost
Growth
GDP Growth
CPI Housing Growth
Housing Approval Growth
Housing Purchases 3 months ago
Interest Rates
Lending to Owner Occupier Growth
Bond Rates
Population Growth
Unemployment
Consumer Confidence
CPI Inflation
House Affordability Index
Real GDP Growth
Real Annual House Price Index
AWE InflationAuction Clearance
Rates Equity Returns
Equity Market SizeFixed Interest Market Size
Listed Property Trust Returns
Listed Property Trust Market Size
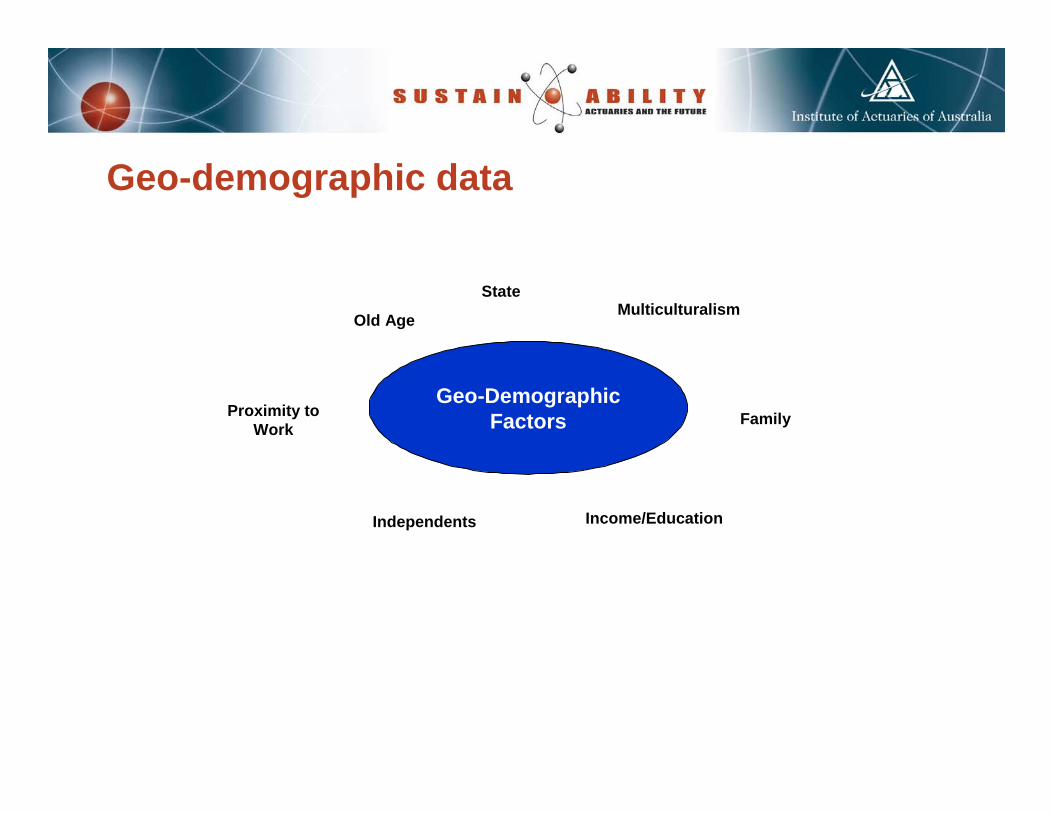
Geo-demographic data
Geo-Demographic Factors
Income/Education
Old Age Multiculturalism
FamilyProximity to Work
Independents
State
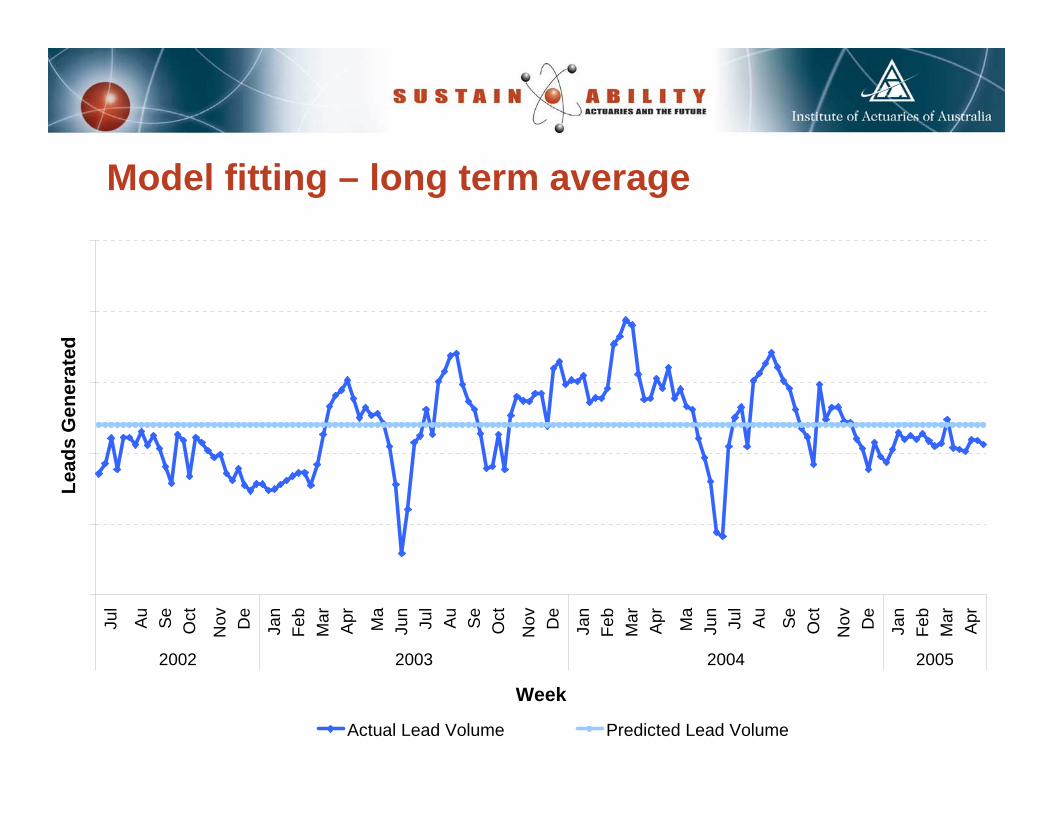
Model fitting – long term average
Jul
Au Se Oct
Nov De
Jan
Feb
Mar
Apr Ma
Jun
Jul
Au Se Oct
Nov De
Jan
Feb
Mar
Apr Ma
Jun
Jul
Au Se Oct
Nov De
Jan
Feb
Mar
Apr
2002 2003 2004 2005
Week
Lead
s G
ener
ated
Actual Lead Volume Predicted Lead Volume

Model fitting – MortgageCo’s spend only
Jul
Au Se Oct
Nov De
Jan
Feb
Mar
Apr Ma
Jun
Jul
Au Se Oct
Nov De
Jan
Feb
Mar
Apr Ma
Jun
Jul
Au Se Oct
Nov De
Jan
Feb
Mar
Apr
2002 2003 2004 2005
Week
Lead
s G
ener
ated
Actual Lead Volume Predicted Lead Volume
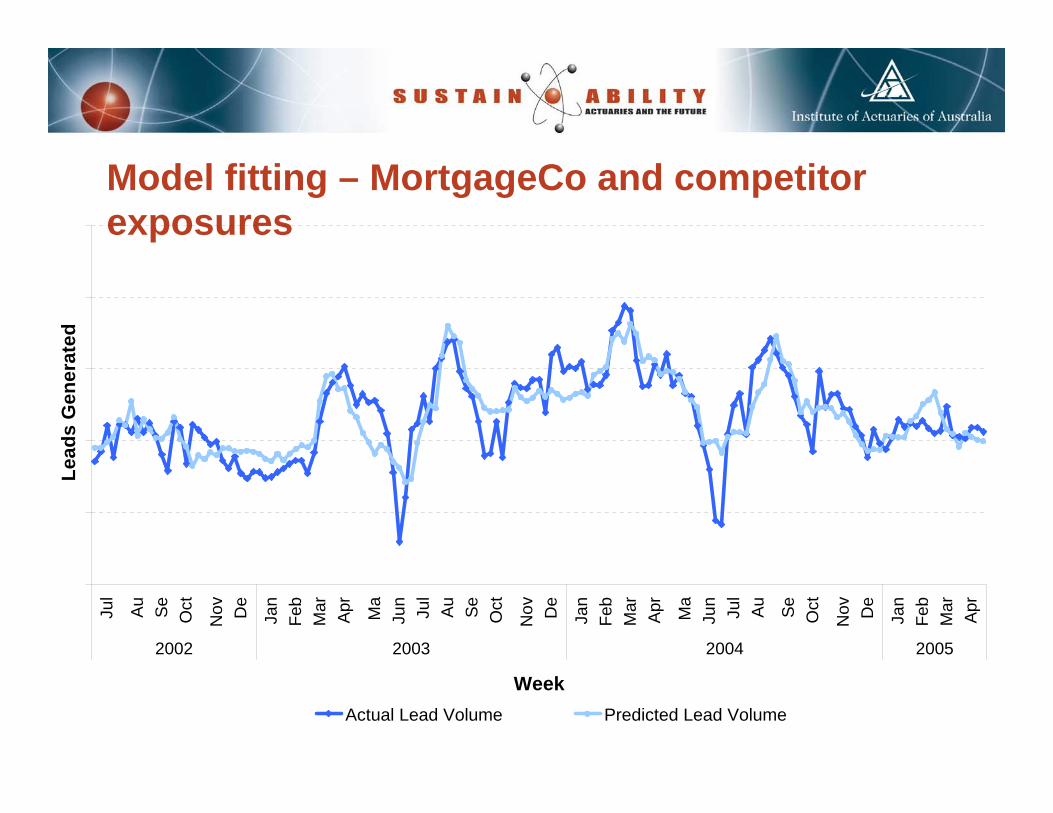
Model fitting – MortgageCo and competitor exposures
Jul
Au Se Oct
Nov De
Jan
Feb
Mar
Apr
Ma
Jun
Jul
Au Se Oct
Nov De
Jan
Feb
Mar
Apr
Ma
Jun
Jul
Au Se Oct
Nov De
Jan
Feb
Mar
Apr
2002 2003 2004 2005
Week
Lead
s G
ener
ated
Actual Lead Volume Predicted Lead Volume

Model testing
• The models developed were then tested rigorously against various hold-out samples and new data periods to ensure their predictive power

Scenario testing, simulation and optimisation
• Once the models proved to be predictive we were able to test a range of alternative media strategies prior to implementation• The natural extension of scenario testing was to find the scenario which provided the optimal outcome for a given set of objectives and constraints

Modelling results
• Tested over 400 factors – final models incl approx 30• For commercial reasons will only show a subset of factors identified• Results relate specifically to MortgageCo and will be different for other advertisers, products and industries

Television
Impact of Number of TARPs (Ages 25-54) in Last 8 Weeks
Number of TARPS (Ages 25 - 54 Years Old) in the Last 8 Weeks
Rel
ativ
e Le
ad
Vol
umes
0%10%20%30%40%50%60%70%80%90%100%
Exp
osur
e
Exposure Prediction

Plus a wide range of factors within television…
• Television Network• Region• Day Part• Genre• Day of the Week• Duration of Advertisement• Position in Break

Radio
Impact of # Radio Ads per 1,000 People in the Last 4 Weeks
Number of Radio Ads Per 1000 People in the Last 4 Weeks
Rel
ativ
e Le
ad
Vol
umes
0%10%20%30%40%50%60%70%80%90%100%
Exp
osur
e
Exposure Prediction
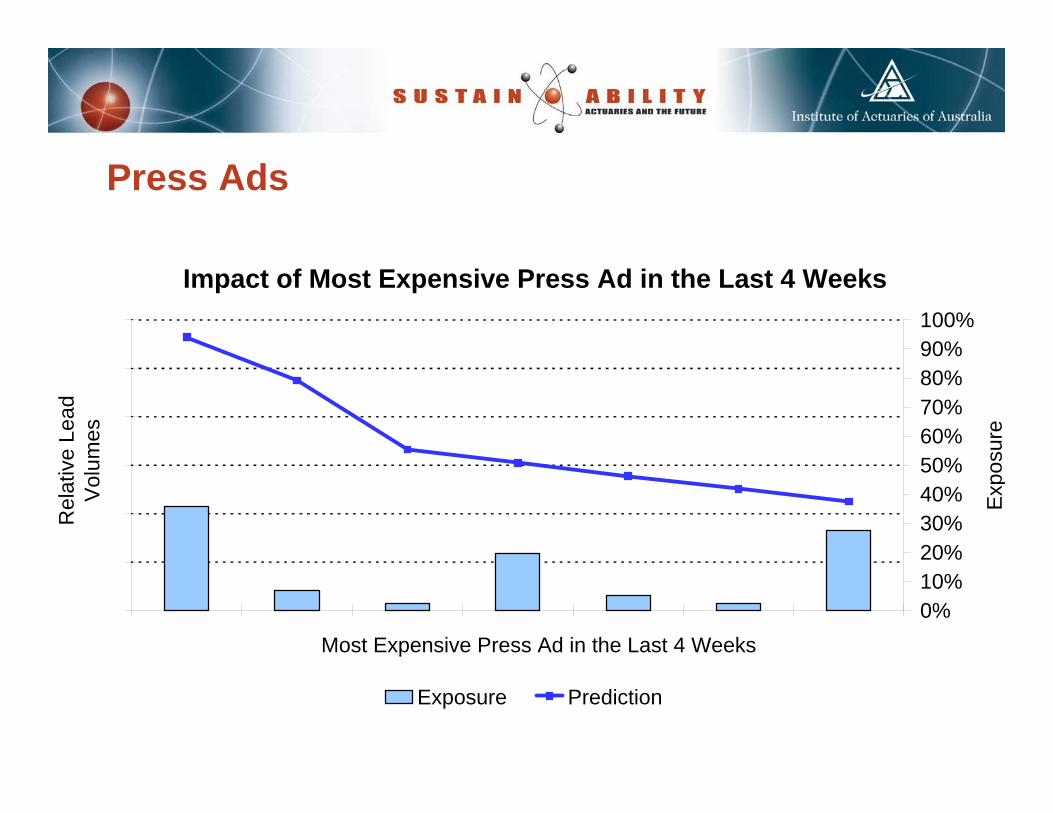
Press Ads
Impact of Most Expensive Press Ad in the Last 4 Weeks
Most Expensive Press Ad in the Last 4 Weeks
Rel
ativ
e Le
ad
Vol
umes
0%10%20%30%40%50%60%70%80%90%100%
Exp
osur
e
Exposure Prediction
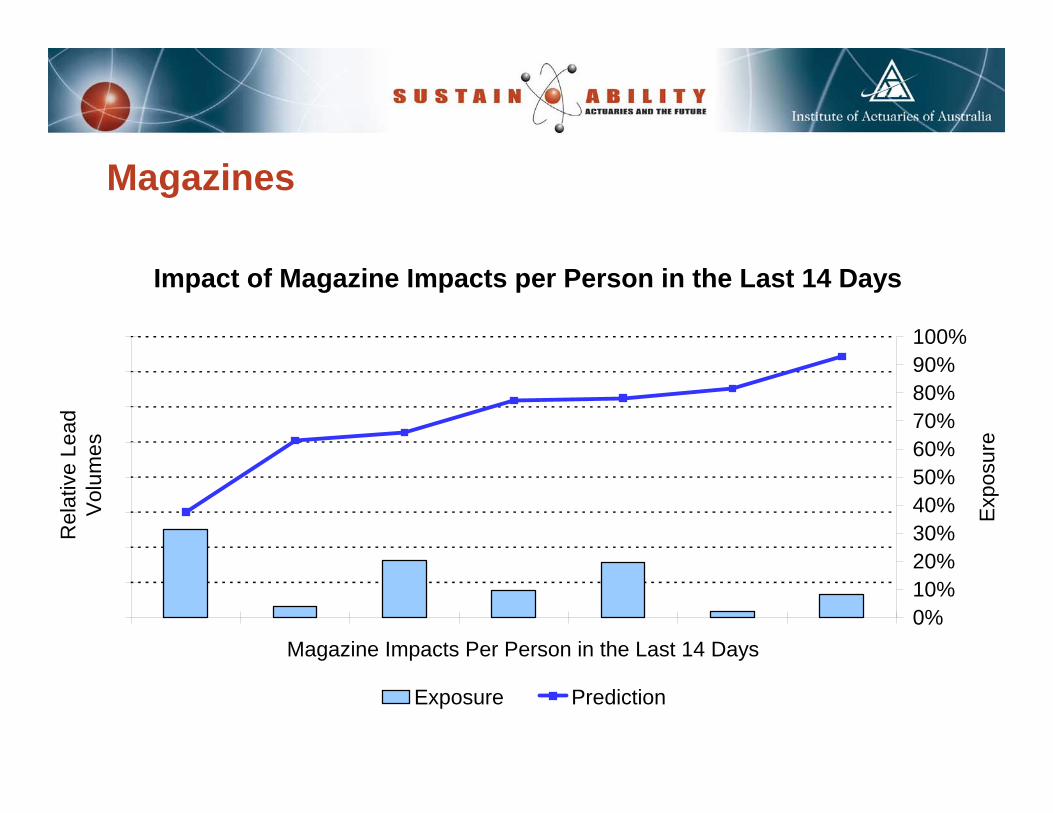
Magazines
Impact of Magazine Impacts per Person in the Last 14 Days
Magazine Impacts Per Person in the Last 14 Days
Rel
ativ
e Le
ad
Vol
umes
0%10%20%30%40%50%60%70%80%90%100%
Exp
osur
e
Exposure Prediction

Online
Impact of Online Impressions per Person in the Last 7 Days
Number of Online Impressions Per Person in the Last 7 Days
Rel
ativ
e Le
ad
Vol
umes
0%10%20%30%40%50%60%70%80%90%100%
Exp
osur
e
Exposure Prediction

Model applications
• Strategic media allocation• Tactical media allocation• Optimising flighting patterns• Negotiating media placements• Determining supply-side strategies• Measuring sales driven by brand
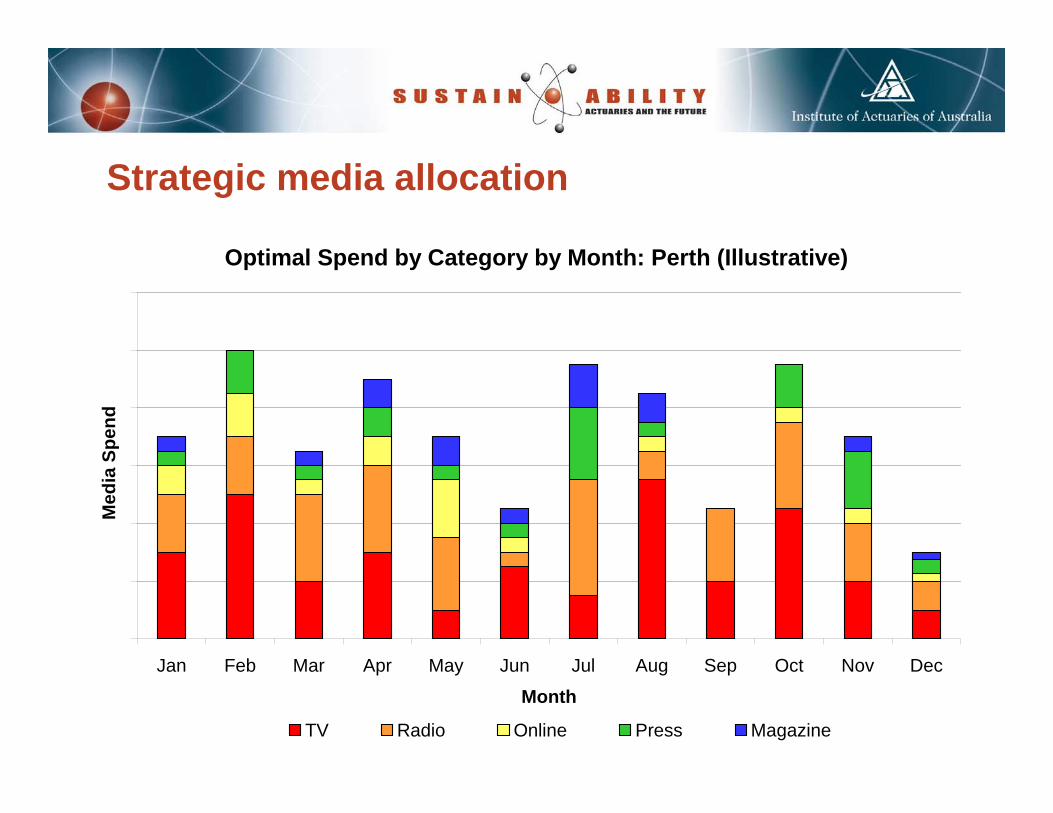
Strategic media allocation
Optimal Spend by Category by Month: Perth (Illustrative)
Jan Feb Mar Apr May Jun Jul Aug Sep Oct Nov Dec
Month
Med
ia S
pend
TV Radio Online Press Magazine
Tactical media allocation
• Certain mediums generate immediate responses whilst other mediums require sustained activities over a longer period before they generate significant lead volumes• Understanding the ‘response curve’ of each medium in this way enables MortgageCo to choose the most appropriate media activities for short term tactical purposes

Optimising flighting patterns
Scenario C
1 2 3 4Week
Med
ia S
pend
Sale
s
Scenario A
1 2 3 4Week
Med
ia S
pend
Sale
sScenario D
1 2 3 4Week
Med
ia S
pend
Sale
s
Scenario B
1 2 3 4Week
Med
ia S
pend
Sale
s
Media Spend Leads

Negotiating media placements
• Knowing the impact of advertising with different media owners can give media buyers a significant advantage in their negotiating placement of advertisements• In the case of MortgageCo we were able to identify which television networks provided the highest return on marketing investment in each region, enabling MortgageCo to use this information in the negotiation process if required

Determining supply side strategiesBrisbane City
South QueenslandNorth Queensland
Sydney CitySydney NorthSydney West
NewcastleWollongong
CanberraNorthern New South WalesSouthern New South Wales
Melbourne CityMelbourne East
GippslandVictoria Country
AdelaideSA Country
PerthWA Country
TasmaniaNorthern Territory

Determining supply side strategies
UnleyUnleyUnleyUnleyUnleyUnleyUnleyUnleyUnley
AdelaideAdelaideAdelaideAdelaideAdelaideAdelaideAdelaideAdelaideAdelaide
Norwood Payneham St PetersNorwood Payneham St PetersNorwood Payneham St PetersNorwood Payneham St PetersNorwood Payneham St PetersNorwood Payneham St PetersNorwood Payneham St PetersNorwood Payneham St PetersNorwood Payneham St Peters
BurnsideBurnsideBurnsideBurnsideBurnsideBurnsideBurnsideBurnsideBurnside
MarionMarionMarionMarionMarionMarionMarionMarionMarion
Holdfast BayHoldfast BayHoldfast BayHoldfast BayHoldfast BayHoldfast BayHoldfast BayHoldfast BayHoldfast Bay MitchamMitchamMitchamMitchamMitchamMitchamMitchamMitchamMitcham
West TorrensWest TorrensWest TorrensWest TorrensWest TorrensWest TorrensWest TorrensWest TorrensWest Torrens
Charles SturtCharles SturtCharles SturtCharles SturtCharles SturtCharles SturtCharles SturtCharles SturtCharles SturtWalkervilleWalkervilleWalkervilleWalkervi lleWalkervi lleWalkervilleWalkervilleWalkervilleWalkervi lle
ProspectProspectProspectProspectProspectProspectProspectProspectProspect CampbelltownCampbelltownCampbelltownCampbell townCampbell townCampbelltownCampbelltownCampbelltownCampbell town
Mount BarkerMount BarkerMount BarkerMount BarkerMount BarkerMount BarkerMount BarkerMount BarkerMount Barker
Adelaide HillsAdelaide HillsAdelaide HillsAdelaide HillsAdelaide HillsAdelaide HillsAdelaide HillsAdelaide HillsAdelaide Hills
Tea Tree GullyTea Tree GullyTea Tree GullyTea Tree GullyTea Tree GullyTea Tree GullyTea Tree GullyTea Tree GullyTea Tree Gully
Port Adelaide EnfieldPort Adelaide EnfieldPort Adelaide EnfieldPort Adelaide EnfieldPort Adelaide EnfieldPort Adelaide EnfieldPort Adelaide EnfieldPort Adelaide EnfieldPort Adelaide Enfield

Measuring brand impact on sales
• By extracting the impact of media on short term sales, we are able to identify the volume of sales generated by the existing strength of the brand• Allows us to effectively allocate and justify the cost of marketing activity between brand building for the long term, and short term sales activity
Conclusions
• Companies are increasingly evaluating every line of expenditure to drive down costs• For those that do attempt to calculate ROI, the resulting metric is often seriously flawed• By applying fundamental actuarial principles allowing us to understand the relationship between promotional activity and sales, we can help advertisers more efficiently allocate their budgets • This promises to be a significant shift in thinking for an area relatively weak at evaluating performance, but perhaps one that is well overdue