AN ABSTRACT OF THE THESIS OF David Ben Lacapa Benavente ...
96
Transcript of AN ABSTRACT OF THE THESIS OF David Ben Lacapa Benavente ...


AN ABSTRACT OF THE THESIS OF David Ben Lacapa Benavente for the Master
of Science in Biology presented April 17, 2014.
Title: TEMPORAL AND SPATIAL CHARACTERIZATION OF LAOLAO BAY CORAL-REEF FISH ASSEMBLAGES: STATUS AND FUNCTION Approved: _____________________________________________________________ Peter C. Houk, Chairman, Thesis Committee
Laolao Bay represents a culturally and economically important natural resource
on Saipan, Commonwealth of the Northern Mariana Islands (CNMI). This study used a
unique historical baseline to examine how coral reef assemblages have shifted across the
bay over the past two decades. Subsequently, the study also examined the plausible
drivers of change. Initial analyses found a significant decrease in functional, food fish
densities for all sites across the bay. This decline mainly consisted of reductions in the
majority of large-bodied herbivores as well as secondary consumers. The declines in
larger-bodied fish groups were accompanied by a shift in dominance to smaller-bodied
counterparts; mainly opportunistic parrotfishes and surgeonfishes that rapidly respond to
disturbances and altered environments, yet have limited functional roles due to their
smaller adult body sizes. When grouping sites across the bay, these generalized trends
were due to a reduction in the density of several species (Monotaxis grandoculus, Naso
unicornis, Naso lituratus, Chlorurus sordidus, Scarus rubroviolaceus, and other mixed
acanthurids), and the spatially-inconsistent increase in density in some species of

rabbitfish (Siganus spp.), a small-bodied grouper (Cephalopholis urodeta), and mixed
small-bodied parrotfishes besides Chlorurus sordidus). Unexpectedly, depth (15m as
compared to 5m) did not offer refuge for food fish populations. Coral assemblages also
declined markedly across Laolao Bay over the past 20 years. Most sites had a significant
reduction in mean colony sizes, and a shift in species assemblages to tolerant
assemblages dominated by smaller colonies offering less reef architecture. Interestingly,
the decline in both coral and fish assemblages was not spatially consistent across Laolao,
with gradients in wave exposure, watershed geology, and water quality representing
influential correlates of change. Analyses indicated that both water quality and wave
exposure had associations with the fishes, corals, and benthic substrates that suggested
similar plausible pathways for explaining change since 1992, and the spatial gradients in
2012. Diminished water quality across space and through time had a similar, positive
association with small-bodied species, and negative association with larger-bodied,
mixed species assemblages. Given that no evidence existed to link the gradient in water
quality with coral assemblages or benthic substrates, which were expected intermediary
drivers of habitat loss and larger-bodied fish declines, the major driver of bay-wide coral
declines were attributed more towards compromised fish assemblages (i.e., herbivory
loss) rather than water quality. In support, the gradient in benthic substrate condition was
best predicted by wave exposure (historical analyses) in combination with herbivore
assemblages (2012 spatial gradients). Wave exposure was also associated with more
heterogeneous fish assemblages (i.e., a diversity of large-and-small bodied species),
attributed to enhanced flushing and reduced fisher access with exposure. However,
significant declines in water quality were inferred through time for two sites, representing

site-specific instances where water quality impacts were greatest. Together, both bottom-
up and top-down processes appeared to be influential to temporal and spatial dynamics in
coral-reef assemblages across Laolao, yet stronger evidence existed for herbivory-
mediated change when considering the reef slopes habitats across the bay as a single
entity. Collection of fishery-dependent data are recommended to better understand how
fishing pressure influences change at Laolao Bay. The present datasets depicted plausible
pathways for negative changes in coral reef resources across an economically and
culturally significant habitat in CNMI, providing resource managers with foundational
knowledge to improve the conservation of Laolao Bay.

TO THE OFFICE OF GRADUATE STUDIES The members of the committee approve the thesis of David Ben Lacapa Benavente presented May 2, 2014. __________________________________________ Peter C. Houk, Chairman __________________________________________ Alexander Kerr, Member __________________________________________ Ryan Okano, Member _________________________________________________ __________________ John A. Peterson, Ph.D. Date Assistant Vice President, Acting Of Graduate Studies, Sponsored Programs And Research
TEMPORAL AND SPATIAL CHARACTERIZATION OF LAOLAO BAY CORAL-REEF FISH ASSEMBLAGES: STATUS AND
FUNCTION
BY
David Ben Lacapa Benavente
A thesis submitted in partial fulfillment of the requirements for the degree of
MASTER OF SCIENCE
IN
BIOLOGY
UNIVERSITY OF GUAM MAY 2014

i
Acknowledgements:
I would like to first thank almighty God for giving me my advisor, Dr. Peter
Houk. Although his guidance and support has strengthened me as a researcher, more
importantly, his friendship has remained constant throughout, a true brother. I would like
to thank my committee member, Dr. Alex Kerr, for all of his statistical support, where
would I be without the knowledge of distributions. I would like to thank my committee
member, Dr. Ryan Okano, for always being down to fish, and for teaching me valuable
scientific techniques and life skills. Thank you to Frances Castro for investing time and
effort in my project, and for believing in me through the past four and a half years. I
would like to thank John Iguel and Vicente Cabrera for keeping me “normal” throughout
this entire process; Kalani Reyes and Rodney Camacho for all the, much appreciated,
technical support. I would like to thank AJ Reyes, Jude Martinez, Jason Miller, Joe
Cummings, Jaques Idechong, Kyle Ngiratregd, Robbie Alexander, Cie, Mai, Travis, and
the rest of the ML crew/affiliates for all the good times at the lab; we partied till they
kicked us out. To my sisters, Darrah and Sewa and Linoa, thank you for your emotional
support for the past 29 years. To my brother Jere, thanks for motivating me to always be
better than I am. My heartfelt thanks to my mother and father for their never-ending
sacrifice and guidance, I hope I can make you proud. I would like to extend a very special
thank you to Yolani, Winfred and Father Ed for all the laughs, tears, and good times to
come. Thank you to my loves, Chinnelle and Iku, for encouraging me, teaching me, and
strengthening me emotionally and mentally throughout this entire process. Finally,
kalangan’ to Nohno Henolynn I dedicate this to you and Iku Madau. Si Yuus ma’ase.

ii
Table of Contents
Acknowledgements: ........................................................................................................... i
List of Tables .................................................................................................................... iii
List of Figures ................................................................................................................... iv
Introduction: ..................................................................................................................... 1
Shifting Baselines: ......................................................................................................... 3 Compromised Fisheries and Water Quality as Localized Stressors to Coral Reefs:......................................................................................................................................... 5 Laolao Bay, Commonwealth of the Northern Mariana Islands: .............................. 7
Methods: .......................................................................................................................... 11
Site Background: ............................................................................................................. 11
Ecological Data Collection: ........................................................................................ 13 Environmental Data collection: ................................................................................. 17 Data Analysis:.............................................................................................................. 19
Results: ............................................................................................................................. 26
Environmental Data: .................................................................................................. 26 Biological Data: ........................................................................................................... 30 H01: ............................................................................................................................... 39
Temporal Analysis: ................................................................................................. 39 Spatial Analysis: ...................................................................................................... 46
H02: ............................................................................................................................... 50 Depth Analysis: ....................................................................................................... 50
H03: ............................................................................................................................... 54 Fish function roles as potential agents of benthic and coral assemblage change across Laolao Bay: .................................................................................................. 54
H04: ............................................................................................................................... 58 Coral assemblages as potential agents of fish assemblage change across Laolao Bay:........................................................................................................................... 58
Discussion: ....................................................................................................................... 60
Bibliography: ................................................................................................................... 70

iii
List of Tables
Table 1. List of fish, coral, and environmental variables which were used for historical
and present-day regression and correlation analysis…………………………………..…24
Table 2. ANOSIM results highlighting spatial trends in water quality data from 2011-12
sampling event……………………………………………………………..……....…….33
Table 3. Describes results of PERMANOVA, tests of significance, and their associated
p-values.…………………...……….………………………..………………………..41-43
Table 4. ANOSIM results of fish groupings in hierarchal order of site similarity for
spatial analysis.……………….…………………………………………………….……49
Table 5. Results of ANOSIM test in hierarchal order of significance, for each respective
sight grouping (H02)……………………………………………………………...….…..51
Table 6. Historical regression/correlation table showing variables responsible for driving
the greatest amount of variation in fish and coral assemblage change over time…..……57
Table 7. 2012 regression/correlation table displaying metrics responsible for the greatest
amount of changes to fish and coral assemblages of Laolao Bay. ………………...…….57
iv
List of Figures
Figure 1. Map of historical sites surveyed, as required by the CNMI government, prior to
construction of the Laolao Bay Golf Course………………………….....…………....…12
Figure 2. Map of survey sites for the present project depict the sub-watersheds of Laolao
Bay and the associated land practices for the areas throughout…………….……………14
Figure 3A-C. Designs for multivariate analysis of temporal, spatial and depth data
associated with metrics of fish assemblages……………………………………………..20
Figure 4. Regression Analysis design for H03 and H04,…………….…………………..23
Figure 5A-B. Satellite image of Laolao bay with water quality and ecological monitoring
stations shown, as well as the results of water quality profiling to understand natural
characteristics of Laolao discharge pattern………………….………………………27, 28
Figure 6. Boxplots summarizing freshwater discharge patterns associated with two
characteristics freshwater discharge regimes that existed in Laolao Bay (black lines
represents the median, the boxes indicates the 25th (lower) and 75th (upper) percentiles,
and the error bars indicate the 5th (lower) and 95th (upper) percentiles…………………29
Figure 7A-B. Principle components analysis and ordination of water quality (nutrient
and turbidity) data from monthly samples at six monitoring locations across Laolao Bay
(see Figure 1)………………….……………………………………………………..31, 32
Figure 8. Percent cover of dominant benthic substrates on Laolao Bay reef slopes.……35
Figure 9. Change in percent coral cover and colony density per m2 since 1992.……….36
Figure 10. Multi-dimensional scaling plot highlighting spatial and temporal trends in
Laolao Bay coral assemblages.……………………………………………………...…...37
Figure 11A-F. Trends in coral population demography since 1992 (see methods)…….38

v
Figure 12. Change in the population density of dominant fish in Laolao since
1992……………………………………………………………………………………....40
Figure 13. PCO Plot depicting differences in multivariate space between fish
assemblages of 1992 and those of the 2012…………………………………………..….44
Figure 14A-F. PCO plots illustrating fish assemblage similarities among study years
(1992 and 2012)……………..……………………………………………………….…..45
Figure 15A-B. MDS plots of fish assemblages across Laolao Bay for 1992 (A) and 2012
(B) with vector overlays to indicate species responsible for assemblage orientation in
multivariate space……………………………..…………………………………..……..47
Figure 16. MDS plot eliciting fish populations in multivariate space between the two
respective depth regimes…………………………………………………….……..…….52
Figure 17A-F. MDS plots with vector overlays depicting differences in fish population
biomass between depths throughout Laolao Bay. ………………………….……………53
Figure 18A-F. MDS plots illustrating the differences in fish assemblage densities
between depths, for each sampled site …………………………………………………..61
Figure 19. H03 and H04 historical regression and correlation diagram….………………56
Figure 20. H03 and H04 multiple regression and correlation diagram for 2012. ……….59

1
Introduction:
Coral-reef fisheries provide essential food resources and ecological functions for
island societies required for their sustainable livelihoods and economies (Johannes 1981,
McGoodwin 2001, Pauly 2008). However, a deeper understanding of how coral-reef
fisheries contribute to healthy ecosystems remains hampered by complex trophic
interactions (Hughes, Rodrigues et al. 2007) and intricate life histories (Choat and
Robertson 2002) that govern diverse reef fish assemblages, coupled with an inadequate
history of exploitation and resource status (Pauly 1995, Greenstein, Curran et al. 1998,
Knowlton and Jackson 2008). As a result, there is much difficulty in setting harvesting
thresholds for reef fish because they can be determined in accordance with multiple
attributes of the coral-reef fishery (i.e., sustainability of piscivore-dominated
assemblages, herbivore-dominated assemblages, specific trophic levels, age based data
for exploited reef fish) that are dependent upon unknown histories (Jennings and Polunin
1996, Jennings, Reynolds et al. 1999, Dulvy, Polunin et al. 2004, Cinner, Daw et al.
2009). In contrast, ecological thresholds are more uniform because they are founded in
the maintenance of measurable functional roles. Thresholds in herbivore biomass have
been established based upon their functional role of grazing and maintaining low
macroalgal cover required for coral recruitment and coral-dominated reefs (Mumby and
Harborne 2010). Yet, the collective evidence to date suggests that coral-reef fisheries
have been assessed more from a harvesting perspective than from an ecological
perspective (Zeller, Booth et al. 2007, Houk, Rhodes et al. 2012), perhaps due to the
economic considerations associated with reef fish as a food resource. This is concerning
because for many island nations reef fisheries actually provide disproportional benefits to

2
the local economy through the recreational and tourism industries as compared with their
monetary value as a harvested resource (Brander and Scott Taylor 1998, Cesar, Burke et
al. 2003, van Beukering, Haider et al. 2006). Therefore, improving our understanding of
the functional roles and thresholds that coral-reef fish stocks play in maintaining coral-
dominated reefs remains a priority.
The Commonwealth of the Northern Mariana Islands (CNMI) comprises a series
of islands within the Marianas Archipelago, Western Pacific Ocean, where coral-reef
resources are heavily relied upon for sustenance, culture, and economic prosperity
(Gilmour, Smith et al. 2013). Like many island nations, management of their near shore
marine resources is complicated by competing interests from resource users that stem
from the tourism, recreational, and fisheries sectors. One of the most notable coral-reef
resources that exist within the CNMI is Laolao Bay, located on the capital island of
Saipan. The reef habitats in Laolao Bay have long been used by indigenous Chamorro
people as a food and cultural resource (Russel 1998). In recent times Laolao Bay has
become one of CNMI’s most frequented tourist destinations for diving, with reefs valued
at over 10 million USD per square kilometer to the tourism industry (van Beukering,
Haider et al. 2006). Despite the obvious importance of Laolao Bay to the people and
economy of CNMI, very little research has been conducted to describe the status and
trends of its coral-reef resources, highlighting the need for further study. The lack of
baseline information from the past increases the difficulty in evaluating the nature and
magnitude of ecological change over time in the CNMI.

3
Shifting Baselines:
This situation is not unique to the CNMI, and has been characterized as the
shifting baseline syndrome (Pauly 1995). Shifting baselines are defined by major changes
in the abundances of natural resources that have occurred in the past due to harvesting,
other human influences, or major disturbance regimes, however, these changes are not
well perceived by the new generations of resource users who consider modern resource
conditions to be ‘natural’ or ‘normal’. Shifting baselines in fisheries often result from
over-exploitation of target species and can lead to establishing inappropriate harvesting
policies that are tied with the compromised resource abundances evident today. One of
the main causes of shifting baselines is the lack of information pertaining to the
abundance of resources in the past. Despite the limited availability and resolution often
associated with historical datasets, when present, they are invaluable in assisting
scientists and fishery managers with capturing a better understanding of how coral-reef
ecosystems function naturally.
Studies have employed a variety of techniques in an attempt to help understand
how past abundances of resources have shifted through time, ranging from examinations
of fossil records to estimating fishery catches from photographs over the years. Pandolfi
and Jackson (2006) analyzed coral species abundance data from well-preserved, raised
Pleistocene reef terraces in Barbados to examine how species diversity and community
composition shifted over geological time scales with inference to anthropogenic stress.
Multivariate analyses of the coral assemblage data showed a stark contrast between
Pleistocene and modern reefs due to a lack of Acropora palmata and A. cervicornis on
modern reefs that were instead dominated by more opportunistic and tolerant corals

4
(Porites asteroids, P. porites, Siderastrea radians, and Agaricia agaricites). From a
fisheries perspective, McClenachan (2009) estimated the lengths of trophy fish from
photographs taken by a charter company in the Florida Keys, over a period of ~30 years
(1956-1985), and compared these with photographs from the same charter companies in
2007. The results suggested a decrease in average size and weight when all trophy fish
were grouped for analyses, and depicted a shift in catch composition to species with
shorter average lengths. In the CNMI, Zeller et al. (2006) assessed the history of fisheries
landings by integrating historical accounts of fish consumption and fishing effort shortly
after World War II, and using the reported data as an anchor point to put modern fishery
landings into perspective. Results revealed a 77% decline in total landings over the fifty
year re-estimation period, yet methodological concerns associated with officially reported
catch data limited the ability to accurately depict the gradient of change over each
decade, and may limit the overall trends that were depicted.
Shifting baselines are important because they highlight how coral reefs are not
static ecosystems, and can change over time due to both acute and chronic disturbances.
Acute disturbances are known to cause major ecological changes within a short time
period, and despite their impacts, recovery typically becomes evident within 10 years
(Bellwood, Hughes et al. 2004, Golbuu, Victor et al. 2007). Thus, acute disturbances are
often considered to be beneficial for the ecosystem because they provide a natural
opportunity for species turnover within coral and fish assemblages that helps to maintain
diversity and function (Talbot and Anderson 1978, Hubbell 1997, Aronson 2002). In the
absence of chronic stress, reef systems should readily regenerate following most acute
disturbance events (Connell 1997, Bellwood, Hughes et al. 2004). However, chronic

5
exposure to anthropogenic stress (e.g. overfishing and reduced water quality) inhibits
coral reef recovery through a variety of mechanisms (Connell 1997, Dulvy, Polunin et al.
2004, Fabricius, De’ath et al. 2005, Houk, Musburger et al. 2010, De'ath, Fabricius et al.
2012), ultimately compromised ecological states can emerge and persist (Brodie,
Fabricius et al. 2005, Gardner, Côté et al. 2005, Chollett, Mumby et al. 2012).
Compromised Fisheries and Water Quality as Localized Stressors to Coral Reefs:
Studies support that impaired water quality negatively impacts coral-reef
ecosystems through many vectors (Fabricius, De’ath et al. 2005, De'ath and Fabricius
2010). Chronic exposure to increased levels of nutrients, sedimentation, and turbidity was
shown to impede coral growth (Salinas-de-León, Dryden et al. 2013) and reproduction
(Loya, Sakai et al. 2001). Specifically, increased sedimentation has resulted in reduced
photosynthetic rates of zooxanthellae (Anthony and Hoegh-Guldberg 2003), decreased
symbiont density (Nugues and Roberts 2003), and decreased coral growth (Marubini and
Davies 1996). Likewise, increased nutrient levels have been shown to adversely affect
coral growth by reducing coral polyp density (Bruno, Petes et al. 2003, Bruno and Selig
2007) and increasing exposure to infectious pathogens (Brown and Bythell 2005). At the
ecosystem level, poor water quality promotes algal blooms that, if left unmaintained, can
overgrow and compete with coral communities. Through all of these combined
mechanisms, pollution serves to homogenize coral-reef architecture, leaving less habitat
complexity for fish (Halford 1996, Friedlander, Brown et al. 2003, Wilson, Fisher et al.
2010). Despite the obvious importance of water quality to local reefs, eutrophication of
coastal areas has continued to increase (Brodie, Devlin et al. 2011).

6
Similar to good water quality, healthy fish populations contribute greatly to
ecosystem function by maintaining a suitable environment for coral recruitment and
growth (McClanahan 1995, Almany, Hamilton et al. 2010, Mumby and Harborne 2010).
Over-exploitation of coral-reef fisheries typically begins with the removal of large
predators (Hutchinson and Rhodes 2010), followed by the subsequent shift in catch
composition towards smaller-sized species in the same trophic group (Jennings, Reynolds
et al. 1999) or species groups of lower trophic levels (Jackson, Kirby et al. 2001,
Friedlander and DeMartini 2002, Myers and Worm 2003, Pauly, Watson et al. 2005,
Essington, Beaudreau et al. 2006). Although mechanisms remain poorly understood, the
loss of predators has been correlated with increased Acanthaster plancii densities
(McCook, Ayling et al. 2010, Wilson, Fisher et al. 2010, Sweatman, Delean et al. 2011,
Houk, Benavente et al. 2012) and reductions in coral cover (Bell 1992, Dulvy, Freckleton
et al. 2004, De'ath, Fabricius et al. 2012). Herbivorous fish populations contribute to
ecosystem functions by maintaining low macroalgal cover on reef habitats (Bellwood,
Hoey et al. 2012). Because exploitation progressively removes larger herbivore species
with longer life spans, the functional role of herbivorous grazers is transferred to smaller
herbivore populations (i.e., the replacement of herbivore assemblages with species that no
longer attain large adult sizes). This is problematic in that herbivore size is exponentially
related to grazing function, whereby a doubling in fish size can equate to a 16 – 32 times
increase in grazing (Lokrantz, Nyström et al. 2008, Bellwood and Choat 2011). While
studies have found evidence for an increase in the population density of smaller
herbivorous fish species along gradients of fishing pressure (Grigg, Polovina et al. 1984,
Rhodes and Tupper 2007), the noted increases are not sufficient to offset the

7
disproportional roles of larger fish, and net grazing potential is significantly decreased
(Bellwood 2003, Bonaldo and Bellwood 2008).
In the end, the combined influences of poor water quality and reduced
functionality of fish populations can push reef systems towards the verge of ecological
collapse (McClanahan, Graham et al. 2011), meaning that key functional roles of grazing
and calcification are compromised, and directional shifts in ecological assemblages
through time are eminent, or already taking place. However, few studies have attempted
to partition the roles of individual stressors, and quantified their relative contribution for
reef function (Houk, Musburger et al. 2010, Graham, Nash et al. 2011).
Laolao Bay, Commonwealth of the Northern Mariana Islands:
General evidence of declining ecosystem health in Laolao Bay has been documented
previously by the CNMI’s Marine Monitoring Team (MMT). Over the past twelve years,
this multi-agency program has collected standardized ecological data across 30 fore-reef
sites around the CNMI (Starmer and Houk 2008). Between 2004 to 2006 high
populations of predator crown-of-thorns starfish (COTS) were evident and caused
widespread declines in coral cover throughout the CNMI. In the years since COTS
disturbances, many of CNMI’s reefs have shown signs of recovery, yet Laolao Bay reefs
have exhibited minimal recovery in terms of coral coverage, species composition, and
overall abundances of calcifying benthic substrates. Ongoing CNMI-wide examinations
attribute the lack of recovery at Laolao and other sites around Saipan, to compromised
herbivore assemblages and water quality (Houk, Benavente et al. 2013). Nevertheless,
herbivore assemblages have explained a disproportional amount of the variance in
recovery rates to date. The perceived decline of coral reef resources in Laolao Bay is

8
cause for concern because of their value to the CNMI’s tourism economy, local
fishermen, and culture. A recently completed technical report associated with the Laolao
Bay revegetation and revitalization project was the first to provide quantitative insight
into the coral reefs and associated fisheries over longer periods of time, and helped to
improve upon the shifting baseline syndrome (Houk, Benavente et al. 2012). Study
results suggested that negative changes to the coral and fish assemblages have become
evident in comparison to a 1992 anchor point, along with a decline in water quality.
However, negative changes were perceived to be spatially consistent across Laolao Bay,
and degradation patterns were predicted by proxies to two localized stressors, pollution
and herbivory, as well as one natural environmental regime, wave exposure. Specific
changes to the fish assemblages included reduced densities of many large-bodied fishes
(i.e., species that have estimated reproductive maturity sizes greater than 30 cm) and
reduced sizes of entire coral assemblages. Ultimately, the 2010 study purported a direct
correlation between both herbivory and water quality represented chronic stressors and
negative change in Laolao Bay, yet the study called for an improved understanding of
fish assemblages through generating species-level datasets to better depict the nature and
consequences of change. In an effort to build upon current knowledge and better describe
the ecological details and consequences behind fish assemblage changes, this study has
attempted to integrate novel datasets with improved taxonomic resolution and depth
coverage to better evaluate the status and function of coral-reef fish populations in Laolao
Bay.
This thesis project first re-examined the dynamics of coral-reef assemblages across
Laolao Bay over the past 20 years using improved datasets that help define the functional

9
roles of reef-associated fisheries. Historical datasets originated from a study by the
University of Guam Marine Laboratory as part of an environmental impact statement
prepared for the development of the Laolao Bay golf course in the early 1990s (Company
1992). Historical data was first compared with contemporary data to contextualize the
change in marine resources across Laolao Bay. While these datasets represent two
snapshots in time of Laolao Bay’s coral-reef resources separated by 20 years, both
datasets are spatially extensive, encompassing six independent sites across Laolao Bay,
and had high site-level replication. Briefly, historical datasets described ~400 individual
fish counts/measurements per site and ~300 coral colony measurements per site. Given
their spatial extent and level of replication, historical datasets offer a unique ability to
assess major changes that have occurred in Laolao Bay over the past 20 years, offering
insight into the nature, but not rate, of change. Given that the only historical data
available were obtained from shallow-reef crests (~5 m depth) and the fact that depth
refuges are expected to exist for exploited coral-reef fish stocks (Tyler, Speight et al.
2009), this thesis project also integrated new datasets collected from deeper reefs (~15 m)
into the present analyses in order to address the extent which depth refuges might
contribute to current fish stocks. Building upon the improved perspective of change since
the early 1990’s, this thesis project next described spatial gradients in the coral and fish
assemblages across Laolao Bay and built plausible association models to assess the role
of watershed pollution, herbivore grazing, and wave exposure in predicting ecological
change. One set of association models focused upon benthic substrate as a dependent
variable (in response to grazing, water quality, and wave exposure), while the other set
10
focused upon the fish assemblages as dependent variables (in response to a loss of coral
architecture). Sequentially, the following hypotheses were tested:
H01: There were no detectable differences in food-fish assemblages of Laolao
Bay based upon comparisons between historical (1992) and contemporary datasets, in
terms of: 1) species composition, 2) numeric density of functional groups defined by
trophic status, and 3) spatial gradients that extend across LaoLao Bay.
H01 will be falsified if significant differences are detected when comparing
temporal datasets across Laolao Bay considered as an individual entity, or when
examining change in a spatially-dependent manner across six study locations within
Laolao Bay. Because H01 was falsified, H02, H03, and H04 were used to further
investigate the causes and characteristics of ecological change. Respectively these
hypotheses were:
H02: Depth did not act as a refuge for exploited fish populations. There were no
detectable differences in contemporary food-fish populations at varying depths based
upon: 1) species composition, 2) numeric density, and 3) relative abundance (i.e.,
biomass) of function groups defined by body-size and trophic status.
Two final null hypotheses were also examined to approach the cause and effects
of changes to Laolao Bay.
H03: Univariate metrics associated with fish population measures were not
predicted by influential environmental regimes such as wave exposure and/or water
quality, with ensuing consequences to the coral and benthic assemblages. H03 would be
falsified if evidence suggests fish populations have contributed to shifting coral and
11
benthic assemblages through time, and/or across space themselves, or interactively with
water quality and/or wave exposure.
H04: Univariate metrics associated with coral and benthic assemblages were not
predicted by environmental regimes such as wave exposure and/or water quality, with
ensuing consequences to the fish populations. H04 would be falsified if evidence
suggests metrics of coral assemblage architecture or benthic composition may have
contributed to shifting fish populations through time, and/or across space themselves, or
interactively with water quality and/or wave exposure.
Methods:
Site Background:
Laolao Bay represents a unique geological feature on the east coast of Saipan,
CNMI, where coral reef environments thrive due to their protection from prevailing
northeast trade wind-generated swells and the presence of large volcanic watersheds that
have created gentle bathymetric slopes conducive for extensive reef growth and
development. In 2010, Houk et al. examined coral reef assemblages and water quality
within six sub-drainages across Laolao Bay, following sample designs that were
established in 1992. Historical ecological assessments were conducted as part of
permitting requirements for the construction of the Laolao Bay golf course (Figure 1).
During the 2010 study, ecological data was collected from two key habitats where
historical datasets were available: 1) the outer reef flat, and 2) the reef slope at 3–5 m
depth. The present thesis project has expanded upon previous studies by conducting
detailed, species-level food-fish assessments at the six reef slope sites (3-5 m depth), and
establishing six new sites parallel to these at a depth of 15m (Figure 2). Because the

12
Figure 1. Map of historical sites surveyed in 1992, as required by the CNMI government,
prior to construction of the Laolao Bay Golf Course.
'lpu 1. .... C .Ioovl .. tt .. , • U"', " ....... u •. ...... 11>0. 1 .. .,..1 ... Or tnt • .......,u. 1 ...... _ " •• 11«
13
present thesis is focused upon food-fish assemblages, their dynamics, and their
relationship with other ecosystem components, reef slope and deeper reef habitats were
of primary interest, as reef flats held disproportionally lower food-fish biomass in
comparison. For each site, novel fish data were collected and integrated with existing
benthic substrate and coral assemblage data to address the outlined hypotheses.
Ecological Data Collection:
To understand if significant changes in fish assemblages were detected between
historic and modern surveys, as well as the relationships between the dynamics of fish,
coral, and benthic assemblages, standardized data collection protocols were utilized
across Laolao Bay. First, the present study generated formal databases for all of the
benthic substrate and coral assemblage data that were collected in 1992 and 2010. In
1992, benthic substrate abundances were estimated along each transect by haphazardly
tossing five, 1 x 1 m quadrats at ten-meter intervals. Benthic substrates were recorded
under each of the 16 intersecting cross-lines, within the quadrat, using the highest
taxonomic resolution possible. Data were typically recorded at the genus or species level.
Turf and crustose coralline algae were separated, while rubble and sand were combined
into a single category. These methods yielded a total of 80 data points per transect and
three transects to generate statistical estimates at the station level. In 2010, Houk et al.
used the same number of transects and transect placement, but increased the level of
replication to improve statistical confidence. Fifty, 0.5 x 0.5 m quadrats were placed at 1
m intervals. On the reef slopes, a digital photograph was taken at each 1m interval and

14
Figure 2. Map of survey sites for the present project depict the sub-watersheds of Laolao
Bay and the associated land practices for the areas throughout. Survey sites were also
established parallel to the current sites but at a depth of 15m.
* Water Sampling
Nativell ntrodlJced Forest
Agroforesl
Savanfla, Crops, Urbafl VegetatKlfl

15
the benthos under each of five random points were assigned a pre-defined category using
the computer software, Coral Point Count (Kohler and Gill 2006). These methods yielded
a total of 250 data points per transect, and three transects to generate sound statistical
estimates at the station level (Houk and Van Woesik 2006). The benthic categories for
analysis were corals (to genus level), turf algae (less than 2 cm), macroalgae (greater than
2cm, to genus level if abundant), fleshy coralline algae known to overgrow coral
(Peyssonnelia, Pneophyllum) (Keats, Chamberlain et al. 1997, Antonius 1999, Antonius
2001) crustose coralline algae, sand, and other invertebrates (genus level if abundant).
Means, standard deviations, and standard errors were calculated based on the three 50m
replicates, with n = 300 individual points per transect and n = 250 points per transect.
Within the present study, benthic data were used to create a standardized univariate
metric of the ratio between calcifying to non-calcifying substrates, also known as the
benthic substrate ratio or BSR. This metric was defined by the percent cover of corals and
heavily-calcified coralline algae, divided by turf, fleshy-coralline, and macroalgae.
Coral assemblages were evaluated using similar protocols in 1992 and 2010. For
both survey periods coral population data were collected in a similar manner. In each
instance, replicate 1 x 1 m quadrats were tossed at equal intervals along the transect lines.
In 1992, fifteen replicate quadrats were sampled, while the 2010 survey used ten
following an initial inspection of the data showing sufficient statistical power to meet
survey demands, as well as species saturation considerations. Within each quadrat, all
corals were identified to the species level, and the maximum diameter and the diameter
perpendicular to the maximum were recorded. Surface area of colonies were calculated
16
by taking the geometric diameter and assuming coral colonies were circular in nature,
common for both study periods.
The present study collected food-fish abundance data using similar protocols
employed in past studies. At each of the twelve stations where data were collected, 12
stationary point counts (SPC’s) were performed at equal intervals along three, 50 m
transect lines (Bohnsack and Bannerot 1986). During each SPC, the species name and
size of all food-fish within a 5 m radius were recorded for 3-minutes. In 1992, similar
SPC surveys of 5 m radius for 3-minutes were performed, however only numeric
densities (and not size) were recorded. Thus, comparisons with past fish datasets were
based upon numeric densities, while spatial analyses across Laolao using 2010 data
included size estimates (detailed in data analyses section below). Size estimates were
used to calculate biomass based upon length-to-biomass coefficients available from
fishbase (www.fishbase.org). In all instances, fish size estimates were binned into 5 cm
categories prior to calculating biomass to reduce any variation caused by observer bias.
In addition, recruit data, fish less than 5 cm, as well as sharks (n=1 seen during entire
surveys) were excluded from analyses to account for biases associated with variable
recruitment or species with disproportionally large range sizes. Target food-fish for both
time frames included acanthurids, scarids, serranids, carangids, labrids, lethrinids,
lutjanids, balistids, kyphosids, mullids, and holocentrids that are known to be harvested.
For some analyses, species were grouped by trophic category (i.e., herbivores/detritivores
grouped as one category) based upon their reported diet (www.fishbase.org), and/or
family. Finally, modern fish surveys were conducted during the same season (fall/winter)
as historical surveys in 1992.

17
Environmental Data collection:
During the 2010 survey, spatial water quality profiles augmented ecological data
collection to understand the relative contribution of surface discharge during rain events
and groundwater discharge during the lunar extremes (i.e., full and new moon periods).
Spatial profiles were conducted on a quarterly basis during 2010 to characterize discharge
patterns for the near-shore reef slopes adjacent to each study region (1-3 m depth, outer
reef) using a YSI 6600 EDS that was attached to a slow moving boat (n = 6 total events).
In each instance, an auxiliary bilge pump system was used to generate a continuous flow
of near-shore marine waters (~1ft. in depth) through the YSI sensor casing system, and
the boat was driven along the reef line following a pre-defined track that was confirmed
with GPS locational data collected at 10 second intervals. High resolution data (±0.01 in
all cases) were collected for salinity (ppt), conductivity (S/m), turbidity (NTU),
chlorophyll-a (mg/L), pH, and temperature (degree C). Based upon unpublished insight
from CNMI Marine Monitoring Team, two types of freshwater discharge events were
focused upon: 1) groundwater discharge during the lunar maximum and minimum when
tidal exchanges were largest, and 2) surface water discharge following major storm
events. Sample-based water quality data were collected during both the 1992 and the
2010 studies. Monthly samples were collected at six, permanent reef flat monitoring
stations that were established during the 1992 study, adjacent to the reef slope sites
investigated (Figure 2). Reef flat sampling was conducted at monthly intervals over the
course of a year for all stations during mid-to-high tides in the morning hours (9 to 11
AM). During each event, sampling consisted of taking YSI measurements (same
parameters noted above) as well as grab samples from the top 0.5 m of water that were

18
later processed for total suspended sediments (CNMI Division of Environmental Quality
Laboratory) and nutrients (University of Guam Water and Energy Research Institute
Laboratory). All samples for nutrient analyses (nitrate, nitrite, total nitrogen) were filtered
immediately, stored on ice or frozen, and processed within 48 hours. Nutrient and
turbidity data from monthly reef flat water sampling were available from both the
historical and present data collection effort. Because of shifting analytical techniques
used to process the samples and technological improvements to nutrient sampling in
general, no direct temporal comparisons were appropriate. In lieu, relative comparisons
across the sampling stations were made for each time period. Data were compared using
ANOSIM testing on rank-transformed data, and visualized using principle components
ordinations (Anderson et al. 2008; described in detail below.
Wave energy was derived from long-term wind datasets and estimates of fetch
(described in Ekebom et al. (2003) and applied to the Mariana Islands by Houk et al.
(2013) in review). For each site, fetch (i.e., distance of unobstructed open water) was first
calculated for 16 radiating lines equally distributed between 20 to 360 degrees. Fully
develop sea conditions were considered if unobstructed exposure existed for 20 km or
greater. Ten-year windspeed averages were calculated from Saipan airport data
(http://www7.ncdc.noaa.gov/), and used as inputs to calculate wave height following
Ekebom et al. (2003). Mean height was calculated by:
Hm = 0.019 U1.1 F.45 (1)
Where Hm is the wave height (m) for each quadrant, U is the windspeed at an elevation
of 10 m, and F is the fetch (km). Windspeed corrections for varying elevations were

19
made following Ekebom et al. (2003). Last, wave height was converted to energy
following:
E = (1/8)ρgH2 (2)
Where ρ is the water density (kg/m3), g is the acceleration due to gravity (9.81 m/s2), and
H is the wave height (m).
Data Analysis:
Historical data from the 1992 ecological assessment of Laolao Bay were available
only as appendices to the printed submitted report. Combined efforts transcribed these
data for analytical purposes.
To analyze temporal differences in coral and food-fish assemblages across Laolao
Bay (H01), multivariate analyses techniques were used to understand how entire
assemblages may have shifted across the entire bay (i.e., all sites aggregated for temporal
comparisons of Laolao bay as a single entity) and across individual sites (i.e., site-based
temporal comparisons) (Figure 3a-b). Multivariate procedures described below followed
standard protocols (Anderson, Gorley et al. 2008). Fish assemblage data were aggregated
at the SPC-level, log-transformed, and Bray-Curtis similarity matrices were generated to
define the ecological distances between each pair of SPC’s (Anderson et al. 2008).
Distance-based similarity matrices (i.e. Bray-Curtis dissimilarity matrix) were created
using numeric density data for temporal analyses. Prior to any comparisons, tests of
multivariate homogeneity were conducted to determine if Bray-Curtis similarity
measures (i.e., dependent variables) were evenly distributed across timeframes. Given
non-homogeneous variances, multivariate comparisons were made using rank-
transformed abundance data (ANOSIM tests), while homogeneous data were examined

20
Figure 3A-C. Designs for multivariate analysis of temporal, spatial and depth data
associated with metrics of fish assemblages. For temporal analysis (A), sites are
compared by survey years. For the spatial analysis (B), gradients of change are assessed
and then compared with one another. For analysis of fish assemblages at varying depths
(C), sites were compared in a manner identical to temporal analysis, just analyzed by
depth rather than survey date.
A) B)
C)

21
using analogs to ANOVA testing (PERMANOVA). Bray-Curtis similarities across
timeframes were homogeneous, so a crossed PERMANOVA procedure was used to test
for differences between the fixed factors of time across each individual site.
PERMANOVA tests are evaluated based upon a pseudo F-statistics (analogs to ANOVA
F-statistics), and t-statistics for post-hoc comparisons. Finally, a principal coordinate
ordination (PCO) was performed on the similarity matrices to depict the PERMANOVA
results in two-dimensional space. Given that PCO is a standard ordination procedure,
each axis has an ‘eigenvalue’ associated with it, that describes the amount of variation in
the multivariate assemblages being explained. Vector overlays, based on Spearman’s
rank correlation coefficients with the PCO axes, were added to PCO plots to identify
species that have contributed most to the underlying change being depicted.
The present study also analyzed patterns in fish assemblages moving across
Laolao Bay to examine if spatial gradients in fish species abundances existed in 1992 and
2012, and if so, were these spatial gradients similar (Figure 3c). Initial PERMDISP tests
showed non-homogenous variances when looking at gradients across Laolao Bay in both
1992 and 2012. Thus, ANOSIM tests with subsequent graphic interpretations using non-
metric multidimensional scaling (n-MDS) plots were conducted. MDS-plots were based
upon ranked abundance data and do not have ‘eigenvalues’ associated with individual
axis scores. Instead, stress values are calculated for the MDS plots based upon
comparisons between depicted distances between sites and actual Bray-Curtis similarity
values. Stress values <0.25 indicated low stress, and that rank-based data visualized in
MDS plots accurately depicted Bray-Curtis distances. H02 was tested in a manner
similarly described above. Crossed multivariate designs examined whether fish
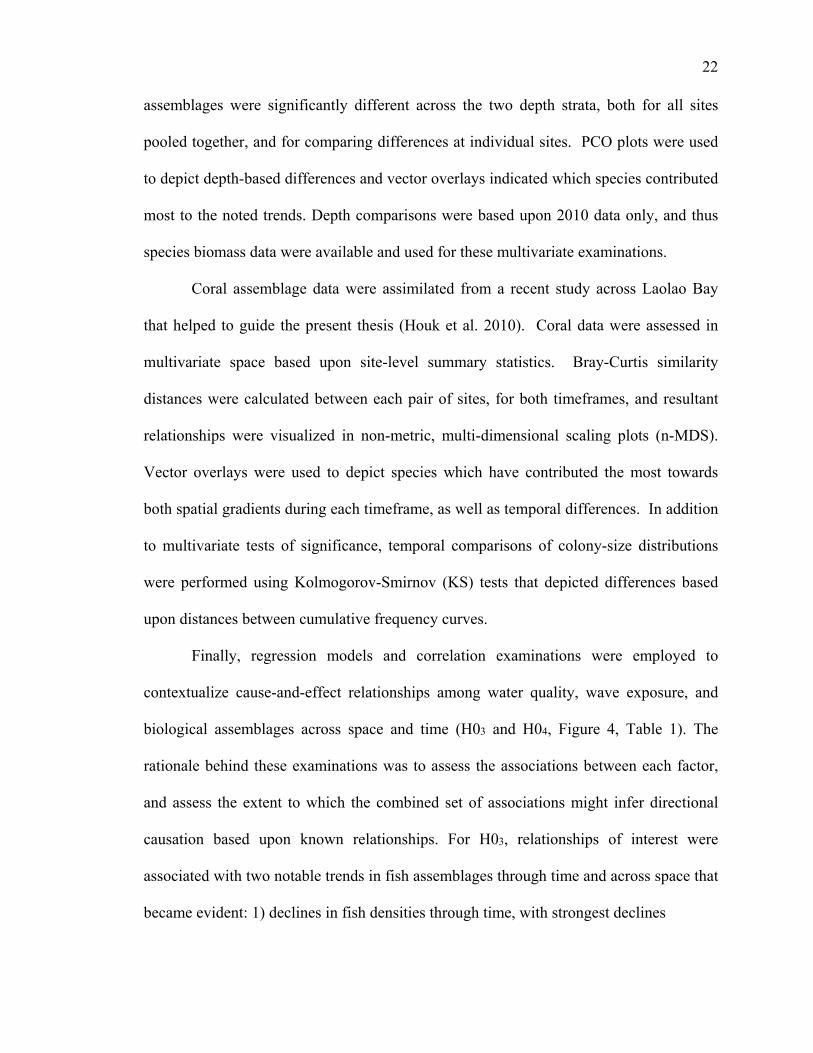
22
assemblages were significantly different across the two depth strata, both for all sites
pooled together, and for comparing differences at individual sites. PCO plots were used
to depict depth-based differences and vector overlays indicated which species contributed
most to the noted trends. Depth comparisons were based upon 2010 data only, and thus
species biomass data were available and used for these multivariate examinations.
Coral assemblage data were assimilated from a recent study across Laolao Bay
that helped to guide the present thesis (Houk et al. 2010). Coral data were assessed in
multivariate space based upon site-level summary statistics. Bray-Curtis similarity
distances were calculated between each pair of sites, for both timeframes, and resultant
relationships were visualized in non-metric, multi-dimensional scaling plots (n-MDS).
Vector overlays were used to depict species which have contributed the most towards
both spatial gradients during each timeframe, as well as temporal differences. In addition
to multivariate tests of significance, temporal comparisons of colony-size distributions
were performed using Kolmogorov-Smirnov (KS) tests that depicted differences based
upon distances between cumulative frequency curves.
Finally, regression models and correlation examinations were employed to
contextualize cause-and-effect relationships among water quality, wave exposure, and
biological assemblages across space and time (H03 and H04, Figure 4, Table 1). The
rationale behind these examinations was to assess the associations between each factor,
and assess the extent to which the combined set of associations might infer directional
causation based upon known relationships. For H03, relationships of interest were
associated with two notable trends in fish assemblages through time and across space that
became evident: 1) declines in fish densities through time, with strongest declines

23
Figure 4. Regression Analysis design for H03 and H04, respectively. For H03 fish
assemblage metrics are the central focus while measures of water quality, wave exposure
and coral population assemblages are used to understand the drivers of change. In
contrast for H04 coral population metrics are the central focus, all other associated
variables remain the same

24
Table 1. List of fish, coral, and environmental variables which were used for historical
and present-day regression and correlation analysis. Historical variables of fish and coral
include measures of temporal change (i.e., PCO Change), distanced based metrics
derived from assemblage differences in multivariate space.
Historical 2012
Fish Coral Environment Fish Coral EnvironmentLarge
herbivorepopulationdensitychange
Percentcoralcoverchange
Waveexposure
Meanherbivore/detritivorebiomass
PopulationDensity
Salinity
Smallherbivorepopulationdensitychange
Species‐richnesschange
Water qualitychange
Assemblageheterogeneity
BenthicSubstrateRatio
Landuse
Largebodiedfishpopulationdensitychange
Skewchange
Meanherbivore/detritivore
size
Skew change Watershedsize
PCOchange PCOchange
WaterqualityPCO
Kurtosischange
Waveexposure
Populationdensitychange

25
observed in the larger-bodied species with greater functional roles, and 2) linkages
between declining water quality and/or larger fish removal that both may serve to
increase small-bodied herbivore/detritivore assemblages that have fast response times to
altered trophic dynamics (Connell 1997, Dulvy, Polunin et al. 2004, Fabricius, De’ath et
al. 2005, Houk, Musburger et al. 2010, De'ath, Fabricius et al. 2012, Houk and
Musburger 2013). H03 examined the extent to which fish may have been the central
component of ecological change to the benthic and coral assemblages independently, or
in concert with environmental regimes. In contrast, relationships of interest for H04 were
associated with the decline in coral architecture that has been noted in LaoLao Bay over
time (Houk, Okano et al. 2010), and whether this decline might have predicted declining
larger-fish densities. In this sense, HO4 examined whether declining coral architecture,
as measured by declining size-class distributions, may have been the central component
of ecological change to the fish assemblages, independently or in concert with
environmental regimes.
Prior to regression and correlation analyses, all variables were standardized to
provide for equal weighting, and constant values were added to make all variables
positive. Historical examinations used biological and environmental variables that
represented change over time (2012 minus 1992), with the exception of wave exposure
which was derived from 10-year averages and assumed to be consistent through time.
Thus, for historical examinations, increases in values should be interpreted as a negative
change to site health (i.e., increased decline in water quality, fish densities, and coral
population measures). Similar examinations were performed for modern data (2012 data
only) to see if trends through time resonated with modern spatial trends. For modern
26
comparisons, increased values represent improved water quality and biological measures.
Single variable regression models were used to test for significance in the expected
relationships described above, while correlations were generally examined across all
variables to help interpret the overall linkages between ecosystem components.
Regression models were all inspected for independence and normality of residuals, and
log-transformations were used to reduce skewness in some instances. Model fit was
indicated by Akaike Information Criterion (AIC) scores that are based upon R2 values,
but also penalized based upon residual normality and adding multiple explanatory factors.
In summary, obtaining a better understanding of the interactions between ecosystem
components (i.e., coral structure and fish functional roles), through time and across space
were the desired outcomes of this analysis.
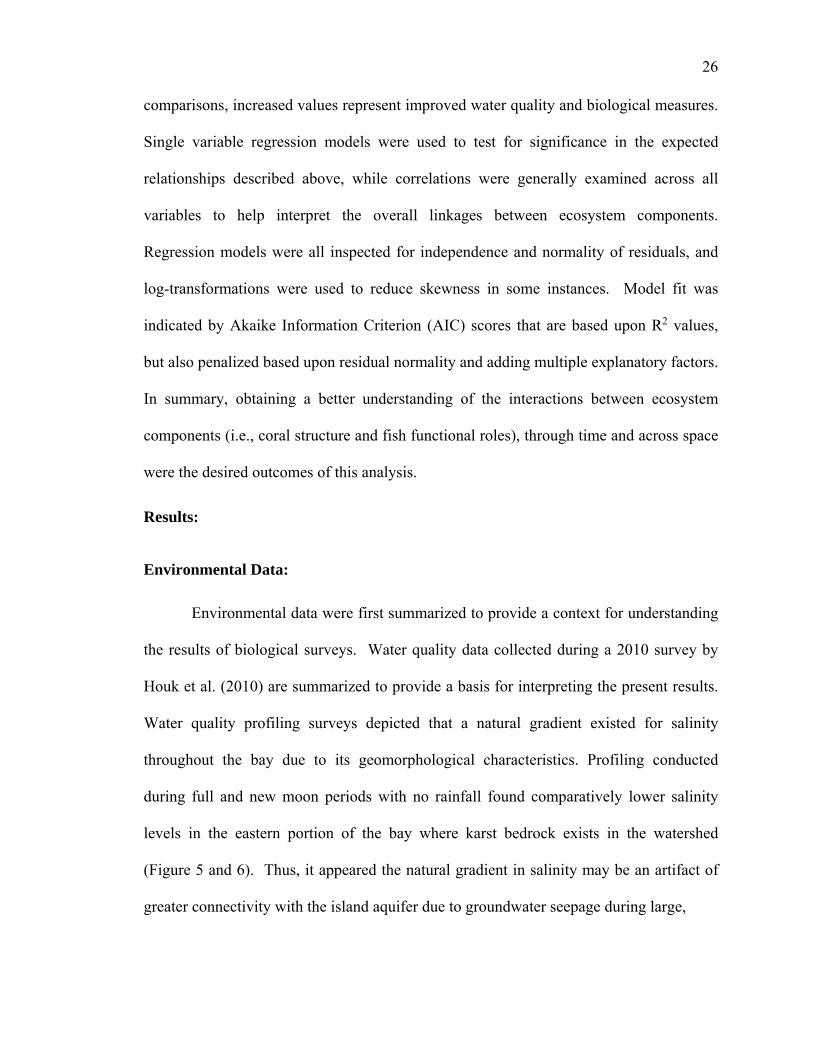
Results:
Environmental Data:
Environmental data were first summarized to provide a context for understanding
the results of biological surveys. Water quality data collected during a 2010 survey by
Houk et al. (2010) are summarized to provide a basis for interpreting the present results.
Water quality profiling surveys depicted that a natural gradient existed for salinity
throughout the bay due to its geomorphological characteristics. Profiling conducted
during full and new moon periods with no rainfall found comparatively lower salinity
levels in the eastern portion of the bay where karst bedrock exists in the watershed
(Figure 5 and 6). Thus, it appeared the natural gradient in salinity may be an artifact of
greater connectivity with the island aquifer due to groundwater seepage during large,
27
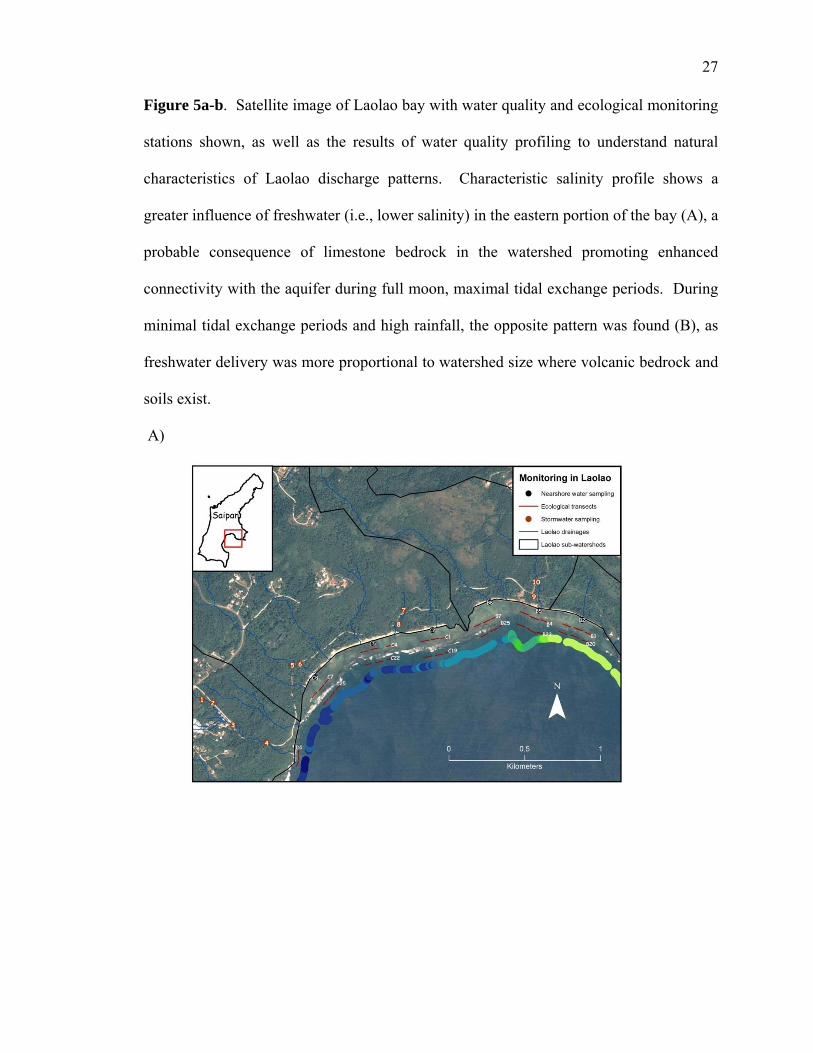
Figure 5a-b. Satellite image of Laolao bay with water quality and ecological monitoring
stations shown, as well as the results of water quality profiling to understand natural
characteristics of Laolao discharge patterns. Characteristic salinity profile shows a
greater influence of freshwater (i.e., lower salinity) in the eastern portion of the bay (A), a
probable consequence of limestone bedrock in the watershed promoting enhanced
connectivity with the aquifer during full moon, maximal tidal exchange periods. During
minimal tidal exchange periods and high rainfall, the opposite pattern was found (B), as
freshwater delivery was more proportional to watershed size where volcanic bedrock and
soils exist.
A)

28
B)
Monitoring in Laolao
• Nearshore water samp~ng
• Stormwater SIIl11lting

29
Figure 6. Boxplots summarizing freshwater discharge patterns associated with two
characteristics freshwater discharge regimes that existed in Laolao Bay (black lines
represents the median, the boxes indicates the 25th (lower) and 75th (upper) percentiles,
and the error bars indicate the 5th (lower) and 95th (upper) percentiles). Groundwater
discharge associated with lunar extremes (full and new moons and the associated
negative low tides) created an east-to-west gradient (A) of freshwater delivery to Laolao
Bay. In contrast, significant rain events created a west-to-east gradient (B) of freshwater
delivery.
A)
B)

30
lower salinity levels during rain events. Wave exposure followed an expected trend of
being highest with greatest exposure to prevailing northeastern trade winds (i.e., in the
western portion of the bay), and lowest where exposure to trade winds was minimal (i.e.,
the eastern portion of the bay).
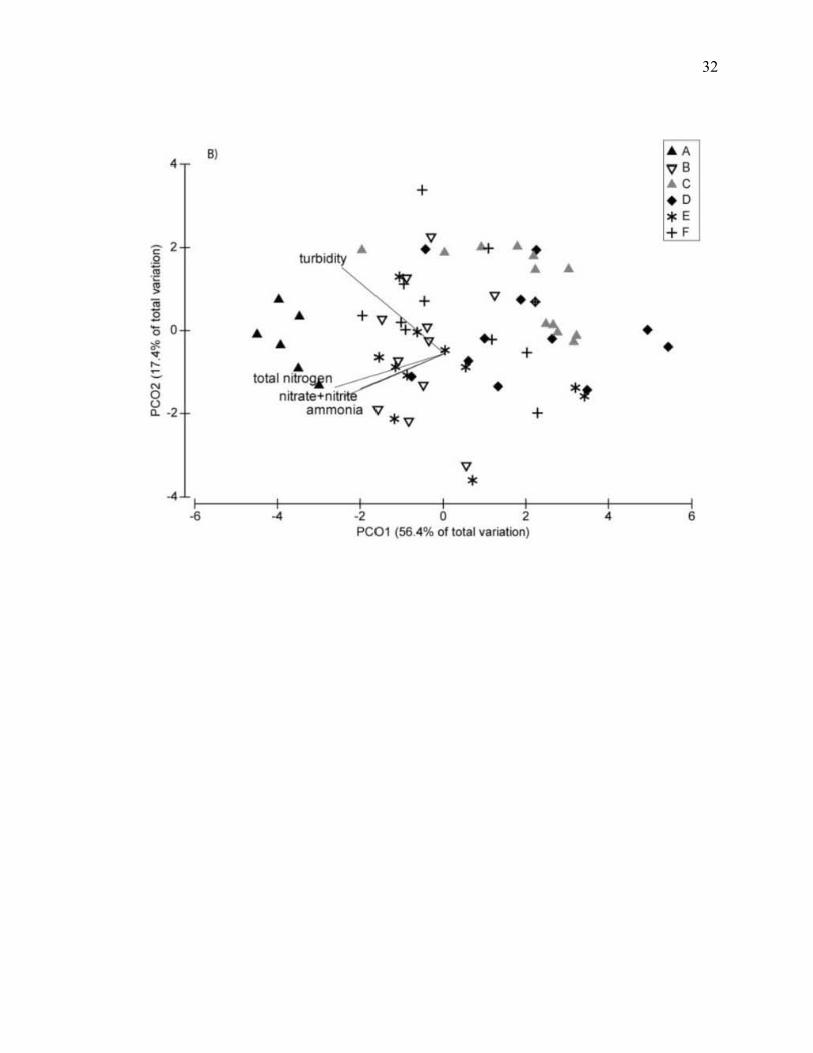
Principle components analysis found that between 40 to 56% of the variance in
nutrient and turbidity data could be explained by a single PCO-axis for both 1992 and
present water quality data (Figure 7). This suggested that the first PCO-axis provided a
useful indicator of pollution loading (Table 2). The overall trends in water quality were
similar for both time periods, whereby highest nutrient loading was found in the Eastern
portion of Laolao Bay, especially during low tides, where profiling depicted high
connectivity with groundwater discharge (site A, Figure 5, Table 2). Besides this site,
stations B and E were distinguished from others by having relatively lower water quality,
while remaining sites were not distinguishable from each other. Despite similar spatial
trends for both past and present water quality data, the magnitude of spatial differences
between sites became more profound in 2010, suggesting that relative to other sites, some
got worse (Figure 7). Based upon these findings, this thesis used PCO scores as metrics
of water quality when examining associations with biological assemblages below.
Biological Data:
Two other datasets were also incorporated from Houk et al. (2010), and further
analyzed: 1) benthic substrate abundances (2010 timeframe only), and 2) coral species
abundances (both timeframes). Benthic datasets collected during 2010 highlighted lower
coral coverage in the eastern portion of Laolao, where turf algae dominated the substrate
(pairwise t-test for coral and turf algae abundances at site A and B compared with others,

31
Figure 7. Principle components analysis and ordination of water quality (nutrient and
turbidity) data from monthly samples at six monitoring locations across Laolao Bay (see
Figure 1). Constituents used for historical water quality data analysis (A) included NO3-
+N,PO4-P, and turbidity. Constituents used for the present dataset (B) were NO3-N,
NH4, total N, and turbidity.
32
•
C' 2 j! .~ ~
" li .. 0
" ~ N 0 u ~ -2
.. I -6
" +
V turbidity
A • A
~: A A
A A
A total nitr~n
nitrate+n" ammonia
I .. I -2
V*V
I o
....
t
V
*
V
... •
A
A
•• +
+
I 2
PCOl (56.4% of total varia tion)
A
~
*t
I •
•
A A
V B AC . 0 * E + ,
•
I 6
33
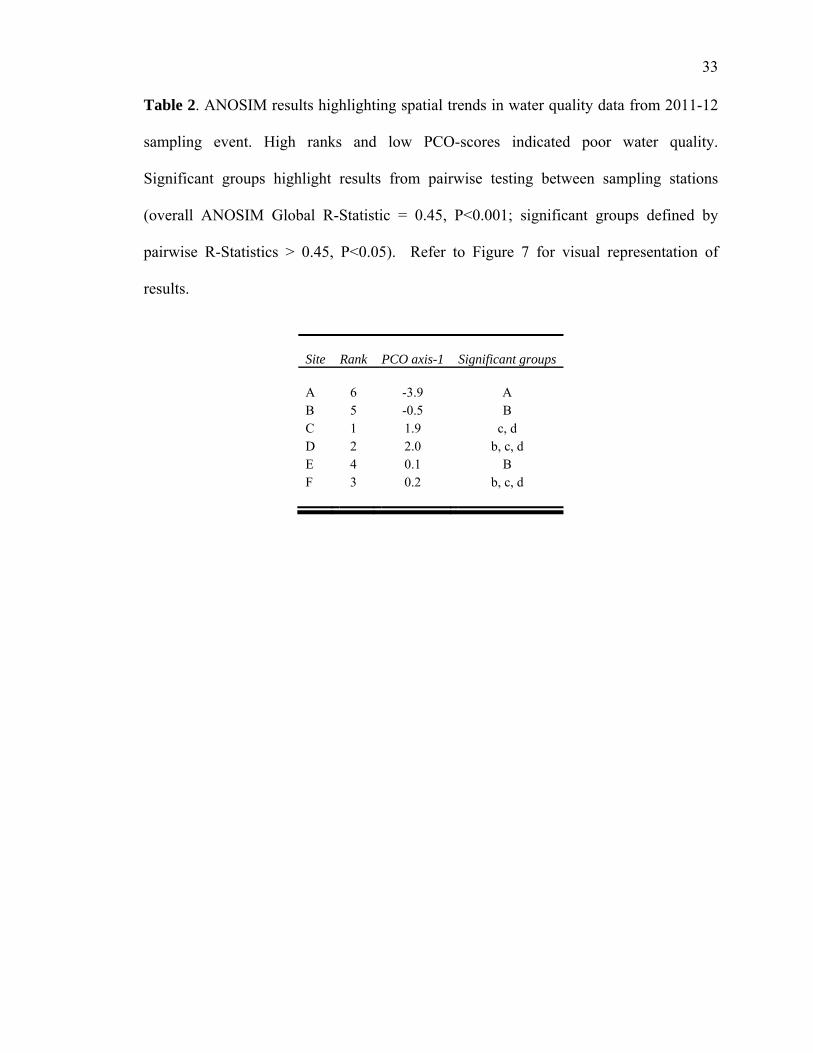
Table 2. ANOSIM results highlighting spatial trends in water quality data from 2011-12
sampling event. High ranks and low PCO-scores indicated poor water quality.
Significant groups highlight results from pairwise testing between sampling stations
(overall ANOSIM Global R-Statistic = 0.45, P<0.001; significant groups defined by
pairwise R-Statistics > 0.45, P<0.05). Refer to Figure 7 for visual representation of
results.
Site Rank PCO axis-1 Significant groups A 6 -3.9 A B 5 -0.5 B C 1 1.9 c, d D 2 2.0 b, c, d E 4 0.1 B F 3 0.2 b, c, d

34
P<0.05 in both instances, Figure 8 and 9). In contrast, remaining sites were less
differentiated from each other in terms of overall coral cover, with sites C and F showing
the highest values. Benthic substrate ratio’s (BSR) followed a similar pattern being
lowest in the eastern portion of the bay and greatest in west Laolao, however a spatial
gradient became more apparent with respect to wave exposure when considering BSR
instead of just coral cover. BSR was used as an indicator of favorable substrate for reef
accretion that was applied to regression and correlation analyses below.
Beyond cover, coral species abundance data depicted significantly different
assemblages between the two sides of the bay, and through time as well (PERMANOVA,
F-Statistic >3.5, P<0.05, for both comparisons, Figure 10). Differences were due to a
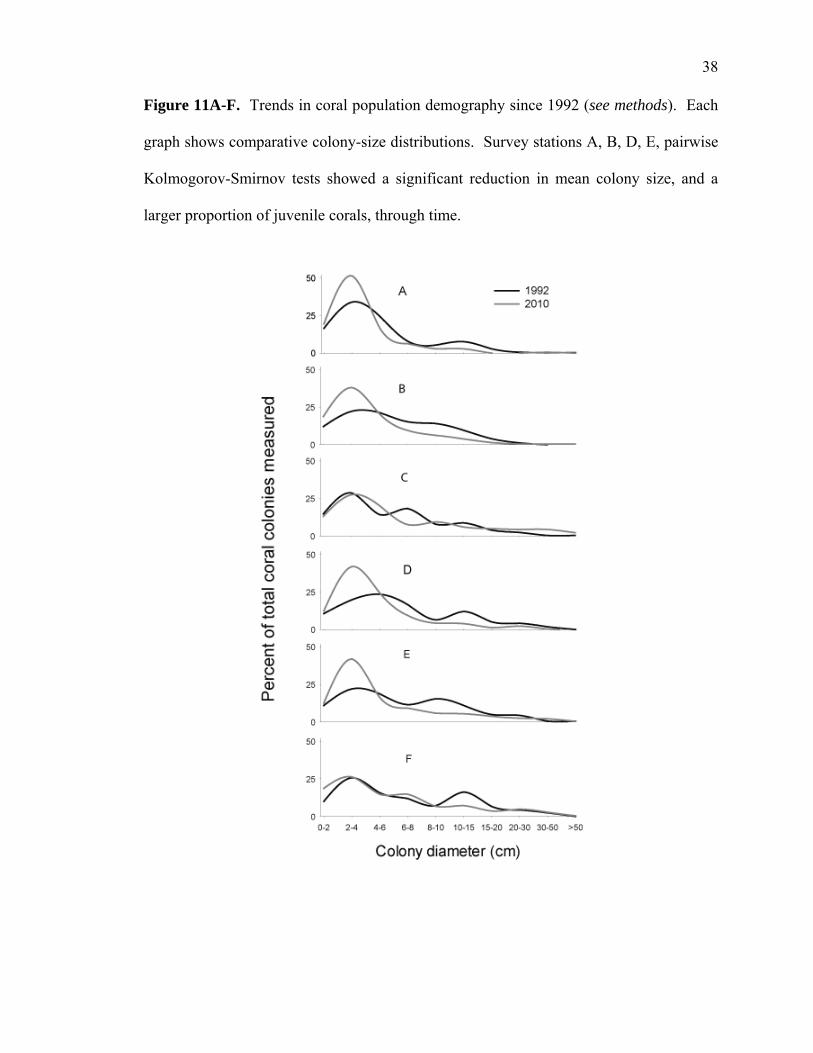
decreased presence of larger colonies and an increase in smaller colonies (KS tests
showed a reduction in colony size and increase in skewness most pronounced for sites A,
B, D, and E, Figure 11). Results indicated that the strongest changes through time
occurred where groundwater influences were high (F-Statistic = 4.29, P<0.01, Figure 10),
specifically in the eastern portion of Laolao Bay where reefs were comprised mostly of
Porites, Leptoria, Favia, and Galaxea, all of whose growth forms facilitate limited three
dimensional reef growth. Overall, a decrease in the quality and structure of coral
assemblages were observed across Laolao, but changes were most pronounced in the
eastern part of the bay. This study used coral assemblage skewness when examining
regression and correlation analyses below, and assumed skewness was a useful metric of
habitat structure provided by corals based upon these results.

35
Figure 8. Percent cover of dominant benthic substrates on Laolao Bay reef slopes. Clear
differences can be seen between survey stations associated with enhanced groundwater
connectivity (A and B) compare with others. These conditions are less favorable for
coral growth and more favorable for turf algae persistence.
F E D C B A
Pe
rce
nt
cove
r (S
E b
ars
)
0
10
20
30
40
50
60
CoralCrustose corallineFleshy corallineTurf algaeMacroalgae

36
Figure 9. Change in percent coral cover and colony density per m2 since 1992.
Significant increases in population density were noted throughout Laolao (P<0.05,
pairwise t-test), however changes in coral coverage were spatially inconsistent. Similar
to other ecological data collected on the reef slope, inherent difference can be seen
between sites associated with enhanced groundwater delivery (A and B) and others.
Station
F E D C B A
cha
nge
in %
co
ral c
ove
r a
nd p
op
ula
tion
de
nsity
(2
01
0 -
19
91
)
-10
0
10
20
30
% Coral coverPopulation density

37
Figure 10. Multi-dimensional scaling plot highlighting spatial and temporal trends in
Laolao Bay coral assemblages. Significant differences were attributed to both
groundwater influence (low vs. high) and change through time (2010 vs. 1992)
(PERMANOVA, F-Statistic >3.5, P<0.05, for both comparisons). Additionally, there
was a significant interactive effect (F-Statistic = 4.29, P<0.05) highlighting that greater
changes occurred through time where high groundwater influence was evident. Vectors
display corals that were significant drivers of these trends (spearman correlation
coefficients >0.5)
38
Figure 11A-F. Trends in coral population demography since 1992 (see methods). Each
graph shows comparative colony-size distributions. Survey stations A, B, D, E, pairwise
Kolmogorov-Smirnov tests showed a significant reduction in mean colony size, and a
larger proportion of juvenile corals, through time.

39
H01:
Temporal Analysis:
Comparative analyses of fish assemblages between 1992 and 2012 depicted
significant differences in the numeric density across major functional fish groups (t-
statistic =7.4, p <0.001, PERMANOVA). When grouping sites across the bay, these
generalized trends were due to a reduction in the density of most food fish species
(especially Monotaxis grandoculus, Naso unicornis, Naso lituratus, Chlorurus sordidus,
Scarus rubroviolaceus, and other mixed acanthurids all showed reductions in numeric
density), and the spatially-inconsistent increase in density in some species of rabbitfish
(Siganus spp.), a small-bodied grouper (Cephalopholis urodeta), and mixed small-bodied
parrotfishes besides Chlorurus sordidus; Figure 12). Similar trends were observed when
focusing analyses at the site-level, whereby pairwise comparisons found consistent
reductions in numeric density for the majority of food-fish across all sites, and increases
in only a few, small-bodied species (Table 3, Figure. 13, & Figure. 14, t-values = 4.3, 3.9,
3.3, 3.18, 3.05, and 3.03, respectively P-values <0.006 for all, PERMANOVA and
pairwise testing). In general, species that consistently contributed greatest to the site-
level changes between 1992 and 2012 were small-bodied acanthurids, wrasses, C.
sordidus, A. triostegus, M. grandoculus, small-bodied parrotfish, N. lituratus, and S.
rubroviolaceus (Table 3, species contribution up to ~70%, SIMPER analyses). Given the
nature of change since 1992 (i.e., a reduction in many larger-bodied species and an
increase in fewer smaller-bodied species), multivariate heterogeneity has also declined in
many instances, as replicate SPC surveys were typically more similar to each other in
2012 compared with 1992. However, site-based changes had several unique

40
Figure 12. Change in the population density of dominant fish in Laolao since 1992. A
significant reduction in fish density, evenness, and functional group abundances was
evident, as 2012 fish assemblages have been reduced to populations dominated by small
acanthurids.

41
Table 3. Describes results of PERMANOVA, tests of significance, and their associated
p-values. SIMPER results describe percentages of key fish groups that have experienced
change through time. Numeric density was also calculated to understand differences in
densities of key fish groups through the two time periods.
SIMPERResults
TestStatistics
Site Fishgroup Numericdensity1992
(SE)
Numericdensity2012
(SE)
%Contribution
Cumulative%
PERMANOVAandPairwise(P‐Value)
D 4.33(0.001) Wrasse 10.7 (1.7) 0.08 (.08) 22.22 22.22 Small‐bodied
acanthurid 17.6 (2.4) 1.25 (0.7) 16.4 38.62 Naso lituratus 5.4 (1.3) 0.16 (0.1) 12.01 50.63 Small‐bodied
parrotfish 0.0 (0.0 ) 2.4 (0.7) 10.49 61.12 Chlorurus
sordidus 11.1 (2.1) 1.4 (.04 5.8 66.92 Goatfish .04 (0.2) 0.16 (.01) 4.53 71.45 Scarus
rubroviolaceus 2.0 (0.9) 0.3 (0.2) 4.03 75.49 Cephalopholis
urodeta 0.0 (0.0 ) 0.83 (0.83) 3.87 79.36 Monotaxis
grandoculus 3.8 (1.04) 0.0 (0.0) 3.53 82.9 Lutjanus kasmira .25 (.25) 0.0 (0.0) 3.19 86.08 A 3.9(0.001) Small‐bodied
acanthurid 21.0 (2.3) 4.3 (0.7) 26.95 26.95 Wrasse 2.75 (0.5) 0.0 (0.0) 17.3 44.26 Naso lituratus 2.41 (.63) .25 (.18) 12.54 56.8 Chlorurus
sordidus 0.0 (0.0) 1.08 (0.2) 8.8 65.6 Small‐bodied
parrotfish 0.4 (0.4) 1.08 (0.3) 8.58 74.18 Gnathodentex
aureolineatus 4.08 (2.7) 0.08 (0.08) 6.01 80.2 Goatfish 0.16 (0.1) 0.3 (0.1) 3.86 84.06 Rabbitfish 0.16 (0.1) 0.25 (0.1) 3.3 87.36 Cephalopholis
urodeta 0.08 (0.08) 0.25 (0.1) 2.87 90.23
F 3.3(0.001) Wrasse 13.4 (1.8) 0.08 (0.08) 25.39 25.39 Small‐bodied
acanthurid 17.1 (5.1) 2.2 (0.5) 16.99 42.38 Naso lituratus 7.16 (2.2) 1.75 (0.3 11.51 53.89 Small‐bodied
parrotfish 0.08(0.08) 1.8(0.6) 6.89 60.66

42
Chlorurus sordidus
2.9(1.5) 0.5(0.3) 6.22 66.88
Goatfish 0.8(0.5) 0.8(0.3) 4.88 71.75 Cephalopholis
urodeta 0.08(0.08) 0.75(0.2) 4.59 76.34
Acanthurus lineatus
0.4(0.19) 0.3(0.18) 3.67 80.02
Macolor niger 0.8(0.6) 0.3(0.2) 3.24 83.26 Aphareus furca 0.6(0.3) 0.08(0.08) 2.93 86.19 Naso unicornis 1.1(0.6) 0.0(0.0) 2.88 89.07 Naso
hexacanthus 2.0(1.4) 0.0(0.0) 2.64 91.72
E 3.18(0.001) Wrasse 7.9 (1.4) 0.08 (0.08) 22.22 22.22 Small‐bodied
acanthurid 8.25 (1.4) 2.5 (0.8) 16.4 38.62 Naso lituratus 4.16 (1.1) 0.5 (0.2) 12.01 50.63 Small‐bodied
parrotfish 0.5 (0.3) 3.7 (1.2) 10.49 61.12 Chlorurus
sordidus 1.3 (0.6) 0.5 (0.3) 5.8 66.92 Goatfish 0.4 (0.2) 0.4 (0.1) 4.53 71.45 Scarus
rubroviolaceus 1.1 (1.1) 0.5 (0.2) 4.03 75.49 Cephalopholis
urodeta 0.4 (0.1) 0.08 (0.08) 3.87 79.36 Monotaxis
grandoculus 0.6 (0.4) 0.0 (0.0) 3.53 82.9 Lutjanus kasmira 1.5 (1.5) 0.0 (0.0) 3.19 86.08 Acanthurus
olivaceus 0.08 (0.08) 0.6 (0.4) 2.5 88.58 Hipposcarus
longiceps 0.4 (0.3) 0.0 (0.0) 2.21 90.79 C 3.05(0.001) Wrasse 6.5(0.6) 0.08(0.08) 21.31 21.31 Naso lituratus 9.1(2.5) 2.08(0.9) 12.06 33.37 Rabbitfish 5.8(3.6) 1.6(1.6) 8.84 42.2 Naso unicornis 0.4(0.4) 3.5(1.8) 8.59 50.79 Small‐bodied
acanthurid 10.5(1.6) 5.0(0.4) 8.32 59.11
Chlorurus sordidus
1.7(0.7) 0.25(0.1) 6.06 65.18
Scarus rubroviolaceus
0.9(0.3) 0.08(0.08) 4.92 70.1
Aphareus furca 1.4(0.6) 0.0(0.0) 4.53 74.63 Acanthurus
xanthopterus 1.1(0.6) 0.0(0.0) 3.44 78.07
Goatfish 0.1(0.1) 1.2(1.0) 3.2 81.26 Acanthurus
olivaceus 0.5(0.2) 0.0(0.0) 3.16 84.43
Small‐bodied parrotfish
0.25(0.25) 0.25(0.17) 2.34 86.77
Hipposcarus longiceps
0.5(0.3) 0.1(0.1) 2.31 89.07
Monotaxis grandoculus
0.3(0.1) 0.0(0.0) 1.98 91.05
B 3.03(0.001) Wrasse 2.9 (0.7) 0.08 (0.08) 15.87 15.87

43
Naso lituratus 3.41 (1.6) 1.08 (.31 13.3 29.18 Small‐bodied
acanthurid 10.2 (1.9) 7.6 (0.9) 12.84 42.02 Rabbitfish 2.0 (1.6) 1.4 (0.4) 12.83 54.85 Chlorurus
sordidus 0.5 (0.3) 1.3 (0.4) 10.79 65.64 Naso unicornis 4.5 (4.5) 0.4 (0.2) 6.19 71.83 Small‐bodied
parrotfish 0.4 (0.4) 0.5 (0.2) 5.93 77.75 Hemigymnus Spp. 0.0 (0.0) 0.4 (0.1) 4.3 82.05 Goatfish 0.4 (0.2) 0.4 (0.4) 3.37 85.42 Lethrinus harak 0.3 (0.2) 0.0 (0.0) 3.29 88.71 Scarus
rubroviolaceus 0.0 (0.0) 0.2 (0.13) 2.87 91.59

44
Figure 13. PCO Plot depicting differences in multivariate space between fish
assemblages of 1992 and those of the 2012. Vector overlays illustrate species that explain
the variation associated with these data in multivariate space. Other fish groups such as
small-bodied parrotfish and Cephalopholis urodeta,a small-bodied grouper increased in
density over time.

45
Figure 14A-F. PCO plots illustrating fish assemblage similarities among study years
(1992 and 2012). Vector overlays were included to showcase how fish groups have
changed through time.
60
40
I .~
~ 20
~ "6
& 0
s " Q.
-20
40
_ 20 :; :~ ~ 0
~ "6
'" ~ -20 11 8 Q. -40
A) x 1992 0 2012
o Scarus fUbtovioiaceus Monotaxis
Small-bodied Rabbitfish tpntb;uI'1f Wrasse
"parroIfish G....~ Small-bodied
C)
o acanthurid o Naso
Cepha/opholis ~ x IitUtatus
urodeta O
o
o
x
peOt (45.5% of total variation)
CD)
6' 0 o x
x x
x Wrasse
~ I22£!!J
)( Nasa lituratus
Cep/Ja/orX>giP "'~===- Xx urodeta --- ChiOltHUs Sma/I-bodied
Small-lxrled panotfish 0 o
Naso unicomis
o
o
scxrfdus ;< acanthutid
Rabbitfish
~0"~"0------4+0-----_420-----4-----420C---~40
40 E) Naso x
20
peOt (36.9% of total variation)
x 0 o
x 1992 0 2012
lituratus x 'b g x ~ Monotaxis 0 0
:~ 0 x ? gfanckJculus =- Smaf.bodied ~ smal-~~pwroltish ~ acanthurid
x ChIcnrus '0 -20 sorc1ic*Js 0
~ o
o
-80' ">-_ --< __ +--_+-_-+-_-+_--< -40 -20 o 20 40 60 80
peQt (26.8% of total variation)
60 B)
_ 40 Wrasse
.~
') 20 Small-bodied
]j acanthurid 9 "6
" X N 0 M o 0 Small-bodied x
'" d(;hlorurus paffOtfish x x S x
sordidus x " 0 0.. .20 0 0 0
X
-40 -40 -20 0 20 40
peOt (31 .3% of total variation)
60 D)
g 40 o
~ ~ 20 ScatUS ~ rubtoviolaceus 0
o
60
x 1992 0 2012
~ [Q2QgJ
". orc:fciJs Small«xied pwrotIish '0 h1CXUfUS~O o X X 0
N )0( Monot Goatfish
l rpnd<x':us 8 0.. -20 J'x Small-boded
x acanthurid Naso Naso unicomis litulatus
0 ..
-40 ~el ----...,If----+I-----+I -----If----+I----...,I ~ _ 0 W 40 00 00
peat (47.1% of tolal variation)
Chlxurus sordidus
Wrasse
,,"~:;;"-=;S;;;mal-bodied )OJ( acanthurid x
x
o ~O">-____ f-__ +-__ -+ ____ +--__ -+-__ __
-60 -40 -20 20 40 60 peol (37.4% of total variation)
(X"1992I ~

46
attributes. Site D experienced the greatest negative change (Table 3, t = 4.3, p value =
>.001, Figure 14-D) both in terms of reduced heterogeneity and numeric density.
Interestingly, reductions were most pronounced for sites in the western part of the study
area (D to F), where the greatest wave exposure existed (Figure 2). For parts of Laolao
Bay that experience the lowest wave exposure (A to C), the changes in heterogeneity
were still significant and consistent in nature with others, but less pronounced. In sum,
declines in numeric density across the majority of food-fish were ubiquitous. Another
unique attribute of change was found for site C, whereby the popular food fish Naso
unicornis showed an increase in density. However, this individual species increase was
offset by the decrease in net density of a suite of other larger food fish. A second site in
the eastern part of the bay also showed a mixed response in terms of numeric density for
one large parrotfish, Scarus rubroviolaceus, which was also offset by a decrease in
overall density across a suite of other species (Site B, Table 3, Figure 14-B).
Spatial Analysis:
Data indicated that heterogeneous fish assemblages existed across several sites,
due to less variation among replicate SPC surveys existed in the eastern portion of the
bay (Sites A and B, PERMDISPERSE Tests, F = 3.1 and 4.19, p-value = 0.04 and 0.006,
respectively for 1992 and 2012). Because of this, spatial gradients during each timeframe
were conducted using rank-based ANOSIM comparisons. The main source of spatial
variation in 1992 was due to unique fish assemblages occurring at sites A, B, and D (R-
statistic > 0.31, P<0.05, ANOSIM for all pairwise comparison with other sites, Table 4,
Figure 15). Mixed small-bodied parrotfishes were found in highest density at site B,
while mixed small-bodied acanthurids and two larger-bodied foodfish, Monotaxis

47
Figure 15A-B. MDS plots of fish assemblages across Laolao Bay for 1992 (A) and 2012
(B) with vector overlays to indicate species responsible for assemblage orientation in
multivariate space.
AI
BI
o
o Rabbitfish . n Nasa Ilfuratus Hipposcaras longiceps V 0
Lutjanus Macalor nigerX kasmira oatfish X X
CephaIOPhOIiS.-iI~~_~ Na!Jl) unicomis 0 urodeta 0 '1P >tY 0
o o
o o
Small-bodied parrotfish
0 " V 0 ~ X V 0 ge0()0taxis~ndOCUJUS X
V .6. A <:>Chlorurus v V V X .6. V "'a microrhinos <:/> <>
Le"(jnt! harak .6. ~h1o,!rus sordidus <>
Chlorurus sordidus
Scarus rubrovio/aceus
SmaJ/-bodied acanthurid
o Small-bo~ief¢ ~
o
V
<> acanthurid <> v /Sl ;0. ~ 0 V
" 0 " " hloru~s Y,iC!IJrhin~s V . poscarus IMlgicep~ 00 0
Small-bodied parrotfish
aso 0 V a U o lituratus 1::J.. A DO x
x <> NarAJunic~is 0 0 Goatfish 0 0 x x
<> 0 ~PhalopholiS X urodeta 0
X o o
X
X
X
20 Stress: 0.19
"A V B D C ~ D
O E X F
2D Stress: 0.23
"A V B D C ~ D
O E X F

48
grandoculus and Chlorurus microrhinos were found at sites A and D. The subtle
difference between the latter two sites was the shift in dominance from small-bodied
acanthurids in the wave sheltered portion of the bay (site A), to a dominance of the small-
bodied parrotfish Chlorurus sordidus (site D). In sum, moving from the sheltered portion
of the bay to the more exposed side, small-bodied acanthurids had a notable decrease in
density. Fish composition was similar for remaining sites in 1992. Trends for fish
assemblages in 2012 were similar in terms of the transition from small-bodied
acanthurids to small-bodied parrotfishes moving westward across the bay, however, site-
level differences were greatly diminished (Table 4). Only site B appeared to have unique
fish assemblages due to high occurrences of both small acanthurids and small scarids,
perhaps representing a transition between reef habitats influenced by groundwater versus
surface water discharge described above. Results of ANOSIM suggested that present fish
populations throughout Laolao Bay were more similar to one another when compared to
past assemblages (Table 4). This corroborates the decreased abundances of many species
of food-fish at sites D, E, and F. Another consistent trend was the low heterogeneity
consistently found for site A, where limestone bedrock exists in the watersheds and
greater groundwater discharge was reported. In contrast, site C consistently had the
highest heterogeneity, which was associated with proximity to the largest freshwater
discharge channel associated with volcanic watersheds and runoff. In general, spatial
findings were consistent with those of the temporal analysis.

49
Table 4. ANOSIM results of fish groupings in hierarchal order of site similarity for
spatial analysis. Results depicted in the table show that differences in change through
time do not significantly follow any specific gradient, however sites with unique habitats.
1992 2012 SiteGroups R‐statistic P‐value SiteGroups R‐statistic P‐value
E,F 0.067 0.072 D,E 0.023 0.301C,E 0.07 0.103 E,F 0.055 0.136C,F 0.128 0.02 D,F 0.111 0.025B,E 0.168 0.07 A,F 0.113 0.027A,B 0.173 0.008 A,B 0.151 0.012B,C 0.212 0.007 A,D 0.165 0.024B,F 0.262 0.003 A,E 0.176 0.018A,E 0.277 0.001 A,C 0.216 0.004A,C 0.344 0.001 C,F 0.248 0.001A,F 0.365 0.001 C,E 0.26 0.004D,F 0.401 0.001 B,C 0.31 0.001C,D 0.453 0.001 B,F 0.353 0.001D,E 0.505 0.001 C,D 0.415 0.001A,D 0.589 0.001 B,E 0.416 0.001B,D 0.62 0.001 B,D 0.491 0.001

50
H02:
Depth Analysis:
The purpose of H02 was to understand if depth acted as a refuge for the food fish
assemblages of Laolao Bay. Although no significant differences were found between
food fish assemblages at 5m and 15m depths for both density and biomass(Table 5 &
Figure 16, ANOSIM R-stat =0.25, 0.065 , p value =.1% for both), defining attributes
between depth were noted. In terms of biomass fish assemblages at 15 m were more
homogeneous, as less variation among replicate SPC’s existed (PERMDISP = 2.5, p
value = .09). This was due to fish assemblages at 15m comprising greater and more
consistent biomass and density of Holocentrids and the small-bodied Lutjanids (L.
kasmira and L. fulvus), all of which are considered to be common table fish, and all of
which had more uniformed occurrences among SPC’s. Assemblages at 5m were
generally more heterogeneous (PERMDISP = 4.4, p value = 0.006) due to varying
abundances of small- bodied acanthurids, small-bodied parrotfish, C. sordidus, and N.
Lituratus (Figure 17). One exception existed for site B` where relatively high
heterogeneity existed due to the varying presence of N. unicornis, C. sordidus, C.
microrhinos, L. monostigma, L. fulvus, S. argenteus, and mixed Holocentrids.
Interestingly, two adjacent sites (E and E`) were both most homogeneous within their
respective depth regimes (Figure 17- E). Overall, the lack of differences between
assemblages of 5 and 15m suggests that depth does not act as a refuge to food-fish
assemblages when considered as a single entity, as both depth strata were consistently
dominated by C. sordidus, C. striatus, S. psittacus, and C. urodeta. Yet, differences in
data homogeneity clearly define that depth-related characteristics existed.

51
Table 5. Results of ANOSIM test in hierarchal order of significance, for each respective
sight grouping (H02). Table suggests that differences in fish assemblages between the
respective depths are not significant for any sites throughout Laolao Bay.
SiteGroup R‐Statistic P‐valueB,B` 0.086 0.07C,C` 0.113 0.44F,F` 0.15 0.01E,E` 0.197 0.005A,A` 0.266 0.001D,D` 0.375 0.001

52
Figure 16. MDS plot of fish populations in multivariate space between the two respective
depth regimes. Vector overlays were included to illustrate fish groups responsible for the
differnces between depths. The plot suggests that although differences exist between
depth, fish assemblages of these two strata are relatively homogenous with one other.
Chloruro5 sordicfuS
Scarus x rutxoviolacel:s
Scarus psitll'1CUI$
Acanffwrus x
lineatus X
0 x Clenochaetus
C"i:ltomus C3rofnus
striatus
x o , x N~o
0 o O UnlCQmlS
oci>x~x~ x~rt~g X
x Naso ,«ltur<ltus 9t. >li1 0 ~ ~ 0 \\IPO'o 0
xXO X'"
00 X X 0
XX 0
0 X X
x
2D SIr . ... 0.24
IXTm'l ~

53
Figure 17A-F. MDS plots with vector overlays depicting differences in fish population
biomass between depths throughout Laolao Bay. Plots suggest that differences between
fish groups of the respective depths were relatively small.
A)
Naso lituratus
Scarus schlegeli
Chlorurus microminos
x Lethrinus xanthochilus
o
o Chlorurus sotriidus
yripristis emdti
C)
o o O X
X
Ca/otanus Naso
Parupeneus multifasciatus
Siganus r/lnUS X
X
X X
o
X
cardinus lituratus
$co/apsis sp. x o
X
X
Naso unicornis 0 0
X
X 0 Hip(XJScarus I
E)
Chlorurus X 0 o sadidus
Pan"""""", Lutjanus multifasciatus monostigma
Sc.,-us Myripristis psittacus kuntee o
Parupeneus multifasciatus
Scarus
0
0
o o
Lethrinus x harak
psittacus Scarus rubroviolaceus
X Naso
0:'1( Lutjanus Kasmira x 0 0 0
o 0 o
X X Cephalopholis argus 0 0
lituratus
o
Sargocentron Gnathodentex spiniferum aurolineatus
X Acanthurus
x olivaceus
X Ctenochaetus striatus
Lutjanus fulvus
Calotomus carolinus
X X
2D Stre ••. O. 14
X
fXAl (Q£J
2D S~ess . 0.2
X
X
rxn l2..£J
2D Stres5.0.15
IXEl i2.D
x
6 )
Naso unicornis
Catotomus carolinus x
Siganus x
spinus
Scarus
x 20 Stress: 0.'9
fXBl l2JU
o Chlorurus sorrlidus
psittacusx X
Scarus Ox
forsteni ~ x
Ctenochaetus o o
Myripristis kuntee
striatus o o Lutjanus
microrhinos monostigma o
o
D) Ca/otomus X Ctenochaetus cardinus
striatus Naso lituratus 0
Variola
00 Parupeneus multif~ciatus 0
louti Lutjanus Kasmira 0
o
o o x Scarus x
o psittacus
Lethrinus xanthochitus
Sargxentron caudimaculatum
' )
Naso lituratus
Acanthu rus lineatus
o x
Chlorurus sordidus
Galotomus
x X
carolinus x Scarus
x x
x
X Scarus
sittacus
Chlorurus
x x
Cephalopholis ~detax
sotriiduSx
Caranx
Kyphosus melampygus
cmerascens Mynpn'stis amaena
x o
o
~ 0
o 0
Ctenochaetus 0 striat~s 0 0
x
x
20 Slfes., o.,a
fXDl l.£.£J
X
x
2D Stress:O.18
I~ :·1
X

54
Similar examinations were undertaken across the two depth strata using fish
densities instead of biomass. Investigations using fish density revealed the same general
trend of greater heterogeneity at shallow depths due mainly to variations in small-bodied
acanthurid assemblages (Figure 18). However, contrasting findings across depths were
apparent for sites A - A’. Site A` had greater heterogeneity than site A due to high
variability in densities of wrasses, small-bodied acanthurids, L. xanthochilus, and L.
bohar at depth (Figure. 18-A). Site B and B` had the greatest homogeneity among all
sites due to consistent presences of N. unicornis, N. lituratus, C. microrhinos,small-
bodied acanthurids, and small-bodied parrotfish (Figure. 18-B).
H03:
Fish function roles as potential agents of benthic and coral assemblage change across Laolao Bay:
In analyzing factors attributed to changing fish assemblages since 1992, “Fish
PCO change”, a dependent variable based upon the distance between past and present
data-points in multivariate space, was influenced greatest by water quality trends (Figure
19, Table 6, F = 23.01, p = 0.008). These relationships were driven by a strong
association between declining water quality (i.e., greater water quality change values,
Table 6) and increased densities in small-bodied herbivores, and declining water quality
and lower densities of larger-bodied fish (Pearson’s moment correlation r-values 0.77
and -0.77, respectively). Expectedly then, there was also a strong, negative association
between changes in small-bodied herbivores and larger-bodied fish groups (i.e.,
acanthurid and scarid species that attain adult sizes less than 25 cm and all other larger
fish grouped together). Yet, no relationships existed between water quality change and
any of the coral assemblage metrics, such as skewness (p<0.05 for all associations),

55
Figure 18A-F. MDS plots illustrating the differences in fish assemblage densities
between depths, for each sampled site. Vector overlays were inserted to show fish groups
responsible for differences in multivariate space.
A) Ghlorurus sordidus
ChlOflJfUS microminos
ScaNS rubrovio/aceus
x Gnathodentex aureolineatus
Naso liiuratus
Cepha/opholis urodeta
C )
x
x x
0
GhlofUfUS
Monotaxis grandoculus
sordidus Lutjanus monostig
x
o
o
Lethrinus xanthochi/us
x
0
0
Wrasse
o Lutjanus bohar
os;(,all-bodied x acanthurid
0
0
Naso Small-bodied lituratus parrotfish
00 0 x
0 0
x Goatfish x
o
x
Small-rodied acanthurid
o Hip~oscarus longiceps
Lutjanus kasmira
o o
Scams
o
x rubrovioleceus
Cepha/opholis urodeta
E)
Lutjanus 0 Small-bodied
kasmira acanthurid
Acanthurus Lutjanus fineatus (ulvus 0 0
x Monotaxis grandoculus )(
vlamingi x x 0
ma//-txx.1ied rrot f ish 0
Aphareus furea 0
Scarus Naso rubroviolaceus ~hoIis x lituratus
x urodela
x
o
20SIJeIl$,O , g
IXAl 19.EJ
20 SIJeIl$: 0.18
IxCl i2.£J
x
20 S!reU , 0 H
IXEl ~
B)
Naso unicamis
canthurid x
Lutjanus (ulvus
ChlofUru~O 00
microrh7fro'~o-,;~2')~~; __ x "0
0& x ~
Wrasse
Lutjanus bohar
Gephalopholis urodeta
carns )( 0
bro$lo/aceus
0)
x Lethrinus harak
ChloftJfllS sordidus
Small-bodied parrotfish
x
x x x
20 Stets; 0,16
IxBl I£.!...J
o
20Stre5o: 0.15
IxDl [Q.£J
Acanthums fineatus
x Cephalopholis x urodeta
o
Wrasse x o
x O Nasa
Chlomms sordfdus
Lethrinus xxanttwchiJtJs
Monotaxis grandoculus
° lituratus ° o
o o
Small-bodied °
F)
acanthurid
Macalor Cephalopholis niger x urodeta
x Scams mbroviolaceus
o AphareusO
(urea o
X X Scams altipinnis
x
x
x Naso Lutjanus (ulvus
° fituratus o
o Small-bodied acanthurid
o
Caranx melampygus °
o
Chlomms sordidus o
° Acanthums lineatus x
o x x
Small-bodied parrotfish
20 SlrHA. 0.21
x
IxFl l2.£J
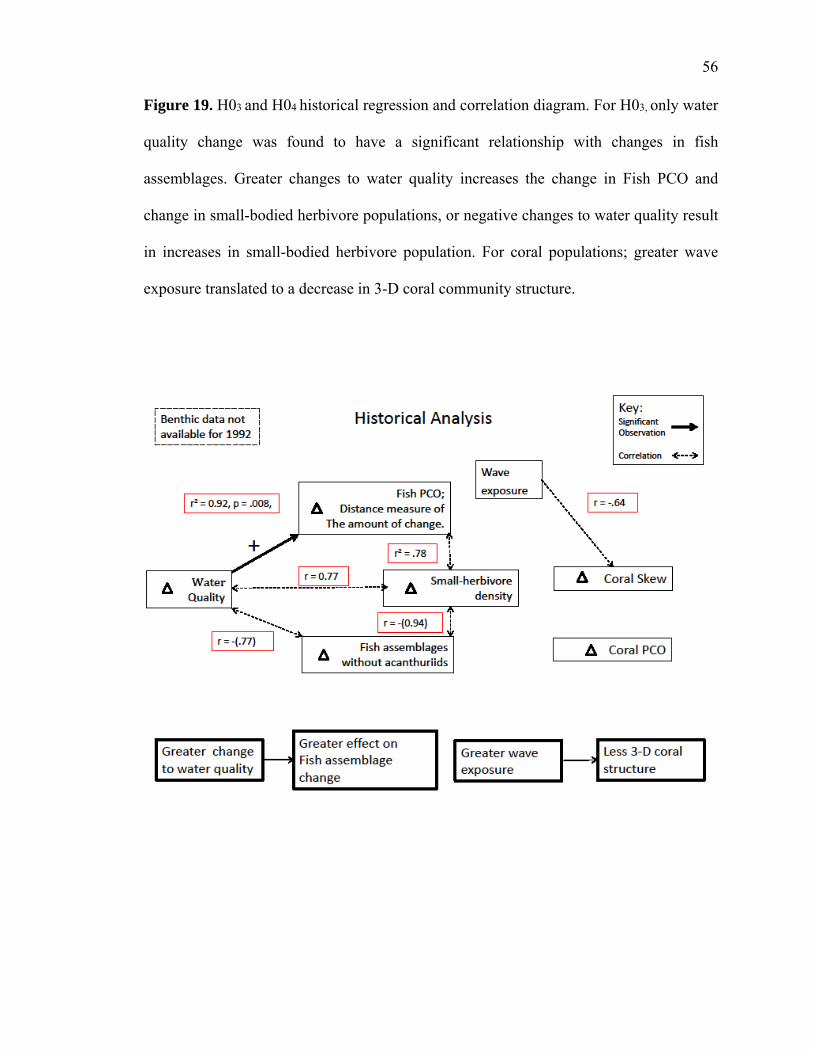
56
Figure 19. H03 and H04 historical regression and correlation diagram. For H03, only water
quality change was found to have a significant relationship with changes in fish
assemblages. Greater changes to water quality increases the change in Fish PCO and
change in small-bodied herbivore populations, or negative changes to water quality result
in increases in small-bodied herbivore population. For coral populations; greater wave
exposure translated to a decrease in 3-D coral community structure.

57
Table 6. Historical regression/correlation table showing variables responsible for driving
the greatest amount of variation in fish and coral assemblage change over time. Measure
of wave exposure and water quality were found to drive distance-based (i.e., multivariate)
metrics of change in fish assemblages. Wave exposure also had a slight influence on
coral three-dimensionality (i.e. skew)
Dependent Equation Slope(SE) Intercept(SE)
R2 P‐Value AIC
1)FishPCOchange
Y=.92(wq)+.15 ±.19 ±.42 .81 .008 10.45
2)FishPCOchange
Y=.26(wqxwave)+.82
±.07 ±.38 .71 .02 12.95
3)Coralskewchange
Y=‐.65(wave)+3.2 ±.38 ±.83 .27 .16 18.6
Table 7. 2012 regression/correlation table displaying metrics responsible for the greatest
amount of changes to fish and coral assemblages of Laolao Bay. Again, measures of
wave exposure were found to influence assemblage dynamics, however water quality did
not have any significant effect on these regimes.
Dependent Equation Slope(SE) Intercept(SE)
R2 P‐Value AIC
1)Fishheterogeneity
Y=.83(wave)+.33 ±.27 ±.61 .6 .04 14.9
2)Fishheterogeneity
Y=.34(wavexwq_pco)+.52
±.07 ±.35 .81 .008 10.3
3)BSR(2010) Y=.89(wave)+.2 ±.22 ±.48 .75 .01 12.24)BSR(2010) Y=.81(fish_hetero)
+.37±.29 ±.63 .57 .04 15.4

58
which were expected intermediary drivers of negative changes in larger fish densities
with greater habitat dependence. Similarly, the heterogeneity associated with 2012 fish
assemblage data was interactively predicted by both water quality and wave exposure (F
= 23.7, P = .008, interactive regression model, Table 7), whereby negative changes to
water quality and low wave exposure predicted for fish assemblages that were dominated
by small-bodied acanthurids. The consistent linkages found for both temporal and
modern fish assemblage dynamics suggested that small-bodied herbivores responded to
increased basal resources, and this increase in resources may have been driven by
declining water quality and/or diminished larger-bodied herbivores. Modern 2012 data
highlighted that the dominance of smaller-bodied herbivores, but not water quality, was
associated with declining benthic substrate ratio’s across Laolao, purporting a greater
emphasis on the latter (Figure 20). The association between wave exposure and higher
fish assemblage heterogeneity in 2010 (i.e., more diverse assemblages comprised of both
small- and large-bodied species) also supports the latter (Figure 20).
H04:
Coral assemblages as potential agents of fish assemblage change across Laolao Bay:
In analyzing factors attributed to changing coral assemblages since 1992, wave
exposure had the only association with shifting coral skewness (Pearson’s moment
correlation r-values = -0.64, Figure 19 Table 6), whereby high wave exposure was
associated with smallest declines in skewness. No relationships were found between
changing water quality and coral assemblages since 1992. Modern data supported these
findings and depicted a significant, positive association between wave exposure and
benthic substrate ratio’s, suggesting wave exposure benefitted calcifying benthic

59
Figure 20. H03 and H04 multiple regression and correlation diagram for 2012.
Significant interactive effects of wave exposure and water quality affect fish assemblage
heterogeneity. Poor water quality and low wave exposure predict fish assemblages
dominated by small-bodied acanthuriids, which in turn predicts dominance of non-
calcifying benthic substrate.

60
substrates. Modern data also found no associations between water quality and any coral
or benthic assemblage metric. Fish assemblages with greater heterogeneity were the only
other correlates of calcifying benthic substrates, yet as stated above, there was no
evidence for expected intermediary relationships between structural coral loss and fish
declines. Hence, there was less evidence to support HO4 because coral loss through time
was only associated with low wave exposure (Houk, Okano et al. 2010), and 2012
benthic substrate ratio’s declined spatially across Laolao in accordance with changing
fish assemblages, but not water quality. The inability to account for changes to the coral
communities of Laolao Bay since 1992 may be an artifact of the lack of relevant data,
such as measures of fishing pressure and benthic composition through time.
Discussion:
This study examined spatially extensive snapshots of coral and fish assemblages
in 1992 and 2012 across Laolao Bay, CNMI, providing a unique look into coral and fish
population dynamics for an economically and culturally important reef setting. Temporal
analyses found strong evidence for a ubiquitous decline in the majority of food fish
densities across Laolao Bay, accompanied by increased densities of a few smaller-bodied,
opportunistic counterparts. While consistent trends across all sites through time suggested
that the nature of change was ubiquitous, spatial examinations found a gradient
associated with the magnitude of change. Both change since 1992 and modern datasets
depicted highest densities of small-bodied parrotfishes and surgeonfishes (i.e., the most
compromised fish assemblages) to be most pronounced in eastern Laolao Bay, where
wave exposure is minimal and karst watersheds provided a greater connection with
groundwater discharge. These physical characteristics provided some insight as to what

61
the plausible drivers of change may be. Moving across the study area from east to west,
wave energy increases substantially, with high waves limiting (fishing) access to western
Laolao during parts of the year when trade winds produce large swells. Previous studies
have found relationships between short time periods when calm weather exists (i.e., low
wind and wave periods) and disproportionally successful reef fish landings (Houk,
Rhodes et al. 2012), as well as high wave exposure and a lower fishing pressure metric
that was derived from opinion surveys taken by CNMI’s resource managers (Maynard et
al. Reef resilience report). Thus, one perceived driver of the spatial trends was the
relationships between wave exposure and fishing pressure. In addition, the easternmost,
sub-watershed associated with the karst aquifer had the greatest, consistent contribution
of nutrients and largest change in water quality through time. The combined influence of
fishing pressure and reduced water quality serves to remove larger-bodied species
(Hutchinson and Rhodes 2010) and provide more access to more algal and detrital
resources for smaller-bodied counterparts (Jennings, Reynolds et al. 1999), respectively,
and enhance the net algal and detrital resource pool (Fabricius, De’ath et al. 2005). In
turn, the dominance of small-bodied herbivores and removal of larger-bodied species
suggested that compromised grazing capacity became evident (Mumby, Dahlgren et al.
2006, Lokrantz, Nyström et al. 2008), because allometry dictates a non-linear relationship
between fish size and function. Lokrantz et al. (2008) showed that a doubling in
parrotfish size resulted in a 67% in grazing rate. In support, fish assemblage
heterogeneity, which was an indicator of the degree of dominance by small-bodies
herbivores, emerged as the strongest covariate of compromised benthic substrates in
2012.

62
Interestingly, depth analyses suggested that while many unique attributes existed
between shallow and deeper fish assemblages, depth did not have a significant influence
upon the density or biomass of many key functional groups, in contrast to what has been
documented elsewhere (Tyler, Speight et al. 2009, Lindfield, McIlwain et al. 2014). It is
speculated that the 15m habitats surveyed may not have been deep enough to show the
expected signs of depth refuge, or previously legal (and perceived illegal) SCUBA
fishing may have diminished resources at depth (Lindfield, McIlwain et al. 2014).
Benthic and coral assemblages also showed informative dynamics through time
with respect to wave exposure, fish assemblages, and water quality. Historic studies
suggested a disturbance event during the early phases of the 1992 surveys that was
attributed to Acanthaster planci populations reported by fishermen, extreme low tides,
and/or a nearby passing tropical storm event (Cheenis). Thus, recovery was expected
across the two time periods given that no major disturbances have existed since 2003-
2006 when Acanthaster were more recently documented (Houk, Bograd et al. 2007). The
present study reported differences in the change in coral cover and colony density that
provided evidence of non-uniform recovery throughout the bay (Figure 9). Although
there was a universal increase in colony density throughout, shifts in size-class
distributions and species assemblages provided three interesting scenarios. For sites A
and B, there was a slight decline in coral cover, a slight increase in population density of
smaller opportunistic corals (Porites rus in particular), and a significant decline in colony
size distributions (Figures 9, 10, and 11). This scenario represented the least desirable
case based upon known reef recovery patterns that typically show a return of coral cover
manifested by larger colonies of mixed species given longer time periods following

63
disturbance events (Bellwood, Hughes et al. 2004, Golbuu, Victor et al. 2007). In
contrast, coral cover had a slight increase at sites D and E, but population density grew
substantially, and significant declines in size-class distributions were again observed.
These trends were similar to above, but suggested that reefs were showing higher signs of
recruitment, yet recruits were mainly opportunistic corals such as small favids,
Leptastrea, and Leptoria, known to be tolerant to environmental stress (Nyström and
Folke 2001, Hughes, Baird et al. 2003). This may also be a result of partial mortality of
larger colonies followed by a continued selection against coral growth and recovery
(Brodie, Fabricius et al. 2005, Gardner, Côté et al. 2005, Chollett, Mumby et al. 2012).
Interestingly, size-class distributions have remained the most consistent through time for
sites C and F, while coral cover increased. The positive changes through time were
associated with a return to dominance by encrusting Montipora corals, and increases in
some branching Acropora and Pocillopora corals that add three-dimensionality to reefs.
Thus, the recovery of coral assemblages from these two locales provides an interesting
situation compared to others.
Site F had the greatest wave exposure, and site-specific recovery resonated well
with an ongoing study. Houk et al. (in review) examined the dynamics of 21 sites around
CNMI following the 2003 – 2006 disturbance period associated with high Acanthaster
planci populations, and found that wave exposure was a primary factor driving recovery.
However, herbivore populations and water quality proxies significantly increased the
amount of variance explained in a spatially-inconsistent manner, relevant to the synthesis
of this thesis presented below. Within Laolao Bay, the highest wave exposure existed at
site F, suggesting its role as a primary driver of recovery. In support, a significant

64
association existed between wave exposure and coral skewness change (i.e., an indicator
of coral community structure and function) across all sites (Figure 19). This has similarly
been found elsewhere, whereby high-cover, Montastrea-dominated reefs in the Caribbean
had greatest affinities with wave exposure (Chollett and Mumby 2012). However,
recovery at site C was less attributable to wave exposure, as moderate exposure existed,
yet recovery was maximal. Noted above, site C had the highest biomass and density of
larger-bodied fish, including numerous herbivores, purporting a stronger role of fish
assemblages (i.e., grazing) in promoting coral assemblage recovery (Mumby and
Harborne 2010). It is speculated that site C represents a unique locale where land-based
sediments and reef flat algal build-up have naturally had a strong connection with near-
shore reefs due to the presence of the largest hydrodynamic channel in Laolao Bay being
adjacent to this site. Hence, this natural geomorphological situation may be facilitating,
in part, the presence of larger-bodied herbivore assemblages, with ensuing benefits to the
corals.
Benthic data collected in 2012 support the general findings depicted from coral
assemblages. Low wave exposure, high groundwater influence, and compromised
herbivore populations were associated with a dominance of turf and macroalgae
throughout eastern portions of the bay, which are known to impede coral settlement and
growth (Keats, Chamberlain et al. 1997, McCook 1999, Mumby, Hastings et al. 2007). In
contrast, maximal coral growth was reported at sites C and F, and an overall strong
association between wave exposure and heavily-calcifying benthic substrates grouped
together existed (combined cover of corals and crustose coralline algae, Figures 8 and
20). Wave exposure has been shown to promote a dominance of calcifying substrates
65
elsewhere in Micronesia (Houk, Benavente et al. 2012), and also influence reef accretion
through time (Grigg 1998). In contrast to wave exposure, water quality did not have a
predictable influence upon 2012 benthic substrates across the entire bay, but
compromised herbivore assemblages did (Figure 20). Clearly, it seems relevant to
contextualize the influences of localized stressors across Laolao Bay while accounting for
wave exposure, a driving natural environmental regime.
Correlation analyses and regression examinations indicated that two key
environmental drivers of change to Laolao Bay were water quality and wave exposure,
both which had linked associations with the fishes, corals, and benthic substrates that
suggested plausible pathways for change since 1992, and spatial gradients in 2012.
Diminished water quality across space and through time had the similar, positive
association with small-bodied acanthurids, and negative association with larger-bodied,
mixed species assemblages. Several studies support these results whereby fish
assemblages dominated by small-bodied species that can rapidly respond to resource
availability become prolific where chronic stress from reduced water quality persisted
(Hughes, Rodrigues et al. 2007). In addition, coral loss from disturbances and/or poor
water quality has been attributed to reduced reef structure (i.e., loss of large, three-
dimensional coral colonies), and a decline in fisheries potential of larger-bodied species
with economic potential (Pratchett, Gust et al. 2001, Jones, McCormick et al. 2004). Yet,
recent studies in the Seychelles provide alternative lines of evidence. One atoll where
fishing has been prohibited for several years was impacted by repeated coral bleaching
events over the past decade, yet biomass of most large-bodied species with high fisheries
potential remains (Friedlander, Obura et al. 2014). Clearly disturbances have direct

66
impacts for fishes that are coral obligates (Pratchett 2005), and a major loss of structure
would eventually reduce fisheries potential (Jones, McCormick et al. 2004), yet it is
important to consider the functional role of fishes in controlling algae and promoting
coral growth.
This study reports strong associations between poor water quality and the
increased dominance of small-bodied species, but provided no evidence linking water
quality to coral assemblages or benthic substrates when considering the gradient among
all sites across Laolao. Rather, sessile organisms were best predicted by wave exposure
(historical analyses) in combination with herbivore assemblages (2012 spatial gradients).
While declines in water quality were inferred through time for two sites (A and E), these
may represent site-specific instances where water quality impacts were most substantial,
as gradients inclusive of all sites were not significant. Further, these sites had the greatest
shifts in coral demography, and the most prolific growth of less-calcifying algae that are
known to impede coral recruitment and survival (Antonius 1999, Antonius 2001).
Therefore, this study provided less evidence to support H04, where coral loss from
disturbance or water quality was the suspected driver of declining food fish fish
resources. In turn, more evidence existed to support H03, where fish assemblages have
shifted through time, and this shift has resulted in the proliferation of compromised
assemblages with reduced ecological function. This notion is also supported by Houk et
al. (in review) who examined a 12-year dataset from CNMI’s long-term monitoring
program and found that beyond wave exposure, the process of herbivory appeared to be
highly influential in predicting coral assemblage recovery. Laolao Bay represented a low
anchor point in their regression models, where recovery was greatly diminished. It

67
followed that water quality was also a significant predictor of trends, but water quality
had a more spatially-restricted influence upon reefs where land-based impacts in the
watershed were most observable. Site A was associated with karst watersheds and the
development of a golf course following the 1992 study, and Site E has a large watershed
that is connected to urban development and road construction in the upper watershed.
Overall, the western portion of the bay held fish assemblages with greater
heterogeneity, a trend that was associated with less dominance of smaller-bodied
surgeonfishes, and greater abundances of mixed fish assemblages mainly from the
herbivore and secondary consumer guilds. The unique attributes of high herbivore
biomass at site C were strongly driven by the increase of one species between 1992 and
the present (N. unicornis), while other species decreased. Thus, heterogeneity for all sites
on the eastern part of the bay were diminished, and the strongest explanatory factor was
wave exposure. There was also a general gradient of low-to-high ecosystem integrity
moving east-to-west across Laolao Bay, depicted by high coral cover and more favorable
calcifying benthic substrate, with site C representing the data point in the predictive
association where residuals were highest. Fish assemblages with higher diversity and
biomass were noted in western compared to eastern Laolao based upon 2012 data, yet
comparisons through time revealed a greater decline in both metrics in the western
portion of the bay. It is speculated that greater declines in fish abundance in western
Laolao may be due to the transfer of fishing effort in the more wave exposed portion of
the bay through time as fish resources in the calmer parts of Laolao diminished (sites D,
E, and F). 1992 data suggested the relative dominance of smaller-bodied, faster growing
species already existed in the eastern portion of the bay, where wave exposure was
68
minimal, and fishing access greatest (predominantly for day/night spearfishing). Given a
greater harvesting potential with increased wave exposure that has been documented for
CNMI (Houk, Rhodes et al. 2012), increasing fishing effort on more exposed reefs could
have become emergent (Jennings and Polunin 1996, Cinner and McClanahan 2006). Yet,
it is problematic that no fishing effort data exists through time to formally develop these
themes. This premise is therefore not scientifically grounded, but rather based on
personal observation, and local knowledge of fishing practices throughout Laolao Bay.
However, understanding gradients in fishing pressure for Laolao Bay, and the entire
CNMI, should be considered a priority for resource management agencies.
This study has documented the change in food fish assemblages of Laolao Bay,
and was able to address several issues as to how and why these shifts have occurred. The
roles of water quality and wave exposure were found to be distributed throughout Laolao
Bay in a non-uniform pattern, shedding light on the spatial gradients present within the
bay. Specifically, the influence of natural geomorphology (i.e., karst limestone substrate
in eastern Laolao, and greater wave exposure in western Laolao) served to drive
underlying differences between coral, benthic and fish assemblages of east and west
portions of Laolao Bay. Several factors limited this studies ability to explain the role of
coral-reef structure on fish assemblage dynamics, the role of depth on fish assemblage
structure, and the greater decreases in density to western portions of Laolao despite
greater wave exposure. The availability of fisheries dependent and catch effort data,
would have served to identify and partition greater amounts of variation explained by the
spatial gradients of fishing pressure. Conveniently, these limitations provide clear
direction for future fisheries research focused at Laolao Bay. It is also highlighted that

69
although we draw conclusions about change through time from historical “baseline” data
(i.e., 1992 dataset); the resources of Laolao Bay have been subjected to external stressors
long before these studies were carried out. This reinforces perceptions that fish and coral
assemblages of Laolao Bay have been compromised prior to 1992, consistent with the
logic of shifting baselines (Pauly 1995), whereby the lack of understanding of these
present regimes stems from the inability to adequately visualize true change through
time. In conclusion the analysis of the fish assemblages of Laolao Bay have provided
local managers with a statistical documentation of how the synergistic factors of wave
exposure, water quality and fishing pressure influence the spatial gradients and recovery
patterns of the coral reefs ecosystems of Laolao Bay. Ultimately this study underscored
shifting baselines, and the importance of documenting change through time, in hopes that
proper management of such economically important resources remains a priority for the
sake of the future generations of resource users at Laolao Bay.

70
Bibliography:
Almany, G. R., et al. (2010). "Research partnerships with local communities: two case
studies from Papua New Guinea and Australia." Coral Reefs 29(3): 567-576.
Anderson, M., et al. (2008). "PERMANOVA+ for PRIMER: Guide to Software and
Statistical Methods." Plymouth, UK, 214pp. PRIMER-E, Plymouth, UK, 214pp.
Anthony, K. R. N. and O. Hoegh-Guldberg (2003). "Variation in coral photosynthesis,
respiration and growth characteristics in contrasting light microhabitats: an
analogue to plants in forest gaps and understoreys?" Functional Ecology 17(2):
246-259.
Antonius, A. (1999). "Metapeyssonnelia corallepida, a new coral-killing red alga on
Caribbean reefs." Coral Reefs 18(3): 301-301.
Antonius, A. (2001). "Pneophyllum conicum, a coralline red alga causing coral reef-death
in Mauritius." Coral Reefs 19(4): 418-418.
Aronson, R. B., Precht, W.F., Toscano, M.A., Koltes, K.H. (2002). "The 1998 bleaching
event and its aftermath on a coral reef in Belize." Coral Reefs.
Bell, P. (1992). "Eutrophication and coral reefs -- some examples in the Great Barrier
Reef lagoon." Water Res. 26(5): 553-568.

71
Bellwood, D., et al. (2004). "Confronting the coral reef crisis." Nature 429(6994): 827-
833.
Bellwood, D. R. (2003). "Origins and escalation of herbivory in fishes: a functional
perspective." Paleobiology 29(1): 71-83.
Bellwood, D. R. and J. H. Choat (2011). "Dangerous demographics: the lack of juvenile
humphead parrotfishes Bolbometopon muricatum on the Great Barrier Reef."
Coral Reefs 30(2): 549-554.
Bellwood, D. R., et al. (2012). "Human activity selectively impacts the ecosystem roles
of parrotfishes on coral reefs." Proceedings of the Royal Society B: Biological
Sciences 279(1733): 1621-1629.
Bohnsack, J. A. and S. P. Bannerot (1986). A stationary visual census technique for
quantatively assessing community structure of coral reef fishes, National Oceanic
and Atmospheric Administration Technical Report. NMFS 41.
Bonaldo, R. M. and D. R. Bellwood (2008). "Size-dependent variation in the functional
role of the parrotfish Scarus rivulatus on the Great Barrier Reef, Australia."
Marine Ecology-Progress Series 360: 237-244.

72
Brander, J. A. and M. Scott Taylor (1998). "Open access renewable resources: Trade and
trade policy in a two-country model." Journal of International Economics 44(2):
181-209.
Brodie, J., et al. (2011). "Assessment of the eutrophication status of the Great Barrier
Reef lagoon (Australia)." Biogeochemistry 106(2): 281-302.
Brodie, J., et al. (2005). "Are increased nutrient inputs responsible for more outbreaks of
crown-of-thorns starfish? An appraisal of the evidence." Marine Pollution
Bulletin 51(1): 266-278.
Brown, B. and J. Bythell (2005). "Perspectives on mucus secretion in reef corals." Marine
Ecology Progress Series 296: 291-309.
Bruno, J. F., et al. (2003). "Nutrient enrichment can increase the severity of coral
diseases." Ecology Letters 6(12): 1056-1061.
Bruno, J. F. and E. R. Selig (2007). "Regional decline of coral cover in the Indo-Pacific:
timing, extent, and subregional comparisons." PLoS ONE 2(8): e711.
Cesar, H., et al. (2003). "The economics of worldwide coral reef degradation."
Cheenis (1991). Cheenis 1991_6 Water Quality. Saipan, CNMI.

73
Choat, J. H. and D. R. Robertson (2002). Age-based studies on coral reef fishes. Coral
Reef Fishes: Dynamics and Diversity in a Complex Ecosystem (San Diego:
Academic Press, 2002). P. Sale. San Diego, Academic Press: 57-80.
Chollett, I. and P. Mumby (2012). "Predicting the distribution of Montastraea reefs using
wave exposure." Coral Reefs 31(2): 493-503.
Chollett, I., et al. (2012). "Physical environments of the Caribbean Sea." Limnology And
Oceanography 57(4): 1233.
Cinner, J. and T. McClanahan (2006). "Socioeconomic factors that lead to overfishing in
small-scale coral reef fisheries of Papua New Guinea." Environmental
Conservation 33(01): 73-80.
Cinner, J. E., et al. (2009). "Socioeconomic Factors that Affect Artisanal Fishers'
Readiness to Exit a Declining Fishery." Conservation Biology 23(1): 124-130.
Company, C. P. (1992). Quantitative marine baseline survey. Biological resources and
water quality. Bahia Laulau and Unai Laulau Kattan areas, Saipan, Mariana
Islands. C. C. R. M. Office. Saipan, MP.

74
Connell, J. H. (1997). Disturbance and recovery of coral assemblages, Coral Reefs. 16:
S101-S113.
De'ath, G. and K. Fabricius (2010). "Water quality as a regional driver of coral
biodiversity and macroalgae on the Great Barrier Reef." Ecological Applications
20(3): 840-850.
De'ath, G., et al. (2012). "The 27-year decline of coral cover on the Great Barrier Reef
and its causes." Proceedings Of The National Academy Of Sciences Of The
United States Of America 109(44): 17995-17999.
Dulvy, N., et al. (2004). "Size structural change in lightly exploited coral reef fish
communities: evidence for weak indirect effects." Canadian Journal Of Fisheries
And Aquatic Sciences 61(3): 466-475.
Dulvy, N. K., et al. (2004). "Coral reef cascades and the indirect effects of predator
removal by exploitation." Ecology Letters 7(5): 410-416.
Ekebom, J., et al. (2003). "A GIS-based step-wise procedure for assessing physical
exposure in fragmented archipelagos." Estuarine, Coastal and Shelf Science
57(5): 887-898.
75
Essington, T. E., et al. (2006). "Fishing through marine food webs." Proceedings of the
National Academy of Sciences of the United States of America 103(9): 3171-
3175.
Fabricius, K., et al. (2005). "Changes in algal, coral and fish assemblages along water
quality gradients on the inshore Great Barrier Reef." Marine Pollution Bulletin
51(1): 384-398.
Friedlander, A. M., et al. (2003). "Effects of habitat, wave exposure, and marine
protected area status on coral reef fish assemblages in the Hawaiian archipelago."
Coral Reefs 22(3): 291-305.
Friedlander, A. M. and E. E. DeMartini (2002). "Contrasts in density, size, and biomass
of reef fishes between the northwestern and the main Hawaiian islands: the effects
of fishing down apex predators." Marine Ecology Progress Series 230: 253-264.
Friedlander, A. M., et al. (2014). "Coexistence of Low Coral Cover and High Fish
Biomass at Farquhar Atoll, Seychelles." PLoS One 9(1).
Gardner, T. A., et al. (2005). "Hurricanes and Caribbean coral reefs: impacts, recovery
patterns, and role in long-term decline." Ecology 86(1): 174-184.

76
Gilmour, J. P., et al. (2013). "Recovery of an Isolated Coral Reef System Following
Severe Disturbance." Science 340(6128): 69-71.
Golbuu, Y., et al. (2007). "Palau's coral reefs show differential habitat recovery following
the 1998-bleaching event." Coral Reefs 26(2): 319-332.
Graham, N. A. J., et al. (2011). "Coral reef recovery dynamics in a changing world."
Coral Reefs 30(2): 283-294.
Greenstein, B., et al. (1998). "Shifting ecological baselines and the demise of Acropora
cervicornis in the western North Atlantic and Caribbean Province: a Pleistocene
perspective." Coral Reefs 17(3): 249-261.
Grigg, R. (1998). "Holocene coral reef accretion in Hawaii: a function of wave exposure
and sea level history." Coral Reefs 17(3): 263-272.
Grigg, R. W., et al. (1984). "Model Of A Coral-Reef Ecosystem .3. Resource Limitation,
Community Regulation, Fisheries Yield And Resource-Management." Coral
Reefs 3(1): 23-27.
Halford, A. (1996). "Recovery of a fish community six years after catastrophic marotality
event." Proc 8th Int Coral Reef Symp, Panama: 1011-1016.
77
Houk, P., et al. (2012). "Characterization and evaluation of coral reefs around Yap
Proper, Federated States of Micronesia." Biodiversity and Conservation 21(8):
2045-2059.
Houk, P., et al. (2013). "Coral reef disturbance and recovery dynamics across gradients of
localized stressors in the Mariana Islands." In review.
Houk, P., et al. (2007). "The transition zone chlorophyll front can trigger Acanthaster
planci outbreaks in the Pacific Ocean: Historical confirmation." Journal of
oceanography 63(1): 149-154.
Houk, P. and C. Musburger (2013). "Trophic interactions and ecological stability across
coral reefs in the Marshall Islands." Mar. Ecol. Prog. Ser 488: 23-34.
Houk, P., et al. (2010). "Water quality and herbivory interactively drive coral-reef
recovery patterns in American Samoa." PLoSONE 5(11): e13913.
Houk, P., et al. (2010). "Water quality and herbivory interactively drive coral-reef
recovery patterns in American Samoa." PLoS One 5(11): e13913.
Houk, P., et al. (2010). Laolao Bay Road and Coastal Management Improvement Project:
Ecological and Water Quality Assessment, Pacific Marine Resources Institute.

78
Houk, P., et al. (2012). "Commercial coral-reef fisheries across Micronesia: A need for
improving management." Coral Reefs 31(1): 13-26.
Houk, P. and R. Van Woesik (2006). "Coral reef benthic video surveys facilitate long-
term monitoring in the commonwealth of the Northern Mariana Islands: Toward
an optimal sampling strategy." Pacific Science 60(2): 177-189.
Hubbell, S. P. (1997). "A unified theory of biogeography and relative species abundance
and its application to tropical rain forests and coral reefs." Coral Reefs 16: S9-
S21.
Hughes, T. P., et al. (2003). "Climate change, human impacts, and the resilience of coral
reefs." Science 301(5635): 929-933.
Hughes, T. P., et al. (2007). "Phase shifts, herbivory, and the resilience of coral reefs to
climate change." Curr Biol 17(4): 360-365.
Hutchinson, N. and K. Rhodes (2010). "Home range estimates for squaretail
coralgrouper, Plectropomus areolatus (Ruppell 1830)." Coral Reefs 29(2): 511-
519.
Jackson, J. B., et al. (2001). "Historical overfishing and the recent collapse of coastal
ecosystems." Science 293(5530): 629-637.

79
Jennings, S. and N. Polunin (1996). "Effects of fishing effort and catch rate upon the
structure and biomass of Fijian reef fish communities." Journal Of Applied
Ecology 33(2): 400-412.
Jennings, S. and N. V. Polunin (1996). "Impacts of fishing on tropical reef ecosystems."
Ambio: 44-49.
Jennings, S., et al. (1999). "Predicting the vulnerability of tropical reef fishes to
exploitation with phylogenies and life histories." Conservation Biology 13(6):
1466-1475.
Jennings, S., et al. (1999). "Predicting the Vulnerability of Tropical Reef Fishes
to Exploitation with Phylogenies and Life Histories." Conservation Biology 13(6): 1466-
1475.
Johannes, R. E. (1981). Words of the lagoon: fishing and marine lore in the Palau district
of Micronesia, Univ of California Press.
Jones, G. P., et al. (2004). "Coral decline threatens fish biodiversity in marine reserves."
Proceedings of the National Academy of Sciences of the United States of America
101(21): 8251-8253.

80
Keats, D. W., et al. (1997). "Pneophyllum conicum (Dawson) comb nov (Rhodophyta,
Corallinaceae), a widespread Indo-Pacific non-geniculate coralline alga that
overgrows and kills live coral." Botanica Marina 40(4): 263-279.
Knowlton, N. and J. B. Jackson (2008). "Shifting baselines, local impacts, and global
change on coral reefs." PLoS biology 6(2): e54.
Kohler, K. E. and S. M. Gill (2006). "Coral Point Count with Excel extensions (CPCe): A
Visual Basic program for the determination of coral and substrate coverage using
random point count methodology." Computers & Geosciences 32(9): 1259-1269.
Lindfield, S. J., et al. (2014). "Depth Refuge and the Impacts of SCUBA Spearfishing on
Coral Reef Fishes." PLoS One 9(3): e92628.
Lokrantz, J., et al. (2008). "The non-linear relationship between body size and function in
parrotfishes." Coral Reefs 27(4): 967-974.
Loya, Y., et al. (2001). "Coral bleaching: the winners and the losers." Ecology Letters
4(2): 122-131.
Marubini, F. and P. S. Davies (1996). "Nitrate Increases Zooxanthellae Population
Density and Reduces Skeletogenesis in Corals." Marine Biology 127(2): 319-328.

81
McClanahan, T. (1995). "A coral reef ecosystem-fisheries model: impacts of fishing
intensity and catch selection on reef structure and processes." Ecological
Modelling 80(1): 1-19.
McClanahan, T. R., et al. (2011). "Critical thresholds and tangible targets for ecosystem-
based management of coral reef fisheries." Proceedings Of The National
Academy Of Sciences Of The United States Of America 108 (41): 17230-17233.
McClenachan, L. (2009). "Documenting loss of large trophy fish from the Florida Keys
with historical photographs." Conserv Biol 23(3): 636-643.
McCook, L. J. (1999). "Macroalgae, nutrients and phase shifts on coral reefs: scientific
issues and management consequences for the Great Barrier Reef." Coral Reefs
18(4): 357-367.
McCook, L. J., et al. (2010). "Adaptive management of the Great Barrier Reef: A
globally significant demonstration of the benefits of networks of marine reserves."
Proceedings of the National Academy of Sciences of the United States of America
107(43): 18278-18285.
McGoodwin, J. R. (2001). Understanding the cultures of fishing communities: A key to
fisheries management and food security, Food & Agriculture Org.
82
Mumby, P. J., et al. (2006). "Fishing, trophic cascades, and the process of grazing on
coral reefs." Science 311(5757): 98-101.
Mumby, P. J. and A. R. Harborne (2010). "Marine reserves enhance the recovery of
corals on Caribbean reefs." PLoS One 5(1): e8657.
Mumby, P. J. and A. R. Harborne (2010). "Marine reserves enhance the recovery of
corals on Caribbean reefs." PLoS ONE 5(1).
Mumby, P. J., et al. (2007). "Thresholds and the resilience of Caribbean coral reefs."
Nature 450(7166): 98-101.
Myers, R. A. and B. Worm (2003). "Rapid worldwide depletion of predatory fish
communities." Nature 423(6937): 280-283.
Nugues, M. M. and C. M. Roberts (2003). "Coral mortality and interaction with algae in
relation to sedimentation." Coral Reefs 22(4): 507-516.
Nyström, M. and C. Folke (2001). "Spatial resilience of coral reefs." Ecosystems 4(5):
406-417.
Pandolfi, J. M. and J. B. C. Jackson (2006). "Ecological persistence interrupted in
Caribbean coral reefs." Ecology Letters 9(7): 818-826.

83
Pauly, D. (1995). "Anecdotes and the shifting baseline syndrome of fisheries." Trends in
Ecology and Evolution 10(10): 430.
Pauly, D. (2008). "Global fisheries: a brief review." Journal of Biological Research-
Thessaloniki 9: 3-9.
Pauly, D., et al. (2005). "Global trends in world fisheries: impacts on marine ecosystems
and food security." Philosophical Transactions of the Royal Society B: Biological
Sciences 360(1453): 5-12.
Pratchett, M., et al. (2001). "Consumption of coral propagules represents a significant
trophic link between corals and reef fish." Coral Reefs 20(1): 13-17.
Pratchett, M. S. (2005). "Dietary overlap among coral-feeding butterflyfishes
(Chaetodontidae) at Lizard Island, northern Great Barrier Reef." Marine Biology
148(2): 373-382.
Rhodes, K. L. and M. H. Tupper (2007). "A preliminary market-based analysis of the
Pohnpei, Micronesia, grouper (Serranidae : Epinephelinae) fishery reveals
unsustainable fishing practices." Coral Reefs 26(2): 335-344.

84
Russel, S. (1998). Tiempon I Manmofo'na: Ancient Chamorro Culture and History of the
Northern Mariana Islands. Micronesian Archaeological Survey Report 32. CNMI
Division of Historic Preservation: 179-192.
Salinas-de-León, P., et al. (2013). "Temporal and spatial variability in coral recruitment
on two Indonesian coral reefs: consistently lower recruitment to a degraded reef."
Marine Biology 160(1): 97-105.
Starmer, J. and P. Houk (2008). Marine and Water Quality Monitoring Plan for the
Commonwealth of the Northern Mariana Islands. C. D. o. E. Q. a. C. R. M.
Agency. Saipan, MP.
Sweatman, H., et al. (2011). "Assessing loss of coral cover on Australia’s Great Barrier
Reef over two decades, with implications for longer-term trends." Coral Reefs
30(2): 521-531.
Talbot, F. H. B. C. R. and G. R. V. Anderson (1978). " "Coral reef fish communities:
unstable, high diversity systems?"." Ecol. Monogr. 48:425-440.
Tyler, E. H., et al. (2009). "Evidence for a depth refuge effect in artisanal coral reef
fisheries." Biological Conservation 142(3): 652-667.

85
van Beukering, P., et al. (2006). "The Economic Value of the Coral Reefs of Saipan,
Commonwealth of the Northern Mariana Islands." Technical Report submitted to
the CNMI Coral Reef Initiative, Saipan, MP.
Wilson, S., et al. (2010). "Habitat degradation and fishing effects on the size structure of
coral reef fish communities." Ecological Applications 20(2): 442-451.
Wilson, S. K., et al. (2010). "Habitat degradation and fishing effects on the size structure
of coral reef fish communities." Ecological Applications 20(2): 442-451.
Zeller, D., et al. (2007). "Re-estimation of small-scale fishery catches for US flag-
associated island areas in the western Pacific: the last 50 years." Fishery Bulletin
105(2): 266-277.
Zeller, D., et al. (2006). "Fisheries contributions to the gross domestic product:
underestimating small-scale fisheries in the Pacific." Marine Resource Economics
21: 355-374.