Amy Blouin, Executive Director The Missouri Budget Project Andrew Nicholas Center on Budget &...
24
Amy Blouin, Executive Director The Missouri Budget Project www.mobudget.org Andrew Nicholas Center on Budget & Policy Priorities www.cbpp.org The State of the State: Economic Conditions in Missouri October 2008
-
Upload
darion-newey -
Category
Documents
-
view
215 -
download
0
Transcript of Amy Blouin, Executive Director The Missouri Budget Project Andrew Nicholas Center on Budget &...
Amy Blouin, Executive DirectorThe Missouri Budget Project
www.mobudget.org Andrew Nicholas
Center on Budget & Policy Prioritieswww.cbpp.org
The State of the State:Economic Conditions in Missouri
October 2008

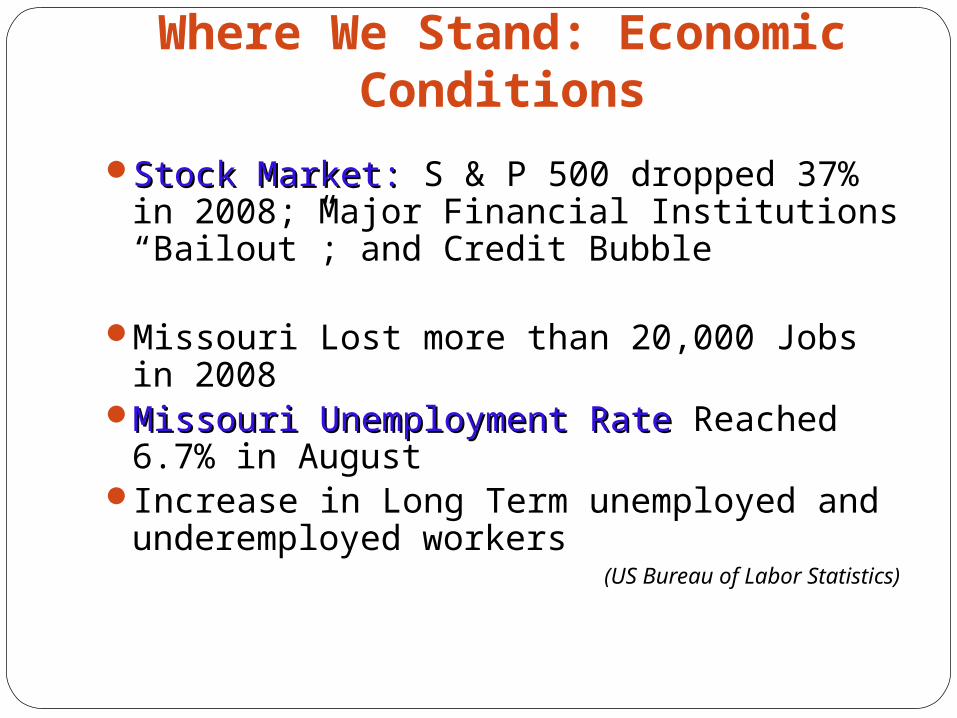
Where We Stand: Economic Conditions
Stock Market:Stock Market: S & P 500 dropped 37% in 2008; Major Financial Institutions “Bailout”; and Credit Bubble
Missouri Lost more than 20,000 Jobs in 2008Missouri Unemployment RateMissouri Unemployment Rate Reached 6.7% in
AugustIncrease in Long Term unemployed and
underemployed workers(US Bureau of Labor Statistics)
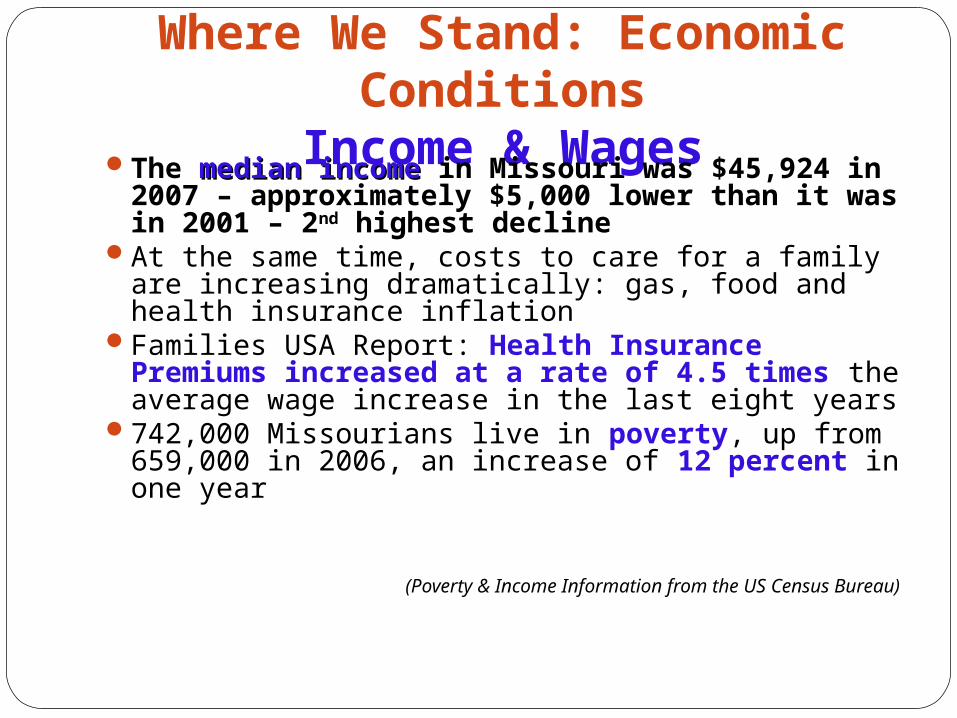
Where We Stand: Economic ConditionsIncome & WagesThe median incomemedian income in Missouri was $45,924 in
2007 – approximately $5,000 lower than it was in 2001 – 2nd highest decline
At the same time, costs to care for a family are increasing dramatically: gas, food and health insurance inflation
Families USA Report: Health Insurance Premiums increased at a rate of 4.5 times the average wage increase in the last eight years
742,000 Missourians live in poverty, up from 659,000 in 2006, an increase of 12 percent in one year
(Poverty & Income Information from the US Census Bureau)

Where We Stand: Economic ConditionsEmploymentOver the same period of wage decline, the Gross State
Product grew by 8.5%First time on record where wages were stagnant despite
productivity growth Missouri had the 22nd largest GDP in the states in 2007
Largest Contributors: Manufacturing 13.3% Government 12.1% Real Estate 10%*
Employment Insecurity & Benefits Insecurity (GDP Information from EPI and MERIC)

Where We Stand Compared to Last Crisis: Employment (BLS Data)

Where We Stand Compared to Last Crisis: Medicaid (Missouri DSS Data)

Where We Stand Compared to Last Crisis: Food Stamps (Missouri DSS Data)
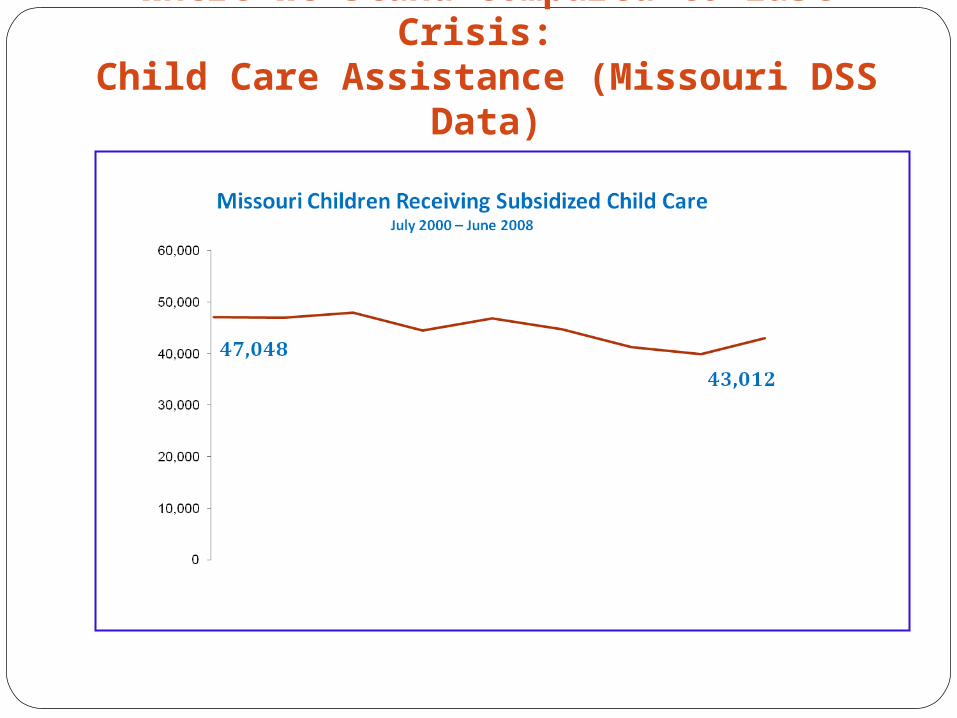
Where We Stand Compared to Last Crisis: Child Care Assistance (Missouri DSS Data)

The Growth of Income Inequality
Amy Blouin, The Missouri Budget Project
Andrew Nicholas, Center on Budget & Policy Priorities

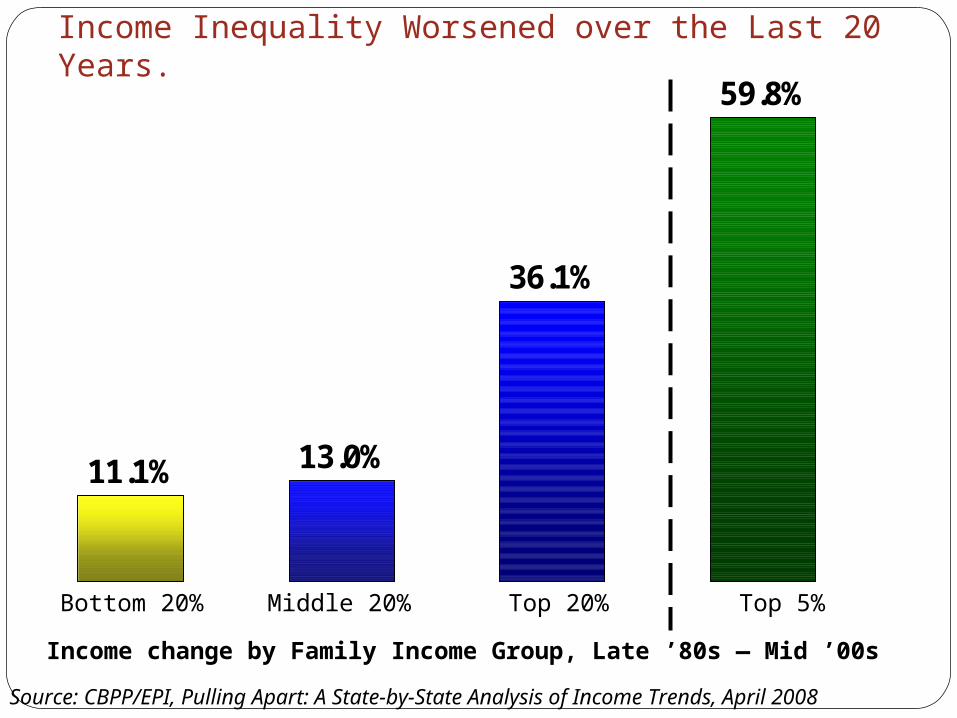
Income Inequality Worsened over the Last 20 Years.
11.1% 13.0%
36.1%
59.8%
Bottom 20% Middle 20% Top 20% Top 5%
Source: CBPP/EPI, Pulling Apart: A State-by-State Analysis of Income Trends, April 2008
Income change by Family Income Group, Late ’80s — Mid ’00s
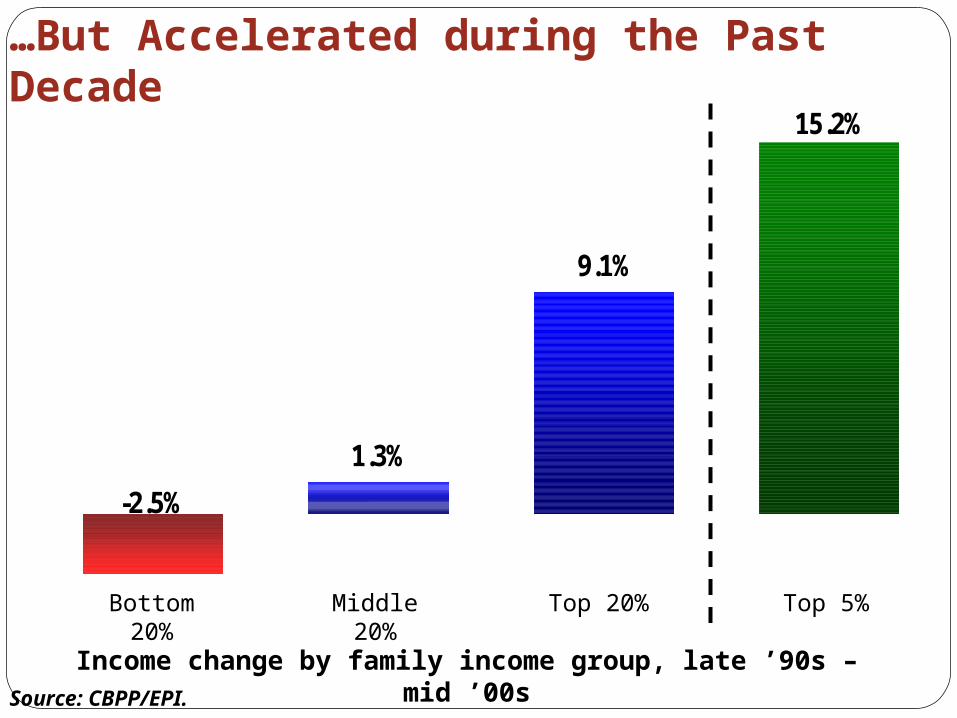
…But Accelerated during the Past Decade
1.3%
9.1%
15.2%
-2.5%
Bottom 20%
Middle 20% Top 20% Top 5%
Income change by family income group, late ’90s – mid ’00sSource: CBPP/EPI.
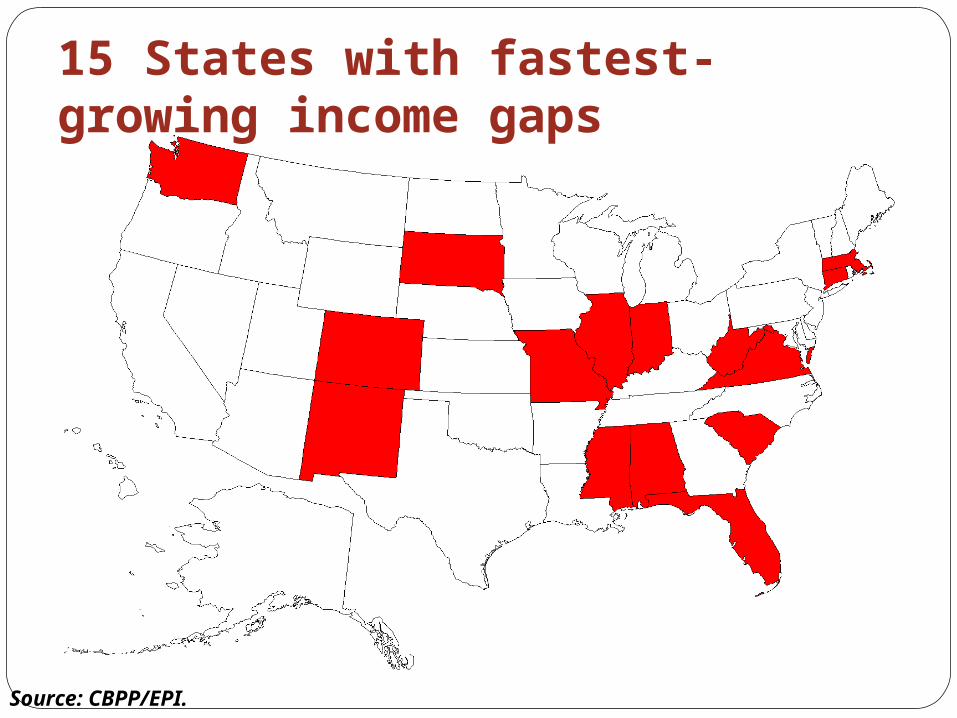
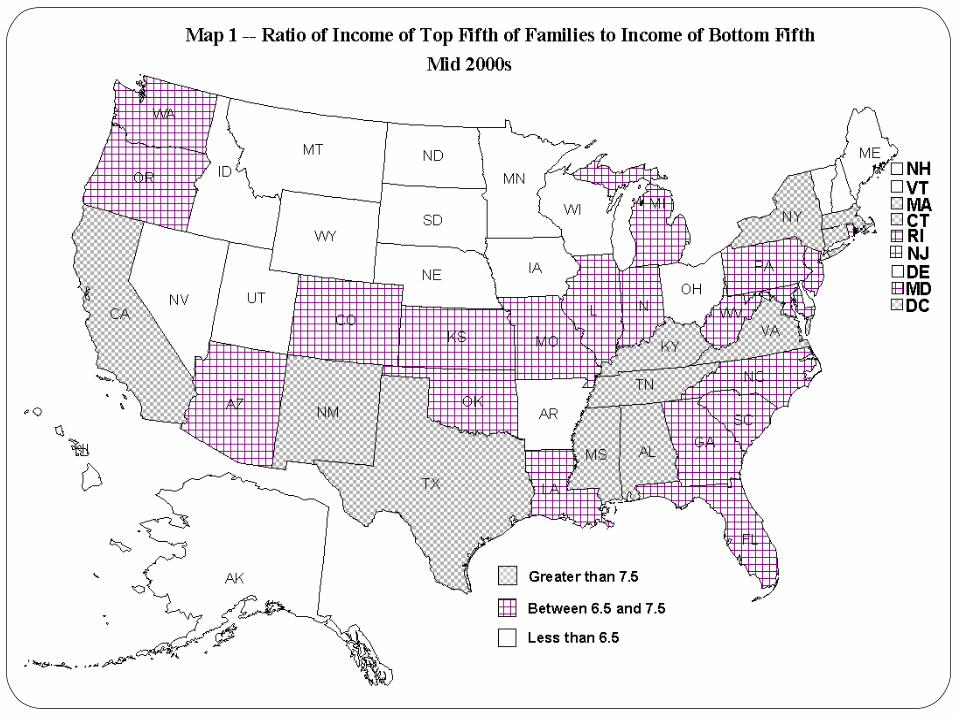
15 States with fastest-growing income gaps
Source: CBPP/EPI.
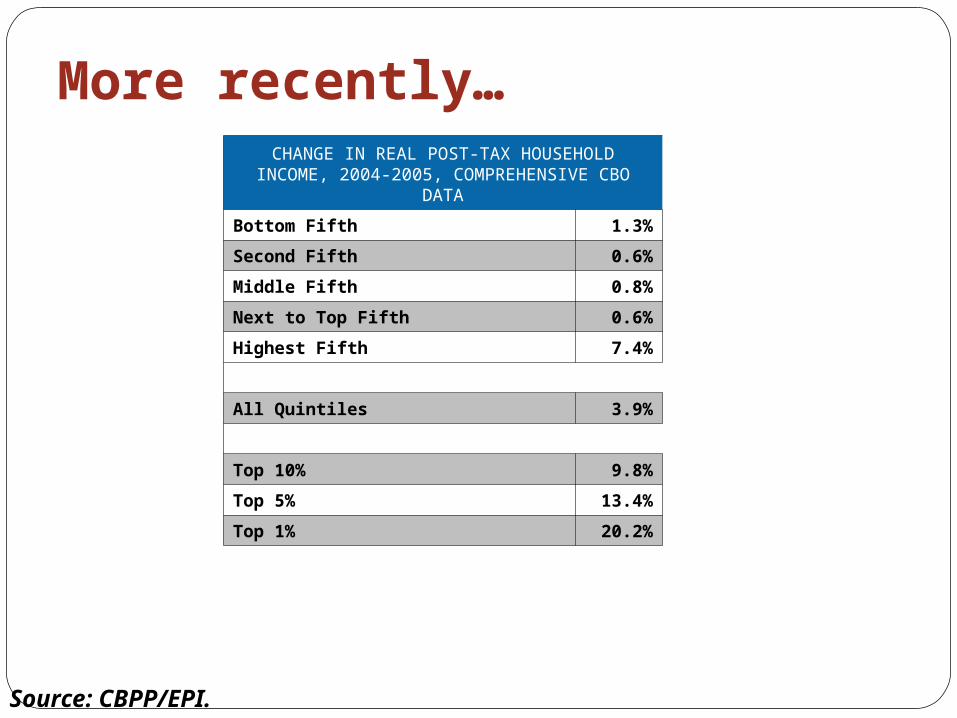
More recently…CHANGE IN REAL POST-TAX HOUSEHOLD
INCOME, 2004-2005, COMPREHENSIVE CBO DATA
Bottom Fifth 1.3%
Second Fifth 0.6%
Middle Fifth 0.8%
Next to Top Fifth 0.6%
Highest Fifth 7.4%
All Quintiles 3.9%
Top 10% 9.8%
Top 5% 13.4%
Top 1% 20.2%
Source: CBPP/EPI.
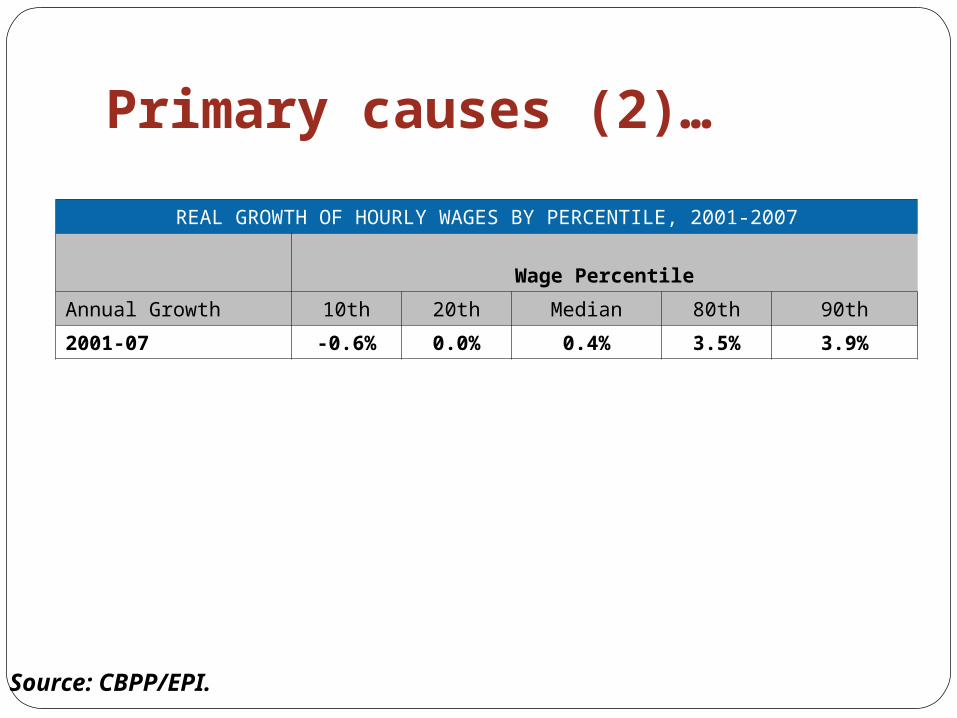
Primary causes (2)…
REAL GROWTH OF HOURLY WAGES BY PERCENTILE, 2001-2007
Wage Percentile
Annual Growth 10th 20th Median 80th 90th
2001-07 -0.6% 0.0% 0.4% 3.5% 3.9%
Source: CBPP/EPI.

Source: Leonhardt, David, “Next Victim of Turmoil Maybe your Salary”, New York Times, October 14, 2008.

Growth in the stock market…
0%
2%
4%
6%
8%
1958 1968 1978 1988 1998 2008 2018
Projection
Actual
Source: Congressional Budget Office

In Missouri, Inequality Increased over the Past 20 Years
10.9%
14.3%
34.9%
Bottom 20% Middle 20% Top 20%
Source: CBPP/EPI, Pulling Apart: A State-by-State Analysis of Income Trends, April 2008
Missouri Income change by Family Income Group, Late ’80s — Mid ’00s

Where We Stand: 2008 vs. 2001 Investments in ServicesHealth Care: Health Care:
The number of uninsured Missourians increased by 3.5% between 2001 and 2007.
Missouri now has 729,000 uninsured (US Census).
Higher Education:Higher Education: Missouri Colleges and Universities received roughly the same amount of state
support in 2008 as they did in 2001 ($771 million in FY 2008 vs. $767 FY 2001),
When inflation is taken into account, Missouri Colleges and Universities in 2008 were $140 million behind their 2001 funding levels,
Tuition has increased by 75% as a result.
K-12 Education:K-12 Education: Recent funding increases are just meeting the 2005 School Funding Formula
requirements, increasing by about 4% per year, slightly more than inflation. More than $1 billion below the “adequacy standard”
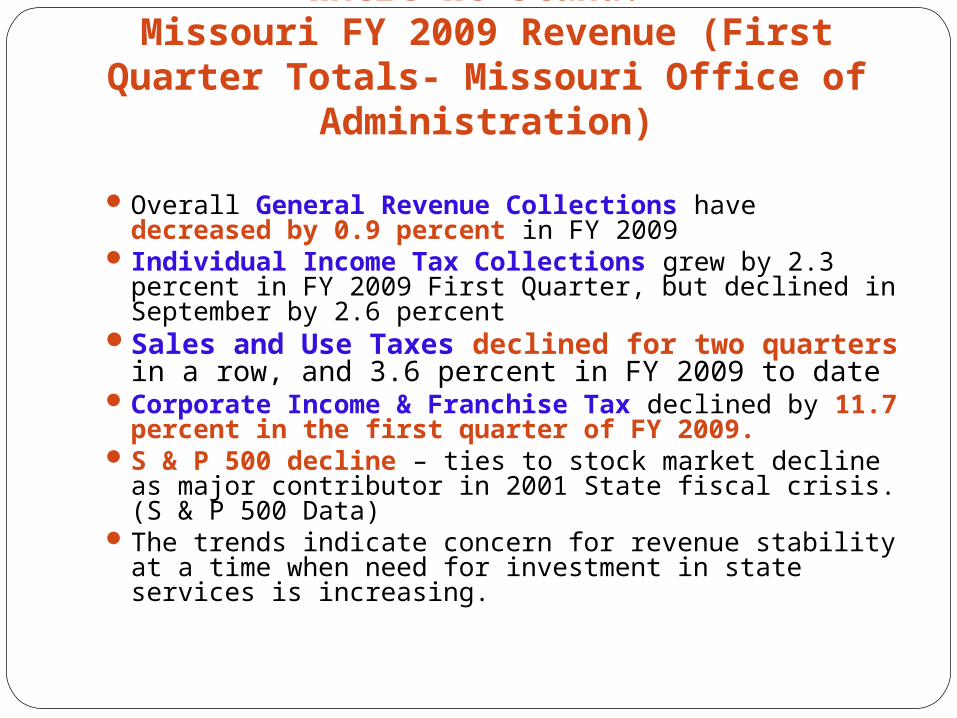
Where We Stand: Missouri FY 2009 Revenue (First Quarter Totals-
Missouri Office of Administration)
Overall General Revenue Collections have decreased by 0.9 percent in FY 2009
Individual Income Tax Collections grew by 2.3 percent in FY 2009 First Quarter, but declined in September by 2.6 percent
Sales and Use Taxes declined for two quarters in a row, and 3.6 percent in FY 2009 to date
Corporate Income & Franchise Tax declined by 11.7 percent in the first quarter of FY 2009.
S & P 500 decline – ties to stock market decline as major contributor in 2001 State fiscal crisis. (S & P 500 Data)
The trends indicate concern for revenue stability at a time when need for investment in state services is increasing.

Structural Deficit: Opportunities
Short Term• Federal Fiscal Relief : 2Federal Fiscal Relief : 2ndnd Economic Stimulus: Economic Stimulus:
• Direct Grants to States, similar to 2001 crisis
• Enhance Federal Medicaid Matching Rate, similar to 2001 crisis
• Extend Unemployment Benefits
Center on Budget & Policy Priorities many resources on federal assistance at www.cbpp.org
2009 State Legislative Session: Opportunities
Evaluate Long-Term Sustainability of State Revenue Sources: Modernize Missouri’s tax structure to fit the new “economy”
State Economic Stimulus• State Earned Income Tax Credit• Health Care• “New” Economy Workforce Development • Work together to build a Missouri that supports healthy
communities and a productive economy:
Join the Missouri Budget Project action network at www.mobudget.org