Biodiversity Action Plan for Amulsar, Armenia Prepared for ...

August 2014
AMULSAR GOLD PROJECT
Hydrogeological Risk Assessment Proposed Heap Leach Facility
RE
PO
RT
Report Number 14514150095.509/B.1
Distribution:
Lydian International Ltd - 1 copy (pdf)
Golder Associates (UK) Ltd - 1 copy
Submitted to:
Lydian International Ltd Ground Floor, Charles House Charles Street St. Helier Jersey, JE2 4ZJ Channel Islands
HLF HYDROGEOLOGICAL RISK ASSESSMENT
August 2014 Report No. 14514150095.509/B.1 i
Table of Contents
1.0 INTRODUCTION ........................................................................................................................................................ 4
1.1 Heap Leach Facility Design .......................................................................................................................... 4
1.1.1 HLF Development Phasing ..................................................................................................................... 5
1.2 Site Setting ................................................................................................................................................... 5
2.0 HEAP LEACH CONCEPTUAL MODEL .................................................................................................................... 6
2.1 Source .......................................................................................................................................................... 6
2.1.1 Engineered Containment ........................................................................................................................ 6
2.1.2 Source Quality ........................................................................................................................................ 7
2.1.2.1 Pregnant Leach Solution Quality ......................................................................................................... 8
2.1.2.2 Closure Water Quality .......................................................................................................................... 8
2.1.3 Constituents of Potential Concern ......................................................................................................... 10
2.2 Transport Pathways and Processes ........................................................................................................... 11
2.2.1 Pathways .............................................................................................................................................. 11
2.2.1.1 Unsaturated Zone .............................................................................................................................. 11
2.2.1.2 Saturated Zone .................................................................................................................................. 12
2.2.2 Retardation and Biodegradation Processes .......................................................................................... 12
2.2.2.1 Environmental Fate and Transport of Cyanide .................................................................................. 12
2.2.2.2 Other Constituents of Potential Concern ........................................................................................... 13
2.3 Receptors ................................................................................................................................................... 13
2.3.1 Groundwater Quality ............................................................................................................................... 1
2.3.2 Surface Water Quality ............................................................................................................................. 2
3.0 SOLUTE TRANSPORT MODELLING ....................................................................................................................... 3
3.1 Modelling Approach and Software Selection ................................................................................................ 3
3.2 GoldSim Model Structure .............................................................................................................................. 3
3.2.1 Flow Calculations .................................................................................................................................... 4
3.2.1.1 Calculation of Leakage Rates .............................................................................................................. 4
3.2.1.2 Unsaturated Zone Flow ....................................................................................................................... 7
3.2.1.3 Groundwater Flow ............................................................................................................................... 7
3.2.2 Solute Transport...................................................................................................................................... 7
3.2.2.1 Source ................................................................................................................................................. 7
3.2.2.2 Pathways ............................................................................................................................................. 8

HLF HYDROGEOLOGICAL RISK ASSESSMENT
August 2014 Report No. 14514150095.509/B.1 ii
3.2.2.3 Receptors ............................................................................................................................................ 8
3.3 Model Input Parameters ............................................................................................................................... 9
3.4 Results .......................................................................................................................................................... 9
3.4.1 HLF Leakage Quantities ......................................................................................................................... 9
3.4.1.1 Leakage from HLF Area Overlying the Shallow Groundwater ............................................................. 9
3.4.1.2 Leakage from HLF Area Overlying the Deeper Groundwater ............................................................ 10
3.4.2 Quality of Groundwater Discharging to Surface Water .......................................................................... 11
3.4.3 Surface Water Quality Impacts ............................................................................................................. 13
3.4.3.1 Arpa River, Scenario 1 ....................................................................................................................... 13
3.4.3.2 Arpa River, Scenario 2 ....................................................................................................................... 14
3.4.3.3 HLF Valley Stream ............................................................................................................................. 15
3.5 Sensitivity Analysis ..................................................................................................................................... 15
4.0 CONCLUSIONS ....................................................................................................................................................... 15
5.0 REFERENCES ......................................................................................................................................................... 17
TABLES
Table 1: HLF Phasing Summary and Modelled Areas ........................................................................................................ 5
Table 2: Barren Solution and Detoxified Solution Analysis (Lydian, 2014) .......................................................................... 9
Table 3: Summary of Baseline Groundwater Quality, HLF, Lower Volcanics Groundwater* ............................................... 1
Table 4: Summary of Baseline Groundwater Quality, HLF, Shallow Groundwater* ............................................................ 1
Table 5: Summary of Baseline Surface Water Quality, AW009, Arpa River* ...................................................................... 2
Table 6: Shallow Groundwater Discharge to HLF Valley Stream ...................................................................................... 10
Table 7: Modelled Maximum Change in Concentration in Deep Groundwater at Point of Discharge to the Arpa River* ............................................................................................................................................................... 11
Table 8: Modelled Maximum Change in Concentrations in Shallow Groundwater at Point of Discharge to Stream* ........ 11
Table 9: Modelled Peak Impact on Groundwater Quality Discharging to Arpa River ........................................................ 12
Table 10: Modelled Peak Impact on Groundwater Quality Discharging to HLF Stream .................................................... 12
Table 11: Modelled Peak Water Quality Change in the Arpa River ................................................................................... 13
Table 12: Modelled 95th
Percentile Water Quality Impacts to the Arpa River .................................................................... 13
Table 13: Modelled Peak Water Quality Change in the Arpa River ................................................................................... 14
Table 14: Modelled 95th Percentile Water Quality Impacts to the Arpa River ................................................................... 14
FIGURES
Figure 1: Groundwater Elevation Contours May 2014 and Indicative Flow Direction, Shallow Groundwater .................... 15
Figure 2: Groundwater Elevation Contours May 2014 and Indicative Flow Direction, Deep Groundwater ........................ 16

HLF HYDROGEOLOGICAL RISK ASSESSMENT
August 2014 Report No. 14514150095.509/B.1 iii
Figure 3: Modelled Leakage Rate from HLF to Shallow Groundwater, Operations and Post-Closure ................................ 9
Figure 4: Modelled Leakage Rate from HLF to Deep Groundwater, Operations and Post-Closure .................................. 10
APPENDICES
DRAWINGS Drawing 1 – Contaminant Transport Conceptual Model
APPENDIX A GoldSim Model Structure (Screen Shots)
APPENDIX B Model Inputs and Justifications
APPENDIX C Model Results
APPENDIX D Electronic Copies of GoldSim Models

HLF HYDROGEOLOGICAL RISK ASSESSMENT
August 2014 Report No. 14514150095.509/B.1 4
1.0 INTRODUCTION
Golder Associates (UK) Ltd (Golder) has been commissioned by Lydian International Ltd (Lydian) to
undertake the surface water and groundwater components of an Environmental and Social Impact
Assessment (ESIA) for the Amulsar Gold Project in central Armenia. The Amulsar Project is a proposed
open pit gold mine development, with a heap leach facility (HLF) and processing plant. The operational life
of the mine is proposed to be nine years.
This report presents an assessment of the risk to groundwater receptors as a result of the construction,
operation, reclamation and closure of the proposed HLF.
The risk assessment is supported by a probabilistic solute transport model using the solute transport module
of the GoldSimTM
dynamic modelling environment. The objective of the modelling is to quantify future
impacts and risks to groundwater and surface water receptors as a result of constituent migration from the
HLF.
1.1 Heap Leach Facility Design
The location of the proposed HLF is shown in the project description incorporated within the ESIA. The
proposed HLF layout and its location relative to potential groundwater receptors are shown in Drawing 1.
The HLF comprises a geosynthetically lined pad approximately 110 ha (approximately 2 km long and
between 300 m and 1,000 m wide oriented approximately northeast/southwest) divided into three phases,
developing upstream to the northeast.
A geosynthetically lined pregnant leach solution (PLS) storage pond is located at the toe of the facility, and
two lined stormwater ponds are located downslope of the PLS pond. The first of these ponds, Storm Pond 1,
is likely to receive overflow from the PLS pond during Phase 2 and 3 of operation based on the current
facility water balance. Upgrading of the liner of this pond will be completed at the end of Phase 1 to address
the use of this pond for PLS in the later phases of operation. This pond is therefore treated as a pregnant
solution pond in Phase 2 and 3 of operation in this assessment. The second pond, Storm Pond 2, will not
receive PLS unless an extreme event occurs and are not considered in this evaluation.
The Heap Leach Pad (HLP; GRE, 2014a), has a nominal capacity of 104 Mt and a maximum ore height of
120 m above the pad. The leach solution will percolate through the ore to the pad liner where it will be
collected in a network of perforated drainpipes installed within a 0.6 m thick granular cover drain fill layer
above the liner. Leach solution will be collected in the PLS pond, directed to the processing plant for
recovery of gold and silver, and barren solution will be recycled for subsequent leaching cycles. Engineered
containment of the pad and collection ponds is described further below.
The process pond are sized to contain eight hours of normal operational solution flow and 24 hours of
solution draindown flow from the ore heap for the final pad extent in case of operational shutdown due to
pump failure or power loss.
A groundwater and surface water monitoring plan will be implemented during operations and closure. The
purpose of the monitoring will be to evaluate the operational performance of the heap leach system and
identify any adverse trends in the facility water balance or changes in downgradient groundwater or surface
water quality (potential leakage) that would require the implementation of modifications to the leaching
system or additional mitigation measures.
The mine closure plan is not yet complete, but preliminary closure concepts for the HLF include:
Placement of a vegetated soil cover system, including a low permeability clay cover component, over
the over-heap to minimise long-term infiltration;
Reduction of leach pad effluent volumes within the heap through draindown prior to capping and
reclamation;
Detoxification to reduce cyanide concentration in the heap through rinsing with hydrogen peroxide prior
to cover placement;

HLF HYDROGEOLOGICAL RISK ASSESSMENT
August 2014 Report No. 14514150095.509/B.1 5
Surface water management and erosion control features designed to minimise erosion and to promote
run-off from the cover system, thereby further minimising long-term infiltration; and
Treatment of post-closure seepages from the reclaimed facility for a minimum period of five years via a
passive water treatment system located downstream of the facility until the fluids meet acceptable
end-of-pipe discharge criteria.
The nominal closure period for the facility is five years following the ten year operational period.
It has been assumed that the PLS pond will cease to be present following closure of the mine: either the
passive treatment system will be constructed in the vicinity of the pond, or the pond will be breached to allow
free discharge at the end of the managed closure period.
Modelling work presented in this assessment and in the remainder of this report has been based on the
feasibility level design for the HLF issued in May 2014 (GRE, 2014a). Assumptions have been made
regarding aspects of the design and closure, based on our understanding of the design. Primary features of
relevance to the groundwater risk assessment, such as the footprint of the facility, operational maximum
head and liner design are not expected to change during final design.
1.1.1 HLF Development Phasing
Phasing is described as follows in GRE (2014a):
“The Phase 1 pad will accommodate the Stage 1 heap of approximately 22.7 Mt, which will constitute the
first seven heap lifts to a nominal top surface elevation of 1688 m, and will be stacked during the initial
2.2 years of operations.
The Phase 2 pad expands the pad uphill to the east, providing for the stacking of the Stage 2 heap above
the Stage 1 heap and Phase 2 pad. The Stage 2 heap will consist of eight additional horizontal lifts above
the Stage 1 heap level and will have a nominal top surface elevation of 1752 m. The Stage 2 heap will be
approximately an additional 35.8 Mt, which is projected to be stacked till near the end of Year 6 of
operations.
The Phase 3 pad also expands the pad uphill to the east, providing for the stacking of the Stage 3 heap
above the Stages 1-2 heap and Phase 3 pad in 13 additional lifts to a nominal top surface elevation of
1856 m. Stacking of the Stage 3 heap will continue till just before the middle of Year 11 of operations to
provide an approximate total ore heap capacity on the Phases 1-3 pad of 104 Mt (excluding haulage and
conveyor bench setback considerations).”
Cover and reclamation of all phases will occur at the end of the rinsing and detoxification period,
approximately 18 months following the end of leach operations. Following a period of management using a
passive treatment system, discharge of fluids to the Arpa River in accordance with appropriate discharge
quality criteria will occur. The phasing and dimensions of the HLF based on feasibility level design drawings
for the HLF (GRE, 2014a) is summarised in Table 2.
Table 1: HLF Phasing Summary and Modelled Areas
Operational Period Area Overlying Shallow Groundwater(m2)
Area Overlying Deeper Groundwater(m
2)
Phase 1 27 months 323,550 156,960
Phase 2 43 months 134,920 142,030
Phase 3 55 months 8,990 337,630
1.2 Site Setting
The proposed HLF is situated approximately 1,500 m east of the Arpa River on the lower slopes of the Arpa
River catchment west of Amulsar, approximately 1.5 km south of the town of Gndevaz. The HLF Site is
valley-shaped and undulating in some areas, with the valley generally dipping to the southwest. The site

HLF HYDROGEOLOGICAL RISK ASSESSMENT
August 2014 Report No. 14514150095.509/B.1 6
grades range from 6% in the valley bottom near the downgradient toe of the planned leach pad to 55% on
the upper valley sides. Site grading fill will be placed in the valley bottom in the pad downgradient toe area
to establish a toe bench with a 1% pad downhill grade to facilitate ore heap stability. The ground elevation is
between 1,600 masl at the southwestern boundary and 1,800 masl at the northeastern boundary. The site is
approximately 180 m in elevation above the Arpa River at its southwestern limit and 350 m above the Arpa
River at its northeastern limit.
A stream valley containing an unnamed ephemeral water course runs southwest through the centre of the
site, the stream channel extends 1.6 km from the southwestern boundary of the Site to discharge into the
Arpa River. Surface water monitoring (ESIA Chapter 4.9) indicates that this stream does not flow in winter,
and it is likely that it is also dry in late summer/early autumn. Monitoring and site observations indicate that
continuous flow occurs at Monitoring Location G1, a tributary to the central drainage through the site to the
north of the main channel and the site footprint. However, this water infiltrates to ground before reaching the
southwestern extent of the HLF footprint.
2.0 HEAP LEACH CONCEPTUAL MODEL
The conceptual model of solute migration in groundwater from the HLF is shown schematically in Drawing 1.
The hydrogeology of the HLF site and hydrogeological conceptual model for groundwater flow is described in
detail in the ESIA Chapter 4.8, Groundwater Baseline.
The purpose of the conceptual model description is to describe the groundwater pathways linking the source
(substances within the HLF) to potential groundwater receptors (groundwater abstractions or
groundwater-fed surface water bodies located hydraulically downgradient of the HLF), and the mechanisms
of solute migration and attenuation in each pathway.
2.1 Source
2.1.1 Engineered Containment
The following engineered containment is proposed for the HLF:
The HLP will be lined by a 1.5 mm to 2.0 mm low density polyethylene (LLDPE) flexible membrane liner
(FML) beneath the pad underlain by minimum thickness of 0.3 m of compacted low permeability soils
with a permeability of less than 1x10⁻⁸
m/s, or geosynthetic clay liner (GCL) in steeper areas;
The liner will be overlain by a 0.6 m thick drainage layer comprising free-draining, hard and durable
granular material inlaid with a drainage pipe network. The pipe network is comprises a three tier
drainage spacing with tertiary drains at intervals of 7 m; and
Solution storage ponds will be lined with a double liner system comprising a 2.0 mm LLDPE FML upper
liner, an interstitial geocomposite drainage layer and a composite lower liner comprising 1.5 mm LLDPE
lower liner underlain by 0.3 m of compacted low permeability soil with a permeability of less than
1x10⁸ m/s.
The interstitial drainage layer in the double lined solution storage pond(s) will drain to a sump, assumed to
be located at one corner of the pond, and be removed via a pump. During Phase 1 of operation there will be
a single pregnant solution pond and two stormwater ponds. During Phases 2 and 3, the first storm water
pond (Storm Pond 1) may receive PLS, and is treated for design purposes and in this assessment as a PLS
pond. The lining of this pond will be upgraded at the end of Phase 1 to reflect the storage of PLS in the later
phases of operation.
Underdrains consisting of a network of drain trenches with pipes will be constructed at the locations of
existing drainages and seeps within the leach pad footprint to drain groundwater/subsurface seepage to
downgradient of the pad. Piped clean surface/groundwater flows will be carried from the point of seepage to

HLF HYDROGEOLOGICAL RISK ASSESSMENT
August 2014 Report No. 14514150095.509/B.1 7
and allowed to discharge downstream of the HLF. The quality of the discharge from the underdrain will be
monitored, and if quality is not suitable for discharge, will be pumped to the PLS pond.
The performance of the underdrains with respect to the capture of any leakage from the facility is not known
with confidence. Observation indicates that under existing conditions, flow in the drainages upstream of the
HLF site and discharge from the spring on the northwestern side of the site infiltrate to ground before
reaching the downstream side of the facility, such that the main drainage is dry in the autumn and winter
months. The impact assessment therefore assumes that all discharge from the basal liner will infiltrate to
ground rather than discharging along the underdrains. Discharge from the underdrains will be monitored
(flow and quality) during operations and underdrain discharge pumped back to the solution ponds if required,
therefore any leakage which is intercepted by the underdrains will not be released to the environment.
The HLF modelling has considered a 0.3 m compacted clay liner under the entire HLP. GCLs are typically
10 mm thick with a hydraulic conductivity less than 1x10-11
m/s. The transmissivity (thickness multiplied by
hydraulic conductivity) of a typical GCL is less than1x10-13
m2/s, whilst that of the 0.3 m compacted clay liner
with a permeability of 1x10⁻⁸
m/s original proposed is 3x10⁻⁹
m2/s. The leakage through a GCL will therefore
be less than that through the 0.3 m compacted low permeability soil liner originally proposed under
equivalent conditions. The modelling is therefore conservative.
2.1.2 Source Quality
The solute source associated with operation of the HLF includes:
Sodium cyanide solution applied to the heap as part of the gold extraction process; and
Substances, metals and major ions, present in the ore which are leached into the sodium cyanide
solution as a result of the leaching process.
Leaching of ore produces PLS. PLS is assumed to be present throughout the HLP and the pregnant solution
pond (PSP).
The engineering design of the HLF is to prevent leakage of PLS in the leaching process. PLS will be
collected in the HLP drainage system overlying the basal liner and will be collected in the PSP and pumped
to the treatment plant or recirculated to the heap.
Evidence from heap leach operations indicates that some PLS may leak into the underlying soils ultimately
reaching groundwater. The quantity of leakage from the HLP and PSP is a function of the head of liquid on
the liner of each component, the liner construction and the quantity of water infiltrating to or applied to the
facility. Flexible plastic membrane liners will degrade with time as a result of oxidation and breakdown of the
liner material, resulting in an increase in leakage with time under constant head conditions. This process is
critically dependent of temperature and conditions surrounding the liner, but at ambient temperatures (15 to
30°C), is estimated to take hundreds of years (for example, Koerner et al, 2011 indicate a period of
238 years to onset of degradation at 20°C and a service life to 50% degradation of 446 years, US National
Research Council (2007) quotes a service life of 565 years to 900 years at 20°C).
The HLP is designed to minimise head on the base, reducing leakage. Head within the heap will be
controlled within the 0.6 m drainage blanket thickness. However, actual head on the base of the facility is
likely to be considerably lower than this design maximum. Estimates of the maximum head on the base of
the facility during operation, in open but inactive phases and following closure and reclamation have been
made based on the drainage design and estimated infiltration rates, and are presented in Section 3.2.1.
The irrigation rate to the 287,400 m2 active leaching area during operations will be 0.01 m
3/hr/m
2. Following
active leaching, the phases will remain open until the facility is closed at the end of operation. Solution
applied in the actively irrigated area will be captured by the drainage system local to the area of application.
Water balance calculations (GRE, 2014c) indicate that infiltration to the open area will be an average of 485
mm/yr.
Following reclamation and closure, infiltration to the facility will be dependent on flow through the vegetated
soil cover. The post-closure infiltration rate will be much lower than operational conditions (thousands of

HLF HYDROGEOLOGICAL RISK ASSESSMENT
August 2014 Report No. 14514150095.509/B.1 8
times lower than the solution application rate, and tens of times lower than the infiltration to the open heap)
resulting in a much lower head on the base of the facility. Unsaturated flow modelling of the infiltration
through the post-closure cover is being undertaken GRE, but was not complete at the time of this
assessment. Similar modelling for the proposed cover for the Barren Rock Storage Facility (GRE, 2014b)
indicates that due to the high summer evaporation rates in the Amulsar Project area and the influence of soil
moisture storage, infiltration rates following closure may be low, less than 1 mm/yr.
In order to address uncertainty in the modelled post-closure infiltration rate, the impact assessment has
assumed an infiltration through the final cover of approximately 10 mm/yr. This is equivalent to the leakage
through a 1 m clay soil cover with a permeability of 1x10⁻⁹
m/s from a 1 m thickness of saturated cover soils
for a period of two months. The HLF facility has been modelled with a calculated 0.01 m head on the base
during closure based on a 10 mm/yr infiltration rate, with the maximum head limited to the assumed
post-closure infiltration rate of 10 mm/yr.
The engineered containment and calculation of leakage rates through the basal liners of the HLP and PSP
are discussed further below.
2.1.2.1 Pregnant Leach Solution Quality
Chemical analysis of the PLS from leaching test work is not currently available. The design (GRE, 2014a)
indicates that a leach solution containing 500 mg/l sodium cyanide concentration (equal to 265 mg/l of
cyanide and 235 mg/l of sodium) will be applied to the heap. However, attenuation of weak acid dissociable
(WAD) cyanide will occur due to reactions within the heap (volatilisation, complexation, precipitation). The
mechanisms of this attenuation are complex and a function of the ore mineralogy, and therefore can only be
reliably assessed through laboratory testing of the leach process or in heap operation. Analysis from pilot
studies (Table 2) indicates that cyanide consumption will result in cyanide concentrations between 34 mg/L
and 66 mg/L in the active heap.
The source term for other constituents of potential concern for this assessment is based on chemical
analyses of metal concentrations in the barren leach solution supplied by Lydian (Lydian, 2014). This
analysis is presented in comparison to Republic of Armenia MACs (maximum acceptable concentrations)
(Category II for the Arpa Basin) in Table 2.
The source term considered in modelling has been based on the following assumptions:
The concentrations of metals in each of the barren solution analyses reported are equally likely to be
representative of the operational barren solution quality (which is assumed, in turn, to be representative
of the PLS), such that the source term should be represented as the range of the values, rather than
their average; and
Concentrations of metals (excluding sodium) in the PLS may be higher (assumed up to two times) than
the concentrations reported in the barren solution due to: the potential loss of some metals to the
carbon residue (difference between concentrations in pregnant and barren solution), natural variation of
the ore mineral composition (significant variation is observed in the two samples analysed), recirculation
of the barren leach solution and progressive concentration of the leachate with respect to metals which
are not removed by the gold recovery process.
2.1.2.2 Closure Water Quality
GRE indicates that the following processes occur following cessation of ore deposition on the heap:
For a period of six to ten months, “rinsing” of the heap occurs: this comprises continued irrigation of the
heap with sodium cyanide solution and circulation of leach solutions to the processing plant, to recover
any remaining precious metals from the ore. No source term attenuation is anticipated during this
period. It is assumed that active evaporation to reduce solution volumes may be undertaken toward the
end of this period;
Following the rinsing period, a detoxification process is undertaken where the heap is rinsed with
hydrogen peroxide solution to destroy the cyanide in the heap and solution, this process will continue

HLF HYDROGEOLOGICAL RISK ASSESSMENT
August 2014 Report No. 14514150095.509/B.1 9
for six months to one year until cyanide concentrations are reduced to permissible levels for discharge;
and
Following rinsing and detoxification, the facility is covered and passive draindown of the leach solution
occurs. Closure management continues for a further five years during which drainage from the heap is
sent to a passive treatment system and is monitored prior to discharge.
Table 2 presents the chemical composition of the predicted final detoxified leach solution (Lydian, 2014).
Concentrations of most metals are similar at the end of the detoxification period to those in the barren leach
solution. Cyanide concentrations are lower, and nitrate concentrations are higher than during operations,
likely as a result of cyanide degradation.
The final detoxified leach solution represents the source term concentration associated with the HLF at the
end of closure. It is assumed that the concentration of all constituents of potential concern in the leach
solution on the leach pad will decrease exponentially with time after the cessation of operation due to
leaching into water percolating through the heap.
Transport of ammonium nitrate residue in the HLF ore is also likely to contribute ammonium and nitrate to
the HLF leach solution. The mass load of ammonium and nitrate has been calculated in Golder (2014). It is
assumed that ammonium will degrade rapidly to nitrate within the heap. The ammonium concentration has
been estimated as 50 mg/L. This is the approximate concentration arising from dilution of the continuously
added mass of ammonium nitrate into five days of solution volume at the operational application rate. The
nitrate concentration has been estimated at 250 mg N/L as it will be generated as a result of both cyanide
and ammonium oxidation. Should higher operation nitrate concentrations be measured, operational adaptive
management mitigation measures may be required.
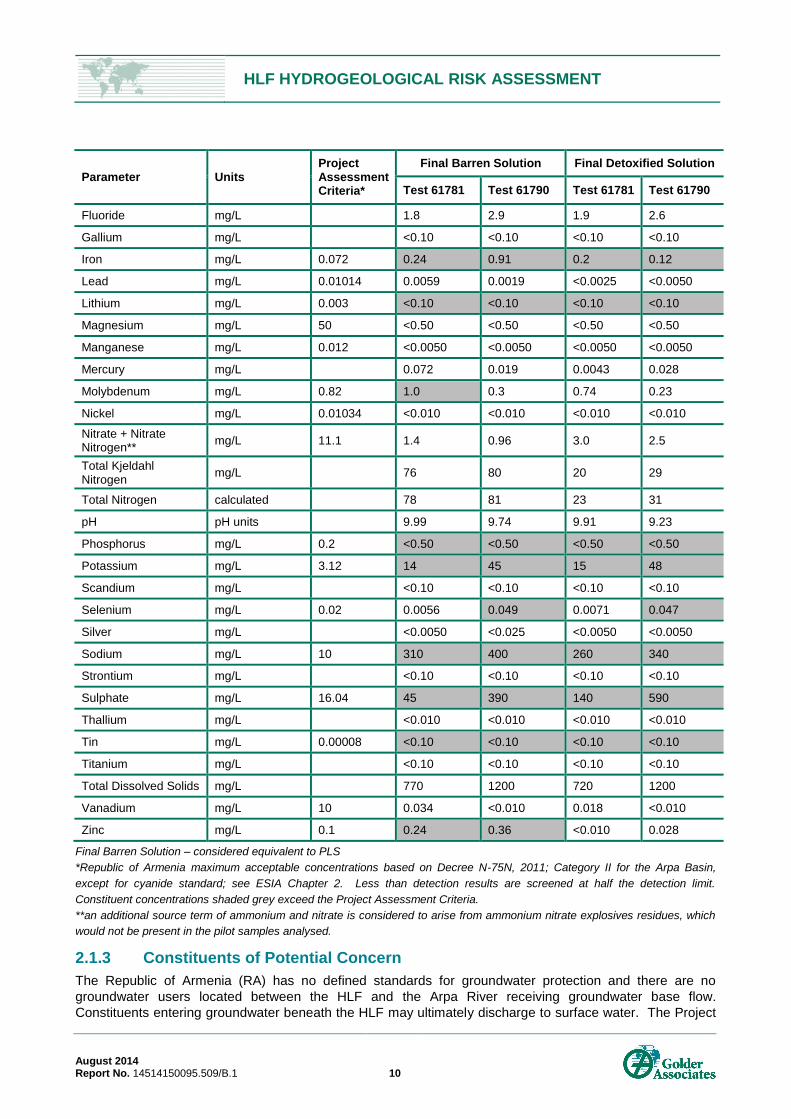
Table 2: Barren Solution and Detoxified Solution Analysis (Lydian, 2014)
Parameter Units Project Assessment Criteria*
Final Barren Solution Final Detoxified Solution
Test 61781 Test 61790 Test 61781 Test 61790
Alkalinity, Total mg/L as CaCO3
490 330 360 170
Bicarbonate mg/L as CaCO3
83 <1 130 120
Carbonate mg/L as CaCO3
260 190 160 43
Hydroxide mg/L as CaCO3
<1.0 3.4 <1.0 <1.0
Aluminium mg/L 0.144 1.1 6.6 0.38 2.4
Antimony mg/L 0.00028 0.12 0.04 0.19 0.061
Arsenic mg/L 0.02 0.63 0.15 0.70 0.18
Barium mg/L 0.028 <0.010 0.016 <0.010 0.016
Beryllium mg/L 0.000038 <0.0010 <0.0010 <0.0010 <0.0010
Bismuth mg/L
<0.10 <0.10 <0.10 <0.10
Boron mg/L 0.45 <0.10 <0.10 <0.10 <0.10
Cadmium mg/L 0.001014 <0.0010 <0.0010 <0.0010 <0.0010
Calcium mg/L 100 1.6 7.8 4.2 13
Chloride mg/L 6.88 41 27 28 27
Chromium mg/L 0.011 0.014 0.01 0.013 0.0055
Cobalt mg/L 0.00036 0.026 0.021 0.016 0.014
Copper mg/L 0.021 1.4 1.5 0.58 0.5
Cyanide (WAD) mg/L 0.5 34 66 0.044 0.036
Cyanide (Total) mg/L 1 42 67 0.66 0.61
HLF HYDROGEOLOGICAL RISK ASSESSMENT
August 2014 Report No. 14514150095.509/B.1 10
Parameter Units Project Assessment Criteria*
Final Barren Solution Final Detoxified Solution
Test 61781 Test 61790 Test 61781 Test 61790
Fluoride mg/L
1.8 2.9 1.9 2.6
Gallium mg/L
<0.10 <0.10 <0.10 <0.10
Iron mg/L 0.072 0.24 0.91 0.2 0.12
Lead mg/L 0.01014 0.0059 0.0019 <0.0025 <0.0050
Lithium mg/L 0.003 <0.10 <0.10 <0.10 <0.10
Magnesium mg/L 50 <0.50 <0.50 <0.50 <0.50
Manganese mg/L 0.012 <0.0050 <0.0050 <0.0050 <0.0050
Mercury mg/L
0.072 0.019 0.0043 0.028
Molybdenum mg/L 0.82 1.0 0.3 0.74 0.23
Nickel mg/L 0.01034 <0.010 <0.010 <0.010 <0.010
Nitrate + Nitrate Nitrogen**
mg/L 11.1 1.4 0.96 3.0 2.5
Total Kjeldahl Nitrogen
mg/L
76 80 20 29
Total Nitrogen calculated
78 81 23 31
pH pH units
9.99 9.74 9.91 9.23
Phosphorus mg/L 0.2 <0.50 <0.50 <0.50 <0.50
Potassium mg/L 3.12 14 45 15 48
Scandium mg/L
<0.10 <0.10 <0.10 <0.10
Selenium mg/L 0.02 0.0056 0.049 0.0071 0.047
Silver mg/L
<0.0050 <0.025 <0.0050 <0.0050
Sodium mg/L 10 310 400 260 340
Strontium mg/L
<0.10 <0.10 <0.10 <0.10
Sulphate mg/L 16.04 45 390 140 590
Thallium mg/L
<0.010 <0.010 <0.010 <0.010
Tin mg/L 0.00008 <0.10 <0.10 <0.10 <0.10
Titanium mg/L
<0.10 <0.10 <0.10 <0.10
Total Dissolved Solids mg/L
770 1200 720 1200
Vanadium mg/L 10 0.034 <0.010 0.018 <0.010
Zinc mg/L 0.1 0.24 0.36 <0.010 0.028
Final Barren Solution – considered equivalent to PLS
*Republic of Armenia maximum acceptable concentrations based on Decree N-75N, 2011; Category II for the Arpa Basin,
except for cyanide standard; see ESIA Chapter 2. Less than detection results are screened at half the detection limit.
Constituent concentrations shaded grey exceed the Project Assessment Criteria.
**an additional source term of ammonium and nitrate is considered to arise from ammonium nitrate explosives residues, which
would not be present in the pilot samples analysed.
2.1.3 Constituents of Potential Concern
The Republic of Armenia (RA) has no defined standards for groundwater protection and there are no
groundwater users located between the HLF and the Arpa River receiving groundwater base flow.
Constituents entering groundwater beneath the HLF may ultimately discharge to surface water. The Project

HLF HYDROGEOLOGICAL RISK ASSESSMENT
August 2014 Report No. 14514150095.509/B.1 11
Assessment Criteria protective of surface water are considered appropriate for assessment of the potential
impacts of the HLF on the water environment.
Based on the analysis presented in Table 2, the following constituents are considered of potential concern
due to their presence above standards for discharge to surface water: aluminium, ammonium, antimony,
arsenic, beryllium, chloride, chromium, cobalt, copper, cyanide, iron, lithium, molybdenum, nitrate,
phosphorous, potassium, selenium, sodium, sulphate, tin and zinc.
It is not considered necessary to model transport of all species present in the leachate, as the risk to
groundwater and surface water will be defined by the constituents which are most mobile, present at highest
concentration, or more toxic. The following constituents were therefore assessed in solute transport
modelling:
Cyanide: ecotoxic and highly mobile anion present at more than 130 times the IFC discharge standard
(0.5 mg/l);
Sodium: highly mobile cation, present above Armenian water quality standards;
Arsenic, antimony: ecotoxic and relatively mobile cations present at concentrations significantly above
water quality standards; and
Copper, cobalt: relatively mobile metallic cations which may form weakly soluble complexes with
cyanide, present above water quality standards in the PLS.
Cyanide may undergo aerobic biodegradation in the groundwater pathway, ultimately to ammonium and
carbon dioxide (Smith and Mudder (1991), Kjeldsen (1999)). Ammonium also undergoes biodegradation to
nitrate under aerobic conditions (England and Wales Environment Agency, 2003a). The accumulation and
transport of ammonia and nitrate in the unsaturated zone and groundwater pathway as a result of
biodegradation is represented in the solute transport model.
2.2 Transport Pathways and Processes
2.2.1 Pathways
The primary pathways for migration of constituents in groundwater from the HLF are as follows:
Vertical leakage through the FML and clay (double) liner from the HLP and lined PSP;
Vertical flow via gravity in the unsaturated zone through Colluvium and upper bedrock;
In the area of the HLF around the main drainage, advection in shallow perched groundwater in the
Colluvium and upper Lower Volcanics horizontally to the southwest to discharge to the surface water
drainage downstream of the HLF; and
On the valley margins away from the main drainage, advection in groundwater in the Lower Volcanics
westward to the Arpa River.
Solution ponds situated downgradient the HLP are assumed to overlie the shallow colluvium/upper bedrock
groundwater and discharge only to this pathway.
The conceptual model of solute migration from the facility is illustrated in Drawing 1. The area of the HLF
footprint which is considered to potentially discharge to the localised perched water body flowing to the local
drainage, and the HLF footprint area potentially discharging to deeper groundwater and subsequently to the
Arpa River is illustrated in Figures 1 and 2.
2.2.1.1 Unsaturated Zone
The calculated unsaturated zone thickness for each HLF phase in each pathway is presented in Appendix B.
Calculations are based on depth to groundwater recorded in October/November 2013 and May/June 2014
presented in the ESIA.

HLF HYDROGEOLOGICAL RISK ASSESSMENT
August 2014 Report No. 14514150095.509/B.1 12
2.2.1.2 Saturated Zone
Groundwater data and groundwater elevation contours for the HLF site are presented in the ESIA
Chapter 4.8 Groundwater Baseline.
Hydraulic gradients in saturated flow pathways within the shallow perched groundwater system and the
groundwater system have been calculated based on groundwater elevations recorded in October/November
2013 and May/June 2014.
Saturated pathway lengths from the upgradient side of the HLF to the point of discharge and mean hydraulic
gradients in each groundwater body beneath the site are presented in Appendix B.
For the purposes of the impact assessment, it is assumed that the shallow groundwater has a mean
saturated thickness of 5 m, and that groundwater discharges from this system to the main drainage
approximately 260 m southwest of Storm Pond 1.
Discharge to the Arpa River from the groundwater pathway occurs 1,580 m west of the western boundary of
the HLF.
2.2.2 Retardation and Biodegradation Processes
2.2.2.1 Environmental Fate and Transport of Cyanide
The toxicity and mobility of cyanide is highly dependent on the form that cyanide takes in solution or as a
solid. Ecological and human health risks arising from potential pollution of groundwater or surface water by
cyanide and cyanide compounds are governed by the concentration of ecotoxic forms of cyanide (cyanide
and thiocyanate) or weak or unstable complexes which may readily dissociate or break down to free cyanide
(weak metal complexes, iron complexes which are subject to photolysis). The total concentration of
potentially ecotoxic cyanide is usually measured as WAD cyanide: i.e. the concentration of cyanide liberated
at pH 4.5.
The chemistry of cyanide in the environment is complex, and is described in published literature and
regulatory guidance, including reviews provided by Smith and Mudder (1991), Lodgson et al (1999), Kjeldsen
(1999) and in NICNAS (2010). A brief overview is provided here.
Attenuation of concentrations of aqueous WAD cyanide in the subsurface may occur through many
processes:
Volatilisation as hydrogen cyanide (HCN) gas in solutions at low to moderate pH where there is a
vapour pathway or exposure to air (below approximately pH 8, all aqueous cyanide is present at HCN,
above pH 12 it is present as CN-). Volatilisation will be limited where there is no vapour migration
pathway or limited exposure to air, or where the solution is at high pH;
Aerobic and anaerobic biodegradation, ultimately to ammonia and carbon dioxide. Published
information suggests that in unsaturated soils, cyanide is readily biodegraded through a number of
mechanisms in aerobic conditions (Smith and Mudder (1991), Kjeldsen (1999)), and that biodegradation
may also occur (after a period of acclimatisation) in anaerobic conditions. However, rates are very
much slower in saturated conditions;
Precipitation as salts of strong cyanide complexes (ferrocyanides and ferricyanides). The ferro- and
ferricyanide salts of the abundant cations (calcium, magnesium, sodium, potassium, and ammonium)
are highly to moderately soluble, but the majority of salts with other metals (including iron, nickel,
copper and zinc) are insoluble;
Sorption to mineral surfaces during transport: studies summarised by Smith and Mudder (1991) suggest
that cyanide sorbs to organic carbon, feldspars and clay minerals, but the authors note that separation
of the effects of precipitation and sorption is difficult. Kjeldsen (1999) reports limited sorption based on
two studies and concludes that sorption is of minimal importance in transport of cyanide in soils.

HLF HYDROGEOLOGICAL RISK ASSESSMENT
August 2014 Report No. 14514150095.509/B.1 13
Sorption is a reversible process and serves to attenuate migration in the subsurface rather than
permanently remove cyanide from solution; and
Hydrolysis under low pH conditions to formic acid or ammonium formate.
Smith and Mudder (1991) note firstly that studies have shown volatilisation and biodegradation to be the two
most effective mechanisms of cyanide degradation occurring in the vadose and unsaturated zone, and
secondly that in closed systems where no volatilisation occurs, geological materials may have little or no
capacity for cyanide degradation.
The attenuation of cyanide in the subsurface will be a function of:
Cyanide concentration;
Concentration of cosolutes;
pH;
Moisture content (saturation conditions);
Soil permeability (and other controls on vapour migration such as meteorological factors);
Redox conditions; and
Mineralogy (affecting both retardation and precipitation).
Modelling has assumed that volatilisation will be limited in the unsaturated zone due to limited vapour
migration and high cyanide concentrations in comparison to available pore space. Most likely, any pregnant
solution potentially entering the subsurface is likely to be buffered to neutral pH, allowing some volatilisation
to occur, but connectivity with any surface water pathways is uncertain so it is difficult to quantify.
Aerobic biodegradation of cyanide has been assumed to occur in the unsaturated zone, but not in the
saturated zone.
Sorption reactions are modelled through a retardation coefficient applied to transport in the unsaturated and
saturated zone. Partition coefficients have been based on figures reported in Smith and Mudder (1991).
These partition coefficients are derived from migration rates of observed cyanide plumes in the natural
environment. Removal of cyanide through precipitation as insoluble complexes is not considered in the
model.
2.2.2.2 Other Constituents of Potential Concern
The solute transport model considers attenuation of metals as a result of sorption and retardation. The effect
of redox conditions and pH on the solubility and mobility of metals is not explicitly considered in the model,
metals present in the PLS are assumed to remain in solution except where sorbed to geological materials.
This approach has the potential to overestimate concentrations in groundwater of metals such as arsenic,
where mobility is a strong function of valency/redox conditions.
The aerobic biodegradation of ammonia (a product of cyanide biodegradation) to nitrate in the unsaturated
zone is represented in the model. It is considered that groundwater conditions in the saturated zone have
the potential to become anaerobic if impacted by significant cyanide discharge, and biodegradation of
ammonium is limited in anaerobic conditions (England and Wales Environment Agency, 2003a). It is
assumed that no biodegradation of ammonium occurs in the aquifer pathway.
2.3 Receptors
Groundwater receptors for the entire Project Area are described in Chapter 4.8 of the ESIA. There is no
groundwater use between the HLF site and groundwater discharge to the Arpa River downgradient of the
site. The steep topography of the Arpa gorge and proximity of the HLF to the river also makes it unlikely that
any future exploitation of groundwater between the site and area of discharge to surface water could occur.

HLF HYDROGEOLOGICAL RISK ASSESSMENT
August 2014 Report No. 14514150095.509/B.1 14
Groundwater provides baseflow to the Arpa River, and potentially to the stream passing southwest through
the HLF valley.
Groundwater elevation data and field observations indicate that groundwater discharges locally to the main
drainage in the HLF site (Figure 1) and regionally to the Arpa River west of the site (Figure 2). Surface water
flow data indicates that the main drainage downstream of the HLF site is dry in winter when surface water
run-off is low. This suggests that if shallow groundwater discharge to this drainage does occur within the site
footprint, it is seasonal in nature occurring primarily during the wetter periods of spring and summer. The
depth to groundwater is approximately 3 m at GGDW016/A downgradient of Storm Pond 2. It is therefore
reasonable to assume that the main drainage intersects the water table slightly southwest of the proposed
HLF site.
For the purposes of the impact assessment, impacts on the Arpa River and water quality in the local surface
water drainage have been determined under the following scenarios:
Scenario 1: Shallow groundwater discharges to the local surface water drainage approximately 260 m
southwest of Storm Pond 2. No additional permanent flow occurs in the stream southwest of the HLF
footprint, such that under low flow conditions there is no mixing in this water course; and
Scenario 2: Shallow groundwater does not locally discharge to surface water, and the entire constituent
mass from the facility may discharge to the Arpa River as a diffuse groundwater discharge to the west
and southwest of the site.
The location of the assumed zone of groundwater discharge to the HLF valley stream is illustrated on
Figure 1. In the model, the constituent mass discharged to the shallow groundwater in Scenario 1 is not
subsequently discharged to the Arpa River as this is considered in Scenario 2.
Flow in the Arpa River downstream of the Kechut Reservoir is controlled by discharge from the reservoir.
For the purpose of the impact assessment, low (Q95) flows in the Arpa River are estimated at 2.5 m3/s
based on existing monitoring (ESIA, Chapter 4.9). A range between 2.0 m3/s and 3.0 m
3/s has been placed
around possible estimates to allow for uncertainty associated with the limited monitoring record and
measurement accuracy.

HLF HYDROGEOLOGICAL RISK ASSESSMENT
August 2014 Report No. 14514150095.509/B.1 15
Figure 1: Groundwater Elevation Contours May 2014 and Indicative Flow Direction, Shallow Groundwater

HLF HYDROGEOLOGICAL RISK ASSESSMENT
August 2014 Report No. 14514150095.509/B.1 16
Figure 2: Groundwater Elevation Contours May 2014 and Indicative Flow Direction, Deep Groundwater

HLF HYDROGEOLOGICAL RISK ASSESSMENT
August 2014 Report No. 14514150095.509/B.1 1
2.3.1 Groundwater Quality
Baseline groundwater quality in the Lower Volcanics surrounding the HLF site is discussed in Chapter 4.8 of
the ESIA. Groundwater wells were installed at the HLF site in 2013; results from two monitoring rounds are
currently available.
Baseline groundwater quality for the HLF site is based on aggregated water quality in all of the monitored
wells, to increase the size and statistical reliability of the data set. Groundwater in the deeper Lower
Volcanics hydrogeological unit has been sampled in wells GGDW007, GGDW009, GGDW011, GGDW012,
GGDW013 and GGDW016. Shallower groundwater in the colluvium and shallow Lower Volcanics has been
sampled in GGDW013A and GGDW016A.
Baseline groundwater quality is presented in Tables 3 and 4. Groundwater quality has been compared to
Project Assessment Criteria (Republic of Armenia (RA) Category II maximum acceptable concentrations for
the Arpa River Basin, Decree N75-N, 2011), both because no dedicated RA standards exist for groundwater,
and because groundwater discharges to surface water.
Table 3: Summary of Baseline Groundwater Quality, HLF, Lower Volcanics Groundwater*
Pa
ram
ete
r
Un
it
Pro
jec
t
Ass
es
sm
en
t
Cri
teri
a
Min
imu
m
Ave
rag
e
Ma
xim
um
Std
Dev
iati
on
Data
Co
un
t
Ex
ce
ed
an
ces
of
MA
C
Ammonia and ammonium ions mg/L 0.51 0.05 0.69 3.52 1.24 12 3
Ammonia as N mg N/L 0.4 0.018 0.57 2.42 0.92 6 2
Antimony µg/L 0.28 1 1.17 1.8 0.31 12 12
Arsenic µg/L 20 1 4.22 15.6 5.38 12 0
Cobalt µg/L 0.36 0.5 0.55 0.96 0.13 12 12
Copper µg/L 21 1 2.11 5.8 1.64 12 0
Easily released cyanides mg/L 0.1 0.005 0.005 0.005 0 12 0
Total Cyanide mg/L 1 0.005 0.005 0.005 0 12 0
Nitrate as N mg/L 11.1 2 3.09 7.31 1.98 12 0
Sodium mg/L 10 6.27 27.1 48.9 12.8 12 9
*less than detection results are considered at the detection limit in statistical summaries
Table 4: Summary of Baseline Groundwater Quality, HLF, Shallow Groundwater*
Pa
ram
ete
r
Un
it
Pro
jec
t
Ass
es
sm
en
t
Cri
teri
a
Min
imu
m
Ave
rag
e
Ma
xim
um
Std
Dev
iati
on
Data
Co
un
t
Ex
ce
ed
an
ce
s o
f M
AC
Ammonia and ammonium ions mg/L 0.51 0.05 0.15 0.357 0.18 3 0
Ammonia as N mg N/L 0.4 0.018 0.018 0.018 0 2 0
Antimony µg/L 0.28 1 1 1 0 3 1
Arsenic µg/L 20 1 1 1 0 3 3
Cobalt µg/L 0.36 0.5 0.5 0.5 0 3 3
Copper µg/L 21 1.2 1.3 1.5 0.17 3 0
Easily released cyanides mg/L 0.1 0.005 0.005 0.005 0 3 0
Total Cyanide mg/L 1 0.005 0.005 0.005 0 3 0
Nitrate as N mg/L 11.1 2 5 11 5.20 3 0
Sodium mg/L 10 14.4 17.0 19.1 2.38 3 1
*less than detection results are considered at the detection limit in statistical summaries
HLF HYDROGEOLOGICAL RISK ASSESSMENT
August 2014 Report No. 14514150095.509/B.1 2
Detection limits applied for antimony and cobalt in groundwater exceed the Project Assessment Criteria for
these substances. For the purposes of the impact assessment, it is assumed that average concentrations of
these substances in groundwater are 0.2 μg/L and 0.3 μg/L respectively.
Ammonium and sodium naturally exceed the Project Assessment Criteria in groundwater under baseline
conditions.
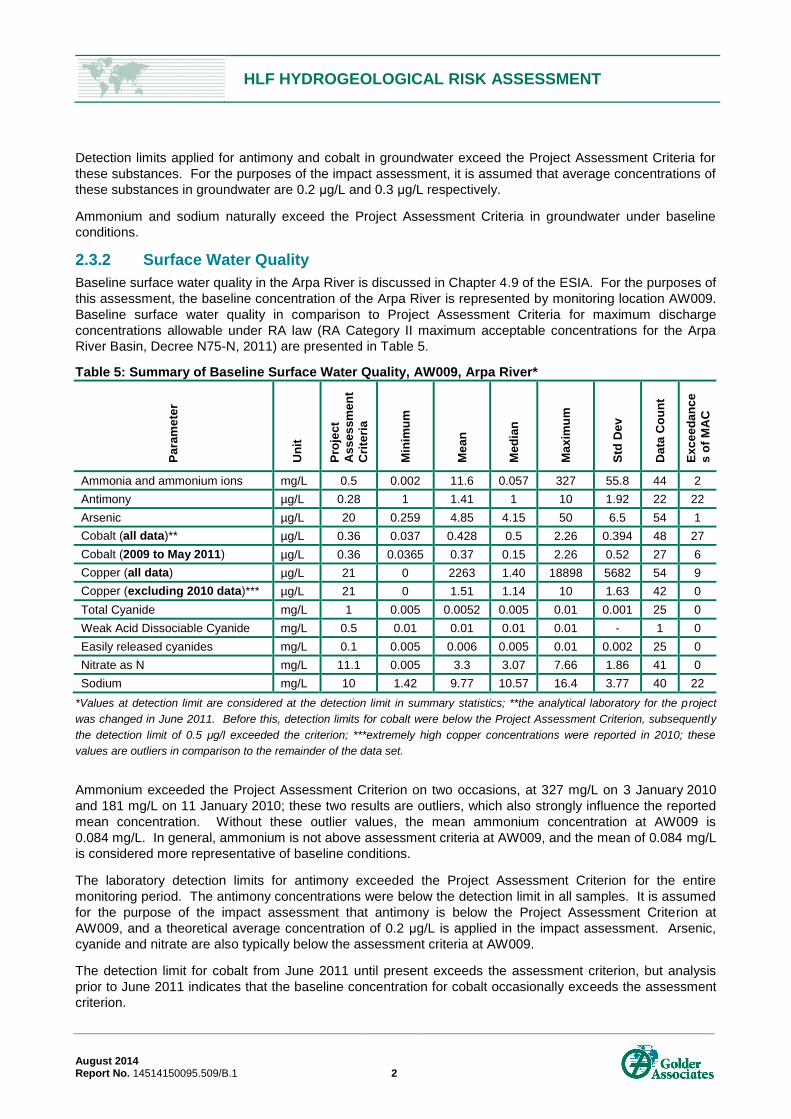
2.3.2 Surface Water Quality
Baseline surface water quality in the Arpa River is discussed in Chapter 4.9 of the ESIA. For the purposes of
this assessment, the baseline concentration of the Arpa River is represented by monitoring location AW009.
Baseline surface water quality in comparison to Project Assessment Criteria for maximum discharge
concentrations allowable under RA law (RA Category II maximum acceptable concentrations for the Arpa
River Basin, Decree N75-N, 2011) are presented in Table 5.
Table 5: Summary of Baseline Surface Water Quality, AW009, Arpa River*
Pa
ram
ete
r
Un
it
Pro
jec
t
Ass
es
sm
en
t
Cri
teri
a
Min
imu
m
Me
an
Me
dia
n
Ma
xim
um
Std
De
v
Data
Co
un
t
Ex
ce
ed
an
ce
s o
f M
AC
Ammonia and ammonium ions mg/L 0.5 0.002 11.6 0.057 327 55.8 44 2
Antimony µg/L 0.28 1 1.41 1 10 1.92 22 22
Arsenic µg/L 20 0.259 4.85 4.15 50 6.5 54 1
Cobalt (all data)** µg/L 0.36 0.037 0.428 0.5 2.26 0.394 48 27
Cobalt (2009 to May 2011) µg/L 0.36 0.0365 0.37 0.15 2.26 0.52 27 6
Copper (all data) µg/L 21 0 2263 1.40 18898 5682 54 9
Copper (excluding 2010 data)*** µg/L 21 0 1.51 1.14 10 1.63 42 0
Total Cyanide mg/L 1 0.005 0.0052 0.005 0.01 0.001 25 0
Weak Acid Dissociable Cyanide mg/L 0.5 0.01 0.01 0.01 0.01 - 1 0
Easily released cyanides mg/L 0.1 0.005 0.006 0.005 0.01 0.002 25 0
Nitrate as N mg/L 11.1 0.005 3.3 3.07 7.66 1.86 41 0
Sodium mg/L 10 1.42 9.77 10.57 16.4 3.77 40 22
*Values at detection limit are considered at the detection limit in summary statistics; **the analytical laboratory for the project
was changed in June 2011. Before this, detection limits for cobalt were below the Project Assessment Criterion, subsequently
the detection limit of 0.5 μg/l exceeded the criterion; ***extremely high copper concentrations were reported in 2010; these
values are outliers in comparison to the remainder of the data set.
Ammonium exceeded the Project Assessment Criterion on two occasions, at 327 mg/L on 3 January 2010
and 181 mg/L on 11 January 2010; these two results are outliers, which also strongly influence the reported
mean concentration. Without these outlier values, the mean ammonium concentration at AW009 is
0.084 mg/L. In general, ammonium is not above assessment criteria at AW009, and the mean of 0.084 mg/L
is considered more representative of baseline conditions.
The laboratory detection limits for antimony exceeded the Project Assessment Criterion for the entire
monitoring period. The antimony concentrations were below the detection limit in all samples. It is assumed
for the purpose of the impact assessment that antimony is below the Project Assessment Criterion at
AW009, and a theoretical average concentration of 0.2 μg/L is applied in the impact assessment. Arsenic,
cyanide and nitrate are also typically below the assessment criteria at AW009.
The detection limit for cobalt from June 2011 until present exceeds the assessment criterion, but analysis
prior to June 2011 indicates that the baseline concentration for cobalt occasionally exceeds the assessment
criterion.

HLF HYDROGEOLOGICAL RISK ASSESSMENT
August 2014 Report No. 14514150095.509/B.1 3
Copper is reported to have exceeded the assessment criterion on nine occasions. These occasions are nine
analyses undertaken in 2010 which reported total concentrations between 6,000 and 19,000 μg/L. The
cause of these elevated concentrations is unknown, but similar concentrations are not a feature of the
remaining dataset. Copper did not exceed the assessment criterion at AW009 in 2008, 2009, 2011, 2012 or
2013. Baseline concentration is therefore considered to be more appropriately represented by the mean of
the dataset excluding the 2010 analyses.
Sodium exceeded the Project Assessment Criterion at AW009 on approximately 50% of the monitoring
occasions. Baseline concentrations of sodium are considered to exceed the assessment criterion under
current conditions.
3.0 SOLUTE TRANSPORT MODELLING
3.1 Modelling Approach and Software Selection
GoldSim (GoldSim Technology Group, 2014) was used for the solute transport modelling. GoldSim is a
commercially available, graphical, object-oriented dynamic and stochastic modelling platform that is well
suited to stochastic simulations of time variant processes in complex water resources systems. GoldSim
considers uncertainty in input parameters and the development of the HLF over its life cycle. The model
utilises prebuilt analytical solution elements in the GoldSim solute transport module to simulate sorption,
advection, dispersion and biodegradation in the geosphere, migration pathways and mixing in flowing
systems. Editable elements within the software are used to calculate flows within the system, and these are
linked to the solute transport elements to dynamically simulate movement of water and solute mass within
the system.
The stochastic modelling approach allows consideration of variations in input parameters that arise either
through uncertainty (lack of knowledge) or through natural variation in the geological, hydrogeological or
hydrological setting of a site. It allows each parameter to be described by a statistical distribution
representing the range and likelihood of possible/probable input values. During a stochastic simulation each
input distribution is randomly sampled, and each parameter is assigned a value from within its defined range.
After a defined number of model iterations, multiple possible results are obtained and it becomes possible to
quantify the likelihood of occurrence of a given outcome. These outcomes are expressed as the percentiles
of the resulting distribution. The results are reported at the 95th percentile to be conservative. GoldSim
provides “best”, “most likely” and “worst” case outcomes and their probability of occurrence enabling risk
quantification.
3.2 GoldSim Model Structure
The GoldSim model has six structured “containers”:
Input Parameters contains all inputs used in the model;
Groundwater Flow calculates leakage rates and flow in the unsaturated and pathways;
SoluteTransport contains elements which simulate advection, dispersion, retardation and
biodegradation in each pathway and calculates the total constituent mass discharged to the receiving
watercourse(s); flows in the advective transport pathways are defined from the ‘Groundwater Flow’
container;
Arpa River Flow contains calculations of mixed concentrations in the Arpa River based on the
calculated total mass discharged from the deeper Lower Volcanics groundwater pathway;
Stream Discharge contains mixed concentration in the stream southwest of the HLF based on
calculated total mass discharged from the shallow (colluvium/upper bedrock) groundwater pathway; and
Results contains time history graphs of constituent concentrations in groundwater and surface water.

HLF HYDROGEOLOGICAL RISK ASSESSMENT
August 2014 Report No. 14514150095.509/B.1 4
Flows within the geosphere and groundwater system must be defined outside the solute transport element
net. These flows are calculated separately and used to define the flow rate in each pathway of the transport
model. Solute velocity in each pathway is then calculated based on the defined flow rate and
cross-sectional area of the pipe or groundwater pathway. Where pipe, groundwater and cell pathways are
directly linked, the mass entering and leaving the pathway is defined by the fluid transfer rate.
Pipe and groundwater pathway elements of the GoldSim solute transport model simulate partitioning,
advection and (if required) diffusive mass flux and biodegradation in a pathway of defined
cross-sectional area and length. These pathways are linked so that solute mass and water flows move
continuously between them. Cell pathways simulate partitioning, mixing and (if required) diffusive exchange
between volumes of water or rock in which water is freely circulating. These elements are combined in the
model to represent the liner and unsaturated zone pathways, mixing of leakage in groundwater underflow
beneath the Site, lateral migration of solutes in the groundwater pathway, and mixing follow discharge to the
Arpa River.
Example screenshots of the models are provided in Appendix A.
3.2.1 Flow Calculations
3.2.1.1 Calculation of Leakage Rates
Composite Liner
Leakage through the membrane liners underlying the heap and the PLS pond is a function of the head on
the liners, the connection between the liners and any underlying soil barrier, and the number and size of
defects in the membrane.
Leakage through the composite liner beneath the HLP is calculated using the method presented by Giroud
(1997). Defects are assumed to be circular, and leakage is calculated as:
Where q is leakage per defect (m3/s), Cd is a coefficient describing the contact between the membrane and
underlying strata, iav is the average vertical hydraulic gradient, h is the head of leachate on the defect (m), a
is the area of the defect (m2) and K is the hydraulic conductivity of the material directly underlying the
membrane (m/s). The contact coefficient has a value 0.21 (good contact) and 1.15 (poor contact)
(Giroud et al, 1997). Defect occurrence rates applied in the modelling are described in Section 3.3.
The average vertical hydraulic gradient is given by the equation:
(
)
Where ts is the thickness of the low permeability soil component of the composite liner. Simulation of
FML degradation is described below, the maximum leakage through the FML is limited to leakage through
the underlying low permeability soil liner calculated based on Darcy’s Law:
(
)
Where Q is leakage, h is head on the liner, t the liner thickness and A the basal area of the facility.
The leakage rate from the facility calculated by the methodology above is limited by the maximum (saturated)
permeability of the underlying unsaturated zone. Following the operational period, the leakage rate is limited
by the estimated recharge to the reclaimed facility.
Modelled liquid depths on the basal liner are based on calculated maximum heads under known or estimated
infiltration rates during each phase of the life cycle. The head on the liner will be governed by the infiltration
rate, pipe spacing, drainage blanket permeability and angle of slope on the base of the facility. The
maximum head on the base above the elevation of the base of the drains can be approximated (neglecting
the basal slope) using the Dupuit Equation (described below).

HLF HYDROGEOLOGICAL RISK ASSESSMENT
August 2014 Report No. 14514150095.509/B.1 5
During the operational period the proposed solution application rate is 10 L/hr/m2 over a 110 day leaching
cycle comprising an active period of 55 days and a recirculation for a subsequent 55 days (GRE, 2014a).
Assumptions regarding the post leaching and post closure infiltration rates are described in Section 2.1.
Given the 7 m drain spacing and assuming a minimum permeability of the drainage media (allowing for
clogging during operation) of 10-3
m/s, head on the base during operation could approach the 0.2 m design
depth at its maximum point. Head will increase with distance from the drainage pipes; the maximum head
will occur at the point between the two drainage pipes. The average head in the active area is assumed to
be 0.1 m, half of the maximum head.
The head of in each phase of the HLF is therefore modelled throughout the lifecycle as follows:
A head of 0.1 m is applied in the active area during the leaching phase;
In areas which are inactive but have not been restored, a calculated head of 0.04 m has been applied;
and
During the period following closure, a maximum head of 0.01 m is applied, up to a maximum
infiltration/leakage of 10 mm/yr.
No limitation on leakage based on liquid supply is present in the model for the active and open phase
leakage calculations, primarily because predicted leakage rates are significantly lower than liquid supply
(leaching) rates, rendering such a limitation unnecessary. Leakage is limited to liquid supply (infiltration)
during the post-closure phase.
The assessment of leakage from the HLF on this basis is considered conservative as the assessment
considers active operation of the entirety of each phase in turn.
Double Liner (Membrane and Composite)
Where a double membrane and composite liner is present, the upper membrane liner is underlain by a
permeable material, such that the equation described above for flow through defects does not apply. In this
case, assuming that there is no limit on liquid supplied to the defect and head above the defect is known
(both considered to be valid in the case of the collection ponds) leakage is calculated using the Bernoulli
equation (as proposed in Giroud and Bonaparte (1989) and Giroud et al (1997)):
√
Where g is acceleration due to gravity and other variables are as previously described. It is noted that this
equation works well when leakage rates are relatively small in relation to the capacity of the underlying
material to transmit flow. The equation is not valid at late time where defect sizes are large as a result of
liner decomposition and calculated leakages exceed both the liquid supply and the ability of the underlying
permeable membrane to transmit water. Limitations on the calculated leakage rate which control the
application of this equation are discussed further below.
Leakage passing through the upper membrane liner enters the intermediate drainage layer (leak detection
system) and flows to the sump located in the corner of the ponds (PLS pond and Storm Pond 1), from where
it is pumped out. The head within the intermediate drainage layer has been estimated in the GoldSim model
as follows:
1) The HLF design (Golder, 2011) indicates that the drainage medium will be a geocomposite drainage
layer; the properties of ABG Geosynthetics Finesse Deckdrain 600 (ABG Geosynthetics, undated) have
been used to represent the behaviour of this layer in the model. The permeability of the drainage layer
has been calculated based on specifications for the in-plane water flow of the material under a hydraulic
gradient of between 0.1 and 1 at a pressure of 100 KPa (equal to 10 m of water).
2) The head within the drainage layer as a result of the leakage through the overlying membrane is
approximated using the Dupuit equation (e.g. Fetter, 2001), describing discharge per unit width
between two fixed heads located at an origin, O, and a distance, L from the origin:

HLF HYDROGEOLOGICAL RISK ASSESSMENT
August 2014 Report No. 14514150095.509/B.1 6
(
)
Where K is permeability of the material in which flow occurs (m/s), h is the liquid head (m) and L is the
separation of the two points. In the case under consideration, the distance L is taken as the longest
flowpath across the base of the collection pond, and the problem is simplified to a two dimensional
problem with flow parallel to the longest flowpath. In order to approximate the discharge per unit width,
the total leakage is converted to an equivalent recharge rate (w) and multiplied by the flow path length,
L. The equation can then be rearranged as:
√
√
In this case, the head at the origin can be taken as zero (the purpose of the calculation is to find the
difference in head), further simplifying this equation. This calculation neglects the effect on any basal
slope on head on the liner.
3) Under conditions where the drainage layer between the two membrane liners is saturated, the head
acting on the lower liner is in continuity with the overlying pond. In this case, the head considered in
leakage calculations should be the depth of the pond (plus the drainage layer thickness). Where the
drainage layer is unsaturated, the head on the lower liner is equal to the head within the drainage layer.
It is conservatively assumed for the purpose of the leakage calculations that where the maximum head
calculated above exceeds the drainage layer thickness, the drainage layer is saturated. Leakage
through the lower liner is calculated using the Giroud (1997) equations described above.
The maximum leakage rate through the double liner is limited to the permeability of both the underlying clay
liner and underlying unsaturated zone as described above with regard to the composite liner. Leakage is not
explicitly limited to liquid supply in the model because this is only relevant during the operational period,
during which the membrane is performing well and leakage rates are low. In late time, when the liner has
potentially degraded, leakage rates are limited to infiltration.
Defect Occurrence and Performance
FMLs comprising the composite and double liners beneath the ore heap and collection ponds are assumed
to be present and perform as follows:
It is assumed that the FML is constructed with an industry-standard QA/QC testing program and there
are few defects. It is assumed that defects are formed gradually (linear increase) as a result of damage
during construction and operation, such that at the end of operation the number of defects is equivalent
to the ‘Stage 2’ values indicated in England and Wales Environment Agency (2004);
The number of defects is then considered to remain constant until the onset of oxidation of the FML
(formation of stress cracks is neglected); and
After the onset of oxidation the area of the holes is considered to double on a half-life basis until the
membrane no longer inhibits leakage (leakage is controlled by the underlying clay liner).
Predicted leakage rates are sensitive to the defect occurrence rate. It has been assumed for the purposes of
the impact assessment that an ‘excellent’ construction quality assurance (CQA) standard will be achieved in
construction of the facility. ‘Excellent’ CQA is defined in Environment Agency (2004) as follows:
“The geomembrane material meets the requirements of the Geosynthetic Research Institute (GRI)
GM13 specification with the added criterion that the stress crack failure time should be well in excess of
the 300 hours currently specified in GRI GM13;
The oxidative induction time value and oven ageing procedure should meet the GRI GM13 and BAM
certification requirements;

HLF HYDROGEOLOGICAL RISK ASSESSMENT
August 2014 Report No. 14514150095.509/B.1 7
The design has been subjected to independent design quality assurance;
Mineral geomembrane protection is provided;
Installation of the liner system by installers certificated under the British Geomembrane Association [or
equivalent] scheme together with experienced CQA [construction quality assurance] supervision until
the first layer of waste [ore] has been placed; and
A fixed electric leak location system is installed and monitored quarterly (or more frequently) until the
completion of waste disposal.”
Other studies (e.g. Forget et al, 2005) indicate that the best standards of modern CQA in North America,
inclusive of an electric leak location survey performed after placement of the over-liner drain gravel
component in the leach pad, achieve defect rates in the ‘excellent’ range described by Environment Agency
(2004) without installation of a fixed leak detection system (required by the definition of the ‘excellent’
standard). The assessment assumes that Lydian will meet apply best practice CQA and will complete an
electrical leak detection survey after placement of the over-liner drainage layer prior to operation.
3.2.1.2 Unsaturated Zone Flow
In the pathway representing bulk flow within the unsaturated zone, flow is modelled based on plug flow
(displacement of water downward under gravity based on the leakage rate with no change in saturation).
This is considered conservative on the basis that if wetting of the unsaturated zone occurs, travel times will
be slower than simulated based on unsaturated conditions.
The area of the unsaturated zone in which flow is occurring beneath the membrane liner is calculated using
wetted area equations based on the method presented in Giroud and Badu-Tweneboah (1992).
3.2.1.3 Groundwater Flow
Flow in the groundwater pathway is calculated using Darcy’s Law. Hydraulic gradients in each pathway and
scenario are calculated based on groundwater elevations from the groundwater flow model along the flow
pathlines indicated in Section 2.2.
3.2.2 Solute Transport
3.2.2.1 Source
It is assumed that the source term remains constant within the ore heap and collection ponds during
operation. It is assumed that the source associated with the collection ponds ceases to exist at the end of
leaching operations. Attenuation of the source term during the detoxification period (including attenuation of
cyanide to environmentally acceptable concentrations) is represented as a linear change from the
operational to the end of detoxification concentrations during this period.
It is assumed that ammoniacal nitrogen and nitrate are leached from the heap during the five year post
closure monitoring (managed closure) period, and that at the end of this time concentrations of ammoniacal
nitrogen and nitrate in the heap are negligible (less than 0.5 mg/l).
It is conservatively assumed that, for species other than ammoniacal nitrogen and nitrate, the source term
within the heap leach will decline from the final detoxification concentration as a result of attenuation due to
ongoing leaching into infiltrating precipitation in the reclaimed facility during closure. The source term
decline is simulated as a function of time and solid to liquid ratio as follows (England and Wales Environment
Agency, 2003b):
and

HLF HYDROGEOLOGICAL RISK ASSESSMENT
August 2014 Report No. 14514150095.509/B.1 8
Where Ct is concentration at time t, C0 is initial concentration, i is infiltration, Wthickness is waste (ore) thickness
(m), Wfc is water field capacity. This model is used for all constituents within the heap leach source except
nitrate and ammonium. Nitrate and ammonium do not (predominantly) derive from the ore solids, but are a
primarily a product cyanide breakdown. Once the cyanide is no longer provided during operations, the
concentrations of these parameters within the source is expected to rapidly decline. The model assumes
ammonium and nitrate in the heap leach source attenuate to zero within ten years of reclamation.
3.2.2.2 Pathways
The solute transport pathways are represented in the model using three elements:
Pipe pathways: for short pathways where constituent mass is transported within a fixed volume based
on a known flow rate, travel time is calculated based on pathway dimensions, flow rate and partition
coefficients defined between the solid and liquid in the pathway;
Groundwater pathways: behave similarly to pipe pathways but are discretized into a number of units to
provide additional resolution; and
Cell pathways: Cell pathways are typically used to describe partitioning (e.g. between air, one or more
liquid phase and one or more solid phases) within a uniformly mixed volume and may be used to
describe diffusive and advective fluxes between defined volumes. In this model, cell pathways are used
only to mix one of more incoming sources of clean or process-influenced water for onward transport.
The liner and unsaturated zone are simulated as pipe and groundwater pathways respectively, carrying
mass discharged from the four source areas to the saturated zone. Leakage and unsaturated zone
migration from the ponds and pad in each phase are calculated separately, but the sources are combined
into a single flow pathway from each phase in the saturated zone.
In the saturated zone, mixing is simulated in the groundwater pathway beneath the upgradient Phase 3
within a defined mixing zone thickness using cell pathway, liquid and mass flows from both unsaturated zone
pathways are combined with the upgradient groundwater flow to calculate an average concentration in the
mixing zone.
Phases 1 and 2 are located downgradient of Phase 3 in both scenarios. Water and mass flowing under
Phase 3 then enters the modelled pathway beneath Phase 2 where any discharges from Phase 2 are added.
The combined flow then enters the pathway under Phase 1. During the period when Phases 2 and 3 are not
operational, there are no additional discharges from these phases and flow in the Phase 2 and Phase 3
pathways is equal to just the upgradient groundwater flow.
Transport in each hydrogeological unit with the unsaturated zone and groundwater pathways beneath each
source (Phases 1, 2 and 3, and the collection ponds) is simulated by the GoldSim aquifer pathway elements,
linked in series. Further groundwater pathway elements represent transport from the downgradient
boundary of the facility to the point of discharge to surface water.
3.2.2.3 Receptors
Scenario 1
In the Arpa River, the surface water concentration is calculated based on the upgradient surface water flow
and the groundwater discharge mass. The model results represent the increase in constituent concentration
as a result of the HLF. Actual maximum concentrations are calculated externally to the GoldSim model
based on mean baseline concentrations.
Under current conditions, flow in the surface water drainage within the HLF footprint is ephemeral at the
downstream monitoring location. The model therefore reports the concentration in groundwater at the point
of discharge to this channel estimated to be 260 m southwest of Storm Pond 2 assuming no additional
surface water flow enters the stream channel.

HLF HYDROGEOLOGICAL RISK ASSESSMENT
August 2014 Report No. 14514150095.509/B.1 9
Scenario 2
This pathway assumes that groundwater in the shallow groundwater merges with the deeper groundwater
flow system southwest of the site and that all groundwater discharges to the Arpa River without any local
discharge to surface water southwest of the HLF footprint. Water quality in the Arpa River has also been
assessed assuming that the mass in both the shallow and deeper modelled groundwater pathways
discharges to the Arpa River.
3.3 Model Input Parameters
Model input parameters and justifications are provided in Appendix B.
3.4 Results
The model simulation was run for a period of 1,000 years, 501 realisations were completed. The calculated
change in concentrations of constituents of potential concern in groundwater at the point of discharge to
surface water courses are reported, and the resultant impact on surface water quality is assessed.
3.4.1 HLF Leakage Quantities
3.4.1.1 Leakage from HLF Area Overlying the Shallow Groundwater
The modelled leakage rate from the facility to the shallow groundwater is illustrated in Figure 3. Leakage
from the HLP is small during operations and reduces significantly at 15 years at the end of the managed
closure period. The median post closure leakage rate is between 0.012 L/s at closure to 0.013 L/s at
1,000 years.
Figure 3: Modelled Leakage Rate from HLF to Shallow Groundwater, Operations and Post-Closure
Upgradient groundwater flow (underflow) in the shallow groundwater is calculated based on the estimated
width of the aquifer, the observed hydraulic gradient and an assumed saturated thickness of 5 m. This yields
a mean underflow of 2.8 m3/day (0.03 L/s), with an uncertainty ranging between a 5
th percentile of 1.2 m
3/day

HLF HYDROGEOLOGICAL RISK ASSESSMENT
August 2014 Report No. 14514150095.509/B.1 10
and 95th percentile of 5.9 m
3/day. It is assumed that the entire leakage and underflow volume potentially
discharges to the stream. The total assumed discharge to the HLF valley stream is shown in Table 6.
Table 6: Shallow Groundwater Discharge to HLF Valley Stream
Percentile Peak Operational Flow (L/s) Post Closure Flow (L/s)
5%ile 0.023 0.021
50%ile 0.097 0.039
95%ile 0.248 0.082
3.4.1.2 Leakage from HLF Area Overlying the Deeper Groundwater
The modelled leakage rate from the facility to the deeper groundwater is illustrated in Figure 4. Leakage
from the HLP is very small and reduces significantly at ten years (at the end of the operation). Leakage to
deep groundwater is lower during operation of Phase 2 is only slightly greater than Phase 1, this is a function
of the area of Phase 2 which overlies the deep aquifer. The median post closure leakage rate is from
0.0009 L/s to 0.0015 L/s.
Figure 4: Modelled Leakage Rate from HLF to Deep Groundwater, Operations and Post-Closure
Upgradient groundwater flow (underflow) in the deeper groundwater system into which leakage from the site
is mixed before reaching the Arpa River is calculated based on the width of the site perpendicular to
groundwater flow, the observed hydraulic gradient and a mixing zone thickness of 30 m (based on a vertical
dispersivity of 1% of the pathway length). This yields a mean underflow at the maximum facility extent
(Phases 1 to 3) of 430 m3/day (5
th percentile of 185 m
3/day (2.1 L/s), 95
th percentile of 1,680 m
3/day
(19.4 L/s)).
Groundwater is assumed to discharge to the Arpa River over a 1,040 m discharge zone, the width of the
facility perpendicular to groundwater flow.

HLF HYDROGEOLOGICAL RISK ASSESSMENT
August 2014 Report No. 14514150095.509/B.1 11
3.4.2 Quality of Groundwater Discharging to Surface Water
Groundwater is not used as a drinking water resource in the vicinity of the HLF, and there is no groundwater
use between the HLF and the discharge to surface water at the Arpa River. Groundwater as a source of
supply is therefore not considered to be a receptor in the context of this assessment. Groundwater
discharging to surface water (baseflow) is considered to be a receptor in the context of impact assessment.
The calculated change in groundwater concentrations in groundwater in the deeper Lower Volcanics, and in
shallow groundwater in the colluvium and upper bedrock is presented Tables 7 and 8. Results are reported
to a precision at which the calculated model results are replicable at 501 iterations. The 50th percentile value
is considered the ‘most likely’ outcome, whilst the 95%ile concentration is the conservative estimate of the
possible maximum impact.
Table 7: Modelled Maximum Change in Concentration in Deep Groundwater at Point of Discharge to the Arpa River*
Constituent 50%ile Peak Concentration (mg/l)
Time to Peak Concentration (years)
95%ile Peak Concentration (mg/)
Time to Peak Concentration (years)
Arsenic <1x10⁻¹⁰
1,000 5.6x10⁻⁶
1,000
Copper N/A >1,000 N/A >1,000
Cobalt N/A >1,000 N/A >1,000
Antimony N/A >1,000 <1x10⁻¹⁰
1,000
Sodium 0.015 59 0.064 81
WAD Cyanide N/A >1,000 <1x10⁻¹⁰
840
NH3+NH4 as N <1x10⁻¹⁰
780 <1x10⁻¹⁰
384
Nitrate as N 0.018 41 0.11 33
*N/A – not applicable, constituent did not arrive at receptor inside the simulation period. >1,000 – travel time to the receptor for
the contaminant is more than 1,000 years.
Positive values indicate an increase in concentration above existing conditions
As described in Section 3.4.1.2, the groundwater mixing zone for the discharge from the HLF to the deeper
groundwater is assumed to be an area 1,040 m long (the width of the facility perpendicular to groundwater
flow) and 30 m deep. In closure, the contribution of groundwater underflow to discharge in this zone is
estimated to be between 2.1 L/s and 19.4 L/s, whilst the contribution of leakage to discharge in this zone is
between 0.0002 L/s and 0.002 L/s, giving a total discharge at the concentrations in Table 7 between 2.1 L/s
and 19.4 L/s.
Table 8: Modelled Maximum Change in Concentrations in Shallow Groundwater at Point of Discharge to Stream*
Constituent 50%ile Peak Concentration (mg/l)
Time to Peak Concentration (years)
95%ile Peak Concentration (mg/)
Time to Peak (years)
Arsenic <1x10⁻¹⁰
1000 0.006 960
Copper N/A >1000 N/A >1000
Cobalt <1x10⁻¹⁰
1000 <1x10⁻¹⁰
1000
Antimony <1x10⁻¹⁰
1000 <1x10⁻¹⁰
1000
Sodium 80.5 20 168 15
WAD Cyanide <1x10⁻¹⁰
1000 9.30x10⁻⁵
960
NH3+NH4 as N 2.10x10⁻⁴
1000 0.57 470
Nitrate as N 152 28 319 14.9
*N/A – not applicable, contaminant did not arrive at receptor inside the simulation period. >1000 – travel time to the receptor for
the contaminant is more than 1000 years.
As described in Section 3.4.1.1, the predicted discharge to the HLF valley stream is between 0.02 L/s and
0.24 L/s in operation and 0.02 L/s and 0.08 L/s in closure. The peak concentrations above occur in closure.
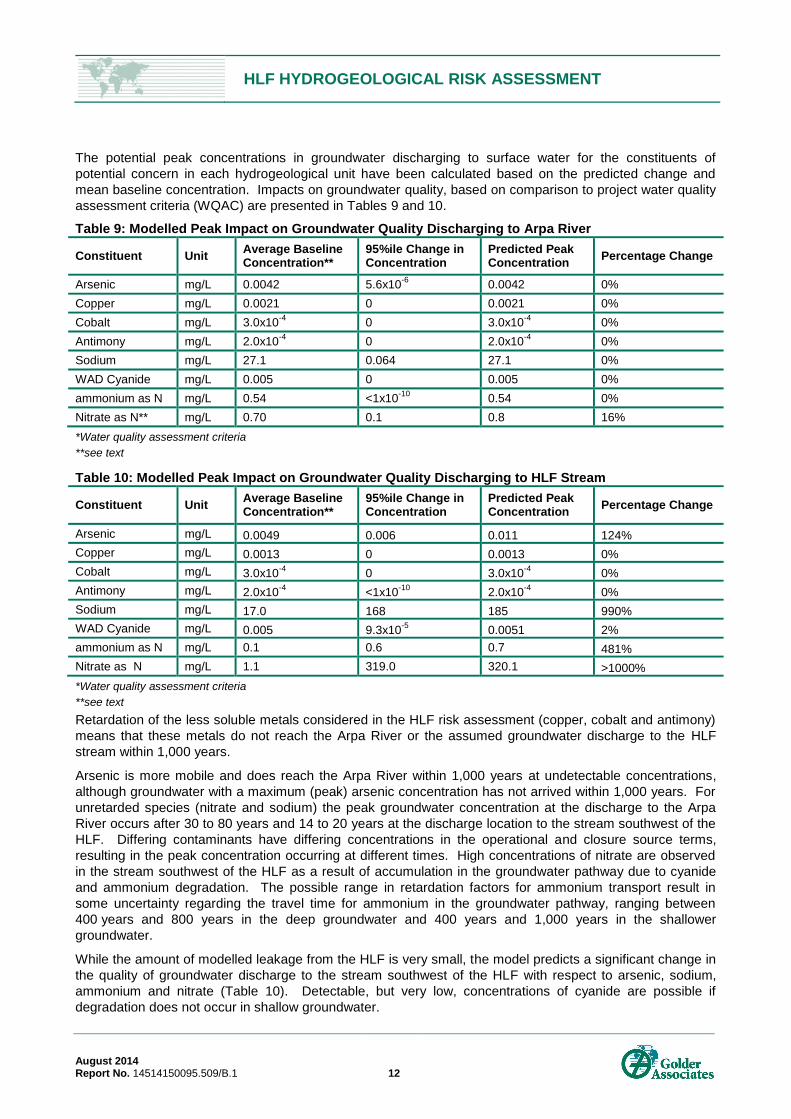
HLF HYDROGEOLOGICAL RISK ASSESSMENT
August 2014 Report No. 14514150095.509/B.1 12
The potential peak concentrations in groundwater discharging to surface water for the constituents of
potential concern in each hydrogeological unit have been calculated based on the predicted change and
mean baseline concentration. Impacts on groundwater quality, based on comparison to project water quality
assessment criteria (WQAC) are presented in Tables 9 and 10.
Table 9: Modelled Peak Impact on Groundwater Quality Discharging to Arpa River
Constituent Unit Average Baseline Concentration**
95%ile Change in Concentration
Predicted Peak Concentration
Percentage Change
Arsenic mg/L 0.0042 5.6x10⁻⁶
0.0042 0%
Copper mg/L 0.0021 0 0.0021 0%
Cobalt mg/L 3.0x10⁻⁴
0 3.0x10⁻⁴
0%
Antimony mg/L 2.0x10⁻⁴
0 2.0x10⁻⁴
0%
Sodium mg/L 27.1 0.064 27.1 0%
WAD Cyanide mg/L 0.005 0 0.005 0%
ammonium as N mg/L 0.54 <1x10⁻¹⁰
0.54 0%
Nitrate as N** mg/L 0.70 0.1 0.8 16%
*Water quality assessment criteria
**see text
Table 10: Modelled Peak Impact on Groundwater Quality Discharging to HLF Stream
Constituent Unit Average Baseline Concentration**
95%ile Change in Concentration
Predicted Peak Concentration
Percentage Change
Arsenic mg/L 0.0049 0.006 0.011 124%
Copper mg/L 0.0013 0 0.0013 0%
Cobalt mg/L 3.0x10⁻⁴
0 3.0x10⁻⁴
0%
Antimony mg/L 2.0x10⁻⁴
<1x10⁻¹⁰
2.0x10⁻⁴
0%
Sodium mg/L 17.0 168 185 990%
WAD Cyanide mg/L 0.005 9.3x10⁻⁵
0.0051 2%
ammonium as N mg/L 0.1 0.6 0.7 481%
Nitrate as N mg/L 1.1 319.0 320.1 >1000%
*Water quality assessment criteria
**see text
Retardation of the less soluble metals considered in the HLF risk assessment (copper, cobalt and antimony)
means that these metals do not reach the Arpa River or the assumed groundwater discharge to the HLF
stream within 1,000 years.
Arsenic is more mobile and does reach the Arpa River within 1,000 years at undetectable concentrations,
although groundwater with a maximum (peak) arsenic concentration has not arrived within 1,000 years. For
unretarded species (nitrate and sodium) the peak groundwater concentration at the discharge to the Arpa
River occurs after 30 to 80 years and 14 to 20 years at the discharge location to the stream southwest of the
HLF. Differing contaminants have differing concentrations in the operational and closure source terms,
resulting in the peak concentration occurring at different times. High concentrations of nitrate are observed
in the stream southwest of the HLF as a result of accumulation in the groundwater pathway due to cyanide
and ammonium degradation. The possible range in retardation factors for ammonium transport result in
some uncertainty regarding the travel time for ammonium in the groundwater pathway, ranging between
400 years and 800 years in the deep groundwater and 400 years and 1,000 years in the shallower
groundwater.
While the amount of modelled leakage from the HLF is very small, the model predicts a significant change in
the quality of groundwater discharge to the stream southwest of the HLF with respect to arsenic, sodium,
ammonium and nitrate (Table 10). Detectable, but very low, concentrations of cyanide are possible if
degradation does not occur in shallow groundwater.

HLF HYDROGEOLOGICAL RISK ASSESSMENT
August 2014 Report No. 14514150095.509/B.1 13
3.4.3 Surface Water Quality Impacts
3.4.3.1 Arpa River, Scenario 1
In this scenario, a proportion of the constituent mass from the HLF discharges to surface water in the stream
southwest of the HLF, where it is captured before discharge to the Arpa River.
The calculated peak increase in concentrations above baseline quality in surface water following mixing
under low flow conditions and times to peak concentration in each scenario are presented in Table 11.
Results are reported to an accuracy at which the model results are replicable at 501 iterations. However, the
range of likely concentrations in surface water based on the calculations undertaken is indicated by the two
values (50th percentile and 95
th percentile) presented.
Table 11: Modelled Peak Water Quality Change in the Arpa River
Constituent 50%ile Peak Concentration (mg/l)
Time to Peak (years) 95%ile Peak Concentration (mg/)
Time to Peak (years)
Arsenic <1x10⁻¹⁰
1000 <1x10⁻¹⁰
1000
Copper N/A >1000 N/A >1000
Cobalt N/A >1000 N/A >1000
Antimony N/A >1000 <1x10⁻¹⁰
1000
Sodium 4.26x10⁻⁵
53 0.00019 28
WAD Cyanide N/A >1000 <1x10⁻¹⁰
960
NH3+NH4 as N <1x10⁻¹⁰
780 <1x10⁻¹⁰
216
Nitrate as N 5.45x10⁻⁵
35 0.0004 28
*N/A – not applicable, contaminant did not arrive at receptor inside the simulation period. >1,000 – travel time to the receptor for
the contaminant is more than 1,000 years.
The potential peak concentrations of the constituents of potential concern in the Arpa River have been
estimated based mean concentrations in AW009 and calculated 95th percentile peak concentrations in the
water course is indicated in Table 12.
Table 12: Modelled 95th
Percentile Water Quality Impacts to the Arpa River
Parameter Unit WQAC Average Baseline Conc’n*
95%ile Change in Conc’n
Predicted Peak Conc’n
Above WQAC?
Above WQAC in Baseline?
Percentage Change
Arsenic mg/L 0.02 0.0049 <1x10⁻¹⁰
0.0049 No No 0.0%
Copper mg/L 0.021 0.0015 0 0.0015 No No 0.0%
Cobalt mg/L 3.6x10⁻⁴
3.7x10⁻⁴
0 3.7x10⁻⁴
Yes Yes 0.0%
Antimony mg/L 2.8x10⁻⁴
2.0x10⁻⁴
0 2.0x10⁻⁴
No No 0.0%
Sodium mg/L 10 9.77 1.9x10⁻⁴
9.77 No No 0.0%
WAD Cyanide mg/L 1 0.0060 0 0.0060 No No 0.0%
Ammonium as N mg/L 0.4 0.065 <1x10⁻¹⁰
0.065 No No 0.0%
Nitrates as N mg/L 2.5 0.75 3.6x10⁻⁴
0.75 No No 0.0%
*see text
A positive value is an increase in concentration
The modelling indicates that assuming a portion of the leakage from the HLF reaches the stream southwest
of the facility, there is a 95% probability that no measurable change in water quality in the Arpa River will
occur.

HLF HYDROGEOLOGICAL RISK ASSESSMENT
August 2014 Report No. 14514150095.509/B.1 14
3.4.3.2 Arpa River, Scenario 2
In this scenario, all of the constituent mass released from the HLF to the shallow and deep groundwater
pathways enters the Arpa River.
Predicted change concentrations over time in the Arpa River are presented graphically in Appendix C.
The calculated peak increase in concentrations above baseline quality in surface water following mixing
under low flow conditions and times to peak concentration in each scenario are presented in Table 13.
Table 13: Modelled Peak Water Quality Change in the Arpa River
Parameter 50%ile Peak Concentration (mg/l)
Time to Peak (years)
95%ile Peak Concentration (mg/)
Time to Peak (years)
Arsenic <1x10⁻¹⁰
1000 1.2x10⁻⁷
1000
Copper N/A >1000 N/A >1000
Cobalt N/A >1000 <1x10⁻¹⁰
1000
Antimony <1x10⁻¹⁰
1000 <1x10⁻¹⁰
1000
Sodium 0.0033 15 0.013 15
WAD Cyanide <1x10⁻¹⁰
1000 1.6x10⁻⁹
780
NH3+NH4 as N 4.4x10⁻⁹
1000 9.5x10⁻⁶
450
Nitrate as N 0.006 17 0.026 14.6
*N/A – not applicable, contaminant did not arrive at receptor inside the simulation period. >1,000 – travel time to the receptor for
the contaminant is more than 1,000 years.
A positive value is an increase in concentration.
The potential peak concentrations of the constituents of potential concern in the Arpa River have been
estimated based in mean concentrations in AW009 and calculated 95th percentile peak concentrations in the
water courses indicated in Table 14.
Table 14: Modelled 95th Percentile Water Quality Impacts to the Arpa River
Parameter Unit WQAC Average Baseline Conc’n*
95%ile Change in Conc’n
Predicted Peak Conc’n
Above WQAC?
Above WQAC in Baseline?
Percent-age Change
Arsenic mg/L 0.02 0.0049 1.2x10⁻⁷
0.0049 No No 0.0%
Copper mg/L 0.021 0.0015 0 0.0015 No No 0.0%
Cobalt mg/L 3.6x10⁻⁴
3.7x10⁻⁴
0 3.7x10⁻⁴
Yes Yes 0.0%
Antimony mg/L 2.8x10⁻⁴
2.0x10⁻⁴
0 2.0x10⁻⁴
No No 0.0%
Sodium mg/L 10 9.77 0.013 9.78 No No 0.1%
WAD Cyanide mg/L 0.5 0.0060 2x10⁻⁹
0.006 No No 0.0%
ammonium as N mg/L 0.4 0.065 9.5x10⁻⁶
0.065 No No 0.0%
Nitrates as N mg/L 2.5 0.75 0.03 0.77 No No 3.4%
*see text
The modelling indicates there is a 95% probability that the remaining discharge to surface water quality in
the Arpa River with no measurable change in surface water quality. All of the modelled constituents that are
below surface water MACs under baseline conditions remain so over the 1,000 year simulation period.
Minor changes in concentrations of sodium and nitrate are predicted, but it is unlikely that these changes
would be statistically measureable against natural fluctuations. Cobalt exceeds surface water MACs under
baseline conditions; no change in cobalt concentration is predicted in surface water.

HLF HYDROGEOLOGICAL RISK ASSESSMENT
August 2014 Report No. 14514150095.509/B.1 15
3.4.3.3 HLF Valley Stream
Observations indicate that there is not a continuous flow in the surface water channel at the southwestern
perimeter of the HLF site, such that under low flow conditions, no additional surface water mixing will occur
for groundwater potentially discharging to this channel downstream of the site. Groundwater quality
presented in Tables 8 and 10 therefore also represents potential concentrations in the stream channel in the
absence of mitigation measures that are currently planned.
Predicted concentrations over time in groundwater discharging to the HLF stream are presented graphically
in Appendix C.
As described in Table 6, the discharge to the stream downgradient of the HLF is predicted to be between
0.02 L/s and 0.24 L/s in operation and between 0.02 L/s and 0.08 L/s in closure. In general, groundwater
discharge concentration will be inversely correlated to flow, such that it is reasonable to apply the 50th
percentile predicted concentration to the median flow rate, and the 95th percentile predicted concentration to
the 5th percentile flow rate.
The quantity of water potentially discharged to the HLF valley stream is of relatively high concentration with
respect to certain parameters, but very low in volume. The occurrence of groundwater discharge in this area
has not been confirmed and may or may not occur; in the event that it does not, discharge in groundwater
has been demonstrated to pose a negligible risk to the Arpa River. Furthermore, other physical and
geochemical processes in the unsaturated zone which are not evaluated in the modelling may also reduce
constituent concentrations in any leakage from the facility to surface water.
Due to the potential risk identified to shallow groundwater/surface water in the HLF drainage, the final design
for the HLF will evaluate in more detail some of the uncertain physical/chemical processes such as
unsaturated flow and vapor transport which will influence solute transport. Leakage and solute transport
concentration predictions will be updated. The monitoring program for the facility (locations, frequency,
parameters and types of monitoring) will be updated following further more detailed design based on the
revised understanding of the potential leakage pathways and concentrations.
During operations, monitoring of the stream flow and quality will allow any leakage impacts to be identified.
If leakage is detected and modifications to the HLF operations do not result in quality improvements, then
other industry-accepted seepage mitigation measures would be implemented to prevent off-site migration of
shallow groundwater. The form of these measures, if required, will be dependent on the site hydrogeological
conditions, HLF operational and water balance conditions, groundwater quality trends and concentrations.
In closure, during periods of low flow when little dilution is available, high evaporation rates will potentially
prevent any discharge to the Arpa River from the small quantities of flow predicted for the HLF stream.
During periods of higher flow, non-contact water discharged from the HLF detention pond will provide mixing
in the stream and concentrations at the point of discharge to the Arpa River will be much lower than those
predicted in discharging groundwater.
3.5 Sensitivity Analysis
The parameters with highest sensitivity in the GoldSim model are entered as stochastic parameters with
ranges based on their possible values. Results are assessed at the 95th percentile. For this reason, the
results incorporate an assessment of the sensitivity of the model to key parameters such as source term
concentration, hydraulic conductivity, retardation factors and biodegradation rates. In addition the
assessment has considered uncertainty regarding groundwater flow direction beneath the Site. For this
reason no further sensitivity analysis is considered necessary to have confidence in the model outcome.
4.0 CONCLUSIONS
An assessment has been undertaken of potential impacts on the Arpa River and water in the stream
southwest of the HLF as a result of the potential leakage from the proposed HLF. Two scenarios were
considered:

HLF HYDROGEOLOGICAL RISK ASSESSMENT
August 2014 Report No. 14514150095.509/B.1 16
Scenario 1: Shallow groundwater discharges to the local surface water drainage approximately 260 m
southwest of Storm Pond 2. No additional permanent flow occurs in the stream southwest of the HLF
footprint, such that under low-flow conditions there may be no available mixing in this water course.
Mass released to local surface water is captured and does not enter the Arpa River; and
Scenario 2: Shallow groundwater does not locally discharge to surface water, and all leakage from the
facility may discharge to the Arpa River as a diffuse groundwater discharge to the west and southwest
of the site.
Based on the 95th percentile concentrations calculated by the solute transport model, it is concluded that:
No measureable change in surface water quality within the Arpa River will occur in the event that all of
the leakage from the facility reaches the Arpa River via the groundwater pathways;
A slight change (up to 0.1 mg N/L) in the quality of baseflow to the Arpa River could potentially occur as
a result of leakage from the HLF with respect to nitrate within 30 to 40 years of the start of operations,
although the concentration in groundwater at discharge to the river would remain below surface water
quality standards;
A significant change in the quality of groundwater discharge to the stream southwest of the HLF with
respect to arsenic, sodium, ammonium and nitrate may potentially occur within 15 to 30 years of the
start of operations. Detectable, but very low, concentrations of cyanide are possible if degradation does
not occur in the unsaturated zone or shallow groundwater; and
Due to the limited or ephemeral flow in the stream southwest of the HLF, any groundwater affected by
leakage from the HLF that discharges to surface water during autumn or winter months may directly
mirror groundwater concentrations, with high nitrate concentrations and high sodium and ammonium
concentrations.
The quantity of water potentially discharged to the HLF valley stream is of relatively high concentration with
respect to certain parameters, but very low in volume. The occurrence of groundwater discharge in this area
has not been confirmed and may or may not occur; in the event that it does not, discharge in groundwater
has been demonstrated to pose a negligible risk to the Arpa River. Furthermore, other physical and
geochemical processes in the unsaturated zone which are not evaluated in the modelling presented may
also act to limit release of leakage from the facility to surface water.
Due to the potential risk identified to shallow groundwater/surface water in the HLF drainage, the final design
for the HLF will evaluate in more detail some of the uncertain physical/chemical processes such as
unsaturated flow and vapor transport which will influence solute transport. Potential leakage rates and solute
transport concentration predictions will be updated. The monitoring program for the facility (locations,
frequency, parameters and types of monitoring) will be updated following further more detailed design based
the revised understanding of the potential leakage pathways.
In the event that operational monitoring detects trends indicative of HLF leakage, typical mining industry
seepage remediation or other mitigation/operational measures will be implemented to protect the
environment during operation and in closure. These measures may or may not be required pending any
modifications during the final design process and would be determined based on the operational
performance of the HLF performance and the site-specific hydrogeological conditions.
This assessment is based on a probabilistic risk assessment approach to incorporate evaluation of the
uncertainty in key parameters affecting the outcome of the assessment. The assessment is considered
conservative in many aspects, for instance:
Evaluation of a head on the base of the HLP across the entire base area of the facility; hydraulic
gradients on the margins of the facility make it probable that heads will develop only in the flatter central
areas;
Potential for discharge to surface water to occur in the drainage southwest of the facility;
HLF HYDROGEOLOGICAL RISK ASSESSMENT
August 2014 Report No. 14514150095.509/B.1 17
The use of a probabilistic modelling approach and assessment of results at the 95th
percentile;
Consideration of metals concentrations in the PLS up to twice those measured in analysis from pilot
testing; and
Conservative representation of processes contributing to attenuation in the unsaturated zone and
groundwater pathway, which neglects processes such as cyanide volatilisation, ferri- and ferrocyanide
precipitation, cation exchange and potential biodegradation of both cyanide and ammonia in the
groundwater pathway which may reduce impacts from those predicted.
It is therefore considered that whilst there are areas of uncertainty in certain aspects of the assessment,
these are accounted for in the range of values applied as input parameters and in the conservatism of the
assessment approach. As such these areas of uncertainty are not considered to affect the assessment
conclusions regarding potential impacts on receptors.
The HLF will be subject to detailed monitoring during operation, both within the heap (flow and quality
monitoring) and in groundwater downgradient of the facility. Any adverse leakage from the facility is
therefore likely to be identified during operations should it occur, and remedial action can be taken.
Similarly, early-warning monitoring wells in close proximity to the facility will identify any impacts on
groundwater before significant impact on surface water occurs, allowing remedial measures to be
implemented if required.
5.0 REFERENCES
1) ABG Ltd. Finesse Deckdrain 600S Geocomposite Drainage Layer. CE 0799-CPD-30.
2) England and Wales Environment Agency, 2003a. Review of Ammonium Attenuation in Soil and
Groundwater. NGWCLC Report NC/02/49. July 2003.
3) England and Wales Environment Agency, 2003b. LandSim Version 2.5, Landfill Performance
Simulation by Monte Carlos Method. Environment Agency R&D Publication 120.
4) England and Wales Environment Agency, 2004. The Likely Medium to Long Term Generation of
Defects in Membrane Liners. R&D Technical Report P1-500/1/TR.
5) Entenmann, W, 1995. In Situ Determination of Retention Processes in Artificial and Natural Mineral
Layers under Landfills and Contaminated Sites. In: Arendt, F; Annokkée, R & van den Brink, W J (eds):
Contaminated Soil '95, S. 375-376, Dordrecht 1995.
6) Fetter, C W, 1999. Contaminant Hydrogeology, Second Edition. Prentice Hall, New Jersey. pp. 500.
7) Fetter, C W, 2001. Applied Hydrogeology, Fourth Edition. Prentice Hall, New Jersey. pp. 598.
8) Forget B, Rollin A L, Jacquelin, T, 2005. Lessons Learned from 10 years of Leak Detection Surveys on
Geomembranes. Tenth International Waste Management and Landfill Symposium, Sardinia 2005,
Sardinia, Italy.
9) Giroud J P, 1997. Equations for Calculating the Rate of Liquid Migration through Composite Liners due
to Geomembrane Defects. Geosynthetics International Vol. 4, Nos. 3-4, pp 335-348.
10) Giroud, J P and Badu-Tweneboah, K, 1992. Rate of Leakage through a Composite Liner due to
Geomembrane Defects. Geotextiles and Geomembranes, Vol. 11 pp 1-28.
11) Giroud, J P and Bonaparte R, 1989. Leakage through Liners Constructed with Geomembranes – Part I:
Geomembrane Liners. Geotextiles and Geomembranes Vol. 8 pp 27-67.

HLF HYDROGEOLOGICAL RISK ASSESSMENT
August 2014 Report No. 14514150095.509/B.1 18
12) Giroud, J P, Khire, M V, and Soderman, K L, 1997. Liquid Migration through Defects in a
Geomembrane Overlain and Underlain by Permeable Media. Geosynthetics International, Vol 4,
Nos 3-4, pp.293-321.
13) Golder Associates (UK) Ltd, 2014. Technical Memorandum, Amulsar Gold Project: Estimate of Nitrate
and Ammonia Concentrations in Mine Water as a Product of Blasting. Ref 14514150095.508. Dated
17 July 2014.
14) Global Resource Engineering Ltd, 2014a. Feasibility Design Report, Site 28 Heap Leach Facility,
Amulsar Gold Project, Central Armenia. Draft. Project No. 13‐1064. May 2014.
15) Global Resource Engineering Ltd, 2014b. Technical Memorandum, Amulsar BRSF Seepage Model.
Project No. 13‐1064. 14 July 2014.
16) Global Resource Engineering Ltd, 2014c. Calculations Memorandum: Amulsar Site 28 Heap Leach
Facility Water Balance Calculations. Project No. 13‐1064. 1 May 2014.
17) GoldSim Technology Group, 2014. GoldSim Version 11.1. Released June 3, 2014.
18) Howard, P H, Boethling, R S, Jarvis, W F, Meylan, W M, Michalenko, E M, 1991. Handbook of
Environmental Degradation Rates. Lewis Publishers.
19) International Network for Acid Prevention, 2003. Evaluation of the Long-Term Performance of Dry
Cover Systems. Final Report. OKC Report No. 684-02.
20) Koerner, R M, Hsuan, G, Koerner, G R, 2011. Geosynthetics Institute GRI White Paper #6 on
Geomembrane Lifetime Prediction: Unexposed and Exposed Conditions.
21) Kjeldsen, P, 1999. Behaviour of Cyanides in Soil and Groundwater: A Review. Water, Air, and Soil
Pollution, Vol. 115, Issue 1-4, October 1999, pp. 279-308.
22) Lodgson, J M, Hagelstein, K, and Mudder, T I, 1999. The Management of Cyanide in Gold Extraction.
International Council on Metals and the Environment (ICME), April 1999.
23) Lydian International Ltd. HLF Drain Down Water Quality. Provided by e-mail 22 July 2014.
24) National Industrial Chemicals Notification and Assessment Scheme, 2010. Priority Existing Chemical
Report No. 31. Sodium Cyanide. Australian Government Department of Health and Ageing 2010.
25) Smith, A and Mudder, T, 1991. The Chemistry and Treatment of Cyanidation Wastes. Mining Journal
Books Ltd, England. pp. 345.
26) US Environmental Protection Agency, 1996. Soil Screening Guidance: Technical Background
Document EPA Document Number: EPA/540/R-95/128. July 1996.
27) US Environmental Protection Agency, 2004. Understanding Variation in Partition Coefficient, Kd,
Values. Volume III: Review of Geochemistry and Available Kd Values for Americium, Arsenic, Curium,
Iodine, Neptunium, Radium and Technetium. EPA 402-R-04-002C.


HLF HYDROGEOLOGICAL RISK ASSESSMENT
August 2014 Report No. 14514150095.509/B.1
DRAWINGS Drawing 1 – Contaminant Transport Conceptual Model

STREAM
ARPARIVER
0 1000 2000 3000
DISTANCE (m)
ELEV
ATIO
N (m
)
1300
1400
1500
1600
1700
1800
1900
VLF
SOLUTION STORAGE POND
PUMPED
DOUBLE LINER (FMLCOMPOSITE) WITH LEAKDETECTION DRAINAGE LAYER
LOWER VOLCANO-SEDIMENTARY SEQUENCE
LEAKAGE
COMPOSITE LINERWITH UNDER ANDOVER DRAINAGE
SEEPAGE
Rev. DESCRIPTIONYYYY-MM-DDof
www.golder.comDESIGN REVIEW APPROVEDPREPARED
CONSULTANT TITLE
PROJECT No. Rev.
PROJECTCLIENT
Path
: ----
| F
ile N
ame:
145
1415
0095
-000
1-R
A-00
01.d
wg
025
mm
IF T
HIS
MEA
SUR
EMEN
T D
OES
NO
T M
ATC
H W
HAT
IS S
HO
WN
, TH
E SH
EET
SIZE
HAS
BEE
N M
OD
IFIE
D F
RO
M: I
SO A
3
BOURNE END OFFICECavendish HouseBourne End Business Park, Cores End RoadUK[+44] (0) 162 885 1851A 2014-06-30 FIRST ISSUE AD SN CN CN
14514150095CONTROL0001-RA-0001
DRAWING
6.8.1A
AMULSAR GOLD PROJECT ESIA
LYDIAN INTERNATIONAL LTD
VLF CONTAMINANT TRANSPORT CONCEPTUAL CROSSSECTION
1:12,500
250 5000
METRES
LOWER VOLCANO-SEDIMENTARY PACKAGE
COLLUVIUM
HEAD OF PREGNANT LEACHATE SOLUTION
GROUNDWATER LEVEL
GROUNDWATER DISCHARGE TO STREAM / RIVER
LEAKAGE THROUGH LINER
INFILTRATION OF RAINFALL
LEGEND
CONTAMINANT PATHWAY

HLF HYDROGEOLOGICAL RISK ASSESSMENT
August 2014 Report No. 14514150095.509/B.1
APPENDIX A GoldSim Model Structure (Screen Shots)

APPENDIX A GoldSim Model Structure (Screen Shots)
August 2014 Project No. 14514150095.509 1/3
Figure 1: Top Level Container
Parameter_values
Results
River_Arpa_Flow
GW_Flow
Contam_Transport
Discharge_to_Stream

APPENDIX A GoldSim Model Structure (Screen Shots)
August 2014 Project No. 14514150095.509 2/3
Figure 2: Shallow Aquifer Groundwater Flow Container

APPENDIX A GoldSim Model Structure (Screen Shots)
August 2014 Project No. 14514150095.509 3/3
Figure 3: Contaminant Transport Container, Shallow Aquifer
Figure 4: Aquifer Pathway, Shallow Aquifer

HLF HYDROGEOLOGICAL RISK ASSESSMENT
August 2014 Report No. 14514150095.509/B.1
APPENDIX B Model Inputs and Justifications

Amulsar Gold Project
Hydrogeological Risk Assessment
Appendix B
Model Inputs and Justifications
14514150095.509
August 2014
Parameter Species/Material Distribution Input Unit Justification
Arsenic Uniform 0.15, 1.26 mg/l
Copper Uniform 1.4, 3.0 mg/l
Cobalt Uniform 0.021, 0.052 mg/l
Antimony Uniform 0.04, 0.24 mg/l
Cyanide Uniform 34, 66 mg/l
Sodium Single 235 mg/l Design specification, solution will have 500 mg/L sodium cyanide
Ammonium Single 50 mg/l
Nitrate Single 250 mg/l
Arsenic Uniform 0.18, 0.7 mg/l
Copper Uniform 0.5, 0.58 mg/l
Cobalt Uniform 0.014, 0.016 mg/l
Antimony Uniform 0.061, 0.19 mg/l
Cyanide Single 1 mg/l Cyanide concentrations to be reduced post-closure through the use of Peroxide.
Sodium Single 235 mg/l Calculated from pre-closure concentrations of NaCN.
Ammonium Single 50 mg/l
Nitrate Single 250 mg/l
Solubility
All Not limited mol/l
Source concentrations are based on analysis of actual solutions, although some
precipitation is likely to occur due to pH change, metals solubilities are a
function of pH and redox conditions which are not well constrained. The
assumption that analytes remain in solution is considered conservative
Arsenic Uniform 0, 18 ml/g USEPA, 2004
Copper Log Uniform 126.8, 27500 ml/g Entenmann, W, 1995; USEPA, 1996
Cobalt Triangular 45, 55.7, 65 ml/g
Entenmann, W.; In Situ determination of retention processes in artificial and
natural min layers under landfills and contaminated sites. Foundation
Engineering & Environmental Technology, Hamburg.
Antimony Triangular 2, 45, 45 ml/g USEPA, 1996
Sodium Single 0 ml/g Conservative
Cyanide Uniform 0.66, 10.81 ml/g Smith and Mudder (1991), values for clay and shales
Ammonium Triangular 0.1, 0.5, 5 ml/g Environment Agency (2003a), values for clay materials and mudstones
Nitrate Single 0 ml/g Conservative
Arsenic Uniform 0, 18 ml/g USEPA, 2004
Copper Log Uniform 126.8, 27500 ml/g Entenmann, W, 1995; USEPA, 1996
Cobalt Triangular 45, 55.7, 65 ml/g
Entenmann, W.; In Situ determination of retention processes in artificial and
natural min layers under landfills and contaminated sites. Foundation
Engineering & Environmental Technology, Hamburg.
Antimony Triangular 2, 45, 45 ml/g USEPA, 1996
Sodium Single 0 ml/g Conservative
Cyanide Uniform 0.066, 9.6 ml/g Smith and Mudder (1991), values for limestone (no other rock types reported)
Ammonium Uniform 0.05, 2 ml/g
Environment Agency (2003a), range for various sedimentary rock types as no
values for igneous rocks reported, and presence of clay infill may affect Kd of
basaltic rock.
Nitrate Single 0 ml/g Conservative
Cyanide Uniform 0.5, 1 years
Aerobic halflife. Conservative range based on Kjeldsen, 1999 and Howard et al,
1991.
Ammonium Uniform 1, 6 years Aerobic halflife. Environment Agency, 2003a.
Cyanide Single 1.00E+09 years
Conservative assumption as degradation may not occur or may be greatly
reduced in saturated conditions (Smith and Mudder, 1991).
Ammonium Single 1.00E+09 years
Conservative assumption as biodegradation does not occur in anaerobic
conditions (Environment Agency, 2003a).
Low Permeability Soil Liner Single 1800 kg/m3
Golder experience for clay materials
Colluvium Single 1800 kg/m3
Golder experience
Lower volcano sedimentary sequence Single 2400 kg/m3
Golder experience
Low Permeability Soil Liner Single 0.15 Golder experience, effective connected porosity
Colluvium Triangular 0.03, 0.07, 0.12 Johnson (1967) "Sandy clay" range; consistent with observed.
Lower volcano sedimentary sequence Triangular 0.02, 0.08, 0.14 Based on porosity estimates: Groundwater Baseline report (Golder 2014)
Phase 1 Single 323,554 m2
Phase 2 Single 134,920 m2
Phase 3 Single 8,993 m2
Phase 1 Single 156,956 m2
Phase 2 Single 142,030 m2
Phase 3 Single 337,627 m2
Active Area
All phases Single 278,400 m2
Total active area, active area overlying each phases calculated by scaling of
proportional area. Total area of Phase 2 is less than the active area, therefore
100% of area of Phase 2 taken as active during operation.
Area of PSP Single 21,470 m2
Amulsar Site 28 HLF Water Balance Calculations Memo, G.R.E., 01-05-14
Area of Storm Pond 1Single 14,784 m
2Amulsar Site 28 HLF Water Balance Calculations Memo, G.R.E., 01-05-14
HLP - active operational Single 0.1 m
HLP - inactive, open (uncapped) Single 0.04 m
HLP - Post-Closure Single 0.01 m
PSP Single 10 m
Maximum possible depth of liquid in PSP; Based on "Phases 1-3 Leach Pad
Layout and Ore Heap Plan, Drawing 6", GRE, April 2014.
Ore heap height
Single 112.7 m
Average maximum heap height across all Phases; Based on "Phases 1-3 Leach
Pad Layout and Ore Heap Plan, Drawing 6", GRE, April 2014.
Ore heap field capacity single 10 % Amulsar Site 28 HLF Water Balance Calculations Memo, G.R.E., 01-05-14
Total Single 10.5 years
Phase 1 Single 27 months
Phase 2 Single 43 months
Phase 3 Single 55 months
Rinsing period
Single 1 years
Based on instructions received from Marc Leduc (Lydian) in email "Heap closure
concepts - to be used for the EIA closure plan", 03-07-2014
Capping period
Single 1.5 years
Based on instructions received from Marc Leduc (Lydian) in email "Heap closure
concepts - to be used for the EIA closure plan", 03-07-2014
Managed closure period
Single 5 years
Based on instructions received from Marc Leduc (Lydian) in email "Heap closure
concepts - to be used for the EIA closure plan", 03-07-2014
Uncapped infiltration rate
Single 485.49 mm/yr
Calculated from values presented in: Amulsar Site 28 HLF Water Balance
Calculations Memo, G.R.E., dated 01-05-14
Post-closure infiltration rate Single 20 mm/yr Conservative estimate based on climatic conditions, see report text.
HLF, Phase 1 (shallow aquifer) Single 800 m
HLF, Phase 2 (shallow aquifer) Single 551 m
HLF, Phase 3 (shallow aquifer) Single 98 m
HLF, Phase 1 (deep aquifer) Single 676 m
HLF, Phase 2 (deep aquifer) Single 400 m
HLF, Phase 3 (deep aquifer) Single 400 m
Longest flowpath across pond
base
PSP Single 210 m
Flow path across full diagonal of base to sump in opposing corner; Based on
"Phases 1-3 Leach Pad Layout and Ore Heap Plan, Drawing 6", GRE, April
2014.
Liquid depth on liner Design specification (GRE 2014a) and based on maximum head on the liner
calculated using the Dupuit Equation and based on infiltration rates of 0.01
m3/hr/m2, 485.49 mm/year and 10 mm/yr (operational, uncapped and post-
closure), 7 m drain spacing, and clogged drainage media permeability 10-3 m/s.
Dry Bulk Density
PLS Concentration During
Closure
Based on analysis of barren leach solution from 2 test ore samples, as provided
by Lydian. maximum equal to double the reported maximum concentration. See
text for further discussion.
Based on calculations of nitrogen loading due to ammonium nitrate residues
(Golder 2014). Analysis of ammonium or nitrate concentrations in the barren
leach solution from pilot testing will not allow for nitrogen derived from
explosives residues.
Contaminants and Materials
Kd Values, LVA
Half Lives, Unsaturated Zone
Half Lives, Aquifer Pathway
Based on calculations of nitrogen loading due to ammonium nitrate residues
(Golder 2014). Analysis of ammonium or nitrate concentrations in the barren
leach solution from pilot testing will not allow for nitrogen derived from
explosives residues.
PLS Concentration
Kd Values, Liner and Colluvium
Based on analysis of barren leach solution from 2 test ore samples, as provided
by Lydian. maximum equal to double the reported maximum concentration for
metals. Taken at reported value for cyanide. See text for further discussion.
Area of HLF intersecting deep
aquifer
Based on "Phases 1-3 Leach Pad Layout and Ore Heap Plan, Drawing 6", GRE,
April 2014 and estimated extent of shallow aquifer.
Porosity
Operational period Amulsar Site 28 HLF Water Balance Calculations Memo, G.R.E., 01-05-14
Average width; Based on "Phases 1-3 Leach Pad Layout and Ore Heap Plan,
Drawing 6", GRE, April 2014.
Dilution width
Liner
Infrastructure Geometry and Properties
Area of HLF intersecting shallow
aquifer
Golder Associates 1
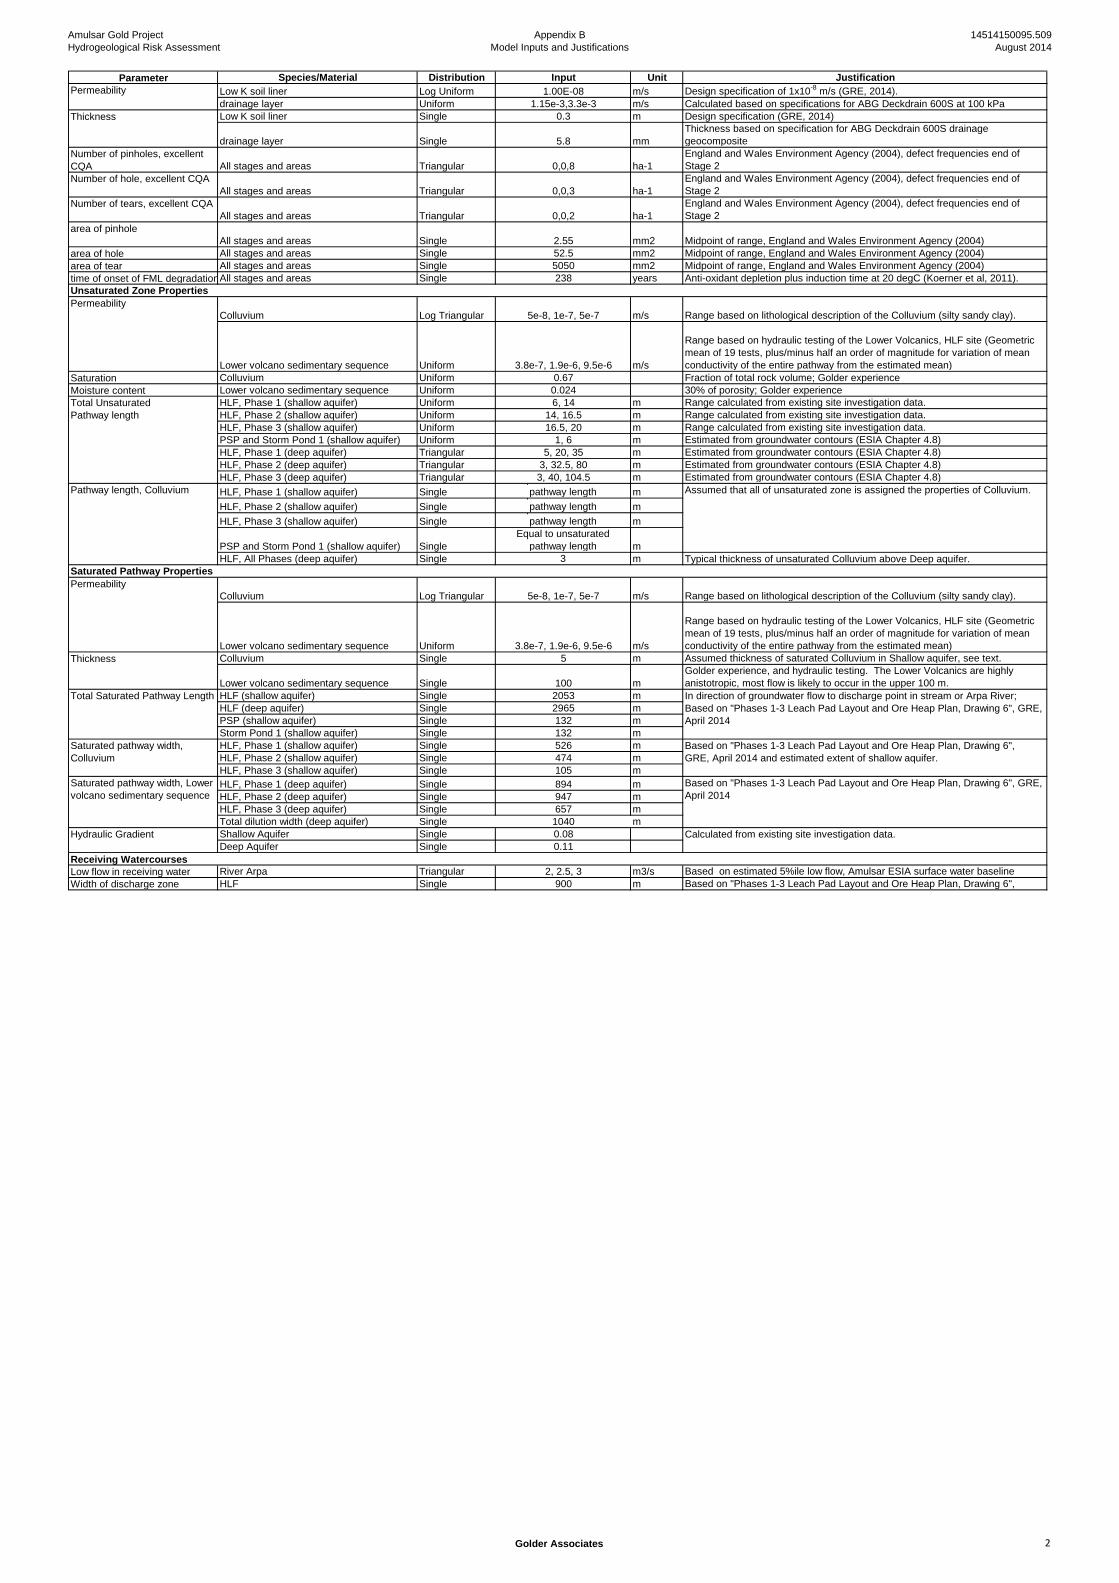
Amulsar Gold Project
Hydrogeological Risk Assessment
Appendix B
Model Inputs and Justifications
14514150095.509
August 2014
Parameter Species/Material Distribution Input Unit Justification
Low K soil liner Log Uniform 1.00E-08 m/s Design specification of 1x10⁻⁸
m/s (GRE, 2014).
drainage layer Uniform 1.15e-3,3.3e-3 m/s Calculated based on specifications for ABG Deckdrain 600S at 100 kPa
Low K soil liner Single 0.3 m Design specification (GRE, 2014)
drainage layer Single 5.8 mm
Thickness based on specification for ABG Deckdrain 600S drainage
geocomposite
Number of pinholes, excellent
CQA All stages and areas Triangular 0,0,8 ha-1
England and Wales Environment Agency (2004), defect frequencies end of
Stage 2
Number of hole, excellent CQA
All stages and areas Triangular 0,0,3 ha-1
England and Wales Environment Agency (2004), defect frequencies end of
Stage 2
Number of tears, excellent CQA
All stages and areas Triangular 0,0,2 ha-1
England and Wales Environment Agency (2004), defect frequencies end of
Stage 2
area of pinhole
All stages and areas Single 2.55 mm2 Midpoint of range, England and Wales Environment Agency (2004)
area of hole All stages and areas Single 52.5 mm2 Midpoint of range, England and Wales Environment Agency (2004)
area of tear All stages and areas Single 5050 mm2 Midpoint of range, England and Wales Environment Agency (2004)
time of onset of FML degradationAll stages and areas Single 238 years Anti-oxidant depletion plus induction time at 20 degC (Koerner et al, 2011).
Colluvium Log Triangular 5e-8, 1e-7, 5e-7 m/s Range based on lithological description of the Colluvium (silty sandy clay).
Lower volcano sedimentary sequence Uniform 3.8e-7, 1.9e-6, 9.5e-6 m/s
Range based on hydraulic testing of the Lower Volcanics, HLF site (Geometric
mean of 19 tests, plus/minus half an order of magnitude for variation of mean
conductivity of the entire pathway from the estimated mean)
Saturation Colluvium Uniform 0.67 Fraction of total rock volume; Golder experience
Moisture content Lower volcano sedimentary sequence Uniform 0.024 30% of porosity; Golder experience
HLF, Phase 1 (shallow aquifer) Uniform 6, 14 m Range calculated from existing site investigation data.
HLF, Phase 2 (shallow aquifer) Uniform 14, 16.5 m Range calculated from existing site investigation data.
HLF, Phase 3 (shallow aquifer) Uniform 16.5, 20 m Range calculated from existing site investigation data.
PSP and Storm Pond 1 (shallow aquifer) Uniform 1, 6 m Estimated from groundwater contours (ESIA Chapter 4.8)
HLF, Phase 1 (deep aquifer) Triangular 5, 20, 35 m Estimated from groundwater contours (ESIA Chapter 4.8)
HLF, Phase 2 (deep aquifer) Triangular 3, 32.5, 80 m Estimated from groundwater contours (ESIA Chapter 4.8)
HLF, Phase 3 (deep aquifer) Triangular 3, 40, 104.5 m Estimated from groundwater contours (ESIA Chapter 4.8)
HLF, Phase 1 (shallow aquifer) Single
Equal to unsaturated
pathway length m
HLF, Phase 2 (shallow aquifer) Single
Equal to unsaturated
pathway length m
HLF, Phase 3 (shallow aquifer) Single
Equal to unsaturated
pathway length m
PSP and Storm Pond 1 (shallow aquifer) Single
Equal to unsaturated
pathway length m
HLF, All Phases (deep aquifer) Single 3 m Typical thickness of unsaturated Colluvium above Deep aquifer.
Colluvium Log Triangular 5e-8, 1e-7, 5e-7 m/s Range based on lithological description of the Colluvium (silty sandy clay).
Lower volcano sedimentary sequence Uniform 3.8e-7, 1.9e-6, 9.5e-6 m/s
Range based on hydraulic testing of the Lower Volcanics, HLF site (Geometric
mean of 19 tests, plus/minus half an order of magnitude for variation of mean
conductivity of the entire pathway from the estimated mean)
Colluvium Single 5 m Assumed thickness of saturated Colluvium in Shallow aquifer, see text.
Lower volcano sedimentary sequence Single 100 m
Golder experience, and hydraulic testing. The Lower Volcanics are highly
anistotropic, most flow is likely to occur in the upper 100 m.
HLF (shallow aquifer) Single 2053 m
HLF (deep aquifer) Single 2965 m
PSP (shallow aquifer) Single 132 m
Storm Pond 1 (shallow aquifer) Single 132 m
HLF, Phase 1 (shallow aquifer) Single 526 m
HLF, Phase 2 (shallow aquifer) Single 474 m
HLF, Phase 3 (shallow aquifer) Single 105 m
HLF, Phase 1 (deep aquifer) Single 894 m
HLF, Phase 2 (deep aquifer) Single 947 m
HLF, Phase 3 (deep aquifer) Single 657 m
Total dilution width (deep aquifer) Single 1040 m
Shallow Aquifer Single 0.08
Deep Aquifer Single 0.11
Low flow in receiving water River Arpa Triangular 2, 2.5, 3 m3/s Based on estimated 5%ile low flow, Amulsar ESIA surface water baseline
Width of discharge zone HLF Single 900 m Based on "Phases 1-3 Leach Pad Layout and Ore Heap Plan, Drawing 6",
Total Unsaturated
Pathway length
Pathway length, Colluvium
Receiving Watercourses
Saturated Pathway Properties
Permeability
Saturated pathway width, Lower
volcano sedimentary sequence
Total Saturated Pathway Length In direction of groundwater flow to discharge point in stream or Arpa River;
Based on "Phases 1-3 Leach Pad Layout and Ore Heap Plan, Drawing 6", GRE,
April 2014
Based on "Phases 1-3 Leach Pad Layout and Ore Heap Plan, Drawing 6",
GRE, April 2014 and estimated extent of shallow aquifer.
Based on "Phases 1-3 Leach Pad Layout and Ore Heap Plan, Drawing 6", GRE,
April 2014
Hydraulic Gradient
Thickness
Saturated pathway width,
Colluvium
Calculated from existing site investigation data.
Permeability
Thickness
Unsaturated Zone Properties
Permeability
Assumed that all of unsaturated zone is assigned the properties of Colluvium.
Golder Associates 2
HLF HYDROGEOLOGICAL RISK ASSESSMENT
August 2014 Report No. 14514150095.509/B.1
APPENDIX C Model Results

APPENDIX C Model Results
August 2014 Project No. 14514150095.509 1/8
GoldSim model outputs showing impacts on surface water quality in the pathways assessed. Graphs show
concentrations in the Arpa River calculated by the GoldSim model and at the point of discharge to the stream
southwest of the HLF.
Concentrations in Surface Water after Discharge to the Arpa River
Figure 1: Arsenic Concentration, Discharge to the Arpa River Scenario 2
Figure 2: Copper Concentration, Discharge to the Arpa River Scenario 2

APPENDIX C Model Results
August 2014 Project No. 14514150095.509 2/8
Figure 3: Cobalt Concentration, Discharge to the Arpa River Scenario 2
Figure 4: Antimony Concentration, Discharge to the Arpa River Scenario 2

APPENDIX C Model Results
August 2014 Project No. 14514150095.509 3/8
Figure 5: Sodium Concentration, Discharge to the Arpa River Scenario 2
Figure 6: Cyanide Concentration, Discharge to the Arpa River Scenario 2

APPENDIX C Model Results
August 2014 Project No. 14514150095.509 4/8
Figure 7: Ammonium Concentration, Discharge to the Arpa River Scenario 2
Figure 8: Nitrate Concentration, Discharge to the Arpa River Scenario 2

APPENDIX C Model Results
August 2014 Project No. 14514150095.509 5/8
Concentrations in Discharge to the HLF Stream
Figure 9: Arsenic Concentration, Discharge to HLF Stream
Figure 10: Copper Concentration, Discharge to HLF Stream

APPENDIX C Model Results
August 2014 Project No. 14514150095.509 6/8
Figure 11: Cobalt Concentration, Discharge to HLF Stream
Figure 12: Antimony Concentration, Discharge to HLF Stream

APPENDIX C Model Results
August 2014 Project No. 14514150095.509 7/8
Figure 13: Sodium Concentration, Discharge to HLF Stream
Figure 14: Cyanide Concentration, Discharge to HLF Stream

APPENDIX C Model Results
August 2014 Project No. 14514150095.509 8/8
Figure 15: Ammonium Concentration, Discharge to HLF Stream
Figure 16: Nitrate Concentration, Discharge to HLF Stream

HLF HYDROGEOLOGICAL RISK ASSESSMENT
August 2014 Report No. 14514150095.509/B.1
APPENDIX D Electronic Copies of GoldSim Models

Golder Associates (UK) Ltd
Cavendish House
Bourne End Business Park
Cores End Road
Bourne End
Buckinghamshire
SL8 5AS
UK
T: [+44] (0) 1628 851851
Caption Text