AmTrust Financial Investor Presentation First Quarter 2010.
18
AmTrust Financial Investor Presentation First Quarter 2010
-
Upload
laurel-douglas -
Category
Documents
-
view
218 -
download
3
Transcript of AmTrust Financial Investor Presentation First Quarter 2010.

AmTrust Financial
Investor Presentation
First Quarter 2010

Forward Looking Statements
This Presentation contains certain forward-looking statements within the meaning of Private Securities Litigation Reform Act of 1995, which are intended to be covered by the safe harbors created thereby. These statements include the plans and objectives of management for future operations, including plans and objectives relating to future growth of the Company’s business activities and availability of funds. The forward-looking statements included herein are based on current expectations that involve numerous risks and uncertainties. Assumptions relating to the foregoing involve judgments with respect to, among other things, future economic, competitive and market conditions, regulatory framework, weather-related events and future business decisions, all of which are difficult or impossible to predict accurately and many of which are beyond the control of the Company. There can be no assurance that actual developments will be those anticipated by the Company. Actual results may differ materially from those projected as a result of significant risks and uncertainties, including non-receipt of the expected payments, changes in interest rates, effect of the performance of financial markets on investment income and fair values of investments, development of claims and the effect on loss reserves, accuracy in projecting loss reserves, the impact of competition and pricing environments, changes in the demand for the Company’s products, the effect of general economic conditions, adverse state and federal legislation, regulations and regulatory investigations into industry practices, developments relating to existing agreements, heightened competition, changes in pricing environments, changes in asset valuations and ability for American Capital Acquisition Corporation to complete its pending acquisition of GMAC’s US consumer P&C insurance business. Additional information about these risks and uncertainties, as well as others that may cause actual results to differ materially from those projected is contained in Item 1A. Risk Factors in the Company’s Annual Report on Form 10-K for the period ended December 31, 2008, as updated in the Company’s Quarterly Report for the quarter ended September 30, 2009. The projections and statements in this presentation speak only as of the date of this presentation and we undertake no obligation to update or revise any forward-looking statement, whether as a result of new information, future developments or otherwise, except as may be required by law.

1
AmTrust Overview
• High ROE business model
– Low hazard, non-catastrophic
– Disciplined underwriting and pricing
– Target underserved niche markets
– Lower volatility business mix
– Proprietary technology platform drives lower cost and service excellence
• Record of intelligent growth
– Strong value creation Organic growth Low-risk high return acquisitions
• Strong balance sheet
– “A-” rating from A.M. Best
– Conservative investment philosophy
Multinational specialty property and casualty insurance company focused on profitable growth in niche markets

2
Performance Highlights
*Net income before after-tax net realized gains (losses) on investments. Please see slide 15 for important information on this non-GAAP measure.
2004 2005 2006 2007 2008 2009
Specialty Middle-Market
Specialty Risk & Extended Warranty
Small Commercial Business
Gross Premium Written
$11.1 $17.4
$38.9
$87.1
$124.9 $125.1
2004 2005 2006 2007 2008 2009
Operating Earnings*
$526.0
$839.4
$286.1
$210.9
$1,110.6
50% CAGR
$1,198.9
22%
39%
39%
21%
38%
41%
27%
36%
37%
26%
25%
49%72%
29%
65%
35%
$s in millions $s in millions
34% C
AGR

Diverse, Lower Volatility Business Mix
200620072008
• Niche lines of business in underserved markets
– More predictable loss experience
– Higher retention rates– Lower pricing pressures– Lower volatility
• Multi-national operations
– Access to over 9,000 wholesale and retail agents with ability to market to ACAC’s agent network
– 21% of 2009 GWP outside U.S.
• Geographic and business line diversity creates strength and opportunity through varied market cycles
3
$1.2 Billion GWP 2009
Workers’ Comp
Inland Marine
Warranty
Commercial Auto
Other Liability
All Other
Fire
8%
40%
23%
17%
4%
5%3%

$308.8$258.9
$458.8 $469.6
2006 2007 2008 2009
Gross Written Premium
Small Commercial BusinessLower hazard small business worker’s comp and packaged products
• Target lower risk, underserved businesses
– Such as restaurants, retailers and professional offices
– Average policy premium of $6,360– Average of 8 employees per WC
policy
• Less price sensitive than traditional products
– Strong client retention with renewal rates consistently > 80%
• Proprietary technology provides ease-of-use and strong operating efficiencies
• Distributed through over 7,300 active retail and wholesale agents
– Geographically diversified in Mid-Atlantic, Southeast and Midwest
Small Commercial Business
4
$s in millions

2006 2007 2008 2009
Gross Written Premium
5
Specialty Risk and Extended WarrantyLow hazard/non-catastrophic extended warranty coverage and
other specialty commercial coverage
• Target manufacturers, small direct retailers, warranty administrators and brokers
– 53% of 2009 GWP outside U.S.
• Products include yellow goods, consumer electronics and appliances, specialty auto
– Less price sensitive than traditional products
– Renewal rates > 90%– Cost effective solution for end user
• Extensive new client and product due diligence and actuarial reviews
– Client-specific forms/strict policies– Proactive claims management allows for
real-time pricing adjustments– Ensures appropriate risk-based pricing
$132.8
$306.4
$415.9
Specialty Risk & Extended Warranty
$s in millions
$461.3

2006 2007 2008 2009
Gross Written Premium
6
Specialty Middle-MarketExpansion of lower risk worker’s comp, general liability,
commercial auto and property coverage
$93.8
$224.2
$268.0$235.8
Specialty Middle-Market
• Target lower risk businesses– Retailers– Wholesalers– Service operations
• Strong client retention with renewal rates consistently > 80%
• Proprietary technology provides ease-of-use to agents and paperless 24 hour underwriting response
– Customized coverage, loss control and claims
• Distributed through wholesalers with product or geographic expertise
– MGAs share in risk with limited underwriting capabilities
$s in millions

• Focused on driving growth organically and via low risk, high return transactions– Key hires of underwriting teams in the US and Europe
– Opportunistic renewal rights transactions, acquisitions and strategic transactions
History of Disciplined Growth
Dec2002
Renewal Rights
Princeton Insurance Company
Dec2003
Renewal Rights
Covenant Group
Dec2005
Renewal Rights
Alea USSmall-, Middle-
market P&C book
May2006
Renewal Rights
Muirfield Underwriters
Jun2007
Reinsurance Agreement
Maiden
Insurance Strategic Quota
Share Agreement
Jun2008
Renewal Rights
Unitrin Business Insurance
Early 2003
Key Hires
Hired specialty risk and
extended warranty
insurance team in London
Feb2006
144A Offering
Raised ~$166 MM to finance
acquisitions and fund
business growth
Aug2004
Renewal Rights
Associated Industries Insurance Company
Apr2007
Acquisition
Acquisition of IGI Group, Ltd.
Sep2007
Acquisition
Associated Industries Insurance
Services, Inc.
Fall2008
Strategic Agreement
Cardinal Comp
Fall 2009
Renewal Rights
CyberComp
Mar2010
Strategic Investment/Agreement
ACAC’sAcquisition of
GMAC personal lines
P&C
7
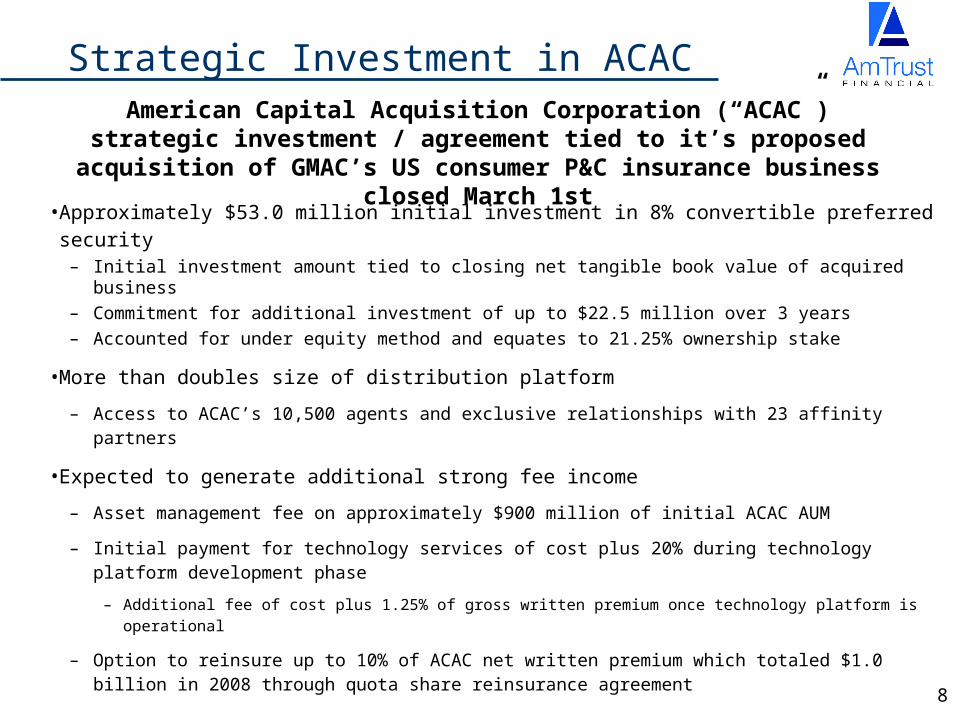
Strategic Investment in ACAC
• Approximately $53.0 million initial investment in 8% convertible preferred security– Initial investment amount tied to closing net tangible book value of acquired business– Commitment for additional investment of up to $22.5 million over 3 years– Accounted for under equity method and equates to 21.25% ownership stake
• More than doubles size of distribution platform
– Access to ACAC’s 10,500 agents and exclusive relationships with 23 affinity partners
• Expected to generate additional strong fee income
– Asset management fee on approximately $900 million of initial ACAC AUM
– Initial payment for technology services of cost plus 20% during technology platform development phase
– Additional fee of cost plus 1.25% of gross written premium once technology platform is operational
– Option to reinsure up to 10% of ACAC net written premium which totaled $1.0 billion in 2008 through quota share reinsurance agreement
American Capital Acquisition Corporation (“ACAC”) strategic investment / agreement tied to it’s proposed acquisition of GMAC’s US
consumer P&C insurance business closed March 1st
8

65.0% 57.1%
29.9% 29.4% 28.0% 20.8% 22.7%
57.7%62.4%63.9%65.7%
20.1%
2004 2005 2006 2007 2008* 2009
Net Loss Ratio Net Expense Ratio
91.9%83.2% 77.8% 79.8%
94.8% 95.1%
9
History of Strong Underwriting
• Granular lower risk portfolio and geographic diversity drives consistently lower loss ratios
• Proprietary technology drives lower costs, enhanced underwriting, and improved agent and client experience
– Results in lower origination costs and improved retention– Enables strong data mining and analysis of enhanced portfolio metrics
2004 2005 2006 2007 2008 2009
$526.0
$839.4
$286.1$210.9
$1,110.6
$1,198.9Gross Written Premium Combined Ratio
* 2008 loss and combined ratios exclude effect of $15.0 million pre-tax loss reserve release.
$s in millions

Focus on Shareholder Returns
Operating Return on Equity*
10
*Net income before after-tax net realized gains (losses) on investments divided by average shareholder’s equity. Please see slide 15 for important information on this non-GAAP measure.
• Highly efficient capital structure
– 46% of 2009 premiums ceded
• Commitment to lower cost structure
– Proprietary technology enhances efficiency
– Single data platform
• Lower level of volatility
– Higher frequency lower severity business mix
• Management interests aligned with shareholders
– Significant inside ownership
• Record of intelligent growth
– Renewal rights transactions
– Strategic agreements and key hires

11
($s in millions except per share data)
Gross Premium Written
Net Written Premium
Net Premium Earned
Fee Income
20072008
20.4
Net Investment Income and Realized Gains / (Losses)
Loss and LAE Expense
Acquisition Costs and Other Underwriting Expenses
Income Before Other Income (Expense)
Net Income
Operating Earnings *
Annualized Operating ROE *
Net Loss Ratio
Net Expense Ratio
Net Combined Ratio
277.0
Ceding Commission
Operating EPS *
$ 839.4
419.9
444.2
55.5
155.4
130.8
90.1
$ 87.1
23.8%
62.4%
20.8%
83.2%
62.8
$1.44
(7.0)
$1,110.6
554.9
439.1
29.0
238.3
203.7
114.3
82.9
$ 124.9
32.3%
54.3%
20.1%
74.4%
115.5
$2.06
$1,198.9
643.4
573.9
30.7
327.8
244.3
145.1
103.2
$ 125.0
26.0%
57.1%
22.7%
79.8%
113.9
$2.09
20.9
Summary Income Statement
2009
*Operating earnings reflect net income before after-tax net realized gains (losses) on investments. Please see slide 15 for important information on these non-GAAP measures.

12
Cash and InvestmentsReinsurance RecoverablePremiums Receivable, NetPrepaid reinsurance premium, deferred policy acquisition costs and other assets
Loss and LAE ReserveUnearned Premium Reserve
(1)Junior Subordinate DebenturesReinsurance payables, accrued expenses and other liabilities
Shareholders' Equity
Total Liabilities and Shareholders' Equity
1. Trust Preferred Securities
Book Value Per Share
$1,289.6281.9257.8
493.5
$2,322.8
$ 775.4527.8123.7
505.5
1,932.4
390.4
$2,322.8
$6.51
$1,361.4
419.6
$3,143.9
$1,014.1759.9123.7
853.7
2,751.4
392.5
$3,143.9
$6.54
584.8
778.1
$1,414.8
495.9
$3,400.4
$1,091.9871.8123.7
743.6
2,831.0
569.4
$3,400.4
$9.60
643.3
846.4
Balance Sheet Highlights
($s in millions except per share data) 12/31/0712/31/0812/31/09

13
Conservative Investment Portfolio
4%
17%
77%
1%
$1.4 Billion Investment Portfolio 12/31/09
Fixed Maturities
Cash & Short-term
Investments
Equity Securities
Other
• 77% fixed maturities
• 89% of fixed maturities A rated or better
• 38% of fixed maturities are floating rate
• Average fixed maturities portfolio yield of 3.83%
• Average fixed maturities portfolio duration of 3.3 years

14
Focus On Delivering Strong ROE
• Diversified balanced business model drives solid results in varying economic cycles
– Target lower risk niche business lines
– Highly efficient capital structure
• Focus on driving consistently strong underwriting profits
– Disciplined pricing and risk selection
– 57.1% net loss ratio for FY2009
• Lower expense ratio
– Proprietary technology platform drives lower costs and provides capacity for continued expansion opportunities
– Provides solid economies of scale
– 22.7% net expense ratio for FY2009
• Continue to capitalize on unique lower-risk market opportunities
• Committed to conservative investing and reserving philosophy
• Management and shareholder interests aligned
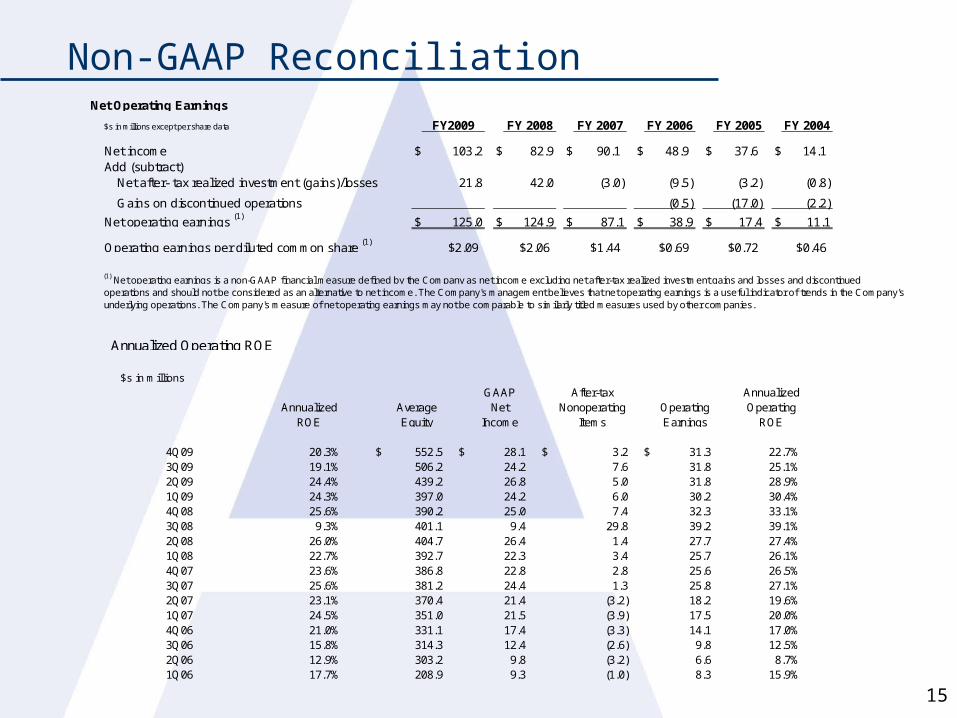
Non-GAAP Reconciliation
15
Net Operating Earnings
$s in millions except per share data FY2009 FY 2008 FY 2007 FY 2006 FY 2005 FY 2004
Net income $ 103.2 $ 82.9 $ 90.1 $ 48.9 $ 37.6 $ 14.1 Add (subtract)
Net after- tax realized investment (gains)/losses 21.8 42.0 (3.0) (9.5) (3.2) (0.8)
Gains on discontinued operations (0.5) (17.0) (2.2)
Net operating earnings (1) $ 125.0
$ 124.9
$ 87.1
$ 38.9
$ 17.4
$ 11.1
Operating earnings per diluted common share (1) $2.09 $2.06 $1.44 $0.69 $0.72 $0.46
(1) Net operating earnings is a non-GAAP financial measure defined by the Company as net income excluding net after-tax realized investment gains and losses and discontinuedoperations and should not be considered as an alternative to net income. The Company's management believes that net operating earnings is a useful indicator of trends in the Company'sunderlying operations. The Company's measure of net operating earnings may not be comparable to similarly titled measures used by other companies.
Annualized Operating ROE
$s in millions
Annualized ROE
Average Equity
GAAP Net
Income
After-tax Nonoperating
ItemsOperating Earnings
Annualized Operating
ROE
4Q09 20.3% $ 552.5 $ 28.1 $ 3.2 $ 31.3 22.7%3Q09 19.1% 506.2 24.2 7.6 31.8 25.1%2Q09 24.4% 439.2 26.8 5.0 31.8 28.9%1Q09 24.3% 397.0 24.2 6.0 30.2 30.4%4Q08 25.6% 390.2 25.0 7.4 32.3 33.1%3Q08 9.3% 401.1 9.4 29.8 39.2 39.1%2Q08 26.0% 404.7 26.4 1.4 27.7 27.4%1Q08 22.7% 392.7 22.3 3.4 25.7 26.1%4Q07 23.6% 386.8 22.8 2.8 25.6 26.5%3Q07 25.6% 381.2 24.4 1.3 25.8 27.1%2Q07 23.1% 370.4 21.4 (3.2) 18.2 19.6%1Q07 24.5% 351.0 21.5 (3.9) 17.5 20.0%4Q06 21.0% 331.1 17.4 (3.3) 14.1 17.0%3Q06 15.8% 314.3 12.4 (2.6) 9.8 12.5%2Q06 12.9% 303.2 9.8 (3.2) 6.6 8.7%1Q06 17.7% 208.9 9.3 (1.0) 8.3 15.9%

AmTrust Financial