AMP Data Entry Page - USPSabout.usps.com/streamlining-operations/Atlanta-final-redacted.pdf ·...
46
Type of Distribution to Consolidate: Originating MODS/BPI Office Facility Name & Type: Street Address: City: Atlanta State: GA 5D Facility ZIP Code: 30304 District: Atlanta Area: Capital Metro Finance Number: 120441 Current 3D ZIP Code(s): Miles to Gaining Facility: 33.1 EXFC office: Yes Plant Manager: Senior Plant Manager: District Manager: Facility Type after AMP: P&DC/F Facility Name & Type: Street Address: City: State: GA 5D Facility ZIP Code: 30096 District: Atlanta Area: Capital Metro Finance Number: 123569 Current 3D ZIP Code(s): EXFC office: Yes A/Plant Manager Senior Plant Manager: District Manager: Start of Study: 10/2/2009 Date Range of Data: Jul-01-2010 : Jun-30-2011 Processing Days per Year: 310 Bargaining Unit Hours per Year: 1,745 EAS Hours per Year: 1,822 June 16, 2011 9/6/2012 12:52 Area Vice President: Vice President, Network Operations: Area AMP Coordinator: HQ AMP Coordinator: rev 10/10/2011 ----- AMP Data Entry Page ----- Atlanta P&DC 3900 Crown Rd SW Mark Hogan 1. Losing Facility Information Stephen E. Martin 302-303, 311, 399 Scott Raymond Salvatore N. Vacca David C. Fields David E. Williams Salvatore N. Vacca North Metro P&DC 1605 Boggs Rd Scott Raymond 4. Other Information Scott Raymond Duluth 300, 301 2. Gaining Facility Information Janet Hester Date & Time this workbook was last saved: 3. Background Information Date of HQ memo, DAR Factors/Cost of Borrowing/ New Facility Start-up Costs Update Package Page 1 AMP Data Entry Page
Transcript of AMP Data Entry Page - USPSabout.usps.com/streamlining-operations/Atlanta-final-redacted.pdf ·...

Type of Distribution to Consolidate: Originating MODS/BPI Office
Facility Name & Type:Street Address:
City: AtlantaState: GA
5D Facility ZIP Code: 30304District: Atlanta
Area: Capital MetroFinance Number: 120441
Current 3D ZIP Code(s):Miles to Gaining Facility: 33.1
EXFC office: YesPlant Manager:
Senior Plant Manager:District Manager:
Facility Type after AMP: P&DC/F
Facility Name & Type:Street Address:
City:State: GA
5D Facility ZIP Code: 30096District: Atlanta
Area: Capital MetroFinance Number: 123569
Current 3D ZIP Code(s):EXFC office: Yes
A/Plant ManagerSenior Plant Manager:
District Manager:
Start of Study: 10/2/2009Date Range of Data: Jul-01-2010 : Jun-30-2011
Processing Days per Year: 310Bargaining Unit Hours per Year: 1,745
EAS Hours per Year: 1,822
June 16, 2011
9/6/2012 12:52
Area Vice President:Vice President, Network Operations:
Area AMP Coordinator:HQ AMP Coordinator:
rev 10/10/2011
----- AMP Data Entry Page -----
Atlanta P&DC3900 Crown Rd SW
Mark Hogan
1. Losing Facility Information
Stephen E. Martin
302-303, 311, 399
Scott RaymondSalvatore N. Vacca
David C. FieldsDavid E. Williams
Salvatore N. Vacca
North Metro P&DC1605 Boggs Rd
Scott Raymond
4. Other Information
Scott Raymond
Duluth
300, 301
2. Gaining Facility Information
Janet Hester
Date & Time this workbook was last saved:
3. Background Information
Date of HQ memo, DAR Factors/Cost of Borrowing/ New Facility Start-up Costs Update
Package Page 1 AMP Data Entry Page


Losing Facility Name and Type:Street Address:
City, State:
Current 3D ZIP Code(s):
Type of Distribution to Consolidate:
Gaining Facility Name and Type:Current 3D ZIP Code(s):
= $3,516,100
= ($14)
= $23,115
= $3,476,690 from Transportation (HCR and PVS)
= $728,414 from Maintenance
= $0 from Space Evaluation and Other Costs
= $7,744,304
= $1,232,438 from Space Evaluation and Other Costs
= $6,511,866
= 34 from Staffing - Craft
= 1 from Staffing - PCES/EAS
= 896,161 from Workhour Costs - Current
= 5,352,212 from Workhour Costs - Current
= 397,466
ADV ADV ADV %
First-Class Mail® 100.0%
Priority Mail® 100.0%
Package Services 59.0%
Periodicals N/A* N/A* N/A* N/A*
Standard Mail N/A* N/A* N/A* N/A*Code to destination 3-digit ZIP Code volume is not
available
Unchanged + Upgrades
Executive SummaryLast Saved: September 6, 2012
Atlanta P&DC
3900 Crown Rd SW
Atlanta, GA
302-303, 311, 399
Originating Miles to Gaining Facility: 33.1
North Metro P&DC
300, 301
Summary of AMP Worksheets
Savings/CostsMail Processing Craft Workhour Savings from Workhour Costs - Proposed
Non-MP Craft/EAS + Shared LDCs Workhour Savings (less Maint/Trans) from Other Curr vs Prop
PCES/EAS Supervisory Workhour Savings from Other Curr vs Prop
Transportation Savings
Maintenance Savings
Space Savings
Total Annual Savings
Total One-Time Costs
Total First Year Savings
Staffing Positions
Craft Position Loss
PCES/EAS Position Loss
Volume
Service
rev 10/15/2009
Total FHP to be Transferred (Average Daily Volume)
Current FHP at Gaining Facility (Average Daily Volume)
Losing Facility Cancellation Volume (Average Daily Volume) (= Total TPH / Operating Days)
Service Standard Impacts by ADV
UPGRADED DOWNGRADEDUnchanged +
Upgrades
Package Page 3 AMP Executive Summary

Losing Facility Name and Type:Current 3D ZIP Code(s):
Type of Distribution to Consolidate:
Gaining Facility Name and Type:Current 3D ZIP Code(s):
8/23/2012 10:06
rev 06/10/2009
September 6, 2012
300, 301
Originating
Summary NarrativeLast Saved:
Atlanta P&DC
North Metro P&DC
302-303, 311, 399
BACKGROUND The Area Mail Processing (AMP) study has been completed for the Atlanta District to determinethe feasibility of relocating the originating mail volume from Atlanta, GA P&DC (302-303, 311, and 399) to North Metro, GA P&DC (300-301 and 305-306) for cancellation. Currently, the Atlanta P&DC is an owned facility that processes all outgoing and incoming mail inthe 302-303, 311, and 399 ZIP ranges Mon-Fri. Along with the processing operations, the Atlanta facility houses administrative offices, a Business Mail Entry Unit (BMEU), and a Customer Service Retail Unit. The Atlanta P&DC is approximately 35 miles from the North Metro P&DC.With the approved AMP, all of Atlanta’s originating mail volume would be cancelled at the NorthMetro facility. The North Metro P&DC is an owned facility that processes all outgoing and incoming mail in the300-301 ZIP ranges daily along with Atlanta’s mail on Saturday. Administrative offices, a BMEU, and a Customer Service Retail Unit are also located at North Metro P&DC. Athens SCF 305-306 ZIP ranges are AMP’d daily into North Metro P&DC for cancellation as a result of an approved AMP study of August 2009. The SCF 305-306 Delivery Point Sequenced (DPS) volumes are completed by the Athens Plant. Athens is located 52 miles northeast of the North Metro P&DC. Once the AMP has been implemented, additional savings can be realized with the implementation of the proposed 2014 Service Standard Change. The additional floor space at the Atlanta P&DC created by the removal of the AFCS machines, will allow destinating volumes for SCF 301 to be moved from the North Metro facility to the Atlanta P&DC. This will create savings in transportation mileage as well as travel time to and from the SCF 301 Customer Service units. With the removal of SCF 301 from the North Metro P&DC into the Atlanta P&DC, there will be sufficient resources to absorb SCF 305-306 plant operations into the North Metro facility from the Athens Plant. Significant savings will be realized in transportation mileage as well as travel time to and from the SCF 305 Customer Service units when consolidated into North Metro P&DC. At that time, the Athens plant operations will collapse leaving only retail and delivery operations. Athens will then become a true Customer Service facility. If the 2014 Service Standard Change goes into effect and overnight service is virtually eliminated, established transportation created for outgoing overnight mail processing back to Atlanta P&DC from North Metro can be eliminated for additional savings. FINANCIAL SUMMARY The annual baseline data for this AMP feasibility study is taken from the period of July 1, 2010 –June 30, 2011. Financial savings proposed for the consolidation of an average daily volume of896,161 FHP from the Atlanta P&DC into the North Metro P&DC are outlined below; however, PVS transportation savings are reflective of July 2012 annualized. This data analysis is further addressed in the Transportation section of this narrative. Additionally, an adjustment has been made to the North Metro F1 workhour savings to account for the Atlanta Saturday consolidation not included in the baseline data.
Total First Year Savings: $6,511,866 Total Annual Savings: $7,744,304 One Time Costs: $1,232,438
A one-time cost of $1,232,438 will be incurred for the relocation of and site prep for mailprocessing equipment transferred to the North Metro P&DC and the projected support costs.
Package Page 4 AMP Summary Narrative

rev 06/10/2009
Summary Narrative (continued)
Summary Narrative Page 2
CUSTOMER SERVICE IMPACTS BULK MAIL ENTRY UNIT There will be no change to BMEU or Retail Operations at the Atlanta P&DC. RETAIL A proposed modified cancellation postmark for mail processing from North Metro, GA to AtlantaMetro, GA is requested. A local postmark will continue to be available at retail service locations. SERVICE STANDARDS Specific service standard changes associated with this Area Mail Processing consolidation arecontingent upon the resolution of both (a) the rulemaking in which current market dominantproduct service standards in 39 CFR Part 121 are being evaluated, and (b) all remaining AMPconsolidation proposals that are part of the same network rationalization initiative. A complete filereflecting any new service standards will be published at www.usps.com once all of the related AMP decisions that provide the foundation for new service standards are made. Priority andExpress Mail service standards will be based upon the capability of the network. EMPLOYEE IMPACTS In this feasibility study, 1,073 craft employees and 64 management positions will be impacted at the Atlanta P&DC. With the AMP implementation, there will be a net reduction of thirty-four (34)craft positions and eight (8) management positions. The total Function 1 savings from craft impacts is projected to be $3,852,902.
Current On-Rolls
Proposed Diff Current On-Rolls
Proposed Diff
Craft 1,073 941 (132) 978 1,076 98 (34)Management 64 56 (8) 63 70 7 (1)
Atlanta North Metro
Management and Craft Staffing Impacts
Net Diff
SDOs to Craft MDOs+SDOs to Craft SDOs to Craft MDOs+SDOs to Craft
(1:25 target) (1:22 target) (1:25 target) (1:22 target)
Atlanta 1 : 23 1 : 20 1 : 25 1 : 22
North Metro 1 : 25 1 : 23 1 : 25 1 : 23
Mail Processing Management to Craft Ratio
Management to Craft 2 Ratios
Current Proposed
As a matter of policy, the Postal Service follows the Worker Adjustment and RetrainingNotification Act's ("WARN") notification requirements when the number of employeesexperiencing an employment loss within the meaning of WARN would trigger WARN'srequirements. Some or all of the impacted employees described above may not experience anemployment loss within the meaning of WARN due to transfers or reassignments. MAINTENANCE IMPACTS The AMP feasibility study projects an annual Maintenance savings of $728,414. Equipment identified for relocation from the Atlanta P&DC to support operations at the North Metro P&DCincludes 4 AFCS 200s, 1 LMS, 1 AFSM Flats Canceller and 2 DIOSS kits. One DOISS kit located at the Athens P&DC will also be relocated to North Metro P&DC. The study projects a one-time cost of $1,232,438 for relocating equipment and associated support costs.
Package Page 5 AMP Summary Narrative
rev 06/10/2009
Summary Narrative Page 3
Summary Narrative (continued)
TRANSPORTATION Transportation supporting the Atlanta P&DC is predominately PVS. Due to recent substantialchanges in PVS schedules through Network Rationalization, the data range for current transportation was modified to July 2012 annualized to show a more accurate picture of theexisting transportation network. In support of the AMP, identified PVS runs from the losing installation, Atlanta P&DC, will be modified to travel directly to the gaining installation, North Metro P&DC, resulting in decreased mileage of 208,585. There will be no changes to existing HCR transportation at either facility. Transportation changes would impact Atlanta city zones/stations, finance units or branchesrepresented by SCF 303 North of I-20. Transportation, as well as the dedicated collection routes for these Atlanta city offices, would bring collection mail directly into the North Metro P&DC forcancellation. Collection mail for Atlanta city stations/branches and SCF 302 post offices/branches South of I-20, approximately 55 offices, would continue to flow into the Atlanta P&DC for cross-dock transfer to North Metro P&DC. This requires modification of transportation to meet the CET at the gaining installation North Metro P&DC. Existing transportation provided for Atlanta L&DC will be revamped to fall in line with the new network. If the Atlanta AMP project is approved, the total estimated transportation savings to the postalservice is $3,476,690 annually. An outline of the transportation changes associated with AMP implementation is as follows: ATLANTA P&DC
SCF 303 – Seventeen (17) city station pre-closeout trips will arrive at Atlanta P&DC between 1640 – 1715 to be cross-docked.
SCF 303 – Seventeen (17) city station closeout trips will arrive at Atlanta P&DC between 1805 – 2000 to be cross-docked. SCF 303 – Eighteen (18) city station pre-closeout trips will arrive at North Metro P&DC between 1630 – 1720. SCF 303 – Twenty-one (21) city station closeout trips will arrive at North Metro P&DC between 1850 – 1925. SCF 303 – Thirty (30) city stations will have direct trips to the Atlanta L&DC to minimize platform impacts, enhance productivity of 010 operations, advance Priority to the L&DC, and reduce MVS transportation. Arrival times will be between 1335 – 1700. Atlanta P&DC Tractor Trailer Operators (TTOs), eleven (11)*, will shuttle Priority to Atlanta L&DC thus reducing the need for North Metro TTOs and runs/trips. Departure times will be between 1910 – 2150. Atlanta P&DC will operate four (4) MVS NTFT assignments to North Metro P&DC for raw collection mail to arrive between 1400 – 1700. These assignments can be eliminated if not needed. Atlanta P&DC will operate MVS trips to North Metro P&DC for SCF 302 and SCF 303 offices that do not have direct transportation to North Metro P&DC. These sixteen (16) cross-dock trips will depart between 1620 – 2050.
Package Page 6 AMP Summary Narrative

rev 06/10/2009
Summary Narrative (continued)Summary Narrative Page 4
Thirty-four (34) eight hour Monday-Friday MVS schedules have been reduced to twenty-nine (29) eight hour schedules and seven (7) NTFT schedules. Fifteen (15) eight hour Saturday MVS schedules have been reduced to thirteen (13) eight hour schedules and five (5) NTFT schedules. Analysis of pre/final SCF 302-303 closeout arrival in half-hour increments is also available.
NORTH METRO P&DC
SCF 300-301 – Twenty (20) pre-closeout trips will arrive at North Metro P&DC between 1620 – 1720. SCF 300-301 – Twenty (20) closeout trips will arrive at North Metro P&DC between 1835 – 1935. SCF 300-301 – Sixteen (16) offices will have direct trips to the Atlanta L&DC to minimize platform impacts, enhance productivity of 010 operations, advance Priority to the L&DC, and reduce MVS transportation. Arrival times will be between 1345 – 1825. Twenty-four (24)* TTO North Metro P&DC trips to Atlanta L&DC have been reduced to seventeen (17). Eleven (11), trips as stated above, will be provided by Atlanta P&DC. The remaining six (6) will be provided by North Metro P&DC. North Metro P&DC provided trips will depart between 1605 – 2040. Twenty-eight (28) eight hour Monday-Friday MVS schedules have been reduced to fourteen (14) eight hour schedules and seven (7) NTFT schedules.
Atlanta P&DC Atlanta P&DC Present Schedules Proposed AMP Schedules
8 Hour Schedule 8 Hour Schedule
Freq Annual Hrs # of MVS Total Hrs Freq Annual Hrs # of MVS Total Hrs DLY 2922 2 5,844 DLY 2922 2 5,844 K7 2424 26 63,024 K7 2424 27 65,448 K1 2473 3 7,419 K1 2473 3 7,419 K67 2011 34 68,374 K67 2011 29 58,319 6X 412 15 6,180 6X 412 13 5,356 7X 412 5 2,060 7X 412 5 2,060
Total MVS Annual Hours 152,901 Total MVS Annual Hours 144,446
6/7 Hour Schedule 6/7 Hour Schedule Freq Annual Hrs # of MVS Total Hrs Freq Annual Hrs # of MVS Total Hrs K7 1818 8 14,544 K7 1818 9 16,362
K7 2121 2 4,242 K1 1855 2 3,710 K1 1855 2 3,710
6X 313 5 1,565 7X 313 1 313 7X 313 1 313
Total MVS Annual Hours 18,254 Total MVS Annual Hours 25,879 Total MVS Annual Hours 171,155 Total MVS Annual Hours 170,325
Package Page 7 AMP Summary Narrative

Summary Narrative (continued)Summary Narrative Page 5
Seventeen (17) eight hour Saturday MVS schedules have been reduced to twelve (12) eight hour schedules and two (2) NTFT schedules. *The number of trips can be reduced if necessary upon completion of a one month transportation review. Analysis of pre/final SCF 300-301 closeout arrival in half-hour increments is available.
CONCLUSION/RECOMMENDATION Due to the financial savings, Atlanta District leadership believes this AMP study is warranted. Furthermore, in order to implement other proposed mail processing consolidations, this AMP may be necessary in order to expand processing capacity in Atlanta P&DC. The planned consolidation of the Cartersville DDC and the Douglasville DDC will increase the DBCS inventory in North Metro P&DC by 6. This increase of DBCS machines is necessary to further accommodate the additional outgoing volumes from this AMP. The Atlanta District leadership recommends the implementation of this AMP.
North Metro P&DC North Metro P&DC Present Schedules Proposed AMP Schedules
8 Hour Schedule 8 Hour Schedule
Freq Annual Hrs # of MVS Total Hrs Freq Annual Hrs # of MVS Total Hrs DLY 2922 3 8,766 DLY 2922 3 8,766K7 2424 22 53,328 K7 2424 24 58,176K1 2473 1 2,473 K1 2473 1 2,473
K67 2011 28 56,308 K67 2011 14 28,1546X 412 17 7,004 6X 412 12 4,9447X 412 14 5,768 7X 412 10 4,120
Total MVS Annual Hours 133,647 Total MVS Annual Hours 106,633
6/7 Hour Schedule 6/7 Hour Schedule Freq Annual Hrs # of MVS Total Hrs Freq Annual Hrs # of MVS Total Hrs K7 1818 0 0 K7 1818 0 0K1 1855 0 0 K1 2121 0 0
K67 1509 0 0 K67 1509 7 10,5636X 313 0 0 6X 313 2 6267X 313 0 0 7X 313 0 0
Total MVS Annual Hours 0 Total MVS Annual Hours 11,189Total MVS Annual Hours 133,647 Total MVS Annual Hours 117,822
MVS Current Annual Hrs Total Combined Atlanta & North Metro 304,802
Proposed MVS Annual Hrs Total Combined Atlanta & North Metro 288,147
Package Page 8 AMP Summary Narrative

Losing Facility Name and Type:Current 3D ZIP Code(s):
Type of Distribution to Consolidate:
Gaining Facility Name and Type:Current 3D ZIP Code(s):
rev 04/2/2008
24 Hour ClockLast Saved:
Atlanta P&DC
North Metro P&DC
302-303, 311, 399
September 6, 2012
300, 301
Originating
Weekl
y T
rends
Begin
nin
g D
ay
Faci
lity
Canc
elle
d b
y 20
00
Data
Sou
rce =
ED
W M
CR
S
OG
P C
lear
ed
by
2300
Dat
a S
ourc
e =
ED
W E
OR
OG
S C
lear
ed
by
2400
Dat
a S
ourc
e =
ED
W E
OR
MM
P C
leare
d b
y 24
00
Dat
a S
ourc
e =
ED
W E
OR
MM
P V
olu
me O
n H
and
at 24
00
Data
Sou
rce =
ED
W M
CR
S
Ass
igne
d C
om
merc
ial /
FedE
x B
y 023
0D
ata
Sourc
e =
ED
W S
AS
S
DP
S 2
nd
Pass
Cle
are
d b
y 070
0D
ata S
ourc
e =
ED
W E
OR
Trips
On-T
ime
040
0 -
0900
Data
Sou
rce =
ED
W T
IME
S
%
2-Oct SAT 10/2 ATLANTA P&DC 73.1% 89.2% 89.4% 93.6% 0.9 90.5% 99.2% 70.8%9-Oct SAT 10/9 ATLANTA P&DC 70.3% 91.4% 85.4% 87.4% 0.8 87.2% 98.2% 77.2%
16-Oct SAT 10/16 ATLANTA P&DC 79.8% 93.8% 87.0% 91.9% 0.9 97.3% 99.8% 77.8%23-Oct SAT 10/23 ATLANTA P&DC 70.1% 91.8% 90.2% 89.4% 0.4 93.2% 98.8% 81.3%30-Oct SAT 10/30 ATLANTA P&DC 73.7% 91.8% 89.8% 91.4% 0.3 96.0% 99.5% 76.6%6-Nov SAT 11/6 ATLANTA P&DC 68.7% 86.0% 90.3% 90.2% 0.4 91.8% 98.7% 80.9%
13-Nov SAT 11/13 ATLANTA P&DC 65.8% 89.1% 88.2% 91.3% 0.2 96.6% 99.7% 83.7%20-Nov SAT 11/20 ATLANTA P&DC 78.2% 87.4% 87.3% 89.6% 0.6 96.8% 97.4% 78.0%27-Nov SAT 11/27 ATLANTA P&DC 66.3% 87.2% 91.2% 90.4% 0.4 97.7% 99.3% 79.0%4-Dec SAT 12/4 ATLANTA P&DC 64.2% 79.5% 77.4% 91.4% 0.7 89.9% 96.8% 59.4%
11-Dec SAT 12/11 ATLANTA P&DC 62.3% 75.6% 72.6% 89.7% 0.3 84.3% 94.8% 48.7%18-Dec SAT 12/18 ATLANTA P&DC 63.9% 88.1% 89.3% 89.6% 0.3 95.7% 99.6% 62.9%25-Dec SAT 12/25 ATLANTA P&DC 70.1% 93.0% 90.8% 84.3% 0.1 98.7% 99.8% 78.1%
1-Jan SAT 1/1 ATLANTA P&DC 69.0% 89.1% 91.0% 91.2% 0.3 94.6% 98.5% 69.7%8-Jan SAT 1/8 ATLANTA P&DC 60.2% 82.9% 90.4% 93.2% 0.4 96.1% 94.5% 39.8%
15-Jan SAT 1/15 ATLANTA P&DC 60.1% 83.1% 84.9% 90.5% 1.8 97.0% 95.6% 59.1%22-Jan SAT 1/22 ATLANTA P&DC 67.8% 87.2% 91.0% 92.6% 0.5 96.2% 99.7% 71.4%29-Jan SAT 1/29 ATLANTA P&DC 67.0% 90.5% 87.1% 91.5% 0.8 96.5% 99.9% 74.4%5-Feb SAT 2/5 ATLANTA P&DC 72.1% 92.9% 68.2% 87.2% 0.3 93.9% 100.0% 69.4%
12-Feb SAT 2/12 ATLANTA P&DC 89.4% 94.1% 82.0% 84.4% 0.2 97.1% 99.4% 69.0%19-Feb SAT 2/19 ATLANTA P&DC 70.4% 91.5% 80.6% 83.4% 0.1 97.6% 99.5% 78.6%
2-Oct SAT 10/2 NORTH METRO 56.9% 87.2% 87.6% 99.2% 0.0 97.1% 95.9% 50.6%9-Oct SAT 10/9 NORTH METRO 55.2% 87.8% 93.5% 91.1% 0.0 97.0% 93.9% 55.9%
16-Oct SAT 10/16 NORTH METRO 63.4% 95.5% 92.1% 95.9% 0.1 98.8% 96.5% 69.3%23-Oct SAT 10/23 NORTH METRO 57.4% 92.8% 95.7% 93.2% 1.6 99.4% 98.2% 52.4%30-Oct SAT 10/30 NORTH METRO 64.3% 94.6% 92.4% 94.6% 0.0 98.6% 98.9% 56.0%6-Nov SAT 11/6 NORTH METRO 52.2% 89.7% 88.3% 90.9% 0.3 96.1% 96.9% 47.6%
13-Nov SAT 11/13 NORTH METRO 54.8% 96.1% 94.9% 95.8% 0.6 98.0% 98.1% 58.3%20-Nov SAT 11/20 NORTH METRO 61.9% 94.6% 90.5% 95.0% 0.0 97.0% 96.6% 78.5%27-Nov SAT 11/27 NORTH METRO 55.9% 87.4% 88.0% 96.3% 0.0 96.7% 97.7% 69.7%4-Dec SAT 12/4 NORTH METRO 51.4% 81.0% 82.4% 96.2% #VALUE! 94.7% 98.2% 62.5%
11-Dec SAT 12/11 NORTH METRO 51.5% 74.4% 69.8% 93.1% #VALUE! 81.7% 94.1% 45.7%18-Dec SAT 12/18 NORTH METRO 60.2% 79.7% 74.2% 84.3% #VALUE! 92.4% 94.5% 51.9%25-Dec SAT 12/25 NORTH METRO 66.7% 93.3% 89.9% 87.5% 1.1 95.9% 99.7% 77.9%
1-Jan SAT 1/1 NORTH METRO 58.5% 86.7% 78.8% 91.4% 1.3 97.5% 99.9% 66.9%8-Jan SAT 1/8 NORTH METRO 36.9% 75.3% 71.0% 91.0% 0.9 95.0% 92.5% 65.9%
15-Jan SAT 1/15 NORTH METRO 54.8% 79.8% 80.2% 91.0% 5.1 95.0% 99.0% 88.1%22-Jan SAT 1/22 NORTH METRO 79.6% 84.5% 83.4% 88.4% #VALUE! 93.9% 97.7% 61.0%29-Jan SAT 1/29 NORTH METRO 71.1% 87.7% 86.1% 88.7% 0.2 95.2% 100.0% 89.9%5-Feb SAT 2/5 NORTH METRO 63.4% 90.0% 92.9% 82.7% 1.0 97.3% 99.6% 78.8%
12-Feb SAT 2/12 NORTH METRO 69.0% 95.7% 95.2% 75.4% #VALUE! 96.4% 99.1% 80.1%19-Feb SAT 2/19 NORTH METRO 63.8% 91.9% 90.2% 76.4% 0.3 99.3% 99.2% 82.0%
Package Page 9 AMP 24 Hour Clock

Last Saved:
Losing Facility Name and Type:Current 3D ZIP Code(s):
Miles to Gaining Facility:
Gaining Facility Name and Type:Current 3D ZIP Code(s):
rev 03/20/2008
300, 301
MAP
Atlanta P&DC
North Metro P&DC
302-303, 311, 399
September 6, 2012
33.1
Package Page 10 AMP MAP

Overnight % Change % Change Total % Change All % Change All % Change % Change All % Change All % Change
UPGRADE 0.0% 0.0% 0.0% 0.0% 0.0% 0.0% 5.8% 0.1%
DOWNGRADE 0.0% 0.0% 0.0% 0.0% 0.0% 0.0% 41.0% 0.7%
TOTAL 0.0% 0.0% 0.0% 0.0% 0.0% 0.0% 46.8% 0.8%
NET UP+NO CHNG 0.0% 0.0% 0.0% 0.0% 0.0% 0.0% -35.2% -0.6%
VOLUME TOTAL
* - Periodical and Standard mail origin 3-digit ZIP Code to destination 3-digit ZIP Code volume is not available
Overnight % Change All Others % Change Total % Change All % Change All % Change All % Change All % Change All % Change
UPGRADE 0 0.0% 0 0.0% 0 0.0% 0 0.0% 0 0.0% 28 1.5% 8 0.4% 36 0.4%
DOWNGRADE 0 0.0% 0 0.0% 0 0.0% 0 0.0% 0 0.0% 16 0.9% 16 0.9% 32 0.3%
TOTAL 0 0.0% 0 0.0% 0 0.0% 0 0.0% 0 0.0% 44 2.4% 24 1.3% 68 0.7%
NET 0 0.0% 0 0.0% 0 0.0% 0 0.0% 0 0.0% 12 0.7% (8) -0.4% 4 0.1%
Atlanta P&DC
302-303, 311, 399300, 301Gaining Facility 3D ZIP Code(s):
Service Standard Changes - PairsFCM PRI
PSVC
Service Standard Changes - Average Daily Volume (data obtained from ODIS is derived from sampling and may vary from actual volume)
PSVC ALL CLASSES
rev 10/16/2009
Losing Facility 3D ZIP Code(s):
9/5/2012
Selected summary fields are transferred to the Executive Summary
PER STD
September 6, 2012
Losing Facility:
Service Standard Impacts
PRI ALL CLASSESSTD *FCM PER *
Based on report prepared by Network Integration Support dated:
Last Saved:
Package Page 11 AMP Service Standard Impacts

Last Saved: Stakeholder Notification Page 1
AMP Event: Start of Study
Oct. 8, 2009Date
Oct. 8, 2009Date
Oct. 8, 2009Date
Oct. 8, 2009Date
Oct. 8, 2009Date
Oct. 8, 2009Date
Oct. 8, 2009Date
Oct. 8, 2009Date
Oct. 8, 2009Date
Oct. 8, 2009Date
Oct. 8, 2009Date
Oct. 8, 2009Date
Oct. 8, 2009Date
Oct. 8, 2009Date
Oct. 8, 2009Date
Oct. 8, 2009Date
Oct. 8, 2009Date
Oct. 8, 2009Date
Oct. 8, 2009Date
Oct. 8, 2009Date
Oct. 8, 2009Date
rev 07/16/2008
Media
The Honorable David Aldeman(Contact Person)
United States Senate(Title/Office)
The Honorable Vincent Fort(Contact Person)
United States Senate(Title/Office)
The Honorable Horacena Tate(Contact Person)
United States Senate(Title/Office)
The Honorable Kasim Reed(Contact Person)
United States Senate(Title/Office)
The Honorable Nan Orrock(Contact Person)
United States Senate(Title/Office)
The Honorable David Scott(Contact Person)
Member of Congress(Title/Office)
The Honorable David Scott(Contact Person)
Member of Congress(Title/Office)
The Honorable John Lewis(Contact Person)
Member of Congress(Title/Office)
The Honorable Lynn Westmoreland(Contact Person)
Member of Congress(Title/Office)
The Honorable Johnny Isakson(Contact Person)
United States Senate(Title/Office)
Government Officials
The Honorable Saxby Chambliss(Contact Person)
United States Senate(Title/Office)
(Contact Person)President APWU - Marietta(Title/Union)
President NAPS(Title/Union)
President APWU - Decatur(Title/Union)
Prsident NAPUS(Title/Union)
President APWU Local 310(Title/Union)
President APWU Local 32(Title/Union)
Presdient NLPM(Title/Union)
(Method)
Newsbreak(Method)
Employee Organizations
Employees
ATL PDC (Method)
NM PDC
Stakeholders Notification Losing Facility:
September 6, 2012(WorkBook Tab Notification - 1)
Atlanta P&DC
Package Page 12 AMP Stakeholders Notification

Stakeholder Notification Page 2
AMP Event: Start of Study
Oct. 8, 2009Date
Oct. 8, 2009Date
Oct. 8, 2009Date
Oct. 8, 2009Date
Oct. 8, 2009Date
Oct. 8, 2009Date
Oct. 8, 2009Date
rev 07/16/2008
Julia Wallace - Managing Editor(Contact Person)
Atlanta Journal-Constitution(Company Name)
Ellen Crooke - News Director(Contact Person)
WXIA CH 11(Company Name)
Budd McEntee - News Director(Contact Person)
WAGA Fox 5(Company Name)
Matt Cook - News Director(Contact Person)
WGST Radio(Company Name)
Steve Schwaid - News Director(Contact Person)
WGCL CH 46(Company Name)
Marian Pittman - News Director(Contact Person)
WSB TV(Company Name)
Chris Camp - News Director(Contact Person)
WSB Radio(Company Name)
Stakeholders Notification (continued)(WorkBook Tab Notification - 1)
Losing Facility: Atlanta P&DC
Package Page 13 AMP Stakeholders Notification

Last Saved:
07/01/10 <<=== : ===>> 06/30/11
LDC LDC LDC LDC
11 $43.15 41 $37.06 11 $44.29 41 $0.00
12 $46.35 42 $0.00 12 $45.63 42 $0.00
13 $44.88 43 $0.00 13 $43.17 43 $22.92
14 $43.58 44 $34.62 14 $45.72 44 $0.00
15 $36.89 45 $0.00 15 $38.06 45 $0.00
16 $0.00 46 $0.00 16 $0.00 46 $0.00
17 $42.78 47 $0.00 17 $42.10 47 $0.00
18 $43.94 48 $36.21 18 $41.69 48 $37.30
(1) (2) (3) (4) (5) (6) (7) (8) (9) (10) (11) (12) (13) (14)Current Current Current Current Current Current Current Current Current Current Current Current
Operation Annual FHP Annual TPH or Annual Productivity Annual Operation Annual FHP Annual TPH or Annual Productivity AnnualNumbers Volume NATPH Volume Workhours (TPH or NATPH) Workhour Costs Numbers Volume NATPH Volume Workhours (TPH or NATPH) Workhour Costs
010 100.0% $180,242 \ ] 010 $432,325011 100.0% $388 \ ] 011 $0012 100.0% $0 \ ] 012 $337014 100.0% $111 \ ] 014 $0015 100.0% $231,787 \ ] 015 $727,320016 100.0% $589 \ ] 016 $206017 100.0% $1,137,903 \ ] 017 $1,716,218018 100.0% $150,031 \ ] 018 $38,771020 100.0% $181 \ ] 020 $109,491021 100.0% $25 \ ] 021 $0022 100.0% $0 \ ] 022 $0030 98.0% $1,354,166 \ ] 030 $1,789,589040 98.0% $268,377 \ ] 040 $140,376060 98.0% $626,471 \ ] 060 $377,732066 100.0% $14,927 \ ] 066 $8,666067 100.0% $1,961 \ ] 067 $3,595070 98.0% $97,866 \ ] 070 $63,417082 100.0% $2,582 \ ] 082 $0092 100.0% $5 \ ] 092 $99,749093 100.0% $25 \ ] 093 $173,100096 100.0% $2 \ ] 096 $5,521097 100.0% $169 \ ] 097 $97,722100 100.0% $363 \ ] 100 $0210 10.0% $3,256,748 \ ] 210 $2,603,482211 10.0% $900 \ ] 211 $0212 10.0% $96,880 \ ] 212 $203,882229 20.0% $1,909,127 \ ] 229 $3,011,212230 20.0% $105,157 \ ] 230 $440,304231 20.0% $1,996,908 \ ] 231 $3,114,466261 100.0% $104 \ ] 261 $10,674271 100.0% $552,074 \ ] 271 $528,656281 100.0% $54,458 \ ] 281 $222,749282 100.0% $347,614 \ ] 282 $215,587331 58.5% $1,856,820 \ ] 141 $67,452332 58.5% $198,776 \ ] 142 $3,700381 100.0% $19,764 \ ] 481 $247,648468 100.0% $0 \ ] 468 $0481 100.0% $504,125 \ ] 481dup628 38.0% $921,664 \ ] 628 $0891 52.0% $682,360 \ ] 891 $374,337
September 6, 2012
Workhour Costs - Current
Atlanta P&DC North Metro P&DC
Losing Current Workhour Rate by LDC
Function 4Function 1
% Moved to Losing
% Moved to Gaining
Losing Facility: Gaining Facility:
Date Range of Data:
Function 1
Gaining Current Workhour Rate by LDC
Function 4
Package Page 14 AMP Workhour Costs - Current

(1) (2) (3) (4) (5) (6) (7) (8) (9) (10) (11) (12) (13) (14)Current Current Current Current Current Current Current Current Current Current Current Current
Operation Annual FHP Annual TPH or Annual Productivity Annual Operation Annual FHP Annual TPH or Annual Productivity AnnualNumbers Volume NATPH Volume Workhours (TPH or NATPH) Workhour Costs Numbers Volume NATPH Volume Workhours (TPH or NATPH) Workhour Costs
% Moved to Losing
% Moved to Gaining
892 52.0% $95,355 \ ] 892 $266,946961 100.0% $252 \ ] 481dup002 $771,563 \ ] 002 $0003 $112 \ ] 003 $0006 $3 \ ] 006 $0007 $9 \ ] 007 $0035 $1,396,047 \ ] 035 $0043 $0 \ ] 043 $449,582044 $208,747 \ ] 044 $1,099,189073 $523 \ ] 073 $810,195074 $154,216 \ ] 074 $1,291,607110 $37 \ ] 110 $0111 $21,514 \ ] 111 $0112 $496,191 \ ] 112 $504,935114 $355,547 \ ] 114 $7,469115 $1,381 \ ] 115 $0117 $71 \ ] 117 $229,004120 $898 \ ] 120 $235,166121 $2,988 \ ] 121 $0122 $210,964 \ ] 122 $1,226123 $670 \ ] 123 $0124 $150 \ ] 124 $940,979125 $1,786 \ ] 125 $90,073126 $2,570,387 \ ] 126 $1,926,152127 $104 \ ] 127 $15,112128 $2,006 \ ] 128 $0132 $389,115 \ ] 132 $0134 $6,565 \ ] 134 $123,598135 $886 \ ] 135 $0136 $2,338,696 \ ] 136 $412,039137 $8,522 \ ] 137 $0139 $106,493 \ ] 139 $54150 $738,899 \ ] 150 $0160 $157,104 \ ] 160 $0168 $879,617 \ ] 168 $0169 $854,119 \ ] 169 $0170 $877,294 \ ] 170 $0178 $414,796 \ ] 178 $0179 $3,889 \ ] 179 $0180 $532,906 \ ] 180 $750,433181 $1,046,002 \ ] 181 $788,620185 $779,336 \ ] 185 $436,440186 $44,160 \ ] 186 $594,305208 $342 \ ] 208 $0233 $66,860 \ ] 233 $144,572234 $109,933 \ ] 234 $0235 $53,687 \ ] 235 $0238 $257 \ ] 238 $0240 $0 \ ] 240 $0263 $210,476 \ ] 263 $0264 $192 \ ] 264 $117,332265 $43,799 \ ] 265 $0267 $2,990 \ ] 267 $0274 $74 \ ] 274 $37275 $53 \ ] 275 $0283 $160 \ ] 283 $9,512285 $211 \ ] 285 $0320 $462 \ ] 320 $0322 $470 \ ] 322 $0329 $232 \ ] 329 $0
Package Page 15 AMP Workhour Costs - Current

(1) (2) (3) (4) (5) (6) (7) (8) (9) (10) (11) (12) (13) (14)Current Current Current Current Current Current Current Current Current Current Current Current
Operation Annual FHP Annual TPH or Annual Productivity Annual Operation Annual FHP Annual TPH or Annual Productivity AnnualNumbers Volume NATPH Volume Workhours (TPH or NATPH) Workhour Costs Numbers Workhour Costs
% Moved to Losing
% Moved to Gaining
333 $485,872 \ ] 333 $0334 $200,299 \ ] 334 $0335 $478,613 \ ] 335 $0336 $2,284,269 \ ] 336 $0337 $20,845 \ ] 337 $0340 $2,150 \ ] 340 $110,582341 $85,433 \ ] 341 $123,236385 $240 \ ] 385 $0483 $428 \ ] 483 $33,100484 $124 \ ] 484 $94,729486 $0 \ ] 486 $0487 $0 \ ] 487 $0488 $19,803 \ ] 488 $0489 $0 \ ] 489 $0495 $327 \ ] 495 $0549 $483,548 \ ] 549 $439,384554 $527,207 \ ] 554 $103,807555 $214,706 \ ] 555 $4,141560 $232,694 \ ] 560 $259,949561 $204 \ ] 561 $0562 $73 \ ] 562 $0563 $298 \ ] 563 $0564 $23,605 \ ] 564 $0565 $194,721 \ ] 565 $1,998,319585 $150,568 \ ] 585 $418,101586 $45,376 \ ] 586 $1,212587 $16,821 \ ] 587 $0588 $743 \ ] 588 $0603 $270,905 \ ] 603 $16,324607 $135,604 \ ] 607 $220,439612 $56,353 \ ] 612 $90,030620 $158 \ ] 620 $0629 $355,112 \ ] 629 $1,224,252630 $51,600 \ ] 630 $171677 $43,182 \ ] 677 $372,349776 $14,189 \ ] 776 $118,770793 $659,741 \ ] 793 $0864 $74 \ ] 864 $0893 $2,186,838 \ ] 893 $3,544,880894 $9,602 \ ] 894 $3,044,424895 $89,641 \ ] 895 $0896 $185,150 \ ] 896 $708,211897 $2,199,460 \ ] 897 $0898 $84 \ ] 898 $0918 $5,608,430 \ ] 918 $7,166,156919 $402,077 \ ] 919 $543,741930 $278,829 \ ] 930 $0965 $541 \ ] 965 $0
\ ] 009 $0\ ] 050 $11\ ] 055 $23,409\ ] 083 $349,380\ ] 084 $152,970\ ] 087 $125,918\ ] 088 $7,509\ ] 089 $16,144\ ] 090 $812\ ] 091 $263,892\ ] 094 $6,173\ ] 095 $3,508
Package Page 16 AMP Workhour Costs - Current
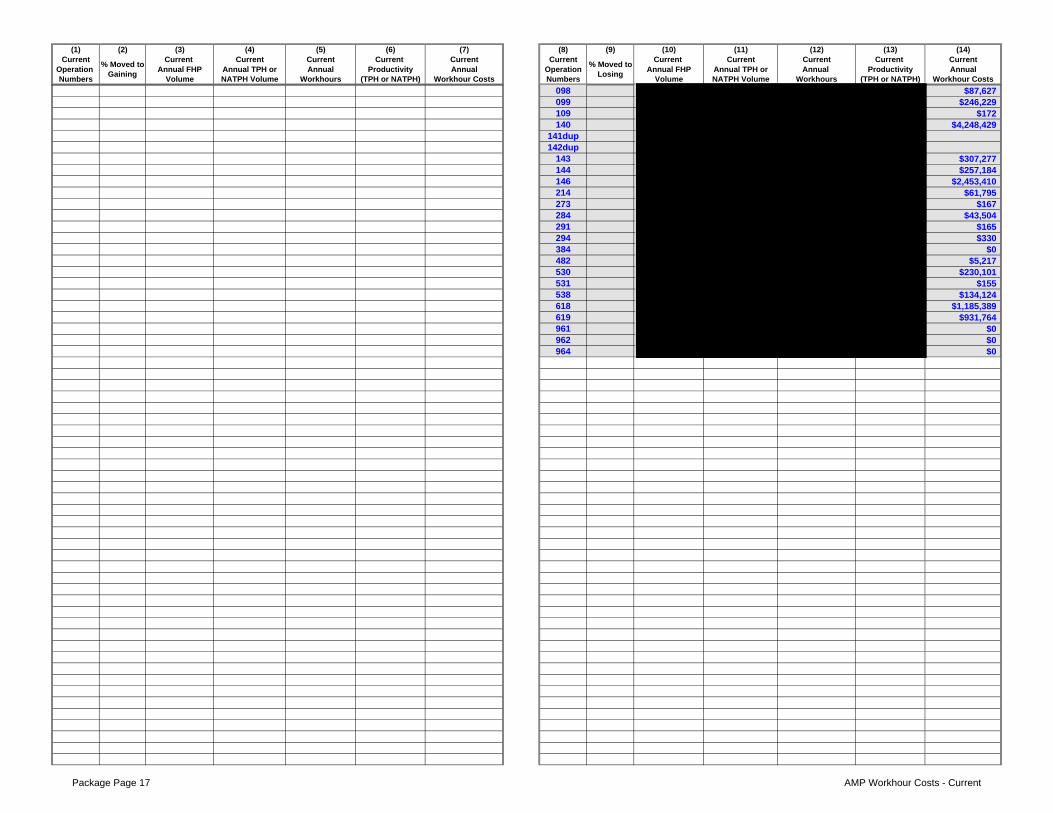
(1) (2) (3) (4) (5) (6) (7) (8) (9) (10) (11) (12) (13) (14)Current Current Current Current Current Current Current Current Current Current Current Current
Operation Annual FHP Annual TPH or Annual Productivity Annual Operation Annual FHP Annual TPH or Annual Productivity AnnualNumbers Volume NATPH Volume Workhours (TPH or NATPH) Workhour Costs Numbers Volume NATPH Volume Workhours (TPH or NATPH) Workhour Costs
% Moved to Losing
% Moved to Gaining
\ ] 098 $87,627\ ] 099 $246,229\ ] 109 $172\ ] 140 $4,248,429\ ] 141dup\ ] 142dup\ ] 143 $307,277\ ] 144 $257,184\ ] 146 $2,453,410\ ] 214 $61,795\ ] 273 $167\ ] 284 $43,504\ ] 291 $165\ ] 294 $330\ ] 384 $0\ ] 482 $5,217\ ] 530 $230,101\ ] 531 $155\ ] 538 $134,124\ ] 618 $1,185,389\ ] 619 $931,764\ ] 961 $0\ ] 962 $0\ ] 964 $0\ ]\ ]\ ]\ ]\ ]\ ]\ ]\ ]\ ]\ ]\ ]\ ]\ ]\ ]\ ]\ ]\ ]\ ]\ ]\ ]\ ]\ ]\ ]\ ]\ ]\ ]\ ]\ ]\ ]\ ]\ ]\ ]\ ]\ ]\ ]\ ]
Package Page 17 AMP Workhour Costs - Current

(1) (2) (3) (4) (5) (6) (7) (8) (9) (10) (11) (12) (13) (14)Current Current Current Current Current Current Current Current Current Current Current Current
Operation Annual FHP Annual TPH or Annual Productivity Annual Operation Annual FHP Annual TPH or Annual Productivity AnnualNumbers Volume NATPH Volume Workhours (TPH or NATPH) Workhour Costs Numbers Volume NATPH Volume Workhours (TPH or NATPH) Workhour Costs
% Moved to Losing
% Moved to Gaining
\ ]\ ]\ ]\ ]\ ]\ ]\ ]\ ]\ ]\ ]\ ]\ ]\ ]\ ]\ ]\ ]\ ]\ ]\ ]\ ]\ ]\ ]\ ]\ ]\ ]\ ]\ ]\ ]\ ]\ ]\ ]\ ]\ ]\ ]\ ]\ ]\ ]\ ]\ ]\ ]\ ]\ ]\ ]\ ]\ ]\ ]\ ]\ ]\ ]\ ]\ ]\ ]\ ]\ ]\ ]\ ]\ ]\ ]\ ]\ ]
Package Page 18 AMP Workhour Costs - Current

(1) (2) (3) (4) (5) (6) (7) (8) (9) (10) (11) (12) (13) (14)Current Current Current Current Current Current Current Current Current Current Current Current
Operation Annual FHP Annual TPH or Annual Productivity Annual Operation Annual FHP Annual TPH or Annual Productivity AnnualNumbers Volume NATPH Volume Workhours (TPH or NATPH) Workhour Costs Numbers Volume NATPH Volume Workhours (TPH or NATPH) Workhour Costs
% Moved to Losing
% Moved to Gaining
\ ]\ ]\ ]\ ]\ ]\ ]\ ]\ ]\ ]\ ]\ ]\ ]\ ]\ ]\ ]\ ]\ ]\ ]\ ]\ ]\ ]\ ]\ ]\ ]\ ]\ ]\ ]\ ]\ ]\ ]
Moved to Gain 347,358,100 757,333,223 383,453 1,975 $16,667,258 Impact to Gain 408,692,595 983,736,633 398,836 2,467 $17,095,228Impact to Lose 0 0 0 No Calc $0 Moved to Lose 0 0 0 No Calc $0Total Impact 347,358,100 757,333,223 383,453 1,975 $16,667,258 Total Impact 408,692,595 983,736,633 398,836 2,467 $17,095,228Non-impacted 1,252,475,190 3,565,620,054 776,180 4,594 $33,881,044 Non-impacted 1,113,426,699 2,811,547,356 726,376 3,871 $31,613,940
Gain Only 137,066,335 449,401,292 256,734 1,750 $11,142,765All 1,599,833,290 4,322,953,277 1,159,633 3,728 $50,548,302 All 1,659,185,629 4,244,685,281 1,381,946 3,072 $59,851,934
Impact to Gain 756,050,695 1,741,069,856 782,289 2,226 $33,762,487Impact to Lose 0 0 0 No Calc $0Total Impact 756,050,695 1,741,069,856 782,289 2,226 $33,762,487Non-impacted 2,365,901,889 6,377,167,410 1,502,556 4,244 $65,494,984
Gain Only 137,066,335 449,401,292 256,734 1,750 $11,142,765All 3,259,018,919 8,567,638,558 2,541,579 3,371 $110,400,236
.
rev 06/11/2008
Comb Totals
Totals Totals
(This number is carried forward to AMP Worksheet Executive Summary )
Combined Current Workhour Annual Workhour Costs :
896,161 Total FHP to be Transferred (Average Daily Volume) :
(This number is carried forward to the bottom of AMP Worksheet Workhour Costs-Proposed )$110,400,236
Current FHP at Gaining Facility (Average Daily Volume) : 5,352,212 (This number is carried forward to AMP Worksheet Executive Summary )
Package Page 19 AMP Workhour Costs - Current

Last Saved:
Losing Facility: Gaining Facility:
(1) (2) (3) (4) (5) (6) (7) (8) (9) (10) (11) (12)Proposed Proposed Proposed Proposed Proposed Proposed Proposed Proposed Proposed Proposed Proposed ProposedOperation Annual FHP Annual TPH or Annual Productivity Annual Operation Annual FHP Annual TPH or Annual Productivity AnnualNumbers Volume NATPH Volume Workhours (TPH or NATPH) Workhour Costs Numbers Volume NATPH Volume Workhours (TPH or NATPH) Workhour Costs
010 $0 010 $609,712011 $0 011 $0012 $0 012 $337014 $0 014 $109015 $0 015 $955,435016 $0 016 $786017 $0 017 $2,836,096018 $0 018 $186,425020 $0 020 $109,670021 $0 021 $25022 $0 022 $0030 $27,083 P 030 $2,611,886040 $5,368 P 040 $342,053060 $12,529 P 060 $466,337066 $0 066 $18,169067 $0 067 $4,936070 $1,957 P 070 $85,504082 $0 082 $0092 $0 092 $99,749093 $0 093 $173,100096 $0 096 $5,521097 $0 097 $97,722100 $0 100 $0210 $2,931,073 P 210 $2,766,461211 $810 P 211 $45212 $87,192 P 212 $208,730229 $1,527,301 P 229 $3,386,989230 $84,126 P 230 $461,003231 $1,597,526 P 231 $3,314,330261 $0 261 $10,698271 $0 271 $833,244281 $0 281 $273,881282 $0 282 $234,679331 $770,580 P 141 $437,940332 $82,492 P 142 $118,199381 $0 481 $581,708468 $0 468 $0481 $0 481dup $0628 $571,431 P 628 $143,668891 $327,533 P 891 $560,782892 $45,770 P 892 $291,222961 $0 481dup $0002 $771,563 002 $0003 $112 003 $0006 $0 006 $0007 $0 007 $0035 $1,396,047 035 $0043 $0 043 $449,582044 $208,747 044 $1,099,189
Workhour Costs - Proposed
Atlanta P&DC
September 6, 2012
North Metro P&DC
Package Page 20 AMP Workhour Costs - Proposed

(1) (2) (3) (4) (5) (6) (7) (8) (9) (10) (11) (12)Proposed Proposed Proposed Proposed Proposed Proposed Proposed Proposed Proposed Proposed Proposed ProposedOperation Annual FHP Annual TPH or Annual Productivity Annual Operation Annual FHP Annual TPH or Annual Productivity AnnualNumbers Workhour Costs Numbers Volume NATPH Volume Workhours (TPH or NATPH) Workhour Costs
073 $523 073 $810,195074 $154,216 074 $1,291,607110 $37 110 $0111 $21,514 111 $0112 $496,191 112 $504,935114 $355,547 114 $7,469115 $1,381 115 $0117 $71 117 $229,004120 $898 120 $235,166121 $2,988 121 $0122 $210,964 122 $1,226123 $670 123 $0124 $150 124 $940,979125 $1,786 125 $90,073126 $2,570,387 126 $1,926,152127 $104 127 $15,112128 $2,006 128 $0132 $389,115 132 $0134 $6,565 134 $123,598135 $886 135 $0136 $2,338,696 136 $412,039137 $8,522 137 $0139 $106,493 139 $54150 $738,899 150 $0160 $157,104 160 $0168 $879,617 168 $0169 $854,119 169 $0170 $877,294 170 $0178 $414,796 178 $0179 $3,889 179 $0180 $532,906 180 $750,433181 $1,046,002 181 $788,620185 $779,336 185 $436,440186 $44,160 186 $594,305208 $342 208 $0233 $66,860 233 $0234 $109,933 234 $0235 $53,687 235 $0238 $0 238 $0240 $0 240 $0263 $210,476 263 $0264 $192 264 $117,332265 $43,799 265 $0267 $2,990 267 $0274 $0 274 $37275 $0 275 $0283 $0 283 $9,512285 $0 285 $0320 $0 320 $0322 $0 322 $0329 $232 329 $0333 $485,872 333 $0334 $200,299 334 $0335 $478,613 335 $0336 $2,284,269 336 $0
Package Page 21 AMP Workhour Costs - Proposed

(1) (2) (3) (4) (5) (6) (7) (8) (9) (10) (11) (12)Proposed Proposed Proposed Proposed Proposed Proposed Proposed Proposed Proposed Proposed Proposed ProposedOperation Annual FHP Annual TPH or Annual Productivity Annual Operation Annual FHP Annual TPH or Annual Productivity AnnualNumbers Volume NATPH Volume Workhours (TPH or NATPH) Workhour Costs Numbers Volume NATPH Volume Workhours (TPH or NATPH) Workhour Costs
337 $20,845 337 $0340 $2,150 340 $110,582341 $85,433 341 $123,236385 $240 385 $0483 $428 483 $33,100484 $124 484 $94,729486 $0 486 $0487 $0 487 $0488 $19,803 488 $0489 $0 489 $0495 $327 495 $0549 $483,548 549 $439,384554 $527,207 554 $103,807555 $214,706 555 $4,141560 $232,694 560 $259,949561 $204 561 $0562 $73 562 $0563 $298 563 $0564 $23,605 564 $0565 $194,721 565 $1,998,319585 $150,568 585 $418,101586 $45,376 586 $1,212587 $16,821 587 $0588 $743 588 $0603 $0 603 $273,334607 $135,604 607 $220,439612 $56,353 612 $90,030620 $158 620 $0629 $355,112 629 $1,224,252630 $51,600 630 $171677 $43,182 677 $372,349776 $14,189 776 $118,770793 $659,741 793 $0864 $0 864 $0893 $2,186,838 893 $3,544,880894 $9,602 894 $3,044,424895 $89,641 895 $0896 $185,150 896 $708,211897 $2,199,460 897 $0898 $84 898 $0918 $5,608,430 918 $7,166,156919 $402,077 919 $543,741930 $278,829 930 $0965 $541 965 $0
0 No Calc 009 $00 No Calc 050 $110 No Calc 055 $23,4090 No Calc 083 $349,3800 No Calc 084 $152,9700 No Calc 087 $125,9180 No Calc 088 $7,5090 No Calc 089 $16,1440 No Calc 090 $8120 No Calc 091 $263,8920 No Calc 094 $6,173
Package Page 22 AMP Workhour Costs - Proposed

(1) (2) (3) (4) (5) (6) (7) (8) (9) (10) (11) (12)Proposed Proposed Proposed Proposed Proposed Proposed Proposed Proposed Proposed Proposed Proposed ProposedOperation Annual FHP Annual TPH or Annual Productivity Annual Operation Annual FHP Annual TPH or Annual Productivity AnnualNumbers Volume NATPH Volume Workhours (TPH or NATPH) Workhour Costs Numbers Workhour Costs
0 No Calc 095 $3,5080 No Calc 098 $87,6270 No Calc 099 $246,2290 No Calc 109 $1720 No Calc 140 $4,248,4290 No Calc 141dup $00 No Calc 142dup $00 No Calc 143 $307,2770 No Calc 144 $257,1840 No Calc 146 $2,453,4100 No Calc 214 $61,7950 No Calc 273 $1670 No Calc 284 $43,5040 No Calc 291 $1650 No Calc 294 $3300 No Calc 384 $00 No Calc 482 $5,2170 No Calc 530 $00 No Calc 531 $1550 No Calc 538 $134,1240 No Calc 618 $1,185,3890 No Calc 619 $931,7640 No Calc 961 $00 No Calc 962 $00 No Calc 964 $00 No Calc 0 No Calc0 No Calc 0 No Calc0 No Calc 0 No Calc0 No Calc 0 No Calc0 No Calc 0 No Calc0 No Calc 0 No Calc0 No Calc 0 No Calc0 No Calc 0 No Calc0 No Calc 0 No Calc0 No Calc 0 No Calc0 No Calc 0 No Calc0 No Calc 0 No Calc0 No Calc 0 No Calc0 No Calc 0 No Calc0 No Calc 0 No Calc0 No Calc 0 No Calc0 No Calc 0 No Calc0 No Calc 0 No Calc0 No Calc 0 No Calc0 No Calc 0 No Calc0 No Calc 0 No Calc0 No Calc 0 No Calc0 No Calc 0 No Calc0 No Calc 0 No Calc0 No Calc 0 No Calc0 No Calc 0 No Calc0 No Calc 0 No Calc0 No Calc 0 No Calc0 No Calc 0 No Calc0 No Calc 0 No Calc
Package Page 23 AMP Workhour Costs - Proposed

(1) (2) (3) (4) (5) (6) (7) (8) (9) (10) (11) (12)Proposed Proposed Proposed Proposed Proposed Proposed Proposed Proposed Proposed Proposed Proposed ProposedOperation Annual FHP Annual TPH or Annual Productivity Annual Operation Annual FHP Annual TPH or Annual Productivity AnnualNumbers Volume NATPH Volume Workhours (TPH or NATPH) Workhour Costs Numbers Volume NATPH Volume Workhours (TPH or NATPH) Workhour Costs
0 No Calc 0 No Calc0 No Calc 0 No Calc0 No Calc 0 No Calc0 No Calc 0 No Calc0 No Calc 0 No Calc0 No Calc 0 No Calc0 No Calc 0 No Calc0 No Calc 0 No Calc0 No Calc 0 No Calc0 No Calc 0 No Calc0 No Calc 0 No Calc0 No Calc 0 No Calc0 No Calc 0 No Calc0 No Calc 0 No Calc0 No Calc 0 No Calc0 No Calc 0 No Calc0 No Calc 0 No Calc0 No Calc 0 No Calc0 No Calc 0 No Calc0 No Calc 0 No Calc0 No Calc 0 No Calc0 No Calc 0 No Calc0 No Calc 0 No Calc0 No Calc 0 No Calc0 No Calc 0 No Calc0 No Calc 0 No Calc0 No Calc 0 No Calc0 No Calc 0 No Calc0 No Calc 0 No Calc0 No Calc 0 No Calc0 No Calc 0 No Calc0 No Calc 0 No Calc0 No Calc 0 No Calc0 No Calc 0 No Calc0 No Calc 0 No Calc0 No Calc 0 No Calc0 No Calc 0 No Calc0 No Calc 0 No Calc0 No Calc 0 No Calc0 No Calc 0 No Calc0 No Calc 0 No Calc0 No Calc 0 No Calc0 No Calc 0 No Calc0 No Calc 0 No Calc0 No Calc 0 No Calc0 No Calc 0 No Calc0 No Calc 0 No Calc0 No Calc 0 No Calc0 No Calc 0 No Calc0 No Calc 0 No Calc0 No Calc 0 No Calc0 No Calc 0 No Calc0 No Calc 0 No Calc0 No Calc 0 No Calc0 No Calc 0 No Calc
Package Page 24 AMP Workhour Costs - Proposed

(1) (2) (3) (4) (5) (6) (7) (8) (9) (10) (11) (12)Proposed Proposed Proposed Proposed Proposed Proposed Proposed Proposed Proposed Proposed Proposed ProposedOperation Annual FHP Annual TPH or Annual Productivity Annual Operation Annual FHP Annual TPH or Annual Productivity AnnualNumbers Volume NATPH Volume Workhours (TPH or NATPH) Workhour Costs Numbers Volume NATPH Volume Workhours (TPH or NATPH) Workhour Costs
0 No Calc 0 No Calc0 No Calc 0 No Calc0 No Calc 0 No Calc0 No Calc 0 No Calc0 No Calc 0 No Calc0 No Calc 0 No Calc0 No Calc 0 No Calc0 No Calc 0 No Calc0 No Calc 0 No Calc0 No Calc 0 No Calc0 No Calc 0 No Calc0 No Calc 0 No Calc0 No Calc 0 No Calc0 No Calc 0 No Calc0 No Calc 0 No Calc0 No Calc 0 No Calc0 No Calc 0 No Calc0 No Calc 0 No Calc0 No Calc 0 No Calc0 No Calc 0 No Calc0 No Calc 0 No Calc0 No Calc 0 No Calc0 No Calc 0 No Calc0 No Calc 0 No Calc0 No Calc 0 No Calc0 No Calc 0 No Calc0 No Calc 0 No Calc0 No Calc 0 No Calc0 No Calc 0 No Calc0 No Calc 0 No Calc0 No Calc 0 No Calc0 No Calc 0 No Calc0 No Calc 0 No Calc0 No Calc 0 No Calc0 No Calc 0 No Calc0 No Calc 0 No Calc0 No Calc 0 No Calc0 No Calc 0 No Calc0 No Calc 0 No Calc0 No Calc 0 No Calc0 No Calc 0 No Calc
Moved to Gain 69,548,195 83,319,135 186,456 447 $8,072,774 Impact to Gain 686,502,500 1,657,750,721 516,543 3,209 $22,227,151Impact to Lose 0 0 0 No Calc $0 Moved to Lose 0 0 0 No Calc $0Total Impact 69,548,195 83,319,135 186,456 447 $8,072,774 Total Impact 686,502,500 1,657,750,721 516,543 3,209 $22,227,151Non Impacted 1,252,475,190 3,565,620,054 769,951 4,631 $33,608,366 Non Impacted 1,113,426,699 2,811,547,356 729,075 3,856 $31,726,379
Gain Only 137,066,335 449,401,292 251,269 1,789 $10,912,665All 1,322,023,385 3,648,939,189 956,407 3,815 $41,681,140 All 1,936,995,534 4,918,699,369 1,496,887 3,286 $64,866,194
Package Page 25 AMP Workhour Costs - Proposed

(1) (2) (3) (4) (5) (6) (7) (8) (9) (10) (11) (12)Proposed Proposed Proposed Proposed Proposed Proposed Proposed Proposed Proposed Proposed Proposed ProposedOperation Annual FHP Annual TPH or Annual Productivity Annual Operation Annual FHP Annual TPH or Annual Productivity AnnualNumbers Volume NATPH Volume Workhours (TPH or NATPH) Workhour Costs Numbers Volume NATPH Volume Workhours (TPH or NATPH) Workhour Costs
Op# FHP TPH/NATPH Workhours Productivity Workhour Cost Op# FHP TPH/NATPH Workhours Productivity Workhour Cost1 015 8,000 No Calc $336,8022
3
4
5
6
7
8
9
10
11
12
13
14
15
16
17
18
19
20
21
22
23
24
25
26
27
28
29
30
Totals 0 0 0 No Calc $0 Totals 0 0 8000 No Calc $336,8021504887
Impact to Gain 756,050,695 1,741,069,856 702,999 2,477 $30,299,924Combined Current Annual Workhour Cost : Impact to Lose 0 0 0 No Calc $0
Total Impact 756,050,695 1,741,069,856 702,999 2,477 $30,299,924Non-impacted 2,365,901,889 6,377,167,410 1,499,026 4,254 $65,334,745
Gain Only 137,066,335 449,401,292 251,269 1,789 $10,912,665Tot Before Adj 3,259,018,919 8,567,638,558 2,453,294 3,492 $106,547,334
Lose Adj 0 0 0 No Calc $0Gain Adj 0 0 8,000 No Calc $336,802
All 3,259,018,919 8,567,638,558 2,461,294 3,481 $106,884,136
Comb Current 3,259,018,919 8,567,638,558 2,541,579 3,371 $110,400,236Proposed 3,259,018,919 8,567,638,558 2,461,294 3,481 $106,884,136Change 0 0 (80,285) ($3,516,100)
Change % 0.0% 0.0% -3.2% -3.2%
Co
mb
To
tals
Cost Impact(This number equals the difference in the current and proposed workhour costs
above and is carried forward to the Executive Summary )
(This number brought forward from Workhour Costs - Current )
Function 1 Workhour Savings : $3,516,100
Minimum Function 1 Workhour Savings : ($422,805)(This number represents proposed workhour savings with no productivity improvements
applied to operations at the gaining facility)
(13) New Flow Adjustments at Losing Facility
$110,400,236
Proposed Annual Workhour Cost :(Total of Columns 6 and 12 on this page)
$106,884,136
rev 04/02/2009
(14) New Flow Adjustments at Gaining Facility
Adjustment for Sat consolidation
Package Page 26 AMP Workhour Costs - Proposed

Last Saved:
to
750 9.4% $7,996,408 \ ] 750 $7,830,410 TGp 750 $7,244,746 750 $8,588,137765 0.0% 67.0% $4,134,778 \ ] 765 $0 TGp 765 $1,364,477 765 $0766 0.0% $11,382,780 \ ] 766 $0 TGp 766 $11,382,780 766 $0515 $538 \ ] 515 $0 NI 515 $538 515 $0551 $244 \ ] 551 $0 NI 551 $244 551 $0571 $16 \ ] 571 $0 NI 571 $16 571 $0581 $250,175 \ ] 581 $304,584 NI 581 $250,175 581 $304,584582 $75,089 \ ] 582 $155,298 NI 582 $75,089 582 $155,298595 $6,601 \ ] 595 $0 NI 595 $6,601 595 $0616 $22,154 \ ] 616 $29,359 NI 616 $22,154 616 $29,359617 $24,580 \ ] 617 $0 NI 617 $24,580 617 $0646 $134 \ ] 646 $0 NI 646 $134 646 $0665 $65,708 \ ] 665 $12,374 NI 665 $65,708 665 $12,374666 $38,383 \ ] 666 $0 NI 666 $38,383 666 $0670 $142 \ ] 670 $0 NI 670 $142 670 $0673 $361,402 \ ] 673 $545,154 NI 673 $361,402 673 $545,154676 $338 \ ] 676 $0 NI 676 $338 676 $0679 $325,763 \ ] 679 $0 NI 679 $325,763 679 $0682 $278 \ ] 682 $0 NI 682 $278 682 $0686 $0 \ ] 686 $0 NI 686 $0 686 $0691 $16,170 \ ] 691 $0 NI 691 $16,170 691 $0732 $492 \ ] 732 $0 NI 732 $492 732 $0745 $730,712 \ ] 745 $720,062 NI 745 $730,712 745 $720,062747 $4,269,177 \ ] 747 $3,515,552 NI 747 $4,269,177 747 $3,515,552748 $327,763 \ ] 748 $0 NI 748 $327,763 748 $0749 $144,005 \ ] 749 $0 NI 749 $144,005 749 $0751 $42,081 \ ] 751 $0 NI 751 $42,081 751 $0753 $1,305,176 \ ] 753 $1,004,932 NI 753 $1,305,176 753 $1,004,932754 $469 \ ] 754 $0 NI 754 $469 754 $0763 $366,578 \ ] 763 $6,133 NI 763 $366,578 763 $6,133764 $323,553 \ ] 764 $0 NI 764 $323,553 764 $0900 $420 \ ] 900 $0 NI 900 $420 900 $0
\ ] 550 $589,500 GO 550 $589,500\ ] 591 $18,933 GO 591 $18,933\ ] 633 $491,955 GO 633 $491,955\ ] 634 $44 GO 634 $44\ ] 647 $13,109 GO 647 $13,109\ ] 653 $1,372 GO 653 $1,372\ ] 668 $45,009 GO 668 $45,009\ ] 752 $400 GO 752 $400\ ]\ ]\ ]\ ]\ ]\ ]\ ]\ ]\ ]\ ]\ ]\ ]\ ]\ ]\ ]\ ]\ ]\ ]\ ]\ ]
Gaining Facility
Current MODS
Operation Number
Percent Moved to
Losing (%)
Current Annual Workhour Cost ($)
Proposed MODS
Operation Number
Proposed Annual Workhour Cost ($)
Gaining Facility Losing FacilityLosing Facility
Current Other Craft Workhours
Current Annual Workhour Cost ($)
Current MODS
Operation Number
Percent Moved to Gaining
(%)
Current Annual Workhours
Current Annual Workhours
Reduction Due to EoS
(%)
Reduction Due to EoS
(%)
Proposed MODS
Operation Number
Proposed Annual Workhours
Other Workhour Move Analysis
Atlanta P&DCLosing Facility: Gaining Facility: North Metro P&DC Date Range of Data: 06/30/1107/01/10
September 6, 2012
Proposed Other Craft Workhours
Proposed Annual Workhours
Proposed Annual Workhour Cost ($)
Package Page 27 AMP Other Curr vs Prop

\ ]\ ]\ ]\ ]\ ]\ ]\ ]\ ]\ ]\ ]\ ]\ ]\ ]\ ]\ ]\ ]\ ]\ ]\ ]\ ]\ ]\ ]\ ]\ ]\ ]\ ]\ ]\ ]\ ]\ ]\ ]\ ]\ ]\ ]\ ]\ ]\ ]\ ]\ ]\ ]\ ]\ ]\ ]\ ]\ ]\ ]\ ]\ ]\ ]\ ]\ ]\ ]\ ]\ ]\ ]\ ]\ ]\ ]\ ]\ ]\ ]\ ]\ ]\ ]\ ]\ ]\ ]\ ]\ ]\ ]\ ]\ ]\ ]\ ]
Package Page 28 AMP Other Curr vs Prop

\ ]\ ]\ ]\ ]\ ]\ ]\ ]\ ]\ ]\ ]\ ]\ ]\ ]\ ]\ ]\ ]\ ]
514,683 $23,513,965 0 $0 Ops-Red 436,639 $19,992,002 Ops-Red 0 $00 $0 159,065 $7,830,410 Ops-Inc 0 $0 Ops-Inc 174,457 $8,588,137
198,896 $8,698,141 168,516 $7,453,769 Ops-Stay 198,896 $8,698,141 Ops-Stay 168,516 $7,453,769713,579 $32,212,107 327,580 $15,284,179 AllOps 635,535 $28,690,143 AllOps 342,973 $16,041,906
698 6.7% 0.0% $899,196 \ ] 698 $641,997 TGp 698 $838,950 698 $696,047701 6.4% 0.0% $865,981 \ ] 701 $1,058,785 TGp 701 $810,559 701 $1,108,507927 25.0% $436,261 \ ] 927 $396,113 TGp 927 $327,196 927 $493,961593 $117,198 \ ] 593 $0 NI 593 $117,198 593 $0671 $175,275 \ ] 671 $165,182 NI 671 $175,275 671 $165,182679 $363 \ ] 679 $0 NI 679 $363 679 $0699 $399,336 \ ] 699 $653,639 NI 699 $399,336 699 $653,639700 $1,033,036 \ ] 700 $1,370,383 NI 700 $1,033,036 700 $1,370,383702 $129,366 \ ] 702 $9,143 NI 702 $129,366 702 $9,143758 $322,754 \ ] 758 $0 NI 758 $322,754 758 $0759 $1,055,105 \ ] 759 $74,146 NI 759 $1,055,105 759 $74,146760 $36,550 \ ] 760 $0 NI 760 $36,550 760 $0922 $4,621 \ ] 922 $145,118 NI 922 $4,621 922 $145,118928 $12,164 \ ] 928 $0 NI 928 $12,164 928 $0934 $82 \ ] 934 $0 NI 934 $82 934 $0951 $1,470,657 \ ] 951 $1,464,474 NI 951 $1,470,657 951 $1,464,474
\ ] 565 $87,200 GO 565 $87,200\ ] 952 $222,994 GO 952 $222,994\ ]\ ]\ ]\ ]\ ]\ ]\ ]\ ]\ ]\ ]\ ]\ ]\ ]\ ]\ ]\ ]\ ]\ ]\ ]\ ]\ ]\ ]\ ]\ ]\ ]\ ]
Gaining Facility
Current MODS
Operation Number
Totals
Ops-ReducingOps-Increasing
Ops-StayingAll Operations
Percent (%) Moved to Losing
(%) Reduction
Due to EoS
Percent (%) Moved to Gaining
(%) Reduction
Due to EoS
Current Annual Workhours
Totals
Ops-ReducingOps-Increasing
Ops-StayingAll Operations
Current All Supervisory Workhours
Current Annual Workhour Cost ($)
Current Annual Workhours
Current MODS
Operation Number
Losing Facility Gaining Facility
Current Annual Workhour Cost ($)
Proposed Annual Workhour Cost ($)
Proposed MODS
Operation Number
Proposed Annual Workhours
Proposed Annual Workhour Cost ($)
Losing Facility
Proposed MODS
Operation Number
Proposed Annual Workhours
Proposed All Supervisory Workhours
Package Page 29 AMP Other Curr vs Prop

\ ]\ ]\ ]\ ]\ ]\ ]\ ]\ ]\ ]\ ]\ ]\ ]\ ]\ ]\ ]\ ]\ ]\ ]\ ]\ ]\ ]\ ]\ ]\ ]\ ]\ ]\ ]\ ]\ ]\ ]\ ]\ ]\ ]\ ]\ ]\ ]\ ]\ ]\ ]\ ]\ ]\ ]\ ]\ ]\ ]\ ]\ ]\ ]\ ]\ ]\ ]\ ]\ ]\ ]\ ]\ ]\ ]\ ]\ ]\ ]\ ]\ ]\ ]\ ]\ ]\ ]\ ]\ ]\ ]\ ]\ ]\ ]\ ]\ ]
Package Page 30 AMP Other Curr vs Prop

\ ]\ ]\ ]\ ]\ ]\ ]\ ]\ ]\ ]\ ]\ ]\ ]\ ]
41,585 $2,201,439 0 $0 Ops-Red 37,340 $1,976,704 Ops-Red 0 $00 $0 44,151 $2,096,895 Ops-Inc 0 $0 Ops-Inc 48,396 $2,298,514
91,428 $4,756,508 79,259 $4,192,279 Ops-Stay 91,428 $4,756,508 Ops-Stay 79,259 $4,192,279133,013 $6,957,946 123,410 $6,289,174 AllOps 128,767 $6,733,212 AllOps 127,655 $6,490,794
780 $0 \ ] 780 $15,798 NI 780 $14 780 $15,798781 $37,162 \ ] 781 $39,947 NI 781 $37,162 781 $39,947783 $135,431 \ ] 783 $341,752 NI 783 $135,431 783 $341,752784 $0 \ ] 784 $0 NI 784 $0 784 $0788 $0 \ ] 788 $0 NI 788 $0 788 $0789 $3,205 \ ] 789 $0 NI 789 $3,205 789 $0
\ ]\ ]\ ]\ ]\ ]\ ]
0 $0 0 $0 Ops-Red 0 $0 Ops-Red 0 $00 $0 0 $0 Ops-Inc 0 $0 Ops-Inc 0 $0
5,309 $175,797 10,761 $397,497 Ops-Stay 5,309 $175,811 Ops-Stay 10,761 $397,4975,309 $175,797 10,761 $397,497 AllOps 5,309 $175,811 AllOps 10,761 $397,497
31 $1,040,473 31 $6,133 31 $1,040,473 31 $6,13332 $0 32 $0 32 $0 32 $033 $0 33 $13,109 33 $0 33 $13,10934 $15,517,557 34 $0 34 $12,747,256 34 $093 $3,205 93 $0 93 $3,205 93 $0Totals 374,084 $16,561,235 Totals 506 $19,241 Totals 311,432 $13,790,934 Totals 506 $19,241
$673,896 0 $0 $673,896 0 $0$15,517,557 0 $0 $12,747,256 0 $0
Subset for Trans-PVS
TabOps 617, 679, 764 (31)
Transportation - PVS
LDCCurrent Annual
Workhours
Current Annual Workhour Cost
($)
Ops 765, 766 (34)
LDCCurrent Annual
Workhours
Current Annual Workhour Cost
($)
Current MODS
Operation Number
(%) Reduction
Due to EoS
Grouped Subtotals for Transportation, Maintenance, Supervision & Flow Adjustments, along with Facility and Combined Summaries
Ops-IncreasingOps-Staying
All Operations
Current Annual Workhours
All Operations
Percent (%) Moved to Losing
Gaining Facility Losing Facility
Current Annual Workhour Cost ($)
Gaining Facility
Ops 617, 679, 764 (31)
Ops 765, 766 (34)
Ops 617, 679, 764 (31)
Ops 765, 766 (34)
Ops-Reducing
All Operations
Current Workhours for LDCs Common to & Shared between Supv & Craft Proposed Workhours for LDCs Common to & Shared between Supv & Craft
Current MODS
Operation Number
Gaining Facility
Totals
Losing Facility
Losing Facility Gaining Facility
TotalsOps-Increasing
Ops-Staying
Losing Facility
Ops 617, 679, 764 (31)Subset for Trans-PVS
Tab
(%) Reduction
Due to EoS
Current Annual Workhours
Current Annual Workhour Cost ($)
Transportation - PVS
Totals
Ops-ReducingOps-Increasing
Ops-Staying
Ops-Reducing
Percent (%) Moved to Gaining
Totals
Ops-ReducingOps-Increasing
Ops-StayingAll Operations
Proposed Annual Workhour Cost ($)
Proposed MODS
Operation Number
Proposed Annual Workhours
Proposed Annual Workhour Cost ($)
LDC
Proposed MODS
Operation Number
Proposed Annual Workhours
Ops 765, 766 (34)
Proposed Annual Workhour Cost ($)
Transportation - PVS
Proposed Annual Workhours
Proposed Annual Workhour Cost ($)
Transportation - PVS
LDCProposed Annual
Workhours
Package Page 31 AMP Other Curr vs Prop

36 $8,038,489 36 $7,830,811 36 $7,286,827 36 $8,588,53737 $1,305,645 37 $1,004,932 37 $1,305,645 37 $1,004,93238 $4,740,945 38 $3,515,552 38 $4,740,945 38 $3,515,55239 $752,866 39 $749,465 39 $752,866 39 $749,46593 $135,431 93 $341,752 93 $135,431 93 $341,752Totals 325,471 $14,973,376 Totals 289,322 $13,442,511 Totals 310,078 $14,221,714 Totals 304,715 $14,200,238
01 $121,819 01 $145,118 01 $121,819 01 $145,11810 $3,775,341 10 $4,217,260 10 $3,550,607 10 $4,418,88020 $0 20 $0 20 $0 20 $030 $1,414,772 30 $74,146 30 $1,414,772 30 $74,14635 $1,470,657 35 $1,687,468 35 $1,470,657 35 $1,687,46840 $0 40 $0 40 $0 40 $050 $0 50 $0 50 $0 50 $060 $0 60 $0 60 $0 60 $070 $0 70 $0 70 $0 70 $080 $175,275 80 $165,182 80 $175,275 80 $165,18281 $82 81 $0 81 $82 81 $088 $0 88 $0 88 $0 88 $0Totals 133,013 $6,957,946 Totals 123,410 $6,289,174 Totals 128,767 $6,733,212 Totals 127,655 $6,490,794
Annual Workhours Annual Dollars Annual Workhours Annual Dollars Annual Workhours Annual Dollars % Change Dollars Change Percent Change
72,568 $3,366,128 0 $0 72,568 $3,366,128 0.0% ($0) 0.0%365,872 $16,191,453 0 $0 303,221 $13,421,152 -17.1% ($2,770,301) -17.1%614,793 $28,415,888 0 $0 614,793 $28,421,952 0.0% $6,064 0.0%256,422 $13,247,121 0 $0 256,422 $13,224,006 0.0% ($23,115) -0.2%
3,995 $96,111 0 $0 3,995 $96,126 0.0% $14 0.0%1,313,651 $61,316,700 0 $0 1,251,000 $58,529,363 -4.8% ($2,787,337) -4.5%
LDC LDCChk >>> Chk >>>Chk >>> Chk >>>Chk >>> Chk >>> Before 851,900 $39,345,850 Before 461,751 $21,970,850Chk >>> Chk >>> After 769,611 $35,599,167 After 481,388 $22,930,196Chk >>> Chk >>> Adj 0 $0 Adj 0 $0Chk >>> Chk >>> AfterTot 769,611 $35,599,167 AfterTot 481,388 $22,930,196Chk >>> Chk >>> Change (82,289) ($3,746,683) Change 19,637 $959,346Chk >>> Chk >>> % Diff -9.7% -9.5% % Diff 4.3% 4.4%Chk >>> Chk >>>Chk >>> Chk >>>Chk >>> Chk >>>Chk >>> Chk >>>
Total Adj 0 $0 Total Adj 0 $0 Before 1,313,651 $61,316,700After 1,251,000 $58,529,363
Adj 0 $0AfterTot 1,251,000 $58,529,363Change (62,651) ($2,787,337)% Diff -4.8% -4.5%
0
4) less Ops going to 'Maintenance' Tabs
'Other Craft' Ops (note 1)
Notes:1) less Ops going to 'Trans-PVS' & 'Maintenance' Tabs
2) going to Trans-PVS tab
3) going to Maintenance tab
Supervisory Ops
ChangeProposed + Special Adjustments - Combined -Current - Combined
Workhour Change
(62,651)00
Maintenance Ops (note 3)
Transportation Ops (note 2)
Summary by FacilitySpecial Adjustments at Losing Site
0Supv/Craft Joint Ops (note 4)
Total (62,651)
Supervisory
LDCProposed Annual
WorkhoursProposed Annual
Workhour Cost ($)
Supervisor Summary Supervisor Summary
LDCCurrent Annual
Workhours
Current Annual Workhour Cost
($)LDC
Current Annual Workhours
Current Annual Workhour Cost
($)
Maintenance
Current Annual Workhours
Maintenance
Proposed Annual Workhour Cost ($)
Proposed Annual WorkhoursLDC
Proposed Annual WorkhoursLDC
Proposed Annual Workhours
Losing Facility Summary
Combined Summary
Proposed Annual Workhours
Proposed Annual Workhour Cost
($)
Proposed Annual Workhour Cost
($)
Proposed Annual Workhours
Proposed MODS
Operation Number
Proposed Annual Workhours
Proposed Annual Workhour Cost
($)
Proposed MODS
Operation Number
Proposed Annual Workhour Cost
($)
Special Adjustments at Gaining Site
Maintenance
Current Annual Workhour Cost
($)
Summary by Sub-GroupSpecial Adjustments -
Combined -
Gaining Facility Summary
Maintenance
LDC LDCCurrent Annual
Workhours
Current Annual Workhour Cost
($)
Proposed Annual Workhour Cost ($)
Supervisory
LDCProposed Annual
WorkhoursProposed Annual
Workhour Cost ($)
Package Page 32 AMP Other Curr vs Prop

Last Saved:
Losing Facility:Data Extraction Date: 06/17/11
(2) (3) (4) (5) (6)
LevelCurrent Auth
StaffingCurrent
On-RollsProposed Staffing
Difference
1 PCES-01 1 1 1 0
2 EAS-25 1 1 1 0
3 EAS-25 1 1 1 0
4 EAS-24 2 2 2 0
5 EAS-23 3 2 2 0
6 EAS-23 1 1 1 0
7 EAS-22 3 2 1 -1
8 EAS-22 1 1 1 0
9 EAS-20 1 1 1 0
10 EAS-20 1 1 1 0
11 EAS-19 1 0 0 0
12 EAS-18 1 0 0 0
13 EAS-18 1 0 0 0
14 EAS-17 3 2 2 0
15 EAS-17 29 29 22 -7
16 EAS-17 11 10 10 0
17 EAS-17 13 8 8 0
18 EAS-16 2 1 1 0
19 EAS-12 1 1 1 0
202122232425262728293031323334353637383940414243
Staffing - Management
120441
September 6, 2012
Atlanta P&DC
NETWORKS SPECIALIST
OPERATIONS SUPPORT SPECIALIST
Line
(1)
Position Title
PLANT MANAGER (1)
OPERATIONS SUPPORT SPECIALIST
Management Positions
OPERATIONS INDUSTRIAL ENGINEER (FI
MGR MAINTENANCE OPERATIONS SUPPT
OPERATIONS SUPPORT SPECIALIST
MGR PVS OPERATIONS
Finance Number:
MGR IN-PLANT SUPPORT
MGR MAINTENANCE
MGR DISTRIBUTION OPERATIONS
MGR MAINTENANCE OPERATIONS
MGR TRANSPORTATION/NETWORKS
MGR DISTRIBUTION OPERATIONS
SUPV DISTRIBUTION OPERATIONS
SUPV MAINTENANCE OPERATIONS
SUPV TRANSPORTATION OPERATIONS
NETWORKS SPECIALIST
SECRETARY (FLD)
Package Page 33 AMP Staffing - PCES/EAS

444546474849505152535455565758596061626364656667686970717273747576777879
77 64 56 (8)
Retirement Eligibles: 17 Position Loss: 8
Totals
Package Page 34 AMP Staffing - PCES/EAS

Gaining Facility:Data Extraction Date: 06/17/11
(13) (14) (15) (16) (17)
LevelCurrent Auth
StaffingCurrent
On-RollsProposed Staffing
Difference
1 PCES-01 1 1 1 0
2 EAS-25 1 1 1 0
3 EAS-25 1 1 1 0
4 EAS-25 1 1 1 0
5 EAS-24 1 1 1 0
6 EAS-23 3 3 3 0
7 EAS-22 2 2 2 0
8 EAS-22 2 2 2 0
9 EAS-20 1 0 1 1
10 EAS-20 1 0 1 1
11 EAS-20 1 0 1 1
12 EAS-19 2 1 1 0
13 EAS-19 1 0 1 1
14 EAS-19 1 1 1 0
15 EAS-18 1 1 1 0
16 EAS-17 6 4 4 0
17 EAS-17 30 31 34 3
18 EAS-17 11 10 10 0
19 EAS-16 1 1 1 0
20 EAS-15 1 1 1 0
21 EAS-12 1 1 1 0
22232425262728293031323334353637383940414243444546
Finance Number: 123569
North Metro P&DC
Line Position Title
(12)
Management Positions
PLANT MANAGER (METRO)
MGR IN-PLANT SUPPORT
MGR MAINTENANCE (LEAD)
SR MGR DISTRIBUTION OPERATIONS
MGR DISTRIBUTION OPERATIONS
MGR MAINTENANCE OPERATIONS
MGR DISTRIBUTION OPERATIONS
OPERATIONS INDUSTRIAL ENGINEER (FI
MGR MAINT ENGINEERING SUPPORT
MGR MAINTENANCE OPERATIONS SUPPT
OPERATIONS SUPPORT SPECIALIST
MAINTENANCE ENGINEERING SPECIALIST
MGR DISTRIBUTION OPERATIONS
MGR FIELD MAINT OPRNS (LEAD)
OPERATIONS SUPPORT SPECIALIST
OPERATIONS SUPPORT SPECIALIST
SUPV DISTRIBUTION OPERATIONS
SUPV MAINTENANCE OPERATIONS
NETWORKS SPECIALIST
OPERATIONS SUPPORT SPECIALIST
SECRETARY (FLD)
Package Page 35 AMP Staffing - PCES/EAS

474849505152535455565758596061626364656667686970717273747576777879
70 63 70 7
Retirement Eligibles: 10 Position Loss: (7)
1
Total
rev 11/05/2008
Total PCES/EAS Position Loss: (This number carried forward to the Executive Summary )
Package Page 36 AMP Staffing - PCES/EAS

Losing Facility: 120441
(1) (2) (3) (4) (5) (6)
Craft Positions
Function 1 - Clerk 21 0 429 450 376 (74)Function 4 - Clerk 0 0 0Function 1 - Mail Handler 0 20 183 203 172 (31)Function 4 - Mail Handler 0 0 0
Function 1 & 4 Sub-Total 21 20 612 653 548 (105)Function 3A - Vehicle Service 13 0 170 183 183 0Function 3B - Maintenance 0 1 185 186 174 (12)Functions 67-69 - Lmtd/Rehab/WC 0 33 33 32 (1)Other Functions 0 0 18 18 4 (14)
Total 34 21 1,018 1,073 941 (132)
Retirement Eligibles: 317
Gaining Facility: 123569
(7) (8) (9) (10) (11) (12)
Craft Positions
Function 1 - Clerk 28 0 394 422 471 49Function 1 - Mail Handler 15 26 306 347 387 40
Function 1 Sub-Total 43 26 700 769 858 89Function 3A - Vehicle Service 0 0 0Function 3B - Maintenance 0 0 169 169 178 9Functions 67-69 - Lmtd/Rehab/WC 0 22 22 22 0Other Functions 0 0 18 18 18 0
Total 43 26 909 978 1,076 98
Retirement Eligibles: 239
34
(13) Notes:
rev 11/05/2008
Finance Number:
North Metro P&DC Finance Number:
Total Craft Position Loss:
Total Proposed
Part Time On-Rolls
Full Time On-Rolls
Total On-Rolls
Staffing - Craft
Difference
Difference
Last Saved: September 6, 2012
Data Extraction Date: 06/17/11
Casuals/PSEs On-Rolls
06/17/11
Total Proposed
Data Extraction Date:
Atlanta P&DC
Part Time On-Rolls
Full Time On-Rolls
Total On-Rolls
(This number carried forward to the Executive Summary )
Casuals/PSEs On-Rolls
Package Page 37 AMP Staffing - Craft

Losing Facility: Gaining Facility:
Date Range of Data: :
(1) (2) (3) (4) (5) (6)
Workhour Activity Current Cost Proposed Cost Difference Workhour Activity Current Cost Proposed Cost Difference
LDC 36Mail Processing
Equipment$ 8,038,489 $ 7,286,827 $ (751,662) LDC 36
Mail Processing Equipment
$ 7,830,811 $ 8,588,537 $ 757,727
LDC 37 Building Equipment $ 1,305,645 $ 1,305,645 $ 0 LDC 37 Building Equipment $ 1,004,932 $ 1,004,932 $ 0
LDC 38 Building Services (Custodial Cleaning)
$ 4,740,945 $ 4,740,945 $ 0 LDC 38 Building Services (Custodial Cleaning)
$ 3,515,552 $ 3,515,552 $ 0
LDC 39Maintenance
Operations Support$ 752,866 $ 752,866 $ 0 LDC 39
Maintenance Operations Support
$ 749,465 $ 749,465 $ 0
LDC 93Maintenance
Training$ 135,431 $ 135,431 $ 0 LDC 93
Maintenance Training
$ 341,752 $ 341,752 $ 0
Workhour Cost Subtotal $ 14,973,376 $ 14,221,714 $ (751,662) Workhour Cost Subtotal $ 13,442,511 $ 14,200,238 $ 757,727
Other Related Maintenance & Facility Costs
Current Cost Proposed Cost DifferenceOther Related Maintenance &
Facility Costs Current Cost Proposed Cost Difference
TotalMaintenance Parts, Supplies &
Facility Utilities$ 2,892,526 $ 2,536,700 $ (355,826) Total
Maintenance Parts, Supplies & Facility Utilities
$ 2,764,685 $ 2,386,033 $ (378,652)
Adjustments (from "Other Curr vs Prop" tab)
$ 0 Adjustments (from "Other Curr vs Prop" tab)
$ 0
Grand Total $ 17,865,902 $ 16,758,414 $ (1,107,488) Grand Total $ 16,207,196 $ 16,586,271 $ 379,075
$728,414 (This number carried forward to the Executive Summary )
(7) Notes:
Annual Maintenance Savings:
rev 04/13/2009
MaintenanceLast Saved:
Atlanta P&DC North Metro P&DC
September 6, 2012
Jul-01-2010 Jun-30-2011
Package Page 38 AMP Maintenance

Losing Facility: Gaining Facility:Finance Number: Finance Number:
Date Range of Data: July 2012 (Annualized)
(1) (2) (3) (4) (5) (6)Current Proposed Difference Current Proposed Difference
PVS Owned Equipment PVS Owned EquipmentSeven Ton Trucks 0 0 0 Seven Ton Trucks 1 1 0
Eleven Ton Trucks 15 15 0 Eleven Ton Trucks 1 1 0
Single Axle Tractors 25 25 0 Single Axle Tractors 20 20 0
Tandem Axle Tractors 15 15 0 Tandem Axle Tractors 18 18 0
Spotters 1 1 0 Spotters 1 1 0
PVS Transportation PVS TransportationTotal Number of Schedules 94 94 0 Total Number of Schedules 73 71 2
Total Annual Mileage 1,972,320 2,070,940 (98,620) Total Annual Mileage 2,430,820 2,123,635 307,185
Total Mileage Costs $11,833,920 $12,425,640 ($591,720) Total Mileage Costs $14,584,920 $12,741,810 $1,843,110
PVS Leases PVS LeasesTotal Vehicles Leased 0 Total Vehicles Leased 0
Total Lease Costs $0 Total Lease Costs $0
PVS Workhour Costs PVS Workhour CostsLDC 31 (617, 679, 764) $828,984 $673,896 $155,088 LDC 31 (617, 679, 764) $0 $0 $0
LDC 34 (765, 766) $14,817,468 $12,747,256 $2,070,212 LDC 34 (765, 766) $0 $0 $0
Adjustments (from "Other Curr vs Prop" tab)
$0 Adjustments (from "Other Curr vs Prop" tab)
$0
Total Workhour Costs $15,646,452 $13,421,152 $2,225,300 Total Workhour Costs $0 $0 $0
PVS Transportation Savings (Losing Facility): $1,633,580 PVS Transportation Savings (Gaining Facility): $1,843,110
$3,476,690
(7) Notes:
changes in PVS schedules due to Network Rationalization initiatives. All Atlanta District PVS workhours are assigned to Atlanta P&DC, even those originating from North Metro P&DC
rev 04/13/2009
The date range for this tab is different from the date ranges in the rest of the workbook in order to account for large recent
Total PVS Transportation Savings:
120441 123569
<<== (This number is summed with Total from 'Trans-HCR' and carried forward to the Executive Summary as Transportation Savings )
Transportation - PVS
Atlanta P&DC North Metro P&DC
Last Saved: September 6, 2012
Package Page 39 AMP Transportation - PVS

21:30 23:00
1:50
1 2 3 4 5 6 7 8 9 10 11 12 13 14Current Current Current Proposed Proposed Proposed Current Current Current Proposed Proposed Proposed
Route Annual Annual Cost per Annual Annual Cost per Route Annual Annual Cost per Annual Annual Cost perNumbers Mileage Cost Mile Mileage Cost Mile Numbers Mileage Cost Mile Mileage Cost Mile
30232 75,724 $217,208 $2.8730233 105,377 $269,451 $2.5630234 34,596 $88,458 $2.5630238 67,342 $147,456 $2.1930220 123,167 $236,705 $1.92302M2 266,950 $526,437 $1.97302M3 76,374 $167,906 $2.20302M5 202,488 $610,482 $3.01
Type of Distribution to Consolidate:
Date of HCR Data File:
CET for cancellations:
Last Saved: September 6, 2012
Losing Facility: Atlanta P&DC North Metro P&DCGaining Facility:
Originating
07/01/12
CET for OGP:
CT for Outbound Dock:
Transportation - HCR
Package Page 40 AMP Transportation - HCR

1 2 3 4 5 6 7 8 9 10 11 12 13 14Current Current Current Proposed Proposed Proposed Current Current Current Proposed Proposed Proposed
Route Annual Annual Cost per Annual Annual Cost per Route Annual Annual Cost per Annual Annual Cost perNumbers Mileage Cost Mile Mileage Cost Mile Numbers Mileage Cost Mile Mileage Cost Mile
Package Page 41 AMP Transportation - HCR

1 2 3 4 5 6 7 8 9 10 11 12 13 14Current Current Current Proposed Proposed Proposed Current Current Current Proposed Proposed Proposed
Route Annual Annual Cost per Annual Annual Cost per Route Annual Annual Cost per Annual Annual Cost perNumbers Mileage Cost Mile Mileage Cost Mile Numbers Mileage Cost Mile Mileage Cost Mile
Totals 952,018 952,018 Totals 0 0
$0 $0
Total HCR Transportation Savings:
Trips from Losing
Moving to Lose (-)
<<== (This number is summed with Total from 'Trans-PVS' and carried forward to the Executive Summary as Transportation Savings )
rev 11/05/2008
Current Gaining
$0
Proposed Result
HCR Annual Savings (Losing Facility): HCR Annual Savings (Gaining Facility):
Proposed Trip Impacts
Other Changes
(+/-)
Moving to Gain (-)
Proposed Trip
Impacts
Current Losing
Proposed ResultTrips from Gaining
Other Changes
(+/-)
Package Page 42 AMP Transportation - HCR

Originating
(1) (2)
DMM L011 From:
x DMM L201 Action Code* Column A - 3-Digit ZIP Code Prefix Group
DMM L601
DMM L602
DMM L603 To:
DMM L604 Action Code* Column A - 3-Digit ZIP Code Prefix Group
DMM L605
DMM L606
DMM L607
DMM L801
(3)
Action Code*
D
CF
Action Code*
CT
Action Code*
Action Code*
(4)
Count % Count % Count % Count %
AUG 303 857 251 29% 245 29% 0 0% 606 71% 45
JUL 303 863 260 30% 247 29% 0 0% 603 70% 37
AUG 300 784 143 18% 268 34% 0 0% 641 82% 53
JUL 300 820 194 24% 275 34% 0 0% 626 76% 44
(5) Notes:
*Action Codes: A=add D=delete CF-change from CT=change to
Important Note: Section 2 & 3 illustrate possible changes to DMM labeling lists. Section 2 relates to consolidation of Destination Operations. Section 3 pertains to Originating Operations. The Area Distribution Network group will submit appropriate requests for DMM changes after AMP approval.
Column A - Entry ZIP Codes Column B - 3-Digit ZIP Code Destinations Column C - Label to
Column A - Entry ZIP Codes Column B - 3-Digit ZIP Code Destinations Column C - Label to
DMM L009
DMM L010
DMM L005
DMM L006
DMM L007
DMM L008
DMM L003
DMM L004
DMM L001
DMM L002
Distribution Changes
Indicate each DMM labeling list affected by placing an "X" to the left of the list.
Losing Facility:Type of Distribution to Consolidate:
If revisions to DMM L005 or DMM L201 are needed, indicate proposed DMM label change below.
Last Saved: September 6, 2012
Atlanta P&DC
DMM Labeling List L005 - 3-Digit ZIP Code Prefix Groups - SCF Sortation
Column B - Label to
*Action Codes: A=add D=delete CF-change from CT=change to
Column B - Label to
rev 5/14/2009
Drop Shipments for Destination Entry Discounts - FAST Appointment Summary Report
Month Losing/GainingNASS Code
Facility NameTotal
Schd ApptsUnschd Count
Losing Facility Atlanta P&DC
Losing Facility Atlanta P&DC
No-Show Late Arrival Open Closed
Gaining Facility North Metro P&DC
Gaining Facility North Metro P&DC
DMM Labeling List L201 - Periodicals Origin Split
Column A - Entry ZIP Codes Column B - 3-Digit ZIP Code Destinations Column C - Label to
302, 303, 311, 399 005, 010-098, 100-212, 214-268, 270-342, 344, 346, 347, 349-352, 354-418, 420-427, 430-516, 520-528, 530-532, 534, 535, 537-551, 553-564, 566, 600-620, 622-631, 633-641, 644-658, 660-662, 664-681, 683-693, 700, 701, 703-708, 710-714, 716-731, 733-741, 743-764, 770-789, 798-816, 880, 885
OMX ATLANTA GA 303
Column C - Label to
300-303, 311, 399 005, 010-098, 100-212, 214-268, 270-342, 344, 346, 347, 349-352, 354-418, 420-427, 430-516, 520-528, 530-532, 534, 535, 537-551, 553-564, 566, 600-620, 622-631, 633-641, 644-658, 660-662, 664-681, 683-693, 700, 701, 703-708, 710-714, 716-731, 733-741, 743-767, 770-789, 798-816, 880, 885
OMX NORTH METRO GA 300
302-303, 311, 399 005, 010-098, 100-212, 214-268, 270-342, 344, 346, 347, 349-352, 354-418, 420-427, 430-516, 520-528, 530-532, 534, 535, 537-551, 553-564, 566, 600-620, 622-631, 633-641, 644-658, 660-662, 664-681, 683-693, 700, 701, 703-708, 710-714, 716-731, 733-741, 743-767, 770-789, 798-816, 880, 885
OMX NORTH METRO GA 300
Column A - Entry ZIP Codes Column B - 3-Digit ZIP Code Destinations Column C - Label to
Package Page 43 AMP Distribution Changes

Losing Facility: Gaining Facility:
(1) (2) (3) (4) (5) (6) (7) (8)
Equipment EquipmentType TypeAFCS 7 0 (7) AFCS 9 13 4 (3) $144,180
AFSM 100 5 5 0 AFSM 100 5 5 0 0
APPS 0 0 0 APPS 0 0 0 0
CIOSS 0 0 0 CIOSS 3 3 0 0
CSBCS 0 0 0 CSBCS 0 0 0 0
DBCS 32 34 2 DBCS 33 36 3 5 $25,179
DBCS-OSS 0 0 0 DBCS-OSS 0 0 0 0
DIOSS 4 2 (2) DIOSS 5 8 3 1 $25,179
FSS 0 0 0 FSS 2 2 0 0
SPBS 1 1 0 SPBS 1 1 0 0UFSM 0 0 0 UFSM 0 0 0 0
FC / MICRO MARK 0 2 2 FC / MICRO MARK 3 3 0 2
ROBOT GANTRY 6 6 0 ROBOT GANTRY 4 4 0 0
HSTS / HSUS 0 0 0 HSTS / HSUS 0 0 0 0
LCTS / LCUS 0 0 0 LCTS / LCUS 2 2 0 0
LIPS 0 0 0 LIPS 0 0 0 0
MLOCR-ISS 0 0 0 MLOCR-ISS 0 0 0 0
MPBCS-OSS 0 0 0 MPBCS-OSS 0 0 0 0
TABBER 0 0 0 TABBER 0 0 0 0POWERED
INDUSTRIAL EQUIPMENT
44 44 0POWERED
INDUSTRIAL EQUIPMENT
0 0 0 0
(9) Notes:
AFCS costs include 4 AFCSs at $30,000 each and 2 BDS at $9,090 each plus 4 GBLs at $1,500 each = $144,180.
DBCS & DIOSS moves calculated at $6,893 + 1 GBL @ $1,500 each.
Data Extraction Date:
Difference
September 6, 2012
04/20/12
Current Number
Proposed Number
rev 03/04/2008
(This number is carried forward to Space Evaluation and Other Costs )
Proposed Number
Relocation Costs
North Metro has 2 LCREM & 2 NEC, Atlanta PDC has 2 NEC and 1 LMLM, 1 LCREM. North Metro will require 13 AFCS machines due to arrival profile.
Current Number
DifferenceEquipment
Change
Mail Processing Equipment Relocation Costs from Losing to Gaining Facility: $194,538
MPE Inventory
Atlanta P&DC North Metro P&DCLast Saved:
Package Page 44 AMP MPE Inventory

Last Saved:
3-Digit ZIP Code: 303 3-Digit ZIP Code: 311
1. Collection Points Mon. - Fri. Sat. Mon. - Fri. Sat. Mon. - Fri. Sat. Sat.
83 153 274 298 4 2
225 149 288 186 9 4
86 4 138 15 13 0
394 306 700 499 26 6 0
2. How many collection boxes are designated for "local delivery"? 0
3. How many "local delivery" boxes will be removed as a result of AMP? 0
4.
Quarter/FY Percent
Q4/10 58.3%
Q3/10 68.8%
Q2/10 71.2%
Q1/10 66.6%
5. 6.
Start End Start End Start End Start End
Monday 6:00 2400_ 6:00 2400_ Monday 10:00 19:00 10:00 19:00
Tuesday 6:00 2400_ 6:00 2400_ Tuesday 10:00 19:00 10:00 19:00
Wednesday 6:00 2400_ 6:00 2400_ Wednesday 10:00 19:00 10:00 19:00
Thursday 6:00 2400_ 6:00 2400_ Thursday 10:00 19:00 10:00 19:00
Friday 6:00 2400_ 6:00 2400_ Friday 10:00 19:00 10:00 19:00
Saturday 6:00 2400_ 6:00 2400_ Saturday 10:00 16:00 10:00 16:00
7.
8. Notes:
9.
Line 1
Line 2 Duluth Ga 30026
September 6, 2012
Atlanta P&DC
04/20/11
Current CurrentCurrent
Current
Atlanta Metro
3-Digit ZIP Code:
Current
rev 6/18/2008
30304
Can customers obtain a local postmark in accordance with applicable policies in the Postal Operations Manual?
Gaining Facility:
What postmark will be printed on collection mail?
Proposed
% Carriers returning before 5 p.m.
Mon. - Fri.
Customer Service Issues
Current Proposed
Number picked up after 5 p.m.
Number picked up between 1-5 p.m.
Total Number of Collection Points
Delivery Performance Report
Retail Unit Inside Losing Facility (Window Service Times)
Losing Facility:
5-Digit ZIP Code:Data Extraction Date:
3-Digit ZIP Code: 302
Number picked up before 1 p.m.
Business (Bulk) Mail Acceptance Hours
North Metro P&DC
YES
0
Package Page 45 AMP Customer Service Issues

Last Saved:
1.
2. Lease Information. (If not leased skip to 3 below.)
3.
4. Planned use for acquired space from approved AMP
5. Facility Costs
(This number shown below under One-Time Costs section.
6. Savings Information
(This number carried forward to the Executive Summary )
7. Notes
(This number carried forward to Executive Summary )
07/01/10 :
(3) (6)
$26.17 $26.17
$29.13 $29.13
$30.72 $30.72
$42.93 $42.93
N/A N/A
$1,037,900
$1,232,438
3900 CROWN RD SEATLANTA GA 30304-9997
N/AN/A
$0
One time facility costs are for the removal of the LMS Feed system, BDS and VFS equipment
$0
Facility Costs:
rev 9/24/2008
Atlanta P&DC North Metro P&DC
06/30/11YTD Range of Report:
Wichita KS
APPS N/A
Wichita KS
Wichita KS
Space Evaluation and Other Costs
Street Address:City, State ZIP:
Losing Facility:
Space Evaluation
Affected FacilityFacility Name:
September 6, 2012
Atlanta P&DC
ATLANTA P&DC
Mail Processing Equipment Relocation Costs: (from MPE Inventory )
Space Savings ($):
One-Time Costs
Employee Relocation Costs:
from Atlanta P&DC and the installation of a standalone LMS, upgrade for current LMS and 4 AFCS 200s in North Metro. Cost based on Materials Handling Engineering ROM.
$194,538
Letters
Gaining Facility:
Current Cost per 1,000 Images
Losing Facility:
(1)
Product
(2)
Wichita KS
Associated REC
N/A
48579314352
$1,037,900
Staging areas for over crowded workroom floor conditions, operational space optimization.
Enter any projected one-time facility costs:
Wichita KS
Wichita KS
Enter annual lease cost:
Enter the total interior square footage of the facility:Enter gained square footage expected with the AMP:
Enter lease options/terms:
Current Square Footage
Enter lease expiration date:
(from above)
(5)
Product Associated REC
(4)
Wichita KSPARS Redirects
Total One-Time Costs:
Remote Encoding Center Cost per 1000
Current Cost per 1,000 Images
Flats
PARS COA
Flats
Letters
PARS COA
APPS N/A
Wichita KS PARS Redirects
Package Page 46 AMP Space Evaluation and Other Costs