AMP Capital Investors Quarterly Infrastructure Research Report · AMP Capital Investors Quarterly...
20
AMP Capital Investors Quarterly Infrastructure Research Report Edition 4 - August 2010 Important note: While every care has been taken in the preparation of this document, AMP Capital Investors Limited (ABN 59 001 777 591) (AFSL 232497) makes no representation or warranty as to the accuracy or completeness of any statement in it including, without limitation, any forecasts. The content of this document has either been sourced from third party sources that AMP Capital Investors considers reliable, or is the opinion of AMP Capital Investors. Past performance is not a reliable indicator of future performance. This document has been prepared for the purpose of providing general information, without taking account of any particular investor’s objectives, financial situation or needs. An investor should, before making any investment decisions, consider the appropriateness of the information in this document, and seek professional advice, having regard to the investor’s objectives, financial situation and needs. This document is solely for the use of the party to whom it is provided.
Transcript of AMP Capital Investors Quarterly Infrastructure Research Report · AMP Capital Investors Quarterly...

AMP Capital Investors
Quarterly Infrastructure Research Report Edition 4 - August 2010
Important note: While every care has been taken in the preparation of this document, AMP Capital Investors Limited (ABN 59 001 777 591) (AFSL 232497) makes no representation or warranty as to the accuracy or completeness of any statement in it including, without limitation, any forecasts. The content of this document has either been sourced from third party sources that AMP Capital Investors considers reliable, or is the opinion of AMP Capital Investors. Past performance is not a reliable indicator of future performance. This document has been prepared for the purpose of providing general information, without taking account of any particular investor’s objectives, financial situation or needs. An investor should, before making any investment decisions, consider the appropriateness of the information in this document, and seek professional advice, having regard to the investor’s objectives, financial situation and needs. This document is solely for the use of the party to whom it is provided.

AMP Capital Investors – Infrastructure Research Report, Edition 4
Overview
Welcome to the fourth AMP Capital Investors (AMP Capital) global infrastructure report.
Our survey indicates that India and China have retained their position as the two powerhouses of world infrastructure development. The scale of economic infrastructure development is truly impressive in both countries, but there are distinct differences in approach. India has achieved a far higher participation of the private sector when compared to China, either through direct investment or through Public Private Partnerships (PPPs).
Europe appears to be on the move again, assisted by a very large Russian nuclear power generation project and growing transport infrastructure developments.
In the lead article of this edition, we continue our theme of studying the fallout from the global financial crisis. This time we look at appropriate gearing levels of infrastructure assets in a financial environment in which debt may be relatively expensive for the foreseeable future.
We welcome your feedback. Should you have specific queries, please contact Warwick Mancini ([email protected]) or Greg Maclean ([email protected]).
Post-recession gearing in the Infrastructure sector
Introduction and background
During the global recession, infrastructure stocks essentially tracked downwards in lock step with equity markets as a whole. However, the subsequent recovery of infrastructure stocks has lagged the broader equities market. These trends can be seen from the following graph, which tracks the fortunes of the S&P Global 1200 Index and the S&P Global Infrastructure Index since 2 January 2008.
Global Infrastructure Vs Global Equities
-
20
40
60
80
100
120
Jan-08 Jul-08 Dec-08 Jul-09 Dec-09 Jul-10 Dec-10
Date
Ind
ex
S&P Global 1200
S&P Global Infrastructure
Source: Standard & Poor’s
Note: both indices have been rebased to 100 as at 2 January 2008 to allow easier comparison
2

AMP Capital Investors – Infrastructure Research Report, Edition 4
The weakness in listed infrastructure equities may be a consequence of lingering concerns regarding the high levels of gearing typical of the sector. At the peak of the global financial crisis, debt spreads soared. This can be seen in the following chart, which shows bank credit default swap spreads for the US, Europe and the UK.
While US swaps have stabilised, there is still significant uncertainty concerning Europe. The cost of financing infrastructure could be expected to follow the same trends in each jurisdiction. Australian swaps have followed a generally similar pattern to the US.
Valuations of the privately-held infrastructure funds managed by AMP Capital have held up much better than the market prices of comparable listed funds. These valuations reflect the underlying ability of the assets in the funds to deliver stable long-term cash flows. These assets are generally single-purpose enterprises which are able to attract project financing. Any debt at the fund level is secured by the cash flows from the assets. In these structures, it is relatively easy to quarantine sufficient project cash flow to satisfy lending covenants.
However, valuations have still been adversely impacted, principally by the perceived increase in refinancing risk. The high post-recession debt margins and virtual disappearance of long-term debt have also been significant.
On a global scale, recovery from the recession has been patchy and fragile. The renewed uncertainty concerning sovereign debt in many European countries hints at a possible new liquidity squeeze in debt markets. Compared with pre-crisis levels, debt servicing costs for infrastructure groups are still substantially higher and may remain this way for a significant period. In response, many listed infrastructure groups have reduced their exposure to debt by de-gearing. This means that balance sheets may now be significantly stronger than before the recession. At current pricing levels, these stocks may represent good investment opportunities.
The purpose of this paper is to examine what levels of gearing are appropriate in the current environment to enable a range of infrastructure asset types to deliver secure returns.
3

AMP Capital Investors – Infrastructure Research Report, Edition 4
Infrastructure characteristics
Infrastructure is usually seen as a defensive investment, with stable cash flows in comparison to conventional industrial investments. However, actual performance will largely be determined by the commercial framework in which the asset operates. For example, imagine two physically identical electricity generation facilities with the same operating costs servicing the same electricity grid. One facility has its entire output under long-term contract (with an agreed pricing path) to an investment grade off-take partner. The other sells its entire output on the spot market. While both are undeniably infrastructure, only the first offers long-term secure cash flows.
To produce long-term secure cash flows, infrastructure assets will normally exhibit one or more of the following characteristics:
They will be asset rich with relatively low operating costs.
They will have monopolistic or near-monopolistic market positions, resulting in little revenue risk, e.g. water, gas or electricity distribution. These will typically fall under a regulated environment.
Alternatively, unregulated assets will exhibit sufficient market power to inhibit direct competition, e.g. toll roads, power generation assets (including renewables) supported by long-term power purchase agreements, unregulated energy transmission assets, airports, ports and rail.
They will have revenue streams that are not highly leveraged to economic conditions, e.g. schools, hospitals, aged care facilities and prisons with availability-based government revenue streams.
As a consequence of these factors, volatility in throughput will only impact earnings before interest, taxes, depreciation and amortisation (EBITDA) to a limited extent. The large asset base and low revenue volatility will result in high EBITDA margins, typically greater than 60%. This allows a high percentage of total revenues to be dedicated to the capital servicing requirements of the asset base, and is the basis of the high gearing levels of the sector.
Using a real life example, the following figures show historical proportional EBITDA, i.e. in proportion to the holding company’s shareholding, and EBITDA margins for some infrastructure investments held by the DUET group.
United Energy Dampier to Bunbury Pipeline
Multinet WA Gas Networks
4

AMP Capital Investors – Infrastructure Research Report, Edition 4
United Energy (UE), Multinet (Multi) and WA Gas Networks (WAGN) are low growth, regulated electricity and gas distribution monopolies. The Dampier to Bunbury Pipeline (DBNP) is a natural gas transmission pipeline with long-term capacity contracts. It has more of a growth focus.
Proportional cash flows, as measured by EBITDA for UE, Multi and WAGN are very consistent. DBNP shows strong growth. EBITDA margins are well above 60%, confirming the assets’ ability to support significant debt.
Why are infrastructure assets highly geared?
Infrastructure is an essential enabler of economic growth and social security. Therefore, governments are keen to ensure that appropriate service levels are available to the community at the lowest cost. Given the high capital intensity of the infrastructure sector, efficient use of capital is important to ensuring the lowest costs. Gearing is the primary means of achieving this capital efficiency by substituting relatively cheap debt for expensive equity, i.e. the higher the gearing the lower the cost of the service to the consumer.
From a shareholder’s perspective, gearing both reduces the requirement for equity and also boosts the returns on the equity that is invested. This can be seen in the following graph. The after tax weighted average cost of capital (WACC) for an infrastructure asset reduces in a linear fashion as gearing increases (left hand scale). The right hand scale shows that the return on equity to investors increases as gearing levels increase.
0.35
Both the consumer and the investor, therefore, have an interest in maximising gearing levels. However, as recent events have confirmed, there is a limit to how far gearing can be taken.
Just as gearing leverages up returns, it also leverages the investment risk, i.e. any cash flow volatility falls directly to the bottom line and sooner or later this volatility will impact dividends. Below are the symptoms of excessive gearing in increasing order of severity.
1. Reduced dividends.
2. Dividend lock-up as debt financiers ensure their security.
3. Equity for debt swaps, diluting the original equity holding.
The very high returns at very high gearing levels forecast by the gearing model are therefore not sustainable.
The issue of appropriate gearing levels then reduces to identifying how far gearing can be extended before the leveraging of risk to equity adversely impacts the long-term sustainability of investment in the asset.
Asset Beta
50%
Imputation Credit
19%
Effective Tax Rate
1.20Debt Margin
6%Market Risk Premium
6%Risk Free
Assumptions
Gearing Impacts
0% 10% 20% 30% 40% 50% 60% 70% 80% 90% 100%
Gearing
0.00%
5.00%
10.00%
15.00%
20.00%
25.00%
Po
st
tax
Re
turn
on
Eq
uit
y
6.50%
6.60%
6.70%
6.80%
6.90%
7.00%
7.10%
7.20%
7.30%
Po
st
Ta
x W
AC
C (
No
min
al)
Risk to Dividends Increases
Post Tax WACC Post Tax ROE
5

AMP Capital Investors – Infrastructure Research Report, Edition 4
Consider the example of a notional regulated utility. The regulator would determine the required level of revenues from a bottom-up ‘building block’ approach and would normally allow the following.
1. A return on the asset base (RAB). Returns are determined by a balancing between consumer demands for a low service cost while attracting sufficient equity to ensure sustainability of the service and, in particular, by ensuring that the asset achieves an investment grade rating. The main tool available to the regulator in achieving this balance is gearing.
2. Depreciation, or return of assets, based on the effective life of the assets.
3. Recovery of efficient development costs. This will include both spending to replace obsolete assets (repex) and spending to develop additional capacity (capex). Recovery would normally include allowances for escalation.
4. Recovery of efficient operating costs. These are usually based on industry benchmarks and performance indicators. Recovery would normally include allowances for escalation.
5. Recovery of tax after any tax credits.
The following graph provides an illustration of how the building block approach produces the revenue streams required to ensure the sustainability of the asset.
Cash Flow Building Blocks
0.0%
10.0%
20.0%
30.0%
40.0%
50.0%
60.0%
70.0%
80.0%
90.0%
100.0%
110.0%
120.0%
Asset BaseEquity
Asset BaseDebt
Depreciation Repex Equity Repex Debt Capex Equity Capex Debt OperatingCosts
Tax
Category
Typical range of actual cash flows
In this example, about 25% of cash flows are required for operations, giving an EBITDA margin of around 75%, i.e. similar to that exhibited in the real life examples above. This leaves approximately 70% of cash flows available for the servicing of the financing of the asset base.
Actual revenues will vary from that assumed. This usually results from:
1. Tariff structure impacts, particularly the split between fixed and volume variable charges. Revenues will be less volatile the higher the percentage of availability type charges in the tariff mix, and more volatile the higher the percentage of volume-based tariffs.
2. Differences between assumed and actual operating conditions, including throughputs and outages, etc. These will impact operating costs at the margin.
3. Differences between actual and assumed escalation factors.
6

AMP Capital Investors – Infrastructure Research Report, Edition 4
Superimposed on the previous graph is the range (5 percentile to 95 percentile) of revenues generated from a Monte Carlo simulation of cash flows from an actual regulated gas distributor1. This suggested that actual cash flows will most probably vary from between 93% and 105% of the target cash flow determined by the regulator. From this, it follows that there is a very high probability (greater than 95%, or 19 in 20 year certainty) that in any one year cash flows will exceed 93% of the target.
In the above example, the assumed gearing is 70% of the RAB. This is somewhat higher than a regulator would normally allow, but still produces a reasonably conservative outcome. Debt servicing costs (essentially interest) consume about 33% of the target cash flows with swap margins of 175 points over a risk free rate of 6%. This gives a notional cover ratio (EBITDA to debt service) of around 2.2. For 19 out of 20 years, the cover ratio will exceed 2, i.e. (0.93*target revenues - operations) / debt service >2.
We are of the opinion that a 5 percentile cover ratio of 2 is a good proxy for an investment grade rating (BBB) for infrastructure assets. It provides some buffer for movements in interest rates and sufficient residual cash flows to undertake reasonable levels of capital expenditure without recourse to the shareholders. This same approach can be applied to any infrastructure asset, regulated or not.
The high percentage of revenue that can be devoted to capital servicing allows much higher levels of gearing than would be appropriate in other industrial assets. This should be seen largely as a natural consequence of the capital intensive nature of infrastructure provision relative to conventional businesses. Although gearing increases return volatility, the analysis shows that if managed correctly high gearing can be compatible with investment grade returns.
Not all infrastructure assets enjoy such high levels of cash flow stability as our example, so we would expect to see a differentiation in gearing levels between asset types.
Typically, the highest gearing is seen in businesses reliant on long-term government underwritten cash flows. For example, gearing levels greater than 90% can be seen in the UK private finance initiative (PFI) accommodation sector. Patronage risk is usually passed through to government and revenue risk is normally limited to meeting benchmarks for availability and consumables. In the UK at least these businesses have been able to secure fully amortising debt, matching the term of the PFI agreement. This effectively eliminates refinancing risk. As such, they are virtually immune to credit squeezes.
At the other end of the spectrum are assets which are exposed to a more competitive environment, such as ports (air and sea) and toll roads. For example, Gatwick Airport is currently geared at 50% post its recent sale2.
Assets with lower gearing tend to be subject to significant direct and indirect competition, as well as patronage risk. They may not be regulated, which further reduces certainty, and will have to refinance debt on a regular basis.
How can this rule be applied to other assets?
Adopting a minimum cover ratio rule will affect gearing on infrastructure assets depending on two factors:
1. EBITDA volatility.
2. A forward view of interest spreads, weighted over the debt portfolio.
EBITDA volatility, or the inherent business operating risk, is encapsulated in the asset, or unlevered, beta. Very low-risk assets, such as the PFI assets discussed above, may have asset betas as low as 0.15, whereas higher-risk assets, such as airports, may have asset betas around 0.5. Gearing increases the volatility of cash flows and therefore increases the beta. Some typical unlevered betas for various types of infrastructure assets are given in the following table.
1 Source: AMP Capital modelling 2 Source: Reuters
7

AMP Capital Investors – Infrastructure Research Report, Edition 4
Asset (Unlevered) Beta
Low Middle High Source
UK PFI assets 0.10 0.15 0.20 AMP Capital Research
Regulated water utility 0.22 0.25 0.33 AMP Capital Research
Regulated electricity connector 0.40 0.43 0.50 AMP Capital Research
Contracted gas fired power station 0.55 0.60 0.65 AMP Capital Research
Contracted gas pipeline 0.30 0.35 0.40 AMP Capital Research
Gas processing plant 0.55 0.60 0.65 AMP Capital Research
Electricity distributor 0.25 0.30 0.35 Bloomberg
Gas distributor 0.30 0.35 0.40 AMP Capital Research
Regulated airports 0.42 0.45 0.50 AMP Capital Research
Non-regulated airports 0.55 0.60 0.70 AMP Capital Research
Ports 0.55 0.60 0.70 AMP Capital Research
Toll roads (established) 0.45 0.50 0.55 AMP Capital Research
The relationship of beta to gearing is shown in the following graph. Equity betas were calculated from asset betas according to the equation: equity beta = [1 + (1-tax rate) * debt/equity] * asset beta.
Gearing Versus Asset Beta (βa )
0.60
0.65
0.70
0.75
0.80
0.85
0.90
0.95
1.00
1.05
1.10
1.15
1.20
40% 45% 50% 55% 60% 65% 70% 75% 80% 85%
Gearing
Equity (Geared) Beta (βe )
βa = 0.25 βa = 0.30 βa = 0.35 βa = 0.40 βa = 0.45 βa = 0.50 βa = 0.55 βa = 0.60
Gas Distribution
Example
Source: AMP Capital Research
The gas distribution business we used in our building block example has an asset beta determined by valuers, in valuations over time, of between 0.33 and 0.37. Using the above graph, it can be seen that an asset with an ungeared beta of 0.35 – the average for our sample utility – will produce an equity beta of about 0.95 if it is geared to about 68%. This is essentially the same gearing as determined from the bottom-up approach developed in the example.
8

AMP Capital Investors – Infrastructure Research Report, Edition 4
By adopting a target equity beta of 0.95, appropriate gearing levels can be calculated for assets with different ungeared betas, i.e. different types of infrastructure assets, as per the following graph. The graph also shows the impact of different interest rate spreads on the gearing level. In effect, this allows an appropriate gearing level to be estimated for different assets under a wide range of debt market conditions.
For example, consider an unregulated airport with an asset beta of between 0.55 and 0.60. If we assume it will have to support a debt portfolio with a weighted average spread of 200 points, a gearing level of between 42% and 38% is appropriate, which approximates to a BBB rating. This is somewhat more than the gearing of Melbourne Airport (33%). If we consider instead a regulated airport with an asset beta of between 0.45 and 0.50, the resulting gearing range is between 52% and 48%, which straddles the gearing involved in the recent Gatwick sale.
The results hold broadly true for different markets around the world.
Maximum Gearing Levels Vs Asset Beta
30%
40%
50%
60%
70%
80%
90%
0.2 0.25 0.3 0.35 0.4 0.45 0.5 0.55 0.6 0.65
Asset Beta
Gea
rin
g (
% D
eb
t/A
sse
t B
ase
)
100
125
150
175
200
225
250
275
300
Airport ExampleDebt Spreads
Debt portfolio management
A few words of caution are necessary. Gearing levels are just one aspect of managing debt. Also important are the actual debt service covenants required by financiers. Integration of capital works and debt management strategies is an important means of ensuring that covenants are not breached. A proactive asset manager will generally defer new capital expenditure if debt financing conditions are unfavourable.
Active management of an asset’s debt portfolio represents both major opportunities and risks, and offers the best opportunity for outperformance. Typically, the infrastructure asset owner will actively manage a hedged debt portfolio diversified by debt term and maturity dates. This creates opportunities to refinance a portion of the debt when margins are low and, conversely, minimises downside risks if a proportion of the debt becomes due during a period of high margins.
Conclusion
The above considerations indicate that, even in the current environment, infrastructure assets can still accommodate much higher levels of gearing than conventional industrial assets while producing stable returns.
9

AMP Capital Investors – Infrastructure Research Report, Edition 4
Infrastructure update
How to read this section
In this section, recent infrastructure activity is summarised by region and sector. The geographic spread principally considers developed (OECD) and the main emerging economies. The following four regions are included:
1. Europe
2. North America (principally the US and Canada)
3. North Asia (principally China and India)
4. Australasia, Australia and New Zealand.
The sectors are summarised in the following table.
Sector Summary
Power New generation assets, apart from renewable energy.
Transmission, Distribution Energy distribution, principally electricity and natural gas.
Transport All transport infrastructure, including air and sea ports, railways and road developments.
Water and sewage Assets associated with management of the water cycle from collection, distribution, treatment and disposal.
Irrigation projects are also included.
Telecommunications Communications assets.
Social infrastructure Includes health, education and justice assets.
Storage Principally energy storage projects, including liquid hydrocarbons, natural gas and carbon sequestration.
Additionally, pipelines built for carbon sequestration will be included in this sector.
Renewables Renewable generation projects of all types.
To assist in analysing this information, the nature of the funding has been further broken down, as:
Investment – This refers to where a traditional funding model is used for both new stand alone developments and the development of an existing asset base. The latter represents ‘business as usual’ activity in either replacing or growing existing infrastructure assets. In general, infrastructure operators have demonstrated that they can fund the equity requirements of all but the largest of expansion projects from cash flows.
PPPs – This covers all types of private sector provision of infrastructure, including BOOT schemes, concessions and design build, and finance. From this edition onward, projects involving privatised utilities, such as the UK water companies, will be counted as PPPs, as these represent expenditure which does not appear on the Government’s balance sheets.
Merger & acquisition (M&A) activity – Whilst this does not represent bricks and mortar construction activity, it is a useful indicator of the attractiveness of the sector to investors overall.
Private equity (PE) – This will generally relate to private investment in infrastructure assets.
This summary was developed from publically available sources and while due care has been exercised in its preparation, AMP Capital offers no warranties as to its completeness or accuracy.
10

AMP Capital Investors – Infrastructure Research Report, Edition 4
European infrastructure (March 2010 to May 2010) The following is a discussion on the European infrastructure environment over the period March 2010 to May 2010.
A total of 54 significant deals were announced with a total value of US$40.3 billion. Main volumes were out of the Russia, with large power and transport projects, followed by the UK, where a number of large transport projects were announced. Poland also figures strongly with a continuation of European Union (EU) funded transport projects.
Whilst project numbers have not changed greatly from the last survey period, average value is much greater. Projects in both Eastern and Western Europe also tend to focus very much on economic infrastructure development. This suggests they will lead to the significant medium and long term GDP growth necessary for Western European economies to work their way out of their high debt burdens.
Infrastructure Spending by Country - Europe
$-
$2,000
$4,000
$6,000
$8,000
$10,000
$12,000
Russia UK
Poland
Franc
eIta
ly
Roman
ia
Irelan
d
Hunga
ry
Portu
gal
Ger
man
y
Bulgar
ia
Finlan
d
Czech
Rep
ublic
Spain
Norway
Bosnia
Val
ue
(US
$ m
)
European infrastructure investments by sector
The transport sector was again the main focus, with almost 50% of the total by value. Power generation, mainly nuclear, also figured strongly.
Infrastructure Spending by Sector - EuropeMar 2010 to May 2010
Transport, $19,476 , 47%
Pow er, $13,116 , 33%
Telecoms, $3,510 , 9%
Transmission, Distribution & Storage, $1,873 , 5%
Renew ables, $1,985 , 5%
Water & Sew age, $279 , 1%Social Infrastructure, $102 , 0%
11
AMP Capital Investors – Infrastructure Research Report, Edition 4
Roads
Road development was down, with developments mainly focused in Eastern Europe. The major projects, i.e. those greater than US$0.5 billion, are summarised in the following table. Both are being developed under PPP arrangements.
Project Cost (US$ millions)
Funding has been obtained for a 43 kilometre segment of the Moscow to St. Petersburg toll road, with construction
commencing this summer.
$2,249
Italian highway concessionaire, ANAS, is developing a number of key projects that will improve the country’s road
network. The first project of this program is the Novara bypass, which will improve the Turin to Milan route.
$1,389
Airports
As anticipated in our previous report, airport projects continue to be announced. The major projects include:
Project Cost (US$ millions)
Poland's eight largest airports will invest €1.2 billion up to 2015 in redevelopments. €400 million of this is to be
acquired from EU funds. Warsaw and Krakaw airports plan to invest €336 million and €253 million respectively.
$1,708
Ferrovial announced the construction of a new Heathrow terminal. $1,265
Rail
In France, infrastructure manager RFF received final offers for the contract to build and maintain LGV Bretagne-Pays-de-la-Loire. Expected to cost around €3.4 billion (US$4.8 billion) at current prices, the 214 kilometre route will extend the Le Mans branch of LGV Atlantique to Rennes, with a connecting link to shorten journey times on the route to Nantes.
Renewable Energy
Renewable projects were again mostly small scale. The wind sector in Europe has increasingly been dominated by Iberdrola Renovables, which is moving on offshore developments in Germany and plans a pipeline of smaller scale inland projects in Eastern Europe.
Power Generation
Nuclear energy continues to gain momentum, with Russia constructing a nuclear power plant in the Kaliningrad Oblast, near the Polish-Russian border. The plant is scheduled to be completed in 2016. The cost is expected to amount to €6 billion (US$7.32 billion) and will produce enough energy for the Russian enclave, with potential exports to Poland.
Also in Poland, Energa is to build new conventional low-emission and sustainable plants totalling some 2,200 MW at a cost of €$4.7 billion.
12

AMP Capital Investors – Infrastructure Research Report, Edition 4
European infrastructure investments by type
Interestingly, private sector investments, either through direct investment (PE) or concession (PPP), amounted to almost 50% of the value of projects announced in the period. This trend is forecast to continue as Western European countries try to rein in their sovereign debt.
The largest PE deal is the development of the London Gateway port project (US$2.5 billion).
The largest PPP deal is the LGV expansion, followed by the Moscow to St Petersburg Tollway and the Italian Novarra Bypass projects, described above.
M&A activity was relatively muted.
Infrastructure Investment by Type - EuropeMar 2010 to May 2010
Investment, $20,823 , 50%
M&A, $945 , 2%PE, $9,374 , 22%
PPP, $10,756 , 26%
13

AMP Capital Investors – Infrastructure Research Report, Edition 4
North American infrastructure (March 2010 to May 2010) US spending continued strongly, while Canada lagged. Overall investment levels continued to show strength, with $US36.4 billion being committed. The major emphasis continued to be transport, with greater than 60% of the total. Power generation and social infrastructure spending also remained strong.
Infrastructure Spending by Sector - North AmericaMar 2010 to May 2010
Transport, 20,017.8, 61%
Water & Sew age, 222.9, 1%
Pow er, 5,449.0, 17%
Telecoms, 1,100.0, 3%
Renew ables, 790.8, 2%
Transmission, Distribution & Storage, 0, 0%
Social Infrastructure, 5,272.4, 16%
There was significant activity across almost all sub-sectors, with the big winner being airports. The most significant projects by value, sorted by sub-sector, are summarised below.
Airports
The major projects announced were:
Project Cost (US$ millions)
The US Federal Aviation Administration (FAA) announced a US$5.2 billion expansion plan for Philadelphia
International Airport.
$5,200
Minneapolis St. Paul International Airport proposed plans to commence US$2.4 billion in additional improvements,
including gate additions, a cross-bound taxiway, remodelling for the terminals and eventually an inter-airport light rail
expansion.
$2,400
Canada’s Calgary International Airport announced plans to invest CAD2.4 billion over a five-year period to expand the
airport’s facilities, including a 22-aircraft gate wing, a CAD1.3 billion concourse and a new 4,267 metre runway – the
longest in Canada. The airport’s runway is due to open in 2015.
$1,800
Honolulu International Airport in Hawaii will soon begin preliminary work to replace the old Interisland Terminal as part
of a US$2.3 billion state-wide airport modernisation plan.
$1,700
San Diego International Airport announced plans to upgrade Terminal 2. $1,000
DFW International Airport in Dallas has awarded a US$900 million pre-construction and construction contract for its
terminals to Balfour Beatty Construction.
$900
14

AMP Capital Investors – Infrastructure Research Report, Edition 4
Roads
The following major projects were noted:
Project Cost (US$ millions)
The Windsor to Essex Parkway link will provide an 11 kilometre link between Highway 401 in Ontario (Canada) and
the US border through Michigan State.
$1,600
The Chinook Roads consortium was awarded the design, build, finance, construct and operate contract for Calgary’s
new Southeast Stoney Trail project. This 25 kilometre link will form part of the fast-growing Canadian city's ring road,
and is being developed under a PPP model.
$763
Rail
US President Obama’s Fiscal Year 2011 budget proposes US$1.82 billion in funding for 27 major rail transit construction projects, including US$834.6 million for 19 new projects. The plan also provides US$924.6 million for the continued funding of eight projects already under construction in New York, Dallas, Denver, Salt Lake City, Seattle and Northern Virginia.
Additionally, construction will proceed on the Central Corridor LRT project between St. Paul and Minneapolis. The 11 mile Central Corridor route will link Union Depot with the existing Hiawatha Line LRT and cost an estimated US$0.96 billion.
Telecommunications
Investment activity remains muted.
Renewable Energy
A total of US$2.5 billion of predominately wind projects were announced.
North American infrastructure investments by type
PPPs were largely confined to Canadian road projects. PE investment was mainly confined to the electricity generation sector, both conventional and renewable, while M&A activity remained subdued.
Infrastructure Investment by Type - North AmericaMar 2010 to May 2010
Investment, 24,877.7, 66%
M&A, 1,550.0, 4%
PE, 10,503.8, 27%
PPP, 1,325.6, 3%
15

AMP Capital Investors – Infrastructure Research Report, Edition 4
North Asian infrastructure (March 2010 to May 2010) China and India continued their rapid expansion, with 48 large projects. However, there was a stark difference in the means, with India continuing to embrace a PPP model wherever practical. Economic infrastructure was again the focus in both countries, as can be seen in the attached graph, though there was a significant difference in direction (as measured by sectors). Note, the Indian telecoms figure is inflated by a large M&A transaction (see below).
Infrastructure Investment by Sector - North AsiaMarch to May
$0
$5,000
$10,000
$15,000
$20,000
$25,000
$30,000
$35,000
India China
Co
mm
itte
d In
ve
stm
en
t ($
US
m)
Transport Water & Sewage Power Telecoms Renewables Transmission, Distribution & Storage Social Infrastructure
The major projects by sub-sector are summarised below.
Roads
Road developments were numerous but somewhat smaller in scale to previous reporting periods. Activity included the following significant projects:
Project Cost (US$ millions)
China's Xinjiang region is investing US$2.2 billion to complete its targeted 152,000 kilometres of road construction
projects by the end of 2010.
$2,200
IL&FS Transportation won a INR25.19 billion order from NHAI. The project work includes increasing the Chennai to
Nashri Section of NH-1A to four lanes and the development of a two-lane, nine kilometre tunnel with parallel escape
tunnels in the State of Jammu and Kashmir.
$524
16

AMP Capital Investors – Infrastructure Research Report, Edition 4
Ports
Indian ports continued their expansion, with the following major project announcements:
Project Cost (US$ millions)
The Indian government confirmed port expansion projects of INR14,000 crore under the PPP mode in the coming 2010-
11 fiscal year
$2,915
The Kandla Port has unveiled development plans for an estimated investment of INR5,081 crore over the next three
years.
$1,058
The Goa-based Mormugao Port Trust, a major port, has announced modernisation and infrastructure development of
INR3,000 crore over the next four years.
$625
Airports
The Chinese government announced plans to invest US$13 billion in 25 airport projects in 2010. The major projects identified include:
Project Cost (US$ millions)
Gammon Construction, in partnership with Hip Hing Construction, will build a new air cargo terminal at Hong Kong
International Airport in China.
$541
Xiamen Gaoqi International Airport in Fujian will build a new runway and add 27 aircraft stands as part of an expansion
plan.
$500
Renewables
China confirmed its intention to improve environmental outcomes of power generation with the announcement that China's National BioEnergy Company, a subsidiary company of the Dragon Power Group, will build 100 biomass-based electricity generator projects over the next five years. Finance totalling US$4 billion will be provided by the China Construction Bank.
Transmission and distribution
In one of the largest PPP deals ever, Power Grid Corporation of India Ltd. announced the signing of long-term transmission pacts with 37 private developers with the aim of connecting gross generation capacity of over 42,000 MW to India’s network. Estimated costs are US$10 billion.
Meanwhile, China announced the commencement of projects to modernise their electricity transmission network (Smartgrid) worth US$1.0 billion.
17

AMP Capital Investors – Infrastructure Research Report, Edition 4
North Asian infrastructure investments by type
The following graph shows the breakdown in projects by type in both China and India. The major news was Bharti Airtel Ltd. buying a majority of Kuwait's Mobile Telecommunications Company’s (or Zain) African assets. The deal was worth US$10.7 billion and will result in a likely total payout of about US$9 billion (the rest being the estimated debt of the target). This marks the first major offshore expansion of India’s phenomenally successful telecom sector (see Report 1). Indian companies have excellent experience in developing networks in areas of low socioeconomic status, and this deal may be the first of a new trend.
Figures continue to show the stark contrast in the funding of projects between China and India.
Infrastructure Investment by Country and Type - North AsiaMarch to May 2010
$0
$5,000
$10,000
$15,000
$20,000
$25,000
$30,000
$35,000
India China
Inv
es
tme
nt
(US
$ m
)
Investment PE PPP M&A
18
AMP Capital Investors – Infrastructure Research Report, Edition 4
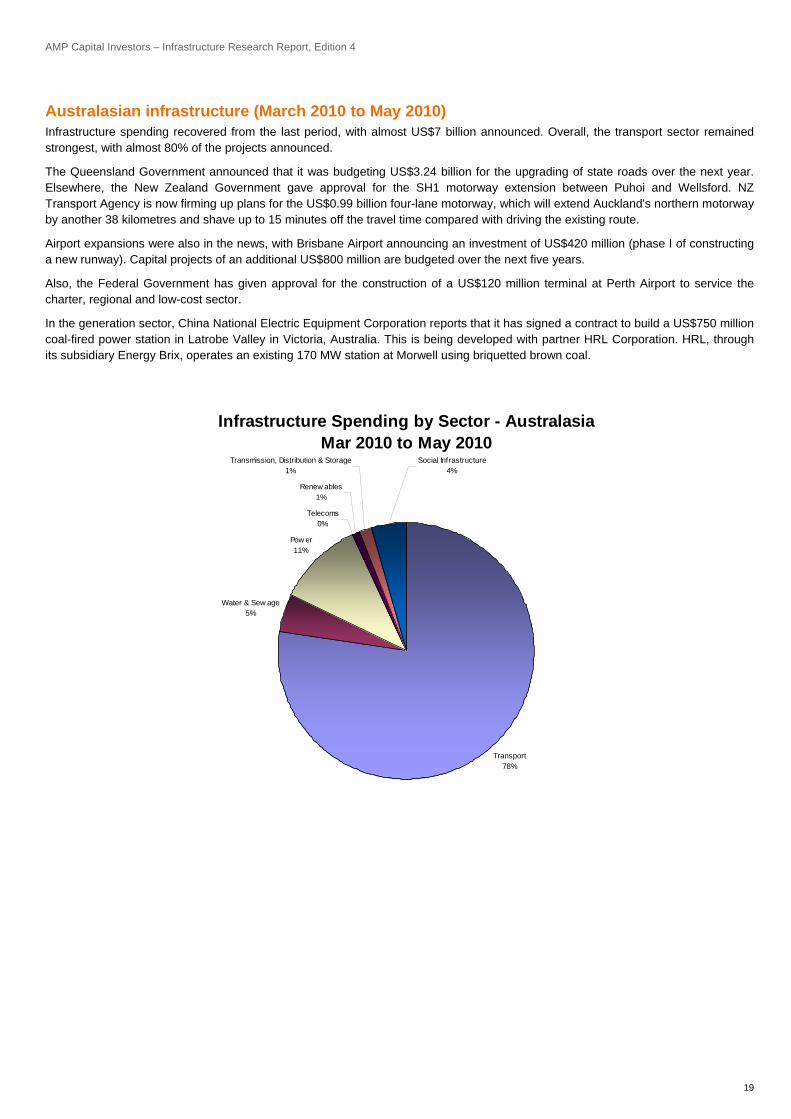
Australasian infrastructure (March 2010 to May 2010) Infrastructure spending recovered from the last period, with almost US$7 billion announced. Overall, the transport sector remained strongest, with almost 80% of the projects announced.
The Queensland Government announced that it was budgeting US$3.24 billion for the upgrading of state roads over the next year. Elsewhere, the New Zealand Government gave approval for the SH1 motorway extension between Puhoi and Wellsford. NZ Transport Agency is now firming up plans for the US$0.99 billion four-lane motorway, which will extend Auckland's northern motorway by another 38 kilometres and shave up to 15 minutes off the travel time compared with driving the existing route.
Airport expansions were also in the news, with Brisbane Airport announcing an investment of US$420 million (phase I of constructing a new runway). Capital projects of an additional US$800 million are budgeted over the next five years.
Also, the Federal Government has given approval for the construction of a US$120 million terminal at Perth Airport to service the charter, regional and low-cost sector.
In the generation sector, China National Electric Equipment Corporation reports that it has signed a contract to build a US$750 million coal-fired power station in Latrobe Valley in Victoria, Australia. This is being developed with partner HRL Corporation. HRL, through its subsidiary Energy Brix, operates an existing 170 MW station at Morwell using briquetted brown coal.
Infrastructure Spending by Sector - AustralasiaMar 2010 to May 2010
Transport78%
Water & Sew age5%
Pow er11%
Telecoms0%
Renew ables1%
Transmission, Distribution & Storage1%
Social Infrastructure4%
19

AMP Capital Investors – Infrastructure Research Report, Edition 4
20
Australasian infrastructure investments by type
Most investment was of the traditional type. M&A activity was muted and the only PPP of note was the announcement that an Auckland-based consortium had won a US$300 million contract to build a prison in Victoria.
.
Infrastructure Investment by Type - Australasia
Mar 2010 to May 2010
Investment, $4,839 , 71%
M&A, $- , 0%
PE, $1,678 , 25%
PPP, $300 , 4%