AMP Capital Investors: Karrinyup Activity Centre Structure ... daps... · Assumes growth of...
20
25 AMP Capital Investors: Karrinyup Activity Centre Structure Plan City of Stirling Impacts of Growth at the Karrinyup Secondary Activity Centre 12 June 2014 11 LGA Centre Name PLUC 5 Floorspace 2011 (m²) Turnover 2011 ($/m²) PLUC 5 Floorspace 2026 (m²) Turnover 2026 ($/m²) Trade Impact Stirling Shakespeare Ave/Beryl St LAC’s 260 $6,722.02 500 $6,830.85 1.62% Stirling Stirling Isolated Uses (10) 390 $5,610.32 390 $5,981.22 6.61% Stirling Yokine LAC 2805 $4,574.50 3,000 $4,828.27 5.55% Stirling Tuart Hill NAC 800 $5,541.32 800 $5,834.17 5.28% Stirling Powell Street LAC 2200 $5,518.36 2,200 $5,831.11 5.67% Stirling Scarbourough Beach Rd #2 NAC 1185 $5,564.67 1,185 $5,826.69 4.71% Stirling McDonald/Main St NAC 100 $3,614.92 100 $3,896.84 7.80% Stirling French Street LAC 220 $3,494.60 220 $4,311.56 23.38% Stirling St Peters Place LAC 1328 $4,698.67 1,328 $5,240.14 11.52% City of Stirling Impacts of Growth at the Karrinyup Secondary Activity Centre 12 June 2014 12 Table 5 below shows estimated trade impacts based on: No growth, at the Karrinyup SAC as at 2026. Includes all local planning strategy proposals for surrounding LGA’s as at 2026. Assumes growth of 110,000m² at the Stirling SMC, 55,000m² at Mirrabooka, 125,000m² at the Joondalup SMC and 75,000m² at the Whitfords SAC. Table 5 LGA Centre Name PLUC 5 Floorspace 2011 (m²) Turnover 2011 ($/m²) PLUC 5 Floorspace 2026 (m²) Turnover 2026 ($/m²) Trade Impact Joondalup Whitfords SAC 49924 $7,725.43 75,000 $7,150.08 -7.45% Joondalup Warwick DAC 25614 $6,064.54 50,000 $5,848.50 -3.56% Joondalup Gwendoline Drive NAC 6148 $7,121.20 10,000 $6,883.78 -3.33% Joondalup Kinross A NAC 4300 $4,784.90 4,300 $4,838.78 1.13% Joondalup Carine Glades NAC 3991 $6,832.14 3,991 $6,367.93 -6.79% Joondalup Kingsley NAC 3983 $5,412.93 3,983 $4,963.12 -8.31% Joondalup Beldon NAC 3768 $10,849.57 3,768 $10,008.16 -7.76% Joondalup Hillary’s NAC 2992 $8,639.61 2,992 $7,763.24 -10.14% Joondalup Beaumaris City NAC 2459 $7,236.22 2,459 $6,840.29 -5.47% Joondalup Duncraig (north) NAC 2388 $7,073.22 2,388 $6,635.89 -6.18% Joondalup Heathridge NAC 2324 $6,885.54 2,324 $6,678.63 -3.00% Joondalup Padbury NAC 2064 $7,112.69 2,064 $6,422.67 -9.70% Joondalup Hepburn NAC 1971 $5,001.15 1,971 $4,576.24 -8.50% Joondalup Ocean Reef NAC 1957 $7,547.21 1,957 $7,142.90 -5.36% Joondalup Mullaloo NAC 1882 $7,118.47 1,882 $6,571.65 -7.68% Joondalup Sheppard Way NAC 1789 $7,105.50 1,789 $6,607.05 -7.01% Joondalup Candlewood NAC 1662 $7,085.13 1,662 $7,233.29 2.09% Joondalup Glengarry NAC 2890 $7,030.53 2,890 $6,495.74 -7.61% Joondalup Sorrento NAC 1278 $5,794.18 1,278 $5,432.88 -6.24% Joondalup Edgewater NAC 1236 $7,271.09 1,236 $7,474.12 2.79% Joondalup Greenwood Plaza LAC 1000 $7,215.54 1,000 $7,025.16 -2.64% Joondalup Duncraig Village LAC 885 $6,499.95 885 $5,986.42 -7.90% Joondalup Coolibah LAC 808 $7,216.00 808 $6,592.84 -8.64% Joondalup Springfield LAC 728 $5,081.38 728 $4,614.46 -9.19% Joondalup Harman Road LAC 724 $6,356.87 724 $5,767.48 -9.27% Joondalup Moolanda South LAC 678 $5,427.93 678 $5,164.37 -4.86% Joondalup Moolanda North LAC 206 $5,524.43 206 $5,156.84 -6.65% Joondalup Kinross B LAC 500 $4,554.25 500 $4,787.13 5.11% Joondalup Lilburne Road LAC 450 $5,705.34 450 $5,283.78 -7.39% Joondalup Woodvale DAC 7460 $7,725.82 15,000 $8,340.14 7.95% Joondalup Sorrento_Quays (tourist) 7261 $3,823.31 8,000 $3,504.50 -8.34% Joondalup Currambine DAC 12000 $9,704.55 15,000 $10,391.60 7.08% Joondalup Greenwood DAC 4976 $7,410.74 10,000 $7,118.33 -3.95% Joondalup Craigie NAC 2337 $7,398.58 2,337 $6,921.09 -6.45% Joondalup Joondalup (LFR) 12443 $4,691.36 12,443 $4,598.15 -1.99% Joondalup Waldecks 80 $6,135.85 80 $6,019.50 -1.90% Joondalup Joondalup Drive (LFR) 8534 $5,332.42 8,534 $5,351.23 0.35% Joondalup Joondalup SMC 92990 $6,921.73 125,000 $7,399.23 6.90% Stirling Stirling SMC 57483 $6,248.52 110,000 $6,867.93 9.91% Stirling Osborne Park 61967 $4,632.78 61,967 $5,002.60 7.98%
Transcript of AMP Capital Investors: Karrinyup Activity Centre Structure ... daps... · Assumes growth of...

25
AMP Capital Investors: Karrinyup Activity Centre Structure Plan
City of Stirling Impacts of Growth at the Karrinyup Secondary Activity Centre 12 June 2014
11
LGA
Cen
tre N
ame
PLU
C 5
Fl
oors
pace
2011
(m²)
Turn
over
201
1 ($
/m²)
PLU
C 5
Fl
oors
pace
20
26 (m
²)
Turn
over
202
6 ($
/m²)
Trad
e Im
pact
Stirling Shakespeare Ave/Beryl St LAC’s
260 $6,722.02 500 $6,830.85 1.62%
Stirling Stirling Isolated Uses (10)
390 $5,610.32 390 $5,981.22 6.61%
Stirling Yokine LAC 2805 $4,574.50 3,000 $4,828.27 5.55% Stirling Tuart Hill NAC 800 $5,541.32 800 $5,834.17 5.28% Stirling Powell Street LAC 2200 $5,518.36 2,200 $5,831.11 5.67% Stirling Scarbourough Beach Rd
#2 NAC 1185 $5,564.67 1,185 $5,826.69 4.71%
Stirling McDonald/Main St NAC 100 $3,614.92 100 $3,896.84 7.80% Stirling French Street LAC 220 $3,494.60 220 $4,311.56 23.38% Stirling St Peters Place LAC 1328 $4,698.67 1,328 $5,240.14 11.52%
City of Stirling Impacts of Growth at the Karrinyup Secondary Activity Centre 12 June 2014
12
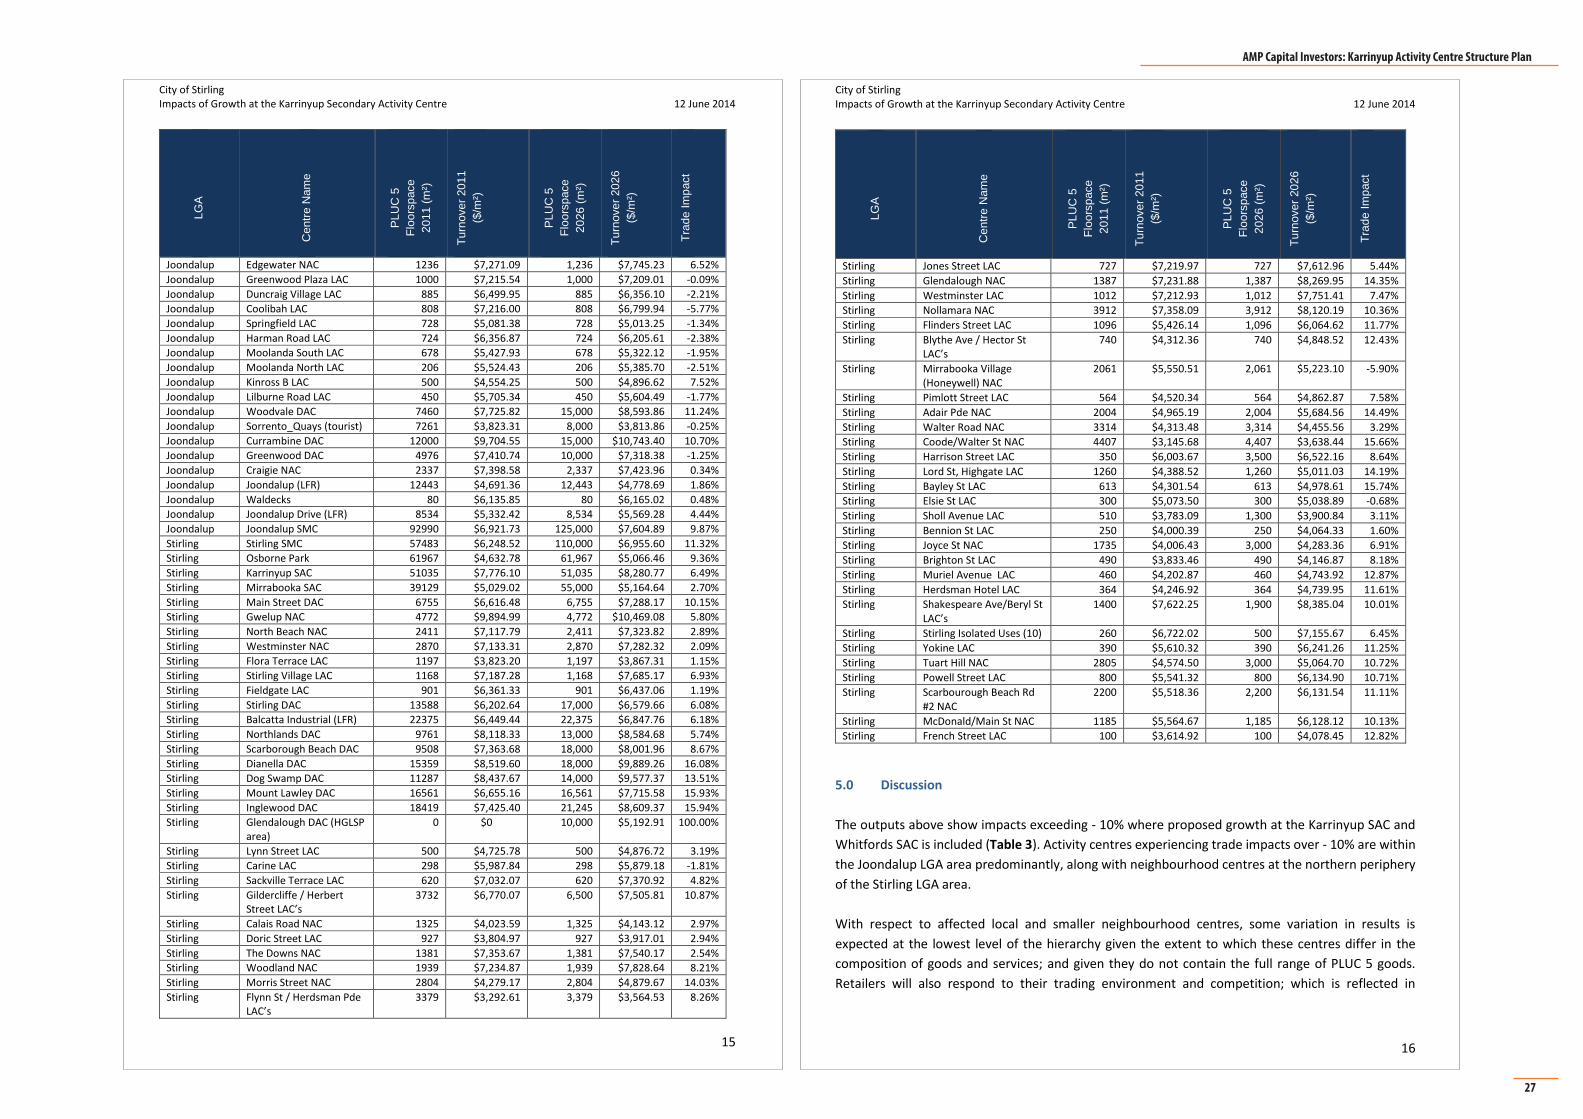
Table 5 below shows estimated trade impacts based on:
No growth, at the Karrinyup SAC as at 2026. Includes all local planning strategy proposals for surrounding LGA’s as at 2026. Assumes growth of 110,000m² at the Stirling SMC, 55,000m² at Mirrabooka, 125,000m² at the
Joondalup SMC and 75,000m² at the Whitfords SAC. Table 5
LGA
Cen
tre N
ame
PLU
C 5
Fl
oors
pace
2011
(m²)
Turn
over
201
1 ($
/m²)
PLU
C 5
Fl
oors
pace
20
26 (m
²)
Turn
over
202
6 ($
/m²)
Trad
e Im
pact
Joondalup Whitfords SAC 49924 $7,725.43 75,000 $7,150.08 -7.45% Joondalup Warwick DAC 25614 $6,064.54 50,000 $5,848.50 -3.56% Joondalup Gwendoline Drive NAC 6148 $7,121.20 10,000 $6,883.78 -3.33% Joondalup Kinross A NAC 4300 $4,784.90 4,300 $4,838.78 1.13% Joondalup Carine Glades NAC 3991 $6,832.14 3,991 $6,367.93 -6.79% Joondalup Kingsley NAC 3983 $5,412.93 3,983 $4,963.12 -8.31% Joondalup Beldon NAC 3768 $10,849.57 3,768 $10,008.16 -7.76% Joondalup Hillary’s NAC 2992 $8,639.61 2,992 $7,763.24 -10.14% Joondalup Beaumaris City NAC 2459 $7,236.22 2,459 $6,840.29 -5.47% Joondalup Duncraig (north) NAC 2388 $7,073.22 2,388 $6,635.89 -6.18% Joondalup Heathridge NAC 2324 $6,885.54 2,324 $6,678.63 -3.00% Joondalup Padbury NAC 2064 $7,112.69 2,064 $6,422.67 -9.70% Joondalup Hepburn NAC 1971 $5,001.15 1,971 $4,576.24 -8.50% Joondalup Ocean Reef NAC 1957 $7,547.21 1,957 $7,142.90 -5.36% Joondalup Mullaloo NAC 1882 $7,118.47 1,882 $6,571.65 -7.68% Joondalup Sheppard Way NAC 1789 $7,105.50 1,789 $6,607.05 -7.01% Joondalup Candlewood NAC 1662 $7,085.13 1,662 $7,233.29 2.09% Joondalup Glengarry NAC 2890 $7,030.53 2,890 $6,495.74 -7.61% Joondalup Sorrento NAC 1278 $5,794.18 1,278 $5,432.88 -6.24% Joondalup Edgewater NAC 1236 $7,271.09 1,236 $7,474.12 2.79% Joondalup Greenwood Plaza LAC 1000 $7,215.54 1,000 $7,025.16 -2.64% Joondalup Duncraig Village LAC 885 $6,499.95 885 $5,986.42 -7.90% Joondalup Coolibah LAC 808 $7,216.00 808 $6,592.84 -8.64% Joondalup Springfield LAC 728 $5,081.38 728 $4,614.46 -9.19% Joondalup Harman Road LAC 724 $6,356.87 724 $5,767.48 -9.27% Joondalup Moolanda South LAC 678 $5,427.93 678 $5,164.37 -4.86% Joondalup Moolanda North LAC 206 $5,524.43 206 $5,156.84 -6.65% Joondalup Kinross B LAC 500 $4,554.25 500 $4,787.13 5.11% Joondalup Lilburne Road LAC 450 $5,705.34 450 $5,283.78 -7.39% Joondalup Woodvale DAC 7460 $7,725.82 15,000 $8,340.14 7.95% Joondalup Sorrento_Quays
(tourist) 7261 $3,823.31 8,000 $3,504.50 -8.34%
Joondalup Currambine DAC 12000 $9,704.55 15,000 $10,391.60 7.08% Joondalup Greenwood DAC 4976 $7,410.74 10,000 $7,118.33 -3.95% Joondalup Craigie NAC 2337 $7,398.58 2,337 $6,921.09 -6.45% Joondalup Joondalup (LFR) 12443 $4,691.36 12,443 $4,598.15 -1.99% Joondalup Waldecks 80 $6,135.85 80 $6,019.50 -1.90% Joondalup Joondalup Drive (LFR) 8534 $5,332.42 8,534 $5,351.23 0.35% Joondalup Joondalup SMC 92990 $6,921.73 125,000 $7,399.23 6.90% Stirling Stirling SMC 57483 $6,248.52 110,000 $6,867.93 9.91% Stirling Osborne Park 61967 $4,632.78 61,967 $5,002.60 7.98%
26
AMP Capital Investors: Karrinyup Activity Centre Structure Plan
City of Stirling Impacts of Growth at the Karrinyup Secondary Activity Centre 12 June 2014
13
LGA
Cen
tre N
ame
PLU
C 5
Fl
oors
pace
2011
(m²)
Turn
over
201
1 ($
/m²)
PLU
C 5
Fl
oors
pace
20
26 (m
²)
Turn
over
202
6 ($
/m²)
Trad
e Im
pact
Stirling Karrinyup SAC 51035 $7,776.10 100,000 $8,089.60 4.03% Stirling Mirrabooka SAC 39129 $5,029.02 55,000 $5,118.91 1.79% Stirling Main Street DAC 6755 $6,616.48 6,755 $7,212.29 9.00% Stirling Gwelup NAC 4772 $9,894.99 4,772 $10,255.17 3.64% Stirling North Beach NAC 2411 $7,117.79 2,411 $7,110.66 -0.10% Stirling Westminster NAC 2870 $7,133.31 2,870 $7,188.08 0.77% Stirling Flora Terrace LAC 1197 $3,823.20 1,197 $3,670.97 -3.98% Stirling Stirling Village LAC 1168 $7,187.28 1,168 $7,570.63 5.33% Stirling Fieldgate LAC 901 $6,361.33 901 $6,332.35 -0.46% Stirling Stirling DAC 13588 $6,202.64 17,000 $6,506.21 4.89% Stirling Balcatta Industrial (LFR) 22375 $6,449.44 22,375 $6,771.31 4.99% Stirling Northlands DAC 9761 $8,118.33 13,000 $8,493.74 4.62% Stirling Scarborough Beach DAC 9508 $7,363.68 18,000 $7,827.06 6.29% Stirling Dianella DAC 15359 $8,519.60 18,000 $9,848.37 15.60% Stirling Dog Swamp DAC 11287 $8,437.67 14,000 $9,530.34 12.95% Stirling Mount Lawley DAC 16561 $6,655.16 16,561 $7,696.24 15.64% Stirling Inglewood DAC 18419 $7,425.40 21,245 $8,591.25 15.70% Stirling Glendalough DAC
(HGLSP area) 500 $4,725.78 500 $4,710.50 -0.32%
Stirling Lynn Street LAC 298 $5,987.84 298 $5,597.76 -6.51% Stirling Carine LAC 620 $7,032.07 620 $7,248.56 3.08% Stirling Sackville Terrace LAC 3732 $6,770.07 6,500 $7,400.70 9.32% Stirling Gildercliffe / Herbert
Street LAC’s 1325 $4,023.59 1,325 $4,087.37 1.59%
Stirling Calais Road NAC 927 $3,804.97 927 $3,875.88 1.86% Stirling Doric Street LAC 1381 $7,353.67 1,381 $7,464.04 1.50% Stirling The Downs NAC 1939 $7,234.87 1,939 $7,766.38 7.35% Stirling Woodland NAC 2804 $4,279.17 2,804 $4,810.70 12.42% Stirling Morris Street NAC 3379 $3,292.61 3,379 $3,544.78 7.66% Stirling Flynn St / Herdsman
Pde LAC’s 727 $7,219.97 727 $7,530.56 4.30%
Stirling Jones Street LAC 1387 $7,231.88 1,387 $8,227.00 13.76% Stirling Glendalough NAC 1012 $7,212.93 1,012 $7,668.63 6.32% Stirling Westminster LAC 3912 $7,358.09 3,912 $8,050.94 9.42% Stirling Nollamara NAC 1096 $5,426.14 1,096 $6,027.22 11.08% Stirling Flinders Street LAC 740 $4,312.36 740 $4,821.30 11.80% Stirling Blythe Ave / Hector St
LAC’s 2061 $5,550.51 2,061 $5,176.09 -6.75%
Stirling Mirrabooka Village (Honeywell) NAC
564 $4,520.34 564 $4,834.61 6.95%
Stirling Pimlott Street LAC 2004 $4,965.19 2,004 $5,661.58 14.03% Stirling Adair Pde NAC 3314 $4,313.48 3,314 $4,439.84 2.93% Stirling Walter Road NAC 4407 $3,145.68 4,407 $3,627.59 15.32% Stirling Coode/Walter St NAC 350 $6,003.67 3,500 $6,470.18 7.77% Stirling Harrison Street LAC 1260 $4,388.52 1,260 $4,995.01 13.82% Stirling Lord St, Highgate LAC 613 $4,301.54 613 $4,961.05 15.33% Stirling Bayley St LAC 300 $5,073.50 300 $4,780.15 -5.78% Stirling Elsie St LAC 510 $3,783.09 1,300 $3,749.59 -0.89% Stirling Sholl Avenue LAC 250 $4,000.39 250 $3,939.04 -1.53% Stirling Bennion St LAC 1735 $4,006.43 3,000 $4,201.71 4.87% Stirling Joyce St NAC 490 $3,833.46 490 $4,098.88 6.92% Stirling Brighton St LAC 460 $4,202.87 460 $4,688.95 11.57%
City of Stirling Impacts of Growth at the Karrinyup Secondary Activity Centre 12 June 2014
14
LGA
Cen
tre N
ame
PLU
C 5
Fl
oors
pace
2011
(m²)
Turn
over
201
1 ($
/m²)
PLU
C 5
Fl
oors
pace
20
26 (m
²)
Turn
over
202
6 ($
/m²)
Trad
e Im
pact
Stirling Muriel Avenue LAC 364 $4,246.92 364 $4,716.06 11.05% Stirling Herdsman Hotel LAC 1400 $7,622.25 1,900 $8,319.45 9.15% Stirling Shakespeare Ave/Beryl
St LAC’s 260 $6,722.02 500 $7,076.93 5.28%
Stirling Stirling Isolated Uses (10)
390 $5,610.32 390 $6,195.74 10.43%
Stirling Yokine LAC 2805 $4,574.50 3,000 $5,026.84 9.89% Stirling Tuart Hill NAC 800 $5,541.32 800 $6,087.59 9.86% Stirling Powell Street LAC 2200 $5,518.36 2,200 $6,087.20 10.31% Stirling Scarbourough Beach Rd
#2 NAC 1185 $5,564.67 1,185 $6,074.18 9.16%
Stirling McDonald/Main St NAC 100 $3,614.92 100 $4,052.07 12.09% Stirling French Street LAC 220 $3,494.60 220 $4,407.10 26.11%
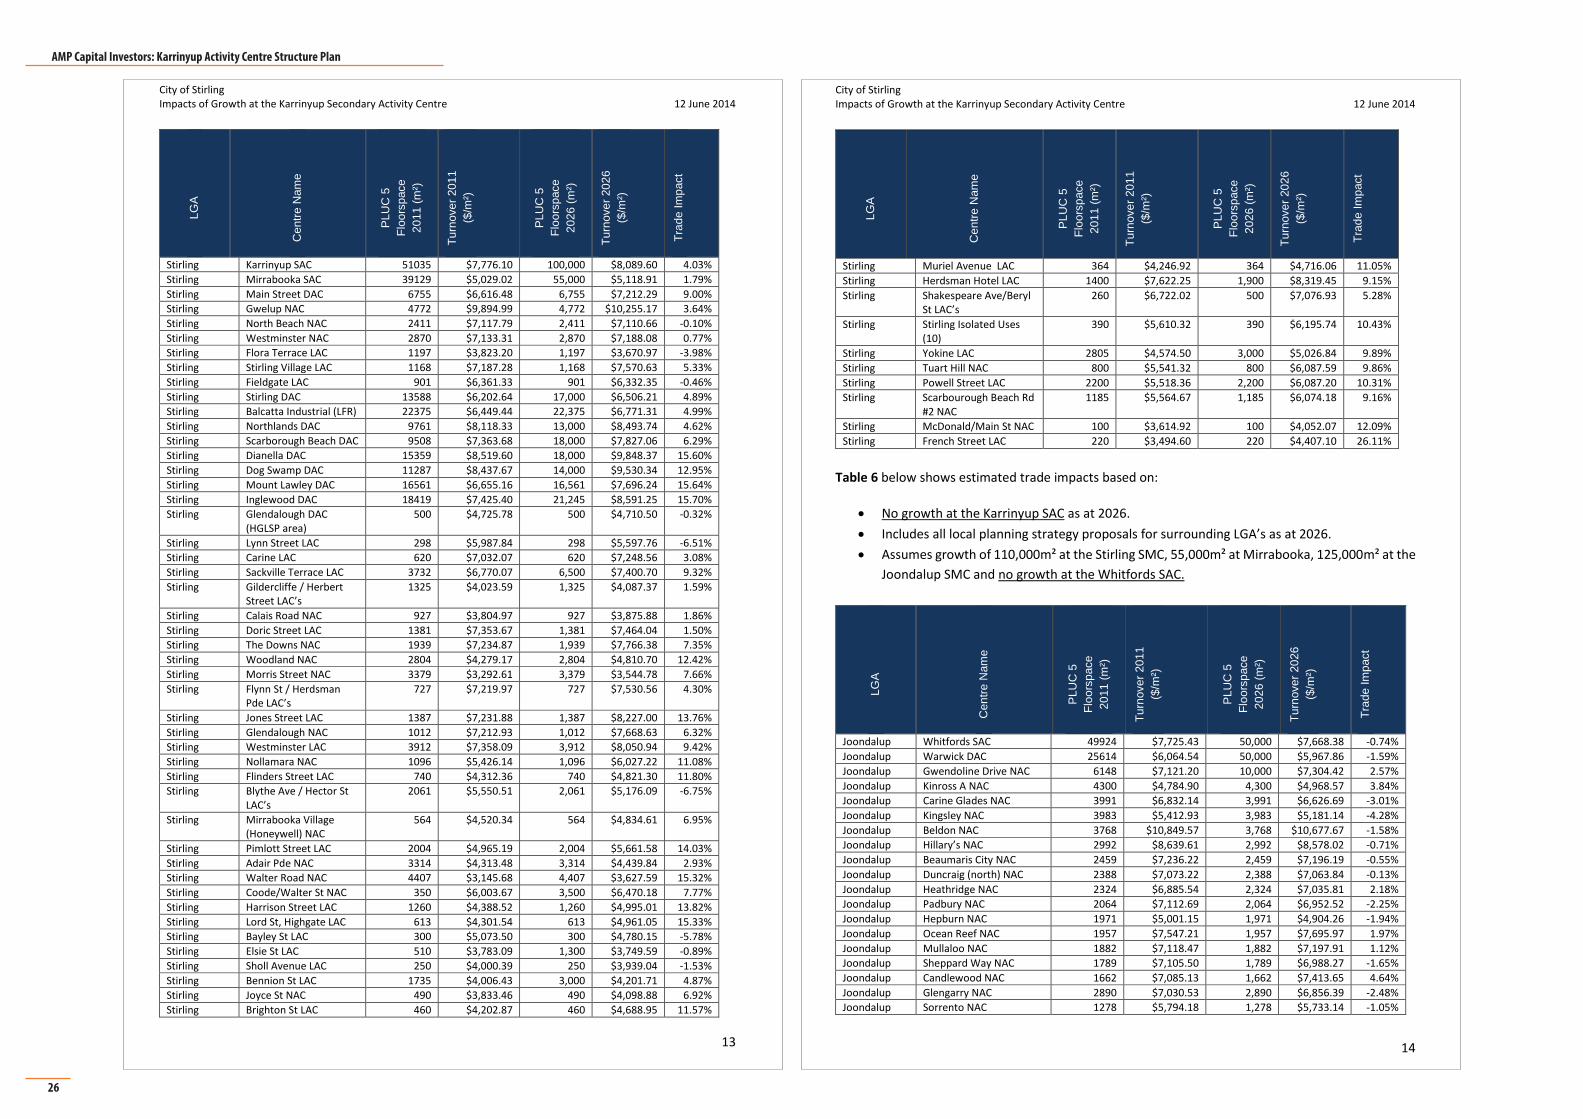
Table 6 below shows estimated trade impacts based on:
No growth at the Karrinyup SAC as at 2026. Includes all local planning strategy proposals for surrounding LGA’s as at 2026. Assumes growth of 110,000m² at the Stirling SMC, 55,000m² at Mirrabooka, 125,000m² at the
Joondalup SMC and no growth at the Whitfords SAC.
LGA
Cen
tre N
ame
PLU
C 5
Fl
oors
pace
2011
(m²)
Turn
over
201
1 ($
/m²)
PLU
C 5
Fl
oors
pace
20
26 (m
²)
Turn
over
202
6 ($
/m²)
Trad
e Im
pact
Joondalup Whitfords SAC 49924 $7,725.43 50,000 $7,668.38 -0.74% Joondalup Warwick DAC 25614 $6,064.54 50,000 $5,967.86 -1.59% Joondalup Gwendoline Drive NAC 6148 $7,121.20 10,000 $7,304.42 2.57% Joondalup Kinross A NAC 4300 $4,784.90 4,300 $4,968.57 3.84% Joondalup Carine Glades NAC 3991 $6,832.14 3,991 $6,626.69 -3.01% Joondalup Kingsley NAC 3983 $5,412.93 3,983 $5,181.14 -4.28% Joondalup Beldon NAC 3768 $10,849.57 3,768 $10,677.67 -1.58% Joondalup Hillary’s NAC 2992 $8,639.61 2,992 $8,578.02 -0.71% Joondalup Beaumaris City NAC 2459 $7,236.22 2,459 $7,196.19 -0.55% Joondalup Duncraig (north) NAC 2388 $7,073.22 2,388 $7,063.84 -0.13% Joondalup Heathridge NAC 2324 $6,885.54 2,324 $7,035.81 2.18% Joondalup Padbury NAC 2064 $7,112.69 2,064 $6,952.52 -2.25% Joondalup Hepburn NAC 1971 $5,001.15 1,971 $4,904.26 -1.94% Joondalup Ocean Reef NAC 1957 $7,547.21 1,957 $7,695.97 1.97% Joondalup Mullaloo NAC 1882 $7,118.47 1,882 $7,197.91 1.12% Joondalup Sheppard Way NAC 1789 $7,105.50 1,789 $6,988.27 -1.65% Joondalup Candlewood NAC 1662 $7,085.13 1,662 $7,413.65 4.64% Joondalup Glengarry NAC 2890 $7,030.53 2,890 $6,856.39 -2.48% Joondalup Sorrento NAC 1278 $5,794.18 1,278 $5,733.14 -1.05%
27
AMP Capital Investors: Karrinyup Activity Centre Structure Plan
City of Stirling Impacts of Growth at the Karrinyup Secondary Activity Centre 12 June 2014
15
LGA
Cen
tre N
ame
PLU
C 5
Fl
oors
pace
2011
(m²)
Turn
over
201
1 ($
/m²)
PLU
C 5
Fl
oors
pace
20
26 (m
²)
Turn
over
202
6 ($
/m²)
Trad
e Im
pact
Joondalup Edgewater NAC 1236 $7,271.09 1,236 $7,745.23 6.52% Joondalup Greenwood Plaza LAC 1000 $7,215.54 1,000 $7,209.01 -0.09% Joondalup Duncraig Village LAC 885 $6,499.95 885 $6,356.10 -2.21% Joondalup Coolibah LAC 808 $7,216.00 808 $6,799.94 -5.77% Joondalup Springfield LAC 728 $5,081.38 728 $5,013.25 -1.34% Joondalup Harman Road LAC 724 $6,356.87 724 $6,205.61 -2.38% Joondalup Moolanda South LAC 678 $5,427.93 678 $5,322.12 -1.95% Joondalup Moolanda North LAC 206 $5,524.43 206 $5,385.70 -2.51% Joondalup Kinross B LAC 500 $4,554.25 500 $4,896.62 7.52% Joondalup Lilburne Road LAC 450 $5,705.34 450 $5,604.49 -1.77% Joondalup Woodvale DAC 7460 $7,725.82 15,000 $8,593.86 11.24% Joondalup Sorrento_Quays (tourist) 7261 $3,823.31 8,000 $3,813.86 -0.25% Joondalup Currambine DAC 12000 $9,704.55 15,000 $10,743.40 10.70% Joondalup Greenwood DAC 4976 $7,410.74 10,000 $7,318.38 -1.25% Joondalup Craigie NAC 2337 $7,398.58 2,337 $7,423.96 0.34% Joondalup Joondalup (LFR) 12443 $4,691.36 12,443 $4,778.69 1.86% Joondalup Waldecks 80 $6,135.85 80 $6,165.02 0.48% Joondalup Joondalup Drive (LFR) 8534 $5,332.42 8,534 $5,569.28 4.44% Joondalup Joondalup SMC 92990 $6,921.73 125,000 $7,604.89 9.87% Stirling Stirling SMC 57483 $6,248.52 110,000 $6,955.60 11.32% Stirling Osborne Park 61967 $4,632.78 61,967 $5,066.46 9.36% Stirling Karrinyup SAC 51035 $7,776.10 51,035 $8,280.77 6.49% Stirling Mirrabooka SAC 39129 $5,029.02 55,000 $5,164.64 2.70% Stirling Main Street DAC 6755 $6,616.48 6,755 $7,288.17 10.15% Stirling Gwelup NAC 4772 $9,894.99 4,772 $10,469.08 5.80% Stirling North Beach NAC 2411 $7,117.79 2,411 $7,323.82 2.89% Stirling Westminster NAC 2870 $7,133.31 2,870 $7,282.32 2.09% Stirling Flora Terrace LAC 1197 $3,823.20 1,197 $3,867.31 1.15% Stirling Stirling Village LAC 1168 $7,187.28 1,168 $7,685.17 6.93% Stirling Fieldgate LAC 901 $6,361.33 901 $6,437.06 1.19% Stirling Stirling DAC 13588 $6,202.64 17,000 $6,579.66 6.08% Stirling Balcatta Industrial (LFR) 22375 $6,449.44 22,375 $6,847.76 6.18% Stirling Northlands DAC 9761 $8,118.33 13,000 $8,584.68 5.74% Stirling Scarborough Beach DAC 9508 $7,363.68 18,000 $8,001.96 8.67% Stirling Dianella DAC 15359 $8,519.60 18,000 $9,889.26 16.08% Stirling Dog Swamp DAC 11287 $8,437.67 14,000 $9,577.37 13.51% Stirling Mount Lawley DAC 16561 $6,655.16 16,561 $7,715.58 15.93% Stirling Inglewood DAC 18419 $7,425.40 21,245 $8,609.37 15.94% Stirling Glendalough DAC (HGLSP
area) 0 $0 10,000 $5,192.91 100.00%
Stirling Lynn Street LAC 500 $4,725.78 500 $4,876.72 3.19% Stirling Carine LAC 298 $5,987.84 298 $5,879.18 -1.81% Stirling Sackville Terrace LAC 620 $7,032.07 620 $7,370.92 4.82% Stirling Gildercliffe / Herbert
Street LAC’s 3732 $6,770.07 6,500 $7,505.81 10.87%
Stirling Calais Road NAC 1325 $4,023.59 1,325 $4,143.12 2.97% Stirling Doric Street LAC 927 $3,804.97 927 $3,917.01 2.94% Stirling The Downs NAC 1381 $7,353.67 1,381 $7,540.17 2.54% Stirling Woodland NAC 1939 $7,234.87 1,939 $7,828.64 8.21% Stirling Morris Street NAC 2804 $4,279.17 2,804 $4,879.67 14.03% Stirling Flynn St / Herdsman Pde
LAC’s 3379 $3,292.61 3,379 $3,564.53 8.26%
City of Stirling Impacts of Growth at the Karrinyup Secondary Activity Centre 12 June 2014
16
LGA
Cen
tre N
ame
PLU
C 5
Fl
oors
pace
2011
(m²)
Turn
over
201
1 ($
/m²)
PLU
C 5
Fl
oors
pace
20
26 (m
²)
Turn
over
202
6 ($
/m²)
Trad
e Im
pact
Stirling Jones Street LAC 727 $7,219.97 727 $7,612.96 5.44% Stirling Glendalough NAC 1387 $7,231.88 1,387 $8,269.95 14.35% Stirling Westminster LAC 1012 $7,212.93 1,012 $7,751.41 7.47% Stirling Nollamara NAC 3912 $7,358.09 3,912 $8,120.19 10.36% Stirling Flinders Street LAC 1096 $5,426.14 1,096 $6,064.62 11.77% Stirling Blythe Ave / Hector St
LAC’s 740 $4,312.36 740 $4,848.52 12.43%
Stirling Mirrabooka Village (Honeywell) NAC
2061 $5,550.51 2,061 $5,223.10 -5.90%
Stirling Pimlott Street LAC 564 $4,520.34 564 $4,862.87 7.58% Stirling Adair Pde NAC 2004 $4,965.19 2,004 $5,684.56 14.49% Stirling Walter Road NAC 3314 $4,313.48 3,314 $4,455.56 3.29% Stirling Coode/Walter St NAC 4407 $3,145.68 4,407 $3,638.44 15.66% Stirling Harrison Street LAC 350 $6,003.67 3,500 $6,522.16 8.64% Stirling Lord St, Highgate LAC 1260 $4,388.52 1,260 $5,011.03 14.19% Stirling Bayley St LAC 613 $4,301.54 613 $4,978.61 15.74% Stirling Elsie St LAC 300 $5,073.50 300 $5,038.89 -0.68% Stirling Sholl Avenue LAC 510 $3,783.09 1,300 $3,900.84 3.11% Stirling Bennion St LAC 250 $4,000.39 250 $4,064.33 1.60% Stirling Joyce St NAC 1735 $4,006.43 3,000 $4,283.36 6.91% Stirling Brighton St LAC 490 $3,833.46 490 $4,146.87 8.18% Stirling Muriel Avenue LAC 460 $4,202.87 460 $4,743.92 12.87% Stirling Herdsman Hotel LAC 364 $4,246.92 364 $4,739.95 11.61% Stirling Shakespeare Ave/Beryl St
LAC’s 1400 $7,622.25 1,900 $8,385.04 10.01%
Stirling Stirling Isolated Uses (10) 260 $6,722.02 500 $7,155.67 6.45% Stirling Yokine LAC 390 $5,610.32 390 $6,241.26 11.25% Stirling Tuart Hill NAC 2805 $4,574.50 3,000 $5,064.70 10.72% Stirling Powell Street LAC 800 $5,541.32 800 $6,134.90 10.71% Stirling Scarbourough Beach Rd
#2 NAC 2200 $5,518.36 2,200 $6,131.54 11.11%
Stirling McDonald/Main St NAC 1185 $5,564.67 1,185 $6,128.12 10.13% Stirling French Street LAC 100 $3,614.92 100 $4,078.45 12.82%
5.0 Discussion The outputs above show impacts exceeding - 10% where proposed growth at the Karrinyup SAC and Whitfords SAC is included (Table 3). Activity centres experiencing trade impacts over - 10% are within the Joondalup LGA area predominantly, along with neighbourhood centres at the northern periphery of the Stirling LGA area. With respect to affected local and smaller neighbourhood centres, some variation in results is expected at the lowest level of the hierarchy given the extent to which these centres differ in the composition of goods and services; and given they do not contain the full range of PLUC 5 goods. Retailers will also respond to their trading environment and competition; which is reflected in

28
AMP Capital Investors: Karrinyup Activity Centre Structure Plan
City of Stirling Impacts of Growth at the Karrinyup Secondary Activity Centre 12 June 2014
17
perceived locational advantages, pricing or other individual circumstances contributing to success or otherwise.
The results listed in Table 4 (excluding growth at Whitfords SAC) and Table 5 (excluding growth at Karrinyup SAC) show tolerable trade impact estimates across the Stirling and Joondalup LGA areas. However, whether Whitfords or Karrinyup expands, adverse trade impacts approaching or exceeding - 9% are predominantly associated with centres in the Joondalup LGA area. With reference to Table 2 above (projected population growth by LGA), it is apparent that a low level of growth is projected for the Joondalup LGA area (~6%) between now and 2026. This constrains growth potential for the Joondalup LGA and is the reason why trade impacts for centres are shown to be greater in this LGA area. The outcome of a SAT review process relating to the proposed Whitfords SAC activity centre plan is yet to be resolved. From a strategic planning perspective it may be more orderly to facilitate growth at the Karrinyup SAC. In isolation, each proposal results in low trade impacts on centres in the Stirling LGA area and tolerable trade impacts on centres in the Joondalup LGA area, however the Karrinyup SAC trade area features residents having relatively high incomes / household expenditure, and there is higher population growth throughout the Stirling LGA. The approved / planned growth for the Ocean Keys SAC and Alkimos SAC by 2026 was also included in the modelling. This growth, and the ongoing growth of higher order centres in Wanneroo will contribute to a lower level of patronage which will affect the Whitfords SAC more than it does the Karrinyup SAC.
Please contact me on 9321 3011 should you wish to discuss in any greater level of detail.
Yours faithfully,
Jeff Malcolm
MGA TOWN PLANNERS
Cc: Mat Selby – Department of Planning
AMP Capital
Karrinyup Shopping Centre Development Application
Activity Centre Performance Report - Amended
December 2016

Karrinyup Development Application Activity Centre Performance Report
AMP Capital
2
Document Control
Document Version Description Prepared By Approved By Date Approved
v 1.0 Draft development application activity centre performance report
Suzie Turner Michael Chappell 27 February 2015
v 2.0 Final development application activity centre performance report
Suzie Turner Michael Chappell 27 February 2015
v 3.0 Additional explanatory appendices added Suzie Turner Michael Chappell 25 June 2015
v 4.0 Additional explanatory appendices added - Amended
Robert Kyne Michael Chappell 10 May 2016
v 5.0 Additional impacts added Robert Kyne Michael Chappell 20 December 2016
Disclaimer
This Briefing Note has been prepared for AMP Capital. The information contained in this document has been prepared with care by the authors and includes information from apparently reliable secondary data sources which the authors have relied on for completeness and accuracy. However, the authors do not guarantee the information, nor is it intended to form part of any contract. Accordingly all interested parties should make their own inquiries to verify the information and it is the responsibility of interested parties to satisfy themselves in all respects.
This document is only for the use of the party to whom it is addressed and the authors disclaim any responsibility to any third party acting upon or using the whole or part of its contents.
Karrinyup Development Application Activity Centre Performance Report
AMP Capital
3
Contents
1 Executive Summary ................................................................................................ 5 1.1 Purpose .................................................................................................................................................................. 5 1.2 Report Structure ................................................................................................................................................. 5 1.3 Justification for Expansion .............................................................................................................................. 5 2 Planning Policy Context ......................................................................................... 7 2.1 Performance-Based Activity Centre Planning .......................................................................................... 7 2.2 Legacy of the Previous Planning Policy ...................................................................................................... 7 2.3 Challenges of Developing Diverse Activity Centres .............................................................................. 8 3 Activity Centre Performance ................................................................................ 10 3.1 State and Local Government Performance Goals ............................................................................... 10 3.2 Activity Centre Diversity ............................................................................................................................... 11 4 Rationale for Floorspace Allocation .................................................................... 12 4.1 Shop/Retail Floorspace Rationale ............................................................................................................. 12 4.2 Office/Business Floorspace Rationale ...................................................................................................... 12 4.3 Entertainment/Recreation/Culture Floorspace Rationale ................................................................ 13 4.4 Health/Welfare/Community Services Floorspace Rationale ............................................................ 13 4.5 Other Retail Floorspace Rationale ............................................................................................................. 14 4.6 Residential Floorspace Rationale ............................................................................................................... 14 5 Amended Development Application 1 ............................................................... 15 5.1 Diversity .............................................................................................................................................................. 15 5.2 Impact .................................................................................................................................................................. 15 6 Amended Development Application 2 ............................................................... 16 6.1 Diversity .............................................................................................................................................................. 16 6.2 Impact .................................................................................................................................................................. 16 7 Conclusion ............................................................................................................. 18
8 Appendix A: Comparison of Alternative Retail Models ..................................... 19
9 Appendix B: Impacts of Growth at Karrinyup Secondary Centre ..................... 20
10 Appendix C: Pracsys Response to Department of Planning Comments .......... 21
11 Appendix D: Stirling Strategic Metropolitan Centre and Karrinyup Secondary Centre .................................................................................................................... 22
12 Appendix E Assumptions and Methodology ...................................................... 23 12.1 Methodology .................................................................................................................................................... 23

Karrinyup Development Application Activity Centre Performance Report
AMP Capital
4
12.2 Assumptions ..................................................................................................................................................... 24 12.3 Supply .................................................................................................................................................................. 25 13 Glossary ................................................................................................................. 26
Karrinyup Development Application Activity Centre Performance Report
AMP Capital
5
1 Executive Summary
1.1 Purpose
Following the submission of a structure plan to the City of Stirling and Western Australian Planning
Commission (WAPC) in 2014, AMP Capital have prepared a development application detailing their
proposed first stage of redevelopment of Karrinyup Secondary Centre.
This report has been prepared to provide clarity on the alignment of the structure plan and the
development application in terms of retail and non-retail floorspace provided, and to provide an
understanding of the change to activity centre performance resulting from the first stage of expansion at
Karrinyup Secondary Centre. The change to performance has been considered for the whole activity centre,
rather than just the site of the development application.
1.2 Report Structure
The report has the following structure:
1. Executive summary
2. Planning policy context
3. Activity centre performance
4. Rationale for floorspace allocation
5. Conclusion
6. Appendix A: Comparison of alternative retail models
7. Appendix B: Impacts of growth at Karrinyup Secondary Centre
8. Appendix C: Pracsys response to Department of Planning comments
9. Appendix D: Stirling Strategic Metropolitan Centre and Karrinyup
10. Glossary
1.3 Justification for Expansion
The following points summarise the justification and rationale for expanding Karrinyup Secondary Centre:
• The designation of Karrinyup as a secondary centre within the activity centre hierarchy requires a
higher level of service to the catchment population than is currently provided by existing
floorspace.
• Regeneration of existing floorspace and expansion to provide goods and services aligned with
current consumer desires is critical to ensure current market share is maintained, a high level of
service is provided to the catchment population, and increased leakage online and outside the
catchment is avoided.
• Retail activity is the only existing competitive advantage at Karrinyup Secondary Centre that can
be leveraged for further activity centre development and maturation into a genuinely intense,
diverse, accessible centre.

Karrinyup Development Application Activity Centre Performance Report
AMP Capital
6
• The expansion will genuinely provide access to a range of new activities not previously available
at the centre or nearby, thus providing an improved level of service to the catchment population.
• The resulting improvement to activity centre performance, and provision of leverage for further
improvements, are in line with aspirations of State and local government.
• The removal of retail floorspace caps from State Government planning policy implies scale of
activity centres is no longer a concern by itself.
• Modelled impacts to competing activity centres are expected to consistently be below the
threshold considered reasonable.
Karrinyup Development Application Activity Centre Performance Report
AMP Capital
7
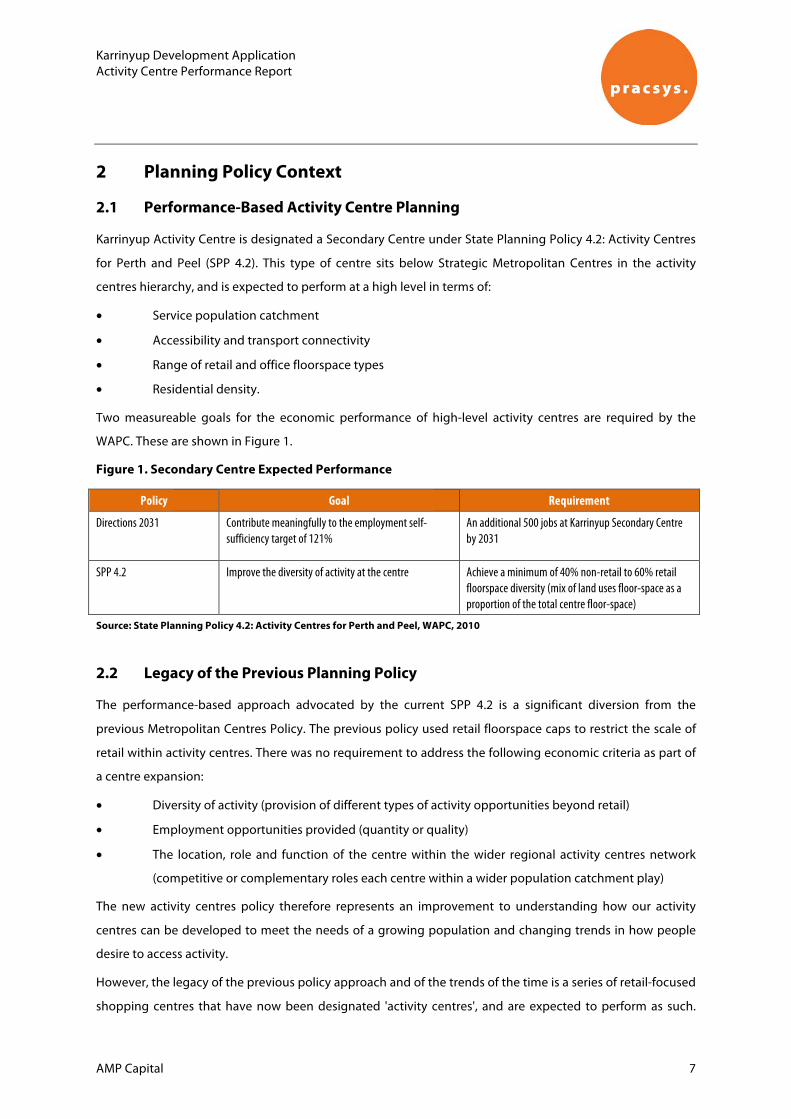
2 Planning Policy Context
2.1 Performance-Based Activity Centre Planning
Karrinyup Activity Centre is designated a Secondary Centre under State Planning Policy 4.2: Activity Centres
for Perth and Peel (SPP 4.2). This type of centre sits below Strategic Metropolitan Centres in the activity
centres hierarchy, and is expected to perform at a high level in terms of:
• Service population catchment
• Accessibility and transport connectivity
• Range of retail and office floorspace types
• Residential density.
Two measureable goals for the economic performance of high-level activity centres are required by the
WAPC. These are shown in Figure 1.
Figure 1. Secondary Centre Expected Performance
Policy Goal Requirement
Directions 2031 Contribute meaningfully to the employment self-sufficiency target of 121%
An additional 500 jobs at Karrinyup Secondary Centre by 2031
SPP 4.2 Improve the diversity of activity at the centre Achieve a minimum of 40% non-retail to 60% retail floorspace diversity (mix of land uses floor-space as a proportion of the total centre floor-space)
Source: State Planning Policy 4.2: Activity Centres for Perth and Peel, WAPC, 2010
2.2 Legacy of the Previous Planning Policy
The performance-based approach advocated by the current SPP 4.2 is a significant diversion from the
previous Metropolitan Centres Policy. The previous policy used retail floorspace caps to restrict the scale of
retail within activity centres. There was no requirement to address the following economic criteria as part of
a centre expansion:
• Diversity of activity (provision of different types of activity opportunities beyond retail)
• Employment opportunities provided (quantity or quality)
• The location, role and function of the centre within the wider regional activity centres network
(competitive or complementary roles each centre within a wider population catchment play)
The new activity centres policy therefore represents an improvement to understanding how our activity
centres can be developed to meet the needs of a growing population and changing trends in how people
desire to access activity.
However, the legacy of the previous policy approach and of the trends of the time is a series of retail-focused
shopping centres that have now been designated 'activity centres', and are expected to perform as such.
Karrinyup Development Application Activity Centre Performance Report
AMP Capital
8
The requirement to demonstrate diverse land uses beyond just retail is necessary for retail-based centres to
mature beyond single-purpose centres to true multi-purpose trip generators with a range of employment
opportunities. However, to expect many of these centres to reach the diversity targets in a single expansion
is impractical and would be effectively penalising them from adhering to the previous planning policy.
The rationale for the previous approach appears to be an attempt to prevent centres from 'out-competing'
one another and reducing the level of service to the catchment population. However, from an economic
point of view, competition between activity centres is generally regarded as essential to providing a high
level of service to users within the catchment, and to facilitate better competition with currently expanding
online forms of activity (e.g. retail, services, education, etc.)1. Policies limiting competition have been
identified in the recent Federal government Competition Policy Review Draft Report as a significant
constraint to business entry and expansion across Australia.
2.3 Challenges of Developing Diverse Activity Centres
There are significant challenges involved in developing retail-based activity centres into genuinely intense,
diverse, accessible activity centres that facilitate multi-purpose trips for the catchment population. People
are now desiring to have access to employment, goods and services, entertainment, social interaction,
education, recreation and variety of other activities close to their homes. Many activity centre owners and
developers today understand and value these types of centres as they recognise that the form and functions
of shopping centres needs to change to meet the needs of our evolving society. Stagnation implies
degeneration, which is not in the interests of activity centre owners or the catchment population.
It is expected that each development at an activity centre, however large or small, will provide improvement
in one or more areas of activity centre performance. Changing a retail-based centre to a genuinely diverse
centre is a process that typically takes years of incremental improvement, as each improvement provides
leverage for an improvement in a related area. The development of Karrinyup Secondary Centre is no
exception. Karrinyup Activity Centre Structure Plan, and the development application, are part of an overall
strategy to address the challenge of turning a retail-based centre into an activity centre with a more
competitive value proposition. In the short term this is expected to include:
• A higher quality retail offer, better aligned with the desires of the current population
• Integrated high density residential dwellings, diversifying the type of housing product available in
the area
• A restaurant/entertainment precinct separate from the main shopping centre to provide
opportunities for social and recreation activity
• Floorspace for complementary population-driven land uses, such as offices, medical clinics and
consulting rooms, community uses and recreation uses
1 Pg. 24, Competition Policy Review Draft Report, September 2014, Commonwealth of Australia. http://competitionpolicyreview.gov.au/files/2014/09/Competition-policy-review-draft-report.pdf

Karrinyup Development Application Activity Centre Performance Report
AMP Capital
9
• Improvement in the quantity and quality of employment available at the centre
In the longer term, the redevelopment of Karrinyup Secondary Centre is expected to provide leverage for
the following:
• Improved public transport to the centre
• Increased residential density in the area surrounding centre
• Attraction of some strategic activity and higher quality employment
Karrinyup Development Application Activity Centre Performance Report
AMP Capital
10
3 Activity Centre Performance
3.1 State and Local Government Performance Goals
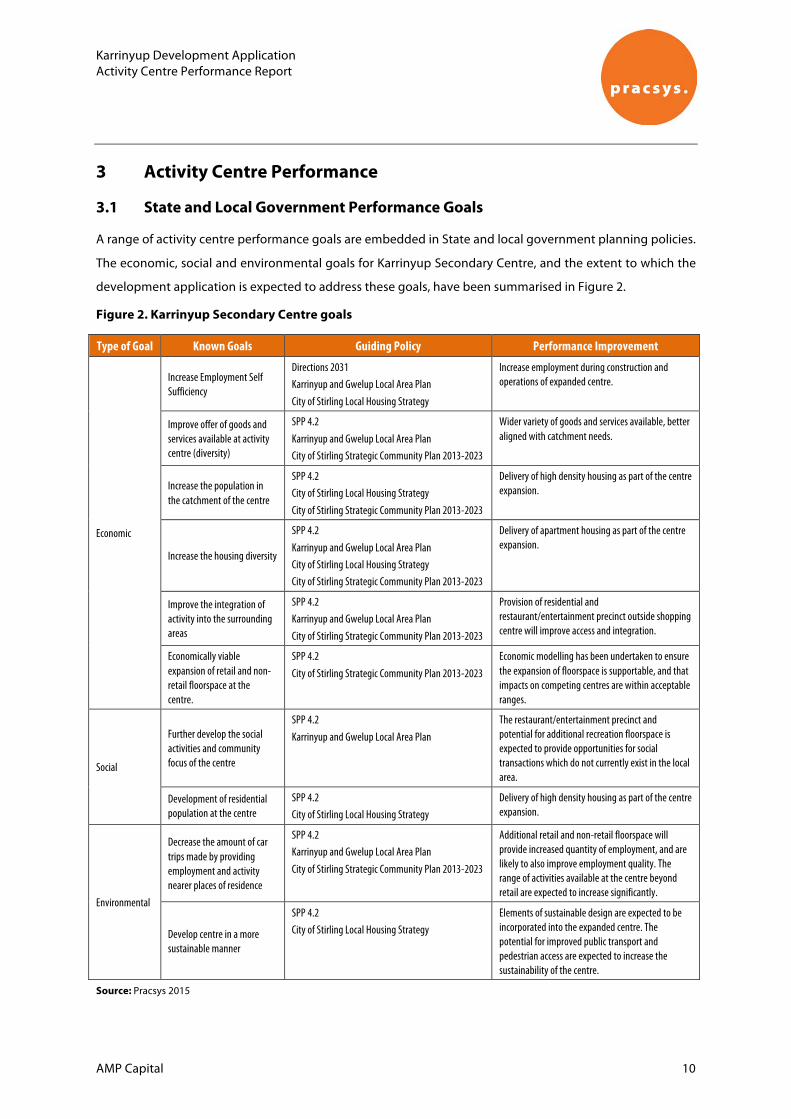
A range of activity centre performance goals are embedded in State and local government planning policies.
The economic, social and environmental goals for Karrinyup Secondary Centre, and the extent to which the
development application is expected to address these goals, have been summarised in Figure 2.
Figure 2. Karrinyup Secondary Centre goals
Type of Goal Known Goals Guiding Policy Performance Improvement
Economic
Increase Employment Self Sufficiency
Directions 2031 Karrinyup and Gwelup Local Area Plan City of Stirling Local Housing Strategy
Increase employment during construction and operations of expanded centre.
Improve offer of goods and services available at activity centre (diversity)
SPP 4.2 Karrinyup and Gwelup Local Area Plan City of Stirling Strategic Community Plan 2013-2023
Wider variety of goods and services available, better aligned with catchment needs.
Increase the population in the catchment of the centre
SPP 4.2 City of Stirling Local Housing Strategy City of Stirling Strategic Community Plan 2013-2023
Delivery of high density housing as part of the centre expansion.
Increase the housing diversity
SPP 4.2 Karrinyup and Gwelup Local Area Plan City of Stirling Local Housing Strategy City of Stirling Strategic Community Plan 2013-2023
Delivery of apartment housing as part of the centre expansion.
Improve the integration of activity into the surrounding areas
SPP 4.2 Karrinyup and Gwelup Local Area Plan City of Stirling Strategic Community Plan 2013-2023
Provision of residential and restaurant/entertainment precinct outside shopping centre will improve access and integration.
Economically viable expansion of retail and non-retail floorspace at the centre.
SPP 4.2 City of Stirling Strategic Community Plan 2013-2023
Economic modelling has been undertaken to ensure the expansion of floorspace is supportable, and that impacts on competing centres are within acceptable ranges.
Social
Further develop the social activities and community focus of the centre
SPP 4.2 Karrinyup and Gwelup Local Area Plan
The restaurant/entertainment precinct and potential for additional recreation floorspace is expected to provide opportunities for social transactions which do not currently exist in the local area.
Development of residential population at the centre
SPP 4.2 City of Stirling Local Housing Strategy
Delivery of high density housing as part of the centre expansion.
Environmental
Decrease the amount of car trips made by providing employment and activity nearer places of residence
SPP 4.2 Karrinyup and Gwelup Local Area Plan City of Stirling Strategic Community Plan 2013-2023
Additional retail and non-retail floorspace will provide increased quantity of employment, and are likely to also improve employment quality. The range of activities available at the centre beyond retail are expected to increase significantly.
Develop centre in a more sustainable manner
SPP 4.2 City of Stirling Local Housing Strategy
Elements of sustainable design are expected to be incorporated into the expanded centre. The potential for improved public transport and pedestrian access are expected to increase the sustainability of the centre.
Source: Pracsys 2015

Karrinyup Development Application Activity Centre Performance Report
AMP Capital
11
3.2 Activity Centre Diversity
Improving the activity centre diversity is one of the most important performance goals of SPP 4.2. The
expected change to diversity as a result of the proposed development is shown in Figure 3. The future
diversity target as shown in the Karrinyup Activity Centre Structure Plan: Retail Sustainability Assessment is
also shown to demonstrate the proposed development is moving the centre diversity in the desired
direction.
The diversity is expected to improve from the current 17.0% mix of uses to 20% mix of uses. Given the
current lack of drivers for non-retail floorspace, and the need to leverage retail floorspace as the only
existing competitive advantage of the centre, this improvement is significant.
Figure 3. Current and future diversity
Planning Land Use Category (PLUC)
Current Floorspace 2014
(m2 NLA)
Stage 1 Floorspace 2018
(m2 NLA)
Floorspace 2031
(m2 NLA)
Floorspace Beyond 2036
(m2 NLA)
Shop/ retail 53,292 93,355 97,000 100,000
Other retail 90 300 1,000 1,500
Office/ business 7,264 10,394 16,500 40,000
Health/ welfare/ community services 1,093 2,654 4,500 7,500
Entertainment/ recreation/ culture 2,457 10,116 13,500 16,500
Total floorspace* 64,196 116,819 132,500 165,500
Total mix of uses floorspace 10,904 23,464 35,500 65,500
Diversity ratio 83% shop/retail 17% mix of uses
80% shop/retail 20% mix of uses
73% shop/retail : 27% mix of uses
60% shop/retail : 40% mix of uses
Source: Pracsys analysis of Department of Planning Land Use and Employment Survey 2008, Rowe Group 2014 and 2015 *Note: total floorspace excludes floorspace in other PLUC, such as utilities, residential and service industry.
Karrinyup Development Application Activity Centre Performance Report
AMP Capital
12
4 Rationale for Floorspace Allocation
The following section provides an understanding of the rationale for providing the different types of
floorspace within Karrinyup Secondary Centre.
4.1 Shop/Retail Floorspace Rationale
The most significant increase in floorspace proposed as part of this development application is shop/retail.
Retail floorspace is currently the biggest competitive advantage of the activity centre. To continue to remain
a competitive advantage, regeneration of existing floorspace and provision of new floorspace
Stirling City Centre is a more appropriate and attractive location for many non-retail uses, such as major
offices and bulky goods, this is therefore the lever most likely to result in a successful intervention to push
the maturation of the centre towards a more intense, diverse and accessible centre. The retail floorspace is
expected to act as an anchor for other types of floorspace to trade off as more people are attracted to the
centre. Development of other types of floorspace can then support more multipurpose trips to the centre.
Retail floorspace includes shops selling convenience and comparison goods and services. A significant
proportion of these are likely to be offerings typically found within shopping centres such as fashion retail,
groceries, fast food and personal services. However, a significant proportion of the new retail floorspace will
be higher quality food and beverage retail - restaurants and cafes. These are considered shop/retail under
the WAPC definition but behave more like entertainment offerings in the way they attract patrons, and in
their function. Development of a restaurant precinct at Karrinyup Shopping Centre was identified by the
local community in the Karrinyup and Gwelup Local Area Plan2 as a means of:
• Enhancing safety within the centre
• Providing social interaction opportunities
• Increasing the hours of operation
• Increasing vibrancy, diversity and energy of the centre
4.2 Office/Business Floorspace Rationale
There are currently few drivers for suburban office floorspace, and a significant oversupply in the Perth CBD
and surrounding suburbs3. The surrounding resident population is therefore expected to be the primary
driver for new office floorspace at Karrinyup Secondary Centre. This is likely to include the following types of
tenants:
• Real estate agents
• Tax accountants
• Medical centres
• Allied health practitioners
2 Page 6, Karrinyup and Gwelup Local Area Plan, City of Stirling, 2010 3 Pages 26-29, Research and Forecast Report Second Half 2014 Australia and New Zealand, Colliers International, 2014
Karrinyup Development Application Activity Centre Performance Report
AMP Capital
13
• Medical consulting rooms
• Small businesses providing goods and services for the supply chains of other floorspace within the
activity centre
Currently, the offer of these types of land uses within the activity centre is limited to several medical
consulting rooms and allied health practitioners. The development of additional office floorspace is
expected to provide significant opportunity for the activity centre to provide a level of service appropriate to
a maturing Secondary Centre.
4.3 Entertainment/Recreation/Culture Floorspace Rationale
Entertainment floorspace includes land uses such as libraries, licensed venues and recreation centres.
Currently entertainment floorspace is limited to:
• Karrinyup library
• Karrinyup community centre
• TAB
• Gym/fitness studios
It is intended that additional entertainment will provide a range of new opportunities for the local
population not currently available, such as:
• Small bars
• Fitness studios
• Tavern
• Exhibition space
• Playspace
The actual uses achieved for the centre will depend on the individual tenants that can be attracted.
However, the Karrinyup and Gwelup Local Area Plan undertaken by the City of Stirling identified these types
of uses as desired by the local population.
4.4 Health/Welfare/Community Services Floorspace Rationale
Current health floorspace is comprised of optometrists within the shopping centre and a childcare on
Davenport road. There is expected to be a small increase in health floorspace as part of the centre
expansion. Land uses attracted may include:
• Additional childcare centres
• Child health clinic
• Veterinary clinic or pet grooming services
• Early childhood education establishments

Karrinyup Development Application Activity Centre Performance Report
AMP Capital
14
4.5 Other Retail Floorspace Rationale
Currently, the service station provides the only Other Retail floorspace within the activity centre. Further
expansion of this type of floorspace is not considered desirable for the centre from both a developer point of
view and from an SPP 4.2 perspective. This type of floorspace, typically comprised of showrooms, bulky
goods and large format retail, has the following limitations at Karrinyup Secondary Centre:
• Relies heavily on car transport for access
• Unsuitable for locations adjacent to residential areas without suitable buffering
• Is better located on the periphery of activity centres
• Typically located in large agglomerations to enable consumers to compare durable goods
• The business model relies on cheap land and single storey buildings to reduce costs
4.6 Residential Floorspace Rationale
While residential floorspace is not considered part of the SPP 4.2 diversity calculation, increasing the
residential density of activity centres is a required outcome of activity centre planning. The delivery of
residential dwellings in the first stage of redevelopment of Karrinyup Shopping Centre is a reflection of the
readiness of the market for high density housing in the location, and the favourable configuration of the
existing urban form.
In many secondary centres and strategic metropolitan centres throughout the Perth Metropolitan Region
the existing amenity and market do not lend themselves to delivery of high density residential within
activity centres. Significant intervention is often required to facilitate the development of residential
floorspace. Delivering residential at Karrinyup Secondary Centre can therefore be considered a significant
success factor for the overall improvement in functioning and maturation of the centre.

Karrinyup Development Application Activity Centre Performance Report
AMP Capital
15
5 Amended Development Application 1
Following acceptance of the initial Development Application (DA), AMP has made a number of changes to
the plans for Karrinyup Shopping Centre, requiring an amended DA. These changes are relatively minor in
the context of the planned expansion, with little impact on the justification for Karrinyup Shopping Centre
to expand.
5.1 Diversity
The amended DA has seen minor adjustments to the planned floorspace mix. Figure 4 shows the diversity
and floorspace mix across each point in time.
Figure 4. Amended Development Application Diversity
Planning Land Use Category (PLUC)
Current Floorspace 2014
(m2 NLA)
Approved DA Floorspace 2018
(m2 NLA)
Amended DA Floorspace 2018
(m2 NLA)
Shop/ retail 53,292 90,717 90,556
Other retail 90 90 0
Office/ business 7,264 14,722 13,359
Health/ welfare/ community services 1,093 2,359 2,602
Entertainment/ recreation/ culture
2,457 6,047 7,056
Total floorspace* 64,196 113,934 113,873
Total mix of uses floorspace 10,904 23,218 23,317
Diversity ratio 83% shop/retail 17% mix of uses
80% shop/retail 20% mix of uses
80% shop/retail : 20% mix of uses
Source: Pracsys analysis of Department of Planning Land Use and Employment Survey 2008, Rowe Group 2014, 2015 and 2016
There are minor revisions downward across shop retail and office, particularly in office/business and
reflecting the deteriorating market conditions in commercial floorspace. Office vacancy rates in the CBD
have climbed from 16.6% to 19.2% from January 2015 to January 20164. To compensate, health, welfare,
community services and entertainment, recreation, and culture floorspace have increased. This has resulted
in the same improvement from existing diversity levels as currently approved floorspace.
5.2 Impact
The reconfiguration of floorspace in the amended DA has resulted in total shop/retail floorspace decreasing.
Given this, it is expected that impacts on other activity centres will be less or the same. In addition, the
change in floorspace is well within the margin of error that would be afforded of a retail model. As a result, a
new iteration of modelling is not seen as necessary as impacts would be the same or less. 4 Property Council Office Vacancies 2016 (http://www.propertycouncil.com.au/Web/Content/Media_Release/WA/2016/Perth_Office_Vacancies_Climb_on_Back_of_New_Supply.aspx)
Karrinyup Development Application Activity Centre Performance Report
AMP Capital
16
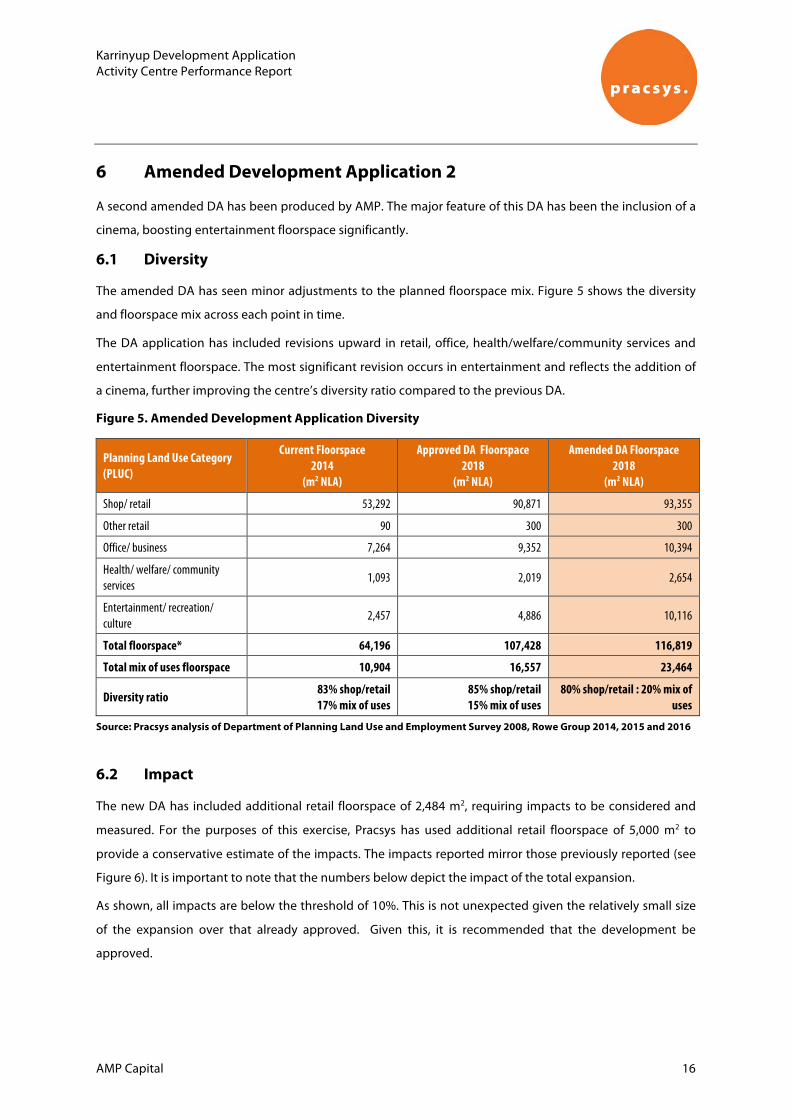
6 Amended Development Application 2
A second amended DA has been produced by AMP. The major feature of this DA has been the inclusion of a
cinema, boosting entertainment floorspace significantly.
6.1 Diversity
The amended DA has seen minor adjustments to the planned floorspace mix. Figure 5 shows the diversity
and floorspace mix across each point in time.
The DA application has included revisions upward in retail, office, health/welfare/community services and
entertainment floorspace. The most significant revision occurs in entertainment and reflects the addition of
a cinema, further improving the centre’s diversity ratio compared to the previous DA.
Figure 5. Amended Development Application Diversity
Planning Land Use Category (PLUC)
Current Floorspace 2014
(m2 NLA)
Approved DA Floorspace 2018
(m2 NLA)
Amended DA Floorspace 2018
(m2 NLA)
Shop/ retail 53,292 90,871 93,355
Other retail 90 300 300
Office/ business 7,264 9,352 10,394
Health/ welfare/ community services 1,093 2,019 2,654
Entertainment/ recreation/ culture 2,457 4,886 10,116
Total floorspace* 64,196 107,428 116,819
Total mix of uses floorspace 10,904 16,557 23,464
Diversity ratio 83% shop/retail 17% mix of uses
85% shop/retail 15% mix of uses
80% shop/retail : 20% mix of uses
Source: Pracsys analysis of Department of Planning Land Use and Employment Survey 2008, Rowe Group 2014, 2015 and 2016
6.2 Impact
The new DA has included additional retail floorspace of 2,484 m2, requiring impacts to be considered and
measured. For the purposes of this exercise, Pracsys has used additional retail floorspace of 5,000 m2 to
provide a conservative estimate of the impacts. The impacts reported mirror those previously reported (see
Figure 6). It is important to note that the numbers below depict the impact of the total expansion.
As shown, all impacts are below the threshold of 10%. This is not unexpected given the relatively small size
of the expansion over that already approved. Given this, it is recommended that the development be
approved.