
AMOREPACIFIC Group, Inc. and...
82
AMOREPACIFIC Group, Inc. and Subsidiaries Consolidated Financial Statements December 31, 2013 and 2012
Transcript of AMOREPACIFIC Group, Inc. and...

AMOREPACIFIC Group, Inc.and SubsidiariesConsolidated Financial StatementsDecember 31, 2013 and 2012

AMOREPACIFIC Group, Inc. and SubsidiariesIndexDecember 31, 2013 and 2012
Page(s)
Report of Independent Auditors…...................................................................................1 – 2
Consolidated Financial Statements
Consolidated Statements of Financial Position........................................................................3
Consolidated Statements of Comprehensive Income…...........................................................4
Consolidated Statements of Changes in Equity…....................................................................5
Consolidated Statements of Cash Flows…..............................................................................6
Notes to Consolidated Financial Statements….................................................................7 – 80

Samil PricewaterhouseCoopers, LS Yongsan Tower, 191, Hangangno 2-ga, Yongsan-gu,Seoul 140-702, Korea (Yongsan P.O Box 266, 140-600), www.samil.com
1
Report of Independent Auditors
To the Board of Directors and Shareholders of
AMOREPACIFIC Group, Inc.
We have audited the accompanying consolidated statements of financial position of
AMOREPACIFIC Group, Inc. and its subsidiaries (collectively the “Group”) as of December 31,
2013 and 2012, and the related consolidated statements of comprehensive income, changes
in equity and cash flows for the years then ended, expressed in Korean won. These financial
statements are the responsibility of the Group's management. Our responsibility is to express
an opinion on these financial statements based on our audits. We did not audit the financial
statements of AMOREPACIFIC EUROPE S.A.S and certain other consolidated subsidiaries,
whose financial statements represent assets of \428,242 million (2012: \257,112 million) as
of December 31, 2013 and sales of \476,502 million (2012: \385,894 million) for the year
then ended. These statements were audited by other auditors whose reports have been
furnished us and our opinion, insofar as it relates to the amounts included for AMOREPACIFIC
EUROPE S.A.S and certain other consolidated subsidiaries, is based solely on the reports of
the other auditors.
We conducted our audits in accordance with auditing standards generally accepted in the
Republic of Korea. Those standards require that we plan and perform the audit to obtain
reasonable assurance about whether the financial statements are free of material
misstatement. An audit includes examining, on a test basis, evidence supporting the amounts
and disclosures in the financial statements. An audit also includes assessing the accounting
principles used and significant estimates made by management, as well as evaluating the
overall financial statement presentation. We believe that our audits and the reports of other
auditors provide a reasonable basis for our opinion.
In our opinion, based on our audits and the reports of other auditors, the consolidated financial
statements, referred to above, present fairly, in all material respects, the financial position of
AMOREPACIFIC Group, Inc. and its subsidiaries as of December 31, 2013 and 2012, and
their financial performance and cash flows for the years then ended, in accordance with
International Financial Reporting Standards as adopted by the Republic of Korea (“Korean
IFRS”).

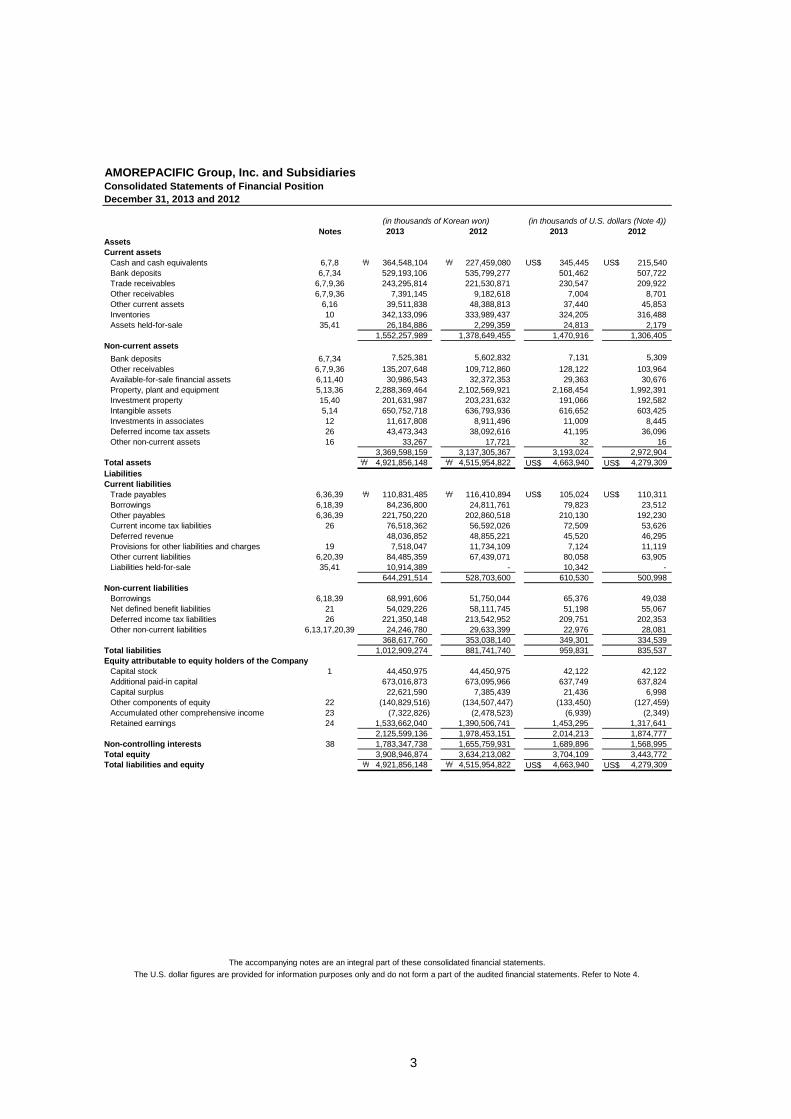
AMOREPACIFIC Group, Inc. and SubsidiariesConsolidated Statements of Financial Position
December 31, 2013 and 2012
Notes
Assets
Current assets
Cash and cash equivalents 6,7,8 ₩ 364,548,104 ₩ 227,459,080 US$ 345,445 US$ 215,540
Bank deposits 6,7,34 529,193,106 535,799,277 501,462 507,722
Trade receivables 6,7,9,36 243,295,814 221,530,871 230,547 209,922
Other receivables 6,7,9,36 7,391,145 9,182,618 7,004 8,701
Other current assets 6,16 39,511,838 48,388,813 37,440 45,853
Inventories 10 342,133,096 333,989,437 324,205 316,488
Assets held-for-sale 35,41 26,184,886 2,299,359 24,813 2,179
1,552,257,989 1,378,649,455 1,470,916 1,306,405
Non-current assets
Bank deposits 6,7,34 7,525,381 5,602,832 7,131 5,309
Other receivables 6,7,9,36 135,207,648 109,712,860 128,122 103,964
Available-for-sale financial assets 6,11,40 30,986,543 32,372,353 29,363 30,676
Property, plant and equipment 5,13,36 2,288,369,464 2,102,569,921 2,168,454 1,992,391
Investment property 15,40 201,631,987 203,231,632 191,066 192,582
Intangible assets 5,14 650,752,718 636,793,936 616,652 603,425
Investments in associates 12 11,617,808 8,911,496 11,009 8,445
Deferred income tax assets 26 43,473,343 38,092,616 41,195 36,096
Other non-current assets 16 33,267 17,721 32 16
3,369,598,159 3,137,305,367 3,193,024 2,972,904Total assets ₩ 4,921,856,148 ₩ 4,515,954,822 US$ 4,663,940 US$ 4,279,309
Liabilities
Current liabilities
Trade payables 6,36,39 ₩ 110,831,485 ₩ 116,410,894 US$ 105,024 US$ 110,311
Borrowings 6,18,39 84,236,800 24,811,761 79,823 23,512
Other payables 6,36,39 221,750,220 202,860,518 210,130 192,230
Current income tax liabilities 26 76,518,362 56,592,026 72,509 53,626
Deferred revenue 48,036,852 48,855,221 45,520 46,295
Provisions for other liabilities and charges 19 7,518,047 11,734,109 7,124 11,119
Other current liabilities 6,20,39 84,485,359 67,439,071 80,058 63,905
Liabilities held-for-sale 35,41 10,914,389 - 10,342 -
644,291,514 528,703,600 610,530 500,998
Non-current liabilities
Borrowings 6,18,39 68,991,606 51,750,044 65,376 49,038
Net defined benefit liabilities 21 54,029,226 58,111,745 51,198 55,067
Deferred income tax liabilities 26 221,350,148 213,542,952 209,751 202,353
Other non-current liabilities 6,13,17,20,39 24,246,780 29,633,399 22,976 28,081
368,617,760 353,038,140 349,301 334,539
Total liabilities 1,012,909,274 881,741,740 959,831 835,537
Equity attributable to equity holders of the Company
Capital stock 1 44,450,975 44,450,975 42,122 42,122
Additional paid-in capital 673,016,873 673,095,966 637,749 637,824
Capital surplus 22,621,590 7,385,439 21,436 6,998
Other components of equity 22 (140,829,516) (134,507,447) (133,450) (127,459)
Accumulated other comprehensive income 23 (7,322,826) (2,478,523) (6,939) (2,349)
Retained earnings 24 1,533,662,040 1,390,506,741 1,453,295 1,317,641
2,125,599,136 1,978,453,151 2,014,213 1,874,777
Non-controlling interests 38 1,783,347,738 1,655,759,931 1,689,896 1,568,995
Total equity 3,908,946,874 3,634,213,082 3,704,109 3,443,772Total liabilities and equity ₩ 4,921,856,148 ₩ 4,515,954,822 US$ 4,663,940 US$ 4,279,309
(in thousands of Korean won)
The accompanying notes are an integral part of these consolidated financial statements.
The U.S. dollar figures are provided for information purposes only and do not form a part of the audited financial statements. Refer to Note 4.
2013 2012 2013 2012
(in thousands of U.S. dollars (Note 4))
3

AMOREPACIFIC Group, Inc. and SubsidiariesConsolidated Statements of Comprehensive Income
Years Ended December 31, 2013 and 2012
Notes
Sales 5,27,36 ₩ 3,895,390,626 ₩ 3,431,733,414 US$ 3,691,264 US$ 3,251,903
Cost of sales 28,36 1,199,461,065 1,013,893,306 1,136,607 960,763
Gross profit 2,695,929,561 2,417,840,108 2,554,657 2,291,140
Selling and administrative expenses 28,29 2,226,178,972 1,967,424,350 2,109,522 1,864,327
Operating profit 5 469,750,589 450,415,758 445,135 426,813
Finance income 6,30 25,973,581 29,445,707 24,613 27,903
Finance costs 6,30 3,325,002 2,297,749 3,151 2,177
Other non-operating losses, net 31 (14,837,288) (9,773,928) (14,060) (9,262)
Share of profit of associates 12 4,329,716 2,921,430 4,103 2,768
12,141,007 20,295,460 11,505 19,232
Profit before income tax 481,891,596 470,711,218 456,640 446,045
Income tax expense 26 126,886,639 124,002,662 120,238 117,505
Profit for the year ₩ 355,004,957 ₩ 346,708,556 US$ 336,402 US$ 328,540
Profit attributable to:
Equity holders of the Company ₩ 163,011,488 ₩ 154,827,917 US$ 154,469 US$ 146,715
Non-controlling interests 38 191,993,469 191,880,639 181,933 181,825
Other comprehensive income
Items that will not be reclassified to profit or loss
Remeasurements of net defined benefit liabilities 21,26 (1,329,774) (13,603,039) (1,260) (12,890)
Items that may be subsequently reclassified to profit or loss
Gain(Loss) on valuation of available-for-sale financial assets 6,11,23,26 (3,882,729) 785,326 (3,679) 744
Share of other comprehensive income of associates 12,23,26 (286,371) (2,446,710) (271) (2,318)
Foreign currency translation differences 23,26 (1,977,966) (8,750,254) (1,875) (8,292)
Total comprehensive income for the year, net of income taxes 347,528,117 322,693,879 329,317 305,784
Attributable to:
Equity holders of the Company 157,065,990 144,705,155 148,835 137,122
Non-controlling interests 190,462,127 177,988,724 180,482 168,662
Total comprehensive income for the year, net of income taxes ₩ 347,528,117 ₩ 322,693,879 US$ 329,317 US$ 305,784
Earnings per share 32
Basic earnings per share to the ordinary equity holders ₩ 20,102 ₩ 19,143 US$ 19.05 US$ 18.14
Basic earnings per share to the preferred equity holders 20,157 19,193 19.10 18.19
Diluted earnings per share to the ordinary equity holders 19,539 18,602 18.52 17.63
Diluted earnings per share to the preferred equity holders 19,594 18,652 18.57 17.67
2013
(in thousands of Korean won,
except per share amounts)
The accompanying notes are an integral part of these consolidated financial statements.
The U.S. dollar figures are provided for information purposes only and do not form a part of the audited financial statements. Refer to Note 4.
2013 2012
(in thousands of U.S. dollars(Note 4),
except per share amounts)
2012
4


AMOREPACIFIC Group, Inc. and Subsidiaries
Consolidated Statements of Cash Flows
Years Ended December 31, 2013 and 2012
Notes
Cash flows from operating activities
Cash generated from operations 33 ₩ 623,242,114 ₩ 429,564,298 US$ 590,583 US$ 407,054
Interest received 24,162,826 23,175,308 22,897 21,961
Interest paid (3,313,998) (1,368,923) (3,140) (1,297)
Income tax paid (104,243,822) (104,881,974) (98,782) (99,386)
Net cash generated from operating activities 539,847,120 346,488,709 511,558 328,332
Cash flows from investing activities
Net decrease in bank deposits 4,665,542 - 4,420 -
Decrease in other receivables 13,036,221 11,941,255 12,353 11,317
Disposal of property, plant and equipment 13,396,965 34,670,740 12,695 32,854
Disposal of intangible assets 1,062,185 1,508,122 1,007 1,429
Disposal of non-current assets held-for-sale - 6,879,904 - 6,519
Dividends received from associates 1,260,000 1,819,624 1,194 1,724
Disposal of available-for-sale financial assets 7,069,547 5,035,793 6,699 4,772
Net increase in bank deposits - (117,172,880) - (111,033)
Increase in other receivables (39,166,911) (41,527,033) (37,114) (39,351)
Acquisition of available-for-sale financial assets (4,179,910) (7,929,132) (3,961) (7,514)
Acquisition of property, plant and equipment (385,389,474) (305,090,194) (365,194) (289,103)
Acquisition of intangible assets (23,578,975) (24,809,253) (22,343) (23,509)
Acquisition of subsidiaries, net of cash acquired - (5,322,822) - (5,044)
Net cash used in investing activities (411,824,810) (439,995,876) (390,244) (416,939)
Cash flows from financing activities
Proceeds from short-term borrowings 19,819,904 9,034,672 18,781 8,561
Proceeds from long-term borrowings 61,674,540 7,900,000 58,443 7,486
Increase in non-controlling Interest 4,446,118 2,604,997 4,213 2,468
Proceeds from disposal of treasury shares 11,828,689 - 11,209 -
Dividends paid (51,457,411) (48,739,355) (48,761) (46,185)
Repayments of short-term borrowings (1,189,459) - (1,127) -
Decrease in non-controlling interests (12,817,155) - (12,146) -
Purchase of treasury shares (19,533,715) - (18,510) -
Net cash provided by(used in) financing activities 12,771,511 (29,199,686) 12,102 (27,670)
Effect of foreign exchange on cash and cash equivalents (3,704,797) (3,421,208) (3,511) (3,242)
Net increase(decrease) in cash and cash equivalents 137,089,024 (126,128,061) 129,905 (119,519)
Cash and cash equivalents at the beginning of year 227,459,080 353,587,141 215,540 335,059
Cash and cash equivalents at the end of year ₩ 364,548,104 ₩ 227,459,080 US$ 345,445 US$ 215,540
2013 20122013 2012
(in thousands of U.S. dollars(Note 4))(in thousands of Korean won)
The accompanying notes are an integral part of these consolidated financial statements.
The U.S. dollar figures are provided for information purposes only and do not form a part of the audited financial statements. Refer to Note 4.
6

AMOREPACIFIC Group, Inc. and SubsidiariesNotes to Consolidated Financial Statements
December 31, 2013 and 2012
7
1. General Information
General information about AMOREPACIFIC Group, Inc. (the “Company”) and its 26 subsidiaries
(collectively referred to as the “Group”) is as follows.
The Company was incorporated on September 5, 1945, under the laws of the Republic of Korea to
engage in manufacturing, marketing and trading of cosmetics, personal care goods and other
related products. However, on January 1, 2007, the Company’s legal form of business entity was
changed to a holding company to provide management, administrative and financing services to its
consolidated and unconsolidated subsidiaries. The Company listed its shares on the Korea Stock
Exchange on April 30, 1973, and as approved by the shareholders on March 25, 2011, the
Company changed its name from PACIFIC Corporation to AMOREPACIFIC Group, Inc.
As of December 31, 2013, the Company’s paid-in capital is ₩44,451 million, including ₩4,555
million of preferred stock. The Company is authorized to issue 36,000,000 shares at a par value
per share of ₩5,000. As of December 31, 2013, 7,979,098 shares of common stock and 911,097
shares of preferred stock are issued.
Details of preferred stock issued by the Company are as follows:
Type Dividend rate
Number of
shares Description
Preferred stock¹ Common stock dividend rate + 1% 644,377 Non-participating and non-cumulative
Convertible preferred stock Max (Common stock dividend rate, 3%) 266,720 Participating and cumulative
1Preferred stock have no voting rights, and they are non-participating and non-cumulative. They
can receive 1% additional dividend of face value on a yearly basis. Accordingly, when calculating
basic earnings per share, the preferred stock are presented separately as ordinary shares which
have different dividend rates from other common stock even though they have no priority.
The Company’s consolidated subsidiaries as of December 31, 2013, are as follows:

AMOREPACIFIC Group, Inc. and SubsidiariesNotes to Consolidated Financial StatementsDecember 31, 2013 and 2012
8
1Although the Group has less than 50% of voting power, it is included as a subsidiary as the
related parties, including the CEO, have 49.6% of the voting power and the rest are widely
distributed among shareholders and institution investors owning less than 1%. Taking into
consideration the participatory and approval ratios of the past general meetings, the Group has de
facto control to decide the financial and operating policies.
Percentage of
Shareholder Subsidiaries Primary business ownership(%) Year end Location
AMOREPACIFIC Group,Inc. AMOREPACIFIC Corporation ¹Manufacturing and marketing
of cosmetics ₩ 34,508 35.40 Dec 31 Korea
AMOREPACIFIC Group,Inc. Etude CorporationManufacturing and marketing
of cosmetics4,650 80.48 Dec 31 Korea
AMOREPACIFIC Group,Inc. Innisfree Corporation Marketing of cosmetics 1,222 81.82 Dec 31 Korea
AMOREPACIFIC Group,Inc. AMOS Professional CorporationMarketing of hair care
products3,500 100.00 Dec 31 Korea
AMOREPACIFIC Group,Inc. PACIFICPHARMA CorporationManufacturing and marketing
of medicine11,645 100.00 Dec 31 Korea
AMOREPACIFIC Group,Inc. PACIFICGLAS, Inc.Manufacturing and marketing
of glass5,000 100.00 Dec 31 Korea
AMOREPACIFIC Group,Inc. PACIFICPACKAGE CorporationPrinting, Manufacturing and
marketing of paper containers11,505 99.58 Dec 31 Korea
AMOREPACIFIC Group,Inc. Jangw on Co., Ltd.Manufacturing and marketing
of green tea5,083 98.38 Dec 31 Korea
AMOREPACIFIC Group,Inc. COSVISION CO.,LTD.
Manufacturing and marketing
of cosmetics, detergents and
organic compounds
2,000 100.00 Dec 31 Korea
AMOREPACIFIC
Corporation
AMOREPACIFIC Global
Operations LimitedHolding company 149,197 90.00 Dec 31 HongKong
AMOREPACIFIC
Corporation
AMOREPACIFIC GLOBAL
OPERATIONS PTE. LTD.Holding company 5,096 100.00 Dec 31 Singapore
AMOREPACIFIC
Corporation
AMORE Cosmetics
(Shanghai) Co.,Ltd.
Manufacturing and
marketing of cosmetics14,274 100.00 Dec 31 China
AMOREPACIFIC
Corporation69.21
AMORE Cosmetics (Shanghai)
Co.,Ltd.30.79
AMOREPACIFIC
Corporation
AMOREPACIFIC
(Shanghai) R&I Center Co.,Ltd.Research and development 2,195 100.00 Dec 31 China
AMOREPACIFIC Global
Operations Limited
AMOREPACIFIC Trading
Co. Ltd.Marketing of cosmetics 9,456 100.00 Dec 31 China
AMOREPACIFIC Global
Operations Limited
AMOREPACIFIC
EUROPE S.A.S
Manufacturing and
marketing of cosmetics98,933 100.00 Dec 31 France
AMOREPACIFIC Global
Operations LimitedAnnick Goutal S.A.S Marketing of cosmetics 9,267 100.00 Dec 31 France
AMOREPACIFIC Global
Operations LimitedAMOREPACIFIC US, INC. Marketing of cosmetics 45,888 100.00 Dec 31 America
AMOREPACIFIC Global
Operations Limited
AMOREPACIFIC Japan
Co.,Ltd.Marketing of cosmetics 30,770 100.00 Dec 31 Japan
AMOREPACIFIC Global
Operations Limited
AMOREPACIFIC Taiw an
Co.,Ltd.Marketing of cosmetics 11,621 100.00 Dec 31 Taiw an
AMOREPACIFIC Global
Operations Limited
AMOREPACIFIC
SINGAPOREPTE. LTD.Marketing of cosmetics 25,861 100.00 Dec 31 Singapore
Amorepacific Global
Operations Limited
AMOREPACIFIC
MALAYSIA SDN. BHD.Marketing of cosmetics 2,950 100.00 Dec 31 Malaysia
AMOREPACIFIC GLOBAL
OPERATIONS PTE. LTD.Amorepacific VIETNAM JSC Marketing of cosmetics 5,479 70.00 Dec 31 Vietnam
AMOREPACIFIC Global
Operations Limited
AMOREPACIFIC
(Thailand) LIMITEDMarketing of cosmetics 6,328 100.00 Dec 31 Thailand
AMOREPACIFIC
Corporation5.82
AMOREPACIFIC Global
Operations Limited94.18
AMOREPACIFIC Global
Operations Limited99.80
Innisfree Corporation 0.20
China
PT. LANEIGEINDONESIA
PACIFICMarketing of cosmetics 4,093 Dec 31 Indonesia
Dec 31
stock
Capital
AMOREPACIFIC
New Cosmetics
(Shanghai) Co.,Ltd.
Marketing of cosmetics 34,829
Innisfree Cosmetics India
Private LimitedMarketing of cosmetics 888 Dec 31 India

AMOREPACIFIC Group, Inc. and SubsidiariesNotes to Consolidated Financial StatementsDecember 31, 2013 and 2012
9
The summary of the consolidated subsidiaries’ financial information as of December 31, 2013 and
2012, and the results of their operations for the years then ended, which are included in the
consolidated financial statements, follows:
(in millions of Korean won)
AMOREPACIFIC Corporation ₩ 3,133,866 ₩ 563,386 ₩ 2,666,340 ₩ 270,810 ₩ 270,306
Etude Corporation 117,762 33,646 337,239 19,467 18,976
Innisfree Corporation 146,617 47,157 332,759 39,348 39,260
AMOS Professional Corporation 47,391 7,370 49,001 8,876 8,590
PACIFICPHARMA Corporation 133,035 42,894 125,439 8,716 5,346
PACIFICGLAS, Inc. 62,010 11,746 61,225 (1,450) (1,339)
PACIFICPACKAGE Corporation 50,349 5,962 53,124 1,914 1,924
Jangwon Co., Ltd. 84,211 8,454 11,659 1,357 1,358
COSVISION CO.,LTD. 29,224 21,451 99,368 1,910 1,858
AMOREPACIFIC Global Operations Limited¹ 171,268 50,886 24,006 1,629 (2,055)
AMOREPACIFIC GLOBAL OPERATIONS PTE. LTD.¹ 4,896 6 - (4) (255)
AMOREPACIFIC Cosmetics (Shanghai) Co.,Ltd.¹ 48,139 9,890 51,402 7,802 8,121
AMOREPACIFIC New Cosmetics (Shanghai) Co.,Ltd. 126,793 92,110 - (53) 392
AMOREPACIFIC (Shanghai) R&I Center Co., Ltd. 1,809 97 1,337 (490) (451)
AMOREPACIFIC Trading Co. Ltd. 129,201 88,435 358,820 2,361 2,740
AMOREPACIFIC EUROPE S.A.S 88,929 56,166 73,065 144 1,163
Annick Goutal S.A.S 22,401 19,777 17,786 (4,580) (5,401)
AMOREPACIFIC US, INC. 11,521 6,001 23,489 (2,289) (5,644)
AMOREPACIFIC Japan Co.,Ltd. 13,425 11,565 47,639 (4,089) (4,691)
AMOREPACIFIC Taiwan Co.,Ltd. 6,017 3,460 10,256 3 (111)
AMOREPACIFIC SINGAPORE PTE., LTD. 20,262 4,742 22,736 (3,236) (4,460)
AMOREPACIFIC MALAYSIA SDN. BHD. 4,138 1,159 7,893 701 431
AMOREPACIFIC VIETNAM JSC 5,611 2,419 2,749 203 111
AMOREPACIFIC (Thailand) LIMITED 5,522 2,781 9,161 (1,458) (1,849)
PT. LANEIGE INDONESIA PACIFIC 1,795 950 788 (1,162) (1,566)
Innisfree Cosmetics India Private Limited 854 - - - (32)
2013
Total
Total Total Net income comprehensive
assets liabilities Sales (loss) income(loss)

AMOREPACIFIC Group, Inc. and SubsidiariesNotes to Consolidated Financial StatementsDecember 31, 2013 and 2012
10
1Represents separate financial statements in which its investments in subsidiaries and associates
are measured at cost.
The amounts presented above are before the elimination of intercompany transactions. Also, the
amounts presented above reflect accounting adjustments which were different from the immediate
parent’s.
Changes in scope for consolidation in 2013
There are no subsidiaries which are newly consolidated or excluded from consolidation in 2013.
(in millions of Korean won)
AMOREPACIFIC Corporation ₩ 2,865,781 ₩ 520,719 ₩ 2,510,394 ₩ 275,500 ₩ 264,196
Etude Corporation 108,441 37,721 280,507 18,608 18,410
Innisfree Corporation 105,948 40,858 229,416 28,284 28,042
AMOS Professional Corporation 43,066 7,087 42,623 8,197 8,234
PACIFICPHARMA Corporation 144,480 56,311 141,247 1,056 2,265
PACIFICGLAS, Inc. 62,653 11,051 59,379 (25) (323)
PACIFICPACKAGE Corporation 35,996 9,451 51,064 3,797 3,665
Jangwon Co., Ltd. 83,723 9,325 11,376 1,747 1,626
COSVISION CO.,LTD. 22,438 16,523 73,702 1,567 1,540
AMOREPACIFIC Global Operations Limited¹ 133,988 45,261 1,540 (704) (7,582)
AMOREPACIFIC GLOBAL OPERATIONS PTE. LTD.¹ 5,148 2 - 5 (59)
AMOREPACIFIC Cosmetics (Shanghai) Co.,Ltd.¹ 41,123 10,890 47,902 4,460 7,199
AMOREPACIFIC New Cosmetics (Shanghai) Co.,Ltd. 44,219 9,743 - (94) (1,089)
AMOREPACIFIC (Shanghai) R&I Center Co., Ltd. 2,162 - - 28 (33)
AMOREPACIFIC Trading Co. Ltd. 91,692 53,904 258,683 9,165 4,136
AMOREPACIFIC EUROPE S.A.S 79,377 47,779 66,353 (10,323) (12,529)
Annick Goutal S.A.S 20,136 12,110 19,650 (719) (1,495)
AMOREPACIFIC US, INC. 10,684 4,985 17,998 (4,408) (4,867)
AMOREPACIFIC Japan Co.,Ltd. 11,961 10,874 47,036 (3,585) (3,920)
AMOREPACIFIC Taiwan Co.,Ltd. 3,723 1,055 7,213 (695) (783)
AMOREPACIFIC SINGAPORE PTE., LTD. 14,409 6,272 10,448 (1,666) (2,039)
AMOREPACIFIC MALAYSIA SDN. BHD. 3,033 485 5,363 590 490
AMOREPACIFIC VIETNAM JSC 4,791 1,710 2,663 (765) (981)
AMOREPACIFIC (Thailand) LIMITED 2,991 1,117 2,867 (668) (727)
PT. LANEIGE INDONESIA PACIFIC 1,129 411 - (283) (359)
Innisfree Cosmetics India Private Limited 351 - - - (2)
2012
assets liabilities Sales (loss) income(loss)
Total Total Net income comprehensive
Total

AMOREPACIFIC Group, Inc. and SubsidiariesNotes to Consolidated Financial Statements
December 31, 2013 and 2012
11
2. Significant Accounting Policies
The principal accounting policies applied in the preparation of these consolidated financial
statements are set out below. These policies have been consistently applied to all the periods
presented, unless otherwise stated.
2.1 Basis of Preparation
The Group maintains its accounting records in Korean won and prepares statutory financial
statements in the Korean language (Hangul) in accordance with the International Financial
Reporting Standards as adopted by the Republic of Korea (“Korean IFRS”). The accompanying
consolidated financial statements have been condensed, restructured and translated into English
from the Korean language financial statements.
Certain information attached to the Korean language financial statements, but not required for a fair
presentation of the Group's financial position, financial performance or cash flows, is not presented
in the accompanying consolidated financial statements.
The Group’s consolidated financial statements have been prepared in accordance with Korean
IFRS. These are the standards, subsequent amendments and related interpretations issued by the
International Accounting Standards Board ("IASB") that have been adopted by the Republic of
Korea.
The preparation of financial statements requires the use of certain critical accounting estimates. It
also requires management to exercise judgment in the process of applying the Group’s accounting
policies. The areas involving a higher degree of judgment or complexity, or areas where
assumptions and estimates are significant to the consolidated financial statements are disclosed in
Note 3.
2.2 Changes in Accounting Policy and Disclosures
(a) New and amended standards adopted by the Group
The Group newly applied the following amended and enacted standards for the annual period
beginning on January 1, 2013:
- Amendment to Korean IFRS 1001, Presentation of Financial Statements: Presentation of Items
of Other Comprehensive Income
The amendment requires other comprehensive income items to be presented into two groups on
the basis of whether they are potentially reclassifiable to profit or loss subsequently. The Group
applies the amendment retroactively and there is no impact of the application of this amendment
on its comprehensive income or loss.

AMOREPACIFIC Group, Inc. and SubsidiariesNotes to Consolidated Financial Statements
December 31, 2013 and 2012
12
- Amendment to Korean IFRS 1019, Employee Benefits
The amendment requires entities to immediately recognize all actuarial gains and losses incurred
in other comprehensive income or loss. All past service costs incurred are immediately recognized
in accordance with the change of the plan, and the previous separate calculation of the interest
cost and the expected returns on plan assets has been revised to calculate net interest expense
(income) by applying the discount rate used in the defined benefit obligation measurement in the
net defined benefit liabilities (assets). The Group applies the amendment retroactively and the
prior year’s consolidated statement of comprehensive income has been restated by retroactive
application.
The effects of retroactive application of this change in accounting policy are as follows:
(in millions of Korean won, except per share amounts) 2013
Before
change Impact
After
change
Cost of sales \ 1,199,461 \ - \ 1,199,461
Selling and administrative expenses 2,226,466 (287) 2,226,179
Post-tax other comprehensive income (7,259) (218) (7,477)
Basic earnings per share to the ordinary equity holders 20,093 9 20,102
Basic earnings per share to the preferred equity holders 20,148 9 20,157
(in millions of Korean won, except per share amounts) 2013
Before
change Impact
After
change
Cost of sales \ 1,013,893 \ - \ 1,013,893
Selling and administrative expenses 1,968,749 (1,325) 1,967,424
Post-tax other comprehensive income (23,005) (1,010) (24,015)
Basic earnings per share to the ordinary equity holders 19,088 55 19,143
Basic earnings per to the preferred equity holders 19,138 55 19,193
- Korean IFRS 1110, Consolidated Financial Statements
Korean IFRS 1110, Consolidated Financial Statements, introduces a single control concept and
provides a specific guidance for the control. The adoption of this standard does not have an impact
on consolidation scope in the consolidated financial statements.
- Korean IFRS 1111, Joint Arrangements
Korean IFRS 1111, Joint Arrangements, reflects the substance of joint arrangements and focuses
on the rights and obligations of the parties to the joint arrangements rather than on the legal forms
of the arrangements. Joint arrangements are classified into joint operations or joint ventures. The
adoption of this standard does not have an impact on the consolidated financial statements.

AMOREPACIFIC Group, Inc. and SubsidiariesNotes to Consolidated Financial Statements
December 31, 2013 and 2012
13
- Korean IFRS 1112, Disclosures of Interests in Other Entities
Korean IFRS 1112, Disclosure of Interests in Other Entities, provides disclosure requirements for
all types of equity investments in other entities including subsidiaries, associates, joint ventures
and unconsolidated structured entities.
- Korean IFRS 1027, Separate Financial Statements
Korean IFRS 1027, Separate Financial Statements, contains accounting treatments and
requirements for investments in subsidiaries, associates and joint ventures relating only to
separate financial statements of the Controlling Company.
- Korean IFRS 1113, Fair Value Measurement
Korean IFRS 1113, Fair Value Measurement, provides a precise definition of fair value, and a
single source of fair value measurement and disclosure requirements for use across K-IFRS. The
Group has applied this standard prospectively according to the transitional provisions of K-IFRS
1113 and there is no material impact of the application of this standard on the consolidated
financial statements.
(b) New standards and interpretations not yet adopted
New standards, amendments and interpretations issued but not effective for the financial year
beginning January 1, 2013 and not early adopted by the Group are as follows:
- Amendment to Korean IFRS 1110, Consolidated Financial Statements
Amendment to Korean IFRS 1110, Consolidated Financial Statements, provides that, if a parent
company qualifies as an investment entity, it is required to measure its investments in subsidiaries
at fair value through profit and loss instead of consolidating these subsidiaries in its consolidated
financial statements. The amendment does not apply for a parent of an investment entity if the
parent itself is not an investment entity. This amendment is effective for annual periods beginning
on or after January 1, 2014, with early adoption permitted. The Group expects that the application
of this amendment would not have a material impact on its consolidated financial statements
- Amendment to Korean IFRS 1032, Financial Instruments: Presentation
Amendment to Korean IFRS 1032, Financial Instruments: Presentation, provides that the right to
offset must not be contingent on a future event and must be legally enforceable in all of
circumstances; and if an entity can settle amounts in a manner such that outcome is, in effect,
equivalent to net settlement, the entity will meet the net settlement criterion. This amendment is
effective for annual periods beginning on or after January 1, 2014, and the Group is assessing the
impact of application of this amendment on its consolidated financial statements.

AMOREPACIFIC Group, Inc. and SubsidiariesNotes to Consolidated Financial Statements
December 31, 2013 and 2012
14
- Amendment to Korean IFRS 1039, Financial Instruments: Recognition and Measurement
Amendment to Korean IFRS 1039, Financial Instruments: Recognition and Measurement, allows
the continuation of hedge accounting for a derivative that has been designated as a hedging
instrument in a circumstance in which that derivative is novated to a central counterparty (CCP) as
a consequence of laws or regulations. This amendment is effective for annual periods beginning
on or after January 1, 2014, with early adoption permitted. The Group is assessing the impact of
application of this amendment on its consolidated financial statements.
- Enactment of Korean IFRS 2121, Levies
Korean IFRS 2121, Levies, are applied to a liability to pay a levy imposed by a government in
accordance with the legislation. The interpretation requires that the liability to pay a levy is
recognized when the activity that triggers the payment of the levy occurs, as identified by the
legislation (the obligating event). This interpretation is effective for annual periods beginning on or
after January 1, 2014, with early adoption permitted. The Group expects that the application of this
interpretation would not have a material impact on its consolidated financial statements.
2.3 Consolidation
The Group has prepared the consolidated financial statements in accordance with Korean IFRS
1110, Consolidated Financial Statements.
(a) Subsidiaries
Subsidiaries are all entities (including special purpose entities) over which the Company has
control. The Company controls the corresponding investee when it is exposed, or has rights, to
variable returns from its involvement with the investee and has the ability to affect those returns
through its power over the investee. Consolidation of a subsidiary begins from the date the
Company obtains control of a subsidiary and ceases when the Company loses control of the
subsidiary.
The Group applies the acquisition method to account for business combinations. The
consideration transferred is measured at the fair values of the assets transferred, and identifiable
assets acquired and liabilities and contingent liabilities assumed in a business combination are
initially measured at their fair values at the acquisition date. The Group recognizes any non-
controlling interest in the acquiree on an acquisition-by-acquisition basis in the event of liquidation,
either at fair value or at the non-controlling interest’s proportionate share of the recognized
amounts of acquiree’s identifiable net assets. All other non-controlling interests are measured at
their acquisition-date fair values, unless another measurement basis is required by IFRSs.
Acquisition-related costs are expensed as incurred.
Goodwill is recognized as the excess of the aggregate of the consideration transferred, the
amount of any non-controlling interest in the acquiree, and the acquisition-date fair value of the
acquirer’s previously held equity interest in the acquiree over the identifiable net assets acquired.
If this consideration is lower than the fair value of the net assets of the subsidiary acquired, the
difference is recognized in profit or loss.

AMOREPACIFIC Group, Inc. and SubsidiariesNotes to Consolidated Financial Statements
December 31, 2013 and 2012
15
Balances of receivables and payables, income and expenses and unrealized gains on
transactions between the Group subsidiaries are eliminated. Accounting policies of subsidiaries
have been changed where necessary to ensure consistency with the policies adopted by the
Group.
(b) Changes in ownership interests in subsidiaries without change of control
In transactions with non-controlling interests, which do not result in loss of control, the Group
recognizes directly in equity any difference between the amount by which the non-controlling
interests are adjusted and the fair value of the consideration paid or received, and attribute it to the
owners of the parent.
(c) Disposal of subsidiaries
If the Group loses control of a subsidiary, any investment continuously retained in the subsidiary is
re-measured at its fair value at the date when control is lost and any resulting differences are
recognized in profit or loss.
(d) Associates
Associates are all entities over which the Group has significant influence, and investments in
associates are initially recognized at acquisition cost using the equity method. Unrealized gains on
transactions between the Group and its associates are eliminated to the extent of the Group’s
interest in the associates. If there is any objective evidence that the investment in the associate is
impaired, the Group recognizes the difference between the recoverable amount of the associate
and its book value as impairment loss.
2.4 Segment Reporting
The Group’s operating segments are reported in a manner consistent with the internal reporting
provided to the chief operating decision-maker (Note 5). The chief operating decision-maker, who
is responsible for allocating resources and assessing performance of the operating segments, has
been identified as the representative director that makes strategic decisions.
2.5 Foreign Currency Translation
(a) Functional and presentation currency
Items included in the financial statements of each of the Group’s entities are measured using the
currency of the primary economic environment in which the entity operates (“the functional
currency”). The consolidated financial statements are presented in Korean won, which is the
controlling entity’s functional and presentation currency.

AMOREPACIFIC Group, Inc. and SubsidiariesNotes to Consolidated Financial Statements
December 31, 2013 and 2012
16
(b) Transactions and balances
Foreign currency transactions are translated into the functional currency using the exchange rates
prevailing at the dates of the transactions or valuation where items are re-measured. Foreign
exchange gains and losses resulting from the settlement of such transactions and from the
translation at year-end exchange rates of monetary assets and liabilities denominated in foreign
currencies are recognized in profit or loss.
Exchange differences arising on non-monetary financial assets and liabilities such as equity
instruments at fair value through profit or loss and available-for-sale equity instruments are
recognized in profit or loss and included in other comprehensive income, respectively, as part of
the fair value gain or loss.
(c) Translation to presentation currency
The results and financial position of all Group entities that have a functional currency different from
the presentation currency are translated into the presentation currency as follows:
assets and liabilities for each statement of financial position presented are translated at
the closing rate at the end of the reporting period;
income and expenses for each income statement are translated at average exchange
rates; and
all resulting exchange differences are recognized in other comprehensive income.
When the Company ceases to control the subsidiary, exchange differences that were recorded in
equity are recognized in the income statement as part of the gain or loss on sale.
Goodwill and fair value adjustments arising on the acquisition of a foreign entity are treated as
assets and liabilities of the foreign entity and translated at the closing rate.
2.6 Financial Instruments
(a) Classification and measurement
The Group classifies its financial assets in the following categories: financial assets at fair value
through profit or loss, available-for-sale financial assets, loans and receivables, and held-to-
maturity financial assets. Regular purchases and sales of financial assets are recognized on trade
date.
Regular purchases and sales of financial assets are recognized on the trade date. At initial
recognition, financial assets are measured at fair value plus, in the case of financial assets not
carried at fair value through profit or loss, transaction costs. Transaction costs of financial assets
carried at fair value through profit or loss are expensed in the statement of income. After the initial
recognition, available-for-sale financial assets and financial assets at fair value through profit or
loss are subsequently carried at fair value. Loans and receivables, and held-to-maturity
investments are subsequently carried at amortized cost using the effective interest rate method.

AMOREPACIFIC Group, Inc. and SubsidiariesNotes to Consolidated Financial Statements
December 31, 2013 and 2012
17
Changes in fair value of financial assets at fair value through profit or loss are recognized in profit
or loss and changes in fair value of available-for-sale financial assets are recognized in other
comprehensive income. When the available-for-sale financial assets are sold or impaired, the fair
value adjustments recorded in equity are reclassified into profit or loss.
(b) Impairment
The Group assesses at the end of each reporting period whether there is objective evidence that a
financial asset or a group of financial assets is impaired. A financial asset or a group of financial
assets is impaired and impairment losses are incurred only if there is objective evidence of
impairment as a result of one or more events that occurred after the initial recognition of the asset
(a ‘loss event’) and that loss event (or events) has an impact on the estimated future cash flows of
the financial asset or a group of financial assets that can be reliably estimated.
Impairment of loans and receivables is presented as a deduction in an allowance account.
Impairment of other financial assets is directly deducted from their carrying amount. The Group
writes off financial assets when the assets are determined to be no longer recoverable.
The objective evidence that a financial asset is impaired includes significant financial difficulty of
the issuer or obligor; a delinquency in interest or principal payments over three months; or the
disappearance of an active market for that financial asset because of financial difficulties. A
decline in the fair value of an available-for-sale equity instrument by more than 30% from its cost
or a prolonged decline below its cost for more than six months is also objective evidence of
impairment.
2.7 Derivative Instruments
Derivatives are initially recognized at fair value on the date when a derivative contract is entered
into and are subsequently re-measured at their fair value. Changes in the fair value of the
derivatives that are not qualified for hedge accounting are recognized in the statement of income
within 'other non-operating income (expenses)' or 'finance income (expenses)' according to the
nature of transactions.
2.8 Inventories
Inventories are stated at the lower of cost and net realizable value. Cost is determined using the
first-in, first-out (FIFO) method.

AMOREPACIFIC Group, Inc. and SubsidiariesNotes to Consolidated Financial Statements
December 31, 2013 and 2012
18
2.9 Property, Plant and Equipment
Property, plant and equipment is stated at its cost less accumulated depreciation and accumulated
impairment losses. Historical cost includes expenditures that is directly attributable to the
acquisition of the items.
Land is not depreciated. Depreciation on other assets is calculated using the straight-line method
to allocate the difference between their cost and their residual values over their estimated useful
lives, as follows:
Useful life
Buildings 10 - 49 years
Structures 10 - 40 years
Machinery 5 - 20 years
Vehicles 4 - 6 years
Tools 3 years
Fixtures and furniture 2 - 4 years
Others 10 - 40 years
The depreciation method, residual values and useful lives of property, plant and equipment are
reviewed at the end of each reporting period and, if appropriate, accounted for as changes in
accounting estimates.
2.10 Borrowing Costs
Borrowing costs incurred in the acquisition or construction of a qualifying asset are capitalized in
the period when it is prepared for its intended use, and investment income earned on the
temporary investment of borrowings made specifically for the purpose obtaining a qualifying asset
is deducted from the borrowing costs eligible for capitalization during the period. Other borrowing
costs are recognized as expenses for the period in which they are incurred.
2.11 Government Grants
Government grants are recognized at their fair values when there is reasonable assurance that the
grant will be received and the Group will comply with the conditions attaching to it. Government
grants related to assets are presented by deducting the grants in arriving at the carrying amount of
the assets, and grants related to income are deferred and presented by deducting the related
expenses for the purpose of the government grants.

AMOREPACIFIC Group, Inc. and SubsidiariesNotes to Consolidated Financial Statements
December 31, 2013 and 2012
19
2.12 Intangible Assets
(a) Goodwill
Goodwill is measured as explained in Note 2.3(a) and goodwill arises on the acquisition of
subsidiaries, associates and business are included in intangible assets. Goodwill is tested annually
for impairment and carried at cost less accumulated impairment losses. Impairment losses on
goodwill are not reversed. Gains and losses on the disposal of an entity include the carrying
amount of goodwill relating to the entity sold.
For the purpose of impairment testing, goodwill acquired in a business combination is allocated to
each of the CGUs, or group of CGUs, that is expected to benefit from the synergies of the
combination. Goodwill is monitored at the operating segment level.
Goodwill impairment reviews are undertaken annually or more frequently if events or changes in
circumstances indicate a potential impairment. The carrying value of goodwill is compared to the
recoverable amount, which is the higher of value in use and the fair value less costs to sell. Any
impairment is recognized immediately as an expense and is not subsequently reversed.
(b) Industrial property rights
Acquired industrial property rights, software and other intangible assets are shown at historical cost.
Intangible assets acquired in a business combination are recognized at fair value at the acquisition
date. These have a finite useful life and are carried at cost less accumulated amortization.
Amortization is calculated using the straight-line method to allocate the cost over their estimated
useful lives, as follows:
Useful life
Industrial property rights 5 - 20 years
Software 5 years
Others 3 - 5 years
Membership rights are regarded as intangible assets with indefinite useful life and not amortized
because there is no foreseeable limit to the period over which the asset is expected to be utilized.
2.13 Investment Property
Property held to earn rentals or for capital appreciation or both is classified as investment property.
Investment property is measured initially at its cost. After recognition as an asset, investment
property is carried at cost less accumulated depreciation and impairment losses. Investment
property, except for land, is depreciated using the straight-line method over their useful lives which
are the same as those of property, plant and equipment.

AMOREPACIFIC Group, Inc. and SubsidiariesNotes to Consolidated Financial Statements
December 31, 2013 and 2012
20
2.14 Impairment of Non-financial Assets
Goodwill or intangible assets with indefinite useful lives are not subject to amortization and are
tested annually for impairment. Assets that are subject to amortization are reviewed for impairment
whenever events or changes in circumstances indicate that the carrying amount may not be
recoverable. An impairment loss is recognized for the amount by which the asset’s carrying
amount exceeds its recoverable amount. The recoverable amount is the higher of an asset’s fair
value less costs to sell and value in use. Non-financial assets, other than goodwill, that suffered
impairment are reviewed for possible reversal of the impairment at each reporting date.
2.15 Financial Liabilities
(a) Classification and measurement
Financial liabilities at fair value through profit or loss are financial instruments held for trading.
Financial liabilities are classified in this category if incurred principally for the purpose of
repurchasing them in the near term. Derivatives that are not designated as hedges or bifurcated
from financial instruments containing embedded derivatives are also categorized as held-for-
trading.
The Group classifies non-derivative financial liabilities, except for financial liabilities at fair value
through profit or loss, financial guarantee contracts and financial liabilities that arise when a
transfer of financial assets does not qualify for derecognition, as financial liabilities carried at
amortized cost and presented as ‘trade payables’, ‘borrowings’, and ‘other payables’ in the
statement of financial position.
Preferred shares that provide for a mandatory redemption at a particular date are classified as
liabilities. Interest expenses on these preferred shares calculated using the effective interest
method are recognized in the statement of income as ‘finance costs’, together with interest
expenses recognized on other financial liabilities.
(b) Derecognition
Financial liabilities are removed from the statement of financial position when it is extinguished, for
example, when the obligation specified in the contract is discharged, cancelled or expired or when
the terms of an existing financial liability are substantially modified.
2.16 Current and Deferred Tax
The tax expense for the period consists of current and deferred tax. Tax is recognized on the profit
for the period in the statement of income, except to the extent that it relates to items recognized in
other comprehensive income or directly in equity. In this case, the tax is also recognized in other
comprehensive income or directly in equity, respectively. The tax expense is calculated on the
basis of the tax laws enacted or substantively enacted at the end of the reporting period.
Deferred tax is recognized for temporary differences arising between the tax bases of assets and
liabilities and their carrying amounts as expected tax consequences at the recovery or settlement

AMOREPACIFIC Group, Inc. and SubsidiariesNotes to Consolidated Financial Statements
December 31, 2013 and 2012
21
of the carrying amounts of the assets and liabilities. However, deferred tax assets and liabilities
are not recognized if they arise from initial recognition of an asset or liability in a transaction other
than a business combination that at the time of the transaction affects neither accounting nor
taxable profit or loss. Deferred tax assets are recognized only to the extent that it is probable that
future taxable profit will be available against which the deductible temporary differences can be
utilized.
Deferred tax liability is recognized for taxable temporary differences associated with investments
in subsidiaries, associates, and interests in joint ventures, except to the extent that the Group is
able to control the timing of the reversal of the temporary difference and it is probable that the
temporary difference will not reverse in the foreseeable future. In addition, deferred tax asset is
recognized for deductible temporary differences arising from such investments to the extent that it
is probable the temporary difference will reverse in the foreseeable future and taxable profit will be
available against which the temporary difference can be utilized.
Deferred tax assets and liabilities are offset when there is a legally enforceable right to offset
current tax assets against current tax liabilities and when the deferred income taxes assets and
liabilities relate to income taxes levied by the same taxation authority on either the same taxable
entity or different taxable entities where there is an intention to settle the balances on a net basis.
2.17 Provisions
Provisions are measured at the present value of the expenditures expected to be required to settle
the obligation and the increase in the provision due to passage of time is recognized as interest
expense.
2.18 Employee Benefits
(a) Post-employment benefits
The Group has both defined benefit and defined contribution plans. A defined contribution plan is a
pension plan under which the Group pays fixed contributions into a separate entity. The
contributions are recognized as an expense when an employee has rendered service.
A defined benefit plan is a pension plan that is not a defined contribution plan. Typically defined
benefit plans define an amount of pension benefit that an employee will receive on retirement,
usually dependent on one or more factors such as age, years of service and compensation. The
liability recognized in the statement of financial position in respect of defined benefit pension plans
is the present value of the defined benefit obligation at the end of the reporting period less the fair
value of plan assets. The defined benefit obligation is calculated annually by independent
actuaries using the projected unit credit method. The present value of the defined benefit
obligation is determined by discounting the estimated future cash outflows using interest rates of
high-quality corporate bonds and that have terms to maturity approximating to the terms of the
related pension obligation. The remeasurements of the net defined benefit liability are recognized
in other comprehensive income.
If any plan amendments, curtailments, or settlements occur, past service costs or any gains or
losses on settlement are recognized as profit or loss for the year.

AMOREPACIFIC Group, Inc. and SubsidiariesNotes to Consolidated Financial Statements
December 31, 2013 and 2012
22
2.19 Revenue Recognition
Revenue is measured at the fair value of the consideration received or receivable, and represents
amounts receivable for goods and services supplied, stated net of discounts, returns and value
added taxes, after elimination of intra-company transactions.
The Group recognizes revenue when the amount of revenue can be reliably measured; when it is
probable that future economic benefits will flow to the entity; and when specific criteria have been
met for each of the Group’s activities, as described below. The revenue can be reliably measured
only when any contingency related to sales is resolved. The Group bases its estimate on historical
results, taking into consideration the type of customer, the type of transaction and the specifics of
each arrangement.
(a) Sales of goods
The Group manufactures and sells cosmetics and personal care of goods. Sales of goods are
recognized when products are delivered to the purchaser.
(b) Rendering of services
When the outcome of a transaction involving the rendering of services can be estimated reliably,
revenue associated with such a transaction is recognised by reference to the stage of performance
of the services. When the outcome of the transaction involving the rendering of services cannot be
estimated reliably, revenue is recognized only to the extent of the expenses recognised that are
recoverable.
(c) Royalty income
Royalty income is recognized on an accrual basis in accordance with the substance of the relevant
agreements.
(d) Interest income
Interest income is recognized using the effective interest method according to the time passed.
When a loan and receivable is impaired, the Group reduces the carrying amount to its recoverable
amount and continues unwinding the discount as interest income. Interest income on impaired loan
and receivables is recognized using the original effective interest rate.
(e) Dividend income
Dividend income is recognized when the right to receive payment is established.
(f) Rental income
Rental income from rental property is recognized on a straight-line basis over a rental period.

AMOREPACIFIC Group, Inc. and SubsidiariesNotes to Consolidated Financial Statements
December 31, 2013 and 2012
23
(g) Customer Loyalty Programs
The Group operates a customer loyalty program in which customers are granted rewards to receive
discounts on future purchases when purchasing products. The fair value of consideration to give or
given for a sale is allocated to the reward points and remaining of initial sale, and the consideration
allocated to the reward points is measured based on the fair value of reward in exchange of reward
points, which is the fair value of reward points considered the proportion of reward points that are
not expected to be redeemed. Revenue from the award credits is recognized when it is redeemed,
and the unredeemed proportion by customers is expected to be forfeited within 12 months after the
initial sale.
2.20 Lease
A lease is an agreement, whereby the lessor conveys to the lessee, in return for a payment or
series of payments, the right to use an asset for an agreed period of time. Leases where all the
risks and rewards of ownership are not transferred to the Group are classified as operating leases.
Lease payments under operating leases are recognized as expenses on a straight-line basis over
the lease term.
Leases where the Group has substantially all the risks and rewards of ownership are classified as
finance leases and recognized as lease assets and liabilities at the lower of the fair value of the
leased property and the present value of the minimum lease payments on the opening date of the
lease period.
A lease is classified as a finance lease if it transfers substantially all the risks and rewards
incidental to ownership at the inception of the lease. A lease other than a finance lease is
classified as an operating lease. Lease income from operating leases is recognized in income on a
straight-line basis over the lease term. Initial direct costs incurred by the lessor in negotiating and
arranging an operating lease is added to the carrying amount of the leased asset and recognized
as an expense over the lease term on the same basis as the lease income.
2.21 Non-current Assets (or Disposal Group) Held-for-sale and Discontinued Operations
Non-current assets (or disposal group) are classified as assets held for sale when their carrying
amount is to be recovered principally through a sale transaction. They are stated at the lower of
carrying amount and fair value less costs to sell.
When a component of the Group representing a separate major line of business or geographical
area of operation has been disposed of, or is subject to a sale plan involving loss of control of a
subsidiary, the Group discloses in the income statement the post-tax profit or loss of discontinued
operations and the post-tax gain or loss recognised on the measurement to fair value less costs to
sell or on the disposal of the assets or disposal groups constituting the discontinued operation. The
net cash flows attributable to the operating, investing and financing activities of discontinued
operations are presented in the notes to the financial statements.

AMOREPACIFIC Group, Inc. and SubsidiariesNotes to Consolidated Financial Statements
December 31, 2013 and 2012
24
2.22 Approval of Issuance of the Financial Statements
The issuance of the December 31, 2013 consolidated financial statements of the Group was
approved by the Board of Directors on February 6, 2014, which is subject to change with approval
at the annual shareholder’s meeting.
3. Critical Accounting Estimates and Judgments
The Group makes estimates and assumptions concerning the future. The estimates and
assumptions are continuously evaluated with consideration to factors such as events reasonably
predictable in the foreseeable future within the present circumstance according to historical
experience. The resulting accounting estimates will, by definition, seldom equal the related actual
results. The estimates and assumptions that have a significant risk of causing a material
adjustment to the carrying amounts of assets and liabilities within the next financial year are
addressed below.
(a) Estimated impairment of goodwill
The Group tests annually whether goodwill has suffered any impairment. The recoverable
amounts of cash-generating units have been determined based on value-in-use calculations.
(Note 14).
(b) Income taxes
The Group is operating in numerous countries and the income generated from these operations is
subject to income taxes based on tax laws and interpretations of tax authorities in numerous
jurisdictions. There are many transactions and calculations for which the ultimate tax determination
is uncertain (Note 26).
(c) Fair value of financial instruments
The fair value of financial instruments that are not traded in an active market is determined by
using valuation techniques. The Group uses its judgment to select a variety of methods and make
assumptions that are mainly based on market conditions existing at the end of each reporting
period (Note 40).
(d) Provisions
As described in Note 19, the Company recognizes provisions for estimated returns, profit-sharing
and bonuses as of the reporting date. The amounts are estimated based on historical data.
(e) Customer loyalty programs
By customer loyalty programs, the Group allocates the consideration receivable to the award
credits by reference to the fair value of goods providing, taking into account redemption rates and
timing of redemption based on historical data.

AMOREPACIFIC Group, Inc. and SubsidiariesNotes to Consolidated Financial Statements
December 31, 2013 and 2012
25
(f) Net defined benefit liability
The present value of net defined benefit liability depends on a number of factors that are
determined on an actuarial basis using a number of assumptions including the discount rate (Note
21).
4. U.S. Dollar Amounts
The Company operates primarily in Korean won and its accounting records are maintained in
Korean won. The U.S. dollars amounts, provided herein, represent supplementary information,
solely for the convenience of the reader. All won amounts are expressed in U.S. dollars at US$1:
₩1,055.30, the exchange rate in effect on December 31, 2013. Such presentation is not in
accordance with accounting principles generally accepted in either the Republic of Korea or the
United States, and should not be construed as a representation that the won amounts shown could
be readily converted, realized or settled in U.S. dollars at this or any other rate.
The December 31, 2012 U.S. dollar amounts, which were previously expressed at US$1:
₩1,071.10, the rate in effect on December 31, 2012, have been restated to reflect the exchange
rate in effect on December 31, 2013.
5. Segment Information
Management has determined the operating segments based on the information reviewed by the
chief operating decision-maker who formulates the strategic. Chief operating decision-maker
considers the business from perspective of products of each segment.
The main products of each business division are as follows:
Divisions Products
Cosmetics Cosmetics and household products
Pharmaceuticals Medicines
Others Cosmetics containers and hair products
The segment information for revenue and operating profit for the years ended December 31, 2013
and 2012, is as follows:
(in millions of Korean won) 2013 2012
Revenue
Operating
profit
Depreciation
and
amortization Revenue
Operating
profit
Depreciation
and
amortization
Cosmetics \3,729,647 \ 448,564 \ 144,069 \ 3,350,833 \ 428,631 \ 116,580
Pharmaceuticals 125,439 4,254 2,721 141,247 6,900 1,484
Others 193,268 16,717 8,522 175,374 15,634 7,278
\4,048,354 \ 469,535 \ 155,312 \ 3,667,454 \ 451,165 \ 125,342
AMOREPACIFIC Group, Inc. and SubsidiariesNotes to Consolidated Financial Statements
December 31, 2013 and 2012
26
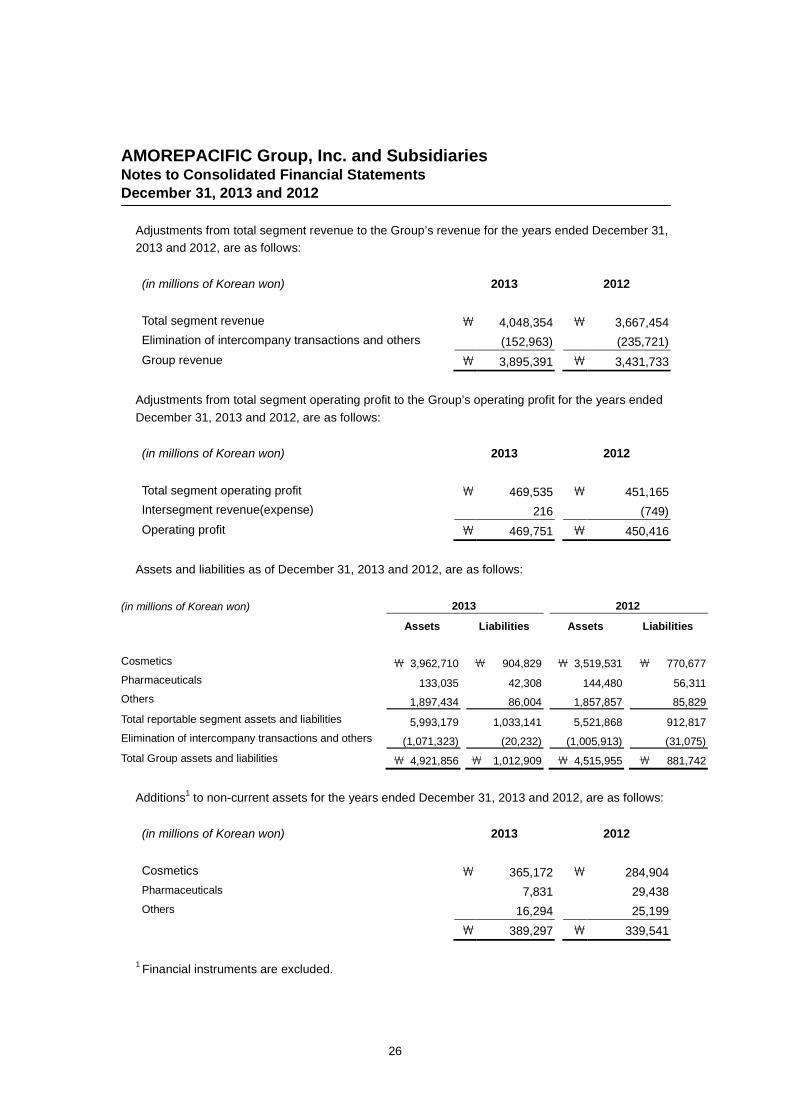
Adjustments from total segment revenue to the Group’s revenue for the years ended December 31,
2013 and 2012, are as follows:
(in millions of Korean won) 2013 2012
Total segment revenue \ 4,048,354 \ 3,667,454
Elimination of intercompany transactions and others (152,963) (235,721)
Group revenue \ 3,895,391 \ 3,431,733
Adjustments from total segment operating profit to the Group’s operating profit for the years ended
December 31, 2013 and 2012, are as follows:
(in millions of Korean won) 2013 2012
Total segment operating profit \ 469,535 \ 451,165
Intersegment revenue(expense) 216 (749)
Operating profit \ 469,751 \ 450,416
Assets and liabilities as of December 31, 2013 and 2012, are as follows:
(in millions of Korean won) 2013 2012
Assets Liabilities Assets Liabilities
Cosmetics ₩ 3,962,710 ₩ 904,829 ₩ 3,519,531 ₩ 770,677
Pharmaceuticals 133,035 42,308 144,480 56,311
Others 1,897,434 86,004 1,857,857 85,829
Total reportable segment assets and liabilities 5,993,179 1,033,141 5,521,868 912,817
Elimination of intercompany transactions and others (1,071,323) (20,232) (1,005,913) (31,075)
Total Group assets and liabilities ₩ 4,921,856 ₩ 1,012,909 ₩ 4,515,955 ₩ 881,742
Additions1
to non-current assets for the years ended December 31, 2013 and 2012, are as follows:
(in millions of Korean won) 2013 2012
Cosmetics \ 365,172 \ 284,904
Pharmaceuticals 7,831 29,438
Others 16,294 25,199
\ 389,297 \ 339,541
1Financial instruments are excluded.

AMOREPACIFIC Group, Inc. and SubsidiariesNotes to Consolidated Financial Statements
December 31, 2013 and 2012
27
External revenues by geographical areas for the years ended December 31, 2013 and 2012, and
non-current assets as December 31, 2013 and 2012, are as follows:
(in millions of Korean won) Revenue Non-current assets1
2013 2012 2013 2012
Korea \ 3,355,880 \ 2,942,478 \ 2,709,887 \ 2,611,966
North America 23,489 27,196 249 609
Europe 74,193 79,659 56,530 59,936
China 336,518 280,308 152,701 53,397
Others 105,311 102,092 19,755 13,456
\ 3,895,391 \ 3,431,733 \ 2,939,122 \ 2,739,364
1Non-current assets consist of property, plant and equipment, and intangible assets.
There is no external customer attributing to more than 10% of total revenues for the years ended
December 31, 2013 and 2012.
6. Financial Instruments by Category
Categorizations of financial assets as of December 31, 2013 and 2012, are as follows:
(in millions of Korean won) 2013 2012
Loans and receivables Cash and cash equivalents \ 364,548 \ 227,459
Current bank deposits 529,193 535,799
Non-current bank deposits 7,525 5,603
Trade receivables 243,296 221,531
Current other receivables 7,391 9,183
Non-current other receivables 135,208 109,713
Other current assets1
4,269 5,581
Available-for-sale Marketable equity securities - 4,211
financial assets Non-marketable equity securities 25,357 23,418
Debt securities 5,630 4,743
\ 1,322,417 \ 1,147,241
1Other current assets mainly represent accrued revenues (Note 16).

AMOREPACIFIC Group, Inc. and SubsidiariesNotes to Consolidated Financial Statements
December 31, 2013 and 2012
28
Categorizations of financial liabilities as December 31, 2013 and 2012, are as follows:
(in millions of Korean won) 2013 2012
Financial liabilities Trade payables \ 110,831 \ 116,411
at amortized cost Short-term borrowings 84,237 24,812
Long-term borrowings 68,992 51,750
Other payables 221,750 202,861
Other current liabilities2
19,024 8,952
Other non-current liabilities3
20,319 25,991
Financial liabilities atfair value throughprofit or loss
Other non-current liabilities⁴181 -
\ 525,334 \ 430,777
2Other current liabilities consist of dividend payables and accrued expenses (Note 20).
3Other non-current liabilities consist of deposits received, long-term accrued expenses and
financial lease liabilities (Note 20).4Other non-current liabilities consist of derivative financial liabilities (Note 17).
Income and loss of financial instruments by category for the years ended December 31, 2013 and
2012, are as follows:
(in millions of Korean won) 2013 2012
Available-for-sale financial assets
Gain(Loss) on valuation (Other comprehensive income(loss)) \ (3,883) \ 785
Gain on disposal (Profit or loss) 3,240 1,947
Gain on disposal (Reclassification1) 3,207 2,215
Interest income 85 95
Dividend income 808 899
Loans and receivables
Interest income 25,889 29,351
Loss on foreign currency translation (1,642) (3,301)
Loss on impairment - 3,841
Financial liabilities at amortized cost
Interest expense (3,140) (2,298)
Gain on foreign currency translation 467 471
Financial liabilities at fair value through profit or loss
Gain(Loss) on valuation (185) -
1Reclassification to profit/loss represents amounts transferred from components of other
comprehensive income.

AMOREPACIFIC Group, Inc. and SubsidiariesNotes to Consolidated Financial Statements
December 31, 2013 and 2012
29
7. Credit Quality of Financial Assets
The credit quality of financial assets that are neither past due nor impaired can be assessed by
reference to external credit ratings (if available) or to historical information about counterparty
default rates as of December 31, 2013 and 2012:
7.1 Credit Quality of Trade Receivables
(in millions of Korean won) 2013 2012
Counterparties with external credit rating
A \ 126,979 \ 111,358
BBB 759 303
127,738 111,661
Counterparties without external credit rating
Group 11
4,093 2,689
Group 22
80,007 76,478
Group 33
1 964
84,101 80,131
\ 211,839 \ 191,792
1New customers/related parties (less than 6 months)
2Existing customers/related parties (more than 6 months) with no defaults in the past
3Existing customers/related parties (more than 6 months) with some defaults in the past.
All defaults were fully recovered.
7.2 Credit Quality of Other Financial Assets
(in millions of Korean won) 2013 2012
Counterparties with external credit rating
A \ 2,667 \ 2,695
2,667 2,695
Counterparties without external credit rating
Group 1 663 3,195
Group 2 139,269 109,796
139,932 112,991
\ 142,599 \ 115,686

AMOREPACIFIC Group, Inc. and SubsidiariesNotes to Consolidated Financial Statements
December 31, 2013 and 2012
30
(in millions of Korean won) 2013 2012
Cash equivalents and bank deposits
AAA \ 889,206 \ 746,725
AA 12,000 22,000
\ 901,206 \ 768,725
8. Cash and Cash Equivalents
Cash and cash equivalents as of December 31, 2013 and 2012, are as follows:
(in millions of Korean won) 2013 2012
Cash on hand \ 60 \ 136
Ordinary deposits 28,127 42,999
Checking accounts 60,138 23,802
MMDA 276,223 160,522
\ 364,548 \ 227,459
9. Trade and Other Receivables
Trade and other receivables as of December 31, 2013 and 2012, are as follows:
(in millions of Korean won) 2013 2012
Trade receivables \ 246,327 \ 224,723
Less: provision for impairment (3,031) (3,192)
Trade receivables, net \ 243,296 \ 221,531
Current other receivables \ 7,882 \ 9,671
Less: provision for impairment (491) (488)
Current other receivables, net \ 7,391 \ 9,183
Non-current other receivables \ 135,208 \ 109,713
Less: provision for impairment - -
Non-current other receivables, net \ 135,208 \ 109,713
AMOREPACIFIC Group, Inc. and SubsidiariesNotes to Consolidated Financial Statements
December 31, 2013 and 2012
31
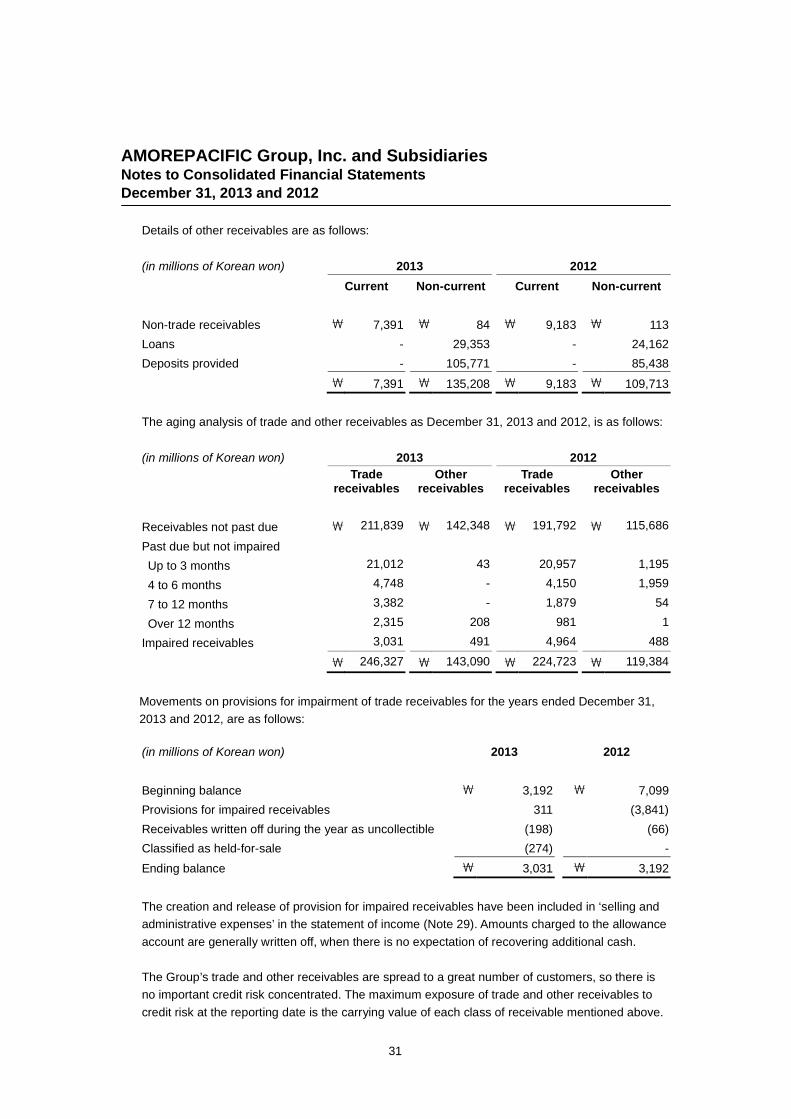
Details of other receivables are as follows:
(in millions of Korean won) 2013 2012
Current Non-current Current Non-current
Non-trade receivables \ 7,391 \ 84 \ 9,183 \ 113
Loans - 29,353 - 24,162
Deposits provided - 105,771 - 85,438
\ 7,391 \ 135,208 \ 9,183 \ 109,713
The aging analysis of trade and other receivables as December 31, 2013 and 2012, is as follows:
(in millions of Korean won) 2013 2012
Tradereceivables
Otherreceivables
Tradereceivables
Otherreceivables
Receivables not past due \ 211,839 \ 142,348 \ 191,792 \ 115,686
Past due but not impaired
Up to 3 months 21,012 43 20,957 1,195
4 to 6 months 4,748 - 4,150 1,959
7 to 12 months 3,382 - 1,879 54
Over 12 months 2,315 208 981 1
Impaired receivables 3,031 491 4,964 488
\ 246,327 \ 143,090 \ 224,723 \ 119,384
Movements on provisions for impairment of trade receivables for the years ended December 31,
2013 and 2012, are as follows:
(in millions of Korean won) 2013 2012
Beginning balance \ 3,192 \ 7,099
Provisions for impaired receivables 311 (3,841)
Receivables written off during the year as uncollectible (198) (66)
Classified as held-for-sale (274) -
Ending balance \ 3,031 \ 3,192
The creation and release of provision for impaired receivables have been included in ‘selling and
administrative expenses’ in the statement of income (Note 29). Amounts charged to the allowance
account are generally written off, when there is no expectation of recovering additional cash.
The Group’s trade and other receivables are spread to a great number of customers, so there is
no important credit risk concentrated. The maximum exposure of trade and other receivables to
credit risk at the reporting date is the carrying value of each class of receivable mentioned above.

AMOREPACIFIC Group, Inc. and SubsidiariesNotes to Consolidated Financial Statements
December 31, 2013 and 2012
32
10. Inventories
Inventories as of December 31, 2013 and 2012, are as follows:
(in millions of Korean won) 2013 2012
Merchandise \ 93,202 \ 78,309
Finished goods 124,888 122,058
Semi-finished goods 27,757 32,900
Work-in-process 3,966 5,226
Raw materials 38,223 49,331
Subsidiary materials 26,215 22,996
Supplies 5,402 4,001
Materials-in-transit 22,480 19,168
\ 342,133 \ 333,989
The cost of inventories recognized as expense and included in ‘cost of sales’ amounts to
\1,026,594 million (2012: \818,134 million).
Movements on the provision for impairment of inventories for the years ended December 31, 2013
and 2012, are as follows:
(in millions of Korean won) 2013 2012
Loss on valuation of inventories \ 4,738 \ 629
Loss on disposal of inventories 23,885 19,386
\ 28,623 \ 20,015

AMOREPACIFIC Group, Inc. and SubsidiariesNotes to Consolidated Financial Statements
December 31, 2013 and 2012
33
11. Available-for-sale Financial Assets
Available-for-sale financial assets as of December 31, 2013 and 2012, are as follows:
(in millions of Korean won) 2013 2012
Available-for-sale debt securities
Government-issued securities \ 5,630 \ 4,743
Available-for-sale equity securities
ANTERIOS, INC. 4,067 4,067
CAPSUM 549 549
Regen Prime Co., Ltd. 500 500
Lithera, Inc. 2,147 2,147
Obalon Therapeutics 5,378 5,378
Brickell Biotech 1,083 -
TRIA BEAUTY INC 1,688 -
Pacific Metals Co., Ltd. 6,080 6,080
I’M Investment Securities Co., Ltd. 2,541 3,373
GL Pharm Tech Co., Ltd. 191 191
Welskin Co., Ltd. 48 48
The Korea Economic Daily 81 81
Biogenics Co., Ltd. 1,000 1,000
Chungbuk Printing Association 1 1
ELANDRETAIL Ltd. 3 3
Marketable equity securities
Medy-tox Inc. - 4,211
\ 30,987 \ 32,372
Marketable equities are measured at fair value using quoted price in an active market. The equity
of I’M Investment & Securities, among the non-marketable equities, is measured at fair value using
recent arm's length market transactions between knowledgeable, willing parties, since the market
for this equity is not active.
Non-marketable equities other than the equity of I’M Investment & Securities are measured at cost,
because the variability of estimated cash flows is significant and the probabilities of the various
estimates cannot be reasonably assessed, or the difference between their fair values and their
acquisition costs is immaterial. Debt investments are measured at cost, since the difference
between the fair value and the acquisition cost is immaterial.

AMOREPACIFIC Group, Inc. and SubsidiariesNotes to Consolidated Financial Statements
December 31, 2013 and 2012
34
The changes in available-for-sale financial assets as of December 31, 2013 and 2012, are as
follows:
(in millions of Korean won) 2013 2012
Beginning balance \ 32,372 \ 18,301
Additions 4,180 7,929
Reclassification - 6,080
Disposals (623) (874)
Gains(Losses) on valuation (831) 3,859
Losses reclassified from equity1
(4,111) (2,923)
Ending balance \ 30,987 \ 32,372
1The Company reclassified gain on valuation of ₩4,111 million (deferred tax: ₩ 904 million) from
equity to profit or loss in 2013, and the gain on valuation of ₩ 2,923 million (deferred tax: ₩ 708
million) were transferred to profit or loss in 2012 (Notes 6 and 22).
The maximum exposure to credit risk at the reporting date is the carrying value of the debt
securities classified as available-for-sale.
None of the available-for-sale financial assets is either past due or impaired.
12. Associates
Associates as of December 31, 2013 and 2012, are as follows:
(in millions of Korean won) 2013
Percentage ofownership(%)
Acquisitioncost
Bookvalue
Net assetvalue
Taiwan AMORE Co.,Ltd. 50 \ 131 \ 1,935 \ 2,118
AMOREPACIFIC HongKong Co.,Limited 30 1,220 5,951 7,371
BBDO Korea lnc. 30 949 3,496 3,496
Anhui Pacific Tea Co., Ltd.1
80 786 236 236
\ 3,086 \ 11,618 \ 13,221
(in millions of Korean won) 2012
Percentage ofownership(%)
Acquisitioncost
Bookvalue
Net assetvalue
Taiwan AMORE Co.,Ltd. 50 \ 131 \ 1,808 \ 1,953
AMOREPACIFIC HongKong Co.,Limited 30 1,220 3,285 4,744
BBDO Korea lnc. 30 949 3,583 3,583
Anhui Pacific Tea Co., Ltd.1
80 786 236 236
\ 3,086 \ 8,912 \ 10,516
1A subsidiary for consolidation but not included in the scope of consolidation due to its
immateriality.

AMOREPACIFIC Group, Inc. and SubsidiariesNotes to Consolidated Financial Statements
December 31, 2013 and 2012
35
Changes in investments in associates for the years ended December 31, 2013 and 2012, are as
follows:
(in millions of Korean won) 2013
Taiwan AMORECo., Ltd.
AMOREPACIFICHongKong
Co., LimitedBBDO
Korea Inc.Anhui PacificTea Co., Ltd. Total
Beginning balance ₩ 1,808 ₩ 3,285 ₩ 3,583 ₩ 236 ₩ 8,912
Share of profit 260 2,896 1,174 - 4,330
Changes in other comprehensive income (95) (191) - - (286)
Dividends - - (1,261) - (1,261)
Exchange differences (38) (39) - - (77)
Ending balance ₩ 1,935 ₩ 5,951 ₩ 3,496 ₩ 236 ₩ 11,618
(in millions of Korean won) 2012
TaiwanAMORECo., Ltd.
AMOREPACIFICHongKong
Co., Limited
AMOREPACIFIC(Thailand)LIMITED
BBDOKorea Inc.
AnhuiPacific Tea
Co., Ltd. Total
Beginning balance ₩ 1,715 ₩ 2,836 ₩ 114 ₩ 3,596 ₩ 253 ₩ 8,514
Share of profit 383 1,292 - 1,247 - 2,922
Loss on impairment - - - - (17) (17)
Changes in other comprehensive income (16) (135) - - - (151)
Dividends (124) (436) - (1,260) - (1,820)
Exchange differences (150) (272) - - - (422)
Disposal - - (114) - - (114)
Ending balance ₩ 1,808 ₩ 3,285 ₩ - ₩ 3,583 ₩ 236 ₩ 8,912

AMOREPACIFIC Group, Inc. and SubsidiariesNotes to Consolidated Financial Statements
December 31, 2013 and 2012
36
Summary of financial information of associates as of and for the years ended December 31, 2013
and 2012, follows:
(in millions of Korean won) 2013
Totalassets
Totalliabilities Revenue Net income
Comprehensiveincome
Taiwan AMORE Co., Ltd. ₩ 5,198 ₩ 962 ₩ 7,530 ₩ 520 ₩ 330
AMOREPACIFIC HongKong Co., Limited 40,176 15,607 84,766 9,330 8,755
BBDO Korea Inc. 37,353 25,699 27,335 3,912 3,912
Anhui Pacific Tea Co., Ltd. 316 - - - -
(in millions of Korean won) 2012
Totalassets
Totalliabilities Revenue Net income
Comprehensiveincome
Taiwan AMORE Co., Ltd. ₩ 5,129 ₩ 1,223 ₩ 7,174 ₩ 766 ₩ 636
AMOREPACIFIC HongKong Co., Limited 28,936 13,122 66,524 5,222 4,148
BBDO Korea Inc. 47,429 35,488 30,327 4,156 4,156
Anhui Pacific Tea Co., Ltd. 316 - - - -
13. Property, Plant and Equipment
Property, plant and equipment as of December 31, 2013 and 2012, are as follows:
(in millions of Korean won) 2013 2012
Acquisitioncost
Accumulateddepreciation
Bookvalue
Acquisitioncost
Accumulateddepreciation
Bookvalue
Land \ 1,084,471 \ - \ 1,084,471 \ 1,033,619 \ - \ 1,033,619
Buildings 620,178 (106,726) 513,452 592,022 (100,436) 491,586
Structures 57,480 (18,293) 39,187 56,891 (16,656) 40,235
Machinery 403,177 (181,314) 221,863 355,587 (157,551) 198,036
Vehicles 3,895 (2,661) 1,234 3,741 (2,703) 1,038
Tools 150,521 (127,751) 22,770 138,271 (115,028) 23,243
Fixtures and furniture 667,804 (456,567) 211,237 567,324 (381,575) 185,749
Others 7,741 (2,447) 5,294 7,178 (1,991) 5,187
Construction-in-progress 188,861 - 188,861 123,877 - 123,877
\ 3,184,128 \ (895,759) \ 2,288,369 2,878,510 \ (775,940) \ 2,102,570
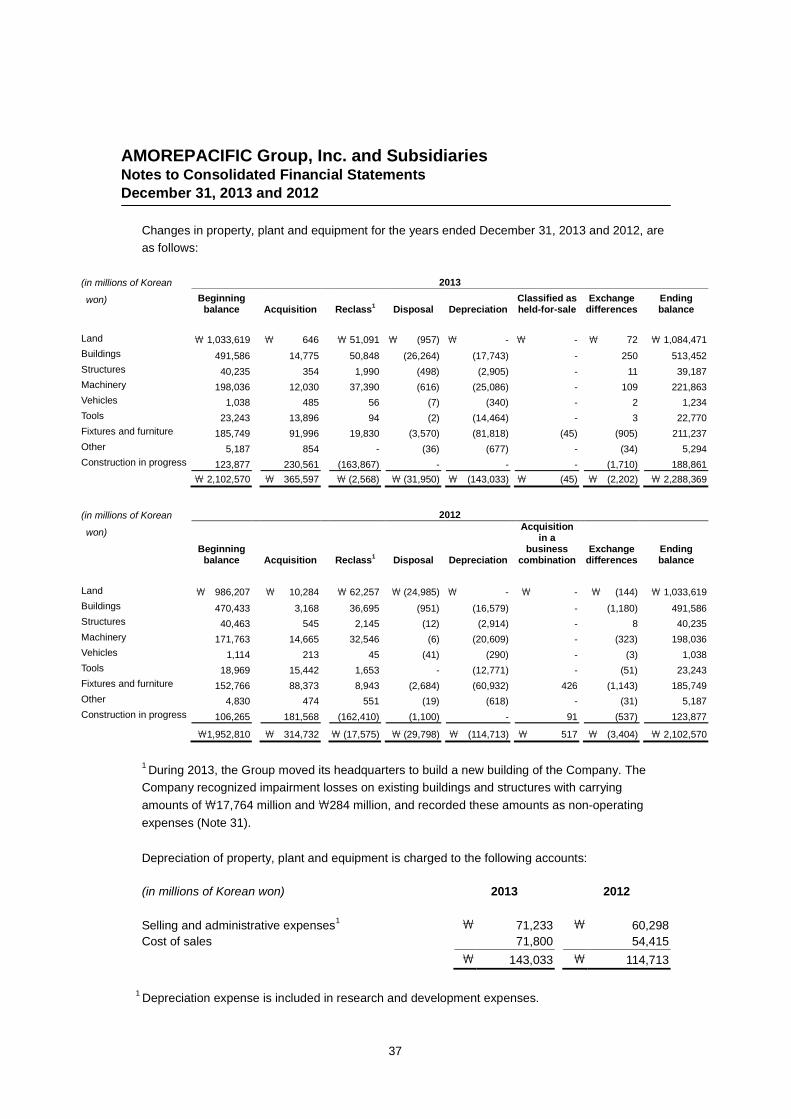
AMOREPACIFIC Group, Inc. and SubsidiariesNotes to Consolidated Financial Statements
December 31, 2013 and 2012
37
Changes in property, plant and equipment for the years ended December 31, 2013 and 2012, are
as follows:
(in millions of Korean
won)
2013
Beginningbalance Acquisition Reclass1 Disposal Depreciation
Classified asheld-for-sale
Exchangedifferences
Endingbalance
Land \ 1,033,619 \ 646 \ 51,091 \ (957) \ - \ - \ 72 \ 1,084,471
Buildings 491,586 14,775 50,848 (26,264) (17,743) - 250 513,452
Structures 40,235 354 1,990 (498) (2,905) - 11 39,187
Machinery 198,036 12,030 37,390 (616) (25,086) - 109 221,863
Vehicles 1,038 485 56 (7) (340) - 2 1,234
Tools 23,243 13,896 94 (2) (14,464) - 3 22,770
Fixtures and furniture 185,749 91,996 19,830 (3,570) (81,818) (45) (905) 211,237
Other 5,187 854 - (36) (677) - (34) 5,294
Construction in progress 123,877 230,561 (163,867) - - - (1,710) 188,861
\ 2,102,570 \ 365,597 \ (2,568) \ (31,950) \ (143,033) \ (45) \ (2,202) \ 2,288,369
(in millions of Korean
won)
2012
Beginningbalance Acquisition Reclass1 Disposal Depreciation
Acquisitionin a
businesscombination
Exchangedifferences
Endingbalance
Land \ 986,207 \ 10,284 \ 62,257 \ (24,985) \ - \ - \ (144) \ 1,033,619
Buildings 470,433 3,168 36,695 (951) (16,579) - (1,180) 491,586
Structures 40,463 545 2,145 (12) (2,914) - 8 40,235
Machinery 171,763 14,665 32,546 (6) (20,609) - (323) 198,036
Vehicles 1,114 213 45 (41) (290) - (3) 1,038
Tools 18,969 15,442 1,653 - (12,771) - (51) 23,243
Fixtures and furniture 152,766 88,373 8,943 (2,684) (60,932) 426 (1,143) 185,749
Other 4,830 474 551 (19) (618) - (31) 5,187
Construction in progress 106,265 181,568 (162,410) (1,100) - 91 (537) 123,877
\1,952,810 \ 314,732 \ (17,575) \ (29,798) \ (114,713) \ 517 \ (3,404) \ 2,102,570
1During 2013, the Group moved its headquarters to build a new building of the Company. The
Company recognized impairment losses on existing buildings and structures with carrying
amounts of ₩17,764 million and ₩284 million, and recorded these amounts as non-operating
expenses (Note 31).
Depreciation of property, plant and equipment is charged to the following accounts:
(in millions of Korean won) 2013 2012
Selling and administrative expenses1 \ 71,233 \ 60,298
Cost of sales 71,800 54,415
\ 143,033 \ 114,713
1Depreciation expense is included in research and development expenses.

AMOREPACIFIC Group, Inc. and SubsidiariesNotes to Consolidated Financial Statements
December 31, 2013 and 2012
38
Details of property, plant and equipment provided as collaterals as of December 31, 2013 and
2012, are as follows:
(in millions ofKorean won)
2013
Carryingamount
Securedamount Related line item
Relatedamount Secured party
Land and buildings \ 54,088 \ 2,842 Deposits received \ 1,968 Wooribank
Land and buildings 319 415 Deposits received 319 Samsung Life Insurance Co., Ltd.
Land and buildings 961 1,249 Deposits received 961 National Pension Service
Land and buildings 56 73 Deposits received 56 Hanwha General Insurance Co., Ltd.
(in millions ofKorean won)
2012
Carryingamount
Securedamount Related line item
Relatedamount Secured party
Land and buildings \ 55,410 \ 2,842 Deposits received \ 1,968 Wooribank
Land and buildings 319 415 Deposits received 319 Samsung Life Insurance
Land and buildings 961 1,249 Deposits received 961 National Pension Service
Land and buildings 56 73 Deposits received 56 Hanwha General Insurance
Land and buildings 459 597 Deposits received 459 AJU CAPITAL CO., LTD
Land and buildings 1,246 1,752 Deposits received 1,246 Wooribank
Details of finance lease as of December 31, 2013 and 2012, are as follows:
One of the subsidiaries, AMOREPACIFIC EUROPE S.A.S leases land and buildings under non-
cancellable finance lease agreements. The lease terms are until the year 2018, and ownership of
the assets will be transferred to AMOREPACIFIC EUROPE S.A.S after the lease terms are
terminated.
Details of property, plant and equipment classified as a finance lease as of December 31, 2013
and 2012, are as follows:
(in millions of Korean won) 2013 2012
Land Buildings Land Buildings
Cost- capitalized finance leases \ 1,777 \ 18,851 \ 2,613 \ 26,051
Accumulated depreciation - (5,712) - (7,625)
Net book value \ 1,777 \ 13,139 \ 2,613 \ 18,426

AMOREPACIFIC Group, Inc. and SubsidiariesNotes to Consolidated Financial Statements
December 31, 2013 and 2012
39
The total of future minimum lease payments as of December 31, 2013 and 2012, are as follows:
(in millions of Korean won) 2013 2012
Total minimum lease payments
No later than 1 year \ 1,803 \ 2,601
1 year to 5 years 7,212 10,093
Later than 5 years - 1,753
\ 9,015 \ 14,447
Unearned finance cost \ (769) \ (1,524)
Net minimum lease payments
No later than 1 year 1,526 2,103
1 year to 5 years 6,720 9,091
Later than 5 years - 1,729
\ 8,246 \ 12,923
The Group leases certain office, warehouse, and computer equipment under non-cancellable
operating lease agreements. The lease terms are between 1 and 5 years. The lease payment
recognized as expense for the year ended December 31, 2013, amount to \112,790 million (2012:
\83,217 million).
The total of future minimum lease payments under non-cancellable operating lease agreements as
of December 31, 2013 and 2012, are as follows:
(in millions of Korean won) 2013 2012
No later than 1 year \ 87,326 \ 76,232
1 year to 5 years 74,678 58,940
\ 162,004 \ 135,172

AMOREPACIFIC Group, Inc. and SubsidiariesNotes to Consolidated Financial Statements
December 31, 2013 and 2012
40
14. Intangible Assets
Changes in intangible assets for the years ended December 31, 2013 and 2012, are as follows:
(in millions of Korean won) 2013
GoodwillIndustrialproperty Software Others Total
Beginning balance ₩ 536,991 ₩ 10,962 ₩ 29,514 ₩ 59,327 ₩ 636,794
Acquisition - 3,976 4,468 15,256 23,700
Reclassification - 18 11,477 (8,927) 2,568
Disposal - - (165) (657) (822)
Amortization - (1,166) (10,536) (577) (12,279)
Loss on impairment - - - (47) (47)
Classified as held-for-sale - (1) - - (1)
Exchange differences 301 69 9 461 840
Ending balance ₩ 537,292 ₩ 13,858 ₩ 34,767 ₩ 64,836 ₩ 650,753
(in millions of Korean won) 2012
GoodwillIndustrialproperty Software Others Total
Beginning balance ₩ 535,660 ₩ 11,080 ₩ 26,776 ₩ 52,399 ₩ 625,915
Acquisition - 1,221 5,891 17,697 24,809
Reclassification - - 6,203 (7,797) (1,594)
Disposal - (223) (1) (1,027) (1,251)
Amortization - (977) (9,282) (370) (10,629)
Loss on impairment - - - (130) (130)
Acquisition in a business combination 4,771 - 6 - 4,777
Exchange differences (3,440) (139) (79) (1,445) (5,103)
Ending balance ₩ 536,991 ₩ 10,962 ₩ 29,514 ₩ 59,327 ₩ 636,794
Amortization of intangible assets is charged to the following accounts:
(in millions of Korean won) 2013 2012
Selling and administrative expenses1 \ 10,744 \ 9,586
Cost of sales 1,535 1,043
\ 12,279 \ 10,629
1Amortization expense is included in research and development expenses.
The Group recognized research and development costs as expenses totaling ₩64,673 million
(2012: ₩63,967 million).

AMOREPACIFIC Group, Inc. and SubsidiariesNotes to Consolidated Financial Statements
December 31, 2013 and 2012
41
14.1 Impairment Tests for Goodwill
Goodwill is monitored by the management at the cash-generating units. The following is a
summary of goodwill allocation for each operating segment:
(in millions of Korean won) 2013 2012
Cosmetics CGU \ 500,319 \ 500,320
Annick Goutal CGU 24,171 23,507
China CGU 4,233 4,179
Vietnam CGU 3,640 3,742
Singapore CGU 3,406 3,581
Thailand CGU 513 559
Indonesia CGU 335 429
Others 675 674
\ 537,292 \ 536,991
The recoverable amounts of all CGUs have been determined based on value-in-use calculations,
and the key assumptions used for value-in-use calculations in 2013 are as follows:
(in percentage, %)Cosmetics
CGUAnnick Goutal
CGUChinaCGU
VietnamCGU
SingaporeEtude House
CGU
Gross margin rate 15.03 6.42 0.70 0.15 2.23
Growth rate1
9.05 8.60 29.8 17.92 6.63
Pre-tax discount rate2
10.46 8.65 12.10 14.99 7.91
1Weighted average revenue growth rate used to extrapolate cash flows for a five-year period is
measured based on the past performance and expectation of market development.
2Pre-tax discount rate applied to pre-tax cash flow projections.
As of December 31, 2013, the recoverable amount of the Annick Goutal operating segment
exceeded its carrying value by\373 million. Nevertheless, there is a possibility that reasonable
changes in key assumptions may offset the excess amount. A reduction in gross margin of 6.31%,
a fall in growth rate to 7.37% and a rise in discount rate to 8.71% would offset the excess amount.

AMOREPACIFIC Group, Inc. and SubsidiariesNotes to Consolidated Financial Statements
December 31, 2013 and 2012
42
15. Investment Property
Details of investment property as of December 31, 2013 and 2012, are as follows:
(in millions of 2013 2012Korean won)
Acquisitioncost
Accumulateddepreciation
Bookvalue
Acquisitioncost
Accumulateddepreciation
Bookvalue
Land \ 185,551 \ - \ 185,551 \ 185,546 \ - \ 185,546
Buildings 39,259 (24,542) 14,717 39,259 (23,099) 16,160
Structures 5,082 (3,718) 1,364 5,082 (3,556) 1,526
\ 229,892 \ (28,260) \ 201,632 \ 229,887 \ (26,655) \ 203,232
Changes in investment property for the years ended December 31, 2013 and 2012, are as follows:
(in millions of Korean
won)
2013 2012
Land Buildings Structures Total Land Buildings Structures Total
Beginning balance \ 185,546 \ 16,160 \ 1,526 \203,232 \185,546 \ - \ - \185,546
Acquisition 5 - - 5 - - - -Reclassification - - - - - 17,497 1,678 19,175Depreciation - (1,443) (162) (1,605) - (1,337) (152) (1,489)Disposal - - - - - - - -
Ending balance \185,551 \ 14,717 \ 1,364 \201,632 \185,546 \ 16,160 \ 1,526 \203,232
Fair value of investment property as of December 31, 2013, is \223,798 million (2012: \220,230
million).
No income related to investment property was recognized for the years ended December 31, 2013
and 2012.
16. Other Assets
Other assets as of December 31, 2013 and 2012, are as follows:
(in millions of Korean won) 2013 2012
Current Non-current Current Non-current
Accrued revenues \ 4,269 \ - \ 5,581 \ -
Advance payments 11,266 - 20,320 -
Prepaid expenses 23,437 22 18,843 18
Others 540 11 3,645 -
\ 39,512 \ 33 \ 48,389 \ 18
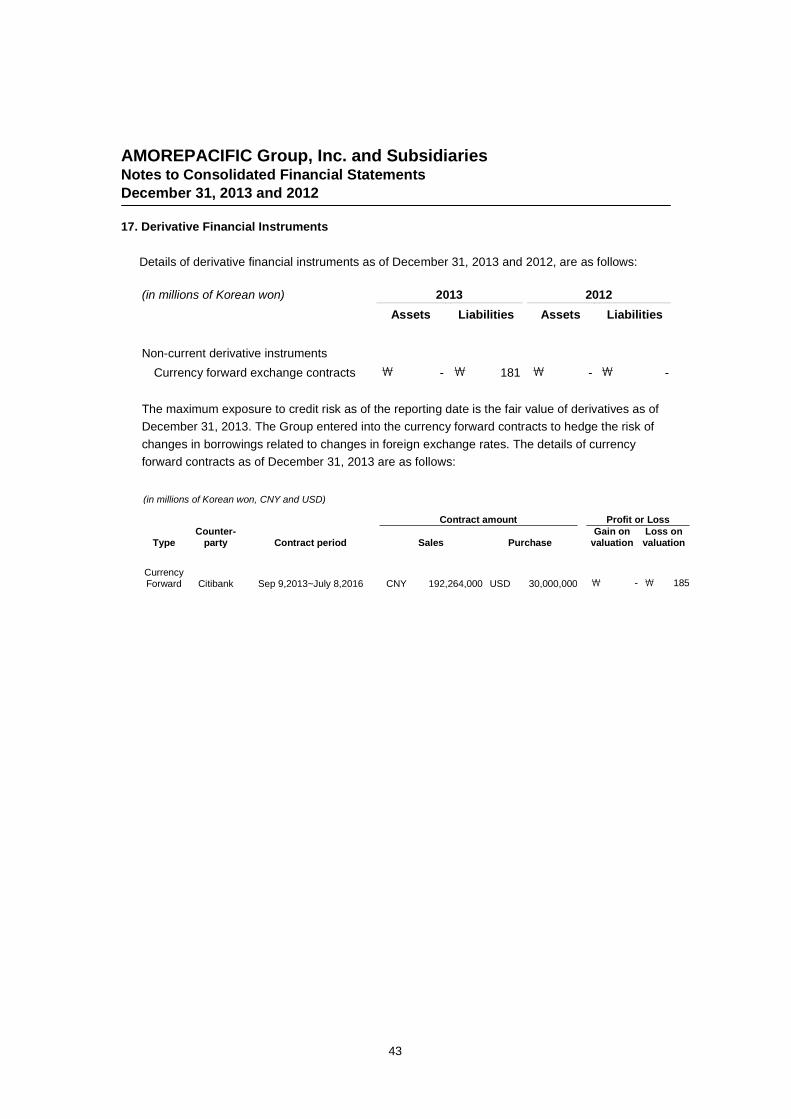
AMOREPACIFIC Group, Inc. and SubsidiariesNotes to Consolidated Financial Statements
December 31, 2013 and 2012
43
17. Derivative Financial Instruments
Details of derivative financial instruments as of December 31, 2013 and 2012, are as follows:
(in millions of Korean won) 2013 2012
Assets Liabilities Assets Liabilities
Non-current derivative instruments
Currency forward exchange contracts \ - \ 181 \ - \ -
The maximum exposure to credit risk as of the reporting date is the fair value of derivatives as of
December 31, 2013. The Group entered into the currency forward contracts to hedge the risk of
changes in borrowings related to changes in foreign exchange rates. The details of currency
forward contracts as of December 31, 2013 are as follows:
(in millions of Korean won, CNY and USD)
Contract amount Profit or Loss
TypeCounter-
party Contract period Sales PurchaseGain on
valuationLoss onvaluation
CurrencyForward Citibank Sep 9,2013~July 8,2016 CNY 192,264,000 USD 30,000,000 \ - \ 185
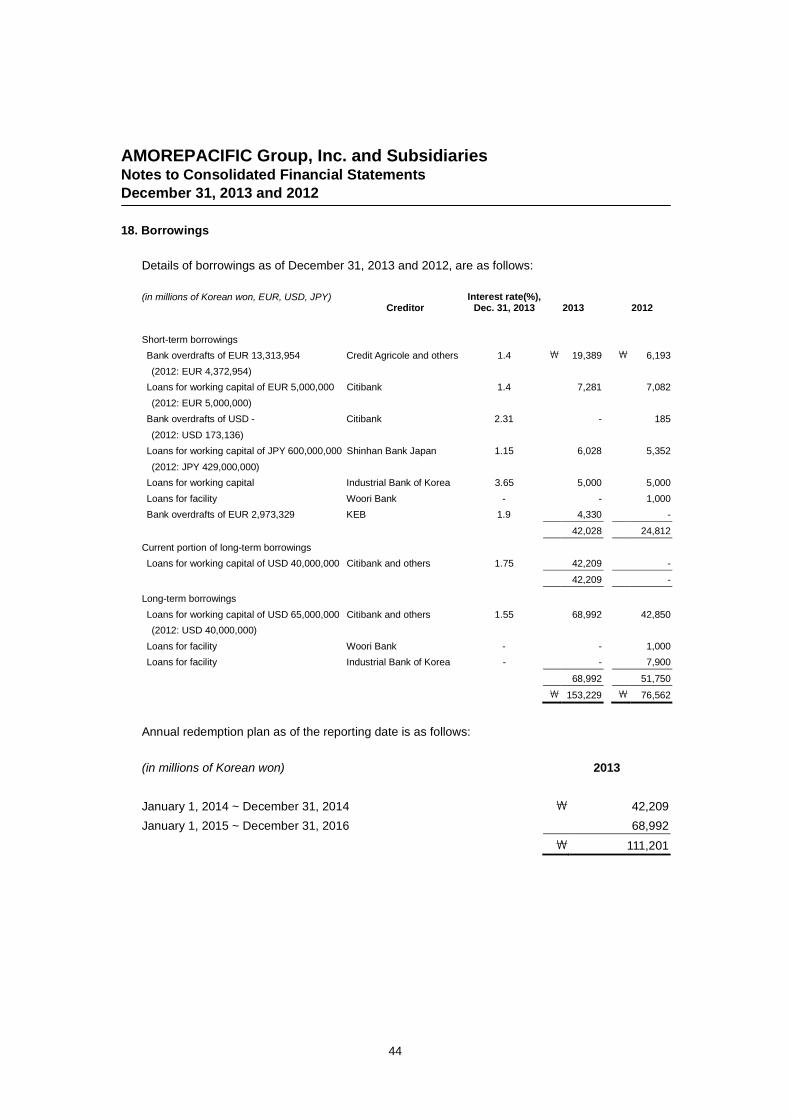
AMOREPACIFIC Group, Inc. and SubsidiariesNotes to Consolidated Financial Statements
December 31, 2013 and 2012
44
18. Borrowings
Details of borrowings as of December 31, 2013 and 2012, are as follows:
(in millions of Korean won, EUR, USD, JPY)Creditor
Interest rate(%),Dec. 31, 2013 2013 2012
Short-term borrowings
Bank overdrafts of EUR 13,313,954 Credit Agricole and others 1.4 \ 19,389 \ 6,193
(2012: EUR 4,372,954)
Loans for working capital of EUR 5,000,000 Citibank 1.4 7,281 7,082
(2012: EUR 5,000,000)
Bank overdrafts of USD - Citibank 2.31 - 185
(2012: USD 173,136)
Loans for working capital of JPY 600,000,000 Shinhan Bank Japan 1.15 6,028 5,352
(2012: JPY 429,000,000)
Loans for working capital Industrial Bank of Korea 3.65 5,000 5,000
Loans for facility Woori Bank - - 1,000
Bank overdrafts of EUR 2,973,329 KEB 1.9 4,330 -
42,028 24,812
Current portion of long-term borrowings
Loans for working capital of USD 40,000,000 Citibank and others 1.75 42,209 -
42,209 -
Long-term borrowings
Loans for working capital of USD 65,000,000 Citibank and others 1.55 68,992 42,850
(2012: USD 40,000,000)
Loans for facility Woori Bank - - 1,000
Loans for facility Industrial Bank of Korea - - 7,900
68,992 51,750
\ 153,229 \ 76,562
Annual redemption plan as of the reporting date is as follows:
(in millions of Korean won) 2013
January 1, 2014 ~ December 31, 2014 \ 42,209
January 1, 2015 ~ December 31, 2016 68,992
\ 111,201

AMOREPACIFIC Group, Inc. and SubsidiariesNotes to Consolidated Financial Statements
December 31, 2013 and 2012
45
19. Provisions for Liabilities and Charges
Changes of provisions for liabilities and charges as of December 31, 2013 and 2012, are as
follows:
(in millions of Korean
won)
2013 2012
Provisionfor sales
returnProfit-sharingand bonuses Restructuring Total
Provisionfor sales
returnProfit-sharingand bonuses Restructuring Total
Beginning balance \ 7,503 \ 80 \ 4,151 \ 11,734 \ 10,866 \ 138 \ - \ 11,004
Increase 3,040 1,791 - 4,831 2,591 43,076 4,245 49,912
Decrease (3,124) (1,772) (4,260) (9,156) (5,925) (43,121) - (49,046)
Exchange differences (3) 3 109 109 (29) (13) (94) (136)
Ending balance \ 7,416 \ 102 \ - \ 7,518 \ 7,503 \ 80 \ 4,151 \ 11,734
20. Other Liabilities
Other liabilities as of December 31, 2013 and 2012, are as follows:
(in millions of Korean won) 2013 2012
Current Non-current Current Non-current
Withholdings \ 12,817 \ - \ 11,155 \ -
Value added tax withheld 26,941 - 25,328 -
Advances from customers 24,296 3,002 20,479 3,002
Deposits received - 8,935 - 10,363
Accrued expenses 18,751 3,138 8,699 2,705
Finance lease liabilities - 8,246 - 12,923
Dividends payable 273 - 253 -
Others 1,407 926 1,525 640
\ 84,485 \ 24,247 \ 67,439 \ 29,633
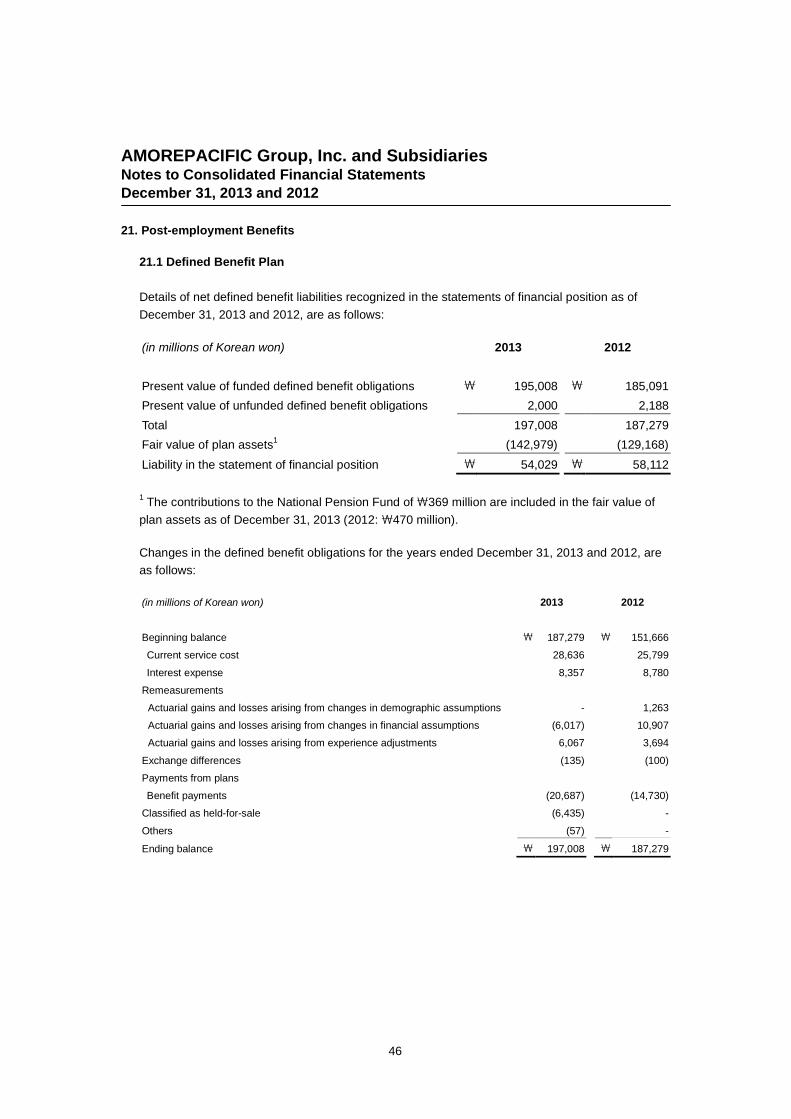
AMOREPACIFIC Group, Inc. and SubsidiariesNotes to Consolidated Financial Statements
December 31, 2013 and 2012
46
21. Post-employment Benefits
21.1 Defined Benefit Plan
Details of net defined benefit liabilities recognized in the statements of financial position as of
December 31, 2013 and 2012, are as follows:
(in millions of Korean won) 2013 2012
Present value of funded defined benefit obligations \ 195,008 \ 185,091
Present value of unfunded defined benefit obligations 2,000 2,188
Total 197,008 187,279
Fair value of plan assets1
(142,979) (129,168)
Liability in the statement of financial position \ 54,029 \ 58,112
1The contributions to the National Pension Fund of \369 million are included in the fair value of
plan assets as of December 31, 2013 (2012: \470 million).
Changes in the defined benefit obligations for the years ended December 31, 2013 and 2012, are
as follows:
(in millions of Korean won) 2013 2012
Beginning balance \ 187,279 \ 151,666
Current service cost 28,636 25,799
Interest expense 8,357 8,780
Remeasurements
Actuarial gains and losses arising from changes in demographic assumptions - 1,263
Actuarial gains and losses arising from changes in financial assumptions (6,017) 10,907
Actuarial gains and losses arising from experience adjustments 6,067 3,694
Exchange differences (135) (100)
Payments from plans
Benefit payments (20,687) (14,730)
Classified as held-for-sale (6,435) -
Others (57) -
Ending balance \ 197,008 \ 187,279

AMOREPACIFIC Group, Inc. and SubsidiariesNotes to Consolidated Financial Statements
December 31, 2013 and 2012
47
Changes in the fair value of plan assets for the years ended December 31, 2013 and 2012, are as
follows:
(in millions of Korean won) 2013 2012
Beginning balance \ 129,168 \ 102,107
Interest income 5,870 6,141
Remeasurements
Return on plan assets (1,716) (1,738)
Contributions
Employees 31,450 33,691
Payments from plans
Benefit payments (17,353) (11,033)
Classified as held-for-sale (4,144) -
Others (296) -
Ending balance \ 142,979 \ 129,168
The principal actuarial assumptions as of December 31, 2013 and 2012, are as follows:
(in percentage, %) 2013 2012
Discount rate 3.15 ~ 5.00 2.75 ~ 4.75
Salary growth rate 3.00 ~ 6.42 3.42 ~ 6.74
The sensitivity of the defined benefit obligations as of December 31, 2013, to changes in the
weighted principal assumptions is:
(in percentage, %) Effect on defined benefit obligation
Changes in principalassumption
Increase in principalassumption
Decrease in principalassumption
Discount rate 1.00% 7.22% decrease 7.51% increase
Salary growth rate 1.00% 8.46% increase 7.49% decrease
The defined benefit liabilities are exposed to a significant risk from changes in the corporate bond
yields used as the discount rate.
The above sensitivity analyses are based on a change in an assumption while holding all other
assumptions constant. In practice, this is unlikely to occur, and changes in some of the
assumptions may be correlated. The sensitivity of the defined benefit obligation to changes in
principal actuarial assumptions is calculated using the projected unit credit method, the same
method applied when calculating the defined benefit obligations recognized on the statement of
financial position.
The methods and types of assumptions used in preparing the sensitivity analysis did not change
compared to the previous period.

AMOREPACIFIC Group, Inc. and SubsidiariesNotes to Consolidated Financial Statements
December 31, 2013 and 2012
48
Plan assets as of December 31, 2013 and 2012, consist of as follows:
(in millions of Korean won) 2013 2012
Unquoted price Composition Unquoted price Composition
Deposits \ 142,609 99.70% \ 128,698 99.60%
Deposits to the National Pension Service 370 0.30% 470 0.40%
\ 142,979 100.00% \ 129,168 100.00%
The Group reviews the funding level on an annual basis and has a policy to contribute in the fund.
Expected contributions to post-employment benefit plans for the year ended December 31, 2014
are \28,148 million.
Expected maturity analysis of undiscounted pension benefits as of December 31, 2013, is as
follows:
(in millions of Korean won)Less than 1
yearBetween 1
and 2 yearsBetween 2
and 5 yearsOver 5years Total
Pension benefits \ 16,684 \ 18,917 \ 63,238 \ 139,651 \ 238,490
The weighted average maturity of the defined benefit obligations is 8.05 years
21. 2 Defined Contribution Plan
Recognized expense related to the defined contribution plan for the year ended December 31,
2013, is\73 million (\84 million).
22. Other Components of Equity
Other components of equity as December 31, 2013 and 2012, are as follows:
(in millions of Korean won) 2013 2012
Treasury shares1 \ (139,647) \ (133,330)
Other capital adjustments (1,183) (1,177)
\ (140,830) \ (134,507)
1Represents 554,964 common shares and 6,327 preferred shares of treasury shares. The
Company intends to dispose of the remaining treasury shares depending on the market
conditions within the range of not incurring or minimizing loss on disposal of treasury shares as
possible.

AMOREPACIFIC Group, Inc. and SubsidiariesNotes to Consolidated Financial Statements
December 31, 2013 and 2012
49
23. Accumulated Other Comprehensive Income
Accumulated other comprehensive income as of December 31, 2013 and 2012, consists of the
following:
(in millions of Korean won) 2013 2012
Gain(Loss) on valuation of available-for-sale financial assets \ (2,990) \ 1,199
Currency translation differences (4,671) (4,115)
Share of other comprehensive income of associates 338 437
\ (7,323) \ (2,479)
Changes in accumulated other comprehensive income for the years ended December 31, 2013
and 2012, are as follows:
(in millions of Korean won) 2013
Beginningbalance
Increase(Decrease)
Reclassificationto profit or loss
Transfer tonon-controlling
interestEndingbalance
Gain(Loss) on valuation of
available-for-sale financial assets ₩ 1,199 ₩ (676) ₩ (3,207) ₩ (306) ₩ (2,990)
Currency translation differences (4,115) (1,978) - 1,422 (4,671)
Share of other comprehensive
income of associates 437 (286) - 187 338
₩ (2,479) ₩ (2,940) ₩ (3,207) ₩ 1,303 ₩ (7,323)
(in millions of Korean won) 2012
Beginningbalance
Increase(Decrease)
Reclassificationto profit or loss
Transfer tonon-controlling
interestEndingbalance
Gain(Loss) on valuation of
available-for-sale financial assets ₩ 93 ₩ 3,000 ₩ (2,215) ₩ 321 ₩ 1,199
Currency translation differences (1,076) (8,750) - 5,711 (4,115)
Share of other comprehensive
income of associates 2,776 (2,447) - 108 437
₩ 1,793 ₩ (8,197) ₩ (2,215) ₩ 6,140 ₩ (2,479)
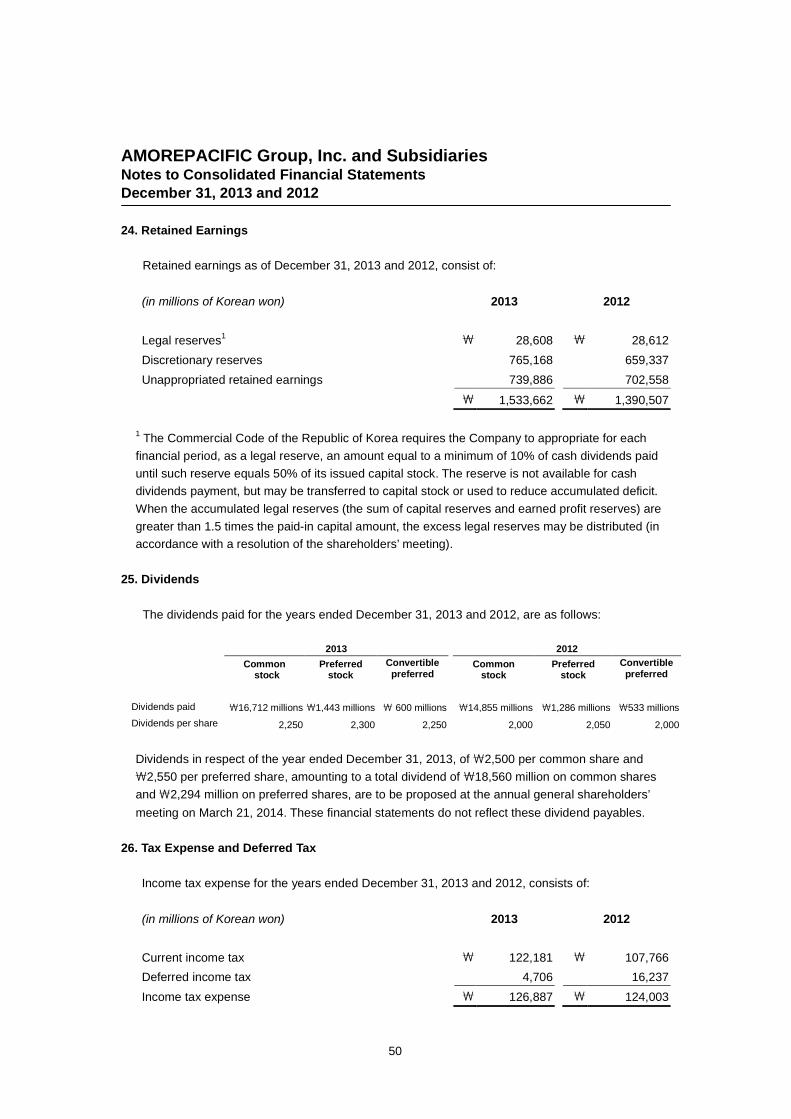
AMOREPACIFIC Group, Inc. and SubsidiariesNotes to Consolidated Financial Statements
December 31, 2013 and 2012
50
24. Retained Earnings
Retained earnings as of December 31, 2013 and 2012, consist of:
(in millions of Korean won) 2013 2012
Legal reserves1 \ 28,608 \ 28,612
Discretionary reserves 765,168 659,337
Unappropriated retained earnings 739,886 702,558
\ 1,533,662 \ 1,390,507
1The Commercial Code of the Republic of Korea requires the Company to appropriate for each
financial period, as a legal reserve, an amount equal to a minimum of 10% of cash dividends paid
until such reserve equals 50% of its issued capital stock. The reserve is not available for cash
dividends payment, but may be transferred to capital stock or used to reduce accumulated deficit.
When the accumulated legal reserves (the sum of capital reserves and earned profit reserves) are
greater than 1.5 times the paid-in capital amount, the excess legal reserves may be distributed (in
accordance with a resolution of the shareholders’ meeting).
25. Dividends
The dividends paid for the years ended December 31, 2013 and 2012, are as follows:
2013 2012
Commonstock
Preferredstock
Convertiblepreferred
stock
Commonstock
Preferredstock
Convertiblepreferred
stock
Dividends paid \16,712 millions \1,443 millions \ 600 millions \14,855 millions \1,286 millions \533 millions
Dividends per share 2,250 2,300 2,250 2,000 2,050 2,000
Dividends in respect of the year ended December 31, 2013, of \2,500 per common share and
\2,550 per preferred share, amounting to a total dividend of \18,560 million on common shares
and\2,294 million on preferred shares, are to be proposed at the annual general shareholders’
meeting on March 21, 2014. These financial statements do not reflect these dividend payables.
26. Tax Expense and Deferred Tax
Income tax expense for the years ended December 31, 2013 and 2012, consists of:
(in millions of Korean won) 2013 2012
Current income tax \ 122,181 \ 107,766
Deferred income tax 4,706 16,237
Income tax expense \ 126,887 \ 124,003

AMOREPACIFIC Group, Inc. and SubsidiariesNotes to Consolidated Financial Statements
December 31, 2013 and 2012
51
The tax on the Group’s profit before tax differs from the theoretical amount that would arise using
the weighted average tax rate applicable to profits of the consolidated entities as follows:
(in millions of Korean won) 2013 2012
Profit before tax \ 481,892 \ 470,711
Tax calculated at domestic tax ratesapplicable to profits in the respective countries \
122,698\
116,910
Tax effects of:
Income not subject to tax (9,278) (9,987)
Expenses not deductible for tax purposes 4,738 7,018
Change in deferred tax based on future realizability 4,883 3,695
Tax credits (3,684) (5,698)
Effect of changes in tax rate (377) 38
Adjustment in respect of prior years 3,469 13,274
Others 4,438 (1,247)
Income tax expense \ 126,887 \ 124,003
The weighted average applicable tax rate of the Group is 26.33% (2012: 26.34%).
Income tax effects related to components of other comprehensive income for the years ended
December 31, 2013 and 2012, are as follows:
(in millions of Korean won) 2013 2012
Before tax Tax effect After tax Before tax Tax effect After tax
Gain(Loss) on valuation of available-for-sale assets \ (4,982) \ 1,099 \ (3,883) \ 904 \ (119) \ 785
Remeasurements (Actuarial gain or loss) (1,767) 437 (1,330) (17,602) 3,999 (13,603)
Share of other comprehensive income of associates (286) - (286) (2,871) 424 (2,447)
Currency translation differences (1,978) - (1,978) (8,750) - (8,750)
\ (9,013) \ 1,536 \ (7,477) \ (28,319) \ 4,304 \ (24,015)
The analysis of deferred tax assets and liabilities as of December 31, 2013 and 2012, is as follows:
(in millions of Korean won) 2013 2012
Deferred tax assets
Deferred tax asset to be recovered after more than 12 months \ 86,214 \ 79,399
Deferred tax asset to be recovered within 12 months 12,318 13,336
98,532 92,735
Deferred tax liabilities
Deferred tax liability to be recovered after more than 12 months (272,844) (263,981)
Deferred tax liability to be recovered within 12 months (3,565) (4,204)
(276,409) (268,185)
Deferred tax assets (liabilities), net \ (177,877) \ (175,450)

AMOREPACIFIC Group, Inc. and SubsidiariesNotes to Consolidated Financial Statements
December 31, 2013 and 2012
52
Changes in deferred tax assets and liabilities for the years ended December 31, 2013 and 2012,
without taking into consideration the offsetting of balances within the same tax jurisdiction, are as
follows:
(in millions of Korean won) 2013
Beginningbalance
Profit orloss
Othercomprehensive
income
Effect ofchanges in
tax rateExchange
differencesEndingbalance
Deferred tax assets
Allowance for doubtful accounts \ 157 \ (43) \ - \ - \ - \ 114
Selling and administrative expenses 1,999 (441) - - - 1,558
Inventories 1,209 608 - - - 1,817
Other current liabilities 1,083 (1,083) - - - -
Deferred revenue 18,148 (2,497) - (106) 17 15,562
Post-employment benefit obligation 31,981 5,706 395 (162) 6 37,926
Property, plant and equipment 4,767 306 - (49) 6 5,030
Intangible assets 178 1 - - - 179
Government grants 772 182 - (43) - 911
Provisions for liabilities 1,739 30 - (37) 4 1,736
Available-for-sale financial assets 841 - 185 - - 1,026
Investment in subsidiaries 3,353 338 1 (143) - 3,549
Accrued expenses 2,150 2,475 - - (28) 4,597
Tax loss carryforwards 22,813 162 - - 644 23,619
Other receivables 827 (210) - (56) - 561
Tax credits 40 (40) - - - -
Others 680 (325) - (8) - 347
92,737 5,169 581 (604) 649 98,532
Deferred tax liabilities
Accrued revenue (1,248) 267 - 10 - (971)
Reserve for technology development (58,937) (2,942) - (89) - (61,968)
Selling and administrative expenses (2,728) 431 - - - (2,297)
Plan assets (27,967) (6,553) 42 169 - (34,309)
Advanced depreciation provision (14,442) - - - - (14,442)
Available-for-sale financial assets (794) (1) 913 - - 118
Property, plant and equipment (114,289) (169) - 82 - (114,376)
Intangible assests (4,319) (172) - - 94 (4,397)
Other receivables (839) 198 - 54 - (587)
Investment in subsidiaries (16,816) (3,138) - - - (19,954)
Treasury shares (25,577) 2,650 - - - (22,927)
Other assets (2) 1 - - - (1)
Others (229) (71) - 2 - (298)
(268,187) (9,499) 955 228 94 (276,409)
\ (175,450) \ (4,330) \ 1,536 \ (376) \ 743 \ (177,877)

AMOREPACIFIC Group, Inc. and SubsidiariesNotes to Consolidated Financial Statements
December 31, 2013 and 2012
53
(in millions of Korean won) 2012
Beginningbalance
Profit orloss
Othercomprehensive
income
Effect ofchanges in
tax rateExchange
differencesEndingbalance
Deferred tax assets
Allowance for doubtful accounts \ 548 \ (391) \ - \ - \ - \ 157
Loss on foreign currency translation 1 (1) - - - -
Selling and administrative expenses 241 1,758 - - - 1,999
Inventories 1,895 (651) - - (35) 1,209
Other current liabilities 1,562 (479) - - - 1,083
Deferred revenue 18,873 (617) - - (108) 18,148
Post-employment benefit obligation 22,805 5,518 3,999 (331) (10) 31,981
Property, plant and equipment 8,580 (3,696) - (46) (71) 4,767
Intangible assets 503 (325) - - - 178
Government grants 826 58 - (112) - 772
Provisions for liabilities 2,617 (869) - - (9) 1,739
Available-for-sale financial assets 849 (31) 23 - - 841
Investment in subsidiaries 2,310 1,277 (91) (143) - 3,353
Accrued expenses 2,315 (31) - - (134) 2,150
Tax loss carryforwards 19,265 4,654 - - (1,106) 22,813
Other receivables 557 270 - - - 827
Tax credits - 40 - - - 40
Others 712 (32) - - - 680
84,459 6,452 3,931 (632) (1,473) 92,737
Deferred tax liabilities
Accrued revenue (1,001) (247) - - - (1,248)
Reserve for technology development (40,924) (18,013) - - - (58,937)
Selling and administrative expenses (1,229) (1,499) - - - (2,728)
Plan assets (21,748) (6,475) - 256 - (27,967)
Advanced depreciation provision (14,445) 3 - - - (14,442)
Available-for-sale financial assets (652) - (142) - - (794)
Property, plant and equipment (121,517) 6,889 - 339 - (114,289)
Intangible assests (5,148) 191 - - 638 (4,319)
Other receivables (680) (159) - - - (839)
Investment in subsidiaries (14,141) (3,190) 515 - - (16,816)
Treasury shares (25,577) - - - - (25,577)
Other assets - (2) - - - (2)
Gain on foreign currency translation (4) 4 - - - -
Others (146) (83) - - - (229)
(247,212) (22,581) 373 595 638 (268,187)
\ (162,753) \ (16,129) \ 4,304 \ (37) \ (835) \ (175,450)
Deferred income tax assets are recognized for tax loss carryforwards to the extent that the
realization of the related tax benefit through future taxable profits is probable. The Group did not
recognize deferred income tax assets of \11,940 million (2012: \13,879 million) in respect of
losses amounting to \35,285 million (2012: \41,640 million) that can be carried forward against
future taxable income. There is no limit to expiration of tax loss carryforwards.

AMOREPACIFIC Group, Inc. and SubsidiariesNotes to Consolidated Financial Statements
December 31, 2013 and 2012
54
The temporary differences from the subsidiaries whose disposal is not in the foreseeable future
were not recognized because of the uncertainty in realizability of the deferred tax assets, and the
amount as of December 31, 2013 and 2012, are as follows:
(in millions of Korean won) 2013 2012
Taxable temporary differences \ (253,256) \ (255,455)
Deductible temporary differences 32,396 36,006
\ (220,860) \ (219,449)
27. Revenue
Revenue for the years ended December 31, 2013 and 2012, consist of the following:
(in millions of Korean won) 2013 2012
Sales of goods
Sales of finished goods \ 2,482,427 \ 2,314,020
Sales of merchandise 1,396,258 1,090,844
3,878,685 3,404,864
Rendering of services 11,045 21,274
Others
Rental income 2,621 2,971
Royalty income 1,954 1,324
Others 1,086 1,300
5,661 5,595
\ 3,895,391 \ 3,431,733

AMOREPACIFIC Group, Inc. and SubsidiariesNotes to Consolidated Financial Statements
December 31, 2013 and 2012
55
28. Expenses by Nature
Expenses by nature for the years ended December 31, 2013 and 2012, are as follows:
(in millions of Korean won) 2013 2012
Changes in inventories \ (18,319) \ (47,646)
Purchase of raw materials and merchandise 1,044,913 865,780
Employee benefit expense 526,547 485,692
Depreciation and amortization 155,312 125,342
Advertising expense 465,819 467,190
Research and development expenses 64,673 64,396
Service fees 353,868 305,456
Distribution commission 525,107 437,525
Other expenses 307,720 277,583
Total1 \ 3,425,640 \ 2,981,318
1Sum of cost of sales, and selling and administrative expenses in the statements of
comprehensive income.
29. Selling and Administrative Expenses
Selling and administrative expenses for the years ended December 31, 2013 and 2012, are as
follows:
(in millions of Korean won) 2013 2012
Salaries and post-employment benefits \ 387,461 \ 351,963
Employee benefits 58,640 52,915
Advertising expense 465,819 472,794
Depreciation 81,978 63,967
Service fees 303,650 268,283
Distribution commission 525,107 427,979
Freight expense 84,925 71,092
Taxes and dues 37,905 30,560
Research and development 64,673 63,967
Others 216,021 163,904
\ 2,226,179 \ 1,967,424

AMOREPACIFIC Group, Inc. and SubsidiariesNotes to Consolidated Financial Statements
December 31, 2013 and 2012
56
30. Financial Income and Costs
Financial income and costs for the years ended December 31, 2013 and 2012, are as follows:
(in millions of Korean won) 2013 2012
Finance income
Interest income on loans and receivables \ 25,889 \ 29,351
Interest income on available-for-sale financial assets 85 95
\ 25,974 \ 29,446
(in millions of Korean won) 2013 2012
Finance costs
Interest expense on financial liabilities carried at amortized cost \ (3,140) \ (2,298)
Loss on valuation of financial liabilities at fair value through profit or loss (185) -
\ (3,325) \ (2,298)
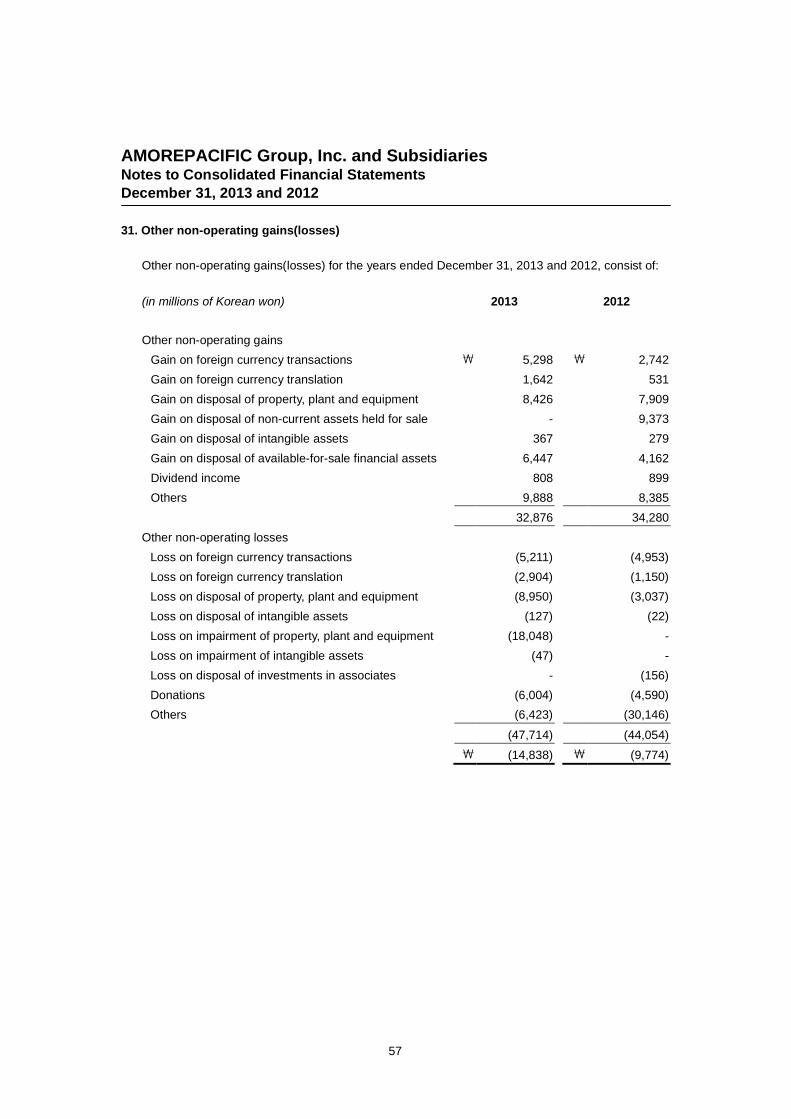
AMOREPACIFIC Group, Inc. and SubsidiariesNotes to Consolidated Financial Statements
December 31, 2013 and 2012
57
31. Other non-operating gains(losses)
Other non-operating gains(losses) for the years ended December 31, 2013 and 2012, consist of:
(in millions of Korean won) 2013 2012
Other non-operating gains
Gain on foreign currency transactions \ 5,298 \ 2,742
Gain on foreign currency translation 1,642 531
Gain on disposal of property, plant and equipment 8,426 7,909
Gain on disposal of non-current assets held for sale - 9,373
Gain on disposal of intangible assets 367 279
Gain on disposal of available-for-sale financial assets 6,447 4,162
Dividend income 808 899
Others 9,888 8,385
32,876 34,280
Other non-operating losses
Loss on foreign currency transactions (5,211) (4,953)
Loss on foreign currency translation (2,904) (1,150)
Loss on disposal of property, plant and equipment (8,950) (3,037)
Loss on disposal of intangible assets (127) (22)
Loss on impairment of property, plant and equipment (18,048) -
Loss on impairment of intangible assets (47) -
Loss on disposal of investments in associates - (156)
Donations (6,004) (4,590)
Others (6,423) (30,146)
(47,714) (44,054)
\ (14,838) \ (9,774)

AMOREPACIFIC Group, Inc. and SubsidiariesNotes to Consolidated Financial Statements
December 31, 2013 and 2012
58
32. Earnings per Share
Basic earnings per share is calculated by dividing the profit attributable to equity holders of the
Company by the weighted average number of ordinary shares in issue during the year, excluding
treasury shares.
Basic earnings per common share for the years ended December 31, 2013 and 2012, is as
follows:
2013 2012
Profit attributable to equity holders of the Company \ 163,011 million \ 154,828 million
Profit attributable to the ordinary equity holders 149,487 million 142,187 million
Weighted average number of ordinary shares in issue (unit: shares) 7,436,397 7,427,541
Basic earnings per share to the ordinary equity holders 20,102 19,143
Basic earnings per preferred share for the years ended December 31, 2013 and 2012, is as
follows:
2013 2012
Profit attributable to equity holders of the Company \ 163,011 million \ 154,828 million
Profit attributable to the preferred equity holders 12,857 million 12,041 million
Weighted average number of preferred shares in issue (unit: shares) 637,856 627,352
Basic earnings per share to the preferred equity holders 20,157 19,193
Net income attributable to common share and preferred share for the years ended December 31,
2013 and 2012, is as follows:
2013 2012
Profit attributable to equity holders of the Company (A) \ 163,011 \ 154,828
Dividends of convertible preferred shares (B) 667 600
Adjusted profit attributable to equity holders of the Company (C=A+B) \ 162,344 \ 154,228
Profit attributable to the ordinary equity holders \ 149,487 \ 142,187
Profit attributable to the preferred equity holders 12,857 12,041

AMOREPACIFIC Group, Inc. and SubsidiariesNotes to Consolidated Financial Statements
December 31, 2013 and 2012
59
Diluted earnings per preferred share for the years ended December 31, 2013 and 2012, is as
follows:
2013 2012
Diluted profit attributable to the ordinary equity holders \ 150,513 million \ 143,127 million
Weighted average number of ordinary shares in issue (unit: shares) 7,703,117 7,694,261
Diluted earnings per share to the ordinary equity holders 19,539 18,602
1Includes 266,720 shares of convertible preference shares.
Diluted earnings per preferred share for the years ended December 31, 2013 and 2012, is as
follows:
2013 2012
Diluted profit attributable to the preferred equity holders \ 12,498 million \ 11,701 million
Weighted average number of preferred shares in issue (unit: shares) 637,856 627,352
Diluted earnings per share for to the preferred equity holders 19,594 18,652
Diluted net income attributable to common shares and preferred shares for the years ended December
31, 2013 and 2012, is as follows:
2013 2012
Adjusted profit attributable to equity holders of the Company (A) \ 162,344 \ 154,228
Dividends of convertible preferred shares (B) 667 600
Adjusted diluted profit attributable to equity holders of the Company (C=A+B) \ 163,011 \ 154,828
Diluted profit attributable to the ordinary equity holders \ 150,513 \ 143,127
Diluted profit attributable to the preferred equity holders 12,498 11,701

AMOREPACIFIC Group, Inc. and SubsidiariesNotes to Consolidated Financial Statements
December 31, 2013 and 2012
60
33. Cash Generated from Operations
(a) Cash generated from operations
Details of cash generated from operations for the years ended December 31, 2013 and 2012, are
as follows:
(in millions of Korean won) 2013 2012
Net income \ 355,005 \ 346,709
Adjustments for
Interest income, net (22,649) (25,449)
Loss on foreign currency translation, net 1,314 1,184
Depreciation and amortization 156,917 126,831
Loss on impairment 18,096 -
Loss(gain) on disposal of property, plant and equipment and intangible assets 266 (4,999)
Gain on disposal of non-current assets held-for-sale - (9,373)
Income tax expense 126,887 124,003
Share of profits from associates (4,330) (2,921)
Gain on disposal of available-for-sale financial assets (6,447) (4,162)
Post-employment benefits 31,123 28,438
Others 3,623 636
Changes in working capital
Increase in trade receivables (42,319) (9,272)
Decrease(Increase) in other receivables (377) 7,398
Increase in inventories (10,891) (49,261)
Decrease(increase) in other assets 3,708 (15,084)
Decrease in trade payables (650) (6,739)
Increase(Decrease) in other payables 41,395 (31,344)
Increase(Decrease) in provisions (3,415) 730
Increase(Decrease) in other liabilities 10,770 (10,373)
Payment of post-employment benefits (20,687) (14,730)
Increase in plan assets, net (14,097) (22,658)
Cash generated from operations \ 623,242 \ 429,564

AMOREPACIFIC Group, Inc. and SubsidiariesNotes to Consolidated Financial Statements
December 31, 2013 and 2012
61
(b) Non-cash transactions
Significant transactions not affecting cash flows for the years ended December 31, 2013 and 2012,
are as follows:
(in millions of Korean won) 2013 2012
Reclassification of construction in-progress to property, plant and equipment ₩ 172,629 ₩ 164,009
Reclassification of land to investment property - 19,175
Offset of non-current assets held-for-sale and long-term advances from customers - 16,876
Reclassification of non-current assets held-for-sale to available-for-sale financial assets - 6,080
Change in other payables related to the acquisition of property, plant and equipment 19,792 9,642
Reclassification of current portion of long-term borrowings 43,788 1,000
34. Commitments and Contingencies
Important contracts entered into with financial institutions as of the reporting dates are as follows:
AMOREPACIFIC Corporation
As of the end of the reporting period, the Company has a bank overdraft agreement with a limit of
\8,000 million and a loan agreement with a limit of \25,000 million with Woori Bank with trade
receivables as collateral in which the Company guarantees payment to the bank if the factoring of
trade receivables takes place before the payment is due. As of the end of the reporting period, the
outstanding balance of the loan agreement secured by credit sales that has not yet reached
maturity is\7,807 million (2012: \12,320 million). Additionally, as of the end of the reporting
period, the Company has a letter of credit agreement with a limit of USD 4,000 thousand with
Woori Bank and the amount USD 311 thousand (2011: USD 49 thousand) has been drawn.
As of the end of the reporting period, Seoul Guarantee Insurance has provided the Company with
payment guarantees such as court bond guarantees, performance guarantees and others
amounting to \2,135 million (2012: \2,284 million).
Etude Corporation
Etude Corporation has a loan agreement secured by credit sales of up to ₩5,000 million and a
bank overdraft agreement of up to ₩1,000 million with Woori Bank as of the reporting date. The
outstanding balance of the loan agreement secured by credit sales that has not yet reached
maturity is ₩1,223 million (2012: ₩2,333 million) as of the reporting date.
As of the end of the reporting period, Seoul Guarantee Insurance has provided the Company with
payment guarantees such as court bond guarantees, performance guarantees and others
amounting to \50 million.
Innisfree Corporation
Innisfree Corporation has a loan agreement secured by credit sales of up to ₩2,000 million and a

AMOREPACIFIC Group, Inc. and SubsidiariesNotes to Consolidated Financial Statements
December 31, 2013 and 2012
62
bank overdraft agreement of up to ₩1,000 million with Woori Bank as of the reporting date. The
outstanding balance of the loan agreement secured by credit sales that has not yet reached
maturity is ₩396 million (2012: ₩158 million) as of the reporting date.
As of the end of the reporting period, Seoul Guarantee Insurance has provided the Company with
payment guarantees such as court bond guarantees, performance guarantees and others
amounting to \71 million.
AMOS Professional Corporation
AMOS Professional has a loan agreement secured by its credit sales of up to ₩4,000 million and
a bank overdraft agreement of up to ₩1,000 million with Woori Bank as of the reporting date. The
outstanding balance of the loan agreement secured by its credit sales that has not yet reached
maturity is ₩36 million (2012: ₩474 million) as of the reporting date.
PACIFICPHARMA Corporation
As of the reporting date, this subsidiary has a facilities fund loan agreement of up to ₩10,000
million (2012: ₩10,000 million) with Industrial Bank of Korea for which no amount (2012: ₩7,900
million) is outstanding. And this subsidiary has an operating fund loan agreement of up to
₩20,000 million with Woori Bank for which no amount is outstanding as of the reporting date.
Additionally, this subsidiary has a loan agreement secured by its credit sales of up to ₩ 30,000
million with Woori Bank as of the reporting date. The outstanding balance of the loan on credit
sales that has not yet reached maturity is ₩1,021 million (2012: ₩2,485 million) as of the
reporting date.
Seoul Guarantee Insurance has provided this subsidiary with payment guarantees such as
performance guarantees and others amounting to \371 million as of the reporting date.
According to the announcement ‘Notice of change in maintenance plans for registered medicine’
of Ministry of Health and Welfare (Article 2011-354(2011/06/22)), this subsidiary should maintain
contingent benefits during the clinical test period, which is conducted to determine the usefulness
of ‘Livital Tab’. Otherwise, the subsidiary has to repay ₩635,662 thousand to National Health
Insurance Corporation.
PACIFICGLAS, Inc.
PACIFICGLAS, Inc. has a loan agreement secured by its credit sales of up to ₩5,000 million and
a bank overdraft agreement of up to ₩3,000 million with Woori Bank as of the reporting date. The
outstanding balance of the loan agreement secured by its credit sales that has not yet reached
maturity is ₩9 million (2012: ₩20 million) as of the reporting date. And there is a letter of credit
agreement of up to EUR 4,000 thousand with Woori Bank for which no amount is outstanding as
of the reporting date. This subsidiary has an operating fund loan agreement of up to ₩5,000
million with Woori Bank, and the outstanding balance is ₩5,000 million as of the reporting date.
As of the reporting date, Seoul Guarantee Insurance has provided this subsidiary with payment
guarantees such as court bond guarantees, performance guarantees and others amounting to
\94 million.

AMOREPACIFIC Group, Inc. and SubsidiariesNotes to Consolidated Financial Statements
December 31, 2013 and 2012
63
PACIFICPACKAGE Corporation
PACIFICPACKAGE Corporation has a loan agreement secured by its credit sales of up to ₩3,000
million and a bank overdraft agreement of up to ₩1,000 million. There is no outstanding balance
(2012: ₩2 million) of the loan agreement secured by its credit sales that has not yet reached
maturity as of the reporting date.
As of the reporting date, Seoul Guarantee Insurance has provided this subsidiary with payment
guarantees such as court bond guarantees, performance guarantees and others amounting to
\193 million.
Jangwon Co., Ltd.
Jangwon Co., Ltd. has a loan agreement of up to ₩1,000 million with Woori Bank but there is no
balance of amount used as of the reporting date.
Seoul Guarantee Insurance has provided this subsidiary with payment guarantees such as court
bond guarantees, performance guarantees and others amounting to ₩42 million.
COSVISION CO.,LTD.
This subsidiary has a loan agreement secured by its credit sales of up to ₩2,000 million, a bank
overdraft agreement of up to ₩1,000 million with Woori Bank as of the reporting date. There is no
outstanding balance of the loan agreement secured by its credit sales that has not yet reached
maturity as of the reporting date.
AMOREPACIFIC Global Operations Limited
This subsidiary has a syndicated loan agreement with Citi Bank and five other banks with a limit of
USD 40,000 thousand and the outstanding balance is USD 40,000 thousand (2012: USD 40,000
thousand). And this subsidiary has a bank overdraft agreement with a limit of USD 10,000
thousand with Citi Bank for which there is no outstanding balance (2012: USD 173 thousand).
AMOREPACIFIC Trading Co., Ltd.
This subsidiary has a bank overdraft agreement with a limit of USD 10,000 thousand with Citibank
and there is no outstanding balance.
AMOREPACIFIC EUROPE S.A.S
This subsidiary has a finance lease agreement with Societe Generale Bank and one other bank
amounting to EUR 8,765 thousand, and a loan agreement with Societe Generale Bank and two
other banks with a limit of EUR 20,000 thousand and the outstanding balance is EUR 18,314
thousand (2012: EUR 9,373 thousand).
Annick Goutal S.A.S
This subsidiary has a bank overdraft agreement with a limit of EUR 3,000 thousand with Korea
Exchange Bank and the outstanding balance is EUR 2,973 thousand.
AMOREPACIFIC Japan Co., Ltd.
This subsidiary has a bank overdraft agreement with a limit of JPY 1,000,000 thousand with
Shinhan Bank-Japan and the outstanding balance is JPY 600,000 thousand (2012: JPY 429,000

AMOREPACIFIC Group, Inc. and SubsidiariesNotes to Consolidated Financial Statements
December 31, 2013 and 2012
64
thousand).
AMOREPACIFIC Cosmetics New (Shanghai) Co.,Ltd.
This subsidiary has a syndicated loan agreement with Citi Bank and two other banks with a limit of
USD 65,000 thousand and the outstanding balance is USD 65,000 thousand.
As of the reporting date, current bank deposits amounting to \20,500 million (2012:\25,000
million) and non-current bank deposits amounting to \33 million (2012: \33 million) are restricted
in use for guarantees provided for subsidiaries’ borrowings and as guarantee deposits for the
maintenance of checking accounts. Non-current bank deposits amounting to \3,482 million (RMB
20,000 thousand) (2012: \3,483 million (RMB 20,000 thousand)) is restricted in use for
permission of door-to-door sales.
PACIFICPAKAGE Co., Ltd. is jointly liable for the obligations of the newly spun off company,
Taeshin Inpack Corporation, including its contingent liabilities that existed prior to the spin-off.
35. Disposal Group Held-for-Sale
Details of assets of disposal group classified as held-for-sale as of December 31, 2013 and 2012,
are as follows:
(In millions of Korean won) 2013 2012
Land in Yongin, Gyeonggi Province1 \ 2,299 \ 2,299
1 The Group had an agreement to sell land situated in Yongin, Gyeonggi Province, but the
ownership was not transferred because the license relating to the sale was not received. In 2012,
the Group recognized a gain on disposal of \7,685 million because the license relating to the
sale was received except for some land.
Also, in relation to the sales contract of the pharmaceutical segment of PACIFIC PHARMA
Corporation during 2013, the Group classified the following assets and liabilities as assets and
liabilities held-for-sale (Note 41):
(in millions of Korean won)
Assets held-for-sale Liabilities held-for-sale
Trade receivables \ 18,964 Trade payables \ 4,878
Inventories 2,710 Other payables 2,826
Other receivables 2,166 Post-employment benefit obligation 2,291
Property, plant and equipment 45 Provision for sales returns 801
Intangible assets 1 Withholdings 118
\ 23,886 \ 10,914

AMOREPACIFIC Group, Inc. and SubsidiariesNotes to Consolidated Financial Statements
December 31, 2013 and 2012
65
36. Related Party Transactions
Details of the parents and subsidiaries as of the reporting date are as follows:
Classification Name
Ultimate parent Kyung- Bae Suh
Ultimate parent company in the preparation of
consolidated financial statements for disclosure AMOREPACIFIC Group, Inc.
Subsidiaries AMOREPACIFIC Corporation
Etude Corporation
Innisfree Corporation
AMOS Professional Corporation
PACIFICPHARMA Corporation
PACIFICGLAS, Inc.
PACIFICPACKAGE Corporation
Jangwon Co., Ltd.
COSVISION CO.,LTD.
AMOREPACIFIC Global Operations Limited.
AMOREPACIFIC GLOBAL OPERATIONS PTE. LTD.
AMORE Cosmetics (Shanghai) Co.,Ltd.
AMOREPACIFIC Cosmetics New (Shanghai) Co.,Ltd.
AMOREPACIFIC (Shanghai) R&I Center Co.,Ltd.
AMOREPACIFIC Trading Co.Ltd.
AMOREPACIFIC EUROPE S.A.S
Annick Goutal S.A.S
AMOREPACIFIC US, INC.
AMOREPACIFIC Japan Co.,Ltd.
AMOREPACIFIC Taiwan Co.,Ltd.
AMOREPACIFIC SINGAPORE PTE., LTD.
AMOREPACIFIC MALAYSIA SDN. BHD.
AMOREPACIFIC VIETNAM JSC
AMOREPACIFIC (Thailand) LIMITED
PT. LANEIGE INDONESIA PACIFIC
Innisfree Cosmetics India Private Limited
Associates BBDO Korea Inc.
AMOREPACIFIC Hong Kong Co.,Limited
Taiwan AMORE Co.,Ltd.
Other related parties Taeshin Inpack Corporation

AMOREPACIFIC Group, Inc. and SubsidiariesNotes to Consolidated Financial Statements
December 31, 2013 and 2012
66
Significant transactions with related parties for the years ended December 31, 2013 and 2012, are
as follows:
(in millions of Korean won) 2013 2012
Sales Purchases Sales Purchases
Associates
Taiwan AMORE Co.,Ltd. \ 249 \ - \ 332 \ -
AMOREPACIFIC HongKong Co.,Limited 17,911 - 16,496 -
BBDO Korea Inc. 443 22,453 441 19,382
Other related parties
Taeshin Inpack Corporation - 19,425 - 22,037
\ 18,603 \ 41,878 \ 17,269 \ 41,419
Balances with related parties as of December 31, 2013 and 2012, are as follows:
(in millions of Korean won) 2013
Receivables Payables
Tradereceivables
Otherreceivables
Tradepayables
Otherpayables
Associates
Taiwan AMORE Co.,Ltd. \ 118 \ - \ - \ -
AMOREPACIFIC HongKong Co.,Limited 2,829 - - -
BBDO Korea Inc. - - 6,037 229
Other related parties - - - -
Taeshin Inpack Corporation - - 2,576 -
\ 2,947 \ - \ 8,613 \ 229
(in millions of Korean won) 2012
Receivables Payables
Tradereceivables
Otherreceivables
Tradepayables
Otherpayables
Associates
Taiwan AMORE Co.,Ltd. \ 29 \ - \ - \ -
AMOREPACIFIC HongKong Co.,Limited 2,746 - - -
BBDO Korea Inc. - - 5,020 -
Other related parties - - - -
Taeshin Inpack Corporation - - 3,091 -
\ 2,775 \ - \ 8,111 \ -

AMOREPACIFIC Group, Inc. and SubsidiariesNotes to Consolidated Financial Statements
December 31, 2013 and 2012
67
The trade receivables from related parties are due two months after the date of sale. The
receivables from related parties are unsecured in nature and bear no interest.
There are no fund transactions with related parties for the years ended December 31, 2013 and
2012.
There are no collaterals nor payment guarantees provided by the Group for the funding sources of
the related parties as of December 31, 2013, and no collaterals and payment guarantees are
provided by the related parties
Compensation for key management for the years ended December 31, 2013 and 2012, consists
of:
(in millions of Korean won) 2013 2012
Short-term employee benefits \ 10,195 \ 14,635
Post-employment benefits 1,267 2,198
\ 11,462 \ 16,833
37. Acquisition of subsidiaries
37.1 AMOREPACIFIC (Thailand) LIMITED
On January 30, 2012, the Group’s subsidiary, AMOREPACIFIC Global Operations Limited acquired
an additional 51% ownership in AMOREPACIFIC (Thailand) LIMITED, on top of its 49% ownership,
to expand its cosmetic market and strengthen competitiveness.
The fair value of consideration transferred and the assets acquired and liabilities assumed at the
date of acquisition are summarized below:
(in millions of Korean won) 2012
Cash and cash equivalents \ 2,435
Trade and other receivables1
164
Other assets 80
Inventories 132
Property, plant and equipment 117
Intangible assets 6
Trade payables (87)
Borrowings (108)
Other liabilities (137)
Net assets acquired \ 2,602

AMOREPACIFIC Group, Inc. and SubsidiariesNotes to Consolidated Financial Statements
December 31, 2013 and 2012
68
1 Fair value of trade and other receivables is ₩164 million, and trade receivables amounting to
₩163 million are included. Gross amount of trade and other receivables on arrangement at
acquisition date is ₩164 million. There are no receivables expected to be uncollectible.
The amount of goodwill recognized is as follows:
(in millions of Korean won) 2012
Gross consideration transferred \ 3,179
Fair value of net assets (2,602)
Goodwill1 \ 577
1None of the goodwill recognized is expected to be deductible for income tax purposes.
Net cash flow following the acquisition of AMOREPACIFIC (Thailand) LIMITED is as follows:
(in millions of Korean won) 2012
Gross consideration transferred \ 3,179
Deducted: cash and cash equivalents of acquiree (2,435)
Deducted: investments in associates (114)
Cash and cash equivalents \ 630
All consideration are in the form of cash and cash equivalents.
The Group provided acquisition-related costs such as legal fees and due diligence fees amounting
to ₩69 million, and recognized it as selling and administrative expenses in the consolidated
statement of comprehensive income.
The revenue and net income included in consolidated statement of comprehensive income
contributed by AMOREPACIFIC (Thailand) LIMITED amount to ₩2,867 million and ₩(723) million,
respectively in 2012.

AMOREPACIFIC Group, Inc. and SubsidiariesNotes to Consolidated Financial Statements
December 31, 2013 and 2012
69
37.2 AMOREPACIFIC SINGAPORE PTE., LTD.’s acquisition of Etude House
On July 1, 2012, the Group’s subsidiary, AMOREPACIFIC SINGAPORE PTE., LTD acquired Etude
House CGU to expand its cosmetic market and strengthen competitiveness.
The fair value of consideration transferred and the assets acquired and liabilities assumed at the
date of acquisition are summarized below:
(in millions of Korean won) 2012
Cash and cash equivalents \ 74
Other receivables1
561
Inventories 175
Property, plant and equipment 344
Trade payables (202)
Net assets acquired \ 952
1Fair value of other receivables are ₩561 million. Gross amount of other receivables on
arrangement at acquisition date is ₩561 million. There are no receivables expected to be
uncollectible.
The amount of goodwill recognized is as follows:
(in millions of Korean won) 2012
Gross consideration transferred \ 4,672
Fair value of net assets (952)
Goodwill1 \ 3,720
1None of the goodwill recognized is expected to be deductible for income tax purposes.
Net cash flow following the acquisition of Etude House is as follows:
(in millions of Korean won) 2012
Gross consideration transferred \ 4,672
Deducted: cash and cash equivalents of acquiree (74)
Cash and cash equivalents \ 4,598
The Group provided acquisition-related costs such as legal fees and due diligence fees amounting
to ₩214 million, and recognized it as selling and administrative expenses in the consolidated
statement of comprehensive income.

AMOREPACIFIC Group, Inc. and SubsidiariesNotes to Consolidated Financial Statements
December 31, 2013 and 2012
70
The amount of revenue and net income included in consolidated statement of comprehensive
income contributed by Etude House amount to ₩3,390 million and ₩(93) million, respectively in
2012.
37.3 PT. LANEIGE INDONESIA PACIFIC
On July 1, 2012, the Group’s subsidiary AMOREPACIFIC Global Operations Limited obtained
control of PT. LANEIGE INDONESIA PACIFIC by an additional acquiring 70% ownership to expand
its cosmetic market and strengthen competitiveness. As of December 31, 2012, the
AMOREPACIFIC Global Operations Limited owns 94.18% of PT. LANEIGE INDONESIA PACIFIC
through its paid-in capital increase. As of December 31, 2013, the Group owns 90.58% of PT.
LANEIGE INDONESIA PACIFIC.
The fair value of consideration transferred and the assets acquired and liabilities assumed at the
date of acquisition are summarized below:
(in millions of Korean won) 2012
Cash and cash equivalents \ 16
Other assets 6
Property, plant and equipment 56
Trade payables (218)
Borrowings (379)
Net assets acquired \ (519)
The amount of goodwill recognized is as follows:
(in millions of Korean won) 2012
Gross consideration transferred \ 110
Fair value of net assets 519
Deducted: investments in associates1
(156)
Goodwill2 \ 473
1The Group’s subsidiary, AMOREPACIFIC Global Operations Limited has stopped applying the
equity method on its 30% ownership at the acquisition date. Thus, \156 million of loss for the
year relating to fair value of net assets was adjusted.
2None of the goodwill recognized is expected to be deductible for income tax purposes.

AMOREPACIFIC Group, Inc. and SubsidiariesNotes to Consolidated Financial Statements
December 31, 2013 and 2012
71
Net cash flow following the acquisition of PT. LANEIGE INDONESIA PACIFIC is as follows:
(in millions of Korean won) 2012
Gross consideration transferred \ 110
Deducted: cash and cash equivalents of acquiree (16)
Cash and cash equivalents \ 94
All consideration are in the form of cash and cash equivalents.
There is no revenue, but the net income included in consolidated statement of comprehensive
income contributed by PT. LANEIGE INDONESIA PACIFIC amounts to ₩(394) million in 2012.
38. Information About Non-controlling Interests
38.1 Changes in Accumulated Non-controlling Interests
The profit or loss allocated to non-controlling interests and accumulated non-controlling interests
of subsidiaries that are material to the Group for the years ended December 31, 2013 and 2012, is
as follows:
(in millions of Korean won) 2013
Percentageof non-
controllinginterests
Accumulatednon-controllinginterests at the
beginning ofthe year
Profit or lossallocated to
non-controllinginterests
Dividendspaid to
non-controllinginterests
Changes innon-
controllinginterests Others
Accumulatednon-controllinginterests at theend of the year
AMOREPACIFIC Corporation 64.60% \ 1,596,016 \ 181,013 \ (30,446) \ 4,438 \ (1,936) \ 1,749,085
Etude Corporation 19.52% 13,467 3,869 (1,089) - (105) 16,142
Innisfree Corporation 18.18% 11,780 7,097 (889) - (16) 17,972
PACIFICPHARMA Corporation -% 34,388 (21) (278) (34,618) 529 -
Others 109 35 - 5 - 149
\ 1,655,760 \ 191,993 \ (32,702) \ (30,175) \ (1,528) \ 1,783,348
(in millions of Korean won) 2012
Percentageof non-
controllinginterests
Accumulatednon-controllinginterests at the
beginning ofthe year
Profit or lossallocated to
non-controllinginterests
Dividendspaid to
non-controllinginterests
Changes innon-
controllinginterests Others
Accumulatednon-controllinginterests at theend of the year
AMOREPACIFIC Corporation 64.60% \ 1,456,037 \ 182,985 \ (30,446) \ 1,784 \(14,344) \ 1,596,016
Etude Corporation 19.52% 11,002 3,409 (908) - (36) 13,467
Innisfree Corporation 18.18% 7,160 5,114 (444) - (50) 11,780
PACIFICPHARMA Corporation 65.13% 33,718 547 (284) - 407 34,388
Others (1,098) (174) - 1,193 188 109
\ 1,506,819 \ 191,881 \ (32,082) \ 2,977 \(13,835) \ 1,655,760

AMOREPACIFIC Group, Inc. and SubsidiariesNotes to Consolidated Financial Statements
December 31, 2013 and 2012
72
38.2 Summarized Financial Information on Subsidiaries
The summarized financial information for each subsidiary with non-controlling interests that are
material to the Group before inter-company eliminations is as follows:
Summarized consolidated statements of financial position as of December 31, 2013 and 2012, are
as follows:
(in millions of Korean won) 2013
AMOREPACIFICCorporation
EtudeCorporation
InnisfreeCorporation
Current assets \ 967,574 \ 70,956 \ 102,694
Non-current assets 2,434,275 46,805 43,923
Current liabilities 542,699 32,568 46,413
Non-current liabilities 291,018 1,077 744
Equity 2,568,132 84,116 99,460
(in millions of Korean won) 2012
AMOREPACIFICCorporation
EtudeCorporation
InnisfreeCorporation
PACIFICPHARMACorporation
Current assets \ 804,189 \ 64,100 \ 70,766 \ 73,092
Non-current assets 2,222,004 44,851 35,181 71,388
Current liabilities 417,240 36,737 39,768 37,282
Non-current liabilities 265,166 1,494 1,089 19,029
Equity 2,343,787 70,720 65,090 88,169

AMOREPACIFIC Group, Inc. and SubsidiariesNotes to Consolidated Financial Statements
December 31, 2013 and 2012
73
Summarized consolidated statements of comprehensive income for the years ended December 31,
2013 and 2012, are as follows:
(in millions of Korean won) 2013
AMOREPACIFICCorporation
EtudeCorporation
InnisfreeCorporation
Sales \ 3,100,413 \ 337,239 \ 332,759
Profit or loss for the year 267,359 19,467 39,348
Other comprehensive income (2,565) (491) (88)
Total comprehensive income \ 264,794 \ 18,976 \ 39,260
(in millions of Korean won) 2012
AMOREPACIFICCorporation
EtudeCorporation
InnisfreeCorporation
PACIFICPHARMACorporation
Sales \ 2,849,462 \ 280,507 \ 229,416 \ 141,247
Profit or loss for the year 269,258 18,629 28,295 1,194
Other comprehensive income (20,749) (219) (253) 1,130
Total comprehensive income \ 248,509 \ 18,410 \ 28,042 \ 2,324
Summarized consolidated statements of cash flows for the years ended December 31, 2013 and
2012, are as follows:
(in millions of Korean won) 2013
AMOREPACIFICCorporation
EtudeCorporation
InnisfreeCorporation
Cash flows from operating activities \ 426,657 \ 17,984 \ 42,522
Cash flows from investing activities (348,843) (2,564) (34,624)
Cash flows from financing activities 49,196 (5,580) (4,888)
Net increase in cash and cash equivalents 127,010 9,840 3,010
Cash and cash equivalents at beginning of year 170,707 4,540 7,056
Exchange losses on cash and cash equivalents (3,705) - -
Cash and cash equivalents at end of year \ 294,012 \ 14,380 \ 10,066
(in millions of Korean won) 2012
AMOREPACIFICCorporation
EtudeCorporation
InnisfreeCorporation
PACIFICPHARMACorporation
Cash flows from operating activities \ 275,581 \ 20,109 \ 40,637 \ (1,612)
Cash flows from investing activities (253,849) (21,564) (47,293) (19,330)
Cash flows from financing activities (35,312) (4,649) (2,445) 7,189
Net decrease in cash and cash equivalents (13,580) (6,104) (9,101) (13,753)
Cash and cash equivalents at beginning of year 187,708 10,644 16,157 34,105
Exchange losses on cash and cash equivalents (3,421) - - -
Cash and cash equivalents at end of year \ 170,707 \ 4,540 \ 7,056 \ 20,352

AMOREPACIFIC Group, Inc. and SubsidiariesNotes to Consolidated Financial Statements
December 31, 2013 and 2012
74
38.3 Transactions with Non-controlling Interests
(a) Acquisition of additional interest in a subsidiary
As of March 11, 2013, the Group paid ₩16,279 million in cash and ₩8,003 million in treasury stock
and acquired the remaining 81.7% of preferred shares and 34.9% of common shares of PACIFIC
PHARMA. As a result, the Group holds 100% of preferred shares and common shares of PACIFIC
PHARMA. At that time the Group acquired additional interests, the carrying amount of non-
controlling interests was ₩34,618 million. This amount has been eliminated as a result of the
above transaction and ₩10,337 million has been booked as an increase of asset that is
attributable to equity holders. Assets attributable to the equity holders after the change of
ownership are as follows:
(in millions of Korean won) 2013
Carrying amount of non-controlling interests acquired \ 34,618
Consideration paid to non-controlling interests (24,281)
Excess of consideration paid recognized in parent’s equity \ 10,337
Loss on disposal of treasury shares recognized in relation to the above transaction with non-
controlling interests is as follows:
(in millions of Korean won) 2013 Note
Fair value of treasury shares at disposal \ 8,003
Book value of treasury shares (5,542) Increase in other components of equity
Compensation of unit shares (158)
Pre-tax gain on disposal of treasury shares 2,303
Post-tax gain on disposal of treasury shares 1,746 Increase in capital surplus
39. Risk Management
39.1 Financial Risk Management
The Group’s activities expose it to a variety of financial risks: market risk (including currency risk,
fair value interest rate risk and cash flow interest rate risk), credit risk and liquidity risk. The Group’s
overall risk management program focuses on the unpredictability of financial markets and seeks to
minimize potential adverse effects on the Group’s financial performance.
Risk management is carried out by a treasury department under policies approved by the board of
directors. The treasury department identifies, evaluates and hedges financial risks in close co-
operation with the Group’s operating units. The treasury department provides written principles for
overall risk management, as well as written policies covering specific areas, such as foreign
exchange risk, interest rate risk, credit risk, use of derivative financial instruments and non-
derivative financial instruments, and investment of excess liquidity.

AMOREPACIFIC Group, Inc. and SubsidiariesNotes to Consolidated Financial Statements
December 31, 2013 and 2012
75
(a) Market risk
i) Foreign exchange risk
The Group operates internationally and is exposed to foreign exchange risk arising from various
currency exposures, primarily with respect to the US dollar, Euro and the Japanese yen.
The purpose of foreign exchange risk management is to maximize the Group’s value by minimizing
the uncertainty and volatility of foreign exchange gains and losses from foreign exchange rate
fluctuations.
The Company’s financial instruments denominated in major foreign currencies as of December 31,
2013 and 2012, are as follows:
(in millions of Korean won) 2013 2012
Assets Liabilities Assets Liabilities
USD \ 61,918 \ 66,742 \ 36,865 \ 65,249
EUR 5,932 2,181 4,954 494
JPY 713 1,885 767 2,588
\ 68,563 \ 70,808 \ 42,586 \ 68,331
As of December 31, 2013 and 2012, if the foreign exchange rate of the Korean won fluctuated by
10% while other variables were fixed, the effects on income before tax would be as follows:
(in millions of Korean won) 2013 2012
10%Increase
10%Decrease
10%Increase
10%Decrease
USD \ (482) \ 482 \ (2,838) \ 2,838
EUR 375 (375) 446 (446)
JPY (117) 117 (182) 182
The above sensitivity analysis is done with foreign currency denominated assets and liabilities
which are not in the Parent Company’s functional currency.
ii) Interest rate risk
The Group is exposed to interest rate risk through changes in interest-bearing liabilities or assets.
The risk mainly arises from borrowings and financial deposits with variable interest rates linked to
market interest rate changes in the future. The objective of interest rate risk management lies in
maximizing corporate value by minimizing uncertainty caused by fluctuations in interest rates and
minimizing net interest expense.

AMOREPACIFIC Group, Inc. and SubsidiariesNotes to Consolidated Financial Statements
December 31, 2013 and 2012
76
To mitigate interest rate risk, the Group manages interest rate risk proactively by: minimizing
external borrowings by maximizing internal cash sharing, reducing borrowings with high interest
rates, maintaining an adequate mix between short-term and long-term liabilities and between fixed
and variable interest rates and monitoring weekly and monthly interest rate trends in domestic and
international markets.
The Group invests in fixed interest assets with maturities of one year or less, and if the market
interest rate increases, there is risk of decrease in fair value. However, the risk of changes in fair
value is minor as the investments are short-term deposits.
At the end of the reporting period, if interest rates on floating rate borrowings had been 1%
higher/lower with all other variables held constant, profit before income tax for the year would have
been ₩1,090 million lower/higher, mainly as a result of higher/lower interest expense on floating
rate borrowings.
(b) Credit Risk
Credit risk is managed by the Group as a whole. Credit risk arises from cash and cash equivalents
and deposits with banks and financial institutions, as well as credit exposures to customers,
including outstanding receivables and committed transactions.
For banks and financial institutions, only independently rated parties with a minimum rating of ’A’
are accepted. For general customer, the Group evaluates and manages the collaterals (real estate,
pledged deposit, payment guarantees, guarantee insurance and others) Also, to decrease credit
risk, only 50~75% of market price of real states are acknowledged as collateral value. If the market
price changes suddenly, the Group adjusts the collateral value, calculates credit limit and executes
it strictly with authorized discretionary power and procedures.
(c) Liquidity Risk
The Group holds sufficient amount of cash and cash equivalents and maintains a flexible fund
capacity within credit limit by brisk business. Financial liabilities involved in sales except borrowings
are basically paid within maximum three months after purchasing (average within two months), so
maturity of all financial liabilities (with or without payment condition) are within three months. The
Group manages liquidity by holding more cash and cash equivalents than monthly payments.

AMOREPACIFIC Group, Inc. and SubsidiariesNotes to Consolidated Financial Statements
December 31, 2013 and 2012
77
The table below analyses the Group’s non-derivative financial liabilities into relevant maturity
groupings based on the remaining period at the statement of financial position date to the
contractual maturity date. The amounts disclosed in the table are the contractual undiscounted
cash flows. These contracts are managed on a net-fair value basis rather than by maturity date.
(in millions ofKorean won)
2013
Up to 1 year 1 to 2 years 2 to 5 years Over 5 years Total Book value
Trade payables \ 110,831 \ - \ - \ - \ 110,831 \ 110,831
Borrowings 87,210 1,119 69,457 - 157,786 153,228
Other payables 221,750 - - - 221,750 221,750
Other liabilities 19,025 12,073 - 8,246 39,344 39,344
Derivative liabilities - - 181 - - 181
(in millions ofKorean won)
2012
Up to 1 year 1 to 2 years 2 to 5 years Over 5 years Total Book value
Trade payables \ 116,411 \ - \ - \ - \ 116,411 \ 116,411
Borrowings 25,271 44,330 7,419 - 77,020 76,561
Other payables 202,861 - - - 202,861 202,861
Other liabilities 11,525 18,184 7,493 1,753 38,955 34,942
39.2 Capital Management
The Group’s capital risk management purpose is maximising shareholders’ value through
maintaining a sound capital structure. The Group monitors financial ratios, such as liability to equity
ratio and net borrowing ratio each month and implements required action plan to improve the
capital structure.
Debt-to-equity ratio and net borrowing ratio are as follows:
(in millions of Korean won) 2013 2012
Liabilities (A) \ 1,012,909 \ 881,742
Equity (B) 3,908,947 3,634,213
Cash and cash equivalents, and current financial deposits (C) 901,267 768,861
Borrowings (D) 153,228 76,561
Debt-to-equity ratio (A/B) 25.91% 24.26%
Net borrowings ratio (D-C)/B (-)19.14% (-)19.05%

AMOREPACIFIC Group, Inc. and SubsidiariesNotes to Consolidated Financial Statements
December 31, 2013 and 2012
78
40. Fair Value Estimation
40.1 Fair Value of Financial Instruments by Category
The Group classifies fair value measurements using a fair value hierarchy that reflects the
significance of the inputs used in measurements.
Level 1: quoted prices (unadjusted) in active markets for identical assets or liabilities.
Level 2: inputs other than quoted prices that are observable for the asset or liability, either
directly or indirectly.
Level 3: inputs for the asset or liability that are not based on observable market data (that is,
unobservable inputs).
(in millions of Korean won) 2013
Level 1 Level 2 Level 3 Total
Recurring fair value measurements
Available-for-sale financial assets - 2,541 - 2,541
Derivative liabilities - 181 - 181
Disclosed fair value
Investment property - - 223,798 223,798
(in millions of Korean won) 2012
Level 1 Level 2 Level 3 Total
Recurring fair value measurements
Available-for-sale financial assets 4,211 3,373 - 7,584
Disclosed fair value
Investment property - - 220,230 220,230
40.2 Valuation Technique
Valuation techniques used in the recurring fair value measurements categorized within Level 2 and
Level 3 of the fair value hierarchy as of December 31, 2013, are as follows:
(a) Derivative financial instruments
The fair value of derivative financial instruments is determined by using valuation techniques
based on current market conditions. These valuation techniques maximize the use of observable
market data whenever possible and rely as little as possible on entity specific estimates. The fair
value of derivative financial instruments is measured at discount using forward exchange rate as
of the reporting date.

AMOREPACIFIC Group, Inc. and SubsidiariesNotes to Consolidated Financial Statements
December 31, 2013 and 2012
79
(b) Availabe-for-sale financial assets
The fair value of available-for-sale financial assets is determined using recent transactions which
are in an arm’s length transaction.
(c) Investment property
The fair value of investment property is measured on the basis of valuation either by an
independent appraiser who holds recognized and relevant professional qualifications or by the
local government in Korea for property tax assessment purposes, or by using similar recent
transaction prices which are available.
40.3 Financial Instruments Measured at Cost
Details of financial instruments measured at cost as of December 31, 2013 and 2012, are as
follows:
(in millions of Korean won) 2013 2012
Available-for-sale debt securities
Government-issued securities \ 5,630 \ 4,743
Available-for-sale equity securities
ANTERIOS, INC. 4,067 4,067
CAPSUM 549 549
Regen Prime Co., Ltd. 500 500
Lithera, Inc. 2,147 2,147
Obalon Therapeutics 5,378 5,378
Brickell Biotech 1,083 -
TRIA BEAUTY INC 1,688 -
Pacific Metals Co., Ltd. 6,080 6,080
GL Pharm Tech Co., Ltd. 191 191
Welskin Co., Ltd. 48 48
The Korea Economic Daily 81 81
Biogenics Co., Ltd. 1,000 1,000
Chungbuk Printing Association 1 1
ELANDRETAIL Ltd. 3 3
\ 28,446 \ 24,788
The above equity securities are measured at cost, because the variability of estimated cash flows
is significant and the probabilities of the various estimates cannot be reasonably assessed, or the
difference between their fair values and their acquisition costs is immaterial. Available-for-sale debt
securities are measured at fair values, because the difference between their fair values and the
acquisition costs is immaterial.

AMOREPACIFIC Group, Inc. and SubsidiariesNotes to Consolidated Financial Statements
December 31, 2013 and 2012
80
Other financial assets and liabilities whose carrying amount is a reasonable approximation of fair
value are excluded from the separate fair value disclosures.
41. Events after the Reporting Period and Assets and Liabilities Held-for-Sale
On January 1, 2014, AMOREPACIFIC Global Operations Limited., a subsidiary, acquired control
over AMOREPACIFIC Hong Kong Co., Ltd., which was classified as an associate with 30% of
equity ratio, by acquiring an additional 47% of interests in order to increase its cosmetic market
share in Hong Kong and strengthen its competitiveness.
During 2013, PACIFIC PHARMA Corporation entered into a contract regarding the sale of the
pharmaceutical operating segment with Handok Inc. and a final agreement was reached on
February 14, 2014. The total contract amount for the sales is ₩57,500 million and receivables and
payables of the pharmaceutical operating segment as of February 14, 2014, is transferred to
Handok Inc.
(in millions of Korean won)
Assets held-for-sale Liabilities held-for-sale
Trade receivables \ 18,964 Trade payables \ 4,878
Inventories 2,710 Other payables 2,826
Other receivables 2,166 Post-employment benefit obligation 2,291
Property, plant and equipment 45 Provision for sales returns 801
Intangible assets 1 Withholdings 118
\ 23,886 \ 10,914


