AMMONIA EXCRETION IN THE ATLANTIC HAGFISH, (Myxine ...
76
AMMONIA EXCRETION IN THE ATLANTIC HAGFISH, (Myxine glutinosa) A Thesis by JUSTIN MATTHEW ARNOLD Submitted to the Graduate School at Appalachian State University in partial fulfillment of the requirements for the degree of MASTER OF SCIENCE December 2013 Department of Biology
Transcript of AMMONIA EXCRETION IN THE ATLANTIC HAGFISH, (Myxine ...

AMMONIA EXCRETION IN THE ATLANTIC HAGFISH, (Myxine glutinosa)
A Thesis by
JUSTIN MATTHEW ARNOLD
Submitted to the Graduate School at Appalachian State University
in partial fulfillment of the requirements for the degree of MASTER OF SCIENCE
December 2013 Department of Biology

AMMONIA EXCRETION IN THE ATLANTIC HAGFISH, (Myxine glutinosa)
A Thesis by
JUSTIN MATTHEW ARNOLD December 2013
APPROVED BY:
Susan L. Edwards, Ph.D. Chairperson, Thesis Committee Ted Zerucha, Ph.D. Member, Thesis Committee Patrick J. Walsh, Ph.D. Member, Thesis Committee Susan L. Edwards, Ph.D. Chairperson, Department of Biology Edelma D. Huntley, Ph.D. Dean, Cratis Williams Graduate School

Copyright by Justin Matthew Arnold 2013 All Rights Reserved

iv
Abstract
AMMONIA EXCRETION IN THE ATLANTIC HAGFISH, (Myxine glutinosa)
Justin Matthew Arnold
B.S., Appalachian State University M.S., Appalachian State University
Chairperson: Susan L. Edwards, Ph.D.
The hagfishes possess the longest known evolutionary history of the extant
craniates and likely offer exclusive insight into vertebrate origins. The Atlantic
hagfish is physiologically adapted to spend much of its life burrowed in ocean-floor
substrate and marine carcasses, where unfavorable conditions for ammonia excretion
are likely encountered. Plasma ammonia concentrations were experimentally elevated
by injection of NH4Cl. Ammonia excretion rates and plasma ammonia concentrations
were measured. Expression of Rhcg and Rhbg mRNA was quantified using
quantitative RT-PCR. We present evidence that suggests Atlantic hagfish are capable
of reducing experimentally elevated plasma ammonia concentrations and eventually
eliminating the plasma ammonia load within 12 hours. Following the injection of
ammonia elevated plasma ammonia concentrations paralleled elevated ammonia
excretion rates and coincided with the initial upregulation of Rhcg and Rhbg in the
gill and Rhcg in the skin suggesting that the transcriptional regulation of Rh
glycoproteins may respond, in part, to elevated plasma ammonia.

v
Acknowledgments
Very few things worth accomplishing are completed independently of the direction,
support and encouragement of others. This project certainly was no exception. I wish to
acknowledge and offer my gratitude to Dr. Susan Edwards for her patient advising and for
allowing me to pursue this research with little prior experinece in molecular biology or
protein biochemistry. I would like to thank my thesis committee members: Dr. Ted Zerucha
for his time and input and especially Dr. Patrick Walsh for the cloning of Rhcg and Rhbg in
the Atlantic hagfish and his willingness to travel for the defense of this thesis. I would have
been even more lost in my first semester of graduate studies without the willingness and
aptitude of Brian Mikeworth in teaching me the basics of molecular cloning and western
blotting, while writing his own thesis. Brian, only now do I realize what a sacrifice you were
making. Many thanks are due to Margo Pray and Ryland Bradley for their invaluable
assistance and lively spirits during otherwise tedious work. I am indebted to Dr. J.B.
Claiborne for his technical assistance, without which I would likely still be calculating net
ammonia flux. Without Dr. Dave Evans, I would have learned much less about the history of
comparative fish physiology and would not have had the hooks on which to hang much of
what I have learned since my summer at MDIBL. Thanks to Dr. Sue Bauldry for directing
the production of the homologous hagfish Rhcg antibody through an immunology laboratory
course. This project and my involvement in it would not have been possible without
generous funding from the NSF (grant # 1OS 112136 awarded to SLE).

vi
Dedication To my loving wife, Joanna, who graciously and patiently supported me through the
adventure of graduate studies, while embarking on her own voyage into motherhood. Your
tremendous investment in our family cannot be fully appreciated through words alone.

vii
Table of Contents Abstract .............................................................................................................................. iv
Acknowledgments ................................................................................................................v
Dedication .......................................................................................................................... vi
List of Tables .......................................................................................................................x
List of Figures .................................................................................................................... xi
Introduction ..........................................................................................................................1
Ammonia excretion ..................................................................................................1
Rh glycoproteins ......................................................................................................4
Rh glycoproteins in fish ...........................................................................................6
Saltwater models of branchial ammonia excretion .................................................7
Freshwater models of branchial ammonia excretion ..............................................8
Hagfishes..................................................................................................................9
Ammonia excretion in hagfishes ............................................................................10
Purpose of study .....................................................................................................13
Methods..............................................................................................................................14
RNA isolation and cDNA synthesis ........................................................................14
Reverse transcriptase polymerase chain reaction (RT-PCR) ................................14
Molecular cloning and sequencing ........................................................................15
Phylogenetic analysis .............................................................................................16

viii
Experimental design and animals ..........................................................................16
Injections ................................................................................................................17
Water sampling ......................................................................................................17
Sacrifice and tissue sampling .................................................................................18
Water ammonia profile ..........................................................................................18
Plasma ammonia profile ........................................................................................19
Quantitative RT-PCR (qRT-PCR) ..........................................................................19
Antibody production ...............................................................................................20
Western blotting .....................................................................................................21
Statistical analysis .................................................................................................22
Results ................................................................................................................................23
RT-PCR and phylogenetic analysis .......................................................................23
Water ammonia profile ..........................................................................................23
Plasma ammonia profile ........................................................................................24
qRT-PCR ................................................................................................................24
Western blotting .....................................................................................................25
Discussion ..........................................................................................................................26
Evolutionary context of hagfish Rh glycoproteins .................................................26
Ammonia excretion in response to elevated plasma ammonia ..............................27
Rh glycoprotein mRNA expression in gill tissue ....................................................29
Rh glycoprotein mRNA expression in skin tissue ...................................................32
Regulation of ammonia excretion in the Atlantic hagfish ......................................34
Limitations .............................................................................................................34

ix
Future directions ....................................................................................................35
Conclusions ............................................................................................................36
Tables .................................................................................................................................37
Figures................................................................................................................................39
References ..........................................................................................................................57
Vita .....................................................................................................................................65

x
List of Tables Table 1. Atlantic hagfish specific primers used for relative quantification of Rhcg and Rhbg
mRNA expression by qRT-PCR ........................................................................................37
Table 2. Sample size and individual mass of Atlantic hagfish injected with seawater sham or
ammonia. ............................................................................................................................38

xi
List of Figures Figure 1. Conceptual model of branchial ammonia excretion mediated by Rh glycoproteins in
pufferfish ............................................................................................................................39
Figure 2. Proposed model of branchial ammonia excretion in saltwater teleosts ..............40
Figure 3. Proposed model of Rhcg1-mediated active ammonia excretion in MRCs .........41
Figure 4. Proposed model of branchial ammonia excretion in freshwater teleosts ...........42
Figure 5. Proposed model of branchial ammonia excretion in freshwater teleosts, including
transport from red blood cells ............................................................................................43
Figure 6. Atlantic hagfish Rhcg cDNA nucleotide sequence from mRNA .......................44
Figure 7. Atlantic hagfish Rhbg cDNA nucleotide sequence from mRNA .......................45
Figure 8. RT-PCR products separated by 1% Ethidum bromide gel electrophoresis ........46
Figure 9. Phylogenetic reconstruction of Rh glycoproteins ...............................................47
Figure 10. Cumulative total ammonia in environmental water .........................................48
Figure 11. Net flux of total ammonia in environmental water ..........................................49
Figure 12. Plasma total ammonia profile ...........................................................................50
Figure 13. Rhcg mRNA expression in gill tissue ..............................................................51
Figure 14. Rhbg mRNA expression in gill tissue ..............................................................52
Figure 15. Rhcg mRNA expression in skin tissue .............................................................53
Figure 16. Immunoblot using homologous hagfish Rhcg antibody ...................................54
Figure 17. Quantification of Atlantic hagfish Rchg protein expression in gill tissue ........55
Figure 18. Immunolocalization of hagfish Rhcg in the gill and skin of Atlantic hagfish ..56
1
Introduction
By the late 1930s, Homer Smith (1929) had discovered that fish excrete ammonia
across the gill epithelium and August Krogh was investigating the ionoregulatory
relationship between sodium (Na+) uptake and the excretion of ammonia in freshwater fishes
(Krogh, 1939). In ostensibly unrelated research, Rhesus (Rh) proteins were determined to be
an antigen important to blood immunocompatibility (Levine and Stetson, 1939). Decades
later, the discovery of Rh glycoproteins (Marini et al., 1997) and the proposition of an
evolutionarily conserved functional role in ammonia transport (Huang and Peng, 2005)
emerged. For those interested in understanding the mechanisms of ammonia transport and
excretion, research has continued for many decades and teleost fish have remained among the
choice model organisms for its study (Evans, 2011; Ip and Chew, 2010). Recently, a
resurgence of scientific investigation has occurred; aimed at revealing the role of Rh
glycoproteins in ammonia excretion within a broad range of organisms through structural,
functional and histological analyses (Weihrauch et al., 2009; Wright and Wood, 2009).
Ammonia excretion
Ammonia is the nitrogenous waste product of amino acid catabolism, which, due to
its toxicity, must be excreted directly or converted into less toxic metabolites, such as urea or
uric acid (Ip et al., 2001; Wright, 1995). Note that ammonia can exist in a non-ionic, gaseous
form (NH3) or ionic form (NH4+) and will be referred to simply as ‘ammonia’ when the form
is not specified. When the chemical form needs to be specified, gaseous ammonia will be

2
referred to as NH3 or ammonia gas and ionic ammonia as NH4+ or ammonium ion. The term
‘total ammonia’ will be used to refer to NH3 and NH4+, collectively. Disruption of an
organism’s ability to excrete or metabolize ammonia leads to a state of hyperammonemia (an
excess of ammonia in the blood) that in vertebrates results in nerve and tissue damage
(Cooper and Plum, 1987; Walsh et al., 2007) and in mammals leads to impaired cognitive
function (hepatic encephalopathy) (Monfort et al., 2009). The direct excretion of ammonia is
metabolically inexpensive; however, it requires copious amounts of water to adequately
dilute the ammonia to below toxic concentrations (Ip and Chew, 2010). Thus, with a few
exceptions involving the volatilization of ammonia in terrestrial snails (Speeg and Campbell,
1968), terrestrial crabs (Greenaway and Nakamura, 1991), and terrestrial isopods (Wieser et
al., 1969), only aquatic organisms are capable of excreting ammonia directly (Wright, 1995).
With this in mind, it is not surprising that the vast majority of aquatic organisms are
ammonotelic, excreting their nitrogenous waste predominantly as ammonia (Walsh, 1998).
Despite relatively greater metabolic costs, some aquatic organisms such as elasmobranchs,
the Lake Magadi tilapia (Alcolapia grahami), and the gulf toadfish (Opsanus beta),
metabolize ammonia via the ornithine urea cycle and are (at least facultatively) ureotelic,
excreting nitrogenous waste predominantly as urea (Walsh et al., 2001). In contrast,
terrestrial organisms must conserve water to varying degrees and consequently must invest
energy in the metabolism of ammonia into urea or uric acid (Reviewed in Wright, 1995).
In most fishes, nitrogenous waste is excreted primarily across the branchial (gill)
epithelium as ammonia (Evans et al., 2005; Smith, 1929), although a number of studies
suggest that cutaneous, intestinal, and renal routes may also play a significant role in
ammonia excretion when branchial surface area is reduced or compromised (Reviewed in

3
Wright and Wood, 2012). Krogh (1939) suggested that the excretion of ammonium ion
might be associated with an influx of sodium, especially in freshwater, where the uptake of
sodium is an essential part of osmoregulation. Subsequent investigations indicated that
Na+/NH4+ exchange does occur in freshwater fish, though likely in conjunction with the
diffusion of NH3 across the branchial epithelium (Maetz and Garcia Romeu, 1964). It was
thought that NH3 could readily diffuse across the lipid bilayers and paracellular junctions of
the branchial epitelium and that a favorable diffusion gradient was maintained by the
protonation of NH3 (forming NH4+) with H+ produced by the hydration of CO2 (Wright et al.,
1989). Decades of research evaluating Na+/NH4+ exchange in fish have produced conflicting
results and suggest that in many species Na+/H+ exchange is predominant (Evans, 2011). A
large proportion of ion-transport is accomplished through mitochondrion-rich cells (MRCs),
ionocytes, usually located on the interlamellar surfaces of the gill filament (Evans et al.,
2005). The MRCs of freshwater fish contain Na+/K+-ATPase (NKA) and in saltwater fishes,
the Na+/K+/2Cl- co-transporter (NKCC) is also present (Wilkie, 2002). Due to similarities in
hydrated ionic radii, NH4+ is able to substitute for K+ as a substrate for NKA (Towle and
Holleland, 1987) and NKCC (Good et al., 1984), allowing transport of ammonia across the
basolateral (serosal or blood-side) membrane of the MRCs. The proposition of apical
(mucosal or water-side) Na+/NH4+ exchange has proved more controversial, in part due to
concerns regarding improbable thermodynamics (Evans, 2011; Kumai and Perry, 2011; Tsui
et al., 2009). Prior to recent studies, it was thought that the simple diffusion of ammonia gas
across the lipid bilayers of the branchial epithelium was the major mechanism of NH3
transport, occurring without the need for a specialized ammonia gas channel to facilitate
diffusion (Evans et al., 2005; Wilkie, 2002). However, epithelial cell membrane

4
permeability (especially the apical membrane) to NH3 can be relatively low and may be
insufficient to account for observed excretion rates (Kikeri et al., 1989). The investigation of
additional means of ammonia transport, including ammonia channels, is thus warranted.
Ammonia excretion is likely facilitated by a variety of transcellular and paracellular
mechanisms, both active and passive, but the potential involvement of Rh glycoproteins has
sparked a reevaluation of the mechanisms of ammonia excretion (Reviewed in Weihrauch et
al., 2009; Wright and Wood et al., 2009).
Rh glycoproteins
The relatively recent discovery of Rh glycoproteins as part of a larger superfamily,
including the methylammonium permases and ammonium transporters (MEP/Amt/Rh)
(Huang and Peng, 2005) provides a viable candidate as a potential ammonia channel and is
supported by both functional evidence and sequence homology with the Mep/Amt family of
NH4+ transporters (Marini et al., 1997; reviewed in McDonald et al., 2012). The Rh protein
family includes non-glycosylated proteins (Rh-30 group) involved in blood
immunocompatibility and glycosylated (Rh-50 or Rh glycoprotein) proteins, which are
implicated in ammonia transport (Cherif-Zahar et al., 2007). The Rh-30 proteins were
initially discovered as the pathological agent of erythroblastis fetalis, or hemolytic disease of
the newborn (Levine and Stetson, 1939), and have become an important factor in blood
typing (Westhoff, 2007). However, the physiological function of the Rh-50 proteins was not
known until the characterization of human RhAG expressed in yeast (Marini et al., 2000) and
Xenopus oocytes (Ripoche et al., 2004) and human RhBG expressed in Xenopus oocytes
(Ludewig, 2004) indicated the capacity for ammonia transport.

5
Rh nomenclature allows differentiation of the blood antigens, genes, and the proteins.
In humans, the blood antigens or Rh factors are designated as D, C, or E. Capital letters
denote the RH genes, with or without italics, including erythroid RHD, RHCE, and RHAG,
as well as the non-erythroid homologs, RHBG and RHCG. Proteins are indicated with a
lower-case “h” (RhD, RhCE, RhAG, RhBG, and RhCG). Addition of a “G” to a gene or
protein name denotes glycosylation of the translated protein, thus glycoproteins (Westhoff,
2007). In non-human organisms, only the “R” is capitalized, i.e. Rhcg (Han et al., 2009).
Early bioinformatics analyses predicted that, in most organisms, Rh family proteins
would primarily function as CO2 channels with only residual ammonia transport
functionality left over from the Amt ancestry (Cherif-Zahar et al., 2007). Further predictions
estimated the absence of Rh genes and predominance of Amt in bacteria and plants, likely
due to the benefits of nitrogen uptake imparted by Amt and inefficiency of Rh in low CO2
conditions. The negative effects of nitrogen retention caused by the toxicity of the
metabolically produced nitrogenous wastes in vertebrates may explain apparent retention of
Rh genes, while Amt genes have been lost (Cherif-Zahar et al., 2007). Matassi et al. (1999)
presented evidence for multiple gene duplications within the Rh gene family of primates. The
estimated occurrence of the first duplication event approximately 250-346 million years ago
is thought to have enabled evolutionary divergence between the genes of the Rh-30 and Rh-
50 groups. The apparent functional significance of the Rh-50 genes in ammonia transport
within a variety of distantly related species is thought to have resulted in a slower rate of
evolution and thus higher evolutionary conservation of function relative to the Rh-30 genes,
while relaxed selective pressure may have resulted in a new function and the loss of
glycosylation in the Rh-30 group (Matassi et al., 1999).

6
Non-mammalian vertebrates generally express three groups of Rh isoforms: Rhag,
Rhbg, and Rhcg (Wright and Wood, 2009). Elasmobranchs and some teleost fishes also
express the primitive isoform Rhp2 (Huang and Peng, 2005; Nakada et al., 2010), and the
teleost fish studied to date are known to express two variants (Rhcg1 and Rhcg2) of Rhcg
isoform (Reviewed in Weihrauch et al., 2009); however, invertebrates express the primitive
isoform Rhp1, which has not yet been identified in the vertebrates (Huang and Peng, 2005;
Nakada et al., 2010; Weihrauch et al., 2009).
Rh glycoproteins in fish
Evidence supporting the capacity of Rh glycoproteins to transport ammonia and their
predicted presence in an evolutionarily diverse array of organisms has paved the way for
multiple studies focused on confirming the presence of Rh isoforms and elucidating their role
in the regulation of ammonia excretion in various animal models. Fish are an excellent
model for such investigations as most species generally excrete nitrogenous waste in the
form of ammonia (Ip and Chew, 2010).
Using in-situ hybridization and immunolocalization in gill tissues along with
functional analysis by heterologous Rh glycoprotein expression in Xenopus oocytes, a study
by Nakada et al. (2007a) presented evidence suggesting that the pufferfish (Takifugu
rubripes) utilizes multiple Rh glycoproteins for ammonia excretion. The localization of Rh
glycoprotein mRNA and protein expression in the gill lamellae allowed the development of a
working model for Rh glycoprotein mediated ammonia excretion in pufferfish (Fig. 1). Rhag
was located both apically and basolaterally on pillar cells, facilitating ammonia transport
from the blood to the basal lamina (Fig. 1B). Basolateral expression of Rhbg and apical
expression of Rhcg2 is predicted to facilitate transcellular movement of ammonia across the

7
pavement cell into the water of the gill boundary layer (Fig. 1B). Rhcg1 was located only in
the interlamellar junction of the gill, where it was apically expressed on mitochondrion-rich
cells (MRCs). The substitution of NH4+ for K+ as the substrate of basolaterally expressed
NKA in the MRCs may be utilized in unison with Rhcg1 (Fig. 1C) to transport ammonia out
of the filament epithelium (Nakada et al., 2007a).
Subsequent studies have identified Rh glycoprotein orthologs in multiple saltwater
(Braun and Perry, 2010; Nakada et al., 2010; Rodela et al., 2012) and freshwater (Hung et al.,
2007; Nakada et al., 2007b; Nawata et al., 2007; Tsui et al., 2008) species of fish, although
the localization of branchial expression varies somewhat between species. Based on such
investigations, separate models of branchial ammonia excretion have been developed for fish
in saltwater and freshwater environments.
Saltwater models of branchial ammonia excretion
Based largely on the previously mentioned work of Nakada et al. (2007a), Weihrauch
et al. (2009) proposed a model for ammonia excretion across the branchial epithelium of
marine fishes (Fig. 2). Really, two models are presented, one for pavement cells and one for
MRCs. For pavement cells, the model involves basolaterally located Rhbg and apically
located Rhcg2 as proposed by Nakada et al. (2007a), but adds that significant diffusion of
NH3 and NH4+ likely occurs across the shallow paracellular junction of gill epithial cells in
marine fishes. Weihrauch et al. (2009) suggest that since pavement cells comprise the
majority (greater than 90%) of the surface area of the marine fish gill, they likely provide the
dominant route of branchial ammonia excretion. The proposed MRC model is primarily
focused on the transport of NH4+ into the MRCs via basolaterally located NKA and NKCC
8
and excreted as NH4+ substituted for H+ as the substrate of apically located Na+/H+-
exchanger (NHE-2) or as NH3 by Rhcg1 (Weihrauch et al., 2009).
Nawata et al. (2010) examined the regulation of Rh glycoproteins and ammonia
excretion in pufferfish exposed to high environmental ammonia (HEA). Following an initial
influx, ammonia excretion resumed and was accompanied by downregulation of Rhbg
mRNA and upregulation of Rhcg1 mRNA, suggesting a mechanism to prevent the backflow
of ammonia across pavement cells, while increasing excretion across MRCs. Nawata et al.
(2010) speculated that during HEA, as the NH3 gradient is unfavorable for passive diffusion,
ammonia excretion is likely driven by active mechanisms (basolaterally located NKA and
NKCC-1, as well as apical H+-ATPase and NHE-3) available in the MRCs (Fig. 3). In this
model, it is assumed that most NH4+ is deprotonated prior to excretion via apical Rhcg1. The
backflow of NH3 is further prevented by combination with H+ excreted by H+-ATPase or
NHE-3 (Nawata et al., 2010).
Freshwater models of branchial ammonia excretion
In freshwater fish the excretion of ammonia appears to be associated with the uptake
of Na+ and excretion of H+ and is likely dependent upon multiple Rh glycoproteins (Figs 4, 5;
Weihrauch et al., 2009; Wright and Wood, 2009). Weihrauch et al. (2009) propose a model
utilizing an unspecified combination of Rh glycoproteins in the transcellular movement of
ammonia across the gill epithelium and requires acidification of the gill boundary layer by H+
excretion and CO2 hydration to maintain a favorable ammonia diffusion gradient (Fig. 4).
While diffusion of NH3 may occur across the paracellular junction in freshwater fish, NH4+ is
not likely to cross due to the depth and tightness of the junction (Weihrauch et al., 2009).
9
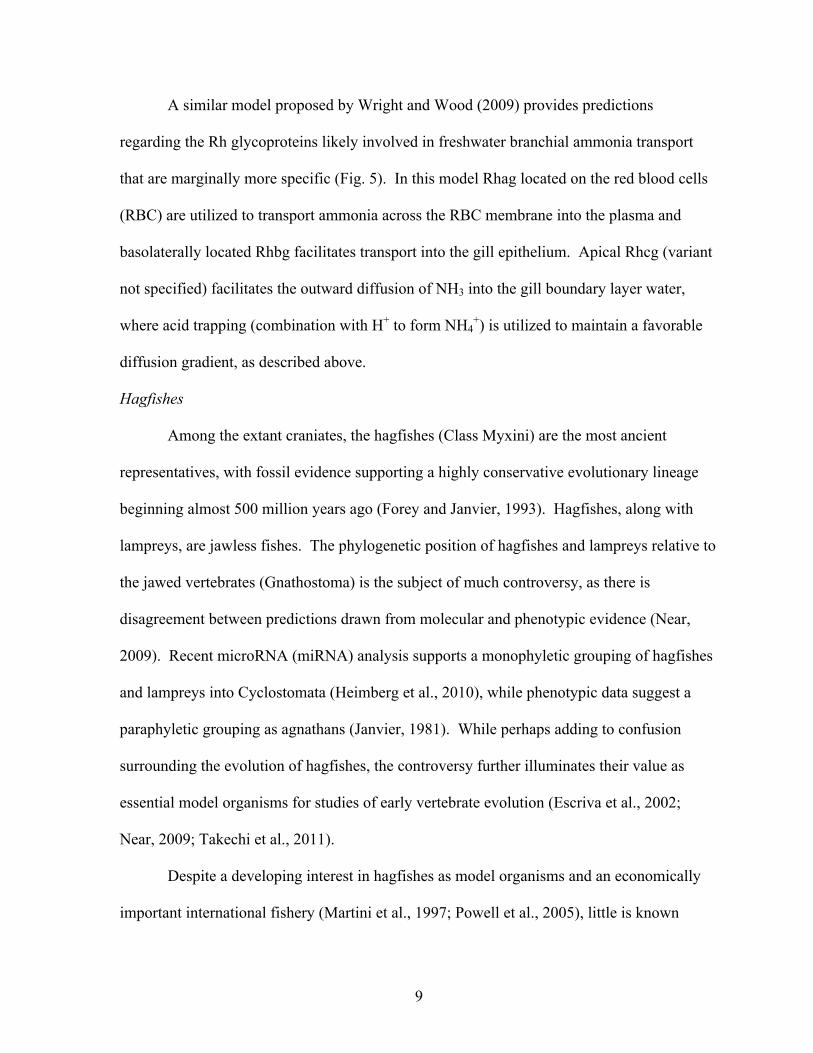
A similar model proposed by Wright and Wood (2009) provides predictions
regarding the Rh glycoproteins likely involved in freshwater branchial ammonia transport
that are marginally more specific (Fig. 5). In this model Rhag located on the red blood cells
(RBC) are utilized to transport ammonia across the RBC membrane into the plasma and
basolaterally located Rhbg facilitates transport into the gill epithelium. Apical Rhcg (variant
not specified) facilitates the outward diffusion of NH3 into the gill boundary layer water,
where acid trapping (combination with H+ to form NH4+) is utilized to maintain a favorable
diffusion gradient, as described above.
Hagfishes
Among the extant craniates, the hagfishes (Class Myxini) are the most ancient
representatives, with fossil evidence supporting a highly conservative evolutionary lineage
beginning almost 500 million years ago (Forey and Janvier, 1993). Hagfishes, along with
lampreys, are jawless fishes. The phylogenetic position of hagfishes and lampreys relative to
the jawed vertebrates (Gnathostoma) is the subject of much controversy, as there is
disagreement between predictions drawn from molecular and phenotypic evidence (Near,
2009). Recent microRNA (miRNA) analysis supports a monophyletic grouping of hagfishes
and lampreys into Cyclostomata (Heimberg et al., 2010), while phenotypic data suggest a
paraphyletic grouping as agnathans (Janvier, 1981). While perhaps adding to confusion
surrounding the evolution of hagfishes, the controversy further illuminates their value as
essential model organisms for studies of early vertebrate evolution (Escriva et al., 2002;
Near, 2009; Takechi et al., 2011).
Despite a developing interest in hagfishes as model organisms and an economically
important international fishery (Martini et al., 1997; Powell et al., 2005), little is known

10
regarding the ecology, life history, and physiology of the Atlantic hagfish (Currie and
Edwards, 2010; Weihrauch et al., 2009). Only recently have observations of embryos of the
inshore hagfish, Eptatretus burgeri (Ota et al., 2007), and examination of the seasonal
variations in reproductive steroids of the Atlantic hagfish, allowed a rudimentary
understanding of hagfish developmental and reproductive biology (Powell et al., 2004;
Powell et al., 2005). In contrast to most vertebrates, hagfishes are marine osmoconformers
and were assumed to be ionoconformers (Evans, 1984). However, recent investigation of
ionoregulation in Pacific hagfish suggests that while hagfish do ionoconform in regard to Na+
and Cl-, they appear to regulate plasma [Ca2+] and [Mg2+] to about half that of seawater
(Sardella et al., 2009). Atlantic hagfish are important players in the substrate turnover and
nutrient recycling of ocean-floor ecosystems (Lesser et al., 1996) as they spend significant
amounts of time burrowed in the anoxic substrate and feed opportunistically on marine
carrion (Martini et al., 1997; Strahan, 1963). These behaviors create the potential for
exposure to conditions of hypoxia or even anoxia, low pH, elevated CO2 and most relevantly,
HEA (Braun and Perry, 2010; Weihrauch et al., 2009). Understanding the physiological
adaptations that enable Atlantic hagfish to tolerate such extreme conditions may provide
insight to the evolutionary history of ammonia excretion mechanisms in the invertebrate to
vertebrate transition. In the context of comparative physiology, such knowledge could be
applied to develop solutions to the problems suffered by less tolerant organisms exposed to
similar extreme conditions (Wright and Wood, 2012).
Ammonia excretion in hagfishes
Evans (1984) evaluated Na+/H+ exchange as a mechanism of acid-base regulation in
Atlantic hagfish and discovered that hagfish exposed to Na+-free seawater underwent no

11
change in ammonia excretion rates, suggesting that the Na+/NH4+ exchange demonstrated in
various freshwater and saltwater teleosts may not be utilized in Atlantic hagfish. However,
the apparent presence of Na+/H+ exchange in the osmoconforming and ionoconforming
Atlantic hagfish led Evans (1984) to suggest that acid-base regulation evolved before
osmoregulation and the invasion of freshwater by vertebrates. Subsequent work confirmed
Na+/NH4+ exchange as a mechanism of acid-base regulation in the Atlantic hagfish and
suggested the involvement of an apical NHE in the gill (McDonald et al., 1991), which was
supported at the molecular level by Edwards et al. (2001). Multiple studies have identified
and localized NKA in hagfish MRCs (Bartels, 1988; Choe et al., 1999; Mallat et al., 1987).
Further investigation of ion-transport in Pacific hagfish resulted in the identification and
localization of H+-ATPase, NKA, and NHE2 all in single MRCs (Tresguerres et al., 2006)
and suggested involvement in acid-base regulation (Tresguerres et al., 2007). Thus, it is
thought that the hagfishes are unique among aquatic craniates and all studied vertebrates in
possessing a single MRC utilized for both acid and base excretion and that MRCs are
devoted to acid-base regulation and not ionoregulation (Brauner and Baker, 2009; Wright,
2007). Hagfish MRCs are distributed singularly, sandwiched between pavement cells and
apparently have a tight paracellular junction (Mallat et al., 1987) that would not likely allow
the leaking of NH4+ described in other marine fishes (Wright, 2007). Although the ion-
transporters (NKA, NKCC, NHE) implicated in ammonia excretion by teleost fishes are also
present in hagfishes, the evidence against Na+/NH4+ exchange (Evans, 1984) in the Atlantic
hagfish only emphasizes the need to investigate Rh glycoproteins in hagfishes.
Experiments conducted by Braun and Perry (2010) examined the potential role of Rh
glycoproteins and urea transporter (UT) proteins in nitrogen excretion in the Pacific hagfish

12
(Eptatretus stoutii). Ammonia excretion rates and plasma ammonia levels were analyzed
following either exposure to HEA or injection with NH4Cl (excluding treatments related to
urea). Exposure to 20 mM HEA initiated an influx of ammonia (almost 50 µmol N g-1 h-1),
which diminished gradually over 9 hours and was reversed to an efflux (over 10 µmol N g-1
h-1) when fish were returned to normal seawater. Despite ammonia uptake, the consequent
increases in plasma ammonia levels were limited, suggesting either ammonia metabolism to
urea or the excretion of ammonia against a gradient created by HEA, each of which is
supported by increased plasma urea and decreased ammonia uptake rates over time during
HEA. Injections of NH4Cl resulted in impressive ammonia excretion rates (over 40 µmol N
g-1 h-1 during the three hours following injection). However, ammonia excretion rates were
calculated for a relatively coarse spatial resolution (3 hour intervals) and observations were
terminated too early to determine if excretion rates in ammonia loaded hagfish would
equilibrate or return to basal levels. The study did not investigate Rh glycoproteins at the
molecular level, but instead utilized heterologous antibodies raised against teleosts to detect
Rhag, Rhbg and Rhcg1 protein expression, while only Rhbg and Rhcg1 were
immunolocalized due to non-specific immunoreactity in Rhag immunoblots. Still, protein
expression was not quantified for any Rh glycoproteins and the use of heterologous
antibodies may have yielded inconclusive immunolocalization (Braun and Perry, 2010).
To further develop the evolutionary context of Rh glycoproteins and their role in the
regulation of ammonia excretion in craniates, the investigation of Rh isoforms in the Atlantic
hagfish would provide valuable information regarding the evolutionary history of ammonia
excretion across the invertebrate to vertebrate transition. Recent molecular cloning of the
Rhcg and Rhbg isoforms in the Atlantic hagfish (Edwards and Walsh, unpublished) has

13
allowed the development of hagfish specific probes for in situ hybridization (Edwards,
unpublished) and enables the subsequent development of hagfish specific primers and
homologous antibodies for the quantification and localization of both molecular and protein
expression.
Purpose of study
We hypothesize that the expression of Rh glycoprotein mRNA and protein are
upregulated in response to experimentally elevated plasma ammonia concentrations in the
Atlantic hagfish. We propose three objectives to evaluate this hypothesis:
1. Determine the effect of experimentally elevated plasma ammonia concentration
on ammonia excretion in Atlantic hagfish
2. Quantify Rh glycoprotein mRNA expression in gill and skin tissues in response to
experimentally elevated plasma ammonia concentrations
3. Develop a homologous Rhcg antibody for the quantification and localization of
protein expression
We predict that experimentally elevated plasma ammonia levels will cause increased
ammonia excretion correlating with increased expression of Rh glycoprotein mRNA
transcripts.
14
Methods
RNA isolation and cDNA synthesis
Total RNA was isolated from gill and skin tissues of M. glutinosa by homogenization
in 1 ml of TRI-reagent (Molecular Research Center, Inc. Cincinnati, Ohio) for every 50-100
mg of tissue, followed by separation and extraction using bromochloropropane, then
precipitation in isopropanol. The resulting RNA precipitate was pelleted by centrifugation at
12,000 g for 8 minutes at room temperature and washed using 75% ethanol. The washed
RNA pellet was solubilized in HyClone molecular grade water (Thermo Fisher Scientific,
Rockford, IL). The purity and concentration of solubilized total RNA were assessed by
measuring sample absorbance at 260/280 nm by spectroscopy (Nanodrop 2000, Thermo Fish
Scientific, Rockford, IL). First strand complementary DNA (cDNA) was synthesized from 5
ug total RNA using Superscript III reverse transcriptase enzyme primed with an Oligo-dT
primer (Invitrogen, Carlsbad, CA).
Reverse transcriptase polymerase chain reaction (RT-PCR)
Previous work by Edwards and Walsh (unpublished) utilized a combination of RT-
PCR and RACE (rapid amplification of cDNA ends) PCR to clone the hagfish Rhcg (Fig. 6;
GenBank accession number GU73440) and Rhbg (Fig. 7; GenBank accession number
GU73441). Atlantic hagfish specific primers (Table 1) were designed based on these
sequences to allow amplification of Rhbg and Rhcg cDNAs across a predicted, non-

15
conserved intron–exon boundary. Primers were also designed to target ribosomal protein
18S (Table 1) for use as an endogenous control in the relative quantitation of Rhcg and Rhbg
mRNA by subsequent quantitiative RT-PCR (qRT-PCR). A hot start PCR (Platinum Taq,
Invitrogen Carlsbad, CA) of 25 ul volume was incubated using a MJ Mini personal thermal
cycler (Bio-Rad, Hercules, CA). PCR reagent concentration for all reactions was 3 mmol l-1
MgCl, 200 umol l-1 dNTP mix, 10mmol l-1 for each primer and 1.25 units Platinum Taq. An
initial incubation at 94°C for 2 minutes allowed activation of the Platinum Taq polymerase.
This was followed by 36 cycles of melting at 94°C for 30 seconds, annealing at 60°C for 30
seconds, extension at 72°C for 60 seconds, and a final extension time of 72°C for 10 min.
The PCR products were analyzed by gel electrophoresis (1% agarose in a 1X TBE buffer,
45mM Tris borate, 1 mM EDTA) stained with ethidium bromide and visualized by trans-
illumination with UV light.
Molecular cloning and sequencing
Amplicons of appropriate sizes (Table 1) were ligated into the pCR2.1-TOPO
plasmid vector (Invitrogen, Grand Island, NY) and transformed into competent One Shot®
TOP10 chemically competent Escherichia coli cells (Invitrogen, Carlsbad, CA). Cells were
plated onto LB agar plates containing 50 µg ml-1 ampicillin (Thermo Fisher Scientific,
Rockford, IL) and 40 µg ml-1 X-gal (Promega, Madison, WI) and incubated at 37°C
overnight. Positively transfected clones were selected by blue/white colony screening and
cultured in LB broth (5 µg ml-1 ampicillin). Plasmid DNA was isolated using a FastPlasmid
miniprep kit (5 Prime Inc., Gaithersburg, MD) and analyzed by restriction enzyme digest
using EcoR1 and agarose gel electrophoresis. Clones containing an insert were combined
with forward or reverse sequencing primers and sequenced on an ABI PRISM 3100 genetic

16
analyzer (Applied Biosystems, Foster City, CA) at Mount Desert Island Biological
Laboratory, Salisbury Cove, ME to confirm that primers were specific to the appropriate Rh
glycoprotein cDNAs.
Phylogenetic analysis
Relevant Rh glycoprotein sequences were retrieved from the GenBank database using the
standard BLAST algorithms available from the National Center for Biotechnology (NCBI).
An alignment of translated amino acid sequences was carried out using the ClustalW
algorithm (Thompson et al., 1994) in MacVector 12.6 (MacVector, Cary, NC). Phylogenetic
reconstruction of the multiple sequence alignment used a neighbor joining algorithm and
bootstrap calculation (1000 replications) with Poisson-corrected distances and proportionally
distributed gaps. The resulting tree was rooted to the Chlamydomonas reinhardtii Rhp1.
Experimental design and animals
A sample of 79 Atlantic hagfish, ranging from 40-115 g wet mass (see Table 2), were
obtained from the Bay of Fundy by commercial fisherman and maintained in a covered flow-
through aquarium with 7 – 12˚C running seawater at Mount Desert Island Biological
Laboratory (MDIBL), Salisbury Cove, Maine. All hagfish were held without feeding for at
least 2 weeks prior to experimentation. Individuals were randomly assigned to control
(N=38, sham-injected) or experimental (N=38, ammonia-injected) groups. Samples were
also collected from individuals that were subjected to identical conditions, but were not
injected (N=3) to provide basal physiological data. Experiments were conducted to allow
repeated collection of water samples following injections and terminal tissue sampling from
three to five individuals of each group over 0.25, 0.5, 1, 2, 4, 8, 12, and 24 hour durations.

17
All animal research activities were approved by institutional animal care and use committees
(IACUC) at both MDIBL and Appalachian State University.
Injections
Individuals were placed into continuously circulated, aerated seawater in 1 L
darkened containers for an acclimation period of 12 hours. Containers were housed in a
continuously circulating seawater bath to maintain consistent water temperature (7 - 12˚C).
Prior to injections, individuals were lightly anesthetized using 40 mg ml-1 MS-222 (Finquel,
Argent Chemical Laboratories, Redmond, Washington) to reduce slime production during
handling. The protocol of Braun and Perry (2010) was followed to experimentally elevate
plasma ammonia concentrations by injection of 100 mM NH4Cl dissolved in seawater at a
pH 7.8 into the caudal subcutaneous sinus. Injection volumes were calculated to elevate
plasma ammonia concentration to an estimated 10 mM NH4Cl, by assuming 30% of whole
organism mass to be extracellular fluid (Braun and Perry, 2010). Control individuals were
injected with a seawater sham (~34 ppt) at a pH 7.8 into the caudal subcutaneous sinus, with
sham volumes calculated identically to NH4Cl injections. Following injection, individuals
were inverted several times to insure mixing of the injected bolus into circulating plasma
prior to returning to their respective containers.
Water sampling
Seawater within containers remained aerated throughout the duration of each
experiment, but circulation was stopped prior to returning injected individuals to containers
to allow static water sampling. Water samples (2 ml) were obtained from each container just
prior to and during hagfish occupancy at all time-points occurring within the respective
experimental duration (0.25, 0.5, 1, 2, 4, 6, 8, 12, and 24 hours following injection). Water

18
samples were frozen and stored at -20˚C for the subsequent determination of total ammonia
concentrations.
Sacrifice and tissue sampling
Experiments were terminated after the appropriate duration by a lethal dose (80 mg
ml-1) of MS-222 (Finquel) administered to each container. Following the termination of life,
1-2 ml of blood was drawn from the caudal sinus of each hagfish using a heparinized needle
and syringe. Blood samples were then centrifuged at 12,000 g for 1 minute to separate
plasma. The plasma layer was removed, snap-frozen in liquid nitrogen and stored at -80˚C
prior to ammonia determination. Gill, skin, intestine (upper and lower), and kidney tissues
were collected and either snap-frozen in liquid nitrogen and stored at -80˚C for subsequent
RNA and protein isolation or fixed in 4% paraformaldehyde in phosphate buffer for
immunohistochemical analysis.
Water ammonia profile
Water samples were analyzed, in triplicate, to determine the total ammonia
concentration (TAmm) by a micro-plate modification of the phenol-hypochlorite method
(Weatherburn, 1967). It should be noted that the determination of total ammonia includes
both NH4+ and NH3, thus no quantitative distinction will be made. Standard solutions ranging
from 5 to 200 mM NH4Cl were prepared in seawater. Sample absorbance was measured at
640 nm with a Bio-Tek Powerwave plate reader (Thermo Fisher Scientific, Rockford, IL)
and VersaMAX plate reader (Molecular Devices, Sunnyvale, CA). Net flux rates (µmol kg-1
h-1) of TAmm were calculated as:
𝐽!"" = ( 𝑇!"" ! − 𝑇!"" !)×𝑉/(∆𝑡×𝑀) (1)

19
where [TAmm]i and [TAmm]f are initial and final TAmm concentrations (µmol l-1) in the water, V
is the volume of water (l) in the container during the flux period, ∆t is the time elapsed (h)
during the flux period and M is the mass of the fish (kg). A positive JAmm indicates net
excretion and a negative value indicates net uptake of ammonia. Data analysis was
performed with Microsoft Excel 2010.
Plasma ammonia profile
A 200 µl aliquot of each plasma sample was deproteinized in two volumes of 8%
perchloric acid, vortexed and centrifuged at 16,000 g for 10 minutes (4°C). The supernatant
was neutralized with saturated KHCO3 and centrifuged at 16,000 g for 10 minutes (4°C).
Using the final deproteinized supernatant, ammonia concentrations (µg ml -1) were
established in triplicate using a micro-plate modification of the L-glutamate dehydrogenase
assay (Sigma AA0100, St. Louis, MO). The absorbance of each sample was measured at 340
nm following incubation (~ 5 minutes) with the ammonia assay reagent and again
approximately 5 minutes after the addition of L-glutamate dehydrogenase enzyme. Sample
absorbance was measured with a VersaMAX plate reader (Molecular Devices, Sunnyvale,
CA). The mean total ammonia concentration for each sample was calculated using Microsoft
Excel 2010.
Quantitative RT-PCR (qRT-PCR)
The relative expression of Rhcg and Rhbg mRNA was quantified in gill and skin
tissues of sham-injected and ammonia-injected individuals using the previously mentioned
Atlantic hagfish specific primers (Table 1). The quantification of Rhcg and Rhbg mRNA
expression for individuals in experiments of durations longer than 8 hours following injection
were deemed unnecessary, as plasma ammonia concentrations and the net flux of ammonia

20
were not significantly different between sham-injected and ammonia-injected individuals in
subsequent time-points. The ribosomal protein 18S was used as an endogenous control for
the 2(-ΔΔCt) method (Pfaffl, 2001). Each sample was analyzed in triplicate using 25 ng of
template cDNA, 70 nmol of each forward and each reverse primer, 0.5 µl of ROX reference
dye diluted 1:10 and SYBR® GreenER SuperMix-UDG (Invitrogen, Carlsbad, CA) in a total
volume of 25 µl. Amplification of the desired product was confirmed using melt curve
analysis. Relative mRNA expression in ammonia-injected individuals was normalized to that
of the sham-injected individuals from the same experiments (time durations). Threshold
cycle (Ct) was determined for each sample using ABI Systems 7500 software. Analysis of
relative mRNA expression using the 2(-ΔΔCt) method (Pfaffl, 2001) was conducted using
Microsoft Excel 2010.
Antibody production
Commercially synthesized Myxine specific Rhcg peptide was developed from Rhcg
amino acid sequence 419-434 (CYEDRAYWEVPEEEVTY) (Bio-Synthesis, TX). The
polyclonal Rhcg antibody was prepared in-house at Appalachian State University. A single
New Zealand white rabbit (Oryctolagus cuniculus) was inoculated with a total of 5 injections
of 1-1.5 mg (0.5 ml, 2-3 mg/ml) of purified peptide over a 15-week period. Following the
initial subcutaneous injection, three subsequent “booster” injections were intramuscularly
administered at a single site. Blood was collected by 4-5 ml blood draws 7 days after each
immunization to determine antibody titer and a terminal bleeding at the end of the 15-week
immunization period to harvest immune serum. All blood was clotted overnight in sterile
glass tubes at 4°C, followed by two centrifugations (10 min., 10,000 g) to separate immune
serum. Antibody titer was assessed by enzyme-linked immunosorbent assay (ELISA).

21
Western blotting
Protein was isolated from frozen hagfish gill tissues. Tissues were placed in buffer
(0.18g Tris-base, 4.28g sucrose, 0.5ml 100mM EDTA, pH 7.8) and homogenized in
polypropylene tubes on ice. The homogenate was centrifuged at 4˚C to separate a protein
fraction. The protein fraction was removed and total protein concentration was quantified
using a BCA (bicinchoninic acid) protein assay (Thermo Scientific, Rockford, IL). Protein
samples (50µg) were loaded in Tris-HEPES polyacrylamide gels (NuSep, Homebush,
Australia) and separated by SDS-PAGE (sodium dodecyl sulfate, polyacrylamide gel
electrophoresis). Separated proteins were transferred to Immobilon-P polyvinylidene
difluoride (PVDF) membranes (Millipore). Membranes were blocked overnight at 4°C in
5% blotto (5% nonfat dry milk powder in 0.1M Tris-buffered saline with 0.2% Tween-20).
Membranes were then incubated in 5% blotto (negative control), homologous Rhcg antibody
(1:5000) in 5% blotto (positive control), or homologous Rhcg antibody preabsorbed 1:10 and
1:20 with purified Rhcg peptide (1:5000) in 5% blotto overnight at room temperature.
Following three washes (0.1M Tris-buffered saline with 0.2% Tween-20 (TBST)),
membranes were incubated with HRP (horseradish peroxidase)-conjugated goat anti-rabbit
antibody (1:10,000) and Precision Protein StrepTactin-HRP conjugate (Bio-Rad, Hercules,
California, USA) in TBST at room temperature for one hour. Unbound secondary antibodies
were removed with three additional washes in TBST and a final wash in TBS (no Tween-20).
Immunoblotted membranes were then prepared using an enhanced chemiluminescence
system (Bio-Rad) and developed on Amersam Hyperfilm ECL X-ray film (GE Healthcare,
Little Chalfont, United Kingdom).
22
Statistical analysis
Data are presented as the mean ±1SEM (one standard error of the mean). Hypotheses were
tested using an appropriate two-sample t-test (α=0.05; Student’s t-test if variances were
homoscedastic; Welch’s t-test if variances were heteroscedastic) for the comparison of two
means within each time-point.

23
Results
RT-PCR and phylogenetic analysis
RT-PCR using Atlantic hagfish specific primers yielded a single product of the
expected size (Table 1) for each target primer set (ribosomal protein 18S, Rhcg, and Rhbg) in
gill and skin tissues (Fig. 8). No detectable product was produced in the RT-PCR reactions
containing no cDNA template (no-template control, NTC, Fig. 8).
Phylogenetic reconstruction (Fig. 9) produced separate clades for Rhcg and Rhbg
lineages and, with the exception of the stickleback (Gasterosteus aculeatus) Rhp2 grouping
with Rhbg, the Rhp isoforms group ancestrally. Rhp1 from the crab, Carcinus maenas, was
grouped ancestrally to Rhcg and Rhbg clades, as well as the zebrafish (Danio rerio) Rhp2.
Water ammonia profile
Cumulative total ammonia was significantly elevated (P<0.05) in the environmental
water of individuals injected with 100 mM NH4Cl at all observed time points following
injection, reaching 2,212.79±11.00 µmol kg-1 by 24 hours post-injection (Fig. 10).
Cumulative ammonia concentrations in the environmental water of control individuals
increased over time to 637.78±15.85 µmol kg-1 by 24 hours following sham injection.
Efflux of ammonia was observed across all time-points for both sham and ammonia-
injected hagfish. Individuals injected with ammonia exhibited a significantly increased
(P<0.05) rate of ammonia efflux (relative to sham-injected individuals) up to 4 hours post-

24
injection. The largest efflux (2895.06±496.29 µmol kg-1 h-1) occurred within the 0.25 hours
following injection (Fig. 11). There were no significant differences in ammonia efflux
between sham and ammonia-injected groups from 4-6 hours post-injection and throughout all
subsequent time-points.
Plasma ammonia profile
The concentration of total ammonia detected in the plasma of ammonia-injected
hagfish was significantly higher than in sham-injected individuals at all times points, except
8 hours post-injection (Fig. 12). Plasma ammonia concentrations were most elevated at 0.25
hours following injection (11.89±1.56 µg ml-1), but generally decreased over time relative to
concentrations observed in sham-injected individuals. Plasma ammonia levels were not
significantly different between groups at 8 hours post-injection. However, plasma ammonia
did significantly increase (P=0.008) again in ammonia-injected hagfish to 2.29±0.41 µg ml-1
at 12 hours post-injection (Fig. 12).
qRT-PCR
The relative expression of Rhcg mRNA was significantly altered (P<0.05) in the gill
tissues of ammonia-injected individuals at all time points (Fig. 13). Rhcg mRNA expression
was increased 5.2±-fold and 7.9±-fold above the sham-injected group expression at 0.25
hours and 0.5 hours after injection, respectively. From 1 hour post-injection onward, Rhcg
mRNA expression in ammonia-injected individuals was less than half that of sham-injected
individuals.
Expression of Rhcg mRNA in skin tissue was significantly altered in ammonia-
injected individuals, with a 6.17±0.0-fold elevation above the sham injected group at 0.5
hours (P=0.002) and less than one fifth of sham-injected expression at 4 hours

25
(P=0.0000165) post-injection (Fig. 14). The differences in Rhcg mRNA expression in skin
tissue at the other time-points were not statistically significant.
The expression of Rhbg mRNA in the gill tissue of ammonia-injected hagfish was
significantly elevated relative to the sham-injected group at 0.25 (2.16±0.58-fold, P=0.012)
and 0.5 hours (2.24±0.40-fold, P=0.015) post-injection (Fig. 15). Rhbg mRNA expression
in the ammonia-injected group was less than half that of sham-injected group expression at 1,
4, and 8 hours post-injection (P<0.005). Gill expression of Rhbg mRNA was not
significantly different between treatments at 2 hours post-injection. Expression of Rhbg
mRNA in skin tissue was not reliably detectable using the methods described above and data
are not shown.
Western blotting
Atlantic hagfish gill protein immunoblots treated with no primary antibody (negative
control) did not present the immunoreactive protein at 37 kDa (Fig. 16A). The positive
control (Fig. 16B) had a prominent band at approximately 37 kDa and this band is
diminished in immunoblots treated with Rhcg antibody preabsorbed with peptide at 1:10
(Fig. 16C) and 1:20 (Fig. 16D) ratios.

26
Discussion
This is the first study to quantify Rhcg and Rhbg mRNA expression in the Atlantic
hagfish, Myxine glutinosa. Our primary objective was to investigate the potential role of Rh
glycoproteins in ammonia excretion by examining differential expression of Rh glycoprotein
mRNA between hagfish with experimentally elevated plasma ammonia levels and hagfish
with baseline plasma ammonia levels. We hypothesized that increased plasma ammonia
concentrations would result in an efflux of ammonia associated with increased expression of
Rhcg and Rhbg mRNA transcripts, which would then be translated into proteins involved in
facilitating the transport of ammonia. The presented results provide support for our
hypothesis. The injection of ammonia elevated plasma ammonia concentrations (Fig. 12)
and resulted in a striking and nearly immediate efflux of ammonia (Fig. 11) that correlates
with the early upregulation of Rhcg in gill (Fig. 13) and skin (Fig. 14), as well as Rhbg in gill
(Fig. 15).
Evolutionary context of hagfish Rh glycoproteins
Phylogenetic reconstruction (Fig. 9) of Atlantic hagfish Rhcg and Rhbg lineages
relative to Rhcg, Rhbg, Rhp2 and Rhp1 isoforms in a small selection of other organisms
corroborates the phylogenetic position of hagfishes as basal to the vertebrates, suggesting
that hagfish Rhcg and Rhbg are ancestral to their respective isoforms in the higher
vertebrates. The primitive isoform Rhp2 in the zebrafish (Danio rerio), although present in a

27
teleost fish, appears to be ancestral to the hagfish Rhcg and Rhbg, as would be expected
given the results of Huang and Peng (2005). Rhp1 and Rhp2 have not yet been identified in
the Atlantic hagfish.
Ammonia excretion in response to elevated plasma ammonia
The cumulative ammonia profile (Fig. 10) of ammonia-injected hagfish illustrates an
obvious accumulation of environmental ammonia relative to that of sham-injected
individuals, indicating an outward flux of ammonia (Fig. 11). Sham-injected hagfish also
demonstrate an outward flux and accumulation of ammonia, although to a much lesser degree
than ammonia-injected hagfish (Figs 10, 11).
The highest rates of ammonia efflux occurred within the first hour following injection
(Fig. 11), suggesting that Atlantic hagfish are either readily equipped for remarkable
ammonia excretion (more the 10X that of sham-injected fish) or that the necessary protein
components may be assembled very rapidly to facilitate increased ammonia excretion. Initial
concerns were raised that injected NH4Cl might be leaking out from the site of injection;
however, these concerns were alleviated as no leakage was observed following injection as
outlined in the methods, but with the addition of colored food dye. McDonald et al. (1991)
reported ammonia excretion rates of nearly 1400 µmol N kg-1 h-1 over the first 0.5 hour
following 4 mmol kg-1 infusion of ammonia as (NH4)2SO4, which was a 7-fold increase over
resting ammonia excretion rates. For comparison, ammonia excretion rates in the current
study, calculated over the first 0.5 hour following injection, were 1558.766±89.786 µmol N
kg-1 h-1 (nearly a 7.5-fold elevation from control ammonia excretion rates during the same
period) following a 3 mmol kg-1 infusion of ammonia as NH4Cl. This suggests a slightly
higher rate of excretion in the current study, even with the infusion of a lesser ammonia load.

28
Ammonia excretion rates in ammonia-injected hagfish gradually diminished to sham-injected
levels by 6 hours post-injection, with a parallel reduction in plasma total ammonia
concentrations by at least 8 hours post-injection (plasma samples were not obtained at 6
hours post-injection). However, the maximum accumulated total ammonia concentration in
ammonia-injected hagfish, occurring at 24 hours post-injection, was 2.2 mmol kg-1, almost
74% of the 3 mmol kg-1 load introduced by injection. The net remaining 0.8 mmol kg-1 of
total ammonia was not excreted into the environmental water, however, was apparently
eliminated from the plasma. To account for this part of the ammonia load, we suggest
multiple possible fates. Wilkie and Wang (1999) reported significantly elevated total
ammonia concentrations in the muscle tissue of another agnathan fish, the sea lamprey
(Peromyzon marinus), relative to plasma concentrations, suggesting that the muscles may
serve as a reservoir to reduce circulating plasma ammonia concentrations. It is possible that
a similar mechanism could be utilized in the Atlantic hagfish. Braun and Perry (2010)
demonstrated elevated urea excretion in Pacific hagfish injected with ammonia and exposed
to HEA. Although it is not known whether Atlantic hagfish possess the enzymes involved in
the metabolism of ammonia into urea, it is possible that the remaining ammonia load in the
current study could have been converted to urea and excreted. However, urea concentrations
were not measured in the current study.
Prior to this study little was known about the Atlantic hagfish’s ability to excrete
ammonia (Evans, 1984; McDonald et al., 1991); given its known burrowing and feeding
behaviors (Martini et al, 1997) the ability to rapidly excrete ammonia in less than favorable
conditions would likely be advantageous and thus not surprising. Atlantic hagfish spend the
majority of their life burrowed in hypoxic (or even anoxic) ocean-floor substrate and may

29
remain there for days at a time (Strahan, 1963). Although gut-content analysis has shown
that Atlantic hagfish may feed primarily on shrimp and other invertebrates (Shelton, 1978),
they are known to opportunistically feed on the carcasses of whales and teleost fishes.
Hagfishes are able to tear away and consume exterior portions of a carcass, but are perhaps
more likely to enter through an orifice to feed while burrowed in the rotting flesh (Strahan,
1963). Burrowing in substrate and feeding within carcasses probably reduces gas exchange
and is likely to upset acid-base balance (Brauner and Baker, 2009). Conditions within a
carcass likely include low O2, high CO2, low pH, and HEA (Currie and Edwards, 2010;
Weihrauch et al., 2009). Extended exposure to hypoxic/anoxic conditions is allowed by
multiple physiological adaptations in the hagfishes, including exceptionally low metabolic
rates and energetic requirements, as well as cutaneous respiration (Lesser et al., 1996). Due,
at least in part, to a common mechanism of neurotoxicity between hypoxia and ammonia
(glutamine excitotoxicity), fishes that are tolerant of hypoxia are often ammonia tolerant, as
well (Walsh et al., 2007). Pacific hagfish are apparently tolerant to both internal ammonia
loads and HEA exposure, surviving more than 72 hours of exposure to 100 mM NH4Cl
(Braun and Perry, 2010). Atlantic hagfish in the current study were tolerant of a 3mmol kg-1
infusion of ammonia as NH4Cl, apparently eliminating the internal ammonia load and
surviving for 24 hours post-infusion.
Rh glycoprotein mRNA expression in gill tissue
We hypothesized an increase in gill Rhcg and Rhbg mRNA expression in response to
elevated plasma ammonia, if these isoforms indeed do have a role in ammonia excretion.
Our results show increased Rhcg and Rhbg mRNA expression in ammonia-loaded fish prior
to 1 hour post-injection. This is not necessarily surprising, as elevated plasma ammonia may

30
serve as a stimulus for the increased production of Rh glycoproteins and may suggest that the
expression of Rh glycoprotein mRNA is tightly regulated in response to ammonia infusion.
Evidence presented by Nawata and Wood (2008) supports the upregulation of branchial
Rhcg1, Rhcg2, and Rhbg mRNA expression in response to ammonia infusion in freshwater
rainbow trout. However, they suggest that a combination of elevated plasma ammonia and a
temporary pulse of cortisol may be key to Rh mRNA regulation. Atlantic hagfish plasma
cortisol levels were not assessed in the current study due to a long-standing controversy
regarding the active corticosteroid in hagfish (Weisbart and Idler, 1970). Atlantic hagfish
Rhcg mRNAs were downregulated at 1 hour and subsequent time-points in ammonia-
injected hagfish (Fig. 13), despite elevated plasma ammonia concentrations and ammonia
excretion rates up to 4 hours following ammonia-injection. Regulation of branchial Rhbg
mRNA expression (Fig. 14) followed a similar pattern, with significant upregulation in
ammonia-injected hagfish at 0.5 hours post-injection, followed by either downregulation or
no significant difference in expression relative to sham-injected hagfish at all subsequent
time-points. This pattern of regulation suggests an immediate response to elevated plasma
ammonia that is subsequently altered in response to additional factors. Among the possible
stimuli inducing the downregulation of Rh mRNA expression is HEA (Nawata et al., 2010).
Rh glycoproteins may transport ammonia bi-directionally (Marini et al., 2000) and thus could
potentially allow back (inward) flux of ammonia during a reversed diffusion gradient caused
by HEA. As mentioned above, this hypothesis was evaluated by Nawata et. al. (2010) in
marine pufferfish (Takifugu rubripes) exposed to HEA. Pufferfish exposed to 1 mmol l-1
HEA downregulated Rhag mRNA expression after 6 hours and downregulated Rhbg mRNAs
after 24 hours of exposure. However, the authors did not perform quantification of Rh

31
protein expression, due to the presence of multiple non-specific bands in western blot
analysis. Interestingly, Rhcg1 mRNA expression, as well as that of NKCC1, NKA, NHE3,
and H+-ATPase, was upregulated in response to HEA. This led Nawata et al. (2010) to
propose that, after prolonged HEA exposure, ammonia transport may shift from a
dependence on passive transport via Rh glycoproteins to active transport by the recruitment
of ion-transporters in MRCs (see description of MRC model above and Fig. 3). It is
conceivable that accumulated HEA could stimulate downregulation of branchial Rhcg and
Rhbg mRNA expression in ammonia-injected hagfish, even while plasma ammonia
concentrations and ammonia excretion rates both remain elevated above sham-injected levels
as a protective mechanism to reduce the backflow of ammonia as in Nawata et al. (2010).
Quantification of protein expression from individuals in this study was conducted by
Edwards (unpublished) using the previously described homologous Rhcg antibody and
suggests that upregulated Rhcg mRNA in ammonia-injected hagfish was translated to
protein. Rhcg protein expression was significantly elevated (P<0.05) by 2 hours post-
injection and remained significantly elevated through 8 hours post-injection in ammonia-
injected hagfish (Fig. 17). In ammonia-injected hagfish, the highest protein expression
(relative to sham-injected individuals) of Rhcg occurred at 8 hours post-injection, after
plasma ammonia and ammonia excretion rates were reduced to control levels at (Fig. 17).
This suggests that branchial Rhcg mRNA that was upregulated at 0.25 and 0.5 hours post-
injection was still being translated into protein at 8 hours post-injection. The mRNA and
protein turnover rates of hagfish Rhcg are unknown and thus it is difficult determine the
specific temporal relationships between the transcriptional regulation of Rhcg, protein
expression and ammonia excretion rates over the time course of this study (Sashaw et al.,

32
2010). However, the current study and the protein expression analysis discussed above
provide the first insights into the regulation of potential Rhcg mediated ammonia excretion
from the transcript to protein levels. A possible scenario is that the Atlantic hagfish may be
equipped for an immediate response to elevated plasma ammonia by utilizing existing Rhcg
glycoproteins, while immediately increasing expression of Rhcg mRNA transcripts to
replenish Rh glycoprotein stores prior to actual protein turnover.
Localization of Rhcg in the gill tissue using the same homologous Rhcg antibody
(Figs 18A, B) demonstrates a basolateral staining pattern associated with the branchial
epithelium closest to the blood margin (Pray, 2013, unpublished thesis). The structure of
hagfish gills is rather different than that of teleost gills, but Rhcg expression occurred in the
multilayered epithelium of the primary fold, the structural equivalent of the gill filament in
teleosts (Elger, 1987). Like the gill filament of marine teleosts, the ‘filament’ of the Atlantic
hagfish has a higher density of MRCs than the lamellae (Choe et al., 1999; Evans et al.,
2005).
Rh glycoprotein mRNA expression in skin tissue
Rhcg mRNA expression in the skin (Fig. 14) followed a similar pattern to that seen in
the gill tissue (Fig. 12), but with upregulation in ammonia-injected hagfish occurring only at
0.5 hours following injection. Immunolocalization (Figs 18C, D; Pray, 2013, unpublished
thesis) and western blotting (Edwards, unpublished) suggest that Rhcg protein is expressed in
the skin; however, protein expression was not quantified in the skin due to poor
immunoreactivity. However, immunolocalization of Rhcg in the skin (Figs 18C, D)
demonstrated a basolateral staining pattern associated with the cutaneous epithelium (Pray,
2013, unpublished thesis).

33
Among teleost fishes, the gill serves as the primary site of ammonia excretion (Evans
et al., 2005). Rhcg mRNA expression data from this study (Fig. 14) suggest that cutaneous
routes involving Rh glycoproteins may play a role in ammonia excretion in the Atlantic
hagfish. Rh glycoproteins have been identified in the skin of rainbow trout (Nawata et al.,
2007), mangrove rivulus (Hung et al., 2007), zebrafish (Shih et al., 2008), and pufferfish
(Nawata et al., 2010); all experiments involving exposure to HEA (see Glover et al., 2013,
for a recent review of fish skin as a transport epithelium). Hung et al. (2007) suggested that
elevated environmental ammonia induces extra-branchial expression of Rh glycoproteins to
provide additional pathways for ammonia excretion. Shih et al. (2008) provide evidence for
Rhcg1-mediated ammonia excretion by ionocytes in the skin of larval zebrafish, relying on
acid trapping H+-ATPase driven H+ excretion. Subsequent research (Shih et al., 2013) also
implicates Rhbg in ammonia excretion via skin ionocytes.
It was not within the scope of this study to determine the specific contributions of
branchial and extra-branchial routes towards overall ammonia excretion, however, we
present evidence that Rhcg and Rhbg are expressed in the skin of the Atlantic hagfish and
that cutaneous Rhcg mRNA expression may respond to elevated plasma ammonia. In
contrast to Rhcg mRNA expression in the gill, significant upregulation of Rhcg mRNA in the
skin of ammonia-injected hagfish did not occur until 0.5 hour following injection. Although
Rhbg mRNA and protein expression were not quantified, Rhbg mRNA was detected in skin
using RT-PCR (Fig. 8). Expression of Rhcg and Rhbg mRNAs were not compared between
gill and skin tissues, however, gel analysis of RT-PCR products and comparison of qRT-PCR
threshold cycles suggest that mRNA expression may be lower in the skin. This would likely
contribute to the difficulty in reliably quantifying Rhbg mRNA in the skin.

34
Regulation of ammonia excretion in the Atlantic hagfish
Based on the evidence in the current study, branchial ammonia excretion in the
Atlantic hagfish likely involves the Rh glycoproteins Rhcg and Rhbg. Immunolocalization
evidence suggests that ammonia may enter the near the blood margin of gill epithelium via
Rhcg. The localization of hagfish Rhbg is uncertain as a homologous antibody has not been
developed and immunolocalization using a heterologous teleost antibody proved
inconclusive in Pacific hagfish (Braun and Perry, 2010). Based on the literature reviewed
above and the proposed models of both freshwater and saltwater ammonia excretion (Figs 1-
5), it is likely that ammonia excretion across the branchial epithelium by an apically located
Rh glycoprotein would rely on H+ excreted by apical H+-ATPase or NHE to maintain a
favorable gradient for passive NH3 excretion. Evans (1984) presented evidence that implies
Na+/NH4+ exchange (especially across the apical membrane) is not significant in the Atlantic
hagfish. However, there may be a possibility that, in hagfish, ammonia could cross the
basolateral membrane of the branchial epithelium as NH4+ displacing K+ as the substrate of
basolaterally located NKCC or NKA (not necessarily relying on the uptake of external Na+).
This hypothesis is speculative and awaits experimental evaluation.
Limitations
The current study provides valuable quantitative evidence of transcriptional
regulation of Rh glycoproteins in response to elevated plasma ammonia in Atlantic hagfish.
Loss of function experiments with Atlantic hagfish would be useful in confirming the role of
Rh glycoproteins in ammonia excretion. However, there are no known chemical inhibitors of
Rh glycoproteins and thus loss of function studies require the genetic manipulations (Hwang
et al., 2011) available in zebrafish (Shih et al., 2008) and medaka (Liu et al., 2013). The

35
current study presents the only known homologous antibody for an Rh glycoprotein (Rhcg)
in hagfish. Still, the lack of any other homologous antibodies for hagfish Rh glycoproteins
remains as a limitation to reliable quantification and localization of Rh protein expression.
Future directions
Molecular cloning should proceed to identify any other Rh isoforms present in the
Atlantic hagfish. Identification of Rhp1 or Rhp2 would be of particular value in establishing
the role of these primitive Rh isoforms in an organism close to the invertebrate/vertebrate
transition (Weihrauch et al., 2009).
Rhcg protein expression (Fig. 17) determined by Edwards (unpublished) in ammonia-
injected hagfish remained elevated after plasma ammonia and ammonia excretion rates had
returned to control levels. This finding may warrant sub-cellular localization of Rhcg using
transmission electron microscopy (TEM) and immunogold labeling, as well as
characterization of Rh glycoprotein turnover rates.
Further investigations are required to elucidate the role of hagfish skin in ammonia
excretion and to assess what role Rh glycoproteins may have in the regulation of extra-
branchial routes of ammonia excretion. Divided chamber experiments allowing the separate
evaluation of branchial and extra-branchial ammonia excretion would likely present logistical
challenges, but may allow the determination of the specific contribution of the skin in
proportion to branchial ammonia excretion.
Extended work involving tissues from the current study should include the
quantification of ion-transporter (NHE, NKA, NKCC, and H+-ATPase) mRNA and protein
expression in relation to plasma ammonia concentrations, ammonia excretion rates, and
expression of Rhcg and Rhbg mRNA and protein. The development a homologous Rhbg

36
antibody to be utilized in combination with existing Rhcg, NKA, NHE, and H+-ATPase
antibodies could enable the immunolocalization necessary to develop a reliable model of
ammonia transport and excretion in the Atlantic hagfish.
Conclusions
The hagfishes possess the longest known evolutionary history of the extant craniates
and are likely to offer exclusive insight into vertebrate origins. The Atlantic hagfish is
physiologically adapted to spend much of its life burrowed in ocean-floor substrate and
marine carcasses, where high environmental ammonia and unfavorable conditions for
ammonia excretion are likely encountered. The current study presents evidence that suggests
Atlantic hagfish are capable of reducing experimentally elevated plasma ammonia
concentrations and eventually eliminating the ammonia load within 8 hours. Following the
injection of ammonia, elevated plasma ammonia concentrations paralleled elevated ammonia
excretion rates and coincided with the initial upregulation of Rhcg and Rhbg in the gill and
Rhcg in the skin suggesting that the transcriptional regulation of Rh glycoproteins may
respond, in part, to elevated plasma ammonia. The subsequent translation of upregulated
Rhcg mRNA into protein provides evidence that suggests Rh glycoproteins are involved in
the regulation of ammonia excretion in Atlantic hagfish.

37
Table 1. Atlantic hagfish specific primers used for relative quantification of Rhcg and Rhcg
mRNA expression by qRT-PCR.
Primers Tm Sequence Product size
18S F2 58.0 5’ GCTCTTGGATGAGTGTCCGTTG 3’ 250 bp
18S R2 54.8 5’ TTCTTGGCAAATGCTTTCGC 3’
Rhcg F1 54.6 5’ GGTGGCACTATTGTCGGTAT 3’ 91 bp
Rhcg R1 54.2 5’ CCTCCCAATATGCTCTGTCTT 3’
Rhbg F1 55.0 5’ CGATAGGAGGTGGCATGATTAC 3’ 77 bp
Rhbg R1 54.5 5’ GAAGCAATCAACATCAGAAGCC 3’

38
Table 2. Sample size and individual mass of Atlantic hagfish injected with seawater sham or
ammonia.
Mass of individuals (g)
Injection N Minimum Maximum Mean SEM
Sham 38 40 113 76.1 2.7
Ammonia 38 47 115 79.4 2.6

39
(Nakada et al., 2007a)
Fig. 1. Conceptual model of branchial ammonia excretion mediated by Rh glycoproteins in pufferfish. A) Structural depiction of gill lamellae and filament with MRC or chloride cells. B) Lamellar model for the facilitated transcellular diffusion of ammonia from the vascular space via Rhag across the pillar cell to the basal lamina, then across the pavement cell via Rhbg and Rhcg2 to environmental water. C) MRC or chloride cell model of ammonia transport from the filament epithelium to environmental water via a coupling of Rhcg1 and Na+, K+-ATPase (Nakada et al., 2007a).

40
(Weihrauch et al., 2009)
Fig. 2. Proposed model of branchial ammonia excretion in saltwater teleosts. Really, two models are presented, one for pavement (PV) cells and one for MR cells. For pavement cells, the model involves basolaterally located Rhbg and apically located Rhcg2, but adds that significant diffusion of NH3 and NH4
+ likely occurs across the shallow paracellular junction of gill epithelial cells in marine fishes. The proposed MRC model is primarily focused on the transport of NH4
+ into the MRCs via basolaterally located NKA and NKCC and excreted as NH4
+ substituted for H+ as the substrate of apically located Na+/H+-exchanger (NHE-2) or as NH3 by Rhcg1 (Weihrauch et al., 2009)
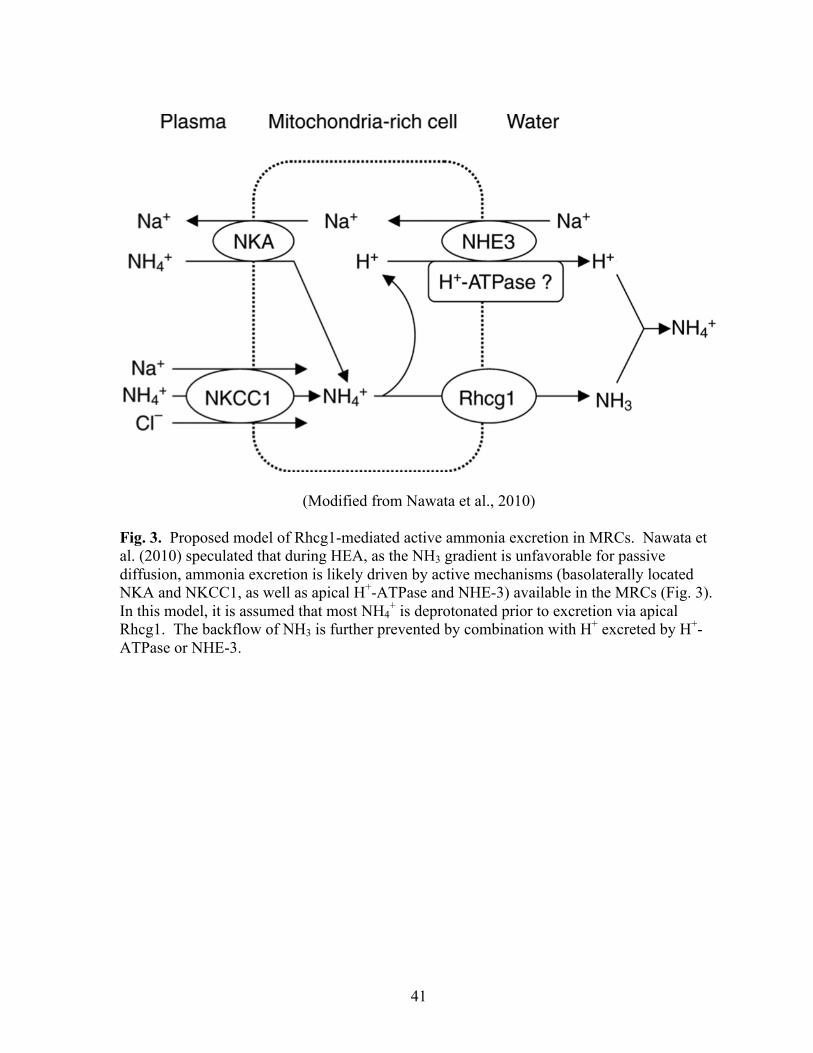
41
(Modified from Nawata et al., 2010) Fig. 3. Proposed model of Rhcg1-mediated active ammonia excretion in MRCs. Nawata et al. (2010) speculated that during HEA, as the NH3 gradient is unfavorable for passive diffusion, ammonia excretion is likely driven by active mechanisms (basolaterally located NKA and NKCC1, as well as apical H+-ATPase and NHE-3) available in the MRCs (Fig. 3). In this model, it is assumed that most NH4
+ is deprotonated prior to excretion via apical Rhcg1. The backflow of NH3 is further prevented by combination with H+ excreted by H+-ATPase or NHE-3.

42
(Weihrauch et al, 2009).
Fig. 4. Proposed model of branchial ammonia excretion in freshwater teleosts. Weihrauch et al. (2009) propose a model utilizing an unspecified combination of Rh glycoproteins in the transcellular movement of ammonia across the gill epithelium and requires acidification of the gill boundary layer by H+ excretion and CO2 hydration to maintain a favorable ammonia diffusion gradient.

43
(Modified from Wright and Wood, 2009). Fig. 5. Proposed model of branchial ammonia excretion in freshwater teleosts, including transport from the red blood cells. In this model Rhag located on the red blood cells (RBC) are utilized to transport ammonia across the RBC membrane into the plasma and basolaterally located Rhbg facilitates transport into the gill epithelium. Apical Rhcg (variant not specified) facilitates the outward diffusion of NH3 into the gill boundary layer water, where acid trapping (combination with H+ provided by NHE2/3, HAT, or CO2 hydration to form NH4
+) is utilized to maintain a favorable diffusion gradient.

44
5’-‐ GGGGGTTGCCACAATATACACCTGCTGTATTACCGGAGTCAATATTGTGTGGTGCTGACGAGTCCTTGCGGAGCCATGGGGTCATTTCCAAACCTTCGCATCCGACTTCCACTCGTAGCTTTCCTCCTTGAGCTTCTCATGATTATTCTCTTTGGCGTATTTGTGAAGTACGATGATGAATCCGATGCTTCAAAACCTGATGATCTGACGGGAAAATCTACTTTCCTTTACCGATATCCCAGTTTCCAGGATGTCCATGTCATGGTTTTCATGGGATTTGGGTTCCTCATGACGTTCCTGCAGCGTTACGGCTTTAGCGCGGTTGGTTTCAACTTCCTCGTCGCTTCTTTCTCCCTTCAGTGGGCGACGCTCATGCAGGGCTGGTTTCATCACTTCCAGGATGGCAAGATCCTTGTCGGAGTGGAAAGCCTCATCAATGCGGATTTTTGCGCAGCATCTATGCTCATTGCCTTTGGGGCCGTGTTGGGGAGGACCAGGCCCGTACAGCTCCTTATTATGGCCTTTTTCCAAGTGACGTTATTTTCAGTCAATGAGTATATCCTTCTCAACCTGCTTGAGGTAATCGATGCACGTGGATCTATGACCATCCACTGCTTTGGTGGATTTTTTGGTCTCGCGGTTTCTCGAGTCCTATACCGTCCAGGCCTCAAGGAGCCCCACCGAAAGGCATCTTCAGTCTATCACTCTGATTTATTTGCTATGATTGGTACTCTGTTCCTATGGATTTACTGGCCGAGCTTTAATTCTGCAATTTCAGAAAAAGGTGTAAATCAGACTCGAGCAGTAATCAATACATACTACACGCTGGCATCGTGTACTGTAACTACGTGTATCCTATCCAGCTTGGTTGACAAGAGCGGCCGAATCAACATGGTCCATTTGCAGAGTTCGACGTTGGCCGGAGCAGTTGCGGTTGGAACGGCAGCAGAAATGATGCTCACTCCGTACGGGTCCCTTATCGTGGGGTTAATTCTGGGAACGCTCAGCACACTTGGATACACCTTCATCACGCCTGCCCTGGAAAAATACCTCCATGTTCAAGACACCTGTGGCATTCATAACCTGCATGCCCTTCCTGGCTTCTGCGGAGGTATCATTGGCGCAATTACAGCTGCTGCTGCTTCAGAAGCGACTTATGGTTCAAGACTCCACCACACCTTTCCATCTCTGGATAAACATCCGGGTCGGTCTTTGGGTGGTTTTCAGATGGCAGGAGCCGTTGTCTCCCTCGGCATGGGCTTGGTTGGTGGCACTATTGTCGGTATTATTCTTAAATTCCCTATCTGGGGGGCCACGACTGATGAAGATTGTTATGAAGACAGAGCATATTGGGAGGTTCCAGAGGAGGAGGTAACATACATTCATACAGTAACACGAAATGAACACGTGAAAGAGGAAAACACCGTGTATGAAATGGAGCCACAAAGTCCAGCTGACTAA -‐3’ Fig. 6. Atlantic hagfish Rhcg cDNA nucleotide sequence from mRNA (Edwards, S. L. and Walsh, P. J., GenBank: GU733440).

45
5’-‐ATGGCGATCTACCACACCAAAATGAACCCCAAGCTACCAGTGGTGGCACTGGTGCTTGAGGTTGTGATGCTTATCCTGTTTGGCATATTTGTACGATATGACCACGATGCCGATGCAAAGGATCATCATAATAACACCAAAGCACAGAAAAACGAGTTCTACTTCAGATACGCAAGCTTTCAAGATGTACACGTGATGATTTTCATTGGTTTTGGCTTCCTCATGACTTTCCTTAAGCGCTACAGTTTCAGCAGCGTGGGTTTCAACTTCTTAATCGCAGCATTTGGTCTGCAATGGGCAGTGCTACTGCAAGGATGGTTGCACCACTTCGACTCTAGCACTATGAAAATCCACATTGGCATGGAGGGGATGATAAATGCCGATTTCTGTACAGCAGCCGTTCTCATCAGCTTTGGTGCCGTGTTGGGTAAAACAAGTCCTTTACAACTGTTGGTGATGACAGTACTAGAAGAGGTTTTCTTTGCTCTGAATGAACACATCGCCATAGGTATTTTACAGGTGAATGATGCTGGTGGATCAATGGTCATACACCTGTTTGGAGCCTATTTTGGTCTTGCTGTCTCCAGAGTAATGTTCCGTGATGGCTTGCACGGAGAGACGCATGAAAAAGAGGGCTCTGTTTACCACTCGGACGTCTTTGCCATGATTGGCACCATCTTCCTGTGGATGTTCTGGCCAAGTTTTAATTCTGCCATCGCTGGTCATGGAGATGATCAAATGCGCGCTGCGATGAATACATATTTCTCACTCGCTGCCAGCCTTGTGGCCACTTTTGCAATTTCGAGTTTGACAAGTCGAGAGGGAAAGTTGGACATGGTTCACATTCAGAATGCCTCACTAGCTGGAGGCGTGGCTGTGGGGACGTGTGCCGACATGATGATAAACCCGTATGGAGCTATCATGATTGGCTTTTGCAGCGGTATAGTTTCTACCTTGGGCTTCAAGTATCTTGCGCCGCTTTTGGAATCAAAGTTGAAAGTTCACGACACATGTGGCGTTCACAACTTGCACGGAATGCCAGGAATTCTGGGAGGACTTTCTGGAGCCATTGCTGCGGCCTTTGCTAGTGAAGAAGTCTATGGACTGAGCTTGTACTTGACCTTTCCAACATTAGTGCCAGAAGACAAAAACACTCCTCTGTTCAAACGTCTTCACGAATGGAGCGATGAAATTGAACCTGGAAAGGGACGCTCGCCCATGGTGCAGGGGGGGTTCCAGGCTCTGCAGGTCCTCATCTCCTTGGTCATGGCGATAGGAGGTGGCATGATTACAGGTTTCTTCCTCAAACATACTTGGTGGGGGCAGGCTTCTGATGTTGATTGCTTCGAGGACAGCATGTACTGGGAGGTGCCTGAAGCTGAGGGGTTTACAGAGGTCAAAACTGATGGAGAGCATCCCTTGGATACGCAGGACGAGCTCTAA -‐3’ Fig. 7. Atlantic hagfish Rhbg cDNA nucleotide sequence from mRNA (Edwards, S. L. and Walsh, P. J., GenBank: GU733441).

46
Fig. 8. RT-PCR products separated by 1% Ethidium bromide gel electrophoresis. (A) hagfish 18S, (B) hagfish Rhcg, and (C) hagfish Rhbg were amplified from reverse transcribed mRNA isolated from gill and skin (see Table 1 for primer information). Molecular grade water was substituted for template cDNA in no template control (NTC) reactions.

47
Fig. 9. Phylogenetic reconstruction of Rh glycoproteins. The tree is rooted to Chlamydomonas Rhp1. Clades formed for Rhcg, Rhbg, Rhp2 and Rhp1. Myxine glutinosa Rhcg and Myxine glutinosa Rhbg were ancestral to the respective isoforms of higher vertebrates, but were not ancestral to the Danio rerio Rhp2.

48
Fig. 10. Cumulative total ammonia in the environmental water. Total ammonia concentrations of ammonia-injected hagfish remained elevated (P>0.05) above sham-injected hagfish at all time points following injection (zero hours).
0
500
1000
1500
2000
2500
3000
0 2 4 6 8 10 12 14 16 18 20 22 24
Tam
m, t
otal
am
mon
ia (µ
mol
N k
g-1)
Time (h)
Sham-injected
Ammonia-injected

49
Fig. 11. Net flux of total ammonia in environmental water. Net flux rates were calculated from changes in cumulative total ammonia concentrations between time-points. The highest rate of excretion was observed during the 0.25 hour following injection of 100 mM NH4Cl. Ammonia excretion remained elevated above sham-injected levels until 6 hours post-injection. * denotes a statistically significant difference (P>0.05) between treatments at a time-point.
0
500
1000
1500
2000
2500
3000
3500
0-0.25 0.25-0.5 0.5-1 1-2 2-4 4-6 6-8 8-12 12-24
J am
m, a
mm
onia
flux
(µm
ol N
kg-1
h-1
)
Time (h)
Sham-injected Ammonia-injected
*
*
*
*
*
P=0.0005
P=0.009 P=4.0 x 10
-11
P=8.8 x 10⁻⁶
P=0.0096

50
Fig. 12. Plasma total ammonia profile. Plasma ammonia concentrations were significantly elevated in ammonia-injected hagfish through 4 hours post-injection. N of 5 individuals per treatment at each time point, except for 12 hours (N of 3 individuals per treatment). * denotes a statistically significant difference (P>0.05) between treatments at a time-point.
0
2
4
6
8
10
12
14
16
Not Injected
0.25 0.5 1 2 4 8 12
Plas
ma
tota
l am
mon
ia (u
g N
ml-1
)
Time (h)
Sham-injected
Ammonia-injected *
* *
* *
P=0.00061
P=2.6 x 10⁻⁵
P=0.017
P=0.0037
P=0.00026

51
Fig. 13. Rhcg mRNA expression in gill tissue. Expression of Rhcg mRNA in the ammonia-injected group was upregulated at 0.25 and 0.5 hours post-injection and downregulated at all subsequent time-points relative to the sham-injected group. N of 5 individuals per treatment at each time point. * denotes a statistically significant difference (P>0.05) between treatments at a time-point.
0
2
4
6
8
10
12
0.25 0.5 1 2 4 8
Rel
ativ
e m
RN
A e
xpre
ssio
n
Time (h)
Sham-injected Ammonia-injected
*
*
* * * *
P=3.3 x 10⁻⁵
P=0.00048
P=0.0077
P=0.0031 P=0.0019
P=0.00046

52
Fig. 14. Rhbg mRNA expression in gill tissue. Expression of Rhbg mRNA in the ammonia-injected group was upregulated at 0.5 hours post-injection, but downregulated at 1, 4, and 8 hours post-injection relative to the sham-injected group. N of 5 individuals per treatment at each time point. * denotes a statistically significant difference (P>0.05) between treatments at a time-point.
0
1
2
3
4
0.25 0.5 1 2 4 8
Rel
ativ
e m
RN
A e
xpre
ssio
n
Time (h)
Sham-injected Ammonia Injected *
* * *
P=0.012
P=0.00057 P=0.0049 P=0.0041

53
Fig. 15. Rhcg mRNA expression in skin tissue. Expression of Rhcg mRNA in the ammonia-injected group was upregulated at 0.5 hours post-injection, but downregulated at 4 hours post-injection relative to the sham-injected group. N of 5 individuals per treatment at each time point. * denotes a statistically significant difference (P>0.05) between treatments at a time-point.
0
1
2
3
4
5
6
7
8
0.25 0.5 1 2 4 8
Rel
ativ
e m
RN
A e
xpre
ssio
n
Time (h)
Sham-injected Ammonia Injected
*
*
P=0.0023
P=1.6 x 10⁻⁵

54
Fig. 16. Immunoblot using homologous hagfish Rhcg antibody. Western blot of Atlantic hagfish gill proteins separated by SDS-PAGE. The left lane of each pair contains molecular weight markers. A) Negative control. B) Positive control, 1:5,000 dilution of Rhcg antibody. C) Rhcg antibody preabsorbed 1:10 with purified Rhcg peptide, 1:5,000 dilution. D) Rhcg antibody preabsorbed 1:20 with purified Rhcg peptide, 1:5,000 dilution. * indicates the location of the immunoreactive in the positive control and the absence of the same band in the negative control and preabsorbed immunoblots.
* * * *
A B C D
50 kDa
37 kDa

55
Edwards (unpublished)
Fig. 17. Quantification of Atlantic hagfish Rhcg protein expression in gill tissue (Edwards, unpublished). N of 5 individuals per treatment at each time point. * denotes a statistically significant difference (P>0.05) between treatments at a time-point.

56
(Pray, 2013, unpublished Honor’s thesis) Fig. 18. Immunolocalization of hagfish Rhcg in (A) the gill and (C) skin of Atlantic hagfish. Note the immunoreactive staining associated with the epithelium closest to the blood margin in (A) and (D). Respective negative controls shown in B and D (Pray, 2012 unpublished thesis).
B
D
C
A
Water
Water
Water Water

57
References Bartels, H. (1988). Intercellular junctions in the gill epithelium of the Atlantic hagfish,
Myxine glutinosa. Cell Tissue Res. 254, 573–583. Braun, M. H. and Perry, S. F. (2010). Ammonia and urea excretion in the Pacific hagfish
Eptatretus stoutii: Evidence for the involvement of Rh and UT proteins. Comp. Biochem. Physiol. 157A, 405-415.
Brauner, C. J. and Baker, D. W. (2009). Patterns of acid–base regulation during exposure
to hypercarbia in fishes. In Cardio-Respiratory Control in Vertebrates (ed. Glass, M. L. and Wood, S. C.), pp. 43–63. Springer Berlin Heidelberg.
Cherif-Zahar, B., Durand, A., Schmidt, I., Hamdaoui, N., Matic, I., Merrick, M., and
Matassi, G. (2007). Evolution and functional characterization of the RH50 gene from the ammonia-oxidizing bacterium Nitrosomonas europaea. J. Bacteriol. 189, 9090–9100.
Choe, K. P., Edwards, S., Morrison-Shetlar, a I., Toop, T. and Claiborne, J. B. (1999).
Immunolocalization of Na+/K+-ATPase in mitochondrion-rich cells of the Atlantic hagfish (Myxine glutinosa) gill. Comp. Biochem. Physiol. A. Mol. Integr. Physiol. 124, 161–8.
Currie, S. and Edwards, S. L. (2010). The curious case of the chemical composition of
hagfish tissues-50 years on. Comp Biochem. Physiol. 157A, 111-115. Cooper, A. J. and Plum, F. (1987). Biochemistry and physiology of brain ammonia.
Physiol. Rev. 67, 440-519. Edwards, S. L., Claiborne, J. B., Morrison-Shetlar, A. L. and Toop, T. (2001).
Expression of Na+/ H+ exchanger mRNA in the gills of the Atlantic hagfish (Myxine glutinosa) in response to metabolic acidosis. Comp. Biochem. Physiol. A. Mol. Integr. Physiol. 130, 81–91.
Elger, M. (1987). The branchial circulation and the gill epithelia in the Atlantic hagfish,
Myxine glutinosa L. Anat. Embryol. (Berl). 175, 489–504. Escriva, H., Manzon, L., Youson, J. H. and Laudet, V. (2002). Analysis of Lamprey and
Hagfish genes reveals a complex history of gene duplications during early vertebrate evolution. Mol. Biol. Evol. 19, 1440-1450.

58
Evans, D. H. (1984). Gill Na+/H+ and Cl-/HCO3- exchange systems evolved before the
vertebrates entered fresh water. J. Exp. Biol. 113, 465–469. Evans, D. H. (2011). Freshwater fish gill ion transport: August Krogh to morpholinos and
microprobes. Acta Physiol. 202, 349–59. Evans, D. H., Piermarini, P., and Choe, K. (2005). The multifunctional fish gill: dominant
site of gas exchange, osmoregulation, acid-base regulation, and excretion of nitrogenous waste. Physiol. Rev. 85, 97-177.
Forey, P., and Janvier, P. (1993). Agnathans and the origin of jawed vertebrates. Nature
361, 129-134. Glover, C., Bucking, C. and Wood, C. (2013). The skin of fish as a transport epithelium: a
review. J. Comp. Physiol. B 183, 877–891. Good, D. W., Knepper, M. A. and Burg, M. B. (1984). Ammonia and bicarbonate transport
by thick ascending limb of rat kidney. Am. J. Physiol. Renal Physiol. 247, F35–F44. Greenaway, P. and Nakamura, T. (1991). Nitrogenous excretion in two terrestrial crabs
(Gecarcoidea natalis and Geograpsus grayi). Physiological Zoology 64, 767–786. Han, K.-H., Kim, H.-Y. and Weiner, I. D. (2009). Expression of Rh glycoproteins in the
mammalian kidney. Electrolyte & Blood Pressure 7, 14–9. Heimberg, A. M., Cowper-Sal-lari, R., Sémon, M., Donoghue, P. C. J. and Peterson, K.
J. (2010). microRNAs reveal the interrelationships of hagfish, lampreys, and gnathostomes and the nature of the ancestral vertebrate. Proc. Natl. Acad. Sci. U. S. A. 107, 19379–83.
Huang, C.H. and Peng, J. (2005). Evolutionary conservation and diversification of Rh
family genes and proteins. Proc. Natl. Acad. Sci. U. S. A. 102, 15512-15517. Hung, C. C., Tsui, K. N. T., Wilson, J. M., Nawata, C. M., Wood, C. M. and Wright, P.
A. (2007). Rhesus glycoprotein gene expression in the mangrove killifish Kryptolebias marmoratus exposed to elevated environmental ammonia levels and air. J. Exp. Biol. 210, 2419-2429.
Hwang, P.-P., Lee, T.-H. and Lin, L.-Y. (2011). Ion regulation in fish gills: recent progress
in the cellular and molecular mechanisms. Am. J. Physiol. Regul. Integr. Comp. Physiol. 301, R28-R47.
Ip, Y. K. and Chew, S. F. (2010). Ammonia production, excretion, toxicity, and defense in
fish: a review. Front. Physiol. 1, 134.

59
Ip, Y. K., Chew, S. F. and Randall, D. J. (2001). Ammonia toxicity, tolerance, and excretion. In Nitrogen Excretion (ed. P. A. Wright,and P. M. Anderson), pp. 109–148. New York, NY: New Academic Press.
Janvier, P. (1981). The phylogeny of the Craniata, with particular reference to the
significance of fossil “agnathans.” J. Vert. Paleontol. 1, 121–159. Kikeri, D., Sun, A., Zeidel, M. L. and Hebert, S. C. (1989). Cell membranes impermeable
to NH3. Nature 339, 478–480. Krogh, A. (1939). Osmotic regulation in aquatic animals. Cambridge: Cambridge
University Press. Kumai, Y. and Perry, S. F. (2011). Ammonia excretion via Rhcg1 facilitates Na+ uptake in
larval zebrafish, Danio rerio, in acidic water. Am. J. Physiol. Regul. Integr. Comp. Physiol. 031, R1517-R1528.
Lesser, M., Martini, F. and Heiser, J. B. (1996). Ecology of the hagfish, Myxine glutinosa
L. in the Gulf of Maine: I. Metabolic rates and energetics. J. Exp. Marine Biol. Ecol. 208, 215-225.
Levine, P. and Stetson, R.E. (1939). An unusual case of intra-group agglutination. J. Am.
Med. Assoc. 113, 126-127. Liu, S.-T., Tsung, L., Horng, J.-L. and Lin, L.-Y. (2013). Proton-facilitated ammonia
excretion by ionocytes of medaka (Oryzias latipes) acclimated to seawater. Am. J. Physiol. Regul. Integr. Comp. Physiol. 305, R242–R251.
Ludewig, U. (2004). Electroneutral ammonium transport by basolateral rhesus B
glycoprotein. J. Physiol. 559, 751-759. Mallatt, J., Conley, D. M. and Ridgway, R. L. (1987). Why do hagfish have gill “chloride
cells” when they need not regulate plasma NaCl concentration? Can. J. Zool. 65, 1956–1965.
Maetz, J. and García Romeu, F. (1964). The mechanism of sodium and chloride uptake by
the gills of a fresh-water fish, Carassius auratus : II. Evidence for NH4+/Na+ and
HCO3-/Cl- exchanges. J. Gen. Physiol. 47, 1209–1227.
Marini, A. M., Urrestarazu, A., Beauwens, R. and André, B. (1997). The Rh (Rhesus)
blood group polypeptides are related to NH4+ transporters. Trends Biochem. Sci. 22,
460-461. Marini, A. M., Matassi, G., Raynal, V., Andre, B., Cartron, J. P. and Cherif-Zahar, B.
(2000). The human Rhesus-associated RhAG protein and a kidney homologue promote ammonium transport in yeast. Nat. Genet. 26, 341–344.

60
Martini, F., Lesser, M. and Heiser, J. B. (1997). Ecology of the hagfish, Myxine glutinosa L., in the Gulf of Maine: II. Potential impact on benthic communities and commercial fisheries. J. Exp. Marine Biol. Ecol. 214, 97-106.
Matassi, G., Cherif-Zahar, B., Pesole, G., Raynal, V. and Cartron, J.P. (1999). The
members of the RH gene family (RH50 and RH30) followed different evolutionary pathways. J. Mol. Evol. 48, 151-159.
McDonald, G., Cavdek, V., Calvert, L. and Milligan, C. L. (1991). Acid-base regulation
in the Atlantic hagfish Myxine glutinosa. J. Exp. Biol. 161, 201–215. McDonald, T. R., Dietrich, F. S. and Lutzoni, F. (2012). Multiple horizontal gene transfers
of ammonium transporters/ammonia permeases from prokaryotes to eukaryotes: toward a new functional and evolutionary classification. Mol. Biol. Evol. 29, 51-60.
Monfort, P., Cauli, O., Montoliu, C., Rodrigo, R., Llansola, M., Piedrafita, B., el Mlili,
N., Boix, J., Agustí, A. and Felipo, V. (2009). Mechanisms of cognitive alterations in hyperammonemia and hepatic encephalopathy: Therapeutical implications. Neurochem. Int. 55, 106–112.
Nakada, T., Westhoff, C.M., Kato, A. and Hirose, S. (2007a). Ammonia secretion from
fish gill depends on a set of Rh glycoproteins. FASEB J. 21, 1067-1074. Nakada, T., Hoshijima, K., Esaki, M., Nagayoshi, S., Kawakami, K. and Hirose, S.
(2007b). Localization of ammonia transporter Rhcg1 in mitochondrion-rich cells of yolk sac, gill, and kidney of zebrafish and its ionic strength-dependent expression. Am. J. Physiol. Regul. Integr. Comp. Physiol. 293, R1743-1753.
Nakada, T., Westhoff, C. M., Yamaguchi, Y., Hyodo, S., Li, X. J., Muro, T., Kato, A.,
Nakamura, N. and Hirose, S. (2010). Rhesus glycoprotein P2 (Rhp2) is a novel member of the Rh family of ammonia transporters highly expressed in shark kidney. J. Biol. Chem. 285, 2653-2664.
Nawata, C. M. and Wood, C. M. (2008). The effects of CO2 and external buffering on
ammonia excretion and Rhesus glycoprotein mRNA expression in rainbow trout. J. Exp. Biol. 211, 3226-3236.
Nawata, C. M., Hung, C. C., Tsui, T. K. N., Wilson, J. M., Wright, P. A. and Wood, C.
M. (2007). Ammonia excretion in rainbow trout (Oncorhynchus mykiss): evidence for Rh glycoprotein and H+-ATPase involvement. Physiol. Genomics 31, 463-474.
Nawata, C. M., Hirose, S., Nakada, T., Wood, C. M. and Kato, A. (2010). Rh
glycoprotein expression is modulated in pufferfish (Takifugu rubripes) during high environmental ammonia exposure. J. Exp. Biol. 213, 3150-3160.
61
Near, T. J. (2009). Conflict and resolution between phylogenies inferred from molecular and phenotypic data sets for hagfish, lampreys, and gnathostomes. J. Exp. Zool. Part B, Mol. Dev. Evol. 312, 749–61.
Ota, K. G., Kuraku, S. and Kuratani, S. (2007). Hagfish embryology with reference to the
evolution of the neural crest. Nature 446, 672–675. Pfaffl, M. W. (2001). A new mathematical model for relative quantification in real-time RT–
PCR. Nucleic Acids Res. 29, e45. Powell, M. L., Kavanaugh, S. I. and Sower, S. A. (2004). Seasonal concentrations of
reproductive steroids in the gonads of the Atlantic hagfish, Myxine glutinosa. J. Exp. Zool. Part A, Comp. Exp. Biol., 301, 352–60.
Powell, M. L., Kavanaugh, S. I. and Sower, S. A. (2005). Current knowledge of hagfish
reproduction: Implications for fisheries management. Integr. Comp. Biol. 45, 158-165.
Pray, M. E. (2013). Localization of Rh glycoproteins in the Atlantic hagfish, Myxine
glutinosa. Unpublished Senior Honor’s Thesis, Appalachian State University, Boone, NC, USA.
Ripoche, P., Bertrand, O., Gane, P., Birkennmeier, C., Colin, Y. and Cartron, J. P.
(2004). Human Rhesus-associated glycoprotein mediates facilitated transport of NH3 into red blood cells. Proc. Natl. Acad. Sci. USA 101, 17222-17227.
Rodela, T. M., Esbaugh, A. J., Weihrauch, D., Veauvy, C. M., McDonald, M. D.,
Gilmour, K. M. and Walsh, P. J. (2012). Revisiting the effects of crowding and feeding in the gulf toadfish, Opsanus beta: the role of Rhesus glycoproteins in nitrogen metabolism and excretion. J. Exp. Biol. 215, 301-13.
Sardella, B. A., Baker, D. W. and Brauner, C. J. (2009). The effects of variable water
salinity and ionic composition on the plasma status of the Pacific hagfish (Eptatretus stoutii). J. Comp. Physiol. B 179, 721–728.
Sashaw, J., Nawata, M., Thompson, S., Wood, C. M. and Wright, P. A. (2010). Rhesus
glycoprotein and urea transporter genes in rainbow trout embryos are upregulated in response to alkaline water (pH 9.7) but not elevated water ammonia. Aquat. Toxicol. 96, 308-13.
Shelton, R. G. J. (1978). On the feeding of the hagfish Myxine glutinosa in the North Sea. J.
Mar. Biol. Assoc. U. K. 58, 81–86. Shih, T.-H., Horng, J.-L., Hwang, P.-P. and Lin, L.-Y. (2008). Ammonia excretion by the
skin of zebrafish (Danio rerio) larvae. 295, C1625–C1632.

62
Shih, T.-H., Horng, J.-L., Lai, Y.-T. and Lin, L.-Y. (2013). Rhcg1 and Rhbg mediate ammonia excretion by ionocytes and keratinocytes in the skin of zebrafish larvae: H+-ATPase-linked active ammonia excretion by ionocytes. Am. J. Physiol. - Regul. Integr. Comp. Physiol. 304, R1130–R1138.
Smith, H. W. (1929). The excretion of ammonia and urea by the gills of fish. J. Biol. Chem.
81, 727–742. Speeg, K. V and Campbell, J. W. (1968). Formation and volatilization of ammonia gas by
terrestrial snails. American Journal of Physiology 214, 1392–1402. Strahan, R. (1963). The behaviour of myxinoids. Acta Zool. 44, 73–102. Takechi, M., Takeuchi, M., Ota, K. G., Nishimura, O., Mochii, M., Itomi, K., Adachi,
N., Takahashi, M., Fujimoto, S., Tarui, H. et al. (2011). Overview of the transcriptome profiles edentified in hagfish, shark, and bichir: Current issues arising from some nonmodel vertebrate taxa. J. Exp. Zool. 316B, 526-546.
Thompson, J. D., Higgins, D. G. and Gibson, T. J. (1994). CLUSTAL W: improving the
sensitivity of progressive multiple sequence alignment through sequence weighting, position-specific gap penalties and weight matrix choice. Nucleic Acids Res. 22, 4673–4680.
Towle, D. W. and Holleland, T. (1987). Ammonium ion substitutes for K+ in ATP-
dependent Na+ transport by basolateral membrane vesicles. 252, R479–R489. Tresguerres, M., Parks, S. K. and Goss, G. G. (2006). V-H+-ATPase, Na+/K+-ATPase and
NHE2 immunoreactivity in the gill epithelium of the Pacific hagfish (Epatretus stoutii). Comp. Biochem. Physiol. Part A Mol. Integr. Physiol. 145, 312–321.
Tresguerres, M., Parks, S. K. and Goss, G. G. (2007). Recovery from blood alkalosis in
the Pacific hagfish (Eptatretus stoutii): Involvement of gill V–H+–ATPase and Na+/K+–ATPase. Comp. Biochem. Physiol. Part A Mol. Integr. Physiol. 148, 133–141.
Tsui, T. K. N., Hung, C. Y. C., Nawata, C. M., Wilson, J. M., Wright, P. A. and Wood,
C. M. (2008). In vitro evidence for the involvement of Rh proteins and H+ efflux in ammonia excretion across the gills of the freshwater rainbow trout. Comp. Biochem. Physiol. 150A, S105-S105.
Tsui, T. K. N., Hung, C. Y. C., Nawata, C. M., Wilson, J. M., Wright, P. A. and Wood,
C. M. (2009). Ammonia transport in cultured gill epithelium of freshwater rainbow trout: the importance of Rhesus glycoproteins and the presence of an apical Na+/NH4
+ exchange complex. J. Exp. Biol. 212, 878-892.

63
Walsh, P. J. (1998). Nitrogen excretion and metabolism. In The Physiology of Fishes, 2nd edn. (ed. D. H. Evans), pp. 199–214. Boca Raton, FL: CRC Press.
Walsh, P. J., Wang, Y., Campbell, C. E., De Boeck, G. and Wood, C. M. (2001). Patterns
of nitrogenous waste excretion and gill urea transporter mRNA expression in several species of marine fish. Marine Biology 139, 839-844.
Walsh, P. J., Veauvy, C. M., McDonald, M. D., Pamenter, M. E., Buck, L. T. and
Wilkie, M. P. (2007). Piscine insights into comparisons of anoxia tolerance, ammonia toxicity, stroke and hepatic encephalopathy. Comp. Biochem. Physiol. Part A Mol. Integr. Physiol. 147, 332–343.
Weatherburn, M. W. (1967). Phenol-hypochlorite reaction for determination of ammonia.
Analytical Chemistry 39, 971-974. Weihrauch, D., Wilkie, M. P. and Walsh, P. J. (2009). Ammonia and urea transporters in
gills of fish and aquatic crustaceans. J. Exp. Biol. 212, 1716-1730. Weisbart, M. and Idler, D. R. (1970). Re-examination of the presence of corticosteroids in
two cyclostomes, the Atlantic hagfish (Myxine glutinosa L.) and the sea lamprey (Petromyzon marinus L.). J. Endocrinol. 46, 29–43.
Westhoff, C. M. (2007). The structure and function of the Rh antigen complex. Semin.
Hematol. 44, 42-50. Wieser, W., Schweizer, G. and Hartenstein, R. (1969). Patterns in the release of gaseous
ammonia by terrestrial isopods. Oecologia 3, 390–400. Wilkie, M. P. (2002). Ammonia excretion and urea handling by fish gills: present
understanding and future research challenges. J. Exp. Zool. 293, 284-301. Wilkie, M. P. and Wang, Y. (1999). Nitrogenous waste excretion by the larvae of a
phylogenetically ancient vertebrate: the sea lamprey (Petromyzon marinus). Can. J. Zool. 715, 707–715.
Wright, P. A. (1995). Nitrogen excretion: three end products, many physiological roles. J.
Exp. Biol. 198, 273–281. Wright, P. A. (2007). Ionic, osmotic, and nitrogenous waste regulation. In Primitive Fishes,
Fish Physiology Series, Vol. 26 (ed. D. J. McKenzie A. P. Farrell and C. J. Brauner), pp. 283-318. San Diego: Academic Press.
Wright, P. A. and Wood, C. M. (2009). A new paradigm for ammonia excretion in aquatic
animals: role of Rhesus (Rh) glycoproteins. J. Exp. Biol. 212, 2303-12.

64
Wright, P. A. and Wood, C. M. (2012). Seven things fish know about ammonia and we don’t. Respir. Physiol. Neurobiol. 184, 231–240.
Wright, P. A., Randall, D. and Perry, S. (1989). Fish gill water boundary layer: a site of
linkage between carbon dioxide and ammonia excretion. J. Comp. Physiol. B 158, 627–635.

65
Vita
Justin M. Arnold became the second son born to parents Philip and Evelyn of Piney
Creek, North Carolina in March of 1986. His family, especially his older brother, Jason,
fostered a love for exploring the woods and rolling fields of Ashe and Alleghany counties. A
notoriously inquisitive mind and penchant for tinkering naturally carried him to pursue
studies in the biological sciences. He received his Bachelor of Science in Biology from
Appalachian State University in May of 2008 following four years of dabbling in whatever
research projects he could get his nose into. He then spent two seasons as a field crew leader
for the United States Fish and Wildlife Service in Alaska, where he was privileged to work
with some of the finest individuals one could know in the task of tracking Pacific salmon as
far upstream as they could be found.
Seeking to top the experience of flying around Alaska in a helicopter, Mr. Arnold
married his college crush on October 16, 2010. After stints as a land manager, carpenter,
woodworker, and poultry farmer, he entered graduate school at Appalachian State University
as a research assistant for Dr. Susan L. Edwards. On the first day of classes in August of
2012, he was blessed with the birth of his son, Micah. He received his Master of Science in
December 2013.
Mr. Arnold currently lives in Valle Crucis, North Carolina with his wife, Joanna, and
son, Micah. He is grateful to be surrounded by such an outstanding community and vibrant
natural beauty, both of which have inspired many adventures and will not soon be forgotten.

![Excretion [2015]](https://static.fdocuments.us/doc/165x107/55d39c87bb61eb05278b46dd/excretion-2015-55d47f0693bf7.jpg)