
Ammonia Brochure 23/5/amend - PIK Research Portal · water, and that it will react with other...
45
1 Executive Summary . . . . . . . . . . . . . . . . . . . . . . . . . . . . . . . . . . . . . . . . . . . .2 Chapter 1 Background to the problem of ammonia in the UK . . . . . . . . . . . . .6 Chapter 2 Atmospheric concentrations and deposition . . . . . . . . . . . . . . . . .14 Chapter 3 Environmental impacts of ammonia on semi-natural habitats . . . . .22 Chapter 4 Estimating total ammonia emissions from the UK . . . . . . . . . . . . .32 Chapter 5 Ammonia emissions from cattle farming . . . . . . . . . . . . . . . . . . . .40 Chapter 6 Ammonia emissions from pig farming . . . . . . . . . . . . . . . . . . . . . .48 Chapter 7 Ammonia emissions from poultry farming . . . . . . . . . . . . . . . . . . .56 Chapter 8 Other livestock: sheep, goats, farmed deer and horses . . . . . . . . . .62 Chapter 9 Emissions from fertilizers and crops . . . . . . . . . . . . . . . . . . . . . . .66 Chapter 10 Emissions from non-agricultural sources . . . . . . . . . . . . . . . . . . . .74 Chapter 11 Overview of research on methods for reducing emissions from agriculture . . . . . . . . . . . . . . . . . . . . . . . . . . . . . . . . . . . . . .78 Annex 1 DEFRA inventory of annual emissions in the UK for 2000 . . . . . .86 Annex 2 Glossary . . . . . . . . . . . . . . . . . . . . . . . . . . . . . . . . . . . . . . . . . . .88 NH 3 Contents Page Figures Figure 2.1 . . . . . . . . . . . . . . . . . . . . 15 Figure 2.2 . . . . . . . . . . . . . . . . . . . . 16 Figure 2.3 . . . . . . . . . . . . . . . . . . . . 16 Figure 2.3a . . . . . . . . . . . . . . . . . . . 18 Figure 2.4b . . . . . . . . . . . . . . . . . . . 18 Figure 2.5a . . . . . . . . . . . . . . . . . . . 19 Figure 2.5b . . . . . . . . . . . . . . . . . . . 19 Figure 2.5b . . . . . . . . . . . . . . . . . . . 19 Figure 2.6 . . . . . . . . . . . . . . . . . . . . 20 Figure 3.1 . . . . . . . . . . . . . . . . . . . . 23 Figure 3.2 . . . . . . . . . . . . . . . . . . . . 29 Figure 3.3 . . . . . . . . . . . . . . . . . . . . 29 Figure 4.1 . . . . . . . . . . . . . . . . . . . . 33 Figure 4.2 . . . . . . . . . . . . . . . . . . . . 35 Figure 4.3 . . . . . . . . . . . . . . . . . . . . 37 Figure 5.1 . . . . . . . . . . . . . . . . . . . . 43 Figure 5.2 . . . . . . . . . . . . . . . . . . . . 44 Figure 5.3 . . . . . . . . . . . . . . . . . . . . 45 Tables Table 4.1 . . . . . . . . . . . . . . . . . . . . . 34 Table 6.1 . . . . . . . . . . . . . . . . . . . . . 52 Table 7.1 . . . . . . . . . . . . . . . . . . . . . 59 Figure 5.4 . . . . . . . . . . . . . . . . . . . . 46 Figure 6.1 . . . . . . . . . . . . . . . . . . . . 49 Figure 6.2 . . . . . . . . . . . . . . . . . . . . 51 Figure 6.3 . . . . . . . . . . . . . . . . . . . . 54 Figure 7.1a . . . . . . . . . . . . . . . . . . . 57 Figure 7.1b . . . . . . . . . . . . . . . . . . . 57 Figure 7.1c . . . . . . . . . . . . . . . . . . . 58 Figure 7.1c . . . . . . . . . . . . . . . . . . . 58 Figure 8.1 . . . . . . . . . . . . . . . . . . . . 63 Figure 9.1 . . . . . . . . . . . . . . . . . . . . 68 Figure 9.2a . . . . . . . . . . . . . . . . . . . 69 Figure 9.2b . . . . . . . . . . . . . . . . . . . 69 Figure 9.3 . . . . . . . . . . . . . . . . . . . . 70 Figure 9.4 . . . . . . . . . . . . . . . . . . . . 72 Figure 10.1 . . . . . . . . . . . . . . . . . . . 75 Figure 10.2 . . . . . . . . . . . . . . . . . . . 76 Figure 11.1 . . . . . . . . . . . . . . . . . . . 81 Table 11.1 . . . . . . . . . . . . . . . . . . . . 79 Table 11.2 . . . . . . . . . . . . . . . . . . . . 83
Transcript of Ammonia Brochure 23/5/amend - PIK Research Portal · water, and that it will react with other...
1
Executive Summary . . . . . . . . . . . . . . . . . . . . . . . . . . . . . . . . . . . . . . . . . . . .2
Chapter 1 Background to the problem of ammonia in the UK . . . . . . . . . . . . .6
Chapter 2 Atmospheric concentrations and deposition . . . . . . . . . . . . . . . . .14
Chapter 3 Environmental impacts of ammonia on semi-natural habitats . . . . .22
Chapter 4 Estimating total ammonia emissions from the UK . . . . . . . . . . . . .32
Chapter 5 Ammonia emissions from cattle farming . . . . . . . . . . . . . . . . . . . .40
Chapter 6 Ammonia emissions from pig farming . . . . . . . . . . . . . . . . . . . . . .48
Chapter 7 Ammonia emissions from poultry farming . . . . . . . . . . . . . . . . . . .56
Chapter 8 Other livestock: sheep, goats, farmed deer and horses . . . . . . . . . .62
Chapter 9 Emissions from fertilizers and crops . . . . . . . . . . . . . . . . . . . . . . .66
Chapter 10 Emissions from non-agricultural sources . . . . . . . . . . . . . . . . . . . .74
Chapter 11 Overview of research on methods for reducing emissions from agriculture . . . . . . . . . . . . . . . . . . . . . . . . . . . . . . . . . . . . . .78
Annex 1 DEFRA inventory of annual emissions in the UK for 2000 . . . . . .86
Annex 2 Glossary . . . . . . . . . . . . . . . . . . . . . . . . . . . . . . . . . . . . . . . . . . .88
NH3
Contents Page
FiguresFigure 2.1 . . . . . . . . . . . . . . . . . . . . 15Figure 2.2 . . . . . . . . . . . . . . . . . . . . 16Figure 2.3 . . . . . . . . . . . . . . . . . . . . 16Figure 2.3a . . . . . . . . . . . . . . . . . . . 18Figure 2.4b . . . . . . . . . . . . . . . . . . . 18Figure 2.5a . . . . . . . . . . . . . . . . . . . 19Figure 2.5b . . . . . . . . . . . . . . . . . . . 19Figure 2.5b . . . . . . . . . . . . . . . . . . . 19Figure 2.6 . . . . . . . . . . . . . . . . . . . . 20Figure 3.1 . . . . . . . . . . . . . . . . . . . . 23Figure 3.2 . . . . . . . . . . . . . . . . . . . . 29Figure 3.3 . . . . . . . . . . . . . . . . . . . . 29Figure 4.1 . . . . . . . . . . . . . . . . . . . . 33Figure 4.2 . . . . . . . . . . . . . . . . . . . . 35Figure 4.3 . . . . . . . . . . . . . . . . . . . . 37Figure 5.1 . . . . . . . . . . . . . . . . . . . . 43Figure 5.2 . . . . . . . . . . . . . . . . . . . . 44Figure 5.3 . . . . . . . . . . . . . . . . . . . . 45
TablesTable 4.1. . . . . . . . . . . . . . . . . . . . . 34Table 6.1. . . . . . . . . . . . . . . . . . . . . 52Table 7.1. . . . . . . . . . . . . . . . . . . . . 59
Figure 5.4 . . . . . . . . . . . . . . . . . . . . 46Figure 6.1 . . . . . . . . . . . . . . . . . . . . 49Figure 6.2 . . . . . . . . . . . . . . . . . . . . 51Figure 6.3 . . . . . . . . . . . . . . . . . . . . 54Figure 7.1a . . . . . . . . . . . . . . . . . . . 57Figure 7.1b . . . . . . . . . . . . . . . . . . . 57Figure 7.1c . . . . . . . . . . . . . . . . . . . 58Figure 7.1c . . . . . . . . . . . . . . . . . . . 58Figure 8.1 . . . . . . . . . . . . . . . . . . . . 63Figure 9.1 . . . . . . . . . . . . . . . . . . . . 68Figure 9.2a . . . . . . . . . . . . . . . . . . . 69Figure 9.2b . . . . . . . . . . . . . . . . . . . 69Figure 9.3 . . . . . . . . . . . . . . . . . . . . 70Figure 9.4 . . . . . . . . . . . . . . . . . . . . 72Figure 10.1 . . . . . . . . . . . . . . . . . . . 75Figure 10.2 . . . . . . . . . . . . . . . . . . . 76Figure 11.1 . . . . . . . . . . . . . . . . . . . 81
Table 11.1 . . . . . . . . . . . . . . . . . . . . 79Table 11.2 . . . . . . . . . . . . . . . . . . . . 83

32
NH3
Executive SummaryAmmonia is a, colourless gas composed of nitrogen (N) and hydrogen (H) with thechemical symbol NH3. The gas is released mainly during naturally occurringprocesses, i.e. the breakdown of the urea excreted by farm livestock and other mammals or of the uric acid excreted by birds. Ammonia is very soluble in waterand readily reacts with other substances in the atmosphere to form ammonium(NH4
+) compounds such as ammonium sulphate and ammonium nitrate. Followingthe emission of ammonia gas to the atmosphere, it may be deposited to land eitheras gas or as ammonium-N compounds in rainfall. This can have profound effects onnatural ecosystems (e.g. heathland, moorland).
This booklet:
• explains why ammonia emissions from farming are causing concern; and
• summarizes the findings of many years’ research, funded mainly by DEFRA,into the sources and effects of ammonia emissions on the environment.
• describes studies to identify and develop practical and cost-effective ways ofreducing ammonia emissions from farming.
The main points are summarized below:
• Concentrations of ammonia in the air are greatest in those parts of the countrywith the most livestock farming, particularly where ammonia emissions aremainly from pig, poultry and cattle farming. High concentrations of ammonia arealso found in some urban areas. (See Chapter 2)
• Ammonia can also react with other chemicals in the atmosphere to produce fineparticles. There are legally binding targets for the levels of particles in air.Reducing ammonia emissions could help meet these targets.
• Ammonia reacts in the atmosphere to form particles containing ammonium.Most of these particles are removed from the atmosphre by rain, while thegaseous ammonia is absorbed by land surfaces (such as soil, water and vegetation).
• Although the greatest concentrations of ammonium-N in rain are found in thesouth and east of the UK, the deposition of ammonium-N in rain is largest in thenorth and west, because of greater rainfall. Ammonia compounds can betransported in the atmosphre over long distances. Some of the ammoniadeposited in the UK comes from emissions sources outside the UK, while asignificant amount of the UK’s ammonia emission is deposited in other countries.
• Direct deposition of ammonia gas is largest in high-emission areas, whereammonia concentrations are greatest. Deposition rates vary depending on thevegetation and the nearest ammonia source.
• There is little deposition of ammonia gas to intensively farmed land with high Nfertilizer inputs, because that land is largely a net source of ammonia. As aresult, deposition of ammonia from the atmosphere is mainly to unfertilized landwith a small N content. This makes semi-natural ecosystems and conservationareas more vulnerable to ammonia deposition.
• The concentration of N in foliage increases with increasing levels of N depositedfrom the atmosphre onto soils and vegetation (see Chapter 3). This may increaseplant sensitivity to stress (for example from frost, drought and insect damage).
• Nitrogen deposition has contributed to changes in the mix of plant speciesgrowing in a range of semi-natural habitats (e.g. heathland, moorland and bogs)in many parts of the UK.
• In a number of semi-natural habitats over large areas of the UK, the current deposition of ammonium-N from the atmosphere is above the critical load of N.The critical load is the amount of pollutant deposited below which significant harmful effect on specified elements of the environment do not occur,according to current knowledge. Nitrogen deposition can also make soil andsurface waters acidic.
• Agriculture is the largest source of ammonia and the increased use of N inlivestock farming has increased ammonia emissions over the last 50 years.
• Emissions of other air pollutants, such as sulphur dioxide, that can damage theenvironment have been greatly reduced over recent years due to reductions byindustry and the transport sectors. This means that the relative importance ofammonia as a pollutant has increased.
• In order to protect sensitive habitats the UK has signed a number of internationalagreements to reduce ammonia emissions: the UNECE Gothenburg Protocol, theEU National Emission Ceilings Directive and the EU Intergrated Pollution,Prevention and Control Directive.
• An inventory, or detailed list, has been drawn up to estimate how much ammoniais emitted by each of the main livestock groups (cattle, pigs, poultry, sheep andother livestock), and nitrogen fertilizer we use in the UK. Non-agriculturalsources (e.g. industrial processes, sewage, wild animals and birds) of ammoniaare also included in the inventory.
Ammonia in the UK

54
NH3
• Total UK emissions of ammonia are currently estimated to be 320 kilotonnes (kt), give or take 15%, which gives an estimated range of emissions of 270-370 kt. Around 80% of these emissions are from agriculture.
• Cattle farming produces 44% of the UK’s total ammonia emissions. Most of theammonia losses are from manure spreading on land (48% of cattle emissions)and from livestock housing (34% of cattle emissions).
• Pig farming produces 9% of the UK’s total ammonia emissions. Most of theammonia losses are from housing (64% of pig emissions) and following manurespreading on land (26% of pig emissions).
• Poultry farming produces 14% of the UK’s total ammonia emissions. Just under halfof the emissions from poultry production come from housing, with the sameamount coming from manure spreading.
• Significant emissions of ammonia come from categories of livestock other thancattle, pigs and poultry, but these emissions are smaller and mostly associatedwith the UK sheep population.
• Using N-containing fertilizers on land produces around 9% of the UK’s totalammonia emissions.
• Non-agricultural sources emit around 50–60 kt of ammonia emission. A widerange of non-agricultural sources contribute to ammonia emissions in the UK, including:
– pets;
– wild animals;
– sewage sludge;
– industrial and combustion (burning) processes; and
– petrol vehicles fitted with catalytic converters.
• There are several potential options to reduce ammonia emissions from non-agricultural sources. Given the large number of small sources a broad approachwould be required to make significant reductions. Vehicles fitted with catalyticconverters, sewage sludge processing and industrial processes are the sectorswith the most potential to reduce non-agricultural emmisions.
• A wide range of possible ways to reduce ammonia emissions from agriculturehas been examined experimentally within the research programme funded by DEFRA. There are discussed at the end of each livestock chapter andsummarized in Chapter 11.
• A simple model has been developed by researers to see which are likely to bethe most cost-effective ways of reducing ammonia emissions from agriculture.These are usually techniques to reduce emissions following manure spreadingand during slurry storage.
• Work is continuing to assess viable emission reduction techniques which:
• do not increase emissions at a later stage in the management of manure;
• are cost-effective;
• are practical; and
• can be used by most farmers.
• It is important to consider ammonia emission and abatement within the widercontext of nitrogen flow and use on farms.
• The most promising methods are being assessed on commercial farms in the UKto see how practical and expensive these methods are (Chapter 11).
Ammonia in the UK

76
NH3
Background to the problem of ammoniain the UKJ Webb (ADAS), Brian Pain and Mark Sutton (CEH)
Chapter 1Background to the problem of ammoniain the UKJ Webb (ADAS), Brian Pain and Mark Sutton (CEH)
Why ammonia?
Ammonia is a soluble and reactive gas. This means that it dissolves, for example inwater, and that it will react with other chemicals to form ammonia containingcompounds. It contains nitrogen (N) and is readily deposited from the atmosphereonto soils and plants. This ‘deposition’ of ammonia from the atmosphere maydamage plant communities that have evolved on nutrient-poor habitats (such asheathlands, upland bogs and some forests) by increasing the amount of N in thesoil. While this extra N may increase the growth of plants adapted to a limited N supply (such as heathers), other plants (such as rough grasses) can use the N more effectively. This enrichment by N, also known as ‘eutrophication’, canoverwhelm those existing species that are not as well able to cope with the extra N and mean that they are replaced by a few rank (fast-growing) grass species andother undesirable species. A major concern is that the plants growing on manyvaluable conservation areas in the UK are adapted to a limited supply of N and aretherefore particularly vulnerable to increased ammonia deposition.
Ammonia may also cause soils to become acidic. Once deposited on soil, ammoniamay be oxidised to nitrate by a chemical process that increases soil acidity(acidification). Soils can neutralize limited amounts of acid, but they may reach apoint where they are not able to cope with the increasing amount of acid deposited.Once this level is reached and soil acidity increases, toxic elements such asaluminium will become more available to plants while other elements vital for plantgrowth will become less available. Toxic elements may then be leached into surfacewaters where they also poison fish and other aquatic life. The most obvious examplesof acidification in the UK are the acidified lakes and streams in many uplandareas. While acidification has been largely caused by sulphur dioxide emitted from industry, N can also play a role. Nitrogen deposition is thought to delay therecovery of habitats now that sulphur dioxide emissions have been reduced.
Ammonia is a very reactive gas, which means that most of it is deposited close towhere it was emitted. However, some ammonia may reach higher levels in theatmosphere and be blown long distances before being deposited in rainfall. When ammonia reacts with sulphur and nitrogen oxides in the atmosphere, it formsparticles containing ammonium-N. These particles can travel for hundreds of miles,so ammonia emissions from one country may cause damage in another.
Another effect of ammonia is that, close to large emission sources (such as buildingsthat house livestock), very high concentrations of the gas can damage vegetation.
Ammonia can also react in the atmosphere to produce fine particles. These arelegally binding targets for the levels of particles in the air. Reducing ammoniaemissions could help to meet these targets.
• Ammonia may damage sensitive habitats by nitrogen enrichment and acidification.
• Agriculture is the largest source of ammonia, and increased N inputs to livestockfarming have increased ammonia emissions over the last 50 years.
• Since emissions of other air pollutants such as sulphur dioxide that can alsodamage wildlife habitats – have been greatly reduced over recent years, the relative importance of ammonia has increased.
• The UK has signed international agreements to curb ammonia emissions, in orderto reduce their effects on the environment.
Main Points
Chapter 1
“ He who is within the sphere of the scent of a dunghill, smellsthat which his crop would have eaten, if he had permitted it.Instead of manuring his land, he manures the atmosphere;and before his dunghill has finished turning, he has manuredanother parish, perhaps another county.”
Statement made by Arthur Young, the 18th century agricultural pioneer, as reported
by Thomas Potts in 1807. Perhaps without realising, Young identified the problem of
ammonia emission.
Ammonia in the UK
98
NH3
In December 2001, the National Expert Group on Transboundary Air Pollutionpublished a report for DEFRA and the devolved administrations on the impact ofair pollution on ecosystems in the UK and prospects for the future. The reporthighlighted the adverse environmental effects of ammonia.
Why agriculture?
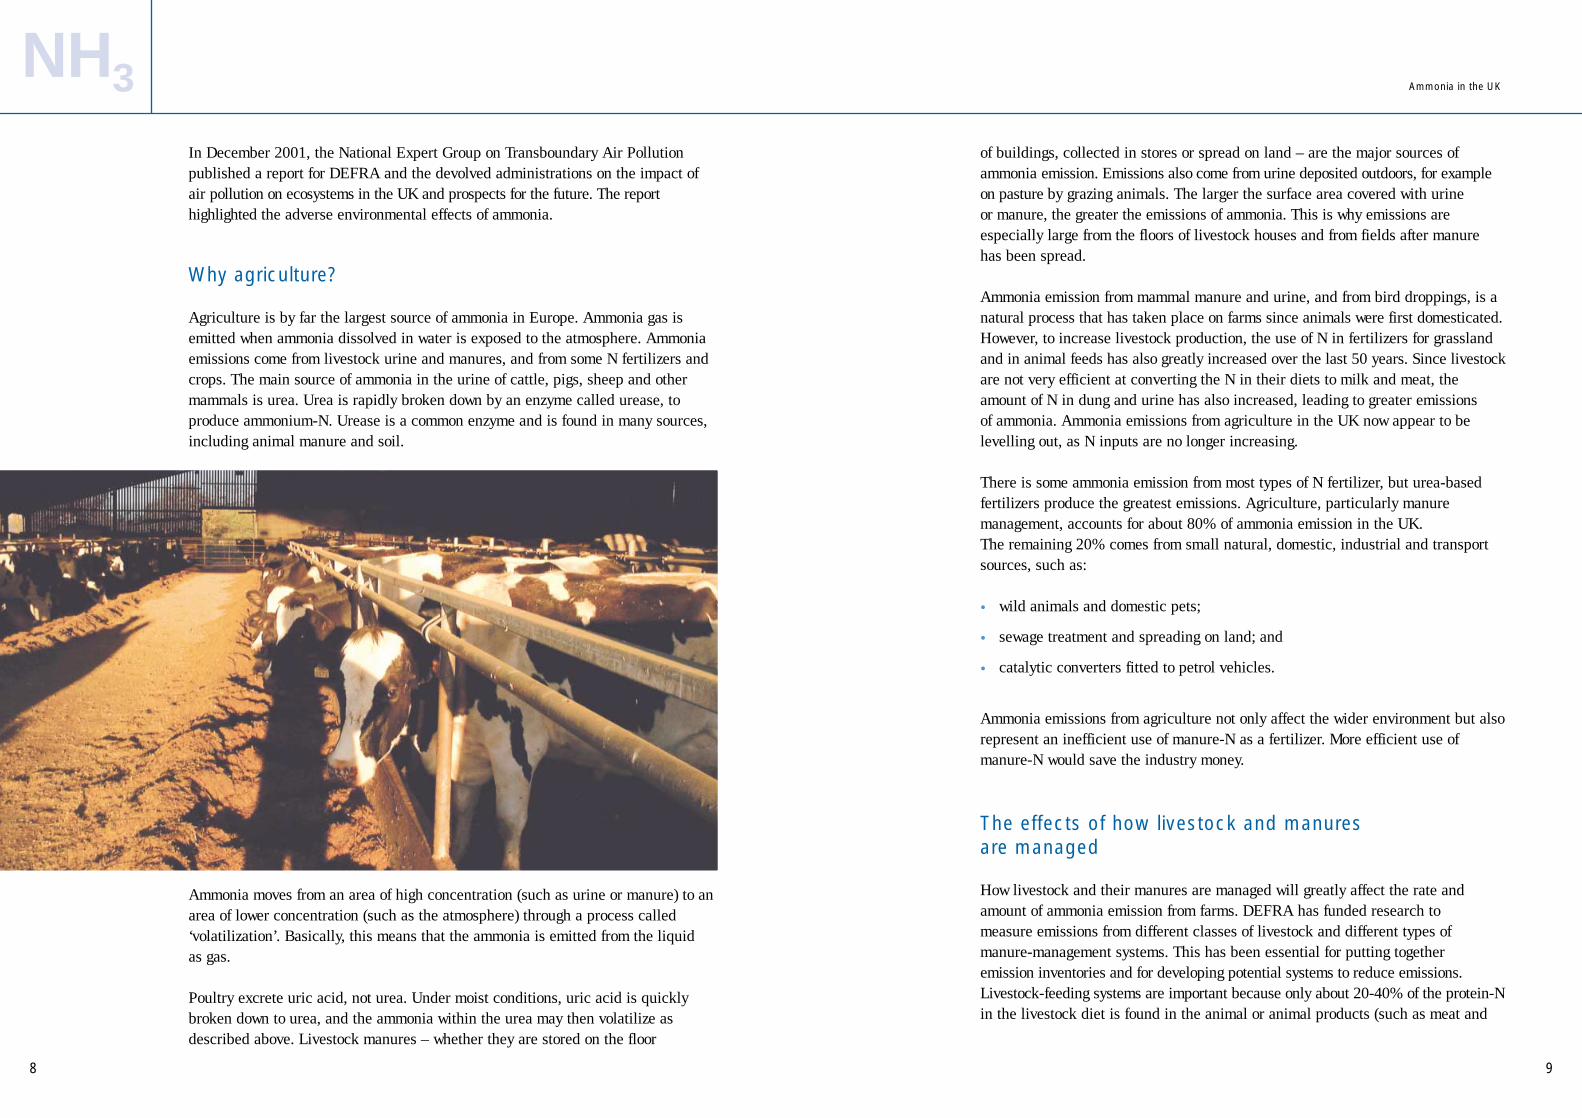
Agriculture is by far the largest source of ammonia in Europe. Ammonia gas isemitted when ammonia dissolved in water is exposed to the atmosphere. Ammoniaemissions come from livestock urine and manures, and from some N fertilizers andcrops. The main source of ammonia in the urine of cattle, pigs, sheep and othermammals is urea. Urea is rapidly broken down by an enzyme called urease, toproduce ammonium-N. Urease is a common enzyme and is found in many sources,including animal manure and soil.
Ammonia moves from an area of high concentration (such as urine or manure) to anarea of lower concentration (such as the atmosphere) through a process called‘volatilization’. Basically, this means that the ammonia is emitted from the liquid as gas.
Poultry excrete uric acid, not urea. Under moist conditions, uric acid is quicklybroken down to urea, and the ammonia within the urea may then volatilize asdescribed above. Livestock manures – whether they are stored on the floor
of buildings, collected in stores or spread on land – are the major sources of ammonia emission. Emissions also come from urine deposited outdoors, for exampleon pasture by grazing animals. The larger the surface area covered with urine or manure, the greater the emissions of ammonia. This is why emissions areespecially large from the floors of livestock houses and from fields after manure has been spread.
Ammonia emission from mammal manure and urine, and from bird droppings, is anatural process that has taken place on farms since animals were first domesticated.However, to increase livestock production, the use of N in fertilizers for grasslandand in animal feeds has also greatly increased over the last 50 years. Since livestockare not very efficient at converting the N in their diets to milk and meat, theamount of N in dung and urine has also increased, leading to greater emissions of ammonia. Ammonia emissions from agriculture in the UK now appear to be levelling out, as N inputs are no longer increasing.
There is some ammonia emission from most types of N fertilizer, but urea-basedfertilizers produce the greatest emissions. Agriculture, particularly manuremanagement, accounts for about 80% of ammonia emission in the UK. The remaining 20% comes from small natural, domestic, industrial and transportsources, such as:
• wild animals and domestic pets;
• sewage treatment and spreading on land; and
• catalytic converters fitted to petrol vehicles.
Ammonia emissions from agriculture not only affect the wider environment but alsorepresent an inefficient use of manure-N as a fertilizer. More efficient use ofmanure-N would save the industry money.
The effects of how livestock and manures are managed
How livestock and their manures are managed will greatly affect the rate and amount of ammonia emission from farms. DEFRA has funded research to measure emissions from different classes of livestock and different types of manure-management systems. This has been essential for putting together emission inventories and for developing potential systems to reduce emissions.Livestock-feeding systems are important because only about 20-40% of the protein-Nin the livestock diet is found in the animal or animal products (such as meat and
Ammonia in the UK
1110
NH3
milk). The rest is excreted (in dung and urine), of which at least 50% is urea (or uric acid for poultry). One of the first steps to reducing ammonia emissions is tomake sure that animals are not fed more protein than they need.
Ammonia losses are usually less from urine deposited directly onto soil (such as by grazing animals) than from that deposited in or around livestock buildings. This is because urine may be absorbed quickly by the soil, so that ammonia emissions stop. Urine deposited in and around buildings (on concrete or other solidsurfaces) cannot be absorbed. Instead, it mixes with dung that contains urease, sothe urea is rapidly broken down to release ammonia. Depending on the type ofmanagement, manures are commonly collected and spread onto land as liquid slurries, or more solid materials such as farmyard manure (FYM) or poultry litter.Slurries (urine mixed with dung) are much thicker than urine and so are more slowly absorbed by the soil. Nitrogen dissolved in FYM and poultry litter takeseven longer to be absorbed.
Taking into consideration the whole manure management process from housing toland spreading there are no consistent differences in emissions between straw- andslurry-based systems. However, since slurry can be pumped into covered manurestores, and spread either directly into soil or under crop canopies, there is greaterscope to reduce emissions from slurry-based systems.
While livestock are being housed, ammonia emissions are affected by physical factors such as:
• temperature;
• ventilation (air-flow) rate; and
• for slurry systems, the design of the floor (such as fully slatted or partly slatted)and how often and with what it is cleaned.
For stored manures, emissions increase with increased:
• mixing, or ‘turning’;
• temperature;
• windspeed; and
• slurry pH.
When slurries are being spread on land, ammonia emissions are affected by:
• slurry dry-matter content;
• windspeed;
• rainfall;
• temperature;
• soil condition (such as moisture content); and
• the slurry-spreading method used.
The close relationship between the amount of ammonia emitted and the dry-mattercontent of cattle slurry suggests that for every 1% increase in dry matter, there is a 5% increase in the loss of ammonium-N. This is because dilute slurries areabsorbed more quickly into the soil and so the ammonium-N is less likely to bereleased as ammonia. Conditions at the soil surface are also important and anythingthat prevents the slurry being absorbed may increase emission; such as:
• surface capping;
• compaction;
• wet soil; or
• a layer of crop residues.
Why now?
It takes a long time for the damage caused by ammonia to be noticeable. Soils canneutralise limited amounts of acid, and it may take decades before they exhaustthis ability. Also, enrichment by N may take place for many years before morecompetitive undesirable plants replace sensitive plants of high conservation value.
Over recent years, there have been large reductions in the emissions of some otherimportant atmospheric pollutants. Sulphur dioxide emissions were the first to beidentified as a cause of acidification, and they have been reduced by 80% fromtheir peak. Emissions of various nitrogen oxides have been reduced by 40%.However, in some sensitive areas, deposition of ammonia alone is enough todamage sensitive habitats.
Ammonia in the UK
1312
NH3
be needed. And, it may be neccessary to look at how ammonia affects sensitivehabitats on a more local or regional level.
Whether or not specific abatement measures will be needed, there is a strongargument for reducing ammonia emissions – not only to avoid environmentaldamage but also to use N for grass and crop production as efficiently, and cost-effectively, as possible.
Ammonia can also react with other chemicals in the atmosphere to produce fineparticles. These are legally binding targets for the levels of particles in air. Reducingammonia emissions could help meet these targets.
The following chapters give more information on the environmental effects and sizeof ammonia emissions, including:
• results of work on each of the main livestock-production groups;
• data from crops and fertilizers; and
• information on what can be done by each group to reduce those emissions.
• information on non-agricultural sources of ammonia
The final section is an overview of potential methods to reduce emissions from thefarming industry as a whole.
The inventory of annual ammonia emissions in the UK for 2000 is presented at theend of this booklet.
Some countries have already taken action to reduce ammonia emissions from farms. Strict regulations are in force in the Netherlands, for example, where thecombination of intensive livestock production and valuable natural habitats onacid-sensitive soils has led to a serious ammonia problem.
In the UK, estimates suggest that ammonia emissions could decline by 10%between 1990 and 2010. This is a result of decreases in national livestock numbersand a reduction in fertilizer-N use, which is bringing the national emissions close to the target of 297 kt a year agreed under the Gothenburg Protocol and theNational Emission Ceiling Directive (see above). However, future emissionestimates are basically uncertain so specific abatement (reduction) methods may
Policy on Ammonia
• The Protocol to Abate Acidification, Eutrophication and Ground-levelOzone (Gothenburg Protocol) of the UNECE Convention on Long-RangeTransboundary Air Pollution was signed by environment ministers in1999, and is expected to come into force in 2003. Annex ll of theProtocol sets annual emission limits (ceilings) for four pollutants,including ammonia, which are to be met by 2010. The ammonia targetfor the UK is 297 kt a year. Annex IX of the Protocol contains a numberof requirements. Signatories (those signing up to this Protocol) must:
• distribute an advisory code of good agricultural practice to control ammonia emissions;
• take reasonable steps to limit ammonia emissions from using solid fertilizers based on urea;
• ban the use of ammonium carbonate fertilizers;
• put in place specific measures on manure spreading and storage, and animal housing, for pigs and poultry. In the UK, these specific measuresare the same as those required in the IPPC Directive.
• The EU National Emission Ceilings Directive came into force in November2001 and will become UK law in November 2002. This targets the sameair pollutants as the Gothenburg Protocol and sets the same limit onammonia emission, which is also to be met by 2010.
• The EU Directive on Integrated Pollution Prevention and Control (IPPC)includes a requirement for large pig and poultry units to take measures toreduce emissions of a range of pollutants, including ammonia (appliesnow to new units and from 2007 to existing units).
Ammonia in the UK

15
Introduction
Ammonia emissions increase both the concentrations of ammonia in the air and theatmospheric deposition of compounds containing N. The areas where the ammoniaconcentration is high enough to damage plants are limited to areas near to largesources of ammonia, such as intensive livestock farms. In the UK and Europe, theproblem of ammonia is largely due to the indirect effects of increased nitrogendeposition rather than the direct effects of ammonia concentration (see Chapter 3).
Ammonia can react in the atmosphere to form fine particles containing ammonium(NH4
+), which can be carried over long distances before they are removed by rain.Together ammonia and ammonium are often called ‘reduced nitrogen’ (NHx). Gasesand particles can be removed from the atmosphere by being absorbed by land andwater surfaces (dry deposition). Most of the ammonia is removed from theatmosphere in this way. Ammonium and ammonia can also be removed from theatmosphere by rain or snow (known as wet deposition).
To assess the risk of environmental damage due to ammonia emission, requiresinformation on the concentrations of ammonia in the atmosphere and the rates ofdeposition. Given the short lifetime of ammonia in the atmosphere, and the unevendistribution of emissions and rainfall across the country, there is a large variation in ammonia concentration and deposition. To deal with this variation, bothmeasurements and mathematical models are required. Models are useful to analyzepossible future changes in emissions. They can also give detailed estimates for differentparts of the UK, which would be very expensive to obtain by taking measurements.
14
NH3
Chapter 2
• The concentrations of ammonia in the air are greatest in parts of the country with a large proportion of livestock farming, particularly where pig, poultry and cattle farming produce the ammonia emissions. Concentrations are also high insome urban areas.
• A proportion of ammonia emitted reacts with other chemicals in the atmosphere toform particles containing ammonium. Most of these particles are removed from theatmosphre by rain, while the ammonia itself is absorbed directly by land surfaces(such as vegetation, soil and water).
• Although the greatest concentrations of ammonium in rain are found in the southand east of the UK, the total deposition of ammonium in rain is largest in the northand west, because of greater rainfall. Some of this deposition comes fromemissions outside the UK, while a significant amount of the UK’s ammoniaemission is deposited in other countries.
• Direct deposition of ammonia gas is largest where ammonia concentrations aregreatest in parts of the country with most livestock per unit area. Deposition ratesvary greatly depending on the distance from large sources of ammonia, such as farms.
• There is little deposition of ammonia gas to intensively managed farmland, which islargely a net source of ammonia. As a result, atmospheric inputs are concentratedon unfertilized land. This makes semi-natural areas, which are a priority forconservation more vulnerable to ammonia deposition.
Main Points
Atmospheric concentrations and deposition
Mark Sutton and David Fowler (CEH)
Ammonia in the UK
Figure 2.1Ammonia flows in
the atmosphere
17
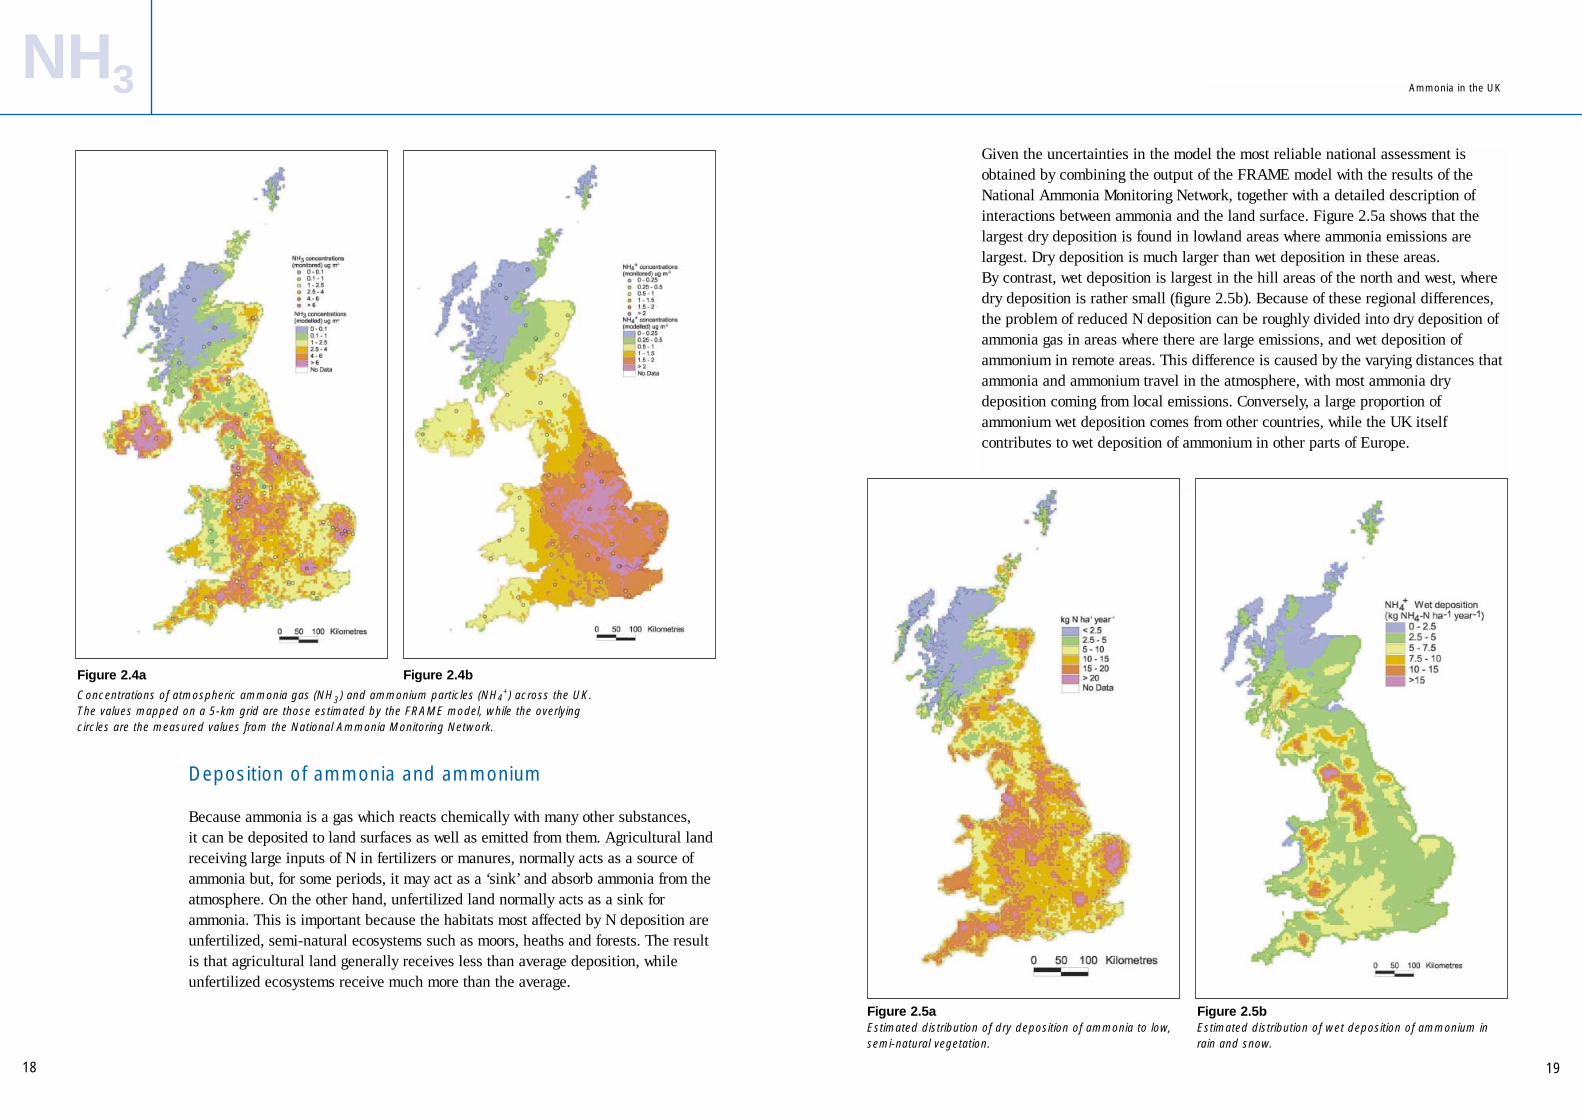
The emitted ammonia gas can be rapidly converted into ammonium in particles. It is therefore neccessary to model both the gas and particle forms to characterise of the concentrations and deposition of reduced N. The estimated concentrations of ammonia gas and ammonium particles are given by the FRAME model (see later)(figure 2.4). The concentration of ammonia varies greatly at a local and regional level,in line with variation in emissions. On the other hand, the estimated distribution ofammonium particles does not vary as much, because processes that produce andremove ammonium generally take place over hours and days.
National Ammonia Monitoring Network
The National Ammonia Monitoring Network was set up in 1996 to provide a referencefor ammonia concentrations in the UK. Since 1999, the network has also includedmeasurements of ammonium particles. As ammonia concentrations vary greatlyfrom area to area, the network has over 80 sites and this allows areas of the countrywith different ammonia source types (figure 2.3) to be considered. These samplingsites were deliberately chosen to compare a wide range of locations across thecountry, and to cover areas where concentrations were expected to be both high andlow. The FRAME model was also used to identify some areas for intensivesampling, such as a transect across East Anglia.
When monitoring ammonia, long-term trends, seasonal patterns and a large numberof sites are more important than frequent sampling at each site. Because of this,new methods were developed to allow the network to measure ammonia andammonium continuously with a monthly change-over. The peaks in ammoniaconcentration are found in the major livestock-farming regions (see figure 2.4),while the much smoother pattern of ammonium particles shows a combination of:
• the main emission regions;
• the average westerly air flow; and
• the time it takes to form ammonium particles.
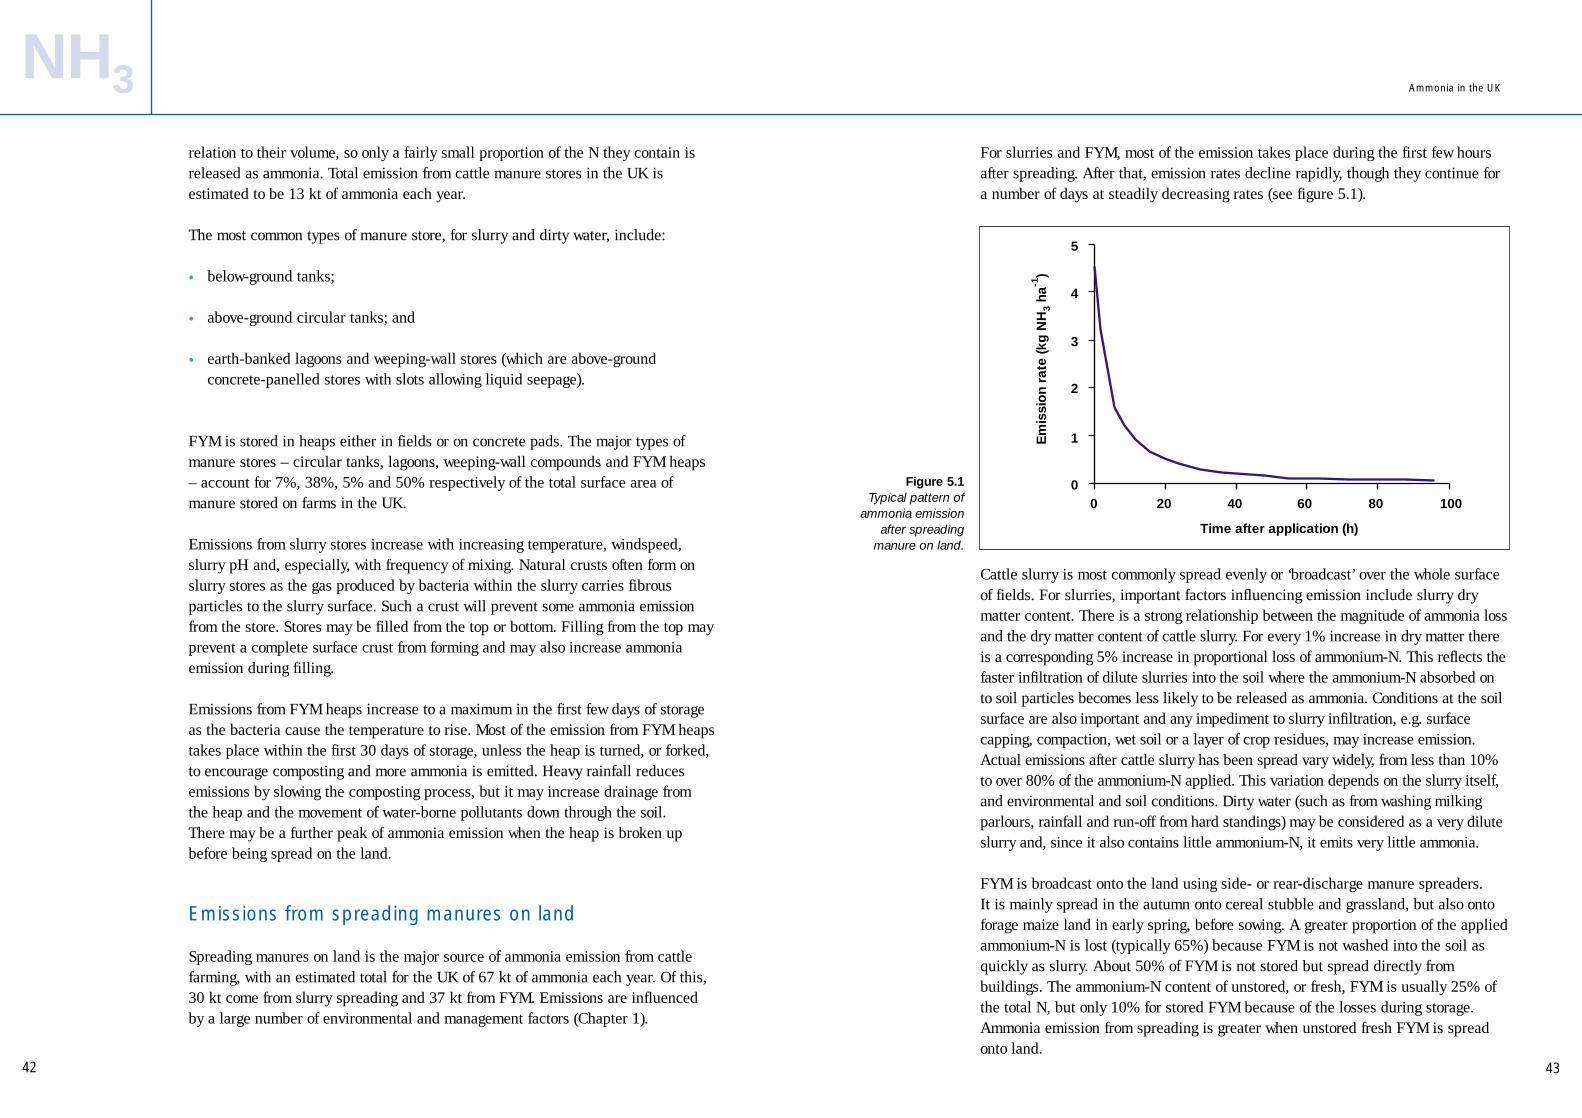
There is a substantial seasonal variation in measured ammonia concentrations,which differs according to the main sources of ammonia emissions. In remote areas,and those where sheep are the main ammonia source, ammonia concentrations arelargest in the summer. However, in areas with housed livestock, peak ammoniaconcentrations coincide with manure spreading on grassland (late winter, earlyspring) and on arable land (early autumn).
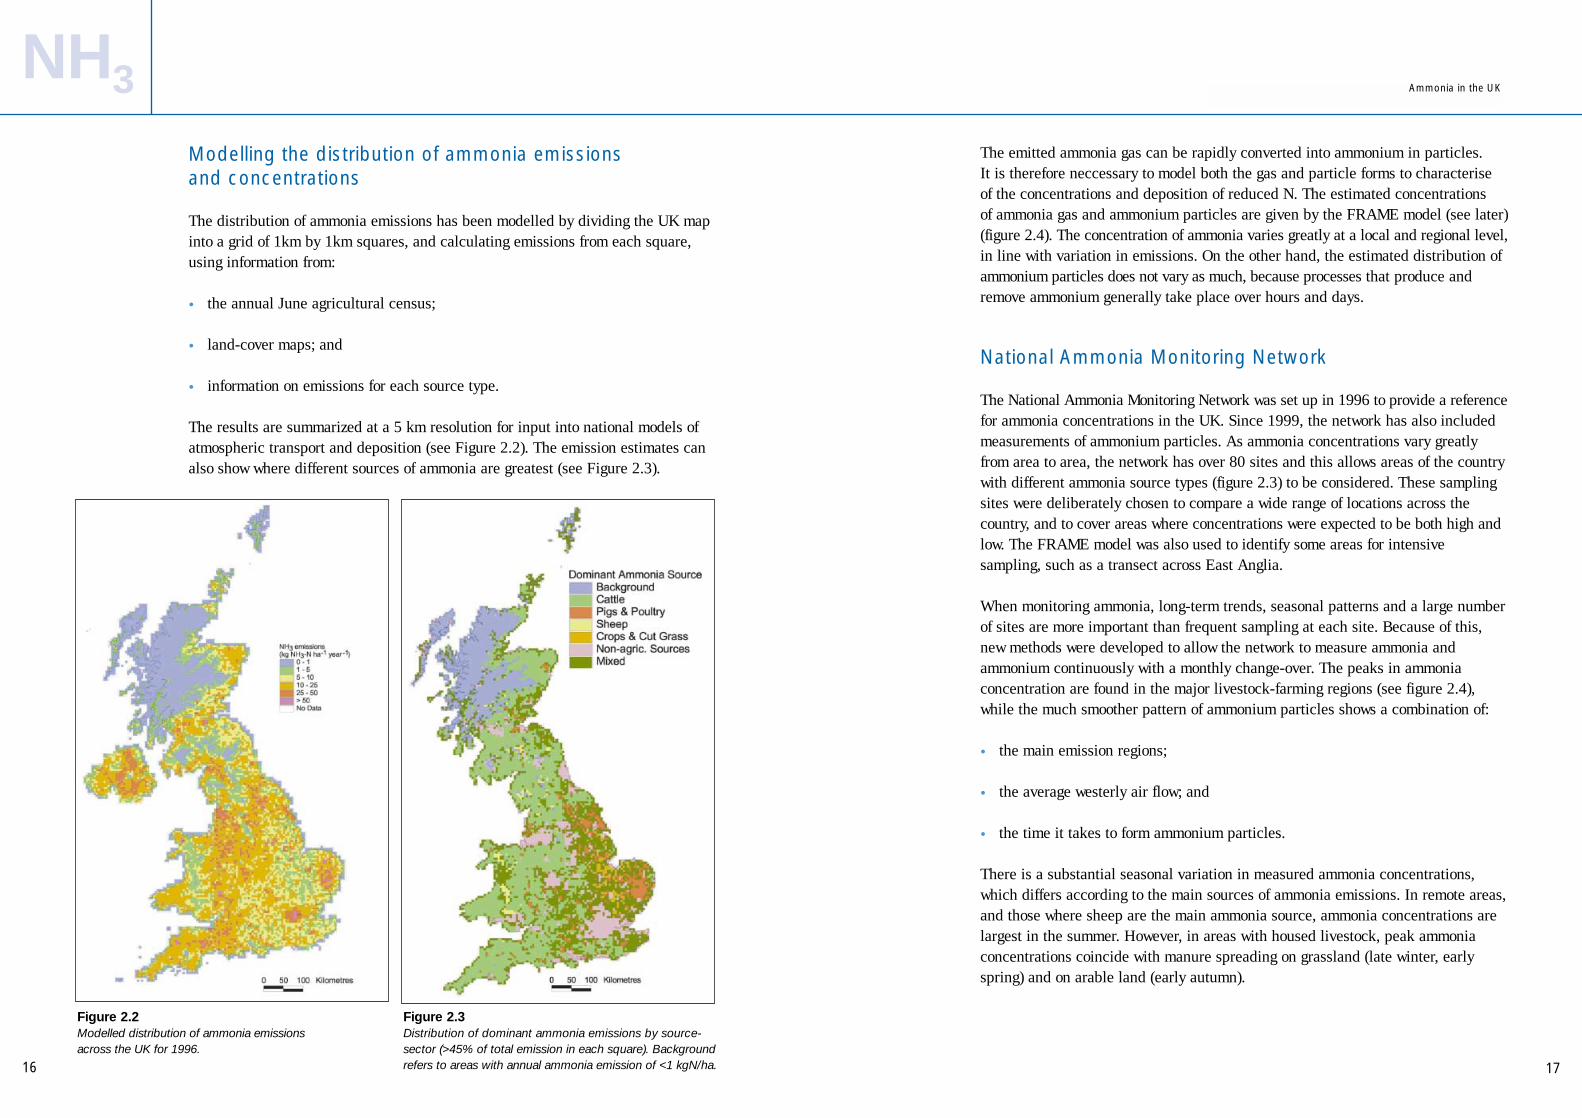
Modelling the distribution of ammonia emissions and concentrations
The distribution of ammonia emissions has been modelled by dividing the UK mapinto a grid of 1km by 1km squares, and calculating emissions from each square,using information from:
• the annual June agricultural census;
• land-cover maps; and
• information on emissions for each source type.
The results are summarized at a 5 km resolution for input into national models ofatmospheric transport and deposition (see Figure 2.2). The emission estimates canalso show where different sources of ammonia are greatest (see Figure 2.3).
16
NH3 Ammonia in the UK
Figure 2.2Modelled distribution of ammonia emissionsacross the UK for 1996.
Figure 2.3Distribution of dominant ammonia emissions by source-sector (>45% of total emission in each square). Backgroundrefers to areas with annual ammonia emission of <1 kgN/ha.
19
Deposition of ammonia and ammonium
Because ammonia is a gas which reacts chemically with many other substances, it can be deposited to land surfaces as well as emitted from them. Agricultural landreceiving large inputs of N in fertilizers or manures, normally acts as a source ofammonia but, for some periods, it may act as a ‘sink’ and absorb ammonia from theatmosphere. On the other hand, unfertilized land normally acts as a sink forammonia. This is important because the habitats most affected by N deposition areunfertilized, semi-natural ecosystems such as moors, heaths and forests. The resultis that agricultural land generally receives less than average deposition, whileunfertilized ecosystems receive much more than the average.
18
Given the uncertainties in the model the most reliable national assessment isobtained by combining the output of the FRAME model with the results of theNational Ammonia Monitoring Network, together with a detailed description ofinteractions between ammonia and the land surface. Figure 2.5a shows that thelargest dry deposition is found in lowland areas where ammonia emissions arelargest. Dry deposition is much larger than wet deposition in these areas. By contrast, wet deposition is largest in the hill areas of the north and west, where dry deposition is rather small (figure 2.5b). Because of these regional differences,the problem of reduced N deposition can be roughly divided into dry deposition ofammonia gas in areas where there are large emissions, and wet deposition ofammonium in remote areas. This difference is caused by the varying distances thatammonia and ammonium travel in the atmosphere, with most ammonia drydeposition coming from local emissions. Conversely, a large proportion ofammonium wet deposition comes from other countries, while the UK itselfcontributes to wet deposition of ammonium in other parts of Europe.
Figure 2.4aConcentrations of atmospheric ammonia gas (NH3) and ammonium particles (NH4
+) across the UK.The values mapped on a 5-km grid are those estimated by the FRAME model, while the overlyingcircles are the measured values from the National Ammonia Monitoring Network.
Figure 2.4b
NH3 Ammonia in the UK
Figure 2.5aEstimated distribution of dry deposition of ammonia to low,semi-natural vegetation.
Figure 2.5bEstimated distribution of wet deposition of ammonium inrain and snow.
21
Methods of ammonia abatement
To a large extent, abatement of the environmental impacts of ammonia focuses onreductions in ammonia emissions. In this context the national targets of the UNECEGothenburg Protocol and the EU National Emissions Ceilings Directive play anessential role. However, given the potential costs of reducing ammonia emissions, suchceilings should not be considered as the only tool for reducing environmental impacts.
The high degree of spatial variability is a key feature of ammonia concentrations anddeposition. While this leads to the potential for major localized impacts on theenvironment, it also provides the opportunity to reduce deposition to particularlysensitive habitats by spatial planning. At its simplest, this might mean not siting anew development of an ammonia source, such as an intensive livestock farm, adjacentto a vulnerable nature reserve. Such approaches could also include the establishmentof buffer zones to limit ammonia emissions from fields around nature reserves. Afurther possibility is the increased planting of tree belts (strips of woodland) adjacentto sources, which may be used to recapture a fraction of the ammonia as well as toincrease dispersion, with the result that deposition to other particularly vulnerablehabitats is reduced. By contrast to dry deposition, wet deposition of ammonium couldonly be reduced through national and international emission reduction measures.
Further reading
Dragosits U, Sutton M A, Place C J and Bayley A (1998) Modelling the spatialdistribution of ammonia emissions in the UK. Environmental Pollution 102, S1, 195-203.
Dragosits U, Theobald M R, Place C J, Lord E, Webb J, Hill J, ApSimon H M and SuttonM A (2002) Ammonia, emission, deposition and impact assessment at a field scale:a case study of sub-grid spatial variability. Environmental Pollution 117 (1) 147-158.
Sutton M A, Asman W A H, Ellerman T, van Jaarsveld J A, Acker K, Aneja V,Duyzer J H, Horvath L, Paramonov S, Mitosinkova M, Tang Y S, Achermann B,Gauger T, Bartnicki J, Neftel A and Erisman J W (2001). Establishing the linkbetween ammonia emission control and measurements of reduced nitrogenconcentrations and deposition. In: UN-ECE Ammonia Expert Group (Berne 18-20Sept 2000) Proceedings (Eds: Menzi H. and Achermann B.) pp 57-84 Swiss Agencyfor Environment, Forest and Landscape (SAEFL), Bern.
Sutton M A, Lee D S, Dollard G J and Fowler D (1998) International conference on atmospheric ammonia: emission, deposition and environmental impacts.(Eds.) Atmospheric Environment 32 (3), 269-594.
Sutton M A, Tang Y S, Dragosits U, Fournier N, Dore T, Smith R I, Weston K J andFowler D (2001) A spatial analysis of atmospheric ammonia and ammonium in theUK. The Scientific World 1 (S2), 275-286.
You will find information on the National Ammonia Monitoring Network at:www.nbu.ac.uk/cara
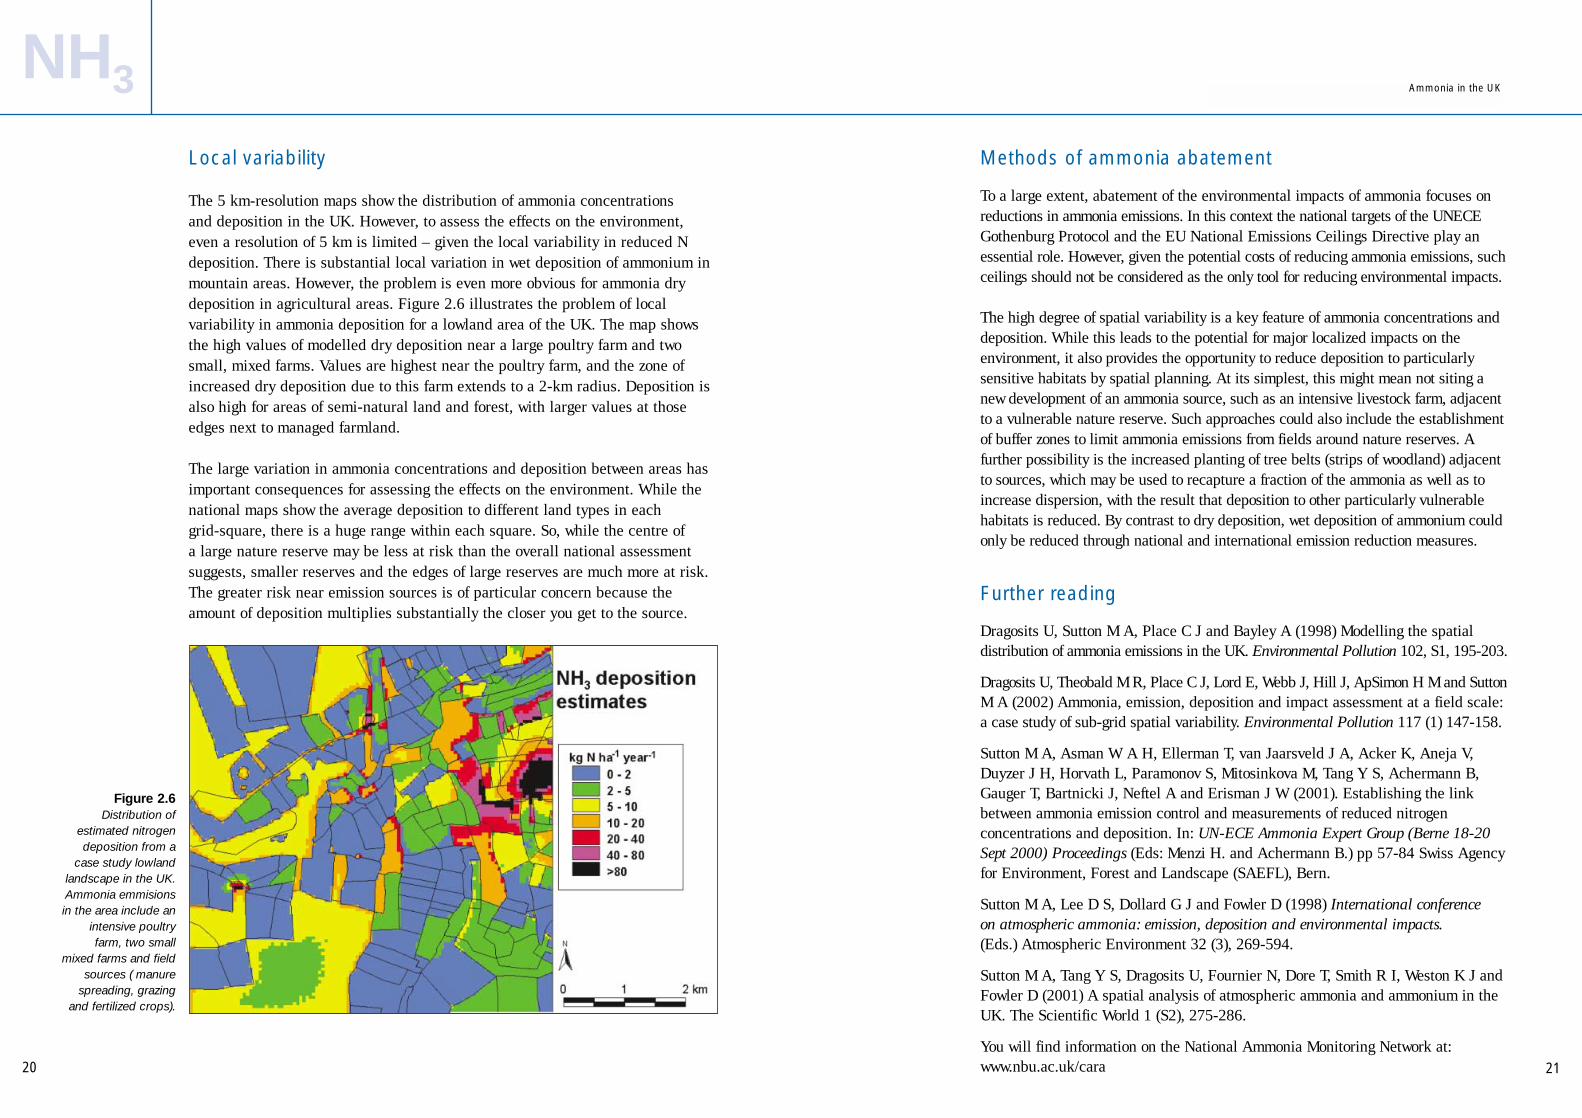
Local variability
The 5 km-resolution maps show the distribution of ammonia concentrations and deposition in the UK. However, to assess the effects on the environment,even a resolution of 5 km is limited – given the local variability in reduced Ndeposition. There is substantial local variation in wet deposition of ammonium inmountain areas. However, the problem is even more obvious for ammonia drydeposition in agricultural areas. Figure 2.6 illustrates the problem of localvariability in ammonia deposition for a lowland area of the UK. The map showsthe high values of modelled dry deposition near a large poultry farm and twosmall, mixed farms. Values are highest near the poultry farm, and the zone ofincreased dry deposition due to this farm extends to a 2-km radius. Deposition isalso high for areas of semi-natural land and forest, with larger values at thoseedges next to managed farmland.
The large variation in ammonia concentrations and deposition between areas hasimportant consequences for assessing the effects on the environment. While thenational maps show the average deposition to different land types in each grid-square, there is a huge range within each square. So, while the centre of a large nature reserve may be less at risk than the overall national assessmentsuggests, smaller reserves and the edges of large reserves are much more at risk.The greater risk near emission sources is of particular concern because theamount of deposition multiplies substantially the closer you get to the source.
20
NH3 Ammonia in the UK
Figure 2.6Distribution of
estimated nitrogendeposition from a
case study lowlandlandscape in the UK.Ammonia emmisionsin the area include an
intensive poultryfarm, two small
mixed farms and fieldsources ( manure
spreading, grazingand fertilized crops).
23
emissions and as oxidised nitrogen compounds (NHy) that result from emissions ofnitrogen oxides (NOx). Although the effects of increased N deposition on land-basedecosystems are now clear, it is often difficult to separate the effects of nitrogenoxides and ammonia in field observations.
In December 2001, the National Expert Group on Transboundary Air Pollution(NEGTAP) published a report for DEFRA and the devolved administrations on the impact of air pollution on ecosystems in the UK and prospects for the future.The report highlighted the adverse impacts of reduced N on vegetation.
22
NH3
Environmental impacts of ammonia onsemi-natural habitatsMike Hornung (CEH), Mike Ashmore (Bradford University) and Mark Sutton (CEH)
Introduction
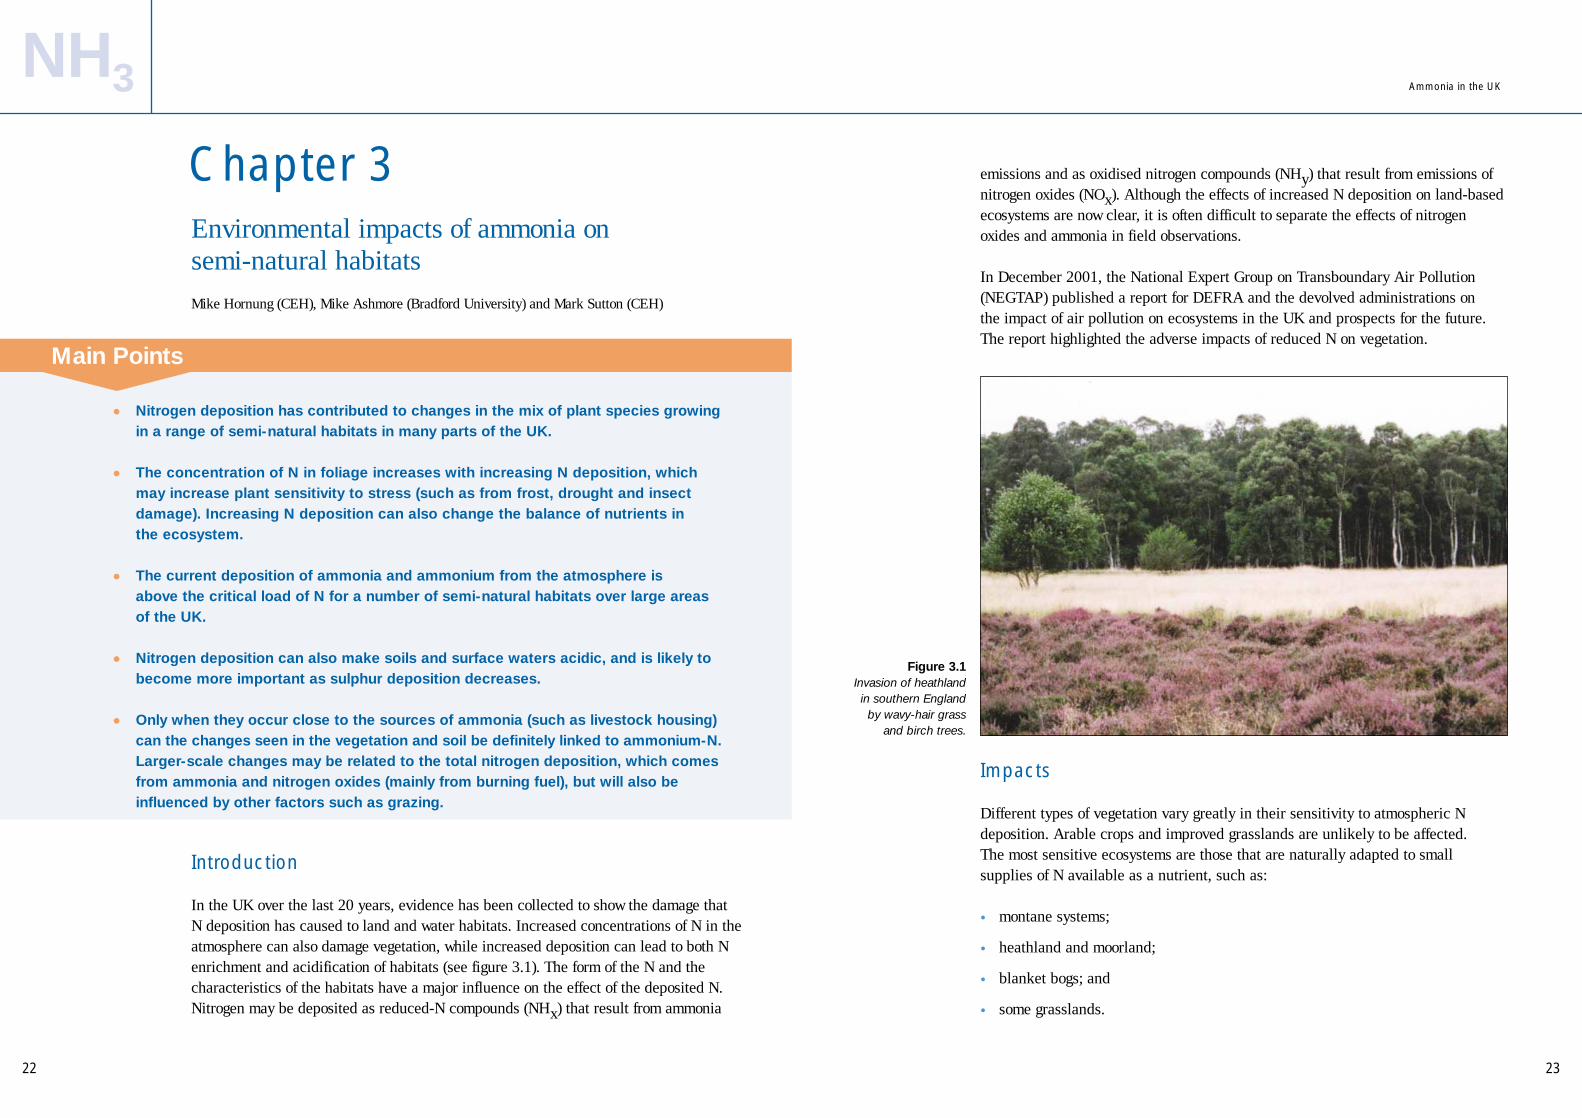
In the UK over the last 20 years, evidence has been collected to show the damage thatN deposition has caused to land and water habitats. Increased concentrations of N in theatmosphere can also damage vegetation, while increased deposition can lead to both Nenrichment and acidification of habitats (see figure 3.1). The form of the N and thecharacteristics of the habitats have a major influence on the effect of the deposited N.Nitrogen may be deposited as reduced-N compounds (NHx) that result from ammonia
Chapter 3
Figure 3.1Invasion of heathland
in southern Englandby wavy-hair grass
and birch trees.
Main Points
• Nitrogen deposition has contributed to changes in the mix of plant species growingin a range of semi-natural habitats in many parts of the UK.
• The concentration of N in foliage increases with increasing N deposition, whichmay increase plant sensitivity to stress (such as from frost, drought and insectdamage). Increasing N deposition can also change the balance of nutrients in the ecosystem.
• The current deposition of ammonia and ammonium from the atmosphere is above the critical load of N for a number of semi-natural habitats over large areasof the UK.
• Nitrogen deposition can also make soils and surface waters acidic, and is likely tobecome more important as sulphur deposition decreases.
• Only when they occur close to the sources of ammonia (such as livestock housing)can the changes seen in the vegetation and soil be definitely linked to ammonium-N.Larger-scale changes may be related to the total nitrogen deposition, which comesfrom ammonia and nitrogen oxides (mainly from burning fuel), but will also beinfluenced by other factors such as grazing.
Ammonia in the UK
Impacts
Different types of vegetation vary greatly in their sensitivity to atmospheric Ndeposition. Arable crops and improved grasslands are unlikely to be affected. The most sensitive ecosystems are those that are naturally adapted to smallsupplies of N available as a nutrient, such as:
• montane systems;
• heathland and moorland;
• blanket bogs; and
• some grasslands.

2524
Some of these habitats have decreased in size over the years and there are policycommitments to protect them such as the EU Habitats Directive. Nitrogendeposition can affect vegetation, and land and freshwater habitats, in four main ways:
• changes in the competitive balance between species;
• changes in plant sensitivity to stresses such as frost, drought and insect attack;
• acidification of soils and waters; and
High concentrations of ammonia can also be directly toxic to sensitive vegetation in the vicinity of large emission sources, such as intensive livestock buildings. The evidence for the effects of N deposition comes from three major sources:
• changes in the N content of foliage;
• changes in the species of composition across the countryside; and
• increased acidity and nitrate concentrations in soils and drainage waters.
These changes in soils and vegetation can be directly related to ammonia emissionsclose to the sources, but the contribution of these emissions to more widespreadchanges in plant species occurrence is much more difficult to measure.
Changes in N content of foliage
Increased N from atmospheric deposition can increase N concentrations in foliage.Particularly high concentrations are found downwind of large sources of ammonia,such as pig and poultry units, but there is also evidence of long-term increasesacross many parts of the country. Analysis of historical plant specimens and currentmaterial from the same sites has shown an increase in N content in foliagethroughout the last century, which can be related to the known increase in N deposition.
The increased N content may increase the plants’ sensitivity to environmentalstresses, such as drought, frost and insect damage. For example, both winter-mothand heather-beetle populations increase as plant N increases. There is also aconnection between the number of insect-damaged Scots pine trees and total N deposition in the UK. The increased N content can also lead to changes indecomposition and other processes that recycle nutrients into forms that can betaken up by plants.
NH3 Ammonia in the UK
Changes in the occurrence of plant species
The characteristic plant species of semi-natural habitats are generally adapted togrow in conditions of limited N availability. Increases in N deposition to thesesystems can result in increases in available N in the soil, which benefits thosespecies that need fairly large supplies of N. These species then begin to outnumberthose species adapted to a limited supply of N. This can mean the loss of species of conservation importance.
It is clear that areas of semi-natural vegetation, including official conservation sitesclose to agricultural sources of emission are at particular risk from ammoniadeposition. For example, in a detailed study around a poultry farm in southernScotland, the number of plants adapted to low N (such as wood sorrel and manymoss species) decreased close to the farm, while the number of species adapted tohigh N (such as rose bay willowherb and certain grasses) increased.
The best evidence of species change across the country comes from the 1978, 1990 and 1998 UK Countryside Surveys, in which the same vegetation plots weresurveyed at different intervals. The surveys have shown that in habitats adaptedto limited supplies of N (such as infertile grassland, upland woodland, moorlandgrass, and heath and bog), there have been small increases in the number ofspecies that have greater N requirements throughout much of the UK. In contrast,the species composition of agricultural grassland has not changed in the same way.
Outside these monitored plots, there have been changes in vegetation compositionover the past few decades that are in line with changes due to excess N deposition.The most widely reported changes are:
• a shift from mostly heather to grass (for example, in Breckland heaths and onScottish moors); and
• a decrease in moss cover (for example, on moss-dominated heath in northernEngland and parts of Scotland; in upland grassland in the northern Pennines;and on blanket bogs in the southern Pennines).
However, in many of these cases, changes in land management have beenimportant, and may have acted with increased N deposition to cause the changes invegetation that we have seen.
Results from experiments also show the loss of species with a small N requirementand an increase in those with a large N requirement. Results from adding N in longterm experiments demonstrate a reduced cover of species with a low N requirement
2726
NH3 Ammonia in the UK
and increased cover of species with a larger N requirement. In general terms,mosses, lichens and forbs tend to decrease relative to grasses, although individualspecies within these groups may show different trends. Some experiments in which N additions have been reduced have shown that these changes in speciescomposition may last for decades, and that active management may be needed torestore the original species.
Acidification and nitrate leaching
Deposition of ammonia, nitrogen oxides (mainly from industry and transport) andsulphur dioxide (mainly from electricity generation) can acidify the soils and, insome cases, drainage waters. This acidification affects biodiversity (plants andanimal species) in both land-based and freshwater habitats, with the loss of acid-sensitive species. What happens to the deposited ammonium-N in the soil-plant system will decidewhether or not acidification takes place. Acidification will result if the ammonium-Nis converted to nitrate by bacteria and that nitrate is leached from the soil indrainage. However, acidification is prevented if the ammonium-N is used inincreased plant growth, absorbed into the microbes in the soil (the microbialbiomass), or held on soil particles (colloids).
Ammonium-N deposition to soils that are not naturally very acidic will lead to theammonium-N being converted to nitrate. It will also lead to the soil becomingacidic and nitrate leaching to ground waters, as seen in woodland downwind of alivestock unit in north Yorkshire. But, in naturally-acidic upland soils, much of theammonium-N input is incorporated in the microbial biomass and not leached.However, if the nitrogen deposition continues, even acid upland soils willeventually become unable to hold any more and there will be some leakage ofnitrate, with the possible acidification of the soils and waters. Deposition of sulphur(from sulphur dioxide emissions) has been the main cause of acidification ofsurface waters over the last 150 years. Many of the UK’s acid-sensitive areas havebeen affected by historical sulphur deposition. In the last 20 years, sulphuremissions – and therefore sulphur deposition – have decreased sharply, while Ndeposition increased until the 1990s. This increase was mainly due to increasingemissions of nitrogen oxides from transport and gradual increases in ammoniaemissions from agriculture. Monitoring has shown a decrease in sulphate butgradual increases in nitrate concentrations at some freshwaters in the uplands.Increasing nitrate concentrations may mean that in these freshwater catchments thesoils have more N than can be taken up by plants, so that any additional N isleached. If so, nitrate will become increasingly important in deciding how well andhow quickly the soil recovers from acidification as sulphate declines.
Risk assessment using critical levels and critical loads
Critical levels
Critical levels are set to prevent gaseous pollution directly affecting plants. If theconcentration of the pollutant goes above the critical level, sensitive vegetation maybe damaged. Experiments have found the critical levels for ammonia to be 23 µg m-3
if the vegetation is exposed to it for one month, and 8 µg m-3 for the averageexposure over a year. Average annual concentrations of ammonia are above thecritical levels in very small areas of the UK. Only one of the 80 monitoring sites in the National Ammonia Monitoring Network, which is in an area with a largenumber of pig and poultry farms in East Anglia, shows annual averageconcentrations above the critical level. Much larger concentrations have beenreported immediately downwind of animal units; for example, average annualconcentrations of 30-60 µg m-3 were measured about 15 m from chicken farms insouthern Scotland. Therefore, direct toxic effects of ammonia on vegetation in theUK are only likely to be of concern very close to large sources.
Critical Levels and Loads
Critical level: is the concentration of a pollutant in the atmosphere, below which vegetation is unlikely to be damaged according to presentknowledge.
Critical load: the critical load is the amount of pollutant deposited belowwhich significant harmful effect on specified elements of the environment donot occur, according to current knowledge.
The idea of a critical load was developed to provide a receptor-basedsystem for measuring emission reduction targets for pollutants, in the areasof acidification and nutrient over-enrichment. Critical loads of N for nitrogenenrichment have been based on the results of field monitoring experiments,and links between N deposition and changes in vegetation. Critical loads of acidity, which include the contributions from N and S (sulphur), aregenerally set to limit changes in the chemistry of soil or soil solution sothat the biological system is protected. The critical limits have been set to
prevent changes in the species present, or changes in the ecosystem

2928
Figure 3.2Areas of heath and
moorland in the UK receiving N
deposition abovethe critical load fornitrogen 1995-97.
The amount ofdeposition abovethe critical load isthe exceedance.
Figure 3.3An area of lowland
landscape in centralEngland receivingtotal N depositionabove the criticalload for nitrogen,
based on a detailedmodel. Areas
adjacent toagricultural land and
near farms receivethe highest
deposition abovethe critical load.
NH3 Ammonia in the UK
Critical loads
Critical loads are set to prevent the long term effects of deposition. If the depositionis above the critical load, the ecosystem may be damaged. When the totaldeposition of acidifying pollutants (from ammonia, nitrogen oxides and sulphurdioxide) is above the critical load for acidity, ecosystems are at risk fromacidification. When total deposition of ammonia and nitrogen oxides is above thecritical load for N, ecosystems are at risk from nitrogen enrichment. Areas wheredeposition is above the critical load, and where damage is therefore possible, canbe shown on a map by comparing the distribution of different habitats and theircritical loads with geographical information on deposition.
Critical loads for nitrogen enrichment
Studies suggest that the critical load to protect heathland and moorland from N enrichment is exceeded over 64% of the UK. Indeed, deposition of reduced Nalone is enough to go above the critical load in over 36% of the area, whereasdeposition of nitrogen oxides alone would only account for this in about 1% of thearea (see figure 3.2).
The critical-loads approach for the UK in figure 3.2 is based on maps of thecritical load of the main habitat in each 1 by 1 km grid square, and a 5 km gridfor deposition. Much of the local variation in deposition is not shown on thesenational maps but it will lead to critical loads being exceeded in very localisedareas. A detailed model study of an area in central England (see figure 3.3)showed large increases in deposition near to farms and into nearby semi-naturalareas. It is likely that critical loads were exceeded at the edges of woodland andnatural areas but not in the centre of nature reserves. This is because of increaseddeposition at the edges of the semi-natural habitats, where these are next tofarmland or livestock buildings.
3130
NH3
Critical loads for acidification
Assessing the contribution of N deposition to soil acidification is complicatedbecause it is difficult to know what will happen to the deposited ammonium-N.However, if we assume that all deposited ammonium adds to soil acidification and does not stay in the soils, we can calculate the maximum potential effects.Studies suggest that current ammonium-N deposition alone is actually largeenough to exceed the critical load in over 40% of the UK’s woodland soils. This is mainly in areas on the acid-sensitive soils of the uplands. For freshwaters,the data suggest that over 11% of the UK is above the critical load. As with plant-soil systems, the main areas of concern are in the sensitive upland areas.
Long term change and recovery
Historic data clearly show that increased N deposition has affected vegetation inthe UK during the last century. The effects of ammonia deposition are clear fromsites around N sources. There is evidence of more widespread changes invegetation in N-sensitive habitats, but the relative sensitivity to reduced nitrogen(NHx) versus oxidised nitrogen (from nitrogen oxides) deposition is still notcertain. It is likely that other issues, such as the way the land is used and plantsensitivity to stress, are also involved. Surface waters have clearly become moreacidic over the last 150 years. Nitrogen deposition has contributed to this, butsulphur has been the main cause. Nitrogen deposition is now important indetermining the rate of recovery of soils and waters as sulphur deposition declines.The build-up of N in soils from historical deposition may also slow down orprevent the recovery of sensitive plant species, even after atmospheric depositionhas decreased. Therefore, recovery may need changes to land use as well asreduction in ammonia emissions.
Further reading
Bobbink R, Hornung M and Roelofs J G M (1999). The effects of air-borne nitrogenpollutants on species diversity in natural and semi-natural European vegetation.Journal of Ecology 86, 717-738.
Green P R S, Ashmore M R, Power S A, and Bobbink R (1997). Whole ecosystemnitrogen manipulation: a review study. English Nature, Peterborough.
Haines-Young R H, Barr C J, Black H I J, Briggs D J, Bunce R G H, Clarke R T,Cooper A, Dawson F H, Firbank L G, Fuller R M, Furse M T, Gillespie G M, Hill R, Hornung M, Howard D C, McCann T, Morecroft M D, Petit S, Sier A R J,Smart S M, Smith G M, Stott A P, Stuart R C, and Watkins J W (2000).
Accounting for nature: Assessing habitats in the UK countryside. DETR, London.ISBN 1 85112 460 8.
Pitcairn C E R, Leith I D, Sheppard L J, Sutton M A, Fowler D, Munro R C, Tang S and Wilson D (1998) The relationship between nitrogen deposition, speciescomposition and foliar N concentrations in woodland flora in the vicinity ofintensive livestock farms. Environmental Pollution (Nitrogen Special Issue). 102, S1, 41-48.
Wilson E J and Emmett B 1999. Factors influencing nitrogen saturation in forestecosystems: advancing in our understanding since the mid 1980s. In: The Impactof Nitrogen Deposition on Natural and Semi-natural Ecosystems. Edited by S JLangan. Dordrecht; Kluwer Academic Publishers pp 123-152.
NEGTAP 2001. Transboundary Air Pollution: Acidification, Eutrophication andGround-level Ozone in the UK. ISBN 1 870393 619. Report available onlinewww.nbu.ac.uk/negtap and from DEFRA’s Air and Environment Quality Division.
Ammonia in the UK
33
Introduction
It is essential to prepare accurate inventories to estimate how much ammonia is inthe atmosphere and its likely effects on the environment. An inventory is a list ofall the estimated emissions from all known sources. Having this inventory meansthat we can identify the major sources of emission and look at ways to reduce them.
32
NH3
Estimating total ammonia emissions from the UKJ Webb (ADAS), Tom Misselbrook (IGER), Mark Sutton (CEH) and Helen ApSimon (Imperial College)
Chapter 4
• An inventory has been drawn up to estimate how much ammonia is emitted byeach of the livestock groups (cattle, pigs, poultry, sheep and other livestock) and by nitrogen fertilizer in the UK. Non-agricultural sources of ammonia (e.g. transport, wild birds) are also included in this inventory.
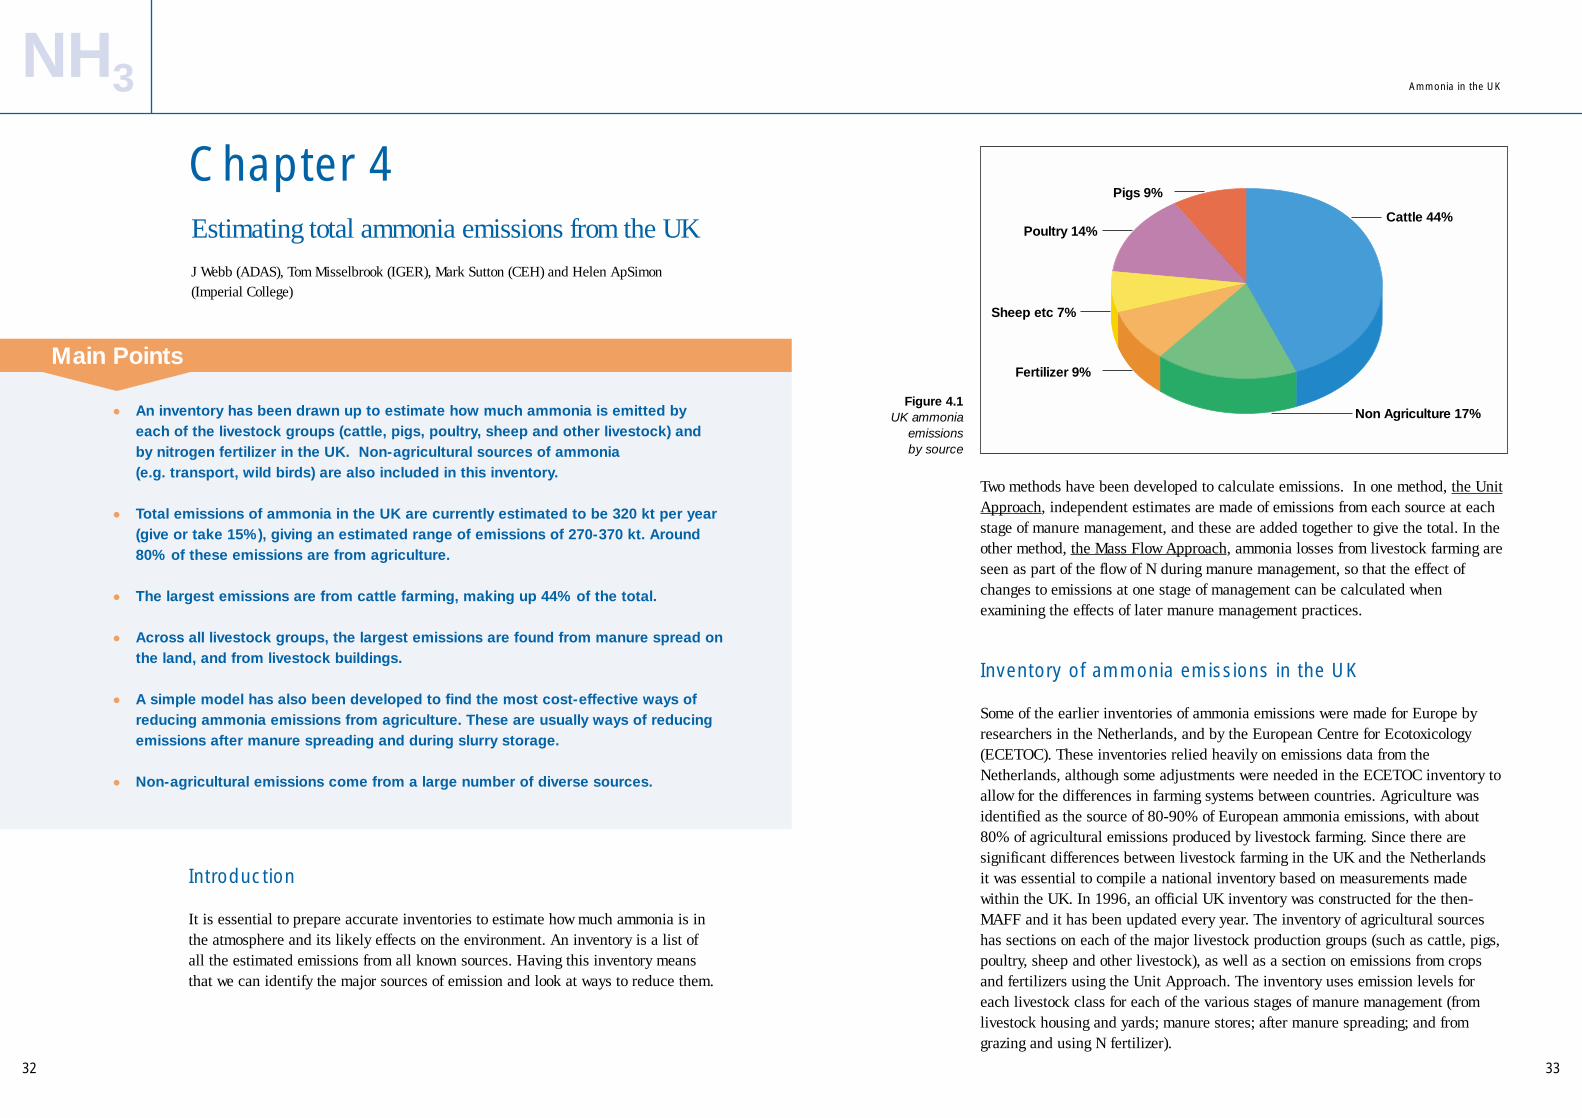
• Total emissions of ammonia in the UK are currently estimated to be 320 kt per year(give or take 15%), giving an estimated range of emissions of 270-370 kt. Around80% of these emissions are from agriculture.
• The largest emissions are from cattle farming, making up 44% of the total.
• Across all livestock groups, the largest emissions are found from manure spread onthe land, and from livestock buildings.
• A simple model has also been developed to find the most cost-effective ways ofreducing ammonia emissions from agriculture. These are usually ways of reducingemissions after manure spreading and during slurry storage.
• Non-agricultural emissions come from a large number of diverse sources.
Main Points
Two methods have been developed to calculate emissions. In one method, the UnitApproach, independent estimates are made of emissions from each source at eachstage of manure management, and these are added together to give the total. In theother method, the Mass Flow Approach, ammonia losses from livestock farming areseen as part of the flow of N during manure management, so that the effect ofchanges to emissions at one stage of management can be calculated whenexamining the effects of later manure management practices.
Inventory of ammonia emissions in the UK
Some of the earlier inventories of ammonia emissions were made for Europe byresearchers in the Netherlands, and by the European Centre for Ecotoxicology(ECETOC). These inventories relied heavily on emissions data from theNetherlands, although some adjustments were needed in the ECETOC inventory toallow for the differences in farming systems between countries. Agriculture wasidentified as the source of 80-90% of European ammonia emissions, with about80% of agricultural emissions produced by livestock farming. Since there aresignificant differences between livestock farming in the UK and the Netherlandsit was essential to compile a national inventory based on measurements madewithin the UK. In 1996, an official UK inventory was constructed for the then-MAFF and it has been updated every year. The inventory of agricultural sourceshas sections on each of the major livestock production groups (such as cattle, pigs,poultry, sheep and other livestock), as well as a section on emissions from cropsand fertilizers using the Unit Approach. The inventory uses emission levels foreach livestock class for each of the various stages of manure management (fromlivestock housing and yards; manure stores; after manure spreading; and fromgrazing and using N fertilizer).
Figure 4.1UK ammonia
emissions by source
Non Agriculture 17%
Fertilizer 9%
Sheep etc 7%
Poultry 14%
Pigs 9%
Cattle 44%
Ammonia in the UK
Activity data Emission level Ammonia emission
Number of
dairy cows in
the UK
(A)
Percentage (%) of
dairy cows kept in
cubicle houses
(B)
Number of days
spent in housing
each year
(C)
A/1000 x B/100 x
C x D x 550/500
(in kg y-1)
2,336,000 66 199 38.2 12,892,166
Table 4.1 Example of a calculation from the UK ammonia inventory to estimate theemissions from dairy cows during housing in cubicles (producing slurry)in the UK each year.
35
are calculated separately, so the effects of efforts to reduce emissions at earlierstages of the cycle cannot be easily assessed. Work is underway to compile the UKammonia inventory using the Mass Flow approach, to avoid this disadvantage.
Estimates from the UK inventory
Based on data from the year 2000, the UK’s total ammonia emission is estimated tobe 320 kt (give or take 15% (about 50 kt). About 256 kt (80%) of the UK’s totalemission comes from agricultural sources.
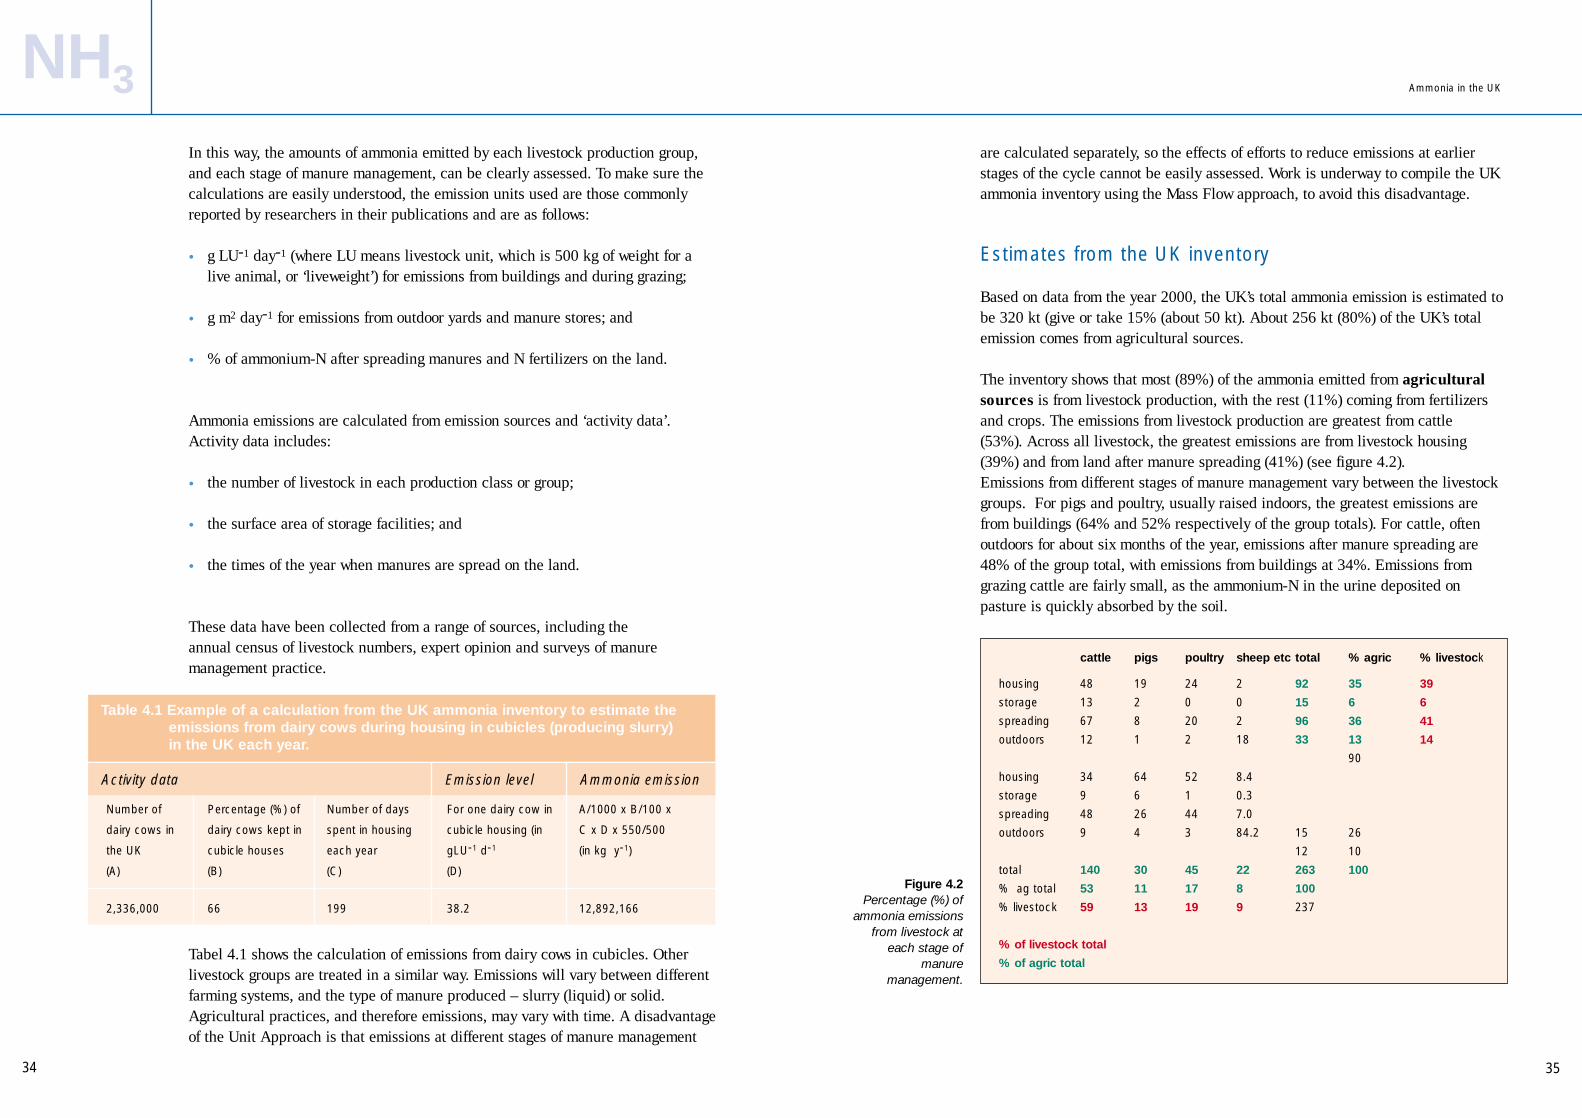
The inventory shows that most (89%) of the ammonia emitted from agriculturalsources is from livestock production, with the rest (11%) coming from fertilizersand crops. The emissions from livestock production are greatest from cattle (53%). Across all livestock, the greatest emissions are from livestock housing(39%) and from land after manure spreading (41%) (see figure 4.2). Emissions from different stages of manure management vary between the livestockgroups. For pigs and poultry, usually raised indoors, the greatest emissions arefrom buildings (64% and 52% respectively of the group totals). For cattle, oftenoutdoors for about six months of the year, emissions after manure spreading are48% of the group total, with emissions from buildings at 34%. Emissions fromgrazing cattle are fairly small, as the ammonium-N in the urine deposited onpasture is quickly absorbed by the soil.
In this way, the amounts of ammonia emitted by each livestock production group,and each stage of manure management, can be clearly assessed. To make sure thecalculations are easily understood, the emission units used are those commonlyreported by researchers in their publications and are as follows:
• g LU-1 day-1 (where LU means livestock unit, which is 500 kg of weight for alive animal, or ‘liveweight’) for emissions from buildings and during grazing;
• g m2 day-1 for emissions from outdoor yards and manure stores; and
• % of ammonium-N after spreading manures and N fertilizers on the land.
Ammonia emissions are calculated from emission sources and ‘activity data’.Activity data includes:
• the number of livestock in each production class or group;
• the surface area of storage facilities; and
• the times of the year when manures are spread on the land.
These data have been collected from a range of sources, including the annual census of livestock numbers, expert opinion and surveys of manuremanagement practice.
Tabel 4.1 shows the calculation of emissions from dairy cows in cubicles. Otherlivestock groups are treated in a similar way. Emissions will vary between differentfarming systems, and the type of manure produced – slurry (liquid) or solid.Agricultural practices, and therefore emissions, may vary with time. A disadvantageof the Unit Approach is that emissions at different stages of manure management
34
Figure 4.2Percentage (%) of
ammonia emissionsfrom livestock at
each stage ofmanure
management.
NH3 Ammonia in the UK
cattle pigs poultry sheep etc total % agric % livestock
housing 48 19 24 2 92 35 39
storage 13 2 0 0 15 6 6
spreading 67 8 20 2 96 36 41
outdoors 12 1 2 18 33 13 14
90
housing 34 64 52 8.4
storage 9 6 1 0.3
spreading 48 26 44 7.0
outdoors 9 4 3 84.2 15 26
12 10
total 140 30 45 22 263 100
% ag total 53 11 17 8 100
% livestock 59 13 19 9 237
% of livestock total
% of agric total
For one dairy cow in
cubicle housing (in
gLU-1 d-1
(D)

37
Each year in the UK, non-agricultural sources account for about 50-60 kt ofammonia emission. A wide range of non-agricultural sources contributes toammonia emissions in the UK, including pets, wild animals, sewage sludge,industrial and combustion processes and vehicles fitted with catalytic converters(chapter 10). The emissions from each of these sources are usually small and veryuncertain because of their variability and lack of measurements.
Models of ammonia abatement
Work is continuing to develop models of ammonia emissions from livestockproduction systems. Since manures are by far the greatest source of ammonia, thefirst step to reduce emissions is to look at the total amount of ammonium-N in thedung and urine produced by livestock, from which ammonia is released. This poolis reduced by ammonia being emitted from manure in livestock houses, in storageand after spreading. Very little of the organic N in dung actually breaks down in thesoil to replace the ammonium-N lost as ammonia. So, if ammonia emission isprevented from an early stage of manure management (for example, emissions fromlivestock buildings or manure stores), a larger pool of ammonium-N will stay in themanure, to be emitted later (for example, from manure spreading) unless furtherabatement methods are used. Abatement in this case means to reduce or evenprevent ammonia emissions.
The idea of a fixed total amount of ammonium-N in the farming system means thatit will be easy to assess the effects of introducing abatement techniques at onestage of manure management on the possible size of later emissions (see figure 4.3).The Mass Flow approach was used in the Model for the Assessment of RegionalCost Curves for Abatement Strategies (MARACCAS) model. The MARACCASmodel was used to review the possible ways of reducing emissions, including howefficient, practical and expensive the current methods are. This review was basedon the information and experience available at the time, which was mostly limitedto a few countries such as the Netherlands. The results were used to compare thepossibilities for ammonia reduction in different European countries, including theUK. More information is now available and this approach is being adapted for usein the National Ammonia Reduction Strategy Evaluation System (NARSES) model.The aim of NARSES is to develop a national-scale model to estimate the size,geographical distribution and seasonal variation of ammonia emissions, and thepotential for emission reduction methods with their associated costs. When it isfinished, NARSES will help policy makers to identify and assess cost-effectiveways to reduce ammonia emissions at a national, regional and farm level. NARSES will also allow the effects on ammonia emissions of other changes in the agricultural industry to be assessed. Designing a model to calculate regionaldifferences in the potentials for both ammonia emissions and reductions will
36
Figure 4.3Percentage (%) of
ammonia emissionsfrom livestock at
each stage of manure
management.
NH3 Ammonia in the UK

3938
NH3 Ammonia in the UK
also allow more accurate estimates of total emissions and emission reductionpotential to be made.
Models have shown that some of the most cost-effective emission reduction methodsare those that reduce emissions after manure spreading on the land. This is thefinal stage of manure management, and thus the final stage where ammoniaemissions can be reduced. Abatement at earlier stages, e.g. during housing orstorage, will mean the manure to be spread has a higher ammonium-N content andthus the potential for greater ammonia emission after spreading. Use of low-emission spreading techniques will ensure that ammonia saved earlier is not lostduring this final stage of manure management.
Further reading
Cowell D A and ApSimon H M (1998). Cost-effective strategies for the abatement ofammonia emissions from European Agriculture. Atmospheric Environment 32, 573-580.
ECETOC (1994). Ammonia emissions to air in western Europe. Technical Report 62.European Centre for Ecotoxicology and Toxicology of Chemicals, Avenue E VanNieuwenhuyse 4, Brussels.
Misselbrook T H, Jarvis S C, Chambers B J, Smith K A, Webb J, Phillips V RSneath R W, Sutton M A, Theobald M R and Dragosits U (2001). Inventory ofAmmonia Emissions from the UK. DEFRA Contract Report AM0108.
Pain B F, van der Weerden T J, Misselbrook T H, Chambers B J, Phillips V R andJarvis S C (1998) A new inventory of ammonia emissions from UK agriculture.Atmospheric Environment 32, 309-314.
Webb J (2000) Estimating the potential for ammonia emissions from livestockexcreta and manures. Environmental Pollution 111, 395-406.
41
Emissions from housing
Housing is second only to spreading of manures on land as a source of ammoniaemission from cattle farming. This is because within buildings and followingmanure spreading, manure is distributed over a large surface area from whichemissions may take place. Ammonia is released almost immediately when the cattleurinate in the housing cubicles. The present estimate of UK emission from cattlehousing is 48 kt ammonia each year, with dairy and beef houses accounting forapproximately 50% each. Recent survey data suggests that approximately 65% ofdairy-cattle manure and 20% of beef-cattle manure is produced as slurry (dung andurine), with the rest (35% and 80% respectively) produced as straw-based FYM.Slurry systems usually have houses with individual cubicles for the cattle to lie in(cubicle houses). A small amount of bedding, such as wood shavings or sawdust, is spread over the concrete floors of the cubicles, or there may be rubber mats. The access passageways are cleaned using either automatic or tractor-mountedscrapers. Beef cattle reared on slurry systems may also be housed in buildings withslatted floors, where dung and urine drop through the slats to a store below. Cattlehousing in the UK is almost entirely naturally ventilated, in other words, throughgaps in the walls and roof.
Ammonia emissions from slurry-based (cubicle) systems are greater than fromstraw-based systems. Straw acts as a barrier to emissions and can also absorb someof the ammonium-N in urine, so reducing the amount available for emission.Scraping the passages in cubicle houses leaves a thin film of slurry from whichemission continues. Recent measurements show that the average emission fromslurry-based systems is 30% of the ammonium-N produced from animal dung andurine excreted in the house (which is 18% of the N deposited in the house)compared with 23% for straw-based systems (14% of the N deposited in the house).There is some evidence that emissions from buildings in summer, when cattle areonly housed overnight, are as great as emissions in winter, when cattle are housedfull time. This could be due to both the higher background temperature in thesummer and the continued emissions from dung and urine deposited by the animalsduring the limited overnight housing.
Emissions from stored slurry and FYM
Recent survey information shows that approximately 20% of the slurry and 50% ofthe FYM (solid farmyard manure) collected from cattle housing is regularly spreaddirectly onto land. The rest is stored before being spread. Ammonia emission frommanure stores depends on the surface area of manure in contact with the air ratherthan the total amount of manure stored. Most stores have a small surface area in
40
NH3
Ammonia emissions from cattle farmingTom Misselbrook (IGER) and Ken Smith (ADAS)
Introduction
Cattle production is the major source of ammonia from UK agriculture, emittingapproximately 140 kt of ammonia each year. This accounts for 44% of the UK’s totalammonia emissions and 53% of the total from agricultural sources. Dairy cattle tend tohave more protein in their diet than beef cattle, which means that dairy cattle producemore N and ammonia in their excreta. Cattle may be housed on either a slurry (liquidmanure) or straw-based (solid farmyard manure, or FYM) manure system, or acombination of both. This influences both the way that manure is managed and howmuch ammonia is produced by:
• housing;
• manure storage; and
• manure spreading.
The manure-management system used also affects the possible emission reductionmethods that could be used.
Chapter 5
Main Points
• Cattle farming accounts for 44% of the UK’s total ammonia emission, and 53% of thatwhich comes from agricultural sources.
• Manure spreading and livestock housing are the major sources of emission.
• Emissions from slurry-based manure systems are greater than from straw-based systems.
• Research suggests that the most cost-effective emission reduction methods focus onspreading manures on land, either by injecting the manure just under the surface or byapplication using band-spreading machinery and by quickly mixing the manure intoarable soils.
Ammonia in the UK
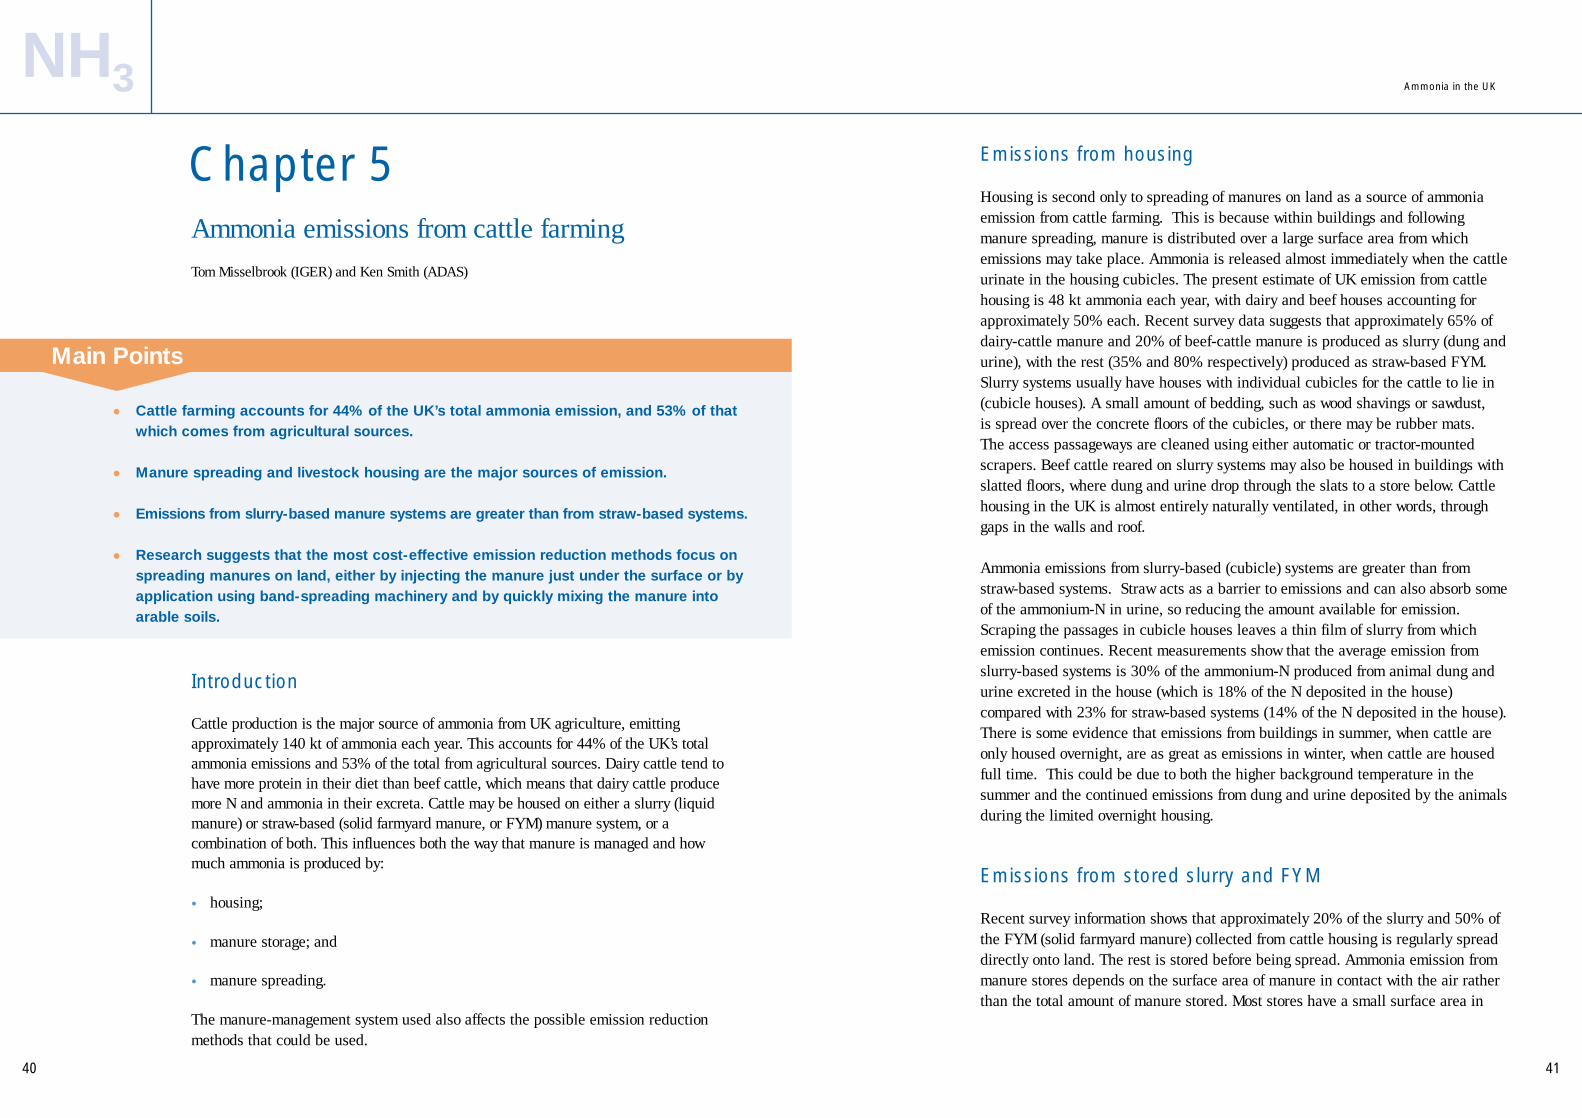
43
For slurries and FYM, most of the emission takes place during the first few hoursafter spreading. After that, emission rates decline rapidly, though they continue fora number of days at steadily decreasing rates (see figure 5.1).
Cattle slurry is most commonly spread evenly or ‘broadcast’ over the whole surfaceof fields. For slurries, important factors influencing emission include slurry drymatter content. There is a strong relationship between the magnitude of ammonia lossand the dry matter content of cattle slurry. For every 1% increase in dry matter thereis a corresponding 5% increase in proportional loss of ammonium-N. This reflects thefaster infiltration of dilute slurries into the soil where the ammonium-N absorbed onto soil particles becomes less likely to be released as ammonia. Conditions at the soilsurface are also important and any impediment to slurry infiltration, e.g. surfacecapping, compaction, wet soil or a layer of crop residues, may increase emission.Actual emissions after cattle slurry has been spread vary widely, from less than 10%to over 80% of the ammonium-N applied. This variation depends on the slurry itself,and environmental and soil conditions. Dirty water (such as from washing milkingparlours, rainfall and run-off from hard standings) may be considered as a very diluteslurry and, since it also contains little ammonium-N, it emits very little ammonia.
FYM is broadcast onto the land using side- or rear-discharge manure spreaders. It is mainly spread in the autumn onto cereal stubble and grassland, but also ontoforage maize land in early spring, before sowing. A greater proportion of the appliedammonium-N is lost (typically 65%) because FYM is not washed into the soil asquickly as slurry. About 50% of FYM is not stored but spread directly frombuildings. The ammonium-N content of unstored, or fresh, FYM is usually 25% ofthe total N, but only 10% for stored FYM because of the losses during storage.Ammonia emission from spreading is greater when unstored fresh FYM is spreadonto land.
relation to their volume, so only a fairly small proportion of the N they contain isreleased as ammonia. Total emission from cattle manure stores in the UK isestimated to be 13 kt of ammonia each year.
The most common types of manure store, for slurry and dirty water, include:
• below-ground tanks;
• above-ground circular tanks; and
• earth-banked lagoons and weeping-wall stores (which are above-groundconcrete-panelled stores with slots allowing liquid seepage).
FYM is stored in heaps either in fields or on concrete pads. The major types ofmanure stores – circular tanks, lagoons, weeping-wall compounds and FYM heaps– account for 7%, 38%, 5% and 50% respectively of the total surface area ofmanure stored on farms in the UK.
Emissions from slurry stores increase with increasing temperature, windspeed,slurry pH and, especially, with frequency of mixing. Natural crusts often form onslurry stores as the gas produced by bacteria within the slurry carries fibrousparticles to the slurry surface. Such a crust will prevent some ammonia emissionfrom the store. Stores may be filled from the top or bottom. Filling from the top mayprevent a complete surface crust from forming and may also increase ammoniaemission during filling.
Emissions from FYM heaps increase to a maximum in the first few days of storageas the bacteria cause the temperature to rise. Most of the emission from FYM heapstakes place within the first 30 days of storage, unless the heap is turned, or forked,to encourage composting and more ammonia is emitted. Heavy rainfall reducesemissions by slowing the composting process, but it may increase drainage from the heap and the movement of water-borne pollutants down through the soil. There may be a further peak of ammonia emission when the heap is broken upbefore being spread on the land.
Emissions from spreading manures on land
Spreading manures on land is the major source of ammonia emission from cattlefarming, with an estimated total for the UK of 67 kt of ammonia each year. Of this,30 kt come from slurry spreading and 37 kt from FYM. Emissions are influencedby a large number of environmental and management factors (Chapter 1).
42
Figure 5.1Typical pattern of
ammonia emissionafter spreading
manure on land.
0
1
2
3
4
5
0 20 40 60 80 100
Time after application (h)
Em
issi
on
rate
(kg
NH
3 ha
-1)
NH3 Ammonia in the UK
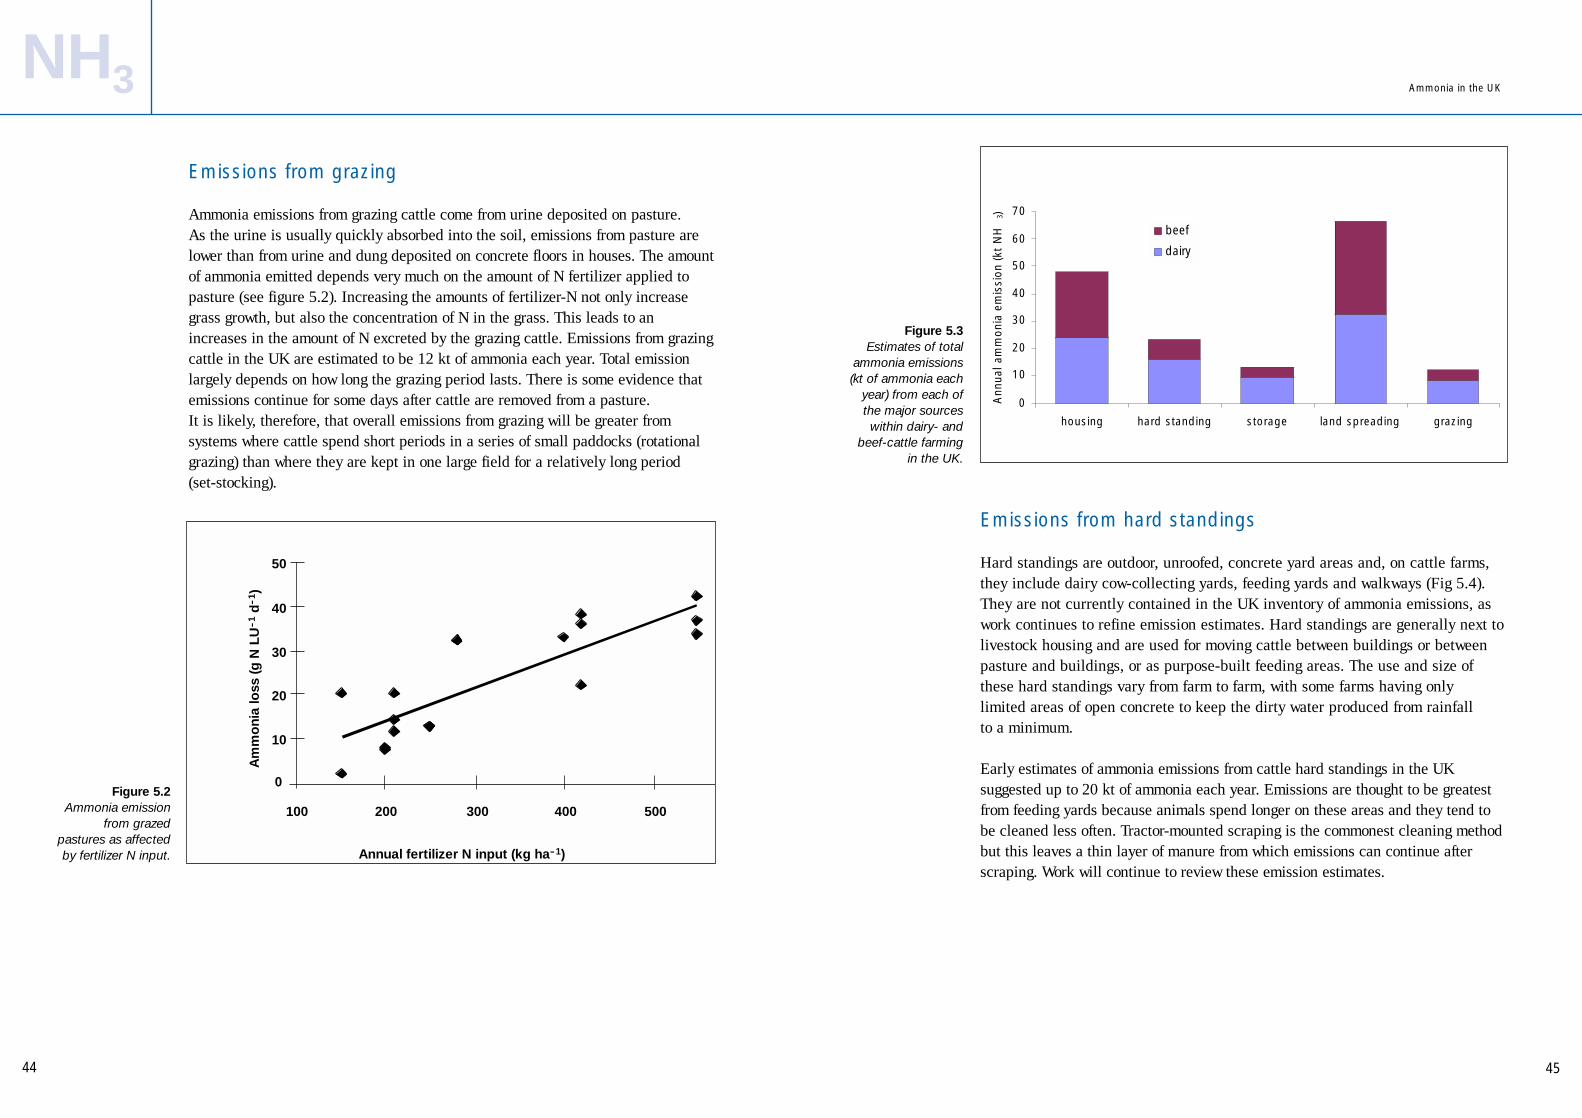
0
10
20
30
40
50
60
70
housing hard standing storage land spreading grazing
Ann
ual a
mm
onia
em
issi
on (k
t N
H3)
beef
dairy
45
Emissions from hard standings
Hard standings are outdoor, unroofed, concrete yard areas and, on cattle farms, they include dairy cow-collecting yards, feeding yards and walkways (Fig 5.4).They are not currently contained in the UK inventory of ammonia emissions, aswork continues to refine emission estimates. Hard standings are generally next tolivestock housing and are used for moving cattle between buildings or betweenpasture and buildings, or as purpose-built feeding areas. The use and size ofthese hard standings vary from farm to farm, with some farms having only limited areas of open concrete to keep the dirty water produced from rainfall to a minimum.
Early estimates of ammonia emissions from cattle hard standings in the UKsuggested up to 20 kt of ammonia each year. Emissions are thought to be greatestfrom feeding yards because animals spend longer on these areas and they tend tobe cleaned less often. Tractor-mounted scraping is the commonest cleaning methodbut this leaves a thin layer of manure from which emissions can continue afterscraping. Work will continue to review these emission estimates.
Emissions from grazing
Ammonia emissions from grazing cattle come from urine deposited on pasture. As the urine is usually quickly absorbed into the soil, emissions from pasture arelower than from urine and dung deposited on concrete floors in houses. The amountof ammonia emitted depends very much on the amount of N fertilizer applied topasture (see figure 5.2). Increasing the amounts of fertilizer-N not only increasegrass growth, but also the concentration of N in the grass. This leads to anincreases in the amount of N excreted by the grazing cattle. Emissions from grazingcattle in the UK are estimated to be 12 kt of ammonia each year. Total emissionlargely depends on how long the grazing period lasts. There is some evidence thatemissions continue for some days after cattle are removed from a pasture. It is likely, therefore, that overall emissions from grazing will be greater fromsystems where cattle spend short periods in a series of small paddocks (rotationalgrazing) than where they are kept in one large field for a relatively long period (set-stocking).
44
Figure 5.2Ammonia emission
from grazedpastures as affectedby fertilizer N input.
0
10
20
30
40
50
100 200 300 400 500
Annual fertilizer N input (kg ha-1)
Am
mo
nia
loss
(g N
LU
-1
d-
1 )
Figure 5.3 Estimates of total
ammonia emissions(kt of ammonia each
year) from each ofthe major sourceswithin dairy- and
beef-cattle farmingin the UK.
NH3 Ammonia in the UK
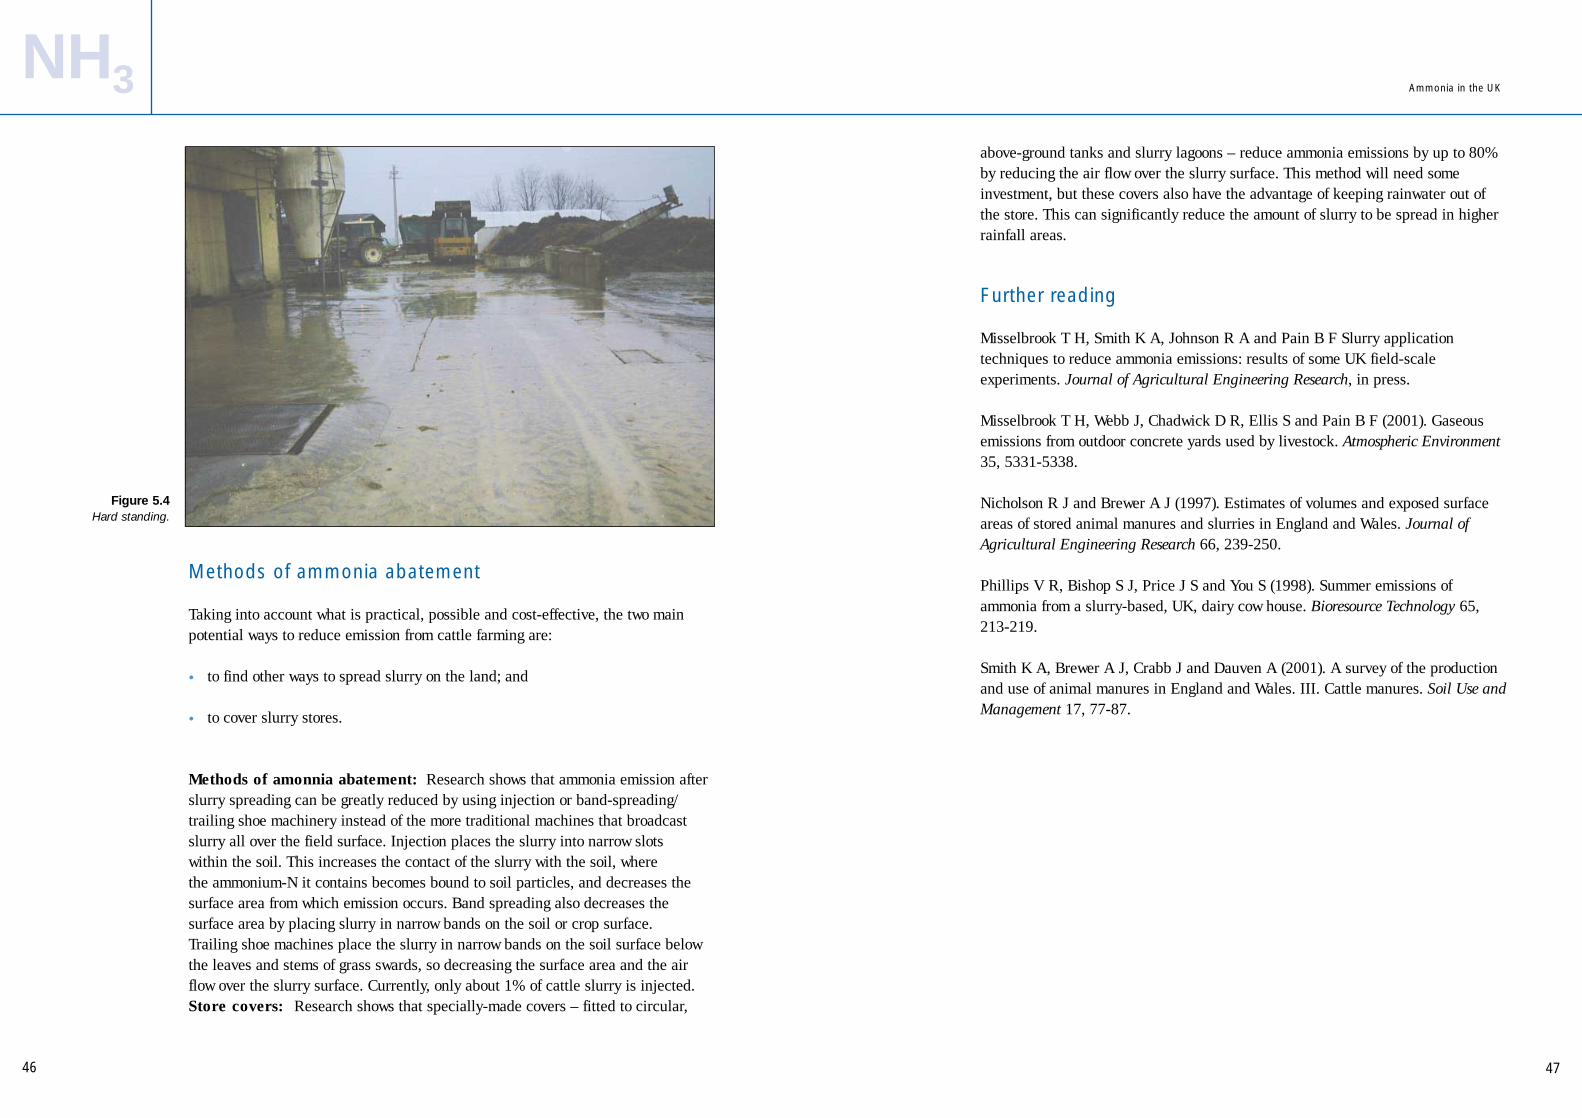
47
above-ground tanks and slurry lagoons – reduce ammonia emissions by up to 80%by reducing the air flow over the slurry surface. This method will need someinvestment, but these covers also have the advantage of keeping rainwater out ofthe store. This can significantly reduce the amount of slurry to be spread in higherrainfall areas.
Further reading
Misselbrook T H, Smith K A, Johnson R A and Pain B F Slurry applicationtechniques to reduce ammonia emissions: results of some UK field-scaleexperiments. Journal of Agricultural Engineering Research, in press.
Misselbrook T H, Webb J, Chadwick D R, Ellis S and Pain B F (2001). Gaseousemissions from outdoor concrete yards used by livestock. Atmospheric Environment35, 5331-5338.
Nicholson R J and Brewer A J (1997). Estimates of volumes and exposed surfaceareas of stored animal manures and slurries in England and Wales. Journal ofAgricultural Engineering Research 66, 239-250.
Phillips V R, Bishop S J, Price J S and You S (1998). Summer emissions ofammonia from a slurry-based, UK, dairy cow house. Bioresource Technology 65,213-219.
Smith K A, Brewer A J, Crabb J and Dauven A (2001). A survey of the productionand use of animal manures in England and Wales. III. Cattle manures. Soil Use andManagement 17, 77-87.
Methods of ammonia abatement
Taking into account what is practical, possible and cost-effective, the two mainpotential ways to reduce emission from cattle farming are:
• to find other ways to spread slurry on the land; and
• to cover slurry stores.
Methods of amonnia abatement: Research shows that ammonia emission afterslurry spreading can be greatly reduced by using injection or band-spreading/trailing shoe machinery instead of the more traditional machines that broadcastslurry all over the field surface. Injection places the slurry into narrow slots within the soil. This increases the contact of the slurry with the soil, where the ammonium-N it contains becomes bound to soil particles, and decreases thesurface area from which emission occurs. Band spreading also decreases thesurface area by placing slurry in narrow bands on the soil or crop surface. Trailing shoe machines place the slurry in narrow bands on the soil surface belowthe leaves and stems of grass swards, so decreasing the surface area and the airflow over the slurry surface. Currently, only about 1% of cattle slurry is injected.Store covers: Research shows that specially-made covers – fitted to circular,
46
Figure 5.4Hard standing.
NH3 Ammonia in the UK

49
Approximately 55% of the pig manure is handled as slurry (i.e. liquid manure),with the remainder managed as solid, straw-based farmyard manure (FYM).Typically, ammonium-N in pig slurry accounts for 60% of the total N, but only 10-25% of that in FYM where most is bound up in organic compounds. Thedifferent manure types and amounts of ammonium-N that they contain influence the extent of emissions from housing, storage and spreading on land. The type ofmanure management system also has implications for potential techniques toreduce emission.
Emissions from housing
Emissions from pig housing are estimated at 19 kt ammonia per year. Ammonia isreleased almost immediately when urine is voided by animals in the house. Partand fully-slatted floor designs are illustrated in Figure 6.1.
48
NH3
Ammonia emissions from pig farmingBrian Chambers and John Williams (ADAS) and Roger Phillips (SRI)
Introduction
Much of the research on ammonia emissions from pig farms has been conducted inparallel to that on emissions from cattle farms. There are important differences betweenthe way in which cattle and pigs are fed, housed and managed, and in the compositionof their manures. These differences impact on ammonia emissions from the two types oflivestock and on the potential for abatement.
Annual ammonia emissions from UK pig farms have been estimated at 30 kt,representing 9% of total emissions from the UK and 11% of those from agriculture.Around two-thirds of ammonia emissions from pig farms are from housing (19 kt), a quarter from spreading manures (8 kt) and the remainder from manure storage, hard standings (concrete areas used by pigs around the housing) and from pigs kept outdoors.
Chapter 6
Main Points
• Pig farming accounts for about 9% of annual ammonia emissions from the UK and 11%of those from agricultural sources. Housing (64% of pig emissions) and manurespreading (26% of pig emissions) are the largest sources.
• Taking into consideration the whole manure management process from housing toland-spreading, there are no consistent differences in emissions between straw– andslurry-based systems.
• The leading abatement methods are similar to those for cattle farming e.g. rapidincorporation of manures into the soil after spreading or use of band spreader orinjection machinery for slurries. Covering of slurry stores (tanks and lagoons) and thestorage of solid manures before spreading on land also reduce ammonia emissions.
Figure 6.1 Part-slatted
and fully-slattedhousing systems
in the UK.
Ammonia in the UK

51
FYM is spread onto land using rear and side discharge spreaders, principally onarable land in the autumn before sowing cereals and during the autumn-springperiod before planting root crops and on grassland. Pig slurry is most commonlyspread evenly over fields (i.e. broadcast) with tankers or irrigation machinery, oftenon arable land in the autumn and on grassland throughout the year. About 4% ofpig slurry in the UK is injected 25-30 cm deep into the soil, largely for odourcontrol, using specialised machinery.
For both slurry and FYM spread on the surface, most of the emissions occur in thefirst few hours and decline progressively thereafter over a period of days. Typically65% of the ammonium-N content of FYM is lost as ammonia following spreading,though this can range between 30-100%. About 50% of losses occur in the first dayafter spreading and emissions continue for a further 10 days or so (Figure 6.2). PigFYM that has not been stored before spreading has a typical ammonium-N contentequivalent to 25% of the total N, compared with only 10% for stored FYM. As aresult, ammonia losses are greater from ‘fresh’ FYM.
Ammonia emissions occur more rapidly from pig slurry than from FYM, withtypically half of the total emissions occurring in the first 6 hours after spreadingand continuing for around 5 days. The dry matter content of slurry has an importantinfluence on ammonia emissions. Emissions increase by about 5% of theammonium N applied for every 1% increase in slurry dry matter content. Emissions
Measurements from finishing pigs (30-100 kg liveweight) showed that ammoniaemissions during housing were around 50% greater from a straw-based than aslurry (fully-slatted) management system. On straw-based systems, dung andurine usually build up on the floor of the house and, therefore, are in closecontact with air circulating in the house. On slurry systems, dung and urine fallthrough the slatted floor to an underground storage tank that acts as a ‘barrier’between the ammonia emitting surface of the slurry and the air circulating in thehouse. These studies indicated that around 40% of N excreted by pigs on thestraw-based system and 25% on the slurry system were lost as ammonia duringhousing. Ammonia losses from part-slatted slurry systems are usually less thanfrom fully-slatted systems because of the non-slatted floor area, that typicallycovers 50-75% of the pen. Research is underway to evaluate different systems interms of ammonia emissions, taking into account animal welfare and otheraspects of managing pigs.
Emissions from manure storage
Ammonia losses during storage are estimated at 2 kt/year and are mainlyinfluenced by the ammonium-N content of the manure, temperature and surfacearea of the store.
The most common types of slurry store include above-ground circular tanks, earth-banked lagoons and below-ground tanks, with around 30, 25 and 45%, respectively,of pig slurry in the UK stored in these structures. Ammonia emissions from slurry tanks and lagoons increase with temperature, windspeed, slurry pH andammonium-N content, as well as the frequency of mixing and the storage period.
Approximately 50% of the FYM collected from pig housing is spread directly toland. The remainder is stored in heaps before spreading, either in the field or onconcrete pads. Ammonia losses from pig FYM heaps reach a peak in the first fewdays after they are made, driven by increased heap temperatures (55-60ºC) during‘composting’ of the manure, with most of the emissions occuring in the first 30 daysof storage. Turning pig FYM heaps to aid the composting process typically increasesammonia emissions by about 50% compared with no turning. Further emissionoccurs once the heap is broken out for spreading on land, however, since this usuallytakes only a short time, it should make only a small contribution to overall losses.
Emissions from spreading manures on land
Around 10 million tonnes of pig manure are produced in the UK each year, with atotal N content of about 70 kt. Ammonia losses following the spreading of pig FYMand slurry on land have been estimated at 8 kt per year. This is worth almost £2million in lost fertilizer value. 50
NH3 Ammonia in the UK
Figure 6.2Caption needed
0
5
10
15
20
25
30
35
1 2 3 4 5 6 7 8 9 10
Days after application
N lo
ss a
s %
am
mo
nium
-N a
pp
lied
Pig FYM
Pig slurry (4% drymatter)

53
Methods of ammonia abatement
The Integrated Pollution Prevention and Control (IPPC) Directive will apply to pigunits with more than 2,000 places for finishing pigs (over 30 kg) or 750 places forsows. The Directive aims to prevent or reduce pollution to achieve a “high level ofprotection of the environment” and will require the adoption of “best availabletechniques”. In developing effective ammonia abatement practices, it is importantto consider all three stages of manure management together, as reductions inemissions at early stages (i.e. from housing) will impact on emissions at later stages(i.e. from storage and spreading of manures).
As outlined in Chapter 1, decreasing the amount of N excreted by livestock,through improved utilisation of the protein in their diet, is one way of reducingammonia losses from pig farms. In experiments, feeding a diet containing 70% less N than typical commercial diets, halved ammonia emissions during housingand reduced the ammonium-N content of the slurry by about 30%, withoutcompromising pig performance. Synthetic amino acids were used to formulate theexperimental diet. Such diets would be somewhat more expensive thanconventional ones.
Presently, research suggests that the most practical and cost-effective methods to reduce emissions focus on the storage and spreading of manures on land, as outlined below:
Storage: Covering slurry stores is an effective method for reducing ammoniaemissions and is a requirement for all new storage facilities on installations coveredby IPPC. Results from recent research indicate that, in addition to speciallyengineered covers, potentially cheaper covers such as a floating layer of LECA(light expanded clay aggregate) or UV-stabilized plastic sheets, give a significantreduction in emissions from stored pig slurry. There are also prospects for reducingammonia emissions by simply storing FYM for a period before spreading on land.Although some emission occurs from the store, this is not as great as that afterspreading because some of the ammonium-N becomes incorporated into biomassduring storage and so is not lost as ammonia.
Spreading on land: The rapid incorporation of slurry and solid manure into thesoil is a simple way of reducing ammonia losses where the manures are spread onbare land. Ploughing pig slurry into the soil within 6 hours of spreading and pigFYM within 24 hours will, typically, halve ammonia emissions compared withleaving the manure on the soil surface. Cultivation using discs and tines is likely tobe less effective than ploughing because the manure will not be buried completely.However, these quicker and cheaper cultivation methods may enable more rapidincorporation compared with ploughing.
are also greater at higher windspeeds and when slurry is spread on to dry soils.Therefore, actual losses can vary between 10-60% of the ammonium-N applieddepending on slurry composition, soil and environmental conditions. Typicalammonia losses from pig FYM and slurry are summarised in Table 6.1.
Emissions from pigs kept outdoors
Currently, around 25% of the UK breeding herd is kept outdoors, coveringapproximately 10,000 hectares. Measurements carried out on dry sow paddocksindicate that ammonia losses, largely as result of emissions from urine deposited in the field, are in the region of 1 kt per year, representing around 4% of totalemissions from UK pig farms. Ammonia emissions per pig are generally lower foroutdoor pigs.
52
NH3 Ammonia in the UK
7
7
4
1.8
0.7
2.4
1.2
0.5
0.6
65%
65%
26%
Manure type(% dry matter)
Nitrogen contents (Kg t-1) of manure
N loss as ammonia(Kg t-1)
Ammonia emissionfactor (i.e. loss as %ammonium-N applied)
Fresh pig FYM* (25%)
Old pig FYM* (25%)
Pig slurry (4%)
Total Ammonium-N
* Fresh FYM has not been stored prior to land application.Old FYM has been stored for 3 months or more.
Table 6.1 Typical ammonia emissions after spreading pig manures on land
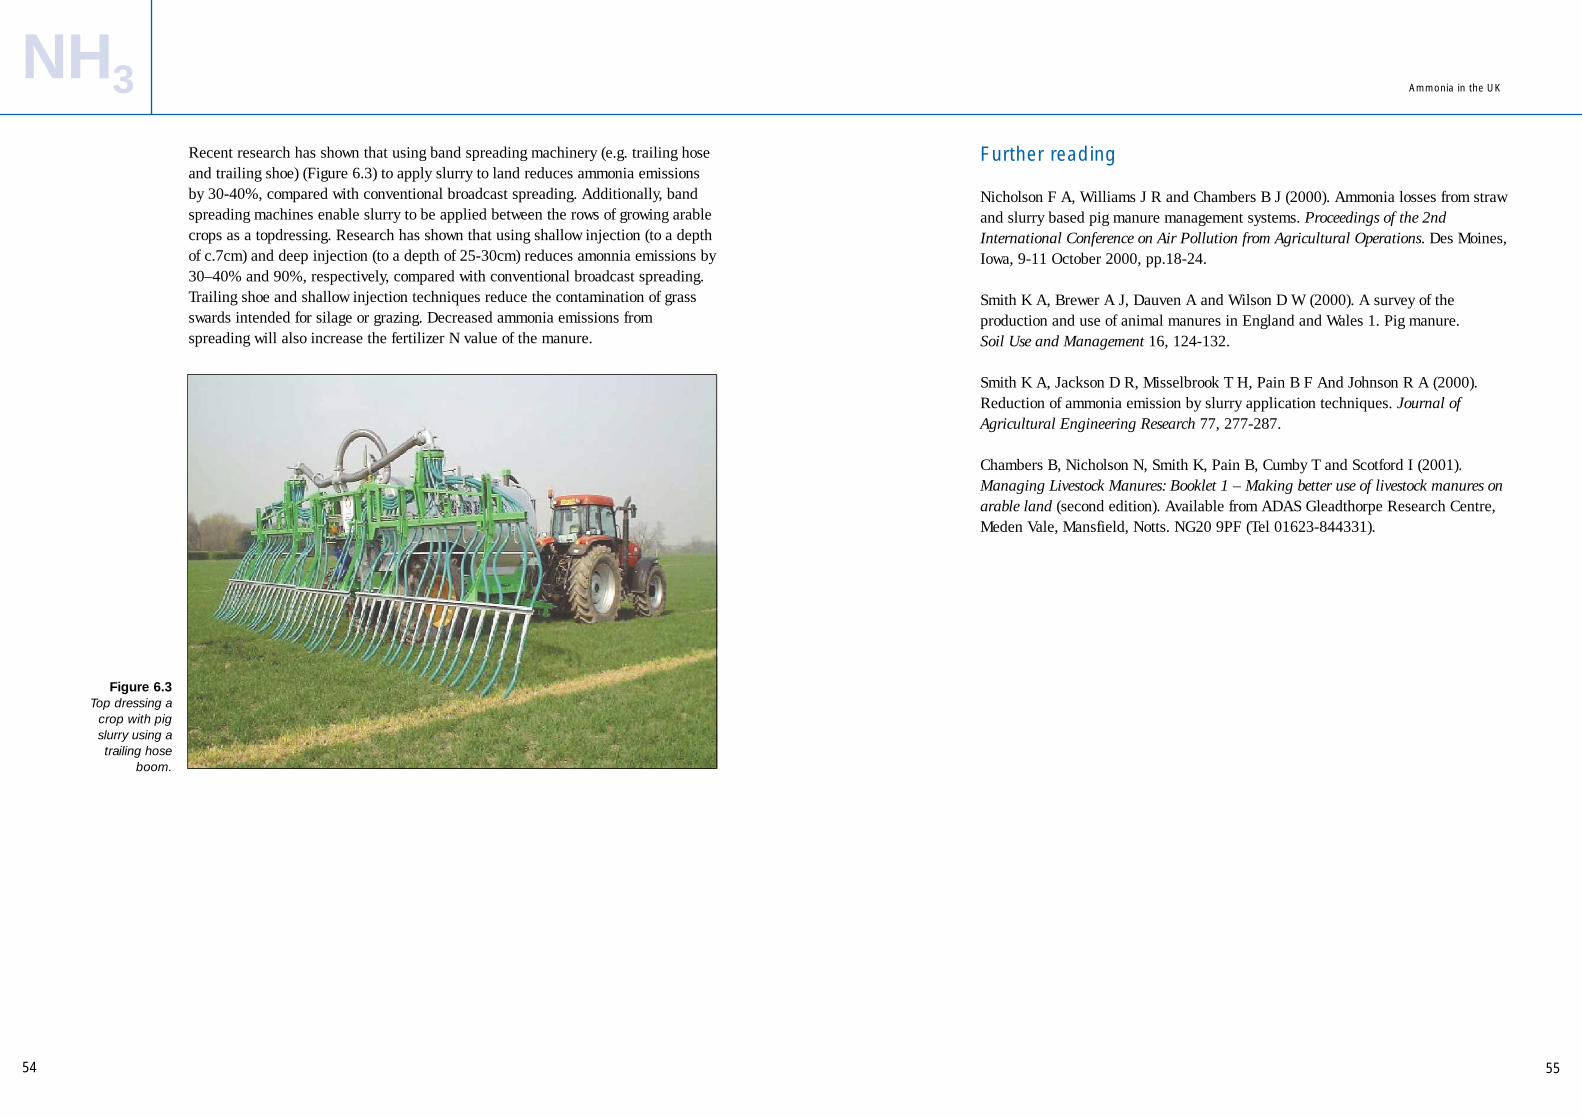
55
Further reading
Nicholson F A, Williams J R and Chambers B J (2000). Ammonia losses from strawand slurry based pig manure management systems. Proceedings of the 2ndInternational Conference on Air Pollution from Agricultural Operations. Des Moines,Iowa, 9-11 October 2000, pp.18-24.
Smith K A, Brewer A J, Dauven A and Wilson D W (2000). A survey of theproduction and use of animal manures in England and Wales 1. Pig manure. Soil Use and Management 16, 124-132.
Smith K A, Jackson D R, Misselbrook T H, Pain B F And Johnson R A (2000).Reduction of ammonia emission by slurry application techniques. Journal ofAgricultural Engineering Research 77, 277-287.
Chambers B, Nicholson N, Smith K, Pain B, Cumby T and Scotford I (2001).Managing Livestock Manures: Booklet 1 – Making better use of livestock manures onarable land (second edition). Available from ADAS Gleadthorpe Research Centre,Meden Vale, Mansfield, Notts. NG20 9PF (Tel 01623-844331).
Recent research has shown that using band spreading machinery (e.g. trailing hoseand trailing shoe) (Figure 6.3) to apply slurry to land reduces ammonia emissionsby 30-40%, compared with conventional broadcast spreading. Additionally, bandspreading machines enable slurry to be applied between the rows of growing arablecrops as a topdressing. Research has shown that using shallow injection (to a depthof c.7cm) and deep injection (to a depth of 25-30cm) reduces amonnia emissions by30–40% and 90%, respectively, compared with conventional broadcast spreading.Trailing shoe and shallow injection techniques reduce the contamination of grassswards intended for silage or grazing. Decreased ammonia emissions fromspreading will also increase the fertilizer N value of the manure.
54
Figure 6.3Top dressing a
crop with pigslurry using atrailing hose
boom.
NH3 Ammonia in the UK
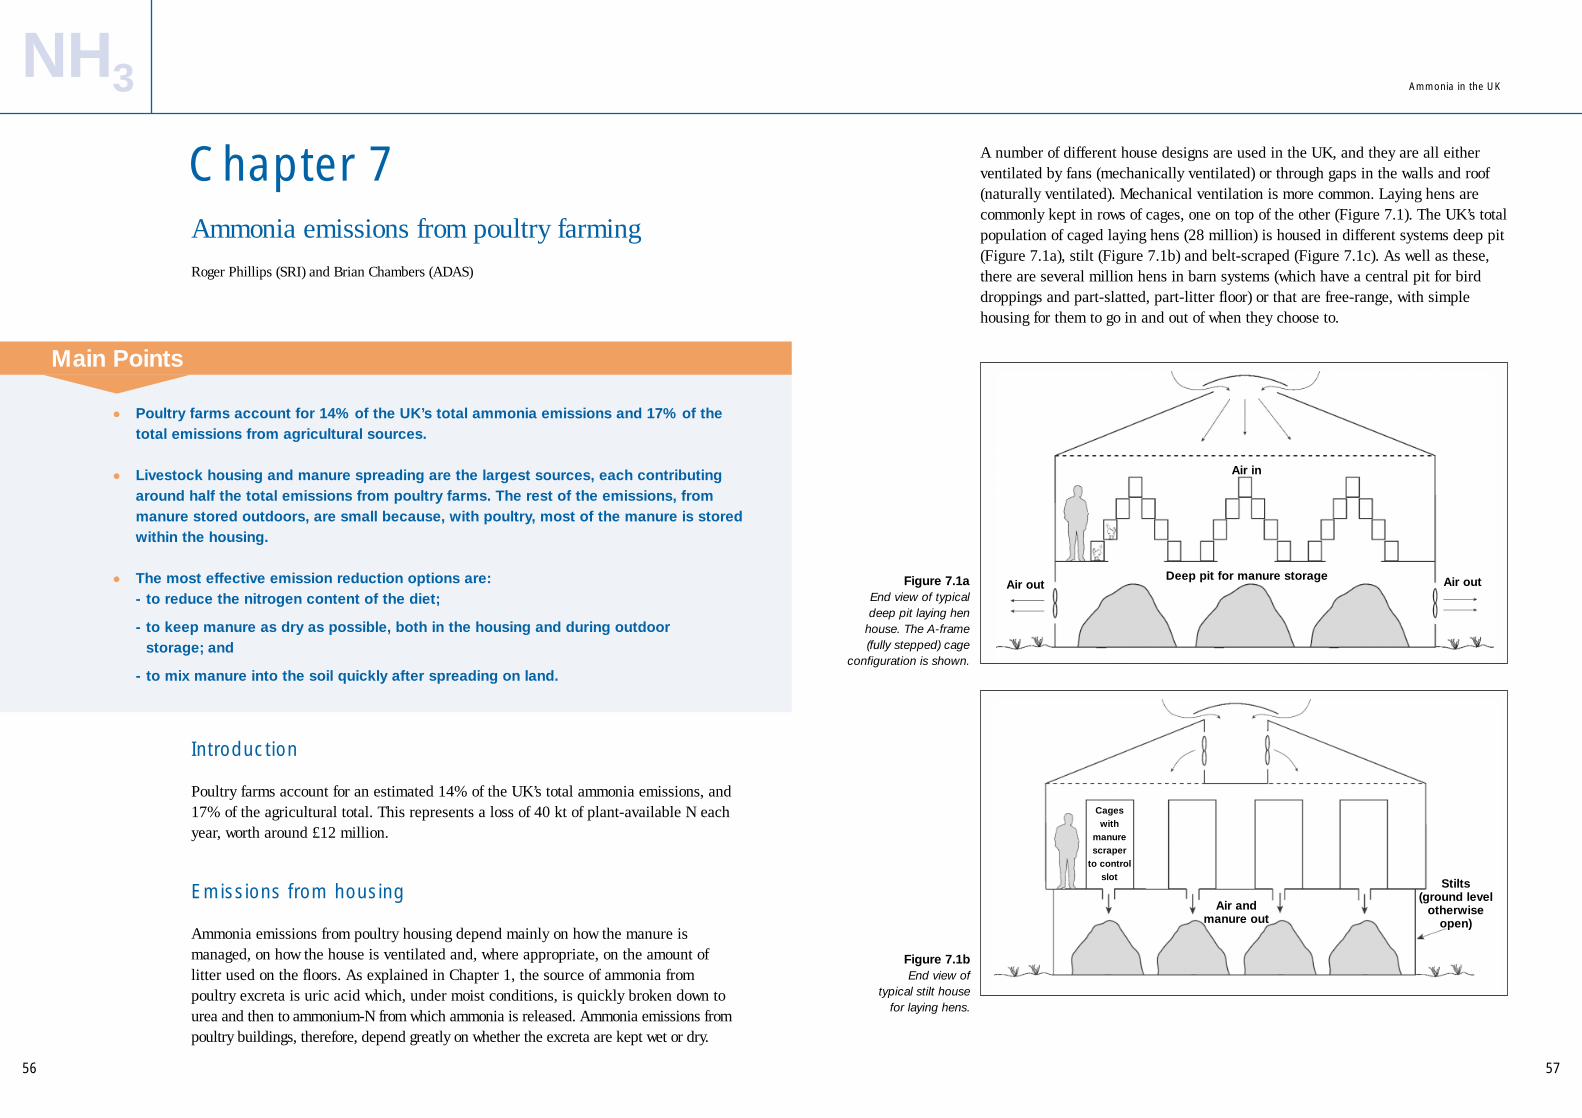
57
A number of different house designs are used in the UK, and they are all eitherventilated by fans (mechanically ventilated) or through gaps in the walls and roof(naturally ventilated). Mechanical ventilation is more common. Laying hens arecommonly kept in rows of cages, one on top of the other (Figure 7.1). The UK’s totalpopulation of caged laying hens (28 million) is housed in different systems deep pit(Figure 7.1a), stilt (Figure 7.1b) and belt-scraped (Figure 7.1c). As well as these,there are several million hens in barn systems (which have a central pit for birddroppings and part-slatted, part-litter floor) or that are free-range, with simplehousing for them to go in and out of when they choose to.
56
NH3
Ammonia emissions from poultry farmingRoger Phillips (SRI) and Brian Chambers (ADAS)
Introduction
Poultry farms account for an estimated 14% of the UK’s total ammonia emissions, and 17% of the agricultural total. This represents a loss of 40 kt of plant-available N eachyear, worth around £12 million.
Emissions from housing
Ammonia emissions from poultry housing depend mainly on how the manure ismanaged, on how the house is ventilated and, where appropriate, on the amount oflitter used on the floors. As explained in Chapter 1, the source of ammonia frompoultry excreta is uric acid which, under moist conditions, is quickly broken down tourea and then to ammonium-N from which ammonia is released. Ammonia emissions frompoultry buildings, therefore, depend greatly on whether the excreta are kept wet or dry.
Chapter 7
Main Points
• Poultry farms account for 14% of the UK’s total ammonia emissions and 17% of thetotal emissions from agricultural sources.
• Livestock housing and manure spreading are the largest sources, each contributingaround half the total emissions from poultry farms. The rest of the emissions, frommanure stored outdoors, are small because, with poultry, most of the manure is storedwithin the housing.
• The most effective emission reduction options are:- to reduce the nitrogen content of the diet;
- to keep manure as dry as possible, both in the housing and during outdoor storage; and
- to mix manure into the soil quickly after spreading on land.
Figure 7.1aEnd view of typicaldeep pit laying hen
house. The A-frame(fully stepped) cage
configuration is shown.
Figure 7.1bEnd view of
typical stilt housefor laying hens.
Ammonia in the UK
Air outAir out
Air in
Air andmanure out
Stilts(ground level
otherwiseopen)
Cages with
manurescraper
to controlslot
Deep pit for manure storage
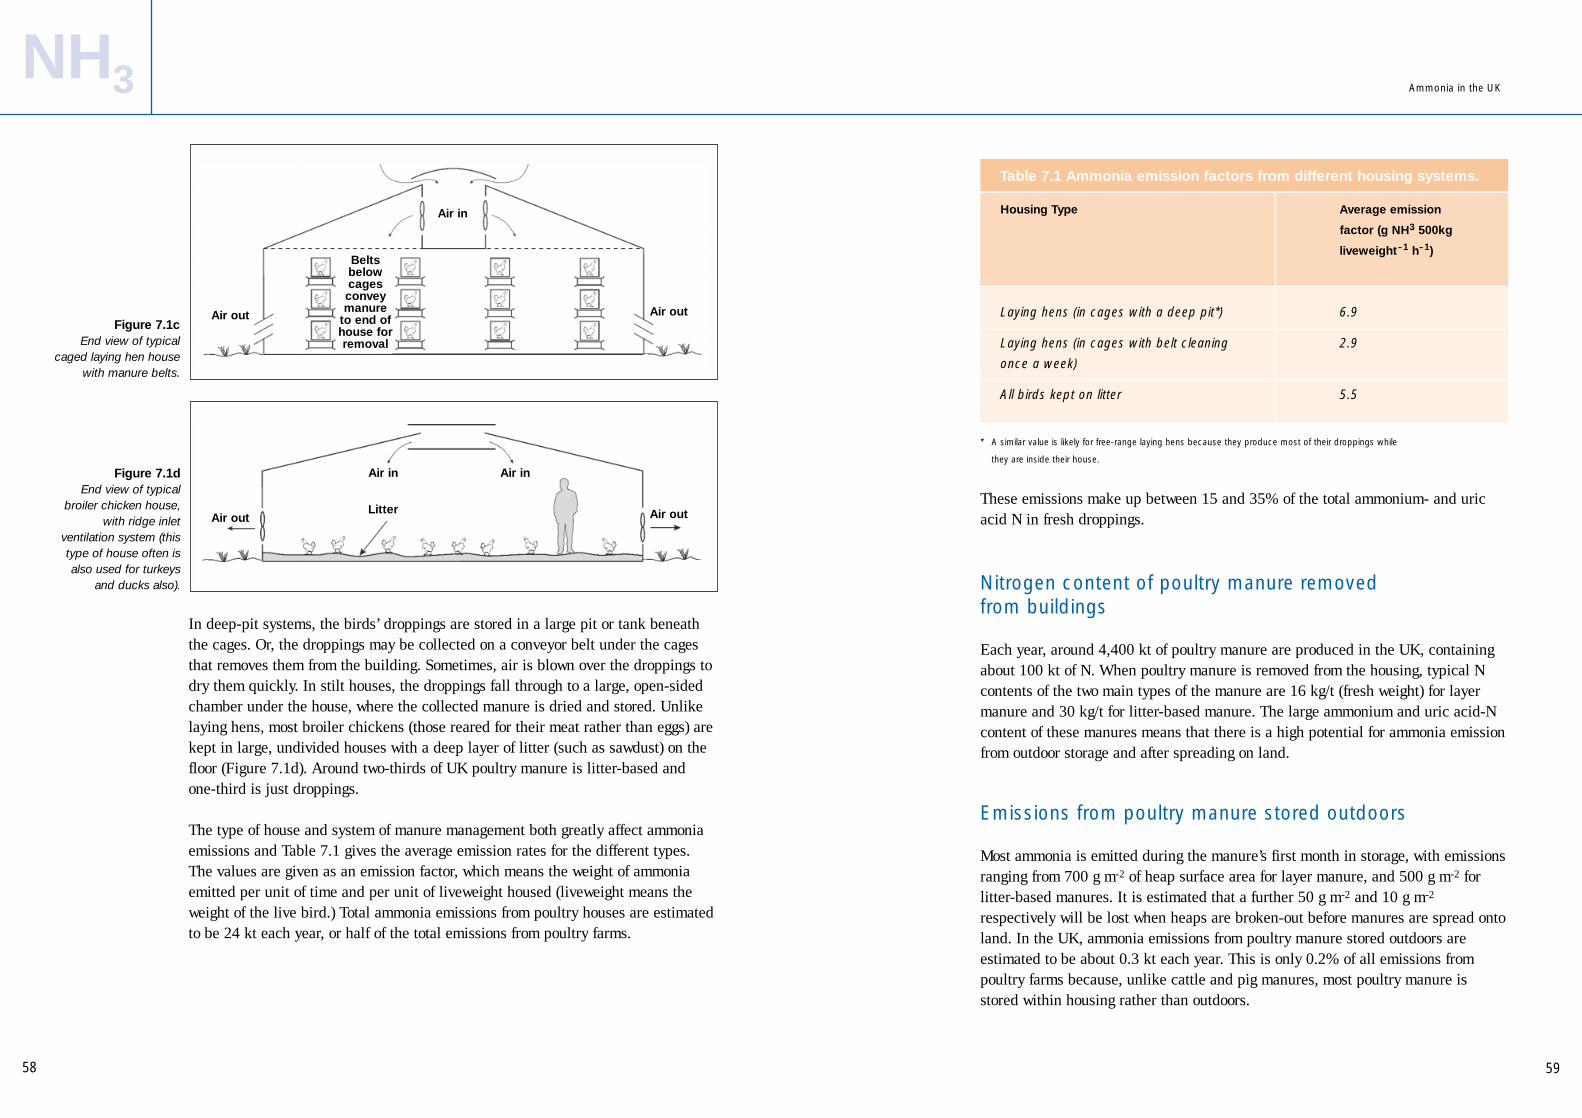
59
* A similar value is likely for free-range laying hens because they produce most of their droppings while
they are inside their house.
These emissions make up between 15 and 35% of the total ammonium- and uricacid N in fresh droppings.
Nitrogen content of poultry manure removed from buildings
Each year, around 4,400 kt of poultry manure are produced in the UK, containingabout 100 kt of N. When poultry manure is removed from the housing, typical Ncontents of the two main types of the manure are 16 kg/t (fresh weight) for layermanure and 30 kg/t for litter-based manure. The large ammonium and uric acid-Ncontent of these manures means that there is a high potential for ammonia emissionfrom outdoor storage and after spreading on land.
Emissions from poultry manure stored outdoors
Most ammonia is emitted during the manure’s first month in storage, with emissionsranging from 700 g m-2 of heap surface area for layer manure, and 500 g m-2 forlitter-based manures. It is estimated that a further 50 g m-2 and 10 g m-2
respectively will be lost when heaps are broken-out before manures are spread ontoland. In the UK, ammonia emissions from poultry manure stored outdoors areestimated to be about 0.3 kt each year. This is only 0.2% of all emissions frompoultry farms because, unlike cattle and pig manures, most poultry manure isstored within housing rather than outdoors.
In deep-pit systems, the birds’ droppings are stored in a large pit or tank beneaththe cages. Or, the droppings may be collected on a conveyor belt under the cagesthat removes them from the building. Sometimes, air is blown over the droppings todry them quickly. In stilt houses, the droppings fall through to a large, open-sidedchamber under the house, where the collected manure is dried and stored. Unlikelaying hens, most broiler chickens (those reared for their meat rather than eggs) arekept in large, undivided houses with a deep layer of litter (such as sawdust) on thefloor (Figure 7.1d). Around two-thirds of UK poultry manure is litter-based andone-third is just droppings.
The type of house and system of manure management both greatly affect ammoniaemissions and Table 7.1 gives the average emission rates for the different types.The values are given as an emission factor, which means the weight of ammoniaemitted per unit of time and per unit of liveweight housed (liveweight means theweight of the live bird.) Total ammonia emissions from poultry houses are estimatedto be 24 kt each year, or half of the total emissions from poultry farms.
58
Figure 7.1cEnd view of typical
caged laying hen housewith manure belts.
Figure 7.1dEnd view of typical
broiler chicken house,with ridge inlet
ventilation system (thistype of house often isalso used for turkeys
and ducks also).
Housing Type Average emission
factor (g NH3 500kg
liveweight-1 h-1)
Laying hens (in cages with a deep pit*) 6.9
Laying hens (in cages with belt cleaning 2.9
once a week)
All birds kept on litter 5.5
NH3 Ammonia in the UK
Air outAir out
Air outAir out
Air in
Air inAir in
Litter
Beltsbelowcagesconveymanure
to end ofhouse forremoval
Table 7.1 Ammonia emission factors from different housing systems.

61
Further reading
Chambers B J and Smith K A (1998). Nitrogen – Some practical solutions for thepoultry industry. World Poultry Science Journal 54, 353-357
Smith K A, Brewer A J, Crabb J and Daren A (2001). A survey of the productionand use of animal manures in England and Wales II poultry manure. Soil Use andManagement 17, 48-56
Emissions from spreading poultry manure on land
These emissions are estimated to be 20 kt each year, which is equivalent to 44% ofthe total from poultry production. Normally, 35% of the N present as ammoniumand uric-acid N is lost over a 30-day period after spreading, although measurmentsshowed a range of 15-95%.
Methods of ammonia abatement
The EU Directive on Integrated Pollution Prevention and Control (IPPC) coverspoultry premises with more than 40,000 birds. It is estimated that there are 540 ofthese premises in the UK so the EU Directive makes it important to find practicalways to reduce ammonia emissions from poultry farming.
Feeding methods: Nitrogen excretion by poultry, and therefore their potential for ammonia emission, can be decreased by reducing the protein in their diet. This method could reduce the ammonia losses from housing and from manurestorage and spreading.
Housing: Keeping the manure dry prevents the bacteria converting uric acid toammonium-N. In practice, this can be done in the house by:
• preventing water spillages;
• using drinkers for the birds that do not leak or drip;
• using enough litter to soak up any liquid in droppings; and
• regularly cleaning manure belts to prevent a build-up of droppings.
Manure stored outdoors: As explained previously, it is good practice to keepmanure as dry as possible by storing it under a roof, with sheeting over outdoorheaps, and making long, thin, steep-sided heaps that can easily shed rainwater. Insome areas of the UK, litter with under 40% moisture content is used as a fuel forelectricity generation and, at present, around one-third of all broiler litter is sold for this purpose.
Spreading manures on land: Mixing manures into the soil as quickly as possibleafter spreading, ideally by ploughing, reduces emissions. This should be donewithin 24 hours of spreading poultry manures. Cultivation with discs or tines willnot mix in the manure as completely, but it is quicker and cheaper.
60
NH3 Ammonia in the UK

Other livestock: sheep, goats, farmeddeer and horsesSteve Jarvis (IGER) and Mark Sutton (CEH)
Introduction
Ammonia emission from this livestock group mostly takes place during grazing. There has been little experimental work on measuring emissions from these animals,and what there is relates almost entirely to sheep. The UK inventory assumes thatemissions for goats and deer are similar to those for sheep. Apart from horses, theselivestock groups spend little time indoors so overall emissions will be relatively smallcompared with the ammonia emissions from cattle, pigs and poultry manureproduction. The latest inventory estimate for emission from UK sheep is 18 kt ofammonia a year (of which more than 70% comes from grazing). Goats and deer eachproduce just less than 1 kt of ammonia each year, and agricultural horses produce justover 3 kt each year.
Chapter 8
63
Emissions from sheep
Sheep are a major feature of the countryside, with about 42 million animals in theUK at present. If we assume that the average volume of urine produced by onesheep each day is 5.7 litres, and that this contains 1.14% N, this represents 1,200kt of ammonium-N each year being recycled – mostly directly to pastures. As is thecase with all urinary-N, this could be volatilized (released as a gas), although theextent of this depends on the nature of the environment in which the sheep aregrazing. So, pastures providing feed and forage that contain little N will:
• reduce urinary-N production; and
• be able to recapture more ammonia in the soil system after volatilisation (see Chapter 3 on tranport and deposition).
Figure 8.1 shows the large differences in the rates of ammonia emissions fromsheep on different pasture. Nitrogen was introduced to these areas in fertilizer orthrough ‘fixation’ by clover (fixation is the conversion of the N in the atmosphere toN within the plant). These values are averages for ongoing measurements, madethrough two grazing seasons.
62
NH3
Main Points
• Ammonia emissions from livestock other than cattle, pigs and poultry are small butsignificant and are mostly associated with the UK sheep population.
• So far, there have only been limited measurements of these emissions so present estimates are very uncertain, and tend to vary with weather and livestockmanagement conditions.
• Emissions from this livestock group arise mainly from grazing, so opportunities forreducing emissions are mainly limited to restricting nitrogen inputs in feed andminimising livestock densities. 2.5
2.0
1.5
1.0
0.5
0grass +400kgNfert
white clover
monoculture
grass\whiteclover
mixture
Ammonia in the UK
Figure 8.1 Daily emissions of
ammonia from sheep-grazed pastures
with different nitrogen(N) forms
(g NH3 sheep -1 d -1).Nfert = Nitrogen
fertilizer.
grass +0kg Nfert

65
year have been estimated for the horses on farms in the UK (although this is uncertain).
Methods of ammonia abatement
There are few opportunities to reduce emissions from other livestock because mostof their time, and often their entire husbandry, is based on grazing. One possibleoption is to reduce N inputs to sheep swards. However, much of the grasslandgrazed by sheep is extensively managed, with little or no N input, so theeffectiveness of this option would be limited to those animals currently underintensive management. All management practices that:
• minimize the concentration of animals on small areas; and
• reduce ‘camping’ areas where animals gather;
will also help to reduce ammonia emissions.
Further Reading
Jarvis S C and Pain B F (eds.) (1997). Gaseous Nitrogen Emissions fromGrasslands. CAB International, Wallingford.
Hatch D J, Jarvis S C and Dollard G (1990). Measurements of ammonia emissionfrom grazed grassland. Environmental Pollution 65, 333-346.
Jarvis S C, Hatch D J, Orr R J and Reynolds S E (1991). Micrometeorologicalstudies of ammonia emission from sheep-grazed swards. Journal of AgriculturalScience, Cambridge 117, 101-109.
64
NH3
A series of short-term experiments under different grazing situations showed the widerange of emissions that are found under different weather and management conditions.Emissions ranged from 0.05 to 3.94 g of ammonia per sheep, per day, for pastures, andup to 4.65 g of ammonia for each sheep, per day, for stubble turnips.
There is a great deal of geographical, and temporal, variation in ammonia emissionsfrom sheep grazing. In most cases, emission is from soil to the atmosphere, but thereare some opportunities for the land to absorb ammonia, especially during the winterperiod. Measurements have shown that after the sheep were removed, emissions alwaysdecreased but still continued for significant periods. Sometimes, both during and aftergrazing, ammonia deposition onto the grass took place. This did not appear to berelated to environmental factors (such as windspeed, temperature and rainfall),although there was some evidence that the greater the concentration of N in the grass,the greater the ammonia emission. The lack of observed links to environmental factorsmay be from the fact that there is only a limited amount of data available.
Ammonia losses from grazing sheep, therefore, depend on the complicatedrelationships between:
• the grass and its management;
• background atmospheric ammonia concentrations;
• environmental conditions; and
• the grazing patterns of the sheep.
We know little about emissions when flocks are penned or housed. Results from theUK Ammonia Monitoring Network suggest that emissions from sheep may have beenunderestimated. In addition, the monitoring data in areas with many sheep show muchlarger ammonia concentrations in the atmosphere in summer than in winter. Thissuggests that overall ammonia emissions from sheep are largest in summer.
Emissions from other livestock
At present, we do not have enough information to estimate accurately the ammoniaemissions from other livestock. Emission levels for sheep may be applied for goats andfarmed deer, taking into account differences in body weight, because their diets aresimilar. There are not many of these animals so even large inaccuracies would notmake much impression on the total national emission levels. Horses, however, have anuncertain but possibly significant effect on total emissions. Not only are there largenumbers of horses in the UK, but the way their manure is managed will also contributeto emissions, mainly because most of it is composted. Ammonia emissions of 3 kt a
Ammonia in the UK

67
• environmental conditions; and
• management (the type, amount and time of fertilizer application).
To develop ways of reducing indirect ammonia emissions from crops, we need adetailed understanding of these relationships.
Effect of fertilizer type
Direct emission of ammonia from fertilizers depends on the chemical form of Nsupplied and the way the fertilizer reacts with the crop-soil system. Ammonia gasexists in balance with ammonium-N dissolved in water, and emissions increase withhigher temperature and pH.
In the UK, the largest ammonia emissions come from fertilizers containing urea. As a percentage of the N applied, between 5-40% of the N in urea is usuallyemitted to the atmosphere. By contrast, emission from ammonium nitrate fertilizeris usually only 0.3-3% of the total N applied. Emissions from other fertilizers, suchas ammonium sulphate and di-ammonium phosphate, are somewhere between ureaand ammonium nitrate, with greater emissions from calcaneous (chalk) soils.
Urea produces large emissions of ammonia because it breaks down in the soil andon plant surfaces to form ammonium. This process is accompanied by an increasein pH to over 9 in the vicinity of fertilizer granules. As a result, soil pH does nothave much effect on ammonia emissions after urea spreading, because the pH willalways be high close to each granule of fertilizer. By contrast, with fertilizers such as ammonium sulphate and di-ammonium phosphate, chemical reactions in the soil do lead to larger ammonia emissions from calcareous soils. Where soil pH ismore than 7, emissions from ammonium sulphate may be even greater than thosefrom urea.
Mixing ammonium nitrate with calcium carbonate to form calcium ammoniumnitrate, does not appear to increase ammonia emissions. This is because the addedcalcium carbonate is only slightly soluble and ammonium nitrate is quicklyabsorbed by the soil. Also, calcium nitrate is highly soluble so this limits theproduction of carbonate ions (which increase soil pH).
It had been suggested that applying urea dissolved in water might reduce emissionsbut more recent measurements do not support this suggestion. However, usingurease inhibitors can significantly reduce ammonia emissions from urea. Ureaseinhibitors slow the breakdown of urea, so that the increases in pH are kept to aminimum and more of the ammonium produced is kept within the soil-plant system.
66
NH3
Emissions from fertilizers and cropsMark Sutton (CEH) and Roland Harrison (ADAS)
Introduction
Spreading N-containing fertilizers on land accounts for around 11% of the ammoniaemission from UK agriculture. Emissions may come either directly from the fertilizer,or indirectly when some of the N taken up by crops is later emitted to the atmosphereas ammonia. This second effect happens both in the first few weeks after adding thefertilizer, when the growing crops are rich in N, and as plants age when stored N isreleased, such as during grain-filling of cereals.
The type of fertilizer used has a large influence on direct ammonia emissions, as doesthe way that the fertilizer is spread on the land. These effects are well established andthey allow clear guidance to be given on how to reduce ammonia emissions. On theother hand, indirect ammonia emission from crops is only partly related to fertilizertype, and depends much more on the relationship between:
• plant metabolism (production, growth and so on);
Chapter 9
Main Points
• Using nitrogen-containing fertilizers on land accounts for around 11% of the totalammonia emission from UK agriculture and 8% of all UK ammonia emissions.
• Ammonia is emitted directly from the nitrogen fertilizer after spreading, and indirectlythrough plants.
• It is possible to reduce both direct and indirect emissions through fairly small changesin management such as the timing of fertilizer spreading.
• Since use of urea is a significant source of ammonia minimising its use by carefullycontrolling use to meet crop requirements or by switching to another fertilizer, such asammonium nitrate, is one of the cheapest ammonia abatement options.
Ammonia in the UK

69
Grassland for hay and silage making
Measurements of ammonia exchange (emission and absorption) with grasslandmanaged for hay and silage-making show that emissions following fertilizerapplication may last several weeks, although the direct emission only lasts a fewdays. Fertilizer N is taken up by plant roots, which increases the ammoniumconcentration in leaves. This results in a larger ammonia compensation point andemission from the leaves. Laboratory studies have shown that ammonium-basedfertilizers result in greater ammonia emissions from grass than nitrate fertilizers,and suggest a direct transfer of some of the soil ammonium to the leaves.
68
NH3
The rate of ammonia emission from fertilizers also depends on environmentalconditions, which partly explains the large range of estimates found in differentexperimental studies. In the UK ammonia emission inventory, it is estimated thatammonium nitrate spread on conserved grassland produces emissions equivalent to1.6% of the N it contains. This can be contrasted with a value of 23% for urea (seeFigure 9.1). For ammonium nitrate on arable land, the estimated percentage emissionrates are halved as urease activity is much less in arable soils and most of thefertilizer-N applied to seedbeds is incorporated into the soil.
Uptake versus emission of ammonia by crops
It is now known that fertilizer N may be emitted as ammonia indirectly by crops. It is difficult to separate the direct emissions from those through crops. An extracomplication is that crops may also absorb ammonia from the atmosphere or recaptureemissions from the soil. So, at times the crop-soil system may emit ammonia, and atother times it may absorb ammonia.
Ammonium-N is found naturally in plant fluids and is present in leaves. The concentration of ammonium in the fluids surrounding cells is a major factor indetermining plants’ ammonia emissions. This concentration depends on the balance ofinputs, such as roots absorbing ammonium versus outputs, such as the formation ofplant proteins. The concentration of ammonia gas in balance with the ammoniumconcentration in these plant fluids is known as the ‘ammonia compensation point’.Where the compensation point is higher than the atmospheric concentration, ammoniais emitted from the stomata (pores) of leaves. Where the compensation point is lowerthan the atmospheric concentration, ammonia is absorbed through stomata. Leafsurfaces are another place where ammonia is absorbed. Also, decaying leaves may emitammonia as the protein breakdown releases large amounts of ammonium.
25
20
15
10
5
0Conserved grassland Tillage
Ammonium nitrate
Urea
Figure 9.1Estimated average rates
of ammonia emissionfrom ammonium nitrate
and urea in the UK. The emission of
ammonia is expressedas the percentage loss
of the N applied.
Ammonia in the UK
1-Jun
3-Jun
5-Jun
7-Jun
9-Jun
11-Jun
13-Jun
15-Jun
17-Jun
19-Jun
rainfall (mm
h-1)
0
5
10 -200
0
200
400
600
800
1000
1200Grass cut Grass
fertilized
Modelled FluxMeasured Fluxem
ission flux (g
NH
3 -N ha - 1)
Figure 9.2bComparison ofmeasured and
modelled ammoniaemission following
cutting and fertilizingof an intensively-
managed grassland.
Figure 9.2aEquipment to
measure ammoniaexchange located
over a managedgrassland.

71
from the atmosphere. During winter, the grassland absorbed 1.5 kg N per ha, butonly emitted 0.8 kg N per ha. Over the whole year, the grassland emitted 4.1 kg Nper ha, but the net emission was less than half this at 1.8 kg N per ha because ofthe periods when absorbtion occured. These values are small in overall agronomicterms but, because of the large area of grassland, they make a significantcontribution to national ammonia emissions. Also, the fact that such grasslandsabsorb only a small amount of ammonia is important as it means that much moreammonia is available in the atmosphere for deposition onto vulnerable ecosystemsof conservation value, such as heath, moorland and forest.
Arable crops
As with grassland, large ammonia emissions occur after young plants emerge fromthe soil and fertilizer is applied. This is because the ammonia compensation pointis large at this stage. As plant growth continues, the available N becomes diluted asmore is incorporated into plant proteins, with the result that the compensation pointis reduced. For cereal crops, a minimum compensation point is reached atflowering, and during this phase both ammonia emission and deposition occur,depending on plant temperature and background ammonia concentrations.
After flowering, crops start to use N from older leaves for seed growth. This leads tolarger ammonia compensation points and net emissions from the canopy. This effectis largely due to the ageing of the older leaves, but there are also signs that highcompensation points occur in the reproductive parts. Emissions from ageing leaveshappen in many other crops, including potatoes, oilseed rape and other brassica(such as cabbage, turnip and mustard). With oilseed rape, the leaves fall to theground during ripening of the seed, where they decay and provide a ground-levelsource of ammonia.
Changes in ammonia exchange above and within an oilseed rape canopy weremeasured to demonstrate this effect, and these measurements provide a useful casestudy to show how the canopy recycles ammonia. Figure 9.4 contrasts averagedaytime and nighttime fluxes (flows). Arrows show the size of individual fluxes. The decaying fallen leaves were a significant source of ammonia during both dayand night, but at night most of this emission was re-absorbed by leaf cuticles.During daytime, the high compensation point of the seed cases led to emission fromthe top part of the canopy, suplemented by some emission from the decaying leaveson the ground. However, most of the emission from decaying leaves is recapturedby deposition within the canopy. The importance of these recycling processes wasshown after the canopy was cut. Net emissions of ammonia to the atmosphereincreased by more than a factor of 5, as much of the ammonia emission fromdecaying leaves was recaptured, while greater air flow at the ground surface alsoincreased mixing with the atmosphere.
70
NH3
Recent improvements in measurement methods now allow ammonia fluxes(exchanges) to be measured continuously at a field scale over many months. Figure9.2b shows how emissions from grassland increased after ammonium nitrate wasapplied on the evening of 11 June, and lasted for over a week. Emissions did notincrease immediately after application but this was probably because of dryweather conditions, as the presence of water increases the mobility of N. Comparethis with the very wet conditions the week before, which reduced the initialemissions after the grass was cut because if there is plenty of water, the ammoniumstays in solution. The normal increase in ammonia emissions after grass cuttingtherefore took several days to appear. Most of this emission comes from the re-growing plants, while emissions from cut silage or drying hay are small.
Advances have also been made in describing the ammonia-exchange process usingmathematical models. Figure 9.2b also shows the output of such a model, whichallows both ammonia emission and deposition to and from plant leaves and the soilsurface, and deposition to leaf cuticles. The purpose of the model is to:
• explain the processes that lead to ammonia emission; and
• provide a tool to estimate changes in emission and absorption where nomeasurements are available.
In the model, the increased emissions following cutting and fertilization areexplained by the increased ammonium in leaf tissues, while soil emissions lastaround four days.
The measurements may be used directly to build up a picture of ammonia exchangewith the intensive grassland during the year (see Figure 9.3). By adding up thehalf-hourly average values, it can be calculated that the grassland emitted 3.3 kg Nper hectare (ha) of land of ammonia during summer and absorbed 0.8 kg N per ha
Winter
kg N ha-1
season-1
Summer
kg N ha-1
season-1
Total
kg N ha-1
yr-1
-1.5 + 0.8 -0.8 + 3.3 -2.3 + 4.1
Net flux -0.7 + 2.5 + 1.8
ANNUAL
Figure 9.3 Annual level of
ammonia exchangewith an intensively-
managed, conservedgrassland. Values are
the totals ofcontinuous, half-hourly
measurements.
Ammonia in the UK
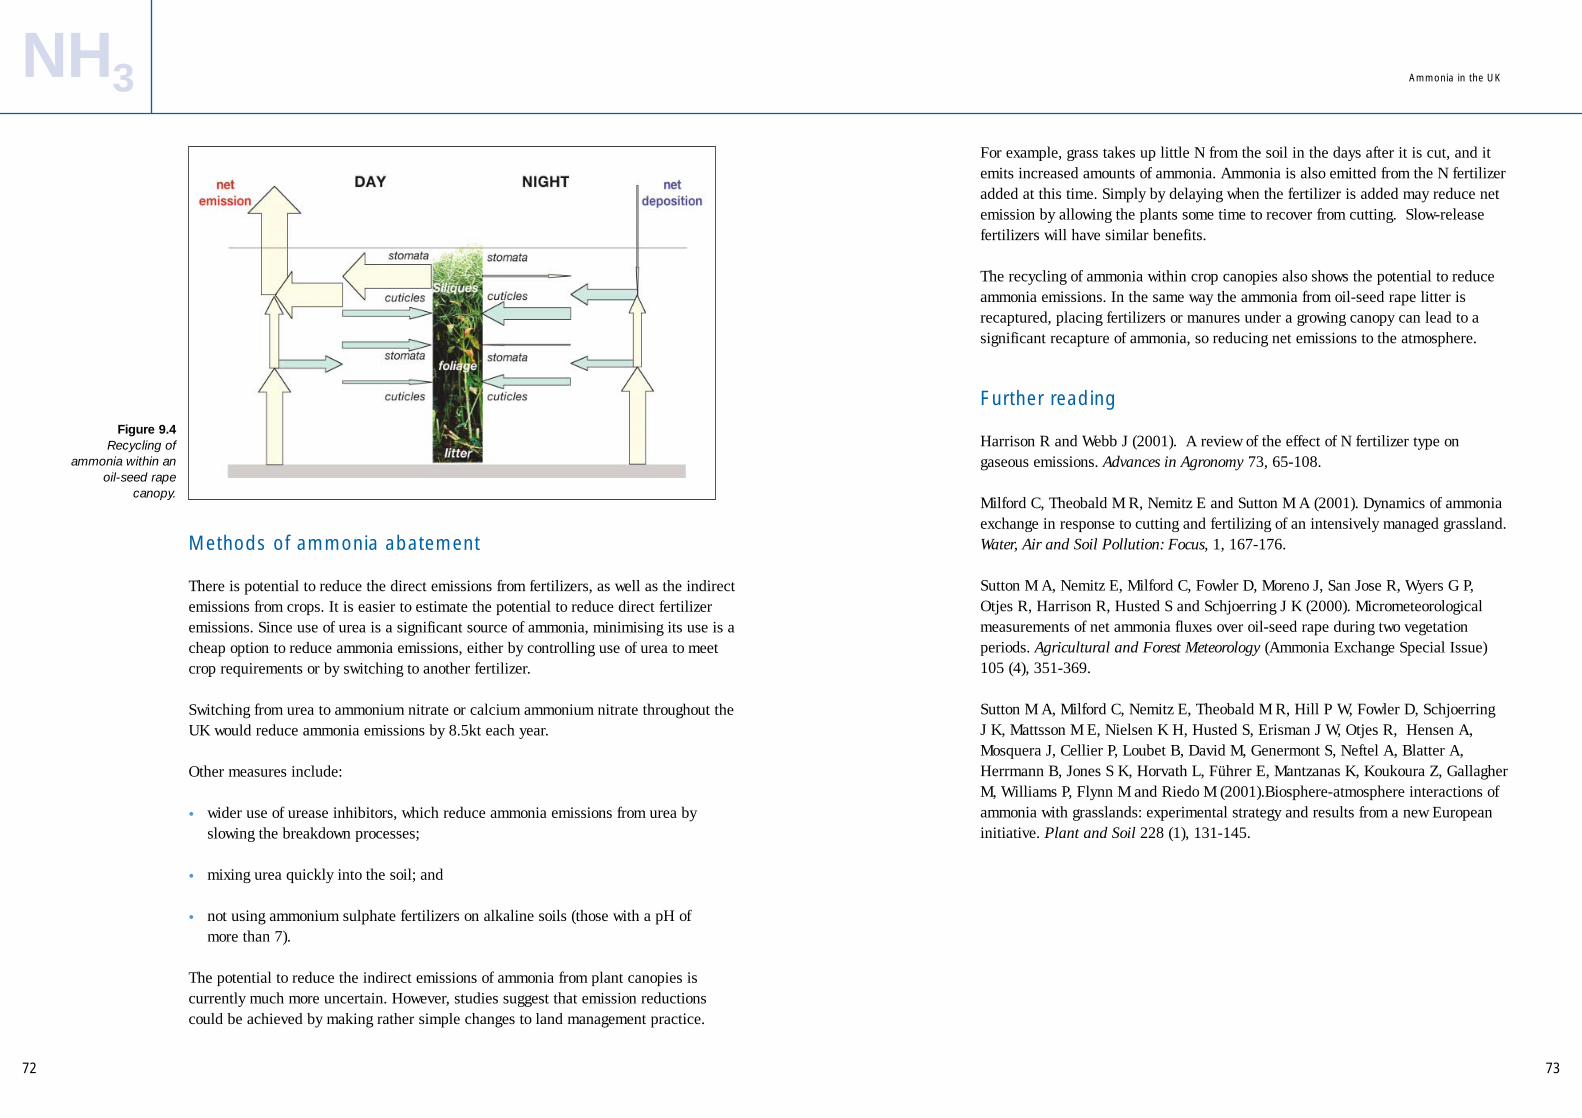
73
For example, grass takes up little N from the soil in the days after it is cut, and itemits increased amounts of ammonia. Ammonia is also emitted from the N fertilizeradded at this time. Simply by delaying when the fertilizer is added may reduce netemission by allowing the plants some time to recover from cutting. Slow-releasefertilizers will have similar benefits.
The recycling of ammonia within crop canopies also shows the potential to reduceammonia emissions. In the same way the ammonia from oil-seed rape litter isrecaptured, placing fertilizers or manures under a growing canopy can lead to asignificant recapture of ammonia, so reducing net emissions to the atmosphere.
Further reading
Harrison R and Webb J (2001). A review of the effect of N fertilizer type ongaseous emissions. Advances in Agronomy 73, 65-108.
Milford C, Theobald M R, Nemitz E and Sutton M A (2001). Dynamics of ammoniaexchange in response to cutting and fertilizing of an intensively managed grassland.Water, Air and Soil Pollution: Focus, 1, 167-176.
Sutton M A, Nemitz E, Milford C, Fowler D, Moreno J, San Jose R, Wyers G P,Otjes R, Harrison R, Husted S and Schjoerring J K (2000). Micrometeorologicalmeasurements of net ammonia fluxes over oil-seed rape during two vegetationperiods. Agricultural and Forest Meteorology (Ammonia Exchange Special Issue)105 (4), 351-369.
Sutton M A, Milford C, Nemitz E, Theobald M R, Hill P W, Fowler D, Schjoerring J K, Mattsson M E, Nielsen K H, Husted S, Erisman J W, Otjes R, Hensen A,Mosquera J, Cellier P, Loubet B, David M, Genermont S, Neftel A, Blatter A,Herrmann B, Jones S K, Horvath L, Führer E, Mantzanas K, Koukoura Z, GallagherM, Williams P, Flynn M and Riedo M (2001).Biosphere-atmosphere interactions ofammonia with grasslands: experimental strategy and results from a new Europeaninitiative. Plant and Soil 228 (1), 131-145.
72
NH3
Methods of ammonia abatement
There is potential to reduce the direct emissions from fertilizers, as well as the indirectemissions from crops. It is easier to estimate the potential to reduce direct fertilizeremissions. Since use of urea is a significant source of ammonia, minimising its use is acheap option to reduce ammonia emissions, either by controlling use of urea to meetcrop requirements or by switching to another fertilizer.
Switching from urea to ammonium nitrate or calcium ammonium nitrate throughout theUK would reduce ammonia emissions by 8.5kt each year.
Other measures include:
• wider use of urease inhibitors, which reduce ammonia emissions from urea byslowing the breakdown processes;
• mixing urea quickly into the soil; and
• not using ammonium sulphate fertilizers on alkaline soils (those with a pH of more than 7).
The potential to reduce the indirect emissions of ammonia from plant canopies iscurrently much more uncertain. However, studies suggest that emission reductionscould be achieved by making rather simple changes to land management practice.
Figure 9.4 Recycling of
ammonia within anoil-seed rape
canopy.
Ammonia in the UK

75
Emissions from animals and birds
Much of the non-agricultural ammonia is emitted from urine and droppings fromanimals and birds, in the same process that gives rise to most agriculturalemissions. Sources include dogs, cats, horses, wild animals and seabird colonies.Horses produce a large proportion of emissions in this group and account foraround 13 kt of ammonia each year, including 3 kt a year from horses registered on
74
NH3
Emissions from non-agricultural sourcesMark Sutton and Ulrike Dragosits (CEH)
Introduction
Ammonia is a waste product of normal biological-breakdown processes. It is also animportant component of many manufactured products. So, while agriculturalactivities are the main source of ammonia emission to the atmosphere, there aremany other sources. Most of these are very small, but added together they accountfor around 60 kilotonnes (kt) of ammonia each year, or around 20% of the UK’stotal ammonia emission. Because of the wide variety and small size of thesesources, most have not been studied and estimates are rather uncertain.
Chapter 10
Main Points
• A wide range of non-agricultural sources contributes to ammonia emissions in theUK, including pets, wild animals, sewage sludge (industrial waste), industrial andcombustion processes, and vehicles fitted with catalytic converters.
• In the UK, non-agricultural sources account for around 60 kilotonnes (kt) ofammonia emission each year, but this value is rather uncertain.
• Given the large number of source types, each containing a small amount ofammonia, achieving large reductions in ammonia from non-agricultural sourceswould require a wide range of different approaches. The source where there is thelargest potential to reduce non-agricultural emissions are vehicles fitted withcatalytic converters, sewage sludge and industrial processes.
Ammonia in the UK
agricultural holdings. Estimates of emissions from pets and wild animals are based onN flow for each animal species, their environment and estimated rates of emission fromtheir excreta. Seabird colonies can emit a large amount of the ammonia in theirdroppings to the atmosphere. Current studies suggest that a large bird colony may emitmore than 5 tonnes of ammonia to the atmosphere in a year, which is a similar amountto that from a large poultry farm.
Emissions from humans
People are also souces of ammonia emissions. The largest sources are sewage treatmentand disposal, although estimates here are particularly uncertain. Sewage tratment usinganaerobic (oxygen-free) digestion methods form ammonia and so are thought to give riseto larger emissions than other methods. Dumping sewage at sea has now been bannedto reduce pollution of the marine environment. This, however, has led to more treatedsewage being spread on land, with the result that ammonia emissions from this sourcehave increased. Other sources of ammonia from people include sweating, breathing,smoking and babies’ nappies. The most reliably estimated of these is the emission fromsmoking, which is partly because ammonia is one of the additives in cigarettes.
Emissions from industry
The wide range of industrial sources of ammonia include:
• fertilizer manufacture;
• sugarbeet processing;
• ceramics and cement works; and
• combustion processes.
Figure 10.1Seabird colonies
are nowrecognized as
sources ofammonia.
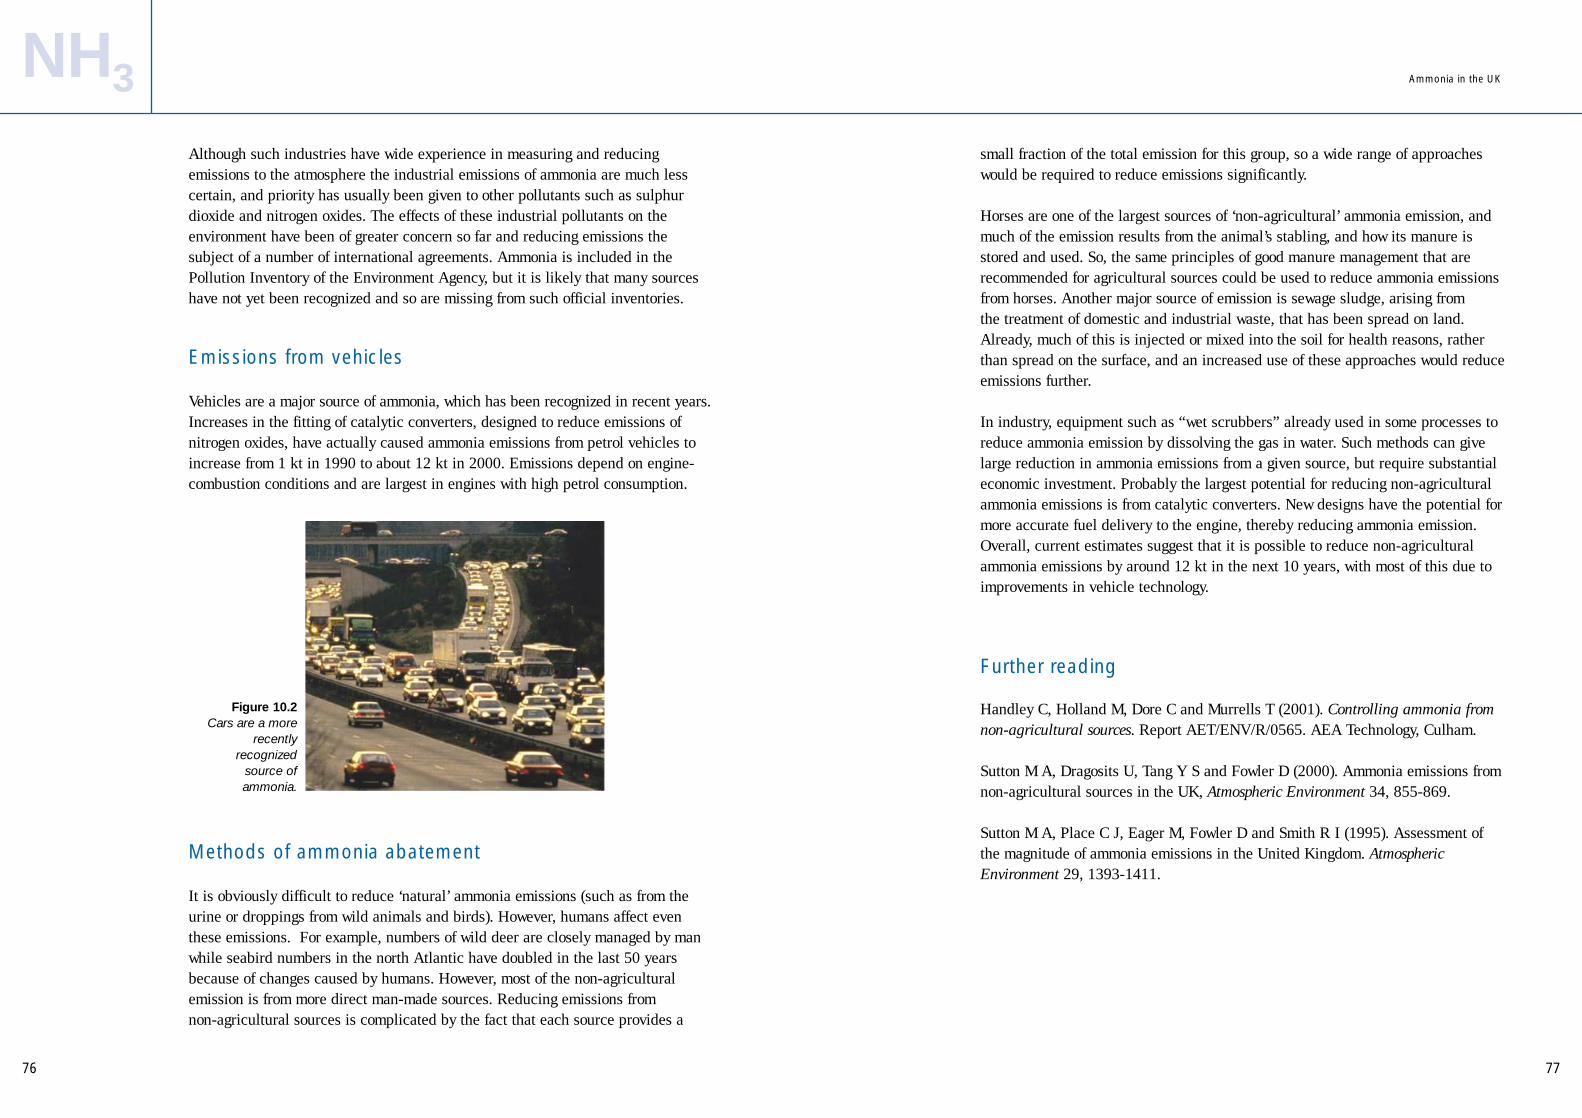
7776
NH3
Figure 10.2Cars are a more
recentlyrecognized
source ofammonia.
Although such industries have wide experience in measuring and reducingemissions to the atmosphere the industrial emissions of ammonia are much lesscertain, and priority has usually been given to other pollutants such as sulphurdioxide and nitrogen oxides. The effects of these industrial pollutants on theenvironment have been of greater concern so far and reducing emissions thesubject of a number of international agreements. Ammonia is included in thePollution Inventory of the Environment Agency, but it is likely that many sourceshave not yet been recognized and so are missing from such official inventories.
Emissions from vehicles
Vehicles are a major source of ammonia, which has been recognized in recent years.Increases in the fitting of catalytic converters, designed to reduce emissions ofnitrogen oxides, have actually caused ammonia emissions from petrol vehicles toincrease from 1 kt in 1990 to about 12 kt in 2000. Emissions depend on engine-combustion conditions and are largest in engines with high petrol consumption.
Methods of ammonia abatement
It is obviously difficult to reduce ‘natural’ ammonia emissions (such as from theurine or droppings from wild animals and birds). However, humans affect eventhese emissions. For example, numbers of wild deer are closely managed by manwhile seabird numbers in the north Atlantic have doubled in the last 50 yearsbecause of changes caused by humans. However, most of the non-agriculturalemission is from more direct man-made sources. Reducing emissions from non-agricultural sources is complicated by the fact that each source provides a
Ammonia in the UK
small fraction of the total emission for this group, so a wide range of approacheswould be required to reduce emissions significantly.
Horses are one of the largest sources of ‘non-agricultural’ ammonia emission, andmuch of the emission results from the animal’s stabling, and how its manure isstored and used. So, the same principles of good manure management that arerecommended for agricultural sources could be used to reduce ammonia emissionsfrom horses. Another major source of emission is sewage sludge, arising from the treatment of domestic and industrial waste, that has been spread on land. Already, much of this is injected or mixed into the soil for health reasons, ratherthan spread on the surface, and an increased use of these approaches would reduceemissions further.
In industry, equipment such as “wet scrubbers” already used in some processes toreduce ammonia emission by dissolving the gas in water. Such methods can givelarge reduction in ammonia emissions from a given source, but require substantialeconomic investment. Probably the largest potential for reducing non-agriculturalammonia emissions is from catalytic converters. New designs have the potential formore accurate fuel delivery to the engine, thereby reducing ammonia emission.Overall, current estimates suggest that it is possible to reduce non-agriculturalammonia emissions by around 12 kt in the next 10 years, with most of this due toimprovements in vehicle technology.
Further reading
Handley C, Holland M, Dore C and Murrells T (2001). Controlling ammonia fromnon-agricultural sources. Report AET/ENV/R/0565. AEA Technology, Culham.
Sutton M A, Dragosits U, Tang Y S and Fowler D (2000). Ammonia emissions fromnon-agricultural sources in the UK, Atmospheric Environment 34, 855-869.
Sutton M A, Place C J, Eager M, Fowler D and Smith R I (1995). Assessment of the magnitude of ammonia emissions in the United Kingdom. AtmosphericEnvironment 29, 1393-1411.
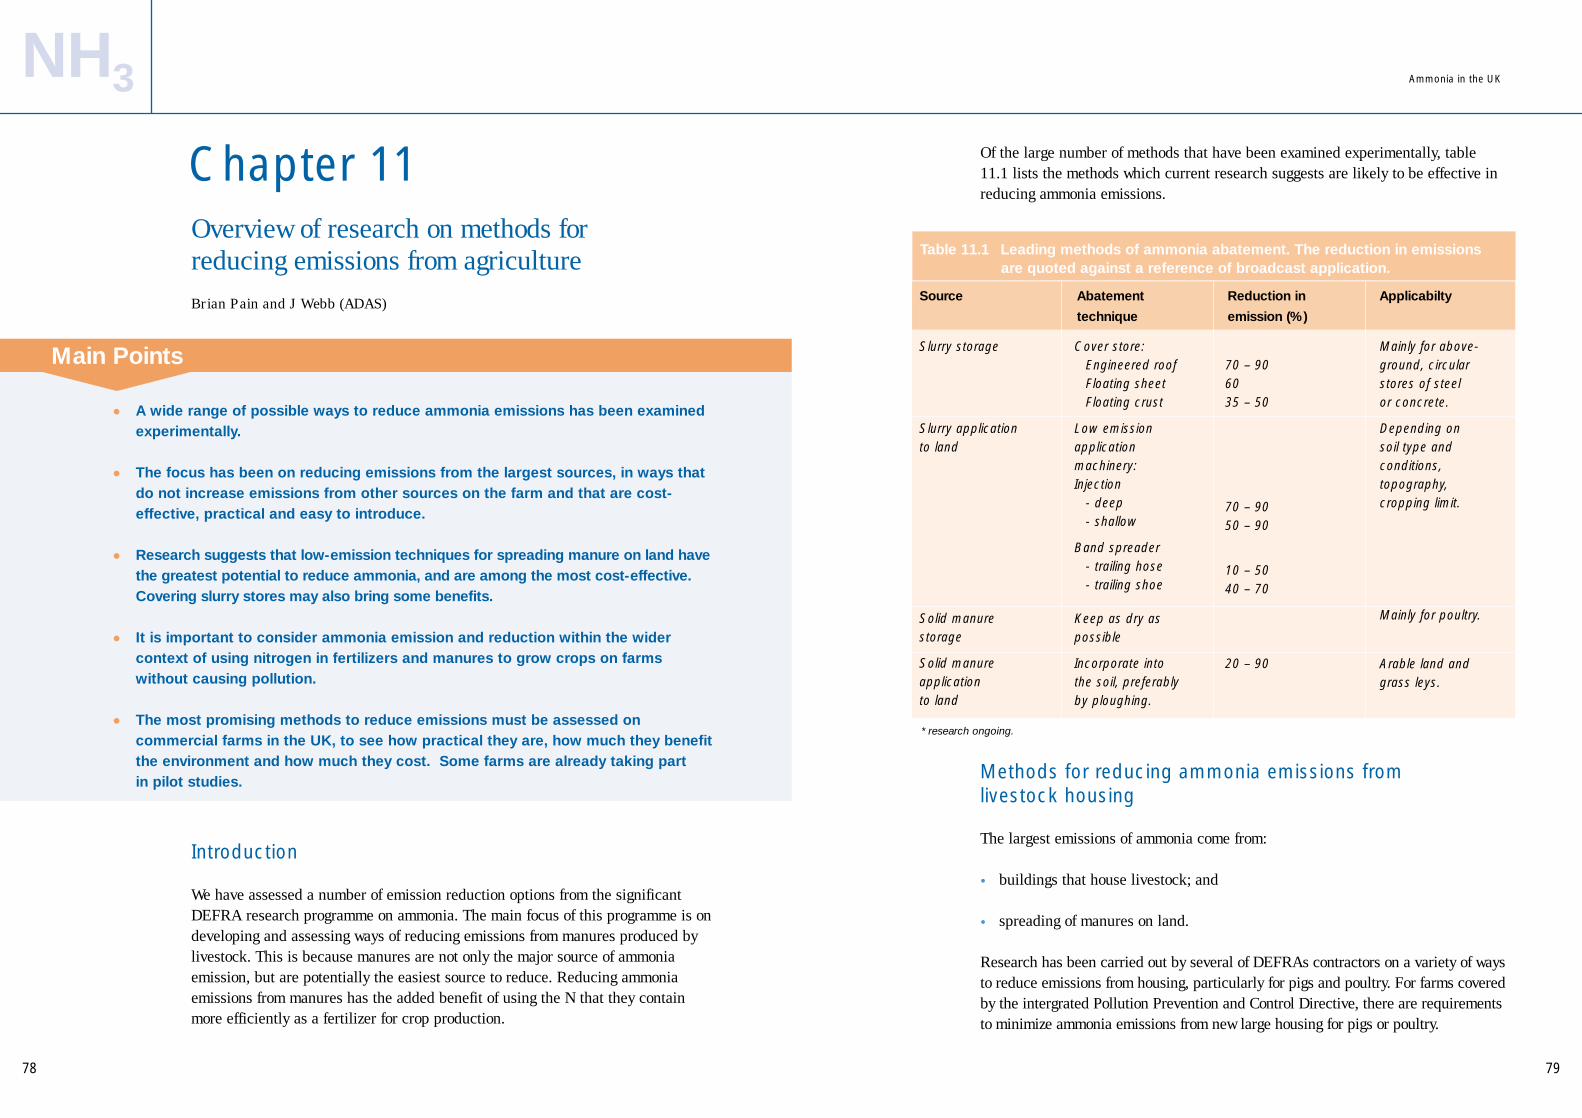
79
Of the large number of methods that have been examined experimentally, table11.1 lists the methods which current research suggests are likely to be effective inreducing ammonia emissions.
Methods for reducing ammonia emissions from livestock housing
The largest emissions of ammonia come from:
• buildings that house livestock; and
• spreading of manures on land.
Research has been carried out by several of DEFRAs contractors on a variety of waysto reduce emissions from housing, particularly for pigs and poultry. For farms coveredby the intergrated Pollution Prevention and Control Directive, there are requirementsto minimize ammonia emissions from new large housing for pigs or poultry.
78
NH3
Overview of research on methods forreducing emissions from agricultureBrian Pain and J Webb (ADAS)
Introduction
We have assessed a number of emission reduction options from the significantDEFRA research programme on ammonia. The main focus of this programme is ondeveloping and assessing ways of reducing emissions from manures produced bylivestock. This is because manures are not only the major source of ammoniaemission, but are potentially the easiest source to reduce. Reducing ammoniaemissions from manures has the added benefit of using the N that they containmore efficiently as a fertilizer for crop production.
Chapter 11
Main Points
• A wide range of possible ways to reduce ammonia emissions has been examinedexperimentally.
• The focus has been on reducing emissions from the largest sources, in ways thatdo not increase emissions from other sources on the farm and that are cost-effective, practical and easy to introduce.
• Research suggests that low-emission techniques for spreading manure on land havethe greatest potential to reduce ammonia, and are among the most cost-effective.Covering slurry stores may also bring some benefits.
• It is important to consider ammonia emission and reduction within the widercontext of using nitrogen in fertilizers and manures to grow crops on farmswithout causing pollution.
• The most promising methods to reduce emissions must be assessed oncommercial farms in the UK, to see how practical they are, how much they benefitthe environment and how much they cost. Some farms are already taking part in pilot studies.
Source Abatement Reduction in Applicabilty
technique emission (%)
Slurry storage
Slurry applicationto land
Solid manurestorage
Solid manureapplication to land
Table 11.1 Leading methods of ammonia abatement. The reduction in emissions are quoted against a reference of broadcast application.
70 – 906035 – 50
70 – 9050 – 90
10 – 5040 – 70
20 – 90
Cover store:Engineered roofFloating sheetFloating crust
Low emissionapplicationmachinery:Injection
- deep- shallow
Band spreader- trailing hose- trailing shoe
Keep as dry aspossible
Incorporate into the soil, preferablyby ploughing.
Mainly for above-ground, circularstores of steel or concrete.
Depending on soil type andconditions,topography,cropping limit.
Mainly for poultry.
Arable land andgrass leys.
* research ongoing.
Ammonia in the UK

8180
NH3
Poultry
Minimizing the moisture content of manure can reduce emissions. This can be done by:
• preventing water spillage from the birds’ drinkers;
• regularly cleaning conveyor belts (which remove the droppings); and
• blowing air over the manure to dry it quickly.
Pigs
In pig housing, floor design can help to reduce emissions. So far, there are noreliable and effective methods for reducing emissions from cattle housing, whichtend to be ventilated naturally through gaps in the walls and roof. However, forloose-housed cattle (those kept in sheds with a deep layer of straw beddingcovering the whole floor area), using more straw may reduce ammonia emissionsfrom the building. The straw absorbs the ammonia, which means there will not beany increase in emissions from manure storage or spreading. Methods for reducingemissions from pig and poultry houses, that are commonly by mechanical means(such as extractor fans), has proved so far to be either expensive or impractical inexisting houses.
Methods for reducing ammonia emissions from manure stores
Emissions from stored manure depend on the surface area of manure in contactwith the air. Fitting specially made covers is an effective way of reducing ammoniaemissions from slurry stores. The ammonia concentration in the air beneath thecover remains high because there is no flow of air across the slurry surface. Thisprevents more of the ammonia dissolved in the slurry being released as a gas andemitted from the store. Such covers are made from sheet steel or concrete and arebest suited to above-ground, circular tanks. Using a slurry store cover can also havethe benefit of keeping rainfall off the store, a particular advantage in high rainfallareas. Less rainfall on the store means less volume of slurry to spread on the landand could give farmers more opportunity to spread the manure at times of the yearwhere ammonia emissions will be lower (such as in spring to a growing crop).Although it is possible, there are some practical difficulties in fitting a cover to a‘lagoon’ type of store, as this has a large, possibly irregular, surface area.
Other methods to reduce ammonia from stored slurry, such as allowing a natural orartificial crust to form on the surface of the stored slurry are not as successful and
Ammonia in the UK
are more difficult to manage but cost less. Methods for reducing emissions fromstored solid manures, such as farmyard manure FYM, are still being developed but generally involve covering the heaps. Although covering manure stores in the UK will have a much smaller effect than reducing emissions from housing orfrom spreading manures, it may be important where the store is near to a sensitive habitat.
Methods for reducing ammonia emissions from spreadingmanures on land
Most slurry and FYM is spread over the whole land surface ‘broadcast’ (figure11.1A). Several techniques have been developed to reduce emissions from slurryspreading and these are described in Figure 11.1 A to D, respectively: spreadingslurry over the whole land surface (broadcast), using a trailing hose, using a trailinghose, using a trailing shoe by injection.
Figure 11.1Methods to reduce
ammonia emissions after slurry spreading.
A Spreading slurry overthe whole land surface
(‘broadcasting’).
B Band spreading bytrailing hose.
C Band spreading bytrailing shoe.
D Injection, either byshallow, open-slotinjection or deep,
below-surface injection.
Against a reference ofbroadcasting.
A B
C D
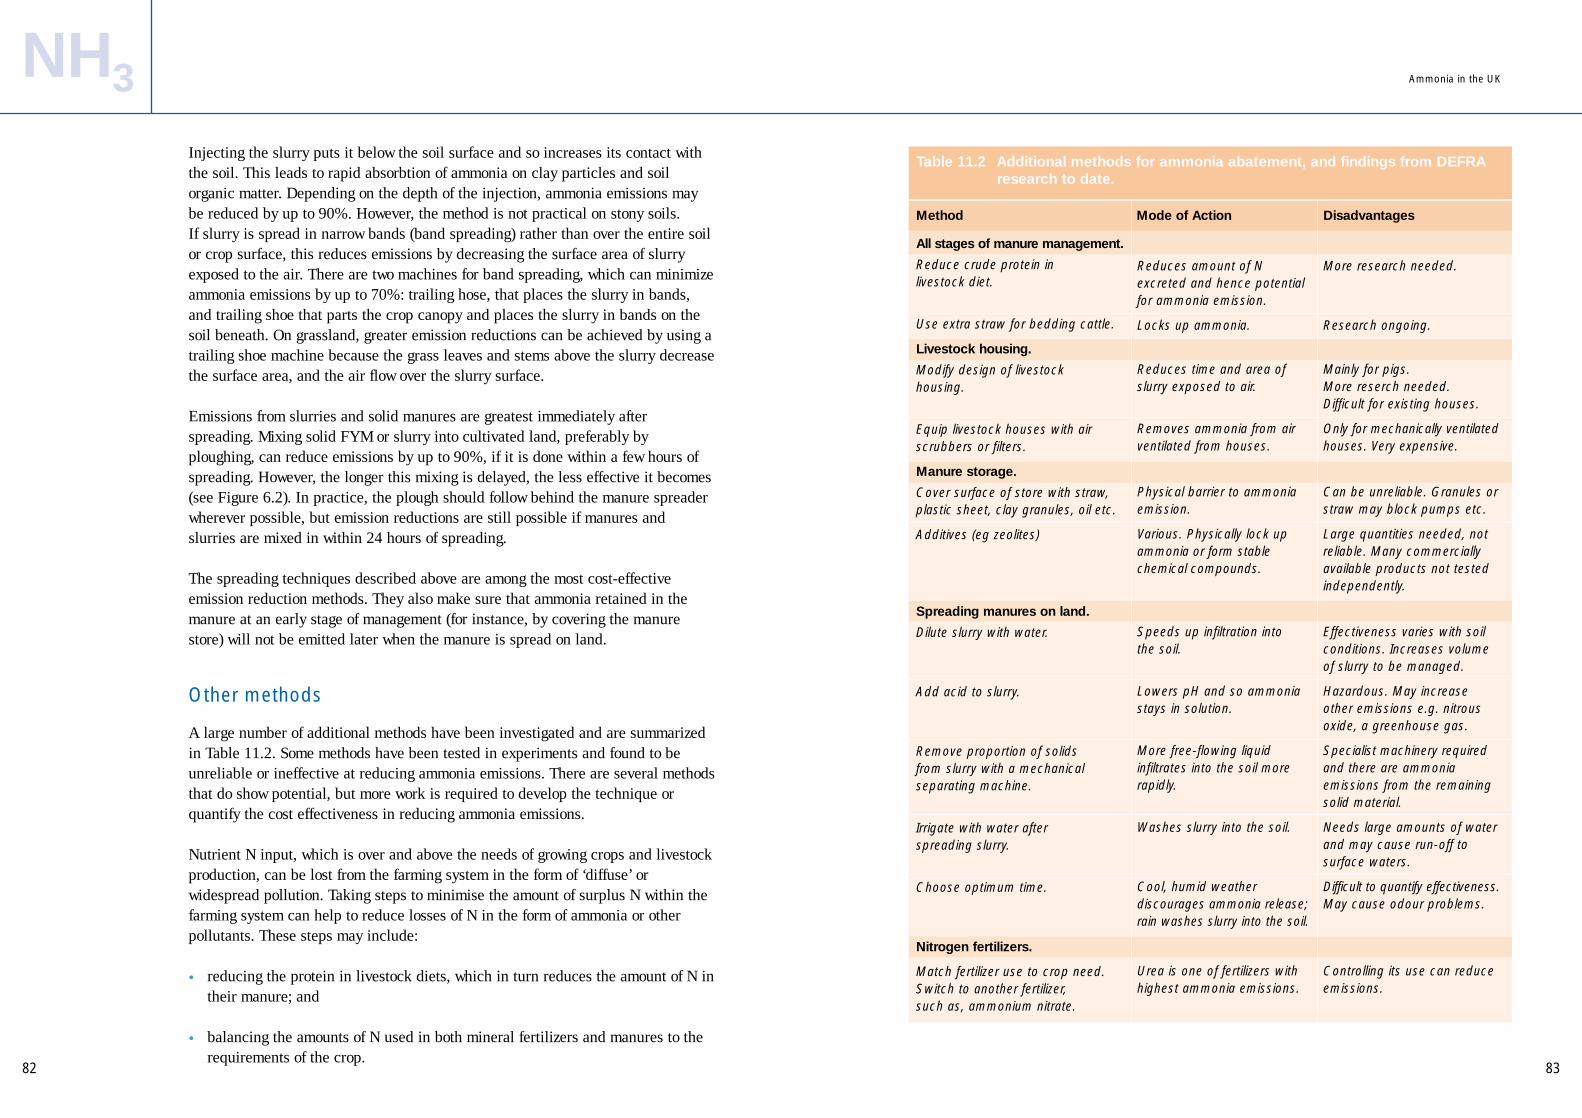
83
Injecting the slurry puts it below the soil surface and so increases its contact withthe soil. This leads to rapid absorbtion of ammonia on clay particles and soilorganic matter. Depending on the depth of the injection, ammonia emissions maybe reduced by up to 90%. However, the method is not practical on stony soils. If slurry is spread in narrow bands (band spreading) rather than over the entire soilor crop surface, this reduces emissions by decreasing the surface area of slurryexposed to the air. There are two machines for band spreading, which can minimizeammonia emissions by up to 70%: trailing hose, that places the slurry in bands,and trailing shoe that parts the crop canopy and places the slurry in bands on thesoil beneath. On grassland, greater emission reductions can be achieved by using atrailing shoe machine because the grass leaves and stems above the slurry decreasethe surface area, and the air flow over the slurry surface.
Emissions from slurries and solid manures are greatest immediately afterspreading. Mixing solid FYM or slurry into cultivated land, preferably byploughing, can reduce emissions by up to 90%, if it is done within a few hours ofspreading. However, the longer this mixing is delayed, the less effective it becomes(see Figure 6.2). In practice, the plough should follow behind the manure spreaderwherever possible, but emission reductions are still possible if manures andslurries are mixed in within 24 hours of spreading.
The spreading techniques described above are among the most cost-effectiveemission reduction methods. They also make sure that ammonia retained in themanure at an early stage of management (for instance, by covering the manurestore) will not be emitted later when the manure is spread on land.
Other methods
A large number of additional methods have been investigated and are summarizedin Table 11.2. Some methods have been tested in experiments and found to beunreliable or ineffective at reducing ammonia emissions. There are several methodsthat do show potential, but more work is required to develop the technique orquantify the cost effectiveness in reducing ammonia emissions.
Nutrient N input, which is over and above the needs of growing crops and livestockproduction, can be lost from the farming system in the form of ‘diffuse’ orwidespread pollution. Taking steps to minimise the amount of surplus N within thefarming system can help to reduce losses of N in the form of ammonia or otherpollutants. These steps may include:
• reducing the protein in livestock diets, which in turn reduces the amount of N intheir manure; and
• balancing the amounts of N used in both mineral fertilizers and manures to therequirements of the crop.
82
NH3 Ammonia in the UK
Method Mode of Action Disadvantages
All stages of manure management.
Reduce crude protein in livestock diet.
Use extra straw for bedding cattle.
Livestock housing.
Modify design of livestock housing.
Equip livestock houses with airscrubbers or filters.
Manure storage.
Cover surface of store with straw, plastic sheet, clay granules, oil etc.
Additives (eg zeolites)
Spreading manures on land.
Dilute slurry with water.
Add acid to slurry.
Remove proportion of solids from slurry with a mechanical separating machine.
Irrigate with water after spreading slurry.
Choose optimum time.
Nitrogen fertilizers.
Match fertilizer use to crop need.Switch to another fertilizer, such as, ammonium nitrate.
More research needed.
Research ongoing.
Mainly for pigs.More reserch needed.Difficult for existing houses.
Only for mechanically ventilatedhouses. Very expensive.
Can be unreliable. Granules orstraw may block pumps etc.
Large quantities needed, notreliable. Many commerciallyavailable products not testedindependently.
Effectiveness varies with soilconditions. Increases volumeof slurry to be managed.
Hazardous. May increaseother emissions e.g. nitrousoxide, a greenhouse gas.
Specialist machinery requiredand there are ammoniaemissions from the remainingsolid material.
Needs large amounts of waterand may cause run-off tosurface waters.
Difficult to quantify effectiveness.May cause odour problems.
Controlling its use can reduceemissions.
Table 11.2 Additional methods for ammonia abatement, and findings from DEFRAresearch to date.
Reduces amount of Nexcreted and hence potentialfor ammonia emission.
Locks up ammonia.
Reduces time and area ofslurry exposed to air.
Removes ammonia from airventilated from houses.
Physical barrier to ammoniaemission.
Various. Physically lock upammonia or form stablechemical compounds.
Speeds up infiltration into the soil.
Lowers pH and so ammoniastays in solution.
More free-flowing liquidinfiltrates into the soil morerapidly.
Washes slurry into the soil.
Cool, humid weatherdiscourages ammonia release;rain washes slurry into the soil.
Urea is one of fertilizers withhighest ammonia emissions.

85
Practicalities on farms
Until recently, our knowledge and experience of ammonia abatement was based onresearch done under experimental conditions. However, priorities and circumstancesare likely to be very different on commercial farms and this will not only affect theefficiency and practicality of the technique, but will also have wider implicationsfor manure management on the farm. As part of a DEFRA funded research project,dairy, beef, pig and poultry farmers were asked to ‘pilot’ the use of injectors, bandspreaders and slurry store covers over three years. Manure contractors were alsoincluded because the relatively high cost of the injectors and band-spreaders couldmean that more farmers use such contractors. The project is providing valuableinformation on the advantages and disadvantages of abatement methods oncommercial farms, and on the true costs. For example, farmers have found thatusing shallow injectors has improved grass production by spreading slurry at theright time to grazing paddocks without the risk of cattle refusing to eat the grass.Covering stores has greatly reduced the amount of slurry in high rainfall areas.Covers may be a more cost-effective option than first thought because of the savingsin slurry-spreading costs. On a less positive note, some farmers have found itimpossible to get onto the land with heavy injection or band-spreading machineryduring wet springs. However, the problem may not be widespread because newmachines can have large flotation tyres so should be more versatile and lessdamaging on wet land than some more conventional manure spreaders.
Further reading
Stevens R J and Laughlin R J (1997). The impact of cattle slurries and theirmanagement on ammonia and nitrous oxide emissions from grassland. In: GaseousNitrogen Emissions from Grasslands. S C Jarvis and B F Pain (eds) CABInternational, Wallingford pp 233-256.
Kay R M and Lee P A (1997). Ammonia emissions from pig buildings andcharacteristics of slurry produced by pigs offered low crude protein diets. In: Voermans J A M and Monteney G J (eds). Ammonia and Odour Emission fromAnimal Production Facilities. Vinkeloord, the Netherlands pp 253-259.
Misselbrook T H, Chadwick D R, Pain B F and Headon D M (1998). Dietarymanipulation as a means of reducing N losses and methane emissions andimproving N uptake following application of pig slurry to grassland. Journal ofAgricultural Science, Cambridge 130, 183-191.
Misselbrook T H, Smith K A, Johnson R A and Pain, B F. Slurry applicationtechniques to reduce ammonia emissions: Results of some UK field-scaleexperiments. Journal of Agricultural Engineering Research (in press).
84
NH3
Changing the livestock diet to conert as much N as possible in feeds to meat and milkappears to be the best solution to the loss of nutrient N, and so reduce diffusepollution, because it tackles the problem at source. The animals excrete less N, sothere is less possibility of ammonia emission from the whole manure-managementsystem. It is sensible to make sure that protein, and therefore N, in the livestock diet ismatched as closely as possible to the animals’ needs at various stages of their growth.Although progress has been made, it is currently not easy to balance the need toachieve an acceptable level of animal production and farm profitability with less N inthe diet, especially for dairy cows. More research is being proposed to address theseissues, however, it is sensible to make sure that protein, and therefore N, in thelivestock diet is matched as closely as possible to the animals’ needs at various stagesof their growth.
Among the other options for reducing ammonia emissions is, when using urea, to matchthe amount of urea and the timing of application to meet the requirements of thegrowing crop, or more effective still, to switch to a different fertilizer with loweremission, such as ammonium nitrate.
Similarly, not spreading the N fertilizer until a few days after cutting grass (to make silage orhay) could reduce ammonia emissions from the crop, as suggested in Chapter 9. A similarbenefit might be expected from slow release fertilizers. These methods do not requirespecialised machinery and could be very cost-effective, however, research is at an early stage.
At the local level, planting a belt of trees around poultry or pig houses could offer someprotection from ammonia emissions nearby sensitive habitats. Good husbandry, forexample keeping floors and walkways clean, and avoiding spillages should also bringsmall benefits in reducing ammonia emissions.
International research
The development and assessment of methods for reducing ammonia in the UK has takenfull advantage of research in other countries, particularly those in Europe. Research onammonia emission reduction has a longer history in countries such as the Netherlandsand Denmark, where the environmental effects have been recognised earlier than in theUK. However, it is well established that there are significant differences between the UKand other countries in livestock management, soil types, climate, economics and so on. It follows that these differences affect how efficient, practical and easily introduced theemission reduction techniques might be. For example, although injecting slurry to below15 cm is known to be a very effective emission reduction method, about 40% of UK soilsare too stony for this method and some land is too steep for the machinery. So, we need tocollect data under specific UK conditions to tackle these differences, and to make surethat the information is relevant to our farming community. Such data will come fromexperimentation, monitoring and modelling, which will involve laboratory, field and farm-scale studies. Alongside this work, improvements in how ammonia is measuredoutdoors in field scale experiments have greatly improved the accuracy of the data obtained.
Ammonia in the UK
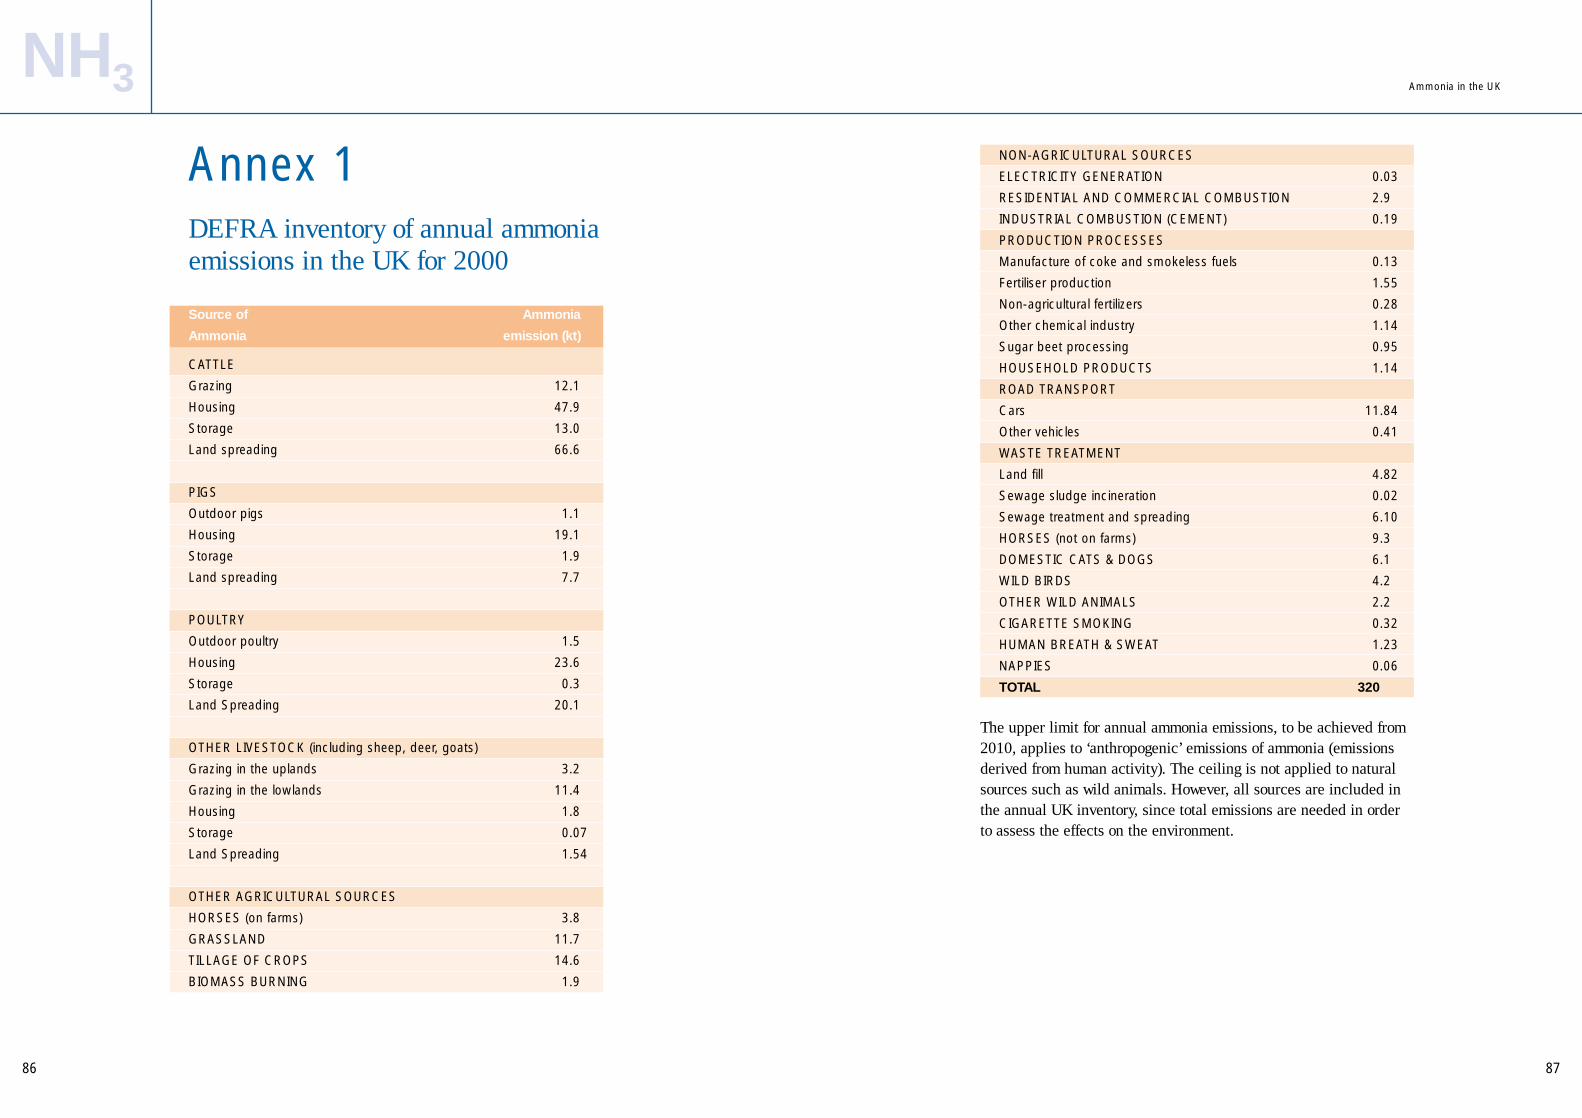
87
Source of Ammonia
Ammonia emission (kt)
CATTLE
Grazing 12.1
Housing 47.9
Storage 13.0
Land spreading 66.6
PIGS
Outdoor pigs 1.1
Housing 19.1
Storage 1.9
Land spreading 7.7
POULTRY
Outdoor poultry 1.5
Housing 23.6
Storage 0.3
Land Spreading 20.1
OTHER LIVESTOCK (including sheep, deer, goats)
Grazing in the uplands 3.2
Grazing in the lowlands 11.4
Housing 1.8
Storage 0.07
Land Spreading 1.54
OTHER AGRICULTURAL SOURCES
HORSES (on farms) 3.8
GRASSLAND 11.7
TILLAGE OF CROPS 14.6
BIOMASS BURNING 1.9
NON-AGRICULTURAL SOURCES
ELECTRICITY GENERATION 0.03
RESIDENTIAL AND COMMERCIAL COMBUSTION 2.9
INDUSTRIAL COMBUSTION (CEMENT) 0.19
PRODUCTION PROCESSES
Manufacture of coke and smokeless fuels 0.13
Fertiliser production 1.55
Non-agricultural fertilizers 0.28
Other chemical industry 1.14
Sugar beet processing 0.95
HOUSEHOLD PRODUCTS 1.14
ROAD TRANSPORT
Cars 11.84
Other vehicles 0.41
WASTE TREATMENT
Land fill 4.82
Sewage sludge incineration 0.02
Sewage treatment and spreading 6.10
HORSES (not on farms) 9.3
DOMESTIC CATS & DOGS 6.1
WILD BIRDS 4.2
OTHER WILD ANIMALS 2.2
CIGARETTE SMOKING 0.32
HUMAN BREATH & SWEAT 1.23
NAPPIES 0.06
TOTAL 320
The upper limit for annual ammonia emissions, to be achieved from2010, applies to ‘anthropogenic’ emissions of ammonia (emissionsderived from human activity). The ceiling is not applied to naturalsources such as wild animals. However, all sources are included inthe annual UK inventory, since total emissions are needed in orderto assess the effects on the environment.
86
NH3
DEFRA inventory of annual ammoniaemissions in the UK for 2000
Annex 1
Ammonia in the UK

8988
NH3
Annex 2 – GlossaryGlossary of Terms
Acidification: is the decrease in the soil reserves of basic cations(positively-charged ions such as those of calcium and magnesium) as aresult of leaching by acids. In streams and lakes, run-off of acidic pollutants(such as nitrate and sulphate) from soils in the catchment (the area of landthat provides the source of water for the stream or lake) removes basiccations, which leads to a decrease in the waters’ ability to neutralise furtheracidity. Acidic cations, such as toxic aluminium, can be released intowaters that cannot neutralize further acidity.
Ammonium-N: Ammonia is very soluble in water and readily reacts withother substances in the atmosphere to form ammonium (NH4
+) compounds
Ammonia gas: Ammonia is mainly emitted to (released into) theatmosphere as a gas (NH3).
Critical level: is the concentration of a pollutant in the atmosphere, below which vegetation is unlikely to be damaged according to presentknowledge.
Critical load: the critical load is the amount of pollutant deposited belowwhich significant harmful effect on specified elements of the environmentdo not occur, according to current knowledge.
The idea of a critical load was developed to provide a receptor-basedsystem for measuring emission reduction targets for pollutants, in the areasof acidification and nutrient over-enrichment. Critical loads of N for nitrogenenrichment have been based on the results of field monitoringexperiments, and links between N deposition and changes in vegetation.Critical loads of acidity, which include the contributions from N and S(sulphur), are generally set to limit changes in the chemistry of soil or soilsolution so that the biological system is protected. The critical limits havebeen set to prevent changes in the species present, or changes in theecosystem
Deposition: Transfer of ammonia or other pollutants from the atmosphere to land
FRAME: the Fine Resolution AMmonia Exchange model has beendeveloped to analyze the fate of ammonia emissions across the UK. The model uses emissions of ammonia, nitrogen oxides and sulphur dioxideto estimate concentrations and deposition at a resolution of 5 km.
Glossary of Terms
Leaching: the washing out of soluble ions and compounds by waterdraining through the soil.
Nitrogen enrichment: is an increase in nitrogen (N) available to plantsabove the amount that a given semi-natural plant community needssometimes referred to as ‘eutrophication’.
Particulate ammonium: ammonia gas reacts in the atmosphere to formfine particles containing ammonium (NH4
+). As these particles can dissolve inwater, they are sometimes called ‘aerosol’.
Reduced nitrogen: together, NH3 and NH4+ are often called ‘reduced
nitrogen’ (NHx). This can be compared with oxidized nitrogen, which includesnitrogen dioxide and nitrates.
Uric Acid: is the form of nitrogen excreted by poultry and other birds.
Ammonia in the UK