Ammonia and greenhouse gas emissions – who emits more? - Tom Misselbrook
14
Rothamsted Research where knowledge grows Rothamsted Research where knowledge grows Ammonia and Greenhouse Gas Emissions – who emits more? Tom Misselbrook Rothamsted Research, North Wyke
-
Upload
sustainable-food-trust -
Category
Environment
-
view
94 -
download
0
Transcript of Ammonia and greenhouse gas emissions – who emits more? - Tom Misselbrook

Rothamsted Researchwhere knowledge grows
Rothamsted Researchwhere knowledge grows
Ammonia and Greenhouse Gas Emissions
– who emits more?
Tom MisselbrookRothamsted Research, North Wyke

Overview
Sources and impacts – ammonia, nitrous oxide, methane
Current emission estimates
Influence of management practices
Potential mitigations

Ammonia - overview
Air quality pollutant
Particulate formation, eutrophication, acidification
Agriculture is major source – c. 90% for UK
NH3 emissions from UK agriculture
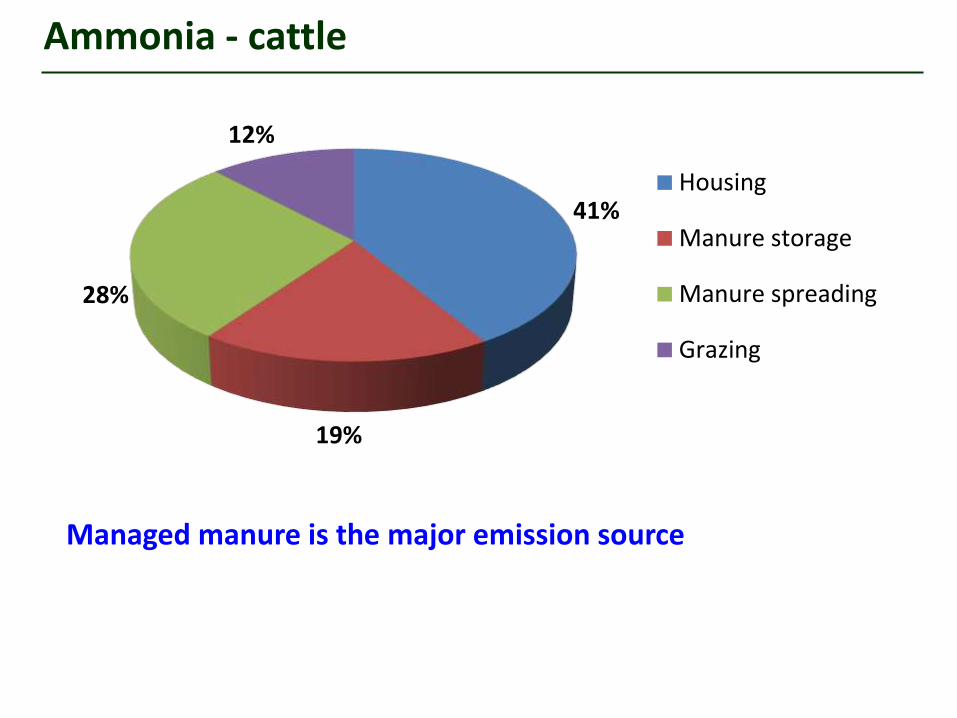
Ammonia - cattle
41%
19%
28%
12%
Housing
Manure storage
Manure spreading
Grazing
Managed manure is the major emission source

Ammonia – influence of management
Annual emission per dairy cow
Extended grazing systems will have lower NH3 emissionsBUT … potential for increased N2O and nitrate leachingHow efficiently are manure nutrients used?

GHG from agriculture - overview
Nitrous oxide and methane are potent GHG (c. 300 and 25x CO2)
Agriculture accounts for 84% N2O and 44% CH4 in UK
GHG emissions from UK agriculture (CO2e)

Enteric methane – influence of management
Production system – large, high yielders vs small, lower yielders
105
110
115
120
125
130
Large, high Medium Small, low
EF k
g C
H4
/hea
d
0
5
10
15
20
25
105
110
115
120
125
130
Large, high Medium Small, low
g C
H4
/kg
milk
EF k
g C
H4
/hea
d
EF (kg/hd/yr) g/l milk
Based on AC0114 proposed inventory methodology

GHG – influence of management
• Diet and body weight – relatively small effect
• Production level has a greater effect
• Other considerations – longevity, fertility, health
110
115
120
125
130
135
140
450 500 550 600 650
EF k
g C
H4
per
hea
d
Live weight
5,000 Milk yield 10,000
25% Concentrate level 75%

Mitigation – diet, lower N intake
Lower losses throughout the system

Mitigation - diet
How low can we go? – Defra project AC0122
How to achieve in largely forage-based systems

Mitigation – manure management
Band spreading Slurry injection
Rapid incorporation
Very effective NH3 emission reduction
Potential increase in N2O
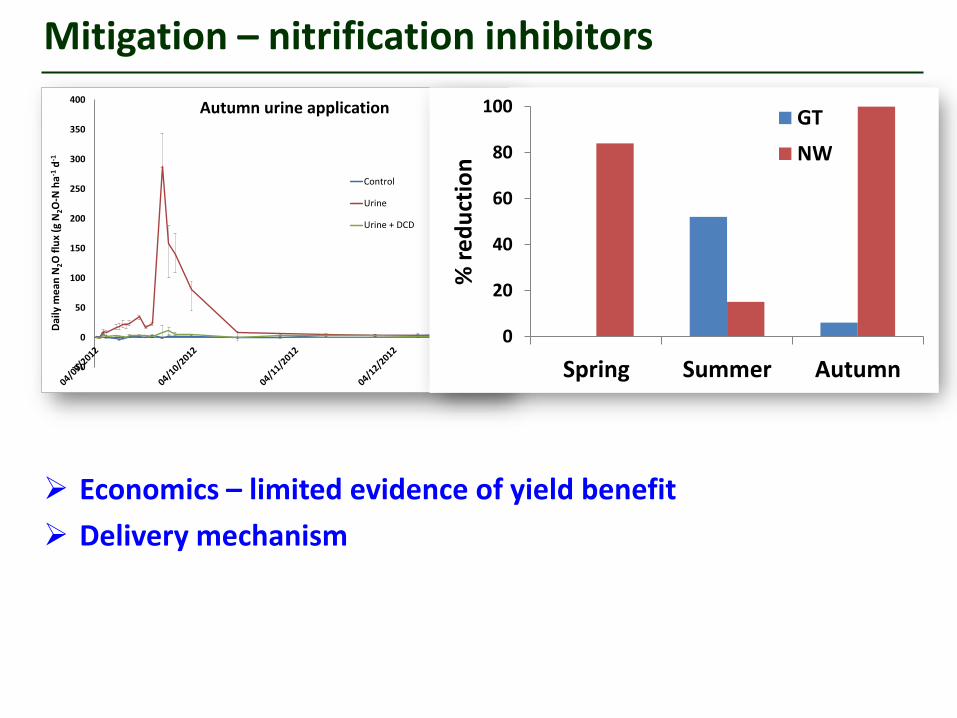
Mitigation – nitrification inhibitors
-50
0
50
100
150
200
250
300
350
400
Dai
ly m
ean
N2O
flu
x (g
N2O
-N h
a-1d
-1
Autumn urine application
Control
Urine
Urine + DCD
Economics – limited evidence of yield benefit
Delivery mechanism
0
20
40
60
80
100
Spring Summer Autumn
% r
ed
uct
ion
GT
NW
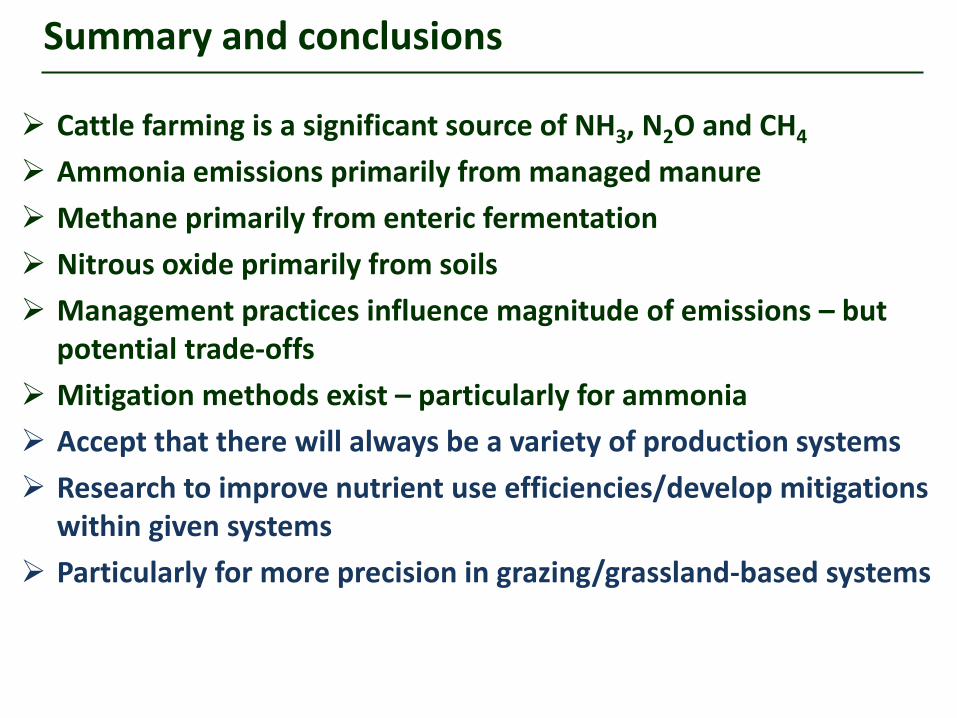
Summary and conclusions
Cattle farming is a significant source of NH3, N2O and CH4
Ammonia emissions primarily from managed manure
Methane primarily from enteric fermentation
Nitrous oxide primarily from soils
Management practices influence magnitude of emissions – but potential trade-offs
Mitigation methods exist – particularly for ammonia
Accept that there will always be a variety of production systems
Research to improve nutrient use efficiencies/develop mitigations within given systems
Particularly for more precision in grazing/grassland-based systems

THE
END
!
Thanks!