Aminoacyl-tRNA-Elongation Ternary Complex. A Fluorescence ... · 7904 Biochemistry 1995, 34,...
9
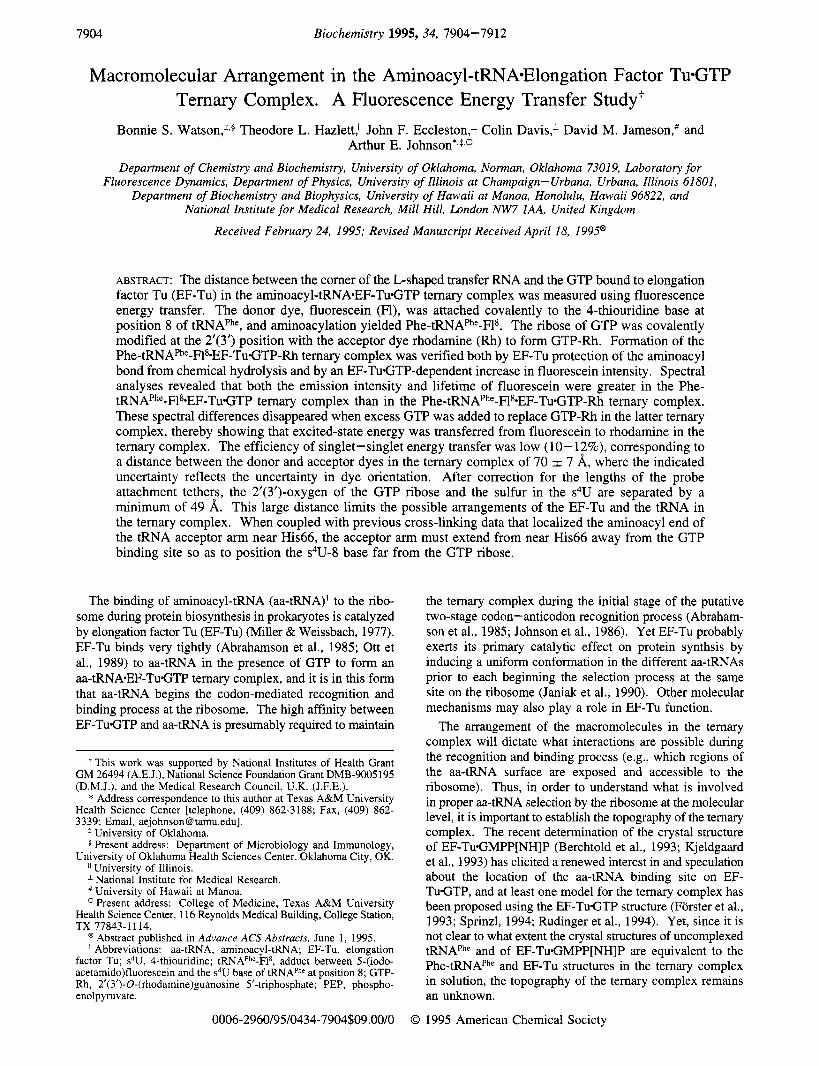
7904 Biochemistry 1995, 34, 7904-7912 Macromolecular Arrangement in the Aminoacyl-tRNA-Elongation Factor Tu-GTP Ternary Complex. A Fluorescence Energy Transfer Study? Bonnie S. Watson,*.§ Theodore L. Hazlett,” John F. Eccleston,l Colin Davis,l David M. Jameson,# and Arthur E. Johnson*%*,o Department of Chemistry and Biochemistry, University of Oklahoma, Norman, Oklahoma 73019, Laboratory for Fluorescence Dynamics, Department of Physics, University of Illinois at Champaign- Urbana, Urbana, Illinois 61801, Department of Biochemistry and Biophysics, University of Hawaii at Manoa, Honolulu, Hawaii 96822, and National Institute for Medical Research, Mill Hill, London NW7 IAA, United Kingdom Received February 24, 1995; Revised Manuscript Received April 18, 1995@ ABSTRACT: The distance between the comer of the L-shaped transfer RNA and the GTP bound to elongation factor Tu (EF-Tu) in the aminoacyl-tRNA-EF-TuGTP ternary complex was measured using fluorescence energy transfer. The donor dye, fluorescein (Fl), was attached covalently to the 4-thiouridine base at position 8 of tRNAPhe, and aminoacylation yielded Phe-tRNAPhe-F18. The ribose of GTP was covalently modified at the 2’(3’) position with the acceptor dye rhodamine (Rh) to form GTP-Rh. Formation of the Phe-tRNAPhe-Fl**EF-TuGTP-Rh ternary complex was verified both by EF-Tu protection of the aminoacyl bond from chemical hydrolysis and by an EF-TuGTP-dependent increase in fluorescein intensity. Spectral analyses revealed that both the emission intensity and lifetime of fluorescein were greater in the Phe- tRNAPhe-Fls*EF-Tu.GTP ternary complex than in the Phe-tRNAPhe-Fls*EF-Tu.GTP-Rh ternary complex. These spectral differences disappeared when excess GTP was added to replace GTP-Rh in the latter ternary complex, thereby showing that excited-state energy was transferred from fluorescein to rhodamine in the ternary complex. The efficiency of singlet-singlet energy transfer was low (10-12%), corresponding to a distance between the donor and acceptor dyes in the ternary complex of 70 f: 7 A, where the indicated uncertainty reflects the uncertainty in dye orientation. After correction for the lengths of the probe attachment tethers, the 2’(3’)-oxygen of the GTP ribose and the sulfur in the s4U are separated by a minimum of 49 A. This large distance limits the possible arrangements of the EF-Tu and the tRNA in the ternary complex. When coupled with previous cross-linking data that localized the aminoacyl end of the tRNA acceptor arm near His66, the acceptor arm must extend from near His66 away from the GTP binding site so as to position the s4U-8 base far from the GTP ribose. The binding of aminoacyl-tRNA (aa-tRNA)’ to the ribo- some during protein biosynthesis in prokaryotes is catalyzed by elongation factor Tu (EF-Tu) (Miller & Weissbach, 1977). EF-Tu binds very tightly (Abrahamson et al., 1985; Ott et al., 1989) to aa-tRNA in the presence of GTP to form an aa-tRNA*EF-TuGTP ternary complex, and it is in this form that aa-tRNA begins the codon-mediated recognition and binding process at the ribosome. The high affinity between EF-TuGTP and aa-tRNA is presumably required to maintain +This work was supported by National Institutes of Health Grant GM 26494 (A.E.J.), National Science Foundation Grant DMB-9005195 (D.M.J.), and the Medical Research Council, U.K. (J.F.E.). * Address correspondence to this author at Texas A&M University Health Science Center [telephone, (409) 862-3188; Fax, (409) 862- 3339; Email, aejohnson @ tamu.edu] . * University of Oklahoma. 5 Present address: Department of Microbiology and Immunology, University of Oklahoma Health Sciences Center, Oklahoma City, OK. 11 University of Illinois. # University of Hawaii at Manoa. National Institute for Medical Research. Present address: College of Medicine, Texas A&M University Health Science Center, 116 Reynolds Medical Building, College Station, TX 77843-1 114. @Abstract published in Advance ACS Abstracts, June 1, 1995. ’ Abbreviations: aa-tRNA, aminoacyl-tRNA; EF-Tu, elongation factor Tu; s4U, 4-thiouridine; tRNAPhe-F18, adduct between 5-(iOdO- acetamid0)fluorescein and the s4Ubase of tRNAPhe at position 8; GTP- Rh, 2’(3’)-O-(rhodamine)guanosine 5’-triphosphate; PEP, phospho- enolpyruvate. 0006-2960/95/0434-7904$09.00/0 the ternary complex during the initial stage of the putative two-stage codon-anticodon recognition process (Abraham- son et al., 1985; Johnson et al., 1986). Yet EF-Tu probably exerts its primary catalytic effect on protein synthsis by inducing a uniform conformation in the different aa-tRNAs prior to each beginning the selection process at the same site on the ribosome (Janiak et al., 1990). Other molecular mechanisms may also play a role in EF-Tu function. The arrangement of the macromolecules in the ternary complex will dictate what interactions are possible during the recognition and binding process (e.g., which regions of the aa-tRNA surface are exposed and accessible to the ribosome). Thus, in order to understand what is involved in proper aa-tRNA selection by the ribosome at the molecular level, it is important to establish the topography of the ternary complex. The recent determination of the crystal structure of EF-TuGMPP[NH]P (Berchtold et al., 1993; Kjeldgaard et al., 1993) has elicited a renewed interest in and speculation about the location of the aa-tRNA binding site on EF- TuGTP, and at least one model for the ternary complex has been proposed using the EF-TuGTP structure (Forster et al., 1993; Sprinzl, 1994; Rudinger et al., 1994). Yet, since it is not clear to what extent the crystal structures of uncomplexed tRNAPhe and of EF-TuGMPP[NH]P are equivalent to the Phe-tRNAPhe and EF-Tu structures in the ternary complex in solution, the topography of the ternary complex remains an unknown. 0 1995 American Chemical Society
Transcript of Aminoacyl-tRNA-Elongation Ternary Complex. A Fluorescence ... · 7904 Biochemistry 1995, 34,...
7904 Biochemistry 1995, 34, 7904-7912
Macromolecular Arrangement in the Aminoacyl-tRNA-Elongation Factor Tu-GTP Ternary Complex. A Fluorescence Energy Transfer Study?
Bonnie S. Watson,*.§ Theodore L. Hazlett,” John F. Eccleston,l Colin Davis,l David M. Jameson,# and Arthur E. Johnson*%*,o
Department of Chemistry and Biochemistry, University of Oklahoma, Norman, Oklahoma 73019, Laboratory for Fluorescence Dynamics, Department of Physics, University of Illinois at Champaign- Urbana, Urbana, Illinois 61801,
Department of Biochemistry and Biophysics, University of Hawaii at Manoa, Honolulu, Hawaii 96822, and National Institute for Medical Research, Mill Hill, London NW7 I A A , United Kingdom
Received February 24, 1995; Revised Manuscript Received April 18, 1995@
ABSTRACT: The distance between the comer of the L-shaped transfer RNA and the GTP bound to elongation factor Tu (EF-Tu) in the aminoacyl-tRNA-EF-TuGTP ternary complex was measured using fluorescence energy transfer. The donor dye, fluorescein (Fl), was attached covalently to the 4-thiouridine base at position 8 of tRNAPhe, and aminoacylation yielded Phe-tRNAPhe-F18. The ribose of GTP was covalently modified at the 2’(3’) position with the acceptor dye rhodamine (Rh) to form GTP-Rh. Formation of the Phe-tRNAPhe-Fl**EF-TuGTP-Rh ternary complex was verified both by EF-Tu protection of the aminoacyl bond from chemical hydrolysis and by an EF-TuGTP-dependent increase in fluorescein intensity. Spectral analyses revealed that both the emission intensity and lifetime of fluorescein were greater in the Phe- tRNAPhe-Fls*EF-Tu.GTP ternary complex than in the Phe-tRNAPhe-Fls*EF-Tu.GTP-Rh ternary complex. These spectral differences disappeared when excess GTP was added to replace GTP-Rh in the latter ternary complex, thereby showing that excited-state energy was transferred from fluorescein to rhodamine in the ternary complex. The efficiency of singlet-singlet energy transfer was low (10-12%), corresponding to a distance between the donor and acceptor dyes in the ternary complex of 70 f: 7 A, where the indicated uncertainty reflects the uncertainty in dye orientation. After correction for the lengths of the probe attachment tethers, the 2’(3’)-oxygen of the GTP ribose and the sulfur in the s4U are separated by a minimum of 49 A. This large distance limits the possible arrangements of the EF-Tu and the tRNA in the ternary complex. When coupled with previous cross-linking data that localized the aminoacyl end of the tRNA acceptor arm near His66, the acceptor arm must extend from near His66 away from the GTP binding site so as to position the s4U-8 base far from the GTP ribose.
The binding of aminoacyl-tRNA (aa-tRNA)’ to the ribo- some during protein biosynthesis in prokaryotes is catalyzed by elongation factor Tu (EF-Tu) (Miller & Weissbach, 1977). EF-Tu binds very tightly (Abrahamson et al., 1985; Ott et al., 1989) to aa-tRNA in the presence of GTP to form an aa-tRNA*EF-TuGTP ternary complex, and it is in this form that aa-tRNA begins the codon-mediated recognition and binding process at the ribosome. The high affinity between EF-TuGTP and aa-tRNA is presumably required to maintain
+This work was supported by National Institutes of Health Grant GM 26494 (A.E.J.), National Science Foundation Grant DMB-9005195 (D.M.J.), and the Medical Research Council, U.K. (J.F.E.).
* Address correspondence to this author at Texas A&M University Health Science Center [telephone, (409) 862-3188; Fax, (409) 862- 3 339; Email, aejohnson @ tamu.edu] . * University of Oklahoma.
5 Present address: Department of Microbiology and Immunology, University of Oklahoma Health Sciences Center, Oklahoma City, OK.
11 University of Illinois.
# University of Hawaii at Manoa. National Institute for Medical Research.
Present address: College of Medicine, Texas A&M University Health Science Center, 116 Reynolds Medical Building, College Station, TX 77843-1 114.
@Abstract published in Advance ACS Abstracts, June 1, 1995. ’ Abbreviations: aa-tRNA, aminoacyl-tRNA; EF-Tu, elongation factor Tu; s4U, 4-thiouridine; tRNAPhe-F18, adduct between 5-(iOdO- acetamid0)fluorescein and the s4U base of tRNAPhe at position 8; GTP- Rh, 2’(3’)-O-(rhodamine)guanosine 5’-triphosphate; PEP, phospho- enolpyruvate.
0006-2960/95/0434-7904$09.00/0
the ternary complex during the initial stage of the putative two-stage codon-anticodon recognition process (Abraham- son et al., 1985; Johnson et al., 1986). Yet EF-Tu probably exerts its primary catalytic effect on protein synthsis by inducing a uniform conformation in the different aa-tRNAs prior to each beginning the selection process at the same site on the ribosome (Janiak et al., 1990). Other molecular mechanisms may also play a role in EF-Tu function.
The arrangement of the macromolecules in the ternary complex will dictate what interactions are possible during the recognition and binding process (e.g., which regions of the aa-tRNA surface are exposed and accessible to the ribosome). Thus, in order to understand what is involved in proper aa-tRNA selection by the ribosome at the molecular level, it is important to establish the topography of the ternary complex. The recent determination of the crystal structure of EF-TuGMPP[NH]P (Berchtold et al., 1993; Kjeldgaard et al., 1993) has elicited a renewed interest in and speculation about the location of the aa-tRNA binding site on EF- TuGTP, and at least one model for the ternary complex has been proposed using the EF-TuGTP structure (Forster et al., 1993; Sprinzl, 1994; Rudinger et al., 1994). Yet, since it is not clear to what extent the crystal structures of uncomplexed tRNAPhe and of EF-TuGMPP[NH]P are equivalent to the Phe-tRNAPhe and EF-Tu structures in the ternary complex in solution, the topography of the ternary complex remains an unknown.
0 1995 American Chemical Society

aa-tRNA-EF-TuGTP Topography
Numerous studies over the past 20 years have provided information about different aspects of the structure of the ternary complex [for references, see Miller and Weissbach (1977), Adkins et al. (1983), Parmeggiani and Swart (1985), Kinzy et al. (1992), and Forster et al. (1993)l. In most cases, the conclusions were compromised by the inability to differentiate unambiguously between the direct effect of ternary complex formation on a structural feature or an indirect effect elicited by a long-range allosteric interaction. Interpretation was also difficult because the only structural models available were of EF-TuGDP [e.g., Kinzy et al. (1992)], not of the much different EF-TuGTP. Only one investigation unequivocally identified the structural relation- ship between a specific site on the prokaryotic EF-Tu and a specific site on the aa-tRNA in the ternary complex. Affinity labeling experiments showed that when Ne-(bromoacety1)- Lys-tRNA, a chemically reactive and functional modified aa-tRNA, was bound to EF-TuGTP in a ternary complex, the bromoacetyl moiety of the aa-tRNA reacted with His66 of EF-Tu (Johnson et al., 1978; Duffy et al., 1981). The high efficiency of the covalent reaction between His66 and the modified amino acid side chain demonstrated that the aminoacyl end of the aa-tRNA binding site on EF-Tu was located adjacent to His66 in domain I. This covalent bond constitutes the only known link between a single site in EF- Tu and a single site on aa-tRNA. Thus, this cross-link serves as the primary experimental reference point in any attempts to discern the arrangement of the EF-Tu and tRNA molecules in the ternary complex.
Since the above affinity labeling result localizes one end of the aa-tRNA molecule at a point on the surface of EF- Tu, the relative orientation of the two macromolecules in the ternary complex can be determined simply by identifying the direction in which the acceptor arm extends along the surface of the protein from the His66 reference point. To determine this, one must identify the spatial relationship between another pair of sites on the EF-Tu and aa-tRNA molecules that are sufficiently far removed from His66 to provide nonredundant information. Thus, we have here determined the separation between the GTP ribose in the nucleotide binding site of EF-Tu and the 4-thiouridine base at the inside comer of the L-shaped aa-tRNA by using fluorescence energy transfer to measure the distance between fluorescent dyes covalently attached to those sites in the ternary complex. Taken together, the energy transfer and affinity labeling data identify the experimentally acceptable arrangements of the EF-Tu and aa-tRNA in the ternary complex in solution and eliminate, by experiment, many other possibilities that are inconsistent with these data.
EXPERIMENTAL PROCEDURES Rhodamine-Lubeled GTP. GTP-Rh was prepared using
a method that is based on the synthesis of adenine nucleotides (Cremo et al., 1990). The procedures were the same as detailed elsewhere (Hazlett et al., 1993; 167 pmol of ethylenediamine should have read 167 pL of ethylenedi- amine), except that lissamine rhodamine B sulfonyl chloride (Molecular Probes, Eugene, OR) was used in place of fluorescein isothiocyanate. The purified GTP-Rh had an Rf of 0.10 when analyzed by thin-layer chromatography using Merck silica gel 60 F254 plates and an isopropyl alcohol/ watedammonium hydroxide (7:4: 1 v/v) solvent. The pres- ence of the triphosphate moiety on GTP-Rh was demon-
Biochemistry, Vol. 34, No. 24, 1995 7905
strated both by the formation of ternary complexes (see below) and by exposing GTP-Rh either to myosin subfrag- ment 1 or to alkaline phosphatase. These enzymes altered the mobility of the fluorescent derivative in the above TLC system to Rfvalues of 0.15 and 0.70, respectively, consistent with the formation of GDP-Rh and guanosine-Rh. The molar absorptivity of GTP-Rh was taken to be 77 000 M-' cm-' at 570 nm (Cooper et al., 1988). No detectable hydrolysis of the rhodamine dye from GTP-Rh to form GTP was observed under the conditions of our experiments.
EF-Tu. Elongation factor Tu was purified from Escheri- chia coli MRE 600 cells (Grain Processing, Muscatine, IA) as described by Leberman et al. (1980), back-extracted from ammonium sulfate as described by Miller and Weissbach (1974), and then stored at -75 "C in the presence of 10 pM GDP. The total concentration of EF-Tu was determined using a molar extinction coefficient of 29 200 M-' cm-I at 280 nm (Hazlett et al., 1989). The nucleotide binding activity of the EF-TU was determined using [3H]GDP and a filter binding assay (Miller & Weissbach, 1974), and the EF- Tu samples used here were completely active in terms of binding GDP. EF-TuGTP-Rh was prepared from EF- TuGDP by stripping the nucleotide from the protein, adding GTP-Rh to the nucleotide-free EF-Tu, and then purifying as described previously (Eccleston, 198 1). The EF-TuGTP titrant solution was prepared immediately prior to a titration by diluting the EF-Tu into solvent S [50 mM Hepes (pH 7.4), 10 mM MgC12, 50 mM NhCl] containing 30 pg/mL pyruvate kinase, 10 pM GTP, and 1 mM PEP and then incubating for 10 min at 37 "C to convert residual GDP to GTP.
Transfer RNA. Pure E. coli tRNAPhe was purchased from Subriden RNA (Rolling Bay, WA), modified using 5-(io- doacetamido)fluorescein (Molecular Probes, Eugene, OR), and purified using RF'C-5 chromatography as before to yield tRNAPhe-F18 (Johnson et., 1982). tRNA samples were aminoacylated as detailed elsewhere (Johnson et al., 1982; Janiak et al., 1990) and stored in 5 mM MgC12 and 1 mM KOAc (pH 5.0) in small aliquots at -75 "C. The concentra- tion of tRNA was determined assuming 6260nm = 6.25 x lo5 M-' cm-' solvent S . The extent of aminoacylation of a tRNA sample was determined by using gel filtration chromatography as detailed by Janiak et al. (1990).
Fluorescence Measurements. All measurements were made in solvent S at 6 "C in 4 mm x 4 mm quartz microcells. The cell compartment was continuously flushed with NZ to prevent condensation on the cuvettes. Shutters were kept closed except during measurements to avoid photodegradation of the samples.
Steady-state fluorescence was measured using an SLM 8000C photon-counting spectrofluorometer (SLM-Aminco, Rochester, NY). For fluorescein, the excitation and emission wavelengths were 490 nm (4-nm band-pass) and 520 nm (1 6-nm band-pass), respectively. Net emission intensity values in fluorescence titrations were determined by subtract- ing the signal of a fluorescein-free sample containing Phe- tRNAPhe from the signal of the parallel sample prepared with Phe-tRNAPhe-F18. Fluorescein emission spectra were ob- tained using an excitation wavelength of 480 nm, recorded at 1-nm intervals between 486 and 700 nm, blank-subtracted, and then corrected for instrument response.
Time-resolved fluorescence measurements were obtained with an ISS Model K2 multifrequency phase fluorometer
7906 Biochemistry, Vol. 34, No. 24, 1995
(ISS, Champaign, IL) using the 488-nm line of a Spectra Physics Model 4540 or 2045 argon ion laser (Spectra- Physics, Piscataway, NJ) as an excitation source and an interference filter (band-pass = 512-528 nm) on the emission light path. Polarization artifacts in the lifetime determinations were avoided by exciting the sample with vertically polarized light and collecting the emission through a Glan-Thompson polarizer oriented 55" relative to the vertical laboratory axis (Spencer & Weber, 1970). The measured phase and modulation values were analyzed with nonlinear least-squares methods using discrete exponential models (Jameson et al., 1984; Jameson & Hazlett, 1991). Disodium fluorescein in 0.1 M NaOH (z = 4.05 ns) was used as a reference solution.
Polarization. The local and global rotational relaxation times for Phe-tRNAPhe-F18, both free and in a ternary complex, were determined previously (Hazlett et al., 1989), and the data reported in that study have been used here. Dynamic polarization measurements of free and EF-Tu- bound GTP-Rh were canied out in the same way using the 514-nm argon ion line for excitation and a Schott OG 550 filter on the emission light path. Steady-state anisotropy values were determined as described elsewhere (Janiak et al., 1992).
Calculation of Ro. The quantum yield of the fluorescein dye in tRNAPhe-F18, the spectral overlap integral and R, were determined using the equations and procedures described previously (Mutucumarana et al., 1992). Since the lifetime of fluorescein in tRNAPhe-F18 was not altered either by aminoacylation or by association of Phe-tRNAPhe-F18 with EF-TuGTP (Hazlett et al., 1989), the quantum yields of fluorescein in tRNAPhe-F18 and in Phe-tRNAPhe-F18*EF- TuGTP were taken to be equal. Also, the emission spectrum of tRNAPhe-FP was not altered by aminoacylation or by association of Phe-tRNAPhe-FP with EF-TuGTP (Adkins et al., 1983), and the excitation spectrum of GTP-Rh was not detectably altered by the presence of either EF-Tu or aa- tRNA (data not shown), so the spectral overlap was calculated using the corrected emission spectrum of tRNAPhe- F18 and the absorbance spectrum of GTP-Rh.
Fluorescence Titrations. Four samples (250 pL) were typically prepared in parallel in solvent S : samples D (donor containing) and DA (donor and acceptor containing) initially contained 15 nM Phe-tRNAPhe-F18, while the blank samples, B (no donor or acceptor) and A (acceptor containing), contained 15 mM unmodified Phe-tRNAPhe. In addition, 3 pM GTP-Rh was added to the DA and A samples, while 10 pM GTP, 1 mM PEP, and 30 pglmL pyruvate kinase were included in the D and B samples. At the beginning of each titration, the fluorescence intensity of a sample was moni- tored until it was stable, and this initial value was designated Fo. The net fluorescein emission intensities, designated FOD and FODA, were obtained by subtraction of the signals of B and of A from the signals of D and of DA, respectively. The subtraction of A from DA eliminated any contribution to the DA signal caused by the direct excitation of rhodamine.
EF-TuGTP-Rh was titrated into samples DA and A, and EF-TuGTP was titrated into samples D and B . After thorough mixing (Dell et al., 1990), microcells were placed back in the sample chamber and allowed to reequilibrate to 6 "C before fluorescence measurements were made (7- 10 min was sufficient for the sample to reach equilibrium, Le., a stable signal). At each point in the titration, the net
Watson et al.
emission intensities were obtained as above and then corrected for dilution due to the addition of titrant to yield a particular value of F. Ternary complex formation was complete when, after addition of sufficient EF-TuGTP(-Rh), the net fluorescein emission intensities of the D and DA samples reached a constant value. These intensities were designated FID and FIDA.
At this point in most titrations, GTP-Rh was added to samples D and B to obtain the same rhodamine concentration (and hence the same inner filter effect) as in DA and A, while GTP was added to either 40 or 20 pM in samples DA and A and incubated for 30-60 min to replace GTP-Rh with GTP in the ternary complexes. At this point, the D and DA samples both contained Phe-tFWAPhe-F18*EF-TuGTP ternary complexes in the presence of GTP-Rh (see Results). The net emission intensities were measured, dilution-corrected, and designated F ~ D and F ~ D A . At the end of the titration, aliquots were removed to determine the total radioactivity in the sample and also the extent of aminoacylation by gel filtration or acid precipitation.
The dissociation constant for the Phe-tRNAPhe-F18*EF- TuGTP-Rh ternary complex was determined at equilibrium as described previously (Abrahamson et al., 1985; Janiak et al., 1990), except that no correction was made for deacylation because the extent of deacylation during these titrations was negligible. The nonlinear least squares fitting of fluorescence data was accomplished using ENZFITTER (R. J. Leather- barrow, Elsevier, Biosoft).
EfSciency of Energy Transfer. The determination of E, the efficiency of singlet- singlet energy transfer, is compli- cated by the presence of unacylated tRNAPhe-F18 in the samples because it does not bind to EF-TuGTP-Rh at the concentrations used here and hence does not participate in energy transfer. The fraction of unacylated tRNAPhe-F18 in a sample, designated u, was calculated from gel filtration data and usually had a value of 0.3 1 for the samples used in this study. Since the deacylation of Phe-tRNAPhe-F18 was negligible, u did not change during our experiments. The binding of EF-TwGTP to Phe-tRNAPhe-FP increased the fluorescein intensity by an average of 37% in solvent S [calculated as in Abrahamson et al. (1985) and Janiak et al. (1990)], but the observed increase averaged 30% in the DA samples because of the inner filter effect of the GTP-Rh in those samples. The fraction of fluorescein intensity con- tributed by unacylated tRNA in a DA sample after the addition of GTP (see above) is therefore ul[u(l) + (1 - u)(1.3)] when all of the aminoacylated tRNA is bound to EF-TuGTP (not EF-TuGTP-Rh). The total fluorescence intensity due to tRNAPhe-Fls in a DA sample is then given
The emission intensity of fluorescein in Phe-tRNAPhe- F18*EF-TuGTP-Rh ternary complexes in the DA sample prior to GTP addition is given by (FIDA - UF), where UF is defined as above. After the addition of 20-40 pM GTP and its replacement of GTP-Rh in the ternary complex, the emission intensity of fluorescein in Phe-tRNAphe-Fl8*EF- TuGTP is given by (FZDA - UF). Making the reasonable assumption that the absorbance of the fluorescein dye bound to the tRNA was not altered by the presence of the distant rhodamine dye attached to the GTP ribose (Le., that intensity is proportional to quantum yield), E is given by
by [ U F ~ D A / ( ~ . ~ - O.~U)] or UF.
aa-tRNA-EF-TuGTP Topography
E = 1 - (QDA/QD) = 1 - [(FIDA - uF)/(F*,A - uF)1 (1)
An independent determination of the efficiency of energy transfer was obtained from measurements of ZD and ZDA, the fluorescein lifetimes in the Phe-tRNAPhe-Fls*EF-TuGTP and Phe-tRNAPhe-F18*EF-TuGTP-Rh ternary complexes, respec- tively. Samples were prepared as above, and fluorescein lifetimes were determined before and after the addition of excess GTP to convert the latter ternary complex into the former. In some experiments, background corrections on the time-resolved data obtained for the DA sample were carried out using the procedures described by Reinhart et al. (1991) and the A sample as the blank. Deconvolution of the phase and modulation data was simplified by the fact that the fluorescein lifetime of tRNAPhe-F18 is not changed either by aminoacylation or by binding to EF-TuGTP (Hazlett et al., 1989) but is altered by the presence of GTP- Rh in the ternary complex. Therefore, in the absence of acceptor, a single exponential decay was utilized to determine ZD. In the presence of acceptor, a two-component analysis was utilized because the unacylated tRNAPhe-F18 did not bind to ET-Tu and experienced no change in lifetime, while the Phe-tRNAPhe-F18 associated with the EF-TuGTP-Rh and experienced a reduction in lifetime due to energy transfer to rhodamine. The deconvolution of the lifetime data was accomplished by fixing one component at the lifetime value obtained in the absence of acceptor and at the fractional contribution corresponding to the biochemically determined amount of unacylated tRNAPhe-F18 (31%) in the sample. The efficiency of singlet-singlet energy transfer was then calculated using
E = 1 - (TDA/zD) (2)
Biochemistry, Vol. 34, No. 24, 1995 7907
n
Distances by Computer. The distances between the center of the rhodamine dye and the 2'- or 3'-oxygen on the GTP ribose, between the center of the fluorescein dye and the sulfur atom in s4U, and between the 3'-oxygen of A-76 and the oxygen on C4 of U8 in yeast tRNAPhe (structure 6TNA.pdb) were determined using Insight 11, version 2.3.5 (Biosym Technologies, San Diego, CA).
RESULTS Fluorescent Species. Phe-tRNAPhe-Fls, an E. coli Phe-
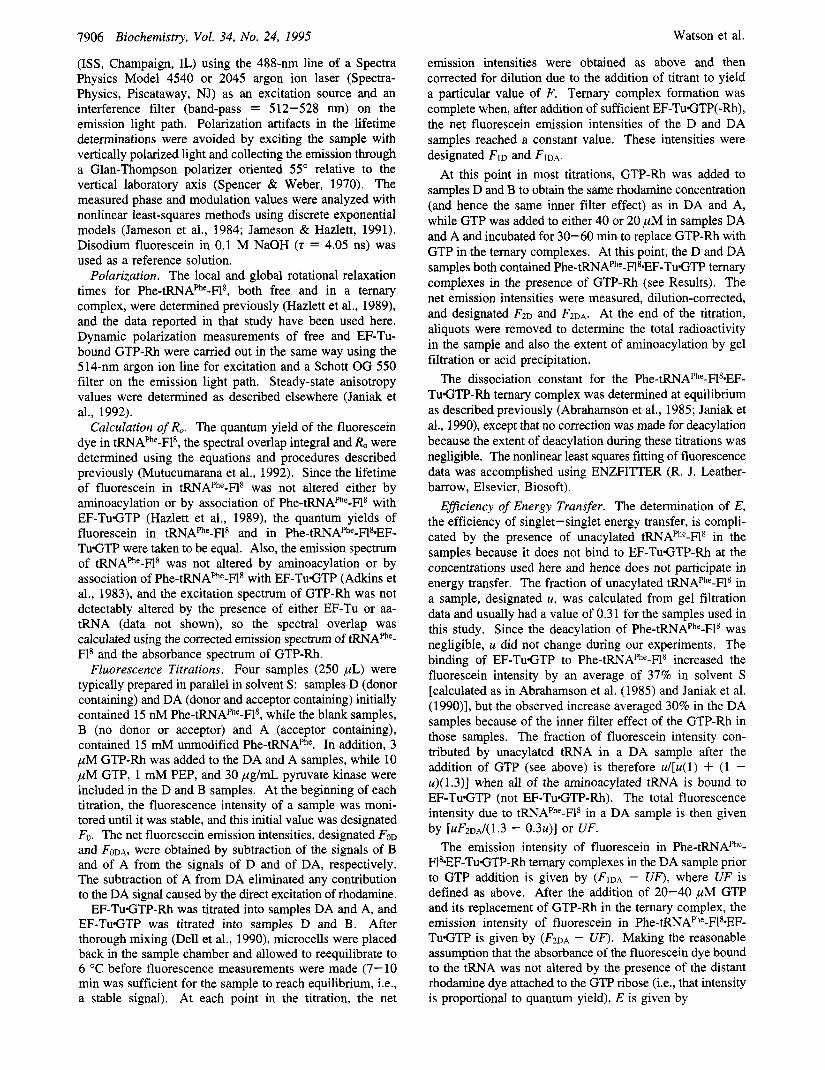
tRNA with a single fluorescein dye covalently attached to the 4-thiouridine base at position 8, was chosen to be the energy-transfer donor species because we had previously shown that Phe-tRNAPhe-Fls forms a ternary complex and functions in protein synthesis (Johnson et al., 1982, 1986; Adkins et al., 1983; Abrahamson et al., 1985). To create the energy-transfer acceptor species, GTP was modified by the covalent attachment of a single rhodamine dye to a ribose hydroxyl (the dye isomerizes between the 2'- and 3'-oxygens) to form GTP-Rh (Figure l), and the formation of an EF- TuGTP-Rh complex was shown by gel filtration (data not shown). The modification of the GTP ribose therefore did not block GTP-Rh binding to the protein, as expected both from our previous work with similar analogues (Eccleston et al., 1987) and from crystallography data which show that the 2'- and 3'-hydroxyls of GTP do not interact with EF-Tu (Berchtold et al., 1993; Kjeldgaard et al., 1993). The association of EF-Tu with GTP-Rh could also be detected
Hb b L o I NH
FIGURE 1: Chemical structure of GTP-Rh. The analogue exists as an equilibrium mixture of the 2'-0 (shown) and 3'-0 derivatives.
0 4 0 8 0
Time (min)
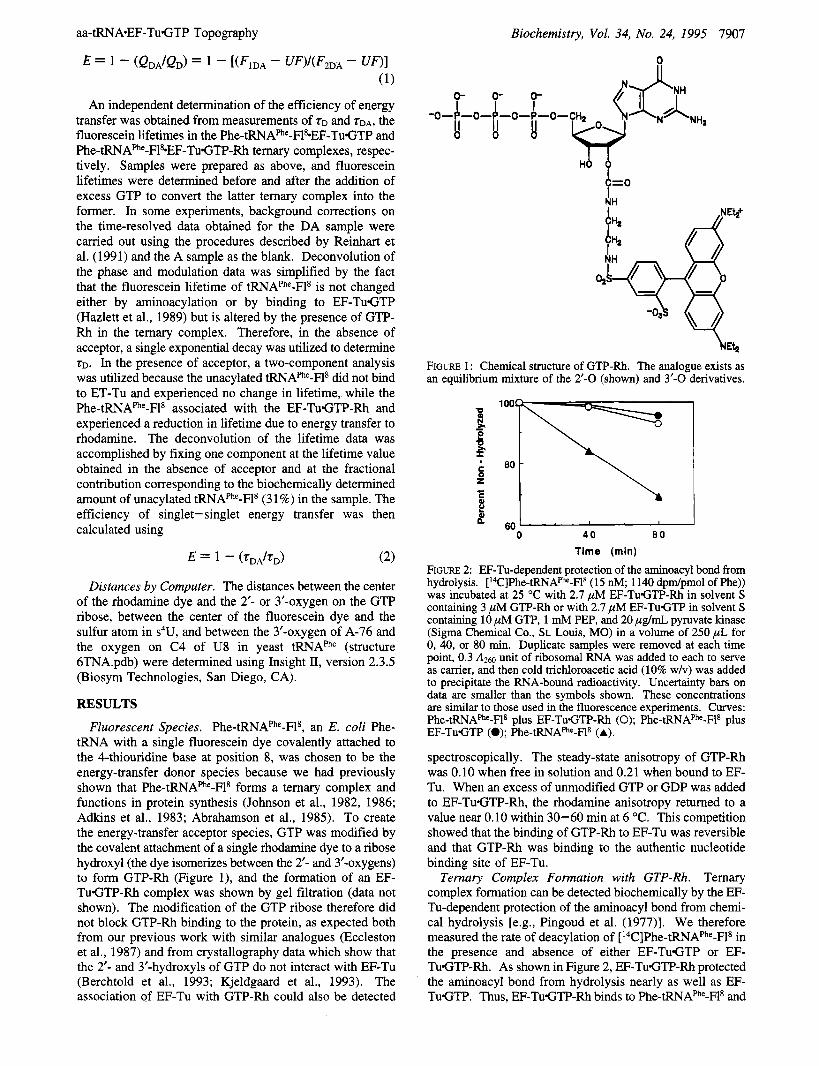
FIGURE 2: EF-Tu-dependent protection of the aminoacyl bond from hydrolysis. ['4C]Phe-tRNAPhe-Fls (15 nM; 1140 dpdpmol of Phe)) was incubated at 25 "C with 2.7 pM EF-TuGTP-Rh in solvent S containing 3 pM GTP-Rh or with 2.7 pM EF-TuGTP in solvent S containing 10 pM GTP, 1 mM PEP, and 20 pg/mL, pyruvate kinase (Sigma Chemical Co., St. Louis, MO) in a volume of 250 pL for 0, 40, or 80 min. Duplicate samples were removed at each time point, 0.3 A260 unit of ribosomal RNA was added to each to serve as carrier, and then cold trichloroacetic acid (10% w/v) was added to precipitate the RNA-bound radioactivity. Uncertainty bars on data are smaller than the symbols shown. These concentrations are similar to those used in the fluorescence experiments. Curves: Phe-tRNAPhe-Fla plus EF-TuGTP-Rh (0); Phe-tRNAPhe-F18 plus EF-TuGTP (0); Phe-tRNAphe-Fls (A).
spectroscopically. The steady-state anisotropy of GTP-Rh was 0.10 when free in solution and 0.21 when bound to EF- Tu. When an excess of unmodified GTP or GDP was added to EF-TuGTP-Rh, the rhodamine anisotropy returned to a value near 0.10 within 30-60 min at 6 "C. This competition showed that the binding of GTP-Rh to EF-Tu was reversible and that GTP-Rh was binding to the authentic nucleotide binding site of EF-Tu.
Ternary Complex Formation with GTP-Rh. Ternary complex formation can be detected biochemically by the EF- Tu-dependent protection of the aminoacyl bond from chemi- cal hydrolysis [e.g., Pingoud et al. (1977)l. We therefore measured the rate of deacylation of [ ''C]Phe-tRNAPhe-F18 in the presence and absence of either EF-TuGTP or EF- TuGTP-Rh. As shown in Figure 2, EF-TuGTP-Rh protected the aminoacyl bond from hydrolysis nearly as well as EF- TuGTP. Thus, EF-TuGTP-Rh binds to Phe-tRNAPhe-F18 and
7908 Biochemistry, Vol. 34, No. 24, 1995 Watson et al.
procedures (Eccleston, 1981), the actual concentration of EF- TuGTP-Rh is significantly less than the total concentration of EF-Tu in the titrant solution. Thus, the actual Kd value for the temary complex containing GTP-Rh is significantly less than 69 nM.
The weaker binding of aa-tRNA to EF-TuGTP-Rh than to EF-TuGTP does not affect the energy-transfer experiments as long as sufficient EF-TuGTP-Rh is added to bind every Phe-tRNAPhe-FP in a sample. Thus, in all of our experi- ments, EF-TuGTP-Rh was added until the fluorescein FIFO reached a constant (maximum) value (cf. Figure 3). At this point, every Phe-tRNAPhe-F18 in the sample was in a temary complex.
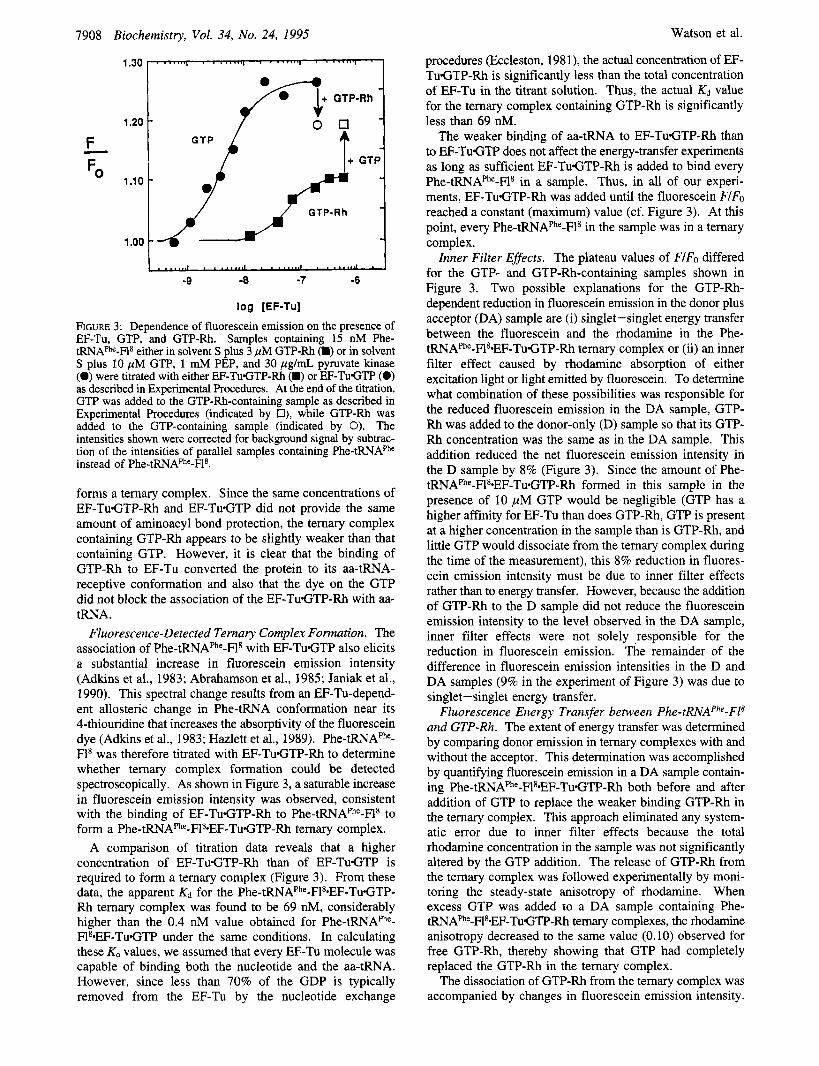
Inner Filter Effects. The plateau values of FIFO differed for the GTP- and GTP-Rh-containing samples shown in Figure 3. Two possible explanations for the GTP-Rh- dependent reduction in fluorescein emission in the donor plus acceptor (DA) sample are (i) singlet-singlet energy transfer between the fluorescein and the rhodamine in the Phe- tRNAPhe-F18*EF-TuGTP-Rh temary complex or (ii) an inner filter effect caused by rhodamine absorption of either excitation light or light emitted by fluorescein. To determine what combination of these possibilities was responsible for the reduced fluorescein emission in the DA sample, GTP- Rh was added to the donor-only (D) sample so that its GTP- Rh concentration was the same as in the DA sample. This addition reduced the net fluorescein emission intensity in the D sample by 8% (Figure 3). Since the amount of Phe- tRNAPhe-F18*EF-TuGTP-Rh formed in this sample in the presence of 10 pM GTP would be negligible (GTP has a higher affinity for EF-Tu than does GTP-Rh, GTP is present at a higher concentration in the sample than is GTP-Rh, and little GTP would dissociate from the ternary complex during the time of the measurement), this 8% reduction in fluores- cein emission intensity must be due to inner filter effects rather than to energy transfer. However, because the addition of GTP-Rh to the D sample did not reduce the fluorescein emission intensity to the level observed in the DA sample, inner filter effects were not solely responsible for the reduction in fluorescein emission. The remainder of the difference in fluorescein emission intensities in the D and DA samples (9% in the experiment of Figure 3) was due to singlet-singlet energy transfer.
Fluorescence Energy Transfer between Phe-tRNAPhe-F18 and GTP-Rh. The extent of energy transfer was determined by comparing donor emission in ternary complexes with and without the acceptor. This determination was accomplished by quantifying fluorescein emission in a DA sample contain- ing Phe-tRNAPhe-F18*EF-TuGTP-Rh both before and after addition of GTP to replace the weaker binding GTP-Rh in the ternary complex. This approach eliminated any system- atic error due to inner filter effects because the total rhodamine concentration in the sample was not significantly altered by the GTP addition. The release of GTP-Rh from the temary complex was followed experimentally by moni- toring the steady-state anisotropy of rhodamine. When excess GTP was added to a DA sample containing Phe- tRNAPhe-FI8*EF-TuGTP-Rh ternary complexes, the rhodamine anisotropy decreased to the same value (0.10) observed for free GTP-Rh, thereby showing that GTP had completely replaced the GTP-Rh in the ternary complex.
The dissociation of GTP-Rh from the ternary complex was accompanied by changes in fluorescein emission intensity.
F - 1.20 -
1.10 -
1.00 -
GTP i
I , * , . , , . I I I , . ..... I . * ... - . . I . 1 -9 -8 -7 -6
log [EF-TU]
FIGURE 3: Dependence of fluorescein emission on the presence of EF-TU, GTP, and GTP-Rh. Samples containing 15 nM Phe- tRNAPhe-H8 either in solvent S plus 3 pM GTP-Rh (W) or in solvent S plus 10 pM GTP, 1 mM PEP, and 30 pg/mL pyruvate kinase (0) were titrated with either EF-TuGTP-Rh (W) or EF-TuGTP (0) as described in Experimental Procedures. At the end of the titration, GTP was added to the GTP-Rh-containing sample as described in Experimental Procedures (indicated by O), while GTP-Rh was added to the GTP-containing sample (indicated by 0). The intensities shown were corrected for background signal by subtrac- tion of the intensities of parallel samples containing Phe-tRNAPhe instead of Phe-tRNAPhe-F18.
forms a ternary complex. Since the same concentrations of EF-TuGTP-Rh and EF-TuGTP did not provide the same amount of aminoacyl bond protection, the ternary complex containing GTP-Rh appears to be slightly weaker than that containing GTP. However, it is clear that the binding of GTP-FUI to EF-Tu converted the protein to its aa-tRNA- receptive conformation and also that the dye on the GTP did not block the association of the EF-TuGTP-Rh with aa- tRNA.
Fluorescence-Detected Temary Complex Formation. The association of Phe-tRNAPhe-F18 with EF-TuGTP also elicits a substantial increase in fluorescein emission intensity (Adkins et al., 1983; Abrahamson et al., 1985; Janiak et al., 1990). This spectral change results from an EF-Tu-depend- ent allosteric change in Phe-tRNA conformation near its 4-thiouridine that increases the absorptivity of the fluorescein dye (Adkins et al., 1983; Hazlett et al., 1989). Phe-tRNAPhe- F18 was therefore titrated with EF-TuGTP-Rh to determine whether temary complex formation could be detected spectroscopically. As shown in Figure 3, a saturable increase in fluorescein emission intensity was observed, consistent with the binding of EF-TuGTP-Rh to Phe-tRNAPhe-F18 to form a Phe-tRNAPhe-F18.EF-TuGTP-Rh ternary complex.
A comparison of titration data reveals that a higher concentration of EF-TuGTP-Rh than of EF-TuGTP is required to form a ternary complex (Figure 3). From these data, the apparent Kd for the Phe-tRNAPhe-F18*EF-TuGTP- Rh temary complex was found to be 69 nM, considerably higher than the 0.4 nM value obtained for Phe-tRNAPhe- FPEF-TuGTP under the same conditions. In calculating these Kd values, we assumed that every EF-Tu molecule was capable of binding both the nucleotide and the aa-tRNA. However, since less than 70% of the GDP is typically removed from the EF-Tu by the nucleotide exchange
aa-tRNA*EF-TuGTP Topography
This is shown for the DA sample in one experiment by an increase in the maximum FIFO value for fluorescein from 1.10 to 1.19 (Figure 3). The binding of unacylated tRNAme- F18 to EF-TuGTP was negligible at the EF-Tu and tRNA concentrations used here (Janiak et al., 1990), so the emission intensity of tRNAPhe-Fls was unaffected by the presence of EF-TuGTP or EF-TuGTP-Rh. Also, EF-Tu was in excess at the end of this titration (Figure 3), so the only fluorescein- containing species present in the DA sample were Phe- tRNAPhe-F18*EF-TuGTP-Rh and tRNAPhe-F18 prior to GTP addition and Phe-tRNAPhe-Fls*EF-TuGTP and tRNAPhe-Fls after GTP addition. Since the fluorescein emission intensity was lower for the Phe-tRNAPhe-F18*EF-TuGTP-Rh temary complex (i.e., the DA sample prior to GTP addition) than for the Phe-tRNAPhe-F18*EF-TuGTP ternary complex (i.e., after GTP addition), the fluorescein dye in the ternary complex must be close enough to the nucleotide binding site to transfer excited-state energy to the rhodamine dye whenever GTP-Rh is bound to EF-Tu in the temary complex. The efficiency of this energy transfer was determined from the emission intensity data of seven independent experiments as detailed in Experimental Procedures and found to average 10.0 f 2.8% for the Phe-tRNAPhe-F18*ET-Tu-TGP-Rh temary complex.
Energy transfer was also detected by comparing the donor fluorescence lifetimes in ternary complexes that either contained or lacked the acceptor. The fluorescein lifetime was 4.3 ns when Phe-tRNAPhe-Fls was bound to EF-TuGTP but was 3.8 ns when Phe-tRNAPhe-FI8 was bound to EF- TuGTP-Rh in the DA sample. The reduced lifetime in the latter complex indicates that excited-state energy was being nonradiatively transferred from the fluorescein to the rhodamine in the GTP-Rh-containing temary complex. This interpretation was confirmed when GTP was added to the DA sample and the fluorescein lifetime returned to its original 4.3-11s value, thereby showing both that the replace- ment of GTP-Rh in the temary complex with GTP was complete and also that energy transfer was observed only with temary complexes that contain GTP-Rh. The observed acceptor-dependent decrease in donor lifetime in Phe- tRNAPhe-F18*EF-TuGTP-Rh yielded a value of 12% for the efficiency of energy transfer in the temary complex.
During these experiments, the deacylation of Phe-tRNAPhe- F18 totalled less than 2% in each sample. Furthermore, there was no significant difference in the total amount of acid- insoluble radioactivity in the D and DA samples at the end of a fluorescence experiment and hence no difference in deacylation in these samples. This invariance indicates that the aminoacyl bond was protected from hydrolysis in each sample and hence that the extent of temary complex formation was equivalent for Phe-tRNAPhe-F18 and Phe- tRNAPhe in our experiments with EF-TuGTP or EF-TuGTP- Rh. This was expected because we intentionally worked at concentrations of EF-Tu that were high enough to ensure that every aa-tRNA in a sample was bound to an EF-TuGTP- Rh.
Spectral Characterization. The quantum yield of the fluorescein in the Phe-tRNAPhe-FI8*EF-TuGTP complex is 0.42, while the spectral overlap integral, JDA, totals 2.20 x l O I 5 M-' cm-' nm4. Using these numbers, R,, the distance at which singlet-singlet energy transfer is 50% efficient, is 49.1 A for this donor-acceptor pair if one assumes that the relative orientation of the transition dipoles of the donor and
Biochemistry, Vol. 34, No. 24, I995 7909
acceptor dyes is dynamically randomized during the ex- cited-state lifetime and hence that the orientation factor, K ~ ,
equals 2/3. The actual relative orientation of the donor and acceptor
transition dipoles in the temary complex is unknown and cannot be determined experimentally in solution. However, the theoretical upper and lower limits of K ~ , and therefore of R,, can be determined from anisotropy data that indicate the freedom of rotation of the dyes (Dale et al., 1979; Van Der Meer et al., 1993). Since both the donor and acceptor dyes are covalently attached to components of the ternary complex, the slow global rotational rate of the temary complex itself (Hazlett et al., 1989) is common to each probe. Thus, we need only consider the local rotational rates of the probes, as was confirmed by dynamic polarization measure- ments that showed the rate of rotational reorientation of each dye, calculated from its local rotational correlation time, to be substantially (40-50-fold) faster than the rate of energy transfer. The maximum range of the orientation factor in the temary complex was calculated to be 0.12 I K~ I 3.1 from the local anisotropies of the fluorescein in Phe-tRNAPhe- F18*EF-TuGTP and of the rhodamine in EF-TuGTP-Rh (Dale et al., 1979). However, as has been discussed extensively elsewhere (Hillel & Wu, 1976; Stryer, 1978; Haas et al., 1978; Wu & Brand, 1992), the actual uncertainty in K~ is considerably less than the maximum for three reasons. First, some orientations are statistically unlikely, such as the direct in-line orientation of the donor and acceptor transition dipoles, and a more reasonable range of c2 values can be calculated by using a probability distribution function (Hillel & Wu, 1976; Stryer, 1978). For example, there is a 90% probability that the upper limit for K~ in our system is less than 1.46 if one assumes that the acceptor is fixed in orientation (Hillel & Wu, 1976; Stryer, 1978). However, since the acceptor actually has significant rotational freedom in our experiments, the upper limit of K~ is significantly lower than 1.46. The R, calculated using a K~ value of 1.46 is 14% larger than the R, calculated using K~ = 2 / 3 , so the upper limit of the orientational uncertainty in our distance measure- ment is (to a 90% confidence level) significantly less than 14%. Similarly, the extent of uncertainty at the lower limit is reduced (Hillel & Wu, 1976; Stryer, 1978). Second, the relatively flexible linkage of the rhodamine to the GTP makes it unlikely that the acceptor dye will adopt a specific orientation relative to the donor dye in each ternary complex, and this will further reduce the limits of the orientational uncertainty (Wu & Brand, 1992). Third, when the donor and acceptor are far apart (i.e., R > R,) as is true here (see below), the error introduced if the dipoles do not have a dynamically averaged orientation (i.e., K~ = 2 / 3 ) is small because orientation effects are not as important when the dyes are well separated (Wu & Brand, 1992). Thus, we conclude that the uncertainty in the K~ orientation factor results in an uncertainty in Ro, and hence in our distance measurement, of f10% or less.
Distance Determination. R, the distance between the donor and acceptor dyes in the temary complex, is related to the efficiency of singlet-singlet energy transfer by
E = ~ , 6 / ( ~ , 6 + R ~ ) (3)
The steady-state intensity measurements yield a value of 0.100 f 0.028 for E, which corresponds to a separation

7910 Biochemistry, Vol. 34, No. 24, 1995
between the fluorescein dye and the rhodamine dye in the Phe-tRNAPhe-F18*EF-TuGTP-Rh temary complex of 7 1 f 4 8, if one assumes that K~ = 2/3. Similarly, the 12% energy- transfer efficiency observed using lifetime measurements yields a distance between the donor and acceptor dyes of 68 8,. The close agreement in the distances measured by two independent methods (fluorescence lifetimes and intensities) strongly indicates that these results are accurate. Since the uncertainty in R due to the orientation factor appears to be less than &IO%, the separation between the fluorescein and rhodamine dyes in the Phe-tRNAPhe-F18*EF-TuGTP-Rh ter- nary complex is therefore 70 f 7 8,.
DISCUSSION
Watson et al.
The fluorescence energy-transfer results reported here show that the fluorescein and rhodamine dyes in the Phe- tRNAPhe-Fl8.EF-TuGTP-Rh ternary complex are separated by 63-77 A, depending upon the actual value of K ~ . This result is striking because the distance is so large.
Since the dyes are linked to the tRNA and GTP via tethers, the actual distance between the s4U and the GTP ribose may be larger or smaller than 70 A, depending upon whether the tethers are pointing toward or away from each other. The distance between the center of the rhodamine dye and the 2'-0 in the GTP (Figure 1) is 10.9 8, when the tether is fully extended. For steric reasons, one would expect the probe to be directed away from the protein as suggested in Figure 4, and it seems likely that the tether is close to maximally extended. The rhodamine dye therefore appears to be located approximately 10 A from the ribose 2'-0 (3'-0) in EF- TuGTP. The center of the fluorescein dye is 8.2 8, from the S atom in s4U. Visual inspection of the tRNA crystal structure near U-8 reveals that the dye and tether could extend in many directions, ranging from directly toward the aminoacyl end of the aa-tRNA to-at the other extreme-about 30" (from a line perpendicular to the plane of the tRNA) toward the non-aminoacyl end of the acceptor arm. The fluorescein could therefore be located anywhere from about 8 8, closer to the aminoacyl end of the acceptor arm than the sulfur atom to a maximum of about 4 A [8.2 8, (sin 30")] farther from the aminoacyl end than the sulfur atom. If we assume that the tethers are maximally extended and directed away from each other as much as possible so as to maximize the separation beteen the dyes, then the measured 70 f 7 8, distance between the dyes in the Phe-tRNAPhe-F18*EF- TuGTP-Rh ternary complex would correspond to a distance of 56 f 7 8, between the 2'-0 (3'-0) of the GTP ribose and the S of the s4U-8 in the aa-tRNA (hereafter termed the 20/ S4 distance). Any other assumption would increase the 56 f 7 8, distance.
While the uncertainty in dye orientation ( K ~ ) prevents the energy-transfer technique from providing high-resolution distance measurements, the technique does provide accurate distance ranges, and in most cases the distances calculated assuming that K~ = 2/3 have been close to the distances determined by crystallography [e.g., James et al. (1992)l. Thus, the 20/S4 distance in the ternary complex is, at a minimum, 49 A in solution. When this measurement is combined with the observation that the aminoacyl end of the acceptor arm is positioned near His66 (Duffj et al., 1981), most of the conceivable ways of orienting the two macro- molecules in the temary complex are eliminated. These two
A. 6.
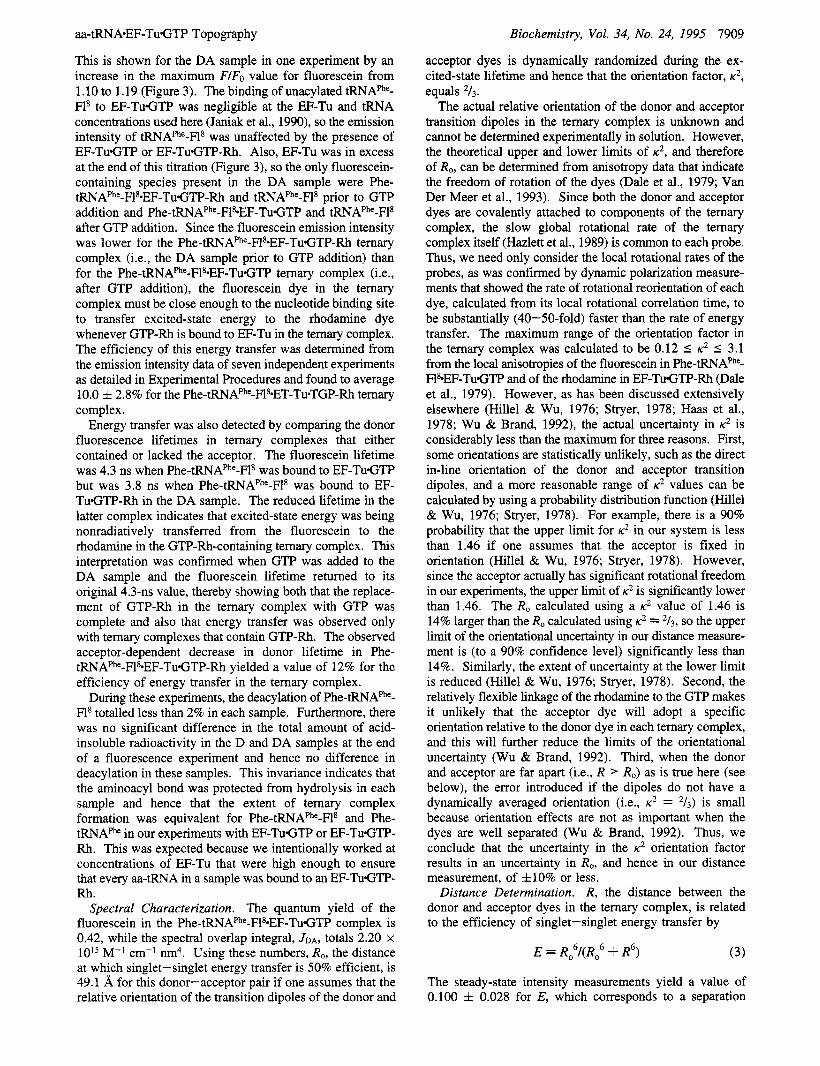
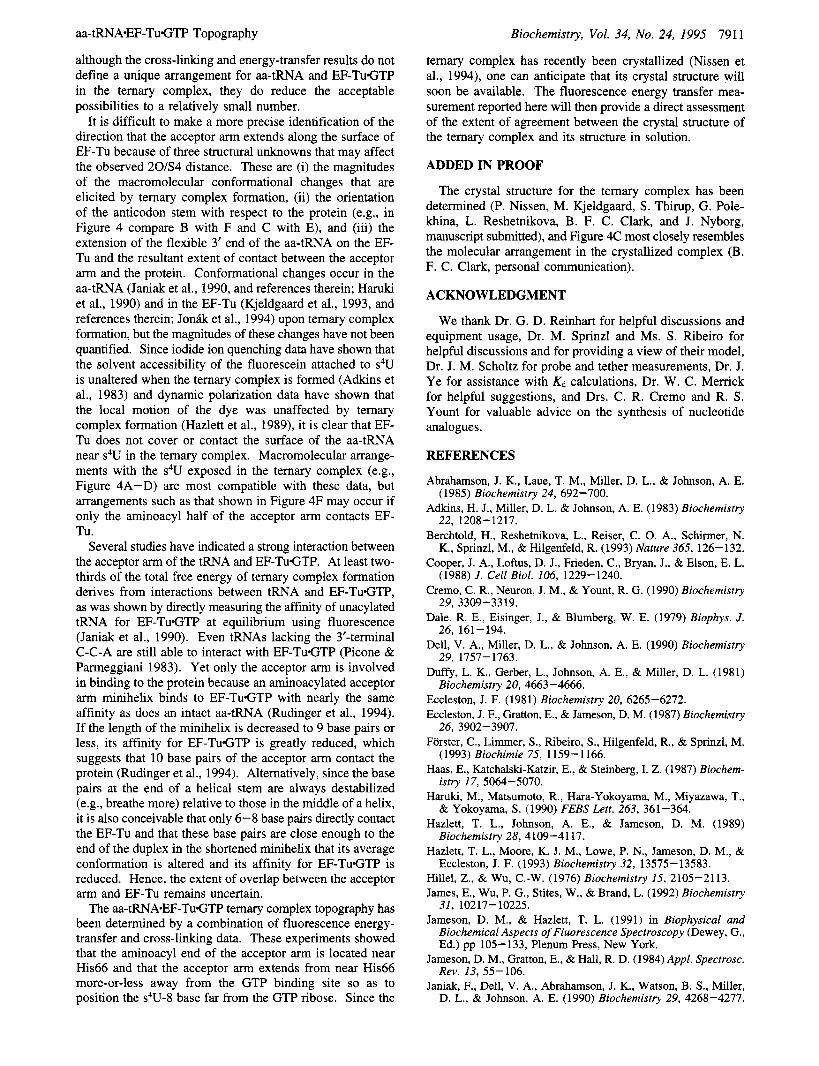
F. u FIGURE 4: Topography of the temary complex. Six possible arrangements of the aa-tRNA and EF-Tu molecules in the ternary complex are shown. The solid dot represents His66, the site that reacts covalently with Nf-(bromoacety1)-Lys-tRNA (Duffy et al., 1981). The approximate location of the GTP is indicated by the solid rectangle in domain I of EF-Tu, while the approximate locations of the rhodamine dye in GTP-Rh and the fluorescein dye in Phe-tRNAPhe-Fls are indicated by Rh and F, respectively. As a crude estimate of scale, the distance between the 3'-oxygen on the ribose of A-76 (the 3'-terrninal nucleotide) and the oxygen attached to the C4 carbon of uridine at position 8 (F in the figure) is 43.4 A in the yeast tRNAPhe crystal structure. The circle shown is centered at the GTP ribose and has a radius of about 49 A.
constraints on orienting the macromolecules in the temary complex are depicted in Figure 4. First, by fixing the aminoacyl end of the aa-tRNA near His66 in domain I of EF-Tu, the acceptor arm can only be located within the 360" of a circle that is centered near His66 (compare Figure 4A- D). Second, the minimum 20/S4 distance of 49 8, is indicated by the circle in Figure 4 that is centered at the GTP ribose. Any macromolecular arrangement that positions the fluorescein dye (F in Figure 4) within the circle is therefore not consistent with the fluorescence energy-transfer results. The combined cross-linking and fluorescence energy- transfer results therefore rule out temary complex topogra- phies similar to those shown in Figure 4B,D,E, while molecular orientations similar to those in Figure 4A,C,F appear to be consistent with the experimental data. Thus,
aa-tRNA-EF-TuGTP Topography Biochemistry, Vol. 34, No. 24, 1995 791 1
temary complex has recently been crystallized (Nissen et al., 1994), one can anticipate that its crystal structure will soon be available. The fluorescence energy transfer mea- surement reported here will then provide a direct assessment of the extent of agreement between the crystal structure of the temary complex and its structure in solution.
although the cross-linking and energy-transfer results do not define a unique arrangement for aa-tRNA and EF-TuGTP in the temary complex, they do reduce the acceptable possibilities to a relatively small number.
It is difficult to make a more precise identification of the direction that the acceptor arm extends along the surface of EF-Tu because of three structural unknowns that may affect the observed 20/S4 distance. These are (i) the magnitudes of the macromolecular conformational changes that are elicited by ternary complex formation, (ii) the orientation of the anticodon stem with respect to the protein (e.g., in Figure 4 compare B with F and C with E), and (iii) the extension of the flexible 3’ end of the aa-tRNA on the EF- Tu and the resultant extent of contact between the acceptor arm and the protein. Conformational changes occur in the aa-tRNA (Janiak et al., 1990, and references therein; Haruki et al., 1990) and in the EF-Tu (Kjeldgaard et al., 1993, and references therein; Jon& et al., 1994) upon ternary complex formation, but the magnitudes of these changes have not been quantified. Since iodide ion quenching data have shown that the solvent accessibility of the fluorescein attached to s4U is unaltered when the ternary complex is formed (Adkins et al., 1983) and dynamic polarization data have shown that the local motion of the dye was unaffected by ternary complex formation (Hazlett et al., 1989), it is clear that EF- Tu does not cover or contact the surface of the aa-tRNA near s4U in the temary complex. Macromolecular arrange- ments with the s4U exposed in the temary complex (e.g., Figure 4A-D) are most compatible with these data, but arrangements such as that shown in Figure 4F may occur if only the aminoacyl half of the acceptor arm contacts EF- Tu.
Several studies have indicated a strong interaction between the acceptor arm of the tRNA and EF-TuGTP. At least two- thirds of the total free energy of ternary complex formation derives from interactions between tRNA and EF-TuGTP, as was shown by directly measuring the affhity of unacylated tRNA for EF-TuGTP at equilibrium using fluorescence (Janiak et al., 1990). Even tRNAs lacking the 3’-terminal C-C-A are still able to interact with EF-TuGTP (Picone & Parmeggiani 1983). Yet only the acceptor arm is involved in binding to the protein because an aminoacylated acceptor arm minihelix binds to EF-TuGTP with nearly the same affinity as does an intact aa-tRNA (Rudinger et al., 1994). If the length of the minihelix is decreased to 9 base pairs or less, its affinity for EF-TuGTP is greatly reduced, which suggests that 10 base pairs of the acceptor arm contact the protein (Rudinger et al., 1994). Alternatively, since the base pairs at the end of a helical stem are always destabilized (e.g., breathe more) relative to those in the middle of a helix, it is also conceivable that only 6-8 base pairs directly contact the EF-Tu and that these base pairs are close enough to the end of the duplex in the shortened minihelix that its average conformation is altered and its affinity for EF-TuGTP is reduced. Hence, the extent of overlap between the acceptor arm and EF-Tu remains uncertain.
The aa-tRNA*EF-TuGTP temary complex topography has been determined by a combination of fluorescence energy- transfer and cross-linking data. These experiments showed that the aminoacyl end of the acceptor arm is located near His66 and that the acceptor arm extends from near His66 more-or-less away from the GTP binding site so as to position the s4U-8 base far from the GTP ribose. Since the
ADDED IN PROOF
The crystal structure for the temary complex has been determined (P. Nissen, M. Kjeldgaard, S . Thirup, G. Pole- khina, L. Reshetnikova, B. F. C. Clark, and J. Nyborg, manuscript submitted), and Figure 4C most closely resembles the molecular arrangement in the crystallized complex (B. F. C. Clark, personal communication).
ACKNOWLEDGMENT
We thank Dr. G. D. Reinhart for helpful discussions and equipment usage, Dr. M. Sprinzl and Ms. S . Ribeiro for helpful discussions and for providing a view of their model, Dr. J. M. Scholtz for probe and tether measurements, Dr. J. Ye for assistance with Kd calculations, Dr. W. C. Merrick for helpful suggestions, and Drs. C. R. Cremo and R. S . Yount for valuable advice on the synthesis of nucleotide analogues.
REFERENCES
Abrahamson, J. K., Laue, T. M., Miller, D. L., & Johnson, A. E. (1985) Biochemistry 24, 692-700.
Adkins, H. J., Miller, D. L. & Johnson, A. E. (1983) Biochemistry 22, 1208-1217.
Berchtold, H., Reshetnikova, L., Reiser, C. 0. A., Schirmer, N. K., Sprinzl, M., & Hilgenfeld, R. (1993) Nature 365, 126-132.
Cooper, J. A., Loftus, D. J., Frieden, C., Bryan, J., & Elson, E. L. (1988) J . Cell Biol. 106, 1229-1240.
Cremo, C. R., Neuron, J. M., & Yount, R. G. (1990) Biochemistry 29, 3309-3319.
Dale, R. E., Eisinger, J., & Blumberg, W. E. (1979) Biophys. J . 26, 161-194.
Dell, V. A., Miller, D. L., & Johnson, A. E. (1990) Biochemistry 29, 1757-1763.
Duffy, L. K., Gerber, L., Johnson, A. E., & Miller, D. L. (1981) Biochemistry 20, 4663-4666.
Eccleston, J. F. (1981) Biochemistry 20, 6265-6272. Eccleston, J. F., Gratton, E., & Jameson, D. M. (1987) Biochemistry
26, 3902-3907. Forster, C., Limmer, S . , Ribeiro, S . , Hilgenfeld, R., & Sprinzl, M.
(1993) Biochimie 75, 1159-1 166. Haas, E., Katchalski-Katzir, E., & Steinberg, I . Z . (1987) Biochem-
istry 17, 5064-5070. Haruki, M., Matsumoto, R., Hara-Yokoyama, M., Miyazawa, T.,
& Yokoyama, S . (1990) FEBS Lett. 263, 361-364. Hazlett, T. L., Johnson, A. E., & Jameson, D. M. (1989)
Biochemistry 28,4109-41 17. Hazlett, T. L., Moore, K. J. M., Lowe, P. N., Jameson, D. M., &
Eccleston, J. F. (1993) Biochemistry 32, 13575-13583. Hillel, Z., & Wu, C.-W. (1976) Biochemistry 15, 2105-2113. James, E., Wu, P. G., Stites, W., & Brand, L. (1992) Biochemistry
31, 10217-10225. Jameson, D. M., & Hazlett, T. L. (1991) in Biophysical and
Biochemical Aspects of Fluorescence Spectroscopy (Dewey, G., Ed.) pp 105-133, Plenum Press, New York.
Jameson, D. M., Gratton, E., & Hall, R. D. (1984) AppZ. Spectrosc. Rev. 13, 55-106.
Janiak, F., Dell, V. A., Abrahamson, J. K., Watson, B. S . , Miller, D. L., & Johnson, A. E. (1990) Biochemistry 29, 4268-4277.

1912 Biochemistry, Vol. 34, No. 24, 1995
Janiak, F., Walter, P., & Johnson, A. E. (1992) Biochemistry 31, 5830-5840.
Johnson, A. E., Miller, D. L., & Cantor, C. R. (1978) Proc. Natl. Acad. Sci. U S A . 75, 3075-3079.
Johnson, A. E., Adkins, H. J., Matthews, E. A., & Cantor, C. R. (1982) J. Mol. Biol. 156, 113-140.
Johnson, A. E., Janiak, F., Dell, V. A,, & Abrahamson, J. K. (1986) in Structure, Function, and Genetics of Ribosomes (Hardesty, B., & Kramer, G., Eds.) pp 541-555, Springer-Verlag. New York.
Jon&, J., Anborgh, P. H., & Parmeggiani, A. (1994) FEBS Lett. 343, 94-98.
Kinzy, T. G., Freeman, J. P., Johnson, A. E., & Merrick, W. P. (1992) J . Biol. Chem. 267, 1623-1632.
Kjeldgaard, M., Nissen, P., Thirup, S . , & Nyborg, J. (1993) Structure 1, 35-50.
Leberman, R., Antonsson, B., Giovanelli, R., Guariguata, R., Schumann, R., & Wittinghofer, A. (1980) Anal. Biochem. 104, 29-36.
Miller, D. L., & Weissbach, H. (1974) Methods Enzymol. 30,219- 232.
Miller, D. L., & Weissbach, H. (1977) in Molecular Mechanisms of Protein Biosynthesis (Weissbach, H., & Pestka, S., Eds.) pp 323-373, Academic Press, New York.
Mutucumarana, V. P., Duffy, E. J., Lollar, P., & Johnson, A. E. (1992) J. Biol. Chem. 267, 17012-17021.
Watson et al.
Nissen, P., Reshetnikova, L., Siboska, G., Polekhina, G., Thirup, S. , Kjeldgaard, M., Clark, B. F. C., & Nyborg, J. (1994) FEBS Lett. 356, 165-168.
Ott, G., Faulhammer, H. G., & Sprinzl, M. (1989) Eur. J . Biochem. 184, 345-352.
Parmeggiani, A., & Swart, G. W. M. (1985) Annu. Rev. Microbiol. 39,557-577.
Picone, D., & Parmeggiani, A. (1983) Biochemistry 22, 4400- 4405.
Pingoud, A., Urbanke, C., Krauss, G., Peters, F., & Maass, G. (1977) Eur. J . Biochem. 78, 403-409.
Reinhart, G. D., Marzola, P., Jameson, D. M., & Gratton, E. (1991) J. Fluoresc. I , 153-162.
Rudinger, J., Blechschmidt, B., Ribeiro, S., & Sprinzl, M. (1994) Biochemistry 33, 5682-5688.
Spencer, R. D., & Weber, G. (1970) J . Chem. Phys. 52, 1654- 1663.
Sprinzl, M. (1994) Trends Biochem. Sci. 19, 245-250. Stryer, L. (1978) Annu. Rev. Biochem. 47, 819-846. Van Der Meer, B. ‘W., Coker, G., & Chen, S.-Y. S . (1994)
Resonance Energy Transfer: Theory and Data, Chapter, 4, VCH Publishers, New York.
BI950427W
Wu, P., & Brand, L. (1992) Biochemistry 31, 7939-7947.