![11.[20-37]Analysis of Bus-Stops Locations Using Geographic Information System in Ibadan North L.G.a Nigeria](https://static.fdocuments.us/doc/165x107/577d1e601a28ab4e1e8e65dd/1120-37analysis-of-bus-stops-locations-using-geographic-information-system.jpg)
American Review of Politics Volume 37 No. 2 Geographic ...
26
American Review of Politics Volume 37 No. 2 71 DOI: 10.15763/issn.2374-779X.2020.37.2.71-96 Geographic Differences of Individual Views toward the Role of Government Daniel J. Fudge Tulsa Community College [email protected] Introduction A central tenet of democracy is the interaction between a government and its citizens. The government provides a number of goods and services that benefit Americans every day. From traveling on public roads to receiving mail, government has long been a provider to millions of people across the United States. Consequently, the role of government is not without debate. As a result, political pundits, politicians, and scholars have often evaluated various policies and government actions in regard to the role government should play. To some, government appears too big and too involved in the everyday lives of Americans. To others, government may not be big enough and fails to encompass or provide the necessary services for a sustainable American life. It is not surprising that politicians often use the role of government as a campaign talking point in order to sway public sentiment towards their preferred points of view. President Ronald Reagan once expressed his disdain for big government when he proclaimed that the most dangerous words in the English language were, “I’m from the government and I’m here to help” (Reagan 1986). On the other side of the aisle, President Bill Clinton once exclaimed that the “era of big government is over” (Clinton 1996). Both presidents were generally popular and this was perhaps due in part to their public appeals that less government means better government. Consequently, political elites and policy decision-makers are entrenched in this battle for the direction of America with regard to how government should function, and while their opinion certainly matters, perhaps the better question is, what factors affect citizen perceptions of governmental policies? This research seeks to understand how individuals perceive specific policies that are rooted in the scope and overarching role of government in American society. While previous research has focused on the variation of views on public policy across demographics such as income and race as well as political perceptions and characteristics such as ideology and partisanship (Ellis and Stimson 2012; Green, Palmquist, and Schickler 2002), the focus here is how much variation exists between individuals of different geographies. More recent work finds that rural Americans hold a distrust towards government generally and therefore do not support government involvement (Walsh 2012; Cramer 2016). This study extends Cramer’s logic that place serves as an influencing factor on political perceptions. This study consequently demonstrates that place acts as a moderator of perspectives. Liberals in rural areas compared to those in urban areas are less supportive of increased government spending and are less supportive of a spending increase in welfare programs. Overall, the findings demonstrate that living in rural America, especially for liberals, can have a significant
Transcript of American Review of Politics Volume 37 No. 2 Geographic ...
American Review of Politics Volume 37 No. 2
71 DOI: 10.15763/issn.2374-779X.2020.37.2.71-96
Geographic Differences of Individual Views toward the Role of Government
Daniel J. Fudge Tulsa Community College
[email protected] Introduction A central tenet of democracy is the interaction between a government and its citizens. The government provides a number of goods and services that benefit Americans every day. From traveling on public roads to receiving mail, government has long been a provider to millions of people across the United States. Consequently, the role of government is not without debate. As a result, political pundits, politicians, and scholars have often evaluated various policies and government actions in regard to the role government should play. To some, government appears too big and too involved in the everyday lives of Americans. To others, government may not be big enough and fails to encompass or provide the necessary services for a sustainable American life.
It is not surprising that politicians often use the role of government as a campaign talking point in order to sway public sentiment towards their preferred points of view. President Ronald Reagan once expressed his disdain for big government when he proclaimed that the most dangerous words in the English language were, “I’m from the government and I’m here to help” (Reagan 1986). On the other side of the aisle, President Bill Clinton once exclaimed that the “era of big government is over” (Clinton 1996). Both presidents were generally popular and this was perhaps due in part to their public appeals that less government means better government.
Consequently, political elites and policy decision-makers are entrenched in this battle for the direction of America with regard to how government should function, and while their opinion certainly matters, perhaps the better question is, what factors affect citizen perceptions of governmental policies? This research seeks to understand how individuals perceive specific policies that are rooted in the scope and overarching role of government in American society. While previous research has focused on the variation of views on public policy across demographics such as income and race as well as political perceptions and characteristics such as ideology and partisanship (Ellis and Stimson 2012; Green, Palmquist, and Schickler 2002), the focus here is how much variation exists between individuals of different geographies.
More recent work finds that rural Americans hold a distrust towards government generally and therefore do not support government involvement (Walsh 2012; Cramer 2016). This study extends Cramer’s logic that place serves as an influencing factor on political perceptions. This study consequently demonstrates that place acts as a moderator of perspectives. Liberals in rural areas compared to those in urban areas are less supportive of increased government spending and are less supportive of a spending increase in welfare programs. Overall, the findings demonstrate that living in rural America, especially for liberals, can have a significant

American Review of Politics Volume 37 No. 2
72 DOI: 10.15763/issn.2374-779X.2020.37.2.71-96
influence on perspectives on the role of government and public policy, which is further evidence that an urban-rural divide adds nuance to the ideological divisions in contemporary American politics.
Perceptions of Government Policies and Spending
Much of the literature regarding the role of government has focused on how individuals perceive government spending and the ways in which attitudes toward the role of government are affected by sociological and ideological factors. Additionally, for the purpose of explaining the division between individuals of varying geographies, existing research has promulgated the ideas that individuals’ ideas about politics and culture are shaped by their environment and their identity with a particular place or population.
This previous research has attempted to illustrate how Americans develop attitudes regarding government spending or an increased role of government. Such research also examines the relationship between government spending and public opinion in order to gain a better understanding of how Americans feel about the role of government. Jacoby (1994) demonstrates that attitudes on government spending are shaped more by symbolic considerations rather than the substantive content of the policies. Symbolic content activates responses in citizens given their ideological or partisan predispositions. A particular policy may take on a new meaning when presented to individuals from different groups and furthermore, the concept of “spending” may actually be interpreted as “welfare,” which presents a symbolic idea on its own. When the concept of “welfare” is activated in the mind of individuals, they perhaps interpret that to be associated with more government involvement.
Other research has discussed issue framing and how “packaging” government programs by political elites to the masses affects perceptions of the role of government. Perceptions of government policy have been shown to be group-centric in the sense that people judge particular policy initiatives based on who benefits from the proposed policy. Therefore, group-centrism follows as a particular heuristic that guides individuals on their evaluations of government activity in a more simplistic manner (Nelson and Kinder 1996; Popkin 1994). Still, while individuals may be able to perceive politics through their group-centric lenses, they are still subject to considerable influence by political parties and elites. The idea of group-centrism is predicated on individuals being able to connect members of a particular group with policies. Additionally, it can be inferred that individuals will view particular groups as “winners” and “losers” of government policies and can either increase or decrease support. Furthermore, when negative frames are used, such as the claim that welfare recipients are “freeloaders,” a negative stigma enters the minds of certain groups and thus, activates stereotypes that influence their predispositions towards welfare. The way in which government spending is framed to the public is clearly a product of partisan strategies to gain public support and appeals. Issue framing influences people in specific ways dependent on their personal characteristics such as race, age, gender, or income (Jacoby 2000). Most striking among studies of issue framing on government
American Review of Politics Volume 37 No. 2
73 DOI: 10.15763/issn.2374-779X.2020.37.2.71-96
spending attitudes are the findings that individuals who were provided with more specific issue frames, where more transparent details about an issue were provided, were more supportive of government spending programs.
Other research has examined similar phenomena specifically with regard to the concept of race, political sophistication, and values. Goren (2003) illustrates that the opinion of white Americans toward government spending is not as much a single issue of racial difference between whites and blacks but is influenced by how well individuals understand the differences between undeserving and deserving poor. Spending programs that target the undeserving poor are significantly likely to be evaluated by sophisticated white individuals through the lenses of racial stereotypes. Racial stereotyping affects beliefs on welfare and government spending but has minimal if any influence on other non-welfare social programs (Goren 2008). It is clear that racial perceptions are significant in determining attitudes toward government welfare spending. Additionally, Americans have ordered hierarchical values that influence their beliefs toward government spending policies as individuals with distinct differences between the values of “liberty” and “equality” have significantly divergent perspectives on government spending, wherein those who favored equality were more likely to support welfare spending and those who valued liberty were less likely (Jacoby 2006).
Unsurprisingly, perceptions of government spending are moderated by political ideology. Previous research has analyzed the role ideology plays in evaluating government spending and politics in general (Conover & Feldman 1981; Huckfeldt et al. 1999; Jacoby 2000; Rudolph & Evans 2005; Pickering & Rockey 2011). Primarily, ideology has been examined in interactions with other factors as political ideology is understood to play such an integral role in political evaluations and perceptions (Ellis & Stimson 2011). In a similar fashion, I build from the growing research agenda that examines the role of place and its influence on attitudes toward government (Walsh 2012; Cramer 2016; Hopkins 2017). In marrying the concepts of political ideology and place, this present study seeks to understand how place moderates the ideological perceptions towards the role of government.
“Place” and its Role in the Study of Political Behavior
Aside from the common determinants of political attitudes and perceptions, a fair amount of research is devoted to the politics of place, where one’s geographic location significantly affects one’s ideas about politics and government. More specifically, recent research has discussed the idea that an urban-rural divide exists in the United States in terms of how people living in those regions perceive the political world around them. Earlier works posited that “a sense of place” is formed through the personal and emotional attachments that individuals have to a particular region or locale (Agnew 1987). This attachment serves as a similar psychological mechanism as partisanship for the purposes of understanding and perceiving politics (Campbell et al 1960; Green, Palmquist, and Schickler 2002).

American Review of Politics Volume 37 No. 2
74 DOI: 10.15763/issn.2374-779X.2020.37.2.71-96
While doubts have been raised as to whether an urban-rural divide is actually prevalent in modern society (Misra 2018), previous and contemporary literature have presented significant findings demonstrating that not only does place matter, but it serves as a valuable mechanism for political socialization. For example, people from rural locations have a propensity to consider themselves distinct and living a different way of life from individuals in urban areas (Bell 1992; Gimpel and Schuknecht 2003). As individuals have some sort of “tie” to a particular place, they are also likely to have their identity reinforced through interaction with like-minded individuals in their local residential networks (Blokland and Savage 2001). As a result, individuals may choose to select where they live based on the political leanings, policies, or like-minded partisans in a particular locality (Bishop 2009; McDonald 2011; Cho, Gimpel, and Hui 2012). Perhaps self-sorting has contributed to the partisan and geographic divisions that have become prevalent in contemporary American politics (McKee 2008). Rural areas across the country are now politically more conservative, especially in the American South compared to other regions of the country. Urban areas are primarily more liberal, even in the American South (McKee 2008; Hopkins 2017; Scala and Johnson 2017). In consequence, individuals from these distinct regions and geographic localities have unique perspectives on politics and government, people, and public policy.
Socioeconomically, the urban-rural divide is rooted in the idea that rural individuals attribute their economic deprivation to urban elites, who fail to understand “how the other half lives” in rural areas (Walsh 2012). As a consequence, these rural individuals are more likely to favor limited government and believe the appropriate role of government is best when “urban elites” are not making decisions on behalf of rural interests. This “rural resentment” fosters a sense of distrust and thus, leads to rural Americans holding negative predispositions towards government. Furthermore, the urban-rural divide is perhaps fostered through the ideas that individuals from urban and rural areas are significantly different from one another in terms of their values and lifestyles, political decision-makers overlook rural areas, and distributive resources in terms of government spending are disproportionately given to urban areas over rural areas (Cramer 2016).
The social identities that are formed through geography have had significant implications for the study of political behavior. Political geography and the identities formed from living in particular regions have allowed scholars to better understand voting behavior across the United States in terms of how citizens view government, political parties, and policy issues. Campaigns view regions as political battlegrounds, and when the campaign is able to understand the “lay of the land,” candidates and strategists may be able to tailor their campaigns to the specific ideologies of the individuals who reside there. As scholars continue to understand political geography and more specifically the urban-rural divide, it is essential to understand how the areas and the people living in those regions perceive the role of government. In turn, this research attempts to demonstrate a clearer picture of the intersection between geographic perceptions and the provision of public policy.

American Review of Politics Volume 37 No. 2
75 DOI: 10.15763/issn.2374-779X.2020.37.2.71-96
Theory and Hypotheses Hypotheses of Place and the Role of Government
Building from the previous research, I seek to test three specific hypotheses on how the role of place affects perspectives on the role of government through individual attitudes on spending towards public services such as health and education, welfare, and Social Security. It is expected that rural Americans will be less favorable of more government spending and welfare due in part to the resentment many rural Americans have demonstrated towards government in general (Cramer 2016). Here, I am not seeking to test Cramer’s theory of rural resentment, but rather whether rural Americans have a negative predisposition towards government spending. Therefore, I propose the following hypothesis:
• Hypothesis 1: Rural Americans are expected to be less favorable of increases in government
spending compared to urban Americans. While it is not only expected that “place” will be a significant factor in determining
differences in government involvement and public policy, political ideology is also expected to be important in explaining political behavior or perceptions. As mentioned previously (Jacoby 2000), individuals who are conservative are more likely to favor a smaller government with less government involvement. Conversely, liberals are primarily associated with supporting more social welfare policies and therefore are more likely to favor more government involvement. Here, the second hypothesis seeks to test for the influence of ideology on perceptions of the role of government and specific government policies. The second hypothesis is as follows:
• Hypothesis 2: Americans who are more conservative will be less favorable of government
spending compared to those who are more liberal. The third hypothesis is most integral to assessing the role an individual citizen’s place
plays in the minds of American citizens when it comes to perceiving politics. If place matters, then it is expected that people’s perceptions of government changes or moderates given their geographic environment. As mentioned previously, liberals are more predisposed to supporting more government spending and involvement, whereas conservatives favor less spending. Like conservatives, rural Americans are less supportive of government involvement and spending compared to urban Americans. Here, the following hypothesis seeks to assess the interaction between ideology and place and whether place has a significant effect on moderating the perceptions of government across political ideology. For example, it is expected that individuals with an ideology that perhaps stands in stark contrast with the rest of their geographic population, those individuals will have moderated perspectives to “match” with their neighbors and friends. Therefore, the third hypothesis is as follows:
American Review of Politics Volume 37 No. 2
76 DOI: 10.15763/issn.2374-779X.2020.37.2.71-96
• Hypothesis 3: Geography conditions perceptions towards government spending and across political ideologies.
Data and Methodology The first task in examining the influence of place on perceptions of government and
policy is to find data that measure these concepts and also specifically identifies place as a key independent variable for analysis. Previous national surveys have done an adequate job at tapping into the minds of individuals regarding their beliefs about government and how much/little the government should do for American citizens. For the purposes of this research, the ANES (American National Election Survey) includes measures of geographic location at the county-level and also asks questions that tap into the attitudes of Americans on government policies and the role of government.
The American National Election Survey permits scholars to access the geocodes (numeric county identifiers) and zip codes for all respondents to the survey for the years of 1994 through 2008. Using this geographic data allows for an examination over roughly the last twenty years of perceptions towards the role of government and government policy based on where someone lives. Furthermore, all the primary dependent variables of interest were included as questions in each of the years in the ANES dataset. The utilization of time in the study is twofold. First, examining individual perceptions towards particular governmental policies across geography is difficult given the low sample size of rural respondents. Therefore, by aggregating respondents for multiple years, the data is able to examine a greater number of rural respondents and their perceptions of public policies. Second, the analysis utilizes the ANES cross-sectional time-series data to account for population shifts in the respondent’s geographic location. For example, a county considered rural in 1994, may become more urban or suburban with a greater population shift over the subsequent years. The shifts are accounted for with the use of the geographic data discussed in the succeeding paragraphs, which are updated every few years. Regarding how time is utilized in the analyses, time acts as a control variable, as the analysis is examining aggregate perceptions on the role of government for each year. By using year as a control variable, the analysis accounts for unmodeled variation in the perceptions towards government spending and policy by each year.
The dataset of the geocodes and zip codes correspond to each respondent’s case ID in the original ANES dataset, therefore giving each respondent a particular geographic location; however, simply having geocodes and zip codes is still not adequate to pinpoint whether a respondent lives in a rural, urban, or suburban county in the United States. The National Center for Health Services through the Center for Disease Control has developed Urban-Rural Continuum Codes in order to “study health differences across the urban-rural continuum” (Ingram & Franco 2014). Compared to other measures of geography utilized in political science research, the NCHS codes have a more fine-grained measurement in the identification of geography. Other types of geographic measurement, such as the U.S. Census Bureau or

American Review of Politics Volume 37 No. 2
77 DOI: 10.15763/issn.2374-779X.2020.37.2.71-96
geographic coding by the U.S. Department of Agriculture, do not designate areas as “urban” or “rural” based on proximity to a metropolitan population. Furthermore, the NCHS breaks down geography into six specific classifications – (1) large central metro, (2) large fringe metro, (3) medium-sized metro, (4) small metro, (5) micropolitan, and (6) non-core rural. Whereas the U.S. Census Bureau and USDA account for population rather than distance or “influence” of nearby geographic areas. In large part, the decision to use the NCHS coding scheme was to ensure that “urban” and “rural” areas were distinct from one another and there were little to no “spillover” effects from metropolitan areas into rural areas. The approximation of the NCHS urban-rural continuum is appropriate for the analysis as it identifies counties according to their population and separates metro areas from “fringe” metro areas. Areas with significantly smaller populations are considered “non-core” localities or rural areas, located away from other population centers. For the purposes of appropriately assigning these NCHS urban-rural codes, of which there are six, to respondents from the ANES data, the designations are broken into four categories in the dataset, wherein large central metro areas are designated as urban, large fringe metros are designated as suburban, medium metros, small metros, and micropolitan areas are considered “mid-size localities,” and “non-core” localities are designated as rural. Most importantly for this paper is the ability to separate out individuals who live in rural areas (non-core in the NCHS data) as the separation from urban locales, regardless of size, may be an important component in explaining attitudes towards the role of government. The NCHS’s urban-rural classification scheme has accounted for population changes across each type of geographic area since its inception in 1990. Additionally, the coding scheme has maintained consistency between the last two versions of the data in 2006 and 2013 by accounting for population shifts and changes as well as the Office of Management and Budget’s (OMB) delineation of geographic areas. The version in 1990 was based on the 1990 census and the OMB’s delineation of areas but did not account for population shifts provided by post-census population estimates of the geographic localities. Table 1 shows the geographic breakdown of the respondents in the ANES and NCHS data across urban, suburban, mid-sized, and rural localities who answered any combination of the primary questions of interest.
Table 1. Summary Statistics of Geography Location n Percent Urban 1,808 29.34% Suburban 1,364 22.14% Mid-Sized Areas 2,564 41.62% Rural 425 6.90% Total 6,161 100%
The primary dependent variables are formulated from several questions in the ANES
that effectively demonstrate individual preferences towards government intervention and

American Review of Politics Volume 37 No. 2
78 DOI: 10.15763/issn.2374-779X.2020.37.2.71-96
specific policies. To test the aforementioned hypotheses, the questions are primarily ordinal wherein respondents rate their responses in accordance with whether government should have a more active role in providing and spending for particular public services or should have a smaller role. For the subsequent analyses, this research analyzes three questions that examine individual attitudes towards government spending, welfare services, and Social Security. Assessing these attitudes towards welfare and Social Security can indicate whether Americans waver in their support for specific policies compared to their overall feelings about broad government spending and involvement. Percentages of the number of respondents across the primary dependent variables are found in Table 2.
Table 2. Percentage of Respondents by Category and Summary Statistics of Dependent Variables
Variables n Percent Std. Dev. Min Max Govt. Spending 4,847 100% 0.849 0 2
Less 1,712 35.3% Same 1,357 28.0% More 1,778 36.7%
Welfare 5,203 100% 0.745 0 2 Less 2,342 45.0%
Same 1,930 37.1% More 931 17.9%
Soc. Security 5,199 100% 0.595 0 2 Less 272 5.2%
Same 2,116 40.7% More 2,811 54.1%
The sample size for each dependent variable accounts for the number of respondents who answered each particular question.
In addition to the primary independent variables measuring “place,” the analysis also includes a control variable for the length of time a respondent has lived in a given area. The inclusion of the variable accounts for the possibility that respondents who have lived in a particular geographic area for a prolonged length of time will have similar perceptions to their geographic peers on government spending across the three policy areas as they have perhaps more rigid and defined perceptions given their long-time residency in the same geographic area. Length of residency for respondents ranges from 0 to 90 years. Also, included in the analysis are standard control variables that attempt to capture additional factors that can potentially influence perceptions on government spending and policy attitudes. The analysis includes variables for political ideology, gender, race, age, income, and level of education. Political ideology is coded from 0 to 2, where liberal is coded as 0, moderate is coded as 1, and conservative is coded as 2.

American Review of Politics Volume 37 No. 2
79 DOI: 10.15763/issn.2374-779X.2020.37.2.71-96
Gender is coded as a dichotomous variable, where male is coded as 0 and female is coded as 1. Race is coded from 0 to 3, where white/Caucasian is coded as 0, black/African American is coded as 1, Hispanic is coded as 2, and other ethnicities are coded as 3. Ages of the respondents range from 18 to 93. Income is coded from 0 to 4, where the respondents who fall in the 0-16th percentile are coded as 0, respondents who fall in the 17th-33rd percentile are coded as 1, respondents who fall in the 34th-67th percentile are coded as 2, respondents who fall in the 68th-95th percentile are coded as 3, and respondents who fall in the 96th-100th percentile are coded as 4. Education is coded from 0 to 4, where respondents who did not completed high school are coded as 0, respondents who received a high school diploma are coded as 1, respondents who have some college education are coded as 2, respondents who have a college degree are coded as 3, and respondents who have an advanced degree are coded as 4. The analysis also controls for geographic region (South vs. Non-South) in order to ensure that people’s place-based perceptions are rooted in their geographic locality while considering the effect of geographic region. South is coded as 1 and Non-South is coded as 0.1 Time is utilized as a control using year fixed effects, with the omitted category being the first year of data (1994). Utilizing year fixed effects accounts for shifts in opinion on government spending from year to year. For example, respondents who answered questions regarding welfare spending may have a more favorable opinion in the aggregate towards such spending in 2004 compared to 2000. Descriptive and summary statistics are found in the Appendix.2
Analysis This study conducts three separate analyses of perceptions of government spending across geography and political ideology. Each separate analysis has two models. The first model is an ordered logistic regression. The second model in each analysis is another ordered logistic regression with an interaction between political ideology and geography. The first analysis examines people’s perceptions towards spending on public services (Table 3). The second analysis examines people’s perceptions towards spending on welfare programs (Table 4). The third analysis examines people’s perceptions towards spending on Social Security (Table 5). For substantive interpretation of the results of the analyses, the marginal effects and predicted probabilities are displayed in Figures 1-3. Geographic Perspectives on Government Spending and Services
First, in order to assess the general dispositions of individuals regarding the role of government, the first analysis utilizes an ordered logistic regression on how much the government
1 South is defined as the states that were members of the Confederate States of America: Alabama, Arkansas, Florida, Georgia, Louisiana, Mississippi, North Carolina, South Carolina, Tennessee, Texas, and Virginia. 2 In total, the dataset used here had a total of 6,161 respondents for the years 1994-2008. For the purposes of the analysis, 6,161 respondents were featured in any of the three models, wherein most of those respondents answered all of the questions pertaining to the dependent variables and the independent variables.
American Review of Politics Volume 37 No. 2
80 DOI: 10.15763/issn.2374-779X.2020.37.2.71-96
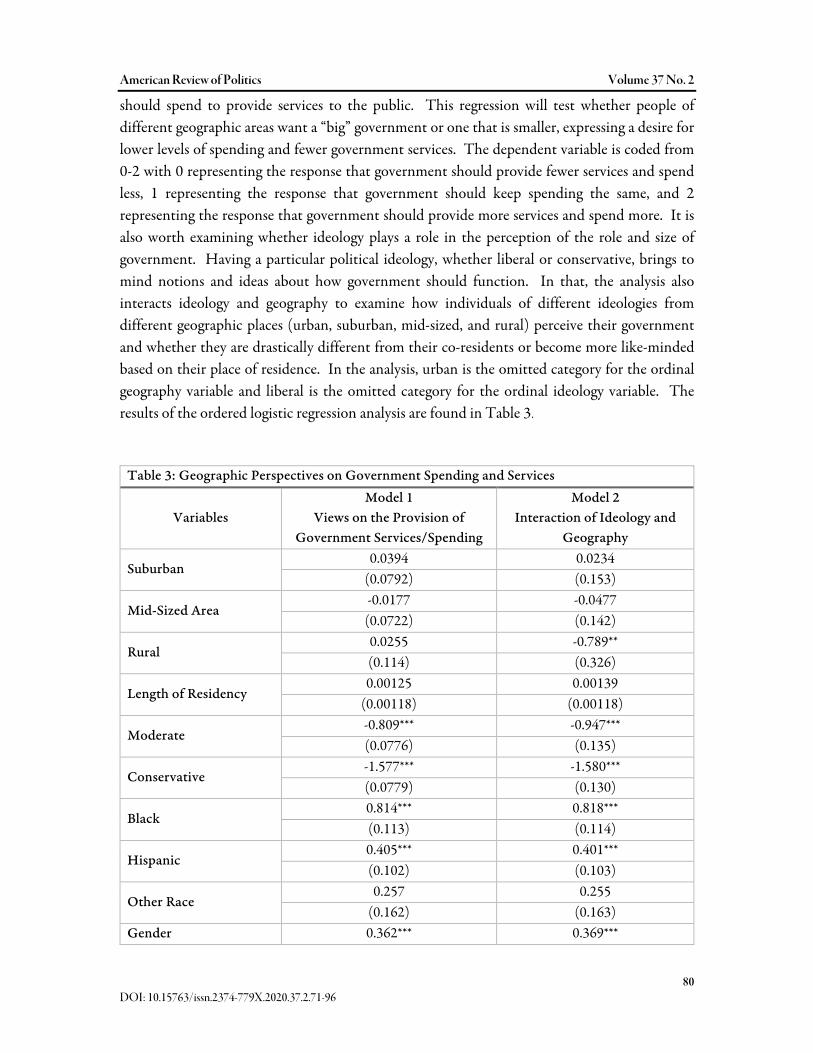
should spend to provide services to the public. This regression will test whether people of different geographic areas want a “big” government or one that is smaller, expressing a desire for lower levels of spending and fewer government services. The dependent variable is coded from 0-2 with 0 representing the response that government should provide fewer services and spend less, 1 representing the response that government should keep spending the same, and 2 representing the response that government should provide more services and spend more. It is also worth examining whether ideology plays a role in the perception of the role and size of government. Having a particular political ideology, whether liberal or conservative, brings to mind notions and ideas about how government should function. In that, the analysis also interacts ideology and geography to examine how individuals of different ideologies from different geographic places (urban, suburban, mid-sized, and rural) perceive their government and whether they are drastically different from their co-residents or become more like-minded based on their place of residence. In the analysis, urban is the omitted category for the ordinal geography variable and liberal is the omitted category for the ordinal ideology variable. The results of the ordered logistic regression analysis are found in Table 3.
Table 3: Geographic Perspectives on Government Spending and Services
Variables Model 1
Views on the Provision of Government Services/Spending
Model 2 Interaction of Ideology and
Geography
Suburban 0.0394 0.0234
(0.0792) (0.153)
Mid-Sized Area -0.0177 -0.0477 (0.0722) (0.142)
Rural 0.0255 -0.789** (0.114) (0.326)
Length of Residency 0.00125 0.00139
(0.00118) (0.00118)
Moderate -0.809*** -0.947*** (0.0776) (0.135)
Conservative -1.577*** -1.580*** (0.0779) (0.130)
Black 0.814*** 0.818*** (0.113) (0.114)
Hispanic 0.405*** 0.401*** (0.102) (0.103)
Other Race 0.257 0.255
(0.162) (0.163) Gender 0.362*** 0.369***

American Review of Politics Volume 37 No. 2
81 DOI: 10.15763/issn.2374-779X.2020.37.2.71-96
(0.0565) (0.0566)
Education -0.0697** -0.0716** (0.0283) (0.0283)
Age -0.00689*** -0.00702*** (0.00179) (0.00179)
Income -0.191*** -0.190*** (0.0281) (0.0281)
South -0.0579 -0.0539 (0.0656) (0.0658)
Suburban x Moderate - 0.0710 (0.200)
Suburban x Conservative
- -0.0151 (0.198)
Mid-Size x Moderate - 0.199
(0.180)
Mid-Size x Conservative - -0.0985 (0.177)
Rural x Moderate - 0.884** (0.360)
Rural x Conservative - 0.963*** (0.366)
Year: 1996 0.226*** 0.234*** (0.0802) (0.0804)
Year: 1998 0.604*** 0.607*** (0.0873) (0.0875)
Year: 2000 0.759*** 0.755*** (0.117) (0.118)
Year: 2004 0.958*** 0.962*** (0.0931) (0.0932)
Year: 2008 0.911*** 0.914*** (0.101) (0.102)
Constant (Cut 1) -1.883*** -1.930*** (0.161) (0.177)
Constant (Cut 2) -0.507*** -0.551*** (0.159) (0.175)
Observations 4,847 4,847 Pseudo 𝑹𝑹𝟐𝟐 0.098 0.100 Ordered Logistic Regression/Robust standard errors in parentheses *** p<0.01, ** p<0.05, * p<0.1

American Review of Politics Volume 37 No. 2
82 DOI: 10.15763/issn.2374-779X.2020.37.2.71-96
Based on the results in Table 3, the analyses bear mixed results for the hypotheses. In the non-interactive model (Model 1), the results support the hypothesis that conservatives are less favorable of government spending compared to liberals; however, the models do not provide support for the first hypothesis that rural Americans are less supportive of spending than urban Americans. The analysis demonstrates that control variables move in their expected direction. Minorities were more likely to support government services compared to white respondents. As expected, the older and wealthier respondents were less supportive of government services and spending, further demonstrating that wealthier and older Americans hold more conservative positions on the role of government involvement. More government programs and spending would also require more tax revenue from citizens, thereby placing a higher tax burden onto wealthier Americans.
As it appears that perceptions on government spending are slightly different across political ideologies especially between liberals and conservatives, it is worth asking how much geography impacts the perceptions of government across the two ideologies. Such a question could better illustrate the link between how place and if the surrounding environment can alter perceptions of government on individuals of varying political ideologies. The second model in Table 3 includes an interaction between geography and ideology. Here, it is expected that an individual’s place will either exacerbate their ideological feelings towards government or will moderate such beliefs (Hypothesis 3). As previous literature has indicated (Walsh 2012; Cramer 2016), rural Americans are more prone to supporting less government involvement. Therefore, the outcome of interest in the marginal effects analysis is the propensity of Americans of different ideologies across geography to desire less government involvement through government spending. The results of the interaction are demonstrated by a marginal effects analysis and the results are depicted in Figure 1.

American Review of Politics Volume 37 No. 2
83 DOI: 10.15763/issn.2374-779X.2020.37.2.71-96
Figure 1. Interaction between Geography and Ideology on Support for Less Government Spending on Public Services
According to the results displayed in Figure 1, it becomes clear that liberals from urban, suburban, and mid-sized areas are less likely to believe government should provide fewer services to the public. As expected, conservatives were always less supportive of government spending across all geographic areas. Still, the significant finding here is that liberals and moderates in rural areas are roughly similar in their perspectives on government spending and the provision of services as rural liberals are nearly 0.15 higher in their desire for less government spending than liberals from other areas.3 This finding supports the third hypothesis and theory that individuals’ opinions and perceptions are moderated by their geographic surroundings and thereby, by living in a particular place may inherently condition or alter one’s political perspectives.
Geographic Perspectives on Welfare Spending
The second analysis moves beyond an examination of the role of government and government spending by evaluating individual opinions of the provision of welfare. The
3 Using a pairwise comparison test between each interaction of ideology and geography, the difference between rural liberals and liberals from the other three geographic areas is statistically significant at p<.05.

American Review of Politics Volume 37 No. 2
84 DOI: 10.15763/issn.2374-779X.2020.37.2.71-96
provision of welfare has often been a hot-button political issue as it deals with the idea that government can play a large role in assisting the poor with increased spending and the creation of social programs. The dependent variable in this analysis asks respondents whether government spending for welfare programs should be decreased, kept the same, or increased. The variable is coded as 0 for decreased spending, 1 for keeping the amount the same, and 2 for an increase in welfare spending. Similar to the analysis for government spending and the provision of services, this analysis will also incorporate an interaction between ideology and geography to evaluate whether opinions regarding welfare are conditioned or moderated by geography across different political ideologies. The results of the ordered logistic regression analysis are found in Table 4.
Table 4: Geographic Perspectives on Welfare Spending
Variables Model 1
Views on the Provision of Government Welfare
Model 2 (Interaction of Ideology and Geography)
Suburban 0.0620 0.108
(0.0774) (0.140)
Mid-Sized Areas 0.0906 0.0343
(0.0691) (0.123)
Rural -0.179 -0.274 (0.119) (0.272)
Length of Residency -0.000212 -0.000234 (0.00119) (0.00119)
Moderate -0.657*** -0.556*** (0.0723) (0.122)
Conservative -1.172*** -1.305*** (0.0712) (0.126)
Black 0.785*** 0.775*** (0.0963) (0.0964)
Hispanic 0.378*** 0.370*** (0.0923) (0.0925)
Other 0.194 0.192
(0.162) (0.163)
Gender 0.174*** 0.180*** (0.0551) (0.0553)
Education 0.0275 0.0281
(0.0274) (0.0275)
Age 0.00178 0.00176
(0.00175) (0.00175) Income -0.261*** -0.262***

American Review of Politics Volume 37 No. 2
85 DOI: 10.15763/issn.2374-779X.2020.37.2.71-96
(0.0281) (0.0281)
South -0.000123 0.00250 (0.0612) (0.0613)
Suburban x Moderate - -0.314
(0.191)
Suburban x Conservative - 0.146
(0.187)
Mid-Size x Moderate - -0.0430
(0.167)
Mid-Size x Conservative - 0.188
(0.165)
Rural x Moderate - -0.0993
(0.332)
Rural x Conservative - 0.294
(0.319)
Year: 1996 -0.227*** -0.227*** (0.0840) (0.0841)
Year: 2000 0.450*** 0.453*** (0.0986) (0.0988)
Year: 2004 0.934*** 0.936*** (0.0913) (0.0918)
Year: 2008 0.959*** 0.955*** (0.0810) (0.0812)
Cut 1 -0.919*** -0.936*** (0.156) (0.166)
Cut 2 1.096*** 1.082*** (0.158) (0.168)
Observations 5,203 5,203 Pseudo 𝑹𝑹𝟐𝟐 0.097 0.097 Ordered Logistic Regression/Robust standard errors in parentheses *** p<0.01, ** p<0.05, * p<0.1
According to the results displayed in Table 4, the analyses bear mixed results for the three
hypotheses. In both Models 1 and 2, there were no significant differences between urban and rural Americans in supporting an increase in welfare spending, therefore demonstrating a lack of support for the first hypothesis. In Models 1 and 2, consistent with the results from the first analysis, conservatives were significantly less supportive of spending on welfare compared to liberals, supporting the second hypothesis. As in the first analysis, wealthier Americans were less likely to be supportive of increased welfare spending and programs. To test the third hypothesis, this analysis also incorporates ideology with geography to determine whether a person’s place moderates opinions towards welfare spending across ideology. The marginal effects analysis

American Review of Politics Volume 37 No. 2
86 DOI: 10.15763/issn.2374-779X.2020.37.2.71-96
demonstrates a similar pattern for rural liberals with the first analysis although with a smaller substantive effect and not statistically significant. As with the first marginal effects analysis, the outcome of interest is the extent to which individuals from the different regions desire less welfare spending for the general public. The results of the marginal effects analysis and interaction between ideology and geography are found in Figure 2.
Figure 2. Interaction between Geography and Ideology on Welfare Spending
Geographic Perspectives on Social Security Spending
The third analysis focuses on a specific government policy that in some way benefits all Americans: Social Security. By evaluating a specific government policy such as Social Security, this analysis demonstrates how Americans will perceive a policy that has been a consistent form of government exhibiting a larger role in American society. Given that Social Security has been an active government welfare policy for more than 80 years, it can be expected that individuals will view this policy favorably or at least consistently across geographic areas and across political ideologies. Further supporting this logic, a March 2018 poll of 1,945 respondents from the National Opinion Research Center and the Associated Press revealed that 51% of those surveyed claimed that they rely on or will rely on Social Security either “completely” or “quite a bit” as they get older (NORC Long-Term Care Poll 2018). In the ANES survey, Americans were asked whether Social Security spending should be decreased or cut out entirely, kept the same, or

American Review of Politics Volume 37 No. 2
87 DOI: 10.15763/issn.2374-779X.2020.37.2.71-96
increased. The dependent variable measuring opinions on Social Security spending is coded from 0-2 with 0 representing the opinion that Social Security spending should be decreased or cut out entirely, 1 representing the opinion that Social Security spending should be kept the same, and 2 representing the opinion that Social Security spending should be increased. In similar fashion to the first two analyses, this analysis also incorporates an interaction between ideology and geography to examine whether place moderates or shifts opinions regarding Social Security across geography and ideology. The results of the ordered logistic regression are found in Table 5.
Table 5: Geographic Perspectives on Social Security Spending
Variables Model 1
Views on Government Spending for Social Security
Model 2 (Interaction of Ideology and Geography
Suburban 0.0383 -0.00267
(0.0826) (0.153)
Mid-Size 0.0523 -0.0723
(0.0755) (0.134)
Rural 0.278** 0.682** (0.119) (0.329)
Length of Residency 0.000713 0.000736 (0.00122) (0.00122)
Moderate -0.109 -0.260*
(0.0796) (0.147)
Conservative -0.514*** -0.518*** (0.0732) (0.131)
Black 1.050*** 1.060*** (0.118) (0.118)
Hispanic 0.496*** 0.506*** (0.102) (0.102)
Other 0.104 0.107
(0.164) (0.164)
Gender 0.508*** 0.503*** (0.0582) (0.0583)
Education -0.305*** -0.303*** (0.0282) (0.0282)
Age -0.00317* -0.00304 (0.00185) (0.00185)
Income -0.125*** -0.126*** (0.0293) (0.0293)
South 0.0375 0.0314

American Review of Politics Volume 37 No. 2
88 DOI: 10.15763/issn.2374-779X.2020.37.2.71-96
(0.0658) (0.0660)
Suburban x Moderate - 0.270
(0.216)
Suburban x Conservative - -0.0745 (0.196)
Mid-Size x Moderate - 0.263
(0.190)
Mid-Size x Conservative - 0.109
(0.172)
Rural x Moderate - -0.424 (0.387)
Rural x Conservative - -0.448 (0.365)
Year: 1996 -0.229*** -0.227*** (0.0794) (0.0796)
Year: 2000 0.697*** 0.696*** (0.105) (0.105)
Year: 2004 0.623*** 0.624*** (0.0951) (0.0953)
Year: 2008 0.646*** 0.646*** (0.0865) (0.0867)
Cut 1 -3.763*** -3.802*** (0.184) (0.197)
Cut 2 -0.750*** -0.787*** (0.165) (0.180)
Observations 5,199 5,199 Pseudo 𝑹𝑹𝟐𝟐 .092 .092 Ordered Logistic Regression/Robust standard errors in parentheses *** p<0.01, ** p<0.05, * p<0.1
According to the results in Table 5, the results are mixed. From the analysis, it appears
that support for Social Security spending is fairly constant and similar across geographic areas; however, in both Models 1 and 2, rural Americans are slightly more supportive of increased spending on Social Security and expansion, compared to urban Americans running counter to the logic of the first hypothesis. Still, as evidenced in the first two analyses, ideology still plays a pivotal role in determining attitudes towards Social Security spending with conservatives being less favorable compared to liberals in both models, supporting the second hypothesis. Furthermore, as in the first two analyses, wealthier Americans were less supportive of increased Social Security spending. To determine whether opinions toward Social Security are different across geography and ideology, a marginal effects analysis of the interaction between the two will
American Review of Politics Volume 37 No. 2
89 DOI: 10.15763/issn.2374-779X.2020.37.2.71-96
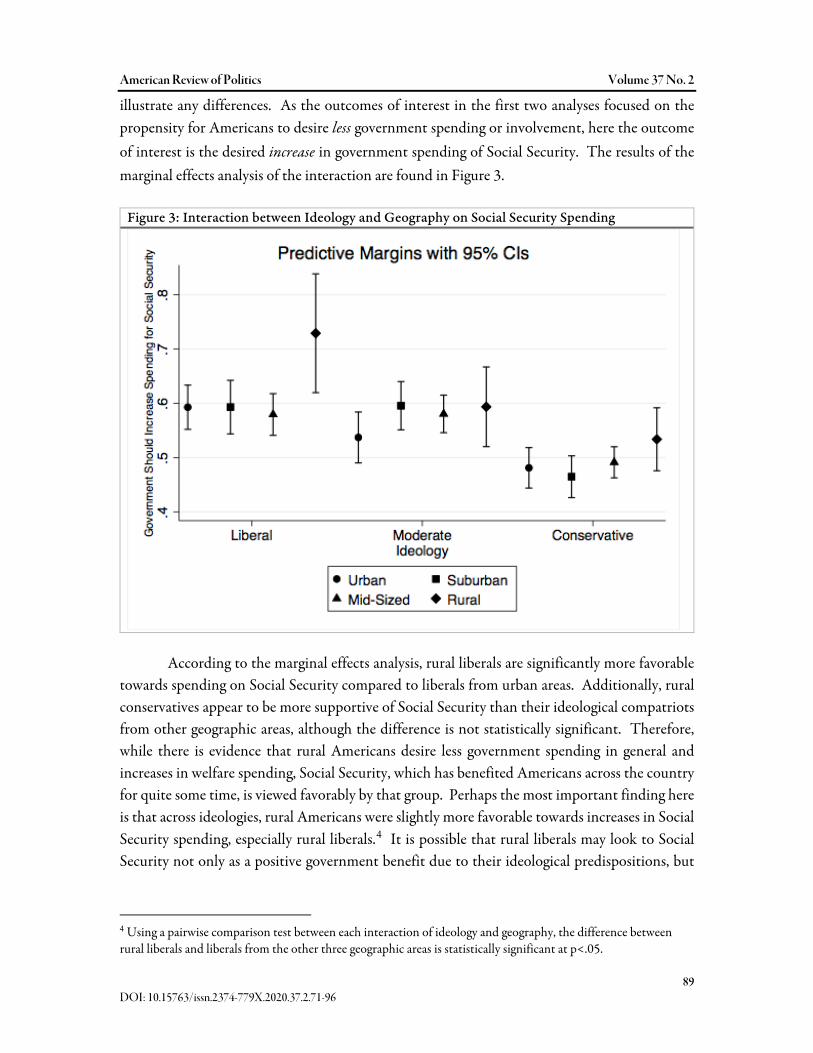
illustrate any differences. As the outcomes of interest in the first two analyses focused on the propensity for Americans to desire less government spending or involvement, here the outcome of interest is the desired increase in government spending of Social Security. The results of the marginal effects analysis of the interaction are found in Figure 3.
Figure 3: Interaction between Ideology and Geography on Social Security Spending
According to the marginal effects analysis, rural liberals are significantly more favorable
towards spending on Social Security compared to liberals from urban areas. Additionally, rural conservatives appear to be more supportive of Social Security than their ideological compatriots from other geographic areas, although the difference is not statistically significant. Therefore, while there is evidence that rural Americans desire less government spending in general and increases in welfare spending, Social Security, which has benefited Americans across the country for quite some time, is viewed favorably by that group. Perhaps the most important finding here is that across ideologies, rural Americans were slightly more favorable towards increases in Social Security spending, especially rural liberals.4 It is possible that rural liberals may look to Social Security not only as a positive government benefit due to their ideological predispositions, but
4 Using a pairwise comparison test between each interaction of ideology and geography, the difference between rural liberals and liberals from the other three geographic areas is statistically significant at p<.05.

American Review of Politics Volume 37 No. 2
90 DOI: 10.15763/issn.2374-779X.2020.37.2.71-96
one that helps their friends, neighbors, and their community with whom they share a geographic identity. Limitations and Considerations
While the findings demonstrate the role of place influences perceptions of politics and public policy, this research has some limitations. First, the sample of rural respondents is significantly smaller compared to the other geographic areas. Therefore, the low sample size of rural respondents is leading to larger confidence intervals in regard to the predicted probabilities when comparing ideology across geography. When coding for a respondent’s geography using the NCHS coding scheme, I wanted to capture respondents who were the most distinctly rural and therefore were not living in micropolitan or scattered suburban areas around a major metro area. In only utilizing one specific classification for rural, I was able to identify those who lived in rural areas that were furthest away from other localities. In order to further understand how politics is viewed, discussed, or different between urban and rural areas, future research will require an emphasis or oversampling of rural areas due to the small sample sizes of rural respondents in existing survey research.
Additionally, the data, while appropriate, is only limited to a specific set of years from 1994-2008. Examining a longer period of time would be beneficial to track the development and trends of perceptions on government and public policy across different geographic areas. In doing so, researchers will be able to better understand how the urban-rural division in America has formed across time. Overall, the data did not provide a perfect picture that mirrors the national demographics of geography (where 14% of Americans live in rural areas); however, the data along with the analyses further confirm that the place in which someone lives can influence perceptions of the role of government.
Conclusion
As seen from previous literature, partisanship, ideology, and race have been significant factors in the development of political attitudes and opinions. This study incorporates the analysis of political geography in order to explain whether the location in which someone lives is just as much of a factor on an individual’s perceptions of government and the provision of government services. The research presented here further buttresses the idea that geography can matter in explaining political attitudes in some situations. The rationale behind this research was not only to demonstrate the value of geography in the study of public opinion, but also to empirically examine the idea that America is divided into two distinct geographic “camps:” urban and rural. The findings in the empirical analyses suggest geography can be an influential factor in affecting individual perceptions towards government or specific government policies, especially among a specific group: rural liberals. Individuals in rural areas, especially those who considered themselves liberal and to a lesser degree moderates, demonstrated significant differences in perceptions on the role of government compared to those respondents with the same ideologies in urban and suburban and mid-size areas. Therefore, the findings suggest that

American Review of Politics Volume 37 No. 2
91 DOI: 10.15763/issn.2374-779X.2020.37.2.71-96
the perspectives of liberal Americans from rural areas regarding government spending are more nuanced than liberals from other regions. Conservatives, unsurprisingly, were consistently in favor of reducing the amount of spending for public services and programs, compared to liberals across geographic areas.
Based on the results of the study, liberals who lived in rural areas were more likely to support decreases in general spending for public services and welfare, thereby demonstrating that geography has a significant influence upon one’s political perspectives and can affect their attitudes regarding the role of government. These results indicate that liberals who live in rural areas have their opinions moderated in perhaps an attempt to “blend in” or become more like those within their rural environment. As liberals are in large part “outnumbered” by conservatives in rural America, rural liberals’ perceptions of politics may be more “liberal” than their fellow community members, yet they still hold onto the belief that increased government spending and welfare benefits are not benefiting their communities. Still, rural liberals demonstrated a greater level of support for Social Security, a policy that has been popular among Americans since its inception.
In short, this study illustrates that political perceptions of individuals between urban and rural America are nuanced and the study of rural Americans who consider themselves liberal merits further consideration as this group perhaps holds its own perspective of the political world. The findings of this study also demonstrate that public opinion among liberals and conservative is conditional upon where they live; therefore, such individuals who identify themselves as either liberal or conservative cannot be assumed to hold more liberal or more conservative attitudes on issues of public policy. For political candidates, liberal Democratic candidates should not discount rural Americans as they appear to be generally supportive of social programs such as Social Security, yet they must be wary of promoting large-scale government programs in rural areas as those voters are perhaps more skeptical or at least more moderate when it comes to spending more on public policies. Given the ideological breakdown of rural areas, Republicans attract a great deal of support from these communities, therefore the Republican message of reducing “big-government” spending continues to resonate with rural Americans.
Bibliography Agnew, John A. (1987). Place and Politics: The Geographical Mediation of State and Society.
Winchester, MA: Allen & Unwin, Inc. American National Election Studies (www.electionstudies.org). These materials are based on
work supported by the National Science Foundation under grant numbers SES 1444721, 2014-2017, the University of Michigan, and Stanford University.
Associated Press-NORC Long-Term Care Poll, 2013-2018. (2018).

American Review of Politics Volume 37 No. 2
92 DOI: 10.15763/issn.2374-779X.2020.37.2.71-96
Bell, Michael. (1992). “The Fruit of Difference: The Rural-Urban Continuum as a System of Identity.” Rural Sociology 57 (1): 65-82. Bishop, Bill. (2009). The Big Sort: Why the Clustering of Like-Minded America is Tearing Us Apart. Mariner Books. Blokland, Talja & Mike Savage. (2001). “Networks, Class and Place.” International Journal
of Urban and Regional Research 25 (2): 221-26. Campbell, Angus, Philip E. Converse, Warren E. Miller, & Donald E. Stokes. (1960). The
American Voter. Chicago: University of Chicago Press. Cho, Wendy K. Tam, James G. Gimpel, & Iris S. Hui. (2013). Voter Migration and the Geographic Sorting of the American Electorate. Annals of the Association of American Geographers, 103(4), 856-870. Clinton, Bill. (1996). State of the Union Address. January 23, 1996.
https://clintonwhitehouse4.archives.gov/WH/New/other/sotu.html Conover, P. J., & Feldman, S. (1981). The origins and meaning of liberal/conservative self-
identifications. American Journal of Political Science, 617-645. Cramer, Katherine J. (2016). The Politics of Resentment: Rural Consciousness and the Rise of Scott Walker. University of Chicago Press. Ellis, Christopher & Stimson, James. (2012). Ideology in America. Cambridge University Press. Gimpel, James G., and Jason E. Schuknecht. (2003). Patchwork Nation: Sectionalism and Political Change in American Politics. Ann Arbor: University of Michigan Press. Goren, P. (2003). Race, Sophistication, and White Opinion on Government Spending. Political Behavior, 25(3), 201-220. Goren, P. (2008). The Two Faces of Government Spending. Political Research Quarterly, 61(1), 147-157.

American Review of Politics Volume 37 No. 2
93 DOI: 10.15763/issn.2374-779X.2020.37.2.71-96
Green, Donald P., Bradley Palmquist, and Eric Schickler. (2002). Partisan Hearts and Minds: Political Parties and the Social Identities of Voters. New Haven: Yale University Press.
Hopkins, David. (2017). Red Fighting Blue: How Geography and Electoral Rules Polarize
American Politics. Cambridge University Press. Huckfeldt, R., Levine, J., Morgan, W., & Sprague, J. (1999). Accessibility and the Political
Utility of Partisan and Ideological Orientations. American Journal of Political Science, 43(3), 888-911.
Ingram D.D & Franco S.F. (2014). 2013 NCHS Urban-Rural Classification Scheme for
Counties. National Center for Health Statistics. Vital Health Stat 2(166). Jacoby, W. (1994). Public Attitudes toward Government Spending. American Journal of Political
Science, 38(2), 336-361. Jacoby, W. (2000). Issue Framing and Public Opinion on Government Spending. American
Journal of Political Science, 44(4), 750-767. Jacoby, W. (2006). Value Choices and American Public Opinion. American Journal of Political
Science, 50(3), 706-723. McDonald, Ian. (2011). Migration and Sorting in the American Electorate: Evidence from the
2006 Cooperative Congressional Election Study. American Politics Research, 39(3), 512-533.
McKee, Seth. (2008). Rural Voters and the Polarization of American Presidential Elections. PS:
Political Science and Politics, 41(1), 101-108. Misra, Tanvi. (2018). Rural and Urban America Have More in Common Than You Think.
CityLab. https://www.citylab.com/life/2018/05/rural-and-urban-america-have-more-in- common-than-you-think/560783/?utm_source=citylab-daily&silverid=NDY5NTk2NTQwMTc0S0.
Nelson, T., & Kinder, D. (1996). Issue Frames and Group-Centrism in American Public
Opinion. The Journal of Politics, 58(4), 1055-1078.
American Review of Politics Volume 37 No. 2
94 DOI: 10.15763/issn.2374-779X.2020.37.2.71-96
Pickering, A., & Rockey, J. (2011). Ideology and the Growth of Government. Review of
Economics and Statistics, 93, 907-919.
Popkin, Samuel L. (1994). The Reasoning Voter: Communication and Persuasion in Presidential Campaigns. Chicago: University Of Chicago Press.
Reagan, Ronald. (1986). “The President’s News Conference.”
https://www.reaganfoundation.org/ronald-reagan/reagan-quotes-speeches/news-conference-1/
Rudolph, T., & Evans, J. (2005). Political Trust, Ideology, and Public Support for Government Spending. American Journal of Political Science, 49(3), 660-671. Scala, D. J., & Johnson, K. M. (2017). Political Polarization along the Rural-Urban Continuum?
The Geography of the Presidential Vote, 2000–2016. The Annals of the American Academy of Political and Social Science, 672(1), 162–184.
Walsh, K. (2012). Putting Inequality in Its Place: Rural Consciousness and the Power of
Perspective. American Political Science Review, 106(3), 517-532.

American Review of Politics Volume 37 No. 2
95 DOI: 10.15763/issn.2374-779X.2020.37.2.71-96
Appendix
Summary Statistics of Independent Control Variables Variables n Percent Std Dev Min Max
Age 6161 100% 16.63 18 93 Income 6161 100% 1.13 1 5
0 – 16 Percentile 846 13.7% 17 – 33 Percentile 994 16.1%
34 – 67 Percentile 2210 35.9%
68 – 95 Percentile 1662 27%
96 – 100 Percentile 449 7.3%
Length of Res. 6161 100% 26.03 0 90 Race 6161 100% 0.82 0 3
White 4575 74.3% Black 675 10.9%
Hispanic 710 11.5%
Other 201 3.3%
Ideology 6161 100% 0.81 0 2 Liberal 1586 25.7%
Moderate 1993 32.4%
Conservative 2582 41.9%
Education 6161 100% 1.14 0 4 Not Completed HS 521 8.5%
High School Diploma 1713 27.8%
Some College 1905 30.9%
College Degree 1299 21.1%
Advanced Degree 723 11.7%
Gender 6161 100% 0.5 0 1 Male 2964 48.1%
Female 3197 51.9%
Geographic Region 6161 100.0% 0.47 0 1 Non-South 4086 66.3%
South 2075 33.7%

American Review of Politics Volume 37 No. 2
96 DOI: 10.15763/issn.2374-779X.2020.37.2.71-96
ANES Question Wording Government Services
• “Some people think the government should provide fewer services in areas such as health and education, in order to reduce spending. Where would you place yourself on this scale?”
Welfare Spending
• “If you had a say in making up the federal budget this year, for which of the following programs would you like to see spending increased and for which would you like to see spending decreased: Should federal spending on welfare programs be increased, decreased, or kept about the same?”
Social Security Spending
• “If you had a say in making up the federal budget this year, for which of the following programs would you like to see spending increased and for which would you like to see spending decreased: Should federal spending on Social Security be increased, decreased, or kept about the same?”


![11.[20 37]analysis of bus-stops locations using geographic information system in ibadan north l.g.a nigeria](https://static.fdocuments.us/doc/165x107/54bd65064a79595e238b4686/1120-37analysis-of-bus-stops-locations-using-geographic-information-system-in-ibadan-north-lga-nigeria.jpg)