AMERICAN PREPAREDNESS PROJECT
71
AMERICAN PREPAREDNESS PROJECT: Where the US Public Stands in 2015 PREPAREDNESS ATTITUDES AND OPINIONS BRIEFING REPORT NO. 2 MAY 2016
Transcript of AMERICAN PREPAREDNESS PROJECT

AMERICAN PREPAREDNESS PROJECT: Where the US Public Stands in 2015
PREPAREDNESS ATTITUDES
AND OPINIONS
BRIEFING REPORT NO.2MAY 2016

Recommended Citation
“The American Preparedness Project: Where the US Public Stands in 2015.” Elisaveta Petkova, Jeff Schlegelmilch, Jonathan Sury, Tom Chandler, Cynthia Herrera, Shwetha Bhaskar, Erin Sehnert, Stephanie Martinez, Sabine Marx, Irwin Redlener. National Center for Disaster Preparedness at Columbia University’s Earth Institute, Research Brief 2016_2. (Release date 12 May 2016) http://dx.doi.org/10.7916/D84Q7TZN
Acknowledgments
Portions of this survey related to children in disasters were developed and analyzed under the Resilient Children/Resilient Communities (RCRC) Initiative (http://ncdp.columbia.edu/rcrc) a partnership with Save the Children funded by a grant from GSK. The RCRC initiative’s full report Children in Disasters: Do Americans Feel Prepared? is available at: http://dx.doi.org/10.7916/D85M65J9
Principal Investigator:
Research Team:
Graduate Research Assistants:
Senior Advisor & Director, NCDP:
Jeff Schlegelmilch
Elisaveta Petkova, Tom Chandler, Jonathan Sury, Shwetha Bhaskar, Erin Sehnert, Sabine Marx
Stephanie Martinez, Cynthia Herrera
Irwin Redlener

TABLE OF CONTENTS
NOTE FROM THE DIRECTOR 1
EXECUTIVE SUMMARY 2 INTRODUCTION 4
METHODOLOGY 5
NATIONAL TRENDS SINCE 9/11 8 General Preparedness 8 Terrorism 12 Natural disasters and climate change 14Children and disasters 16
KEY FINDINGS IN 2015 19 General Preparedness 19 Natural disasters and climate change 23 Terrorism 29Children and disasters 31
CONCLUSIONS & RECOMMENDATIONS 40 APPENDIX 42


THE AMERICAN PREPAREDNESS PROJECT: WHERE THE U.S. STANDS IN 2015 1
NOTE FROM THE DIRECTOR
We began the American Preparedness Project in the years after 9/11 as public concern over acts of terrorism and national investments in disaster preparedness reached unprecedented levels. The intent of this project was to understand levels of public preparedness to disasters, as well as their perceptions and trust in govern-ment. Over the years, the survey has evolved to capture the original questions, as well as emerging ones driven by Hurricane Katrina and other disasters. This latest survey continues this tradition by repeating ques-tions from each administration of the survey for trending purposes, and adding questions related to recent events like the Ebola Outbreak and Superstorm Sandy, as well as long-term issues such as climate change.
We capture public opinion data, because this information is critical for understanding preparedness in ways that other kinds of research overlook. It provides a “reality check” to what is assumed by planners and policy-makers based on what people actually perceive. This perception provides clues into how public engagement is working as well as the likelihood (or unlikelihood) of the public to listen and respond as expected by emer-gency planners. However it should be acknowledged that opinion data is also notoriously difficult to validate. This is partly due to the sensitivity of public opinion to recent events, and also inherent limitations in how these surveys are conducted.
Using the example of personal preparedness, this phone survey finds that approximately 50% of households claimed to have a disaster plan and supplies, but when pressed for more information on a follow-up ques-tion, only 35% of all households are able to report an adequate plan and supplies. In an online survey we conducted with the same questions this number is 40% reporting preparedness plans/supplies with only 20% of the total respondents reporting an adequate plan/supplies based on a follow-up question. Even this lower number is still higher than my own anecdotal experience, where I have asked this question at conferences and meetings across the country for many years and rarely do more than a few people identify as having a preparedness kit and plan.
The difficulty with this data is that we can’t say which numbers are closer to the absolute truth: this phone survey, the online survey or my anecdotal accounts. While this does not change the ability to use this data for broad conclusion statements that include terms like “most households” or “few individuals”, we still lack a reliable tool to explore these questions with more precision. Unfortunately, the state of preparedness has not improved to a level where this really matters. According to all three methods, we can say with certainty that most households are not prepared for disasters, and the situation has not improved to a degree that is com-mensurate with our national investment and experience with disasters.
As we continue to collect this data and make it available to researchers, policymakers and planners nation-ally, it is important that the trends in household preparedness and perceptions of preparedness continue to be understood. But as a nation we should also invest in better tools to understand public perceptions of preparedness more regularly and with more precise instruments. Of all the partnerships that are required for preparing, responding to and recovering from disasters, the relationship with the American public is the most important to understand and cultivate.
1 A full comparison between the phone and online surveys is being conducted by the National Center for Disaster Preparedness
to explore the differences further.
THE AMERICAN PREPAREDNESS PROJECT: WHERE THE U.S. STANDS IN 20152
EXECUTIVE SUMMARY
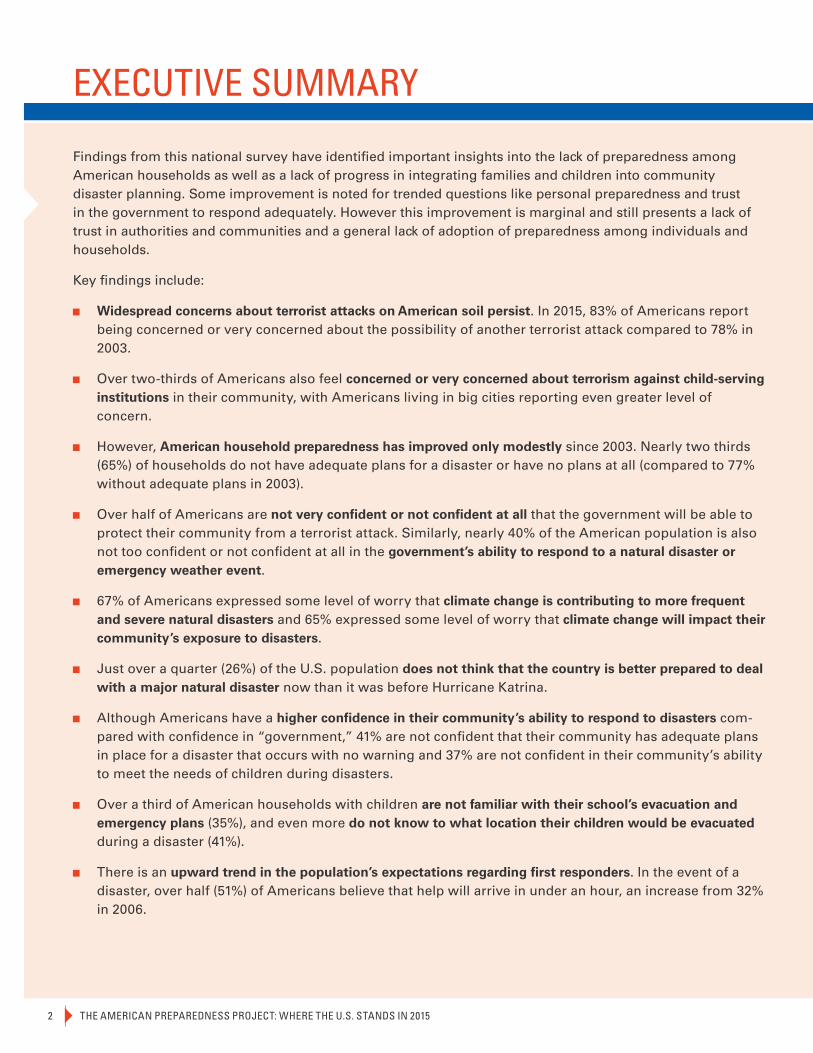
Findings from this national survey have identified important insights into the lack of preparedness among American households as well as a lack of progress in integrating families and children into community disaster planning. Some improvement is noted for trended questions like personal preparedness and trust in the government to respond adequately. However this improvement is marginal and still presents a lack of trust in authorities and communities and a general lack of adoption of preparedness among individuals and households.
Key findings include:
Widespread concerns about terrorist attacks on American soil persist. In 2015, 83% of Americans report being concerned or very concerned about the possibility of another terrorist attack compared to 78% in 2003.
Over two-thirds of Americans also feel concerned or very concerned about terrorism against child-serving institutions in their community, with Americans living in big cities reporting even greater level of concern.
However, American household preparedness has improved only modestly since 2003. Nearly two thirds (65%) of households do not have adequate plans for a disaster or have no plans at all (compared to 77% without adequate plans in 2003).
Over half of Americans are not very confident or not confident at all that the government will be able to protect their community from a terrorist attack. Similarly, nearly 40% of the American population is also not too confident or not confident at all in the government’s ability to respond to a natural disaster or emergency weather event.
67% of Americans expressed some level of worry that climate change is contributing to more frequent and severe natural disasters and 65% expressed some level of worry that climate change will impact their community’s exposure to disasters.
Just over a quarter (26%) of the U.S. population does not think that the country is better prepared to deal with a major natural disaster now than it was before Hurricane Katrina.
Although Americans have a higher confidence in their community’s ability to respond to disasters com-pared with confidence in “government,” 41% are not confident that their community has adequate plans in place for a disaster that occurs with no warning and 37% are not confident in their community’s ability to meet the needs of children during disasters.
Over a third of American households with children are not familiar with their school’s evacuation and emergency plans (35%), and even more do not know to what location their children would be evacuated during a disaster (41%).
There is an upward trend in the population’s expectations regarding first responders. In the event of a disaster, over half (51%) of Americans believe that help will arrive in under an hour, an increase from 32% in 2006.

THE AMERICAN PREPAREDNESS PROJECT: WHERE THE U.S. STANDS IN 2015 3
EXECUTIVE SUMMARY (CONTD.)
Members of the preparedness, policy, and practice communities should examine these findings to consider ways to more effectively communicate with individuals and households in their community and to integrate various organizations and stakeholders into preparedness programs. Additionally, insights gained from this study may help policymakers to better understand the perspectives of the public and how these sentiments correspond with their own actions to prepare and respond to the needs of children in a disaster.
Key recommendations:
Individuals and households should invest more into ensuring their preparedness in a disaster.
Governmental agencies should cooperate with trusted community leaders and organizations in order to ensure better community and individual engagement in disaster planning.
The impact of climate change on disasters should be better understood and integrated into communica-tions and preparedness programs.
Preparedness programs should review and consider the effectiveness of planning based on the different geographic, socio-economic and other strata of the presented data
First responders should work with their communities to ensure that either they are prepared to meet the response expectations of their community in a disaster, or to help educate their communities on what they can reasonably expect in a disaster response.

THE AMERICAN PREPAREDNESS PROJECT: WHERE THE U.S. STANDS IN 2015 4
introductionThe American Preparedness Project was launched by the National Center for
Disaster Preparedness (NCDP) in 2002, in the aftermath of the 9/11 attacks in
order to survey public perceptions and opinions on disaster preparedness and to
acknowledge that a comprehensive understanding of the concerns of individuals
and families is critical to emergency planning efforts on all levels.
Characterizing such trends is critical because in order to develop effective disaster plans, as well as a sustain-able long term disaster preparedness strategy, people need to be confident in (a) the reliability of information from official sources, (b) the capacity of government to perform effectively in a crisis and (c) the capability of response systems, particularly health systems and first responders. The major findings of the 2015 American Preparedness Project are presented in the Key Findings section of this report.
The American Preparedness Project survey has been administered eight times since the launch of the project in 2002. Although the content of the question-naire has changed over time to reflect the changing
disaster landscape, a select set of questions has been asked in every iteration of the survey in order to cap-ture changes over time. These questions are presented in the National Trends Since 9/11 section of this report and capture national confidence in household and community preparedness, response systems, and lead-ership. Following the overview of national trends over time, the report highlights findings from the current survey (see Key Findings in 2015) across the domains of General Preparedness, Natural Disasters and Climate Change, Terrorism, and Children in Disasters. The report concludes with Recommendations for improving national, community and household-level preparedness.
THE AMERICAN PREPAREDNESS PROJECT: WHERE THE U.S. STANDS IN 20155
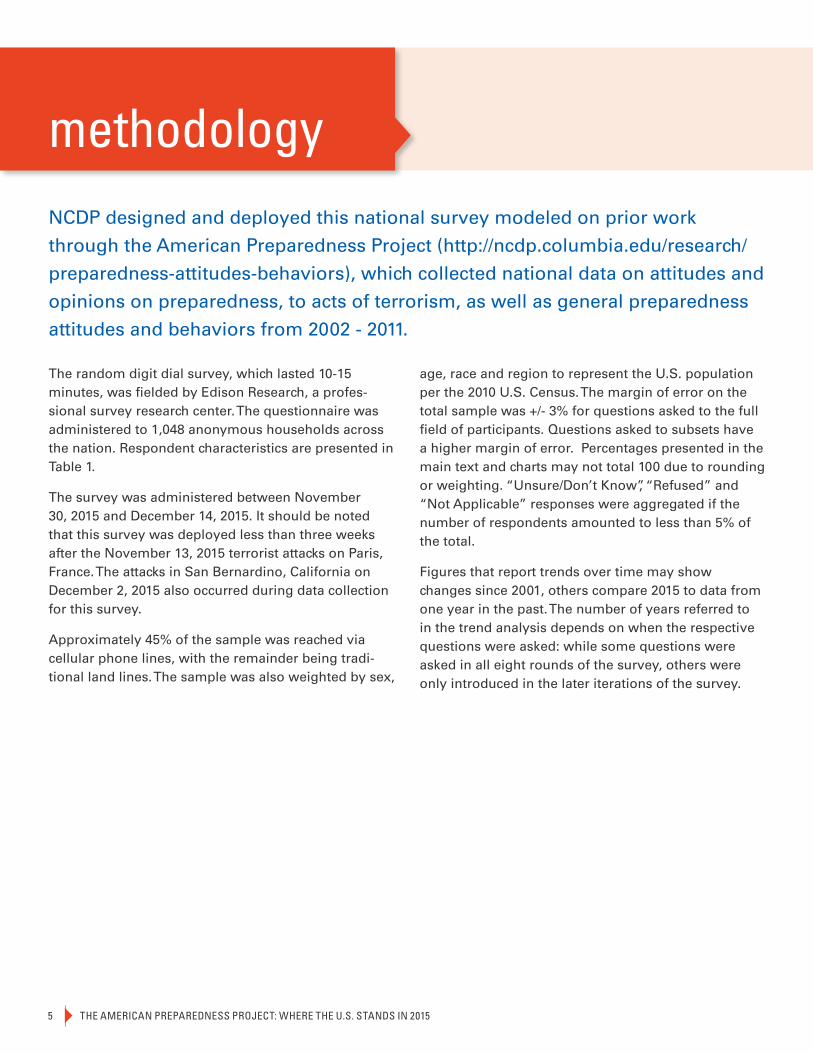
NCDP designed and deployed this national survey modeled on prior work
through the American Preparedness Project (http://ncdp.columbia.edu/research/
preparedness-attitudes-behaviors), which collected national data on attitudes and
opinions on preparedness, to acts of terrorism, as well as general preparedness
attitudes and behaviors from 2002 - 2011.
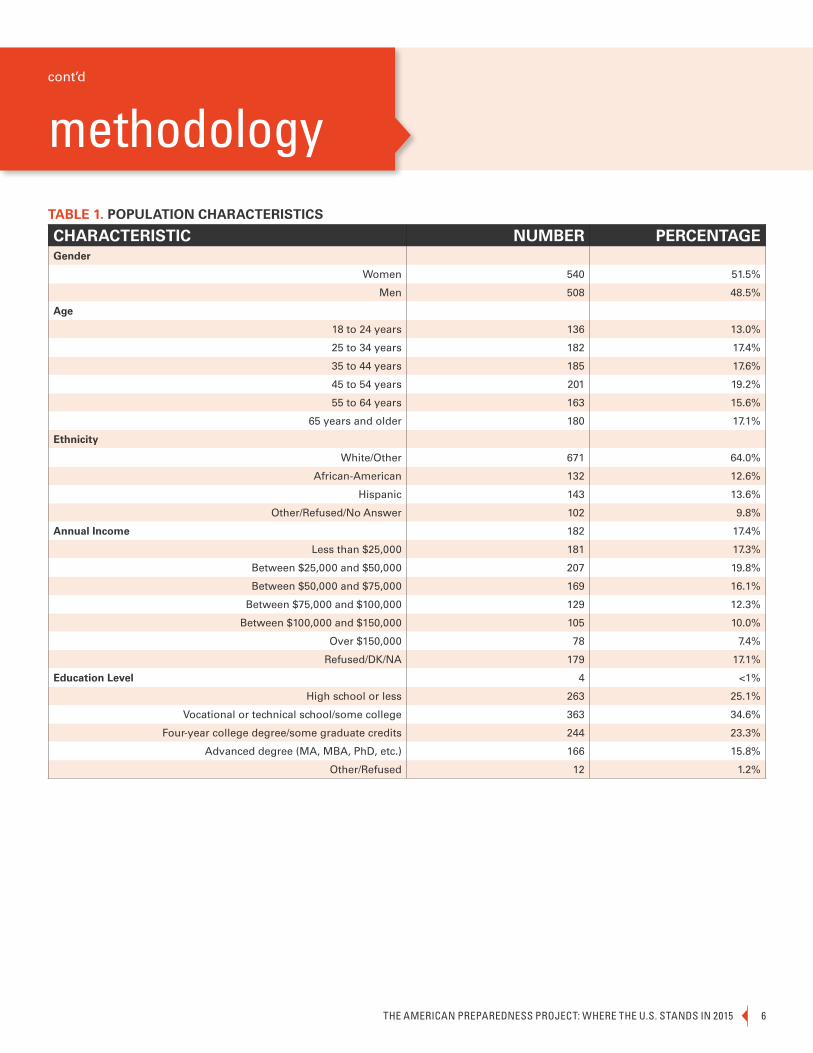
The random digit dial survey, which lasted 10-15 minutes, was fielded by Edison Research, a profes-sional survey research center. The questionnaire was administered to 1,048 anonymous households across the nation. Respondent characteristics are presented in Table 1.
The survey was administered between November 30, 2015 and December 14, 2015. It should be noted that this survey was deployed less than three weeks after the November 13, 2015 terrorist attacks on Paris, France. The attacks in San Bernardino, California on December 2, 2015 also occurred during data collection for this survey.
Approximately 45% of the sample was reached via cellular phone lines, with the remainder being tradi-tional land lines. The sample was also weighted by sex,
age, race and region to represent the U.S. population per the 2010 U.S. Census. The margin of error on the total sample was +/- 3% for questions asked to the full field of participants. Questions asked to subsets have a higher margin of error. Percentages presented in the main text and charts may not total 100 due to rounding or weighting. “Unsure/Don’t Know”, “Refused” and “Not Applicable” responses were aggregated if the number of respondents amounted to less than 5% of the total.
Figures that report trends over time may show changes since 2001, others compare 2015 to data from one year in the past. The number of years referred to in the trend analysis depends on when the respective questions were asked: while some questions were asked in all eight rounds of the survey, others were only introduced in the later iterations of the survey.
cont’d
prefacemethodology
THE AMERICAN PREPAREDNESS PROJECT: WHERE THE U.S. STANDS IN 2015 6
TABLE 1. POPULATION CHARACTERISTICS
CHARACTERISTIC NUMBER PERCENTAGEGender
Women 540 51.5%
Men 508 48.5%
Age
18 to 24 years 136 13.0%
25 to 34 years 182 17.4%
35 to 44 years 185 17.6%
45 to 54 years 201 19.2%
55 to 64 years 163 15.6%
65 years and older 180 17.1%
Ethnicity
White/Other 671 64.0%
African-American 132 12.6%
Hispanic 143 13.6%
Other/Refused/No Answer 102 9.8%
Annual Income 182 17.4%
Less than $25,000 181 17.3%
Between $25,000 and $50,000 207 19.8%
Between $50,000 and $75,000 169 16.1%
Between $75,000 and $100,000 129 12.3%
Between $100,000 and $150,000 105 10.0%
Over $150,000 78 7.4%
Refused/DK/NA 179 17.1%
Education Level 4 <1%
High school or less 263 25.1%
Vocational or technical school/some college 363 34.6%
Four-year college degree/some graduate credits 244 23.3%
Advanced degree (MA, MBA, PhD, etc.) 166 15.8%
Other/Refused 12 1.2%
cont’d
prefacemethodologycont’d

THE AMERICAN PREPAREDNESS PROJECT: WHERE THE U.S. STANDS IN 20157
TABLE 1. POPULATION CHARACTERISTICS (CONTD.)
CHARACTERISTIC NUMBER PERCENTAGEMarital Status
Single 262 25.0%
Married or Living with (Domestic) Partner 589 56.3%
Separated/Divorced/Widowed 180 17.2%
Refused/DK/NA 17 1.6%
Residence by Region
Northeast 188 17.9%
Midwest 227 21.7%
South 389 37.1%
West 244 23.3%
Political Identification
Democrat 474 45.2%
Republican 365 34.8%
Other/None 209 19.9%
Urbanicity
Big City 233 22.3%
Small City 190 18.1%
Suburban 182 17.4%
Small Town 241 23.0%
Rural Area 192 18.3%
No Answer 9 0.9%
Does the participant have children in the household attending school or daycare?
Yes 365 34.9%
No/Refused 683 65.1%
Had the participant experienced a major disaster in the past 5 years? 143 13.6%
Yes 170 16.3%
No 878 83.7%
cont’d
prefacemethodologycont’d

THE AMERICAN PREPAREDNESS PROJECT: WHERE THE U.S. STANDS IN 2015 8
national trends SINCE 9/11
General Preparedness
In 2015, 50% of people state that their family has a family emergency preparedness plan, a steady increase from 35% in 2003. However, the fact that nearly half of the U.S. population do not have or are unsure if they have a family emergency preparedness plan remains an issue of concern, particularly in light of the substantial efforts to improve population awareness and emergency preparedness since 9/11.
% of population reporting having a family emergency preparedness plan over time. The dotted line depicts observed data collected in previous years. The straight line depicts trend over time.
Figure 1
THE AMERICAN PREPAREDNESS PROJECT: WHERE THE U.S. STANDS IN 20159
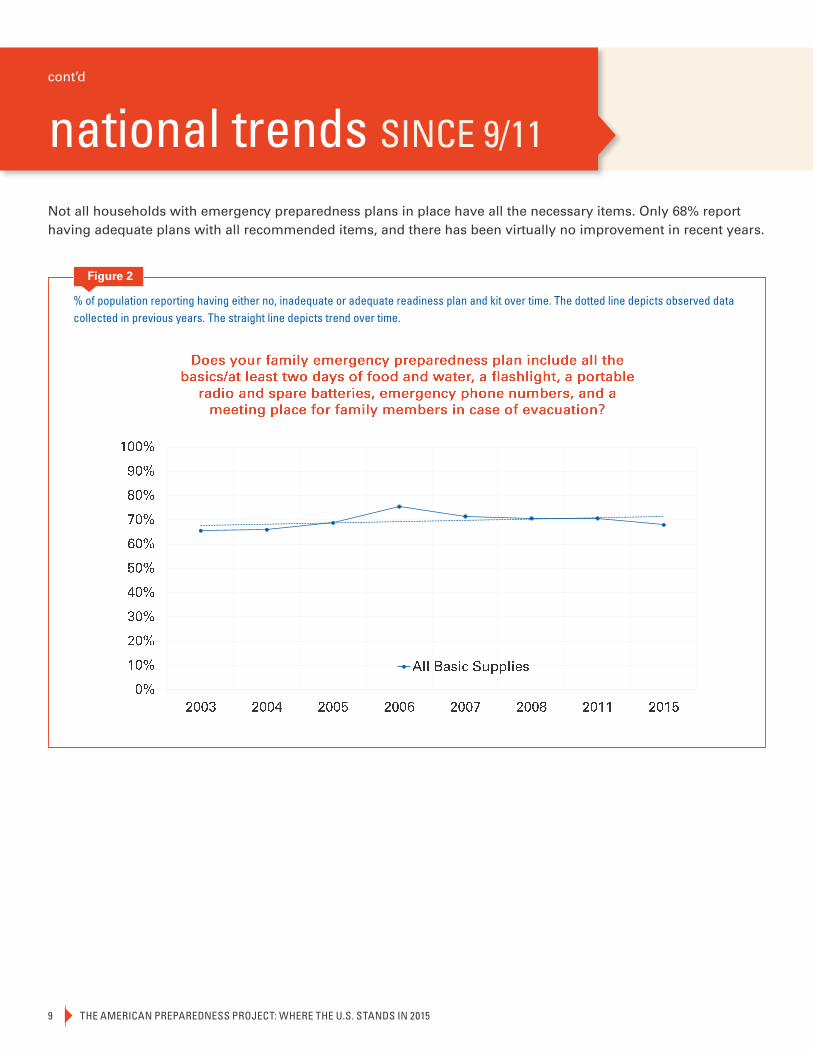
Not all households with emergency preparedness plans in place have all the necessary items. Only 68% report having adequate plans with all recommended items, and there has been virtually no improvement in recent years.
% of population reporting having either no, inadequate or adequate readiness plan and kit over time. The dotted line depicts observed data collected in previous years. The straight line depicts trend over time.
Figure 2
cont’d
national trends SINCE 9/11

THE AMERICAN PREPAREDNESS PROJECT: WHERE THE U.S. STANDS IN 2015 10
national trends SINCE 9/11
Perceived levels of community preparedness have not improved since the question was first introduced in 2007. Today, only 35% of the population believes that their community has an adequate emergency response plan cur-rently in place, a decrease from 40% in 2007. In addition, 24% of respondents report being unsure if their commu-nity currently has an adequate response plan in 2015, a substantial increase compared to all previous years.
% of population reporting disaster readiness.
Figure 3
cont’d

THE AMERICAN PREPAREDNESS PROJECT: WHERE THE U.S. STANDS IN 201511
Finally, despite the overall perception of insufficient community-level preparedness, there is an upward trend in the population’s expectations regarding first responders. The percentage of people who believe that help would arrive in less than 1 hour has increased from 32% in 2006 to 51% in 2015.
% of population reporting confidence in immediate emergency response over time. The dotted line depicts observed data collected in previous years. The straight line depicts trend over time.
Figure 4
cont’d
national trends SINCE 9/11

THE AMERICAN PREPAREDNESS PROJECT: WHERE THE U.S. STANDS IN 2015 12
national trends SINCE 9/11
Terrorism
Almost 53% of the population is not too confident, or not confident at all in the government to protect the area where they live from a terrorist attack. This is 16.4% higher compared to 2002.
% of population reporting confidence in government’s ability to protect their community in disasters over time. The dotted line depicts observed data collected in previous years. The straight line depicts trend over time.
Figure 5
cont’d

THE AMERICAN PREPAREDNESS PROJECT: WHERE THE U.S. STANDS IN 201513
national trends SINCE 9/11
83% of the population is very concerned or concerned about the possibility of there being more terror attacks in the United States, an 11% increase since 2011.
% of population concerned with possibility of more terror attacks in the U.S. over time. The dotted line depicts observed data collected in previous years. The straight line depicts trend over time.
Figure 6
cont’d

THE AMERICAN PREPAREDNESS PROJECT: WHERE THE U.S. STANDS IN 2015 14
Natural Disasters
Ten years after Hurricane Katrina, over a quarter of the population (25.6%) does not think the country is better prepared to deal with a major natural disaster now than it was before Hurricane Katrina. Compared with 2008, when the question was first asked, there is an increase of 7.5% in the population that believes the country is better prepared.
% of population reporting country preparedness in relation to past natural disasters.
Figure 7
national trends SINCE 9/11
cont’d

THE AMERICAN PREPAREDNESS PROJECT: WHERE THE U.S. STANDS IN 201515
Nearly 40% (39%) of the population is not too confident or not confident at all in the government’s ability to re-spond to a natural disaster or emergency weather event, a slight decrease since 2006.
% of population reporting little confidence in government responding to natural disasters.
Figure 8
national trends SINCE 9/11
cont’d
THE AMERICAN PREPAREDNESS PROJECT: WHERE THE U.S. STANDS IN 2015 16
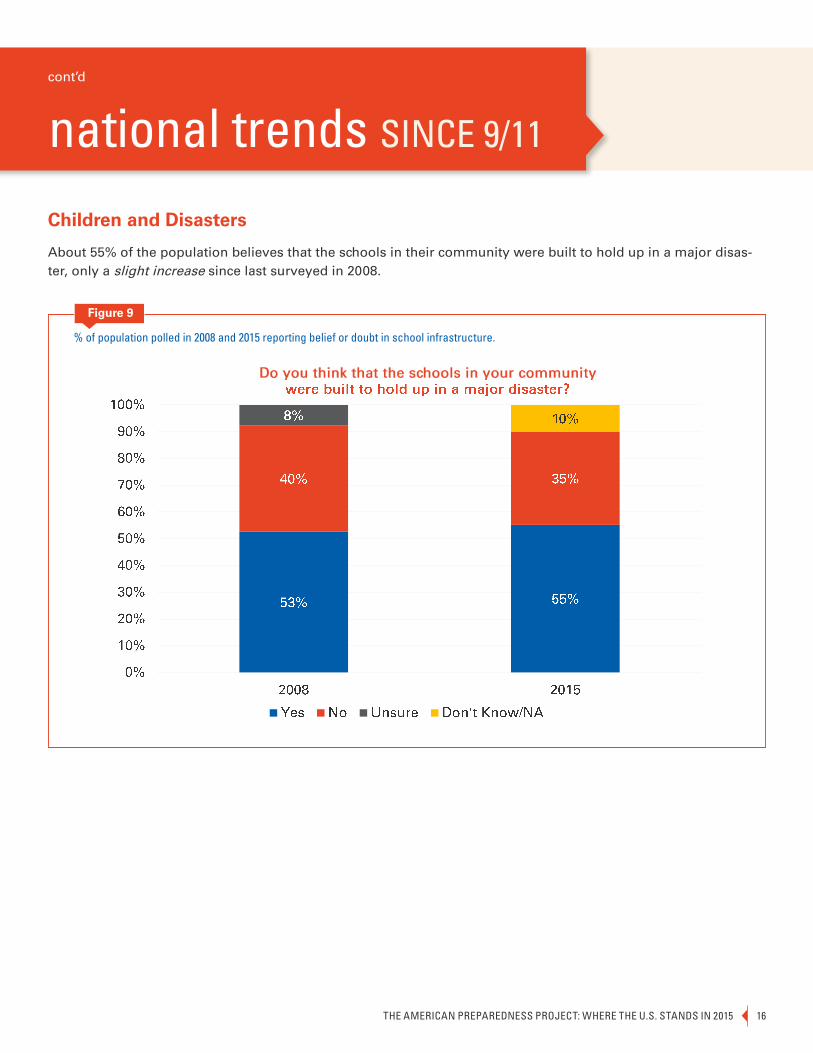
Children and Disasters
About 55% of the population believes that the schools in their community were built to hold up in a major disas-ter, only a slight increase since last surveyed in 2008.
% of population polled in 2008 and 2015 reporting belief or doubt in school infrastructure.
Figure 9
national trends SINCE 9/11
cont’d
THE AMERICAN PREPAREDNESS PROJECT: WHERE THE U.S. STANDS IN 201517
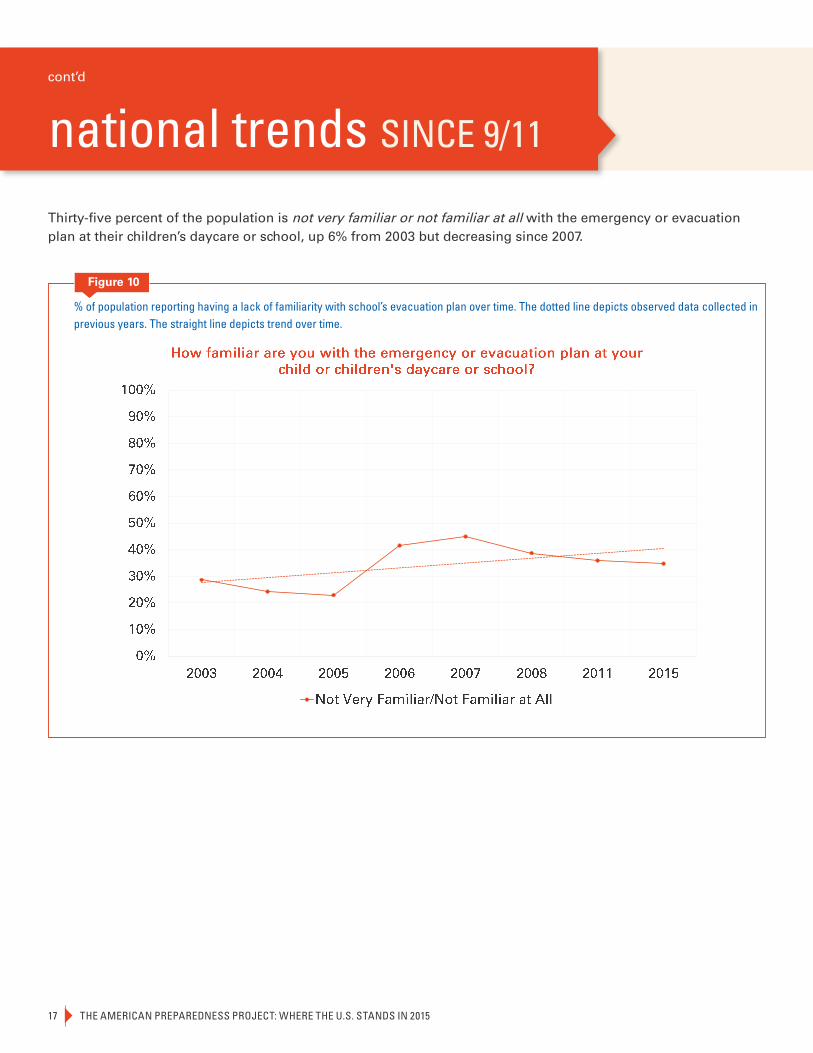
% of population reporting having a lack of familiarity with school’s evacuation plan over time. The dotted line depicts observed data collected in previous years. The straight line depicts trend over time.
Figure 10
Thirty-five percent of the population is not very familiar or not familiar at all with the emergency or evacuation plan at their children’s daycare or school, up 6% from 2003 but decreasing since 2007.
national trends SINCE 9/11
cont’d

THE AMERICAN PREPAREDNESS PROJECT: WHERE THE U.S. STANDS IN 2015 18
% of population polled in 2008 and 2015 reporting knowledge of school’s evacuation destination location.
Figure 11
43% of the population does not know or is unsure where their children would be evacuated to if their school had to evacuate. This is a slight decrease of 3% since last surveyed in 2008.
national trends SINCE 9/11
cont’d

THE AMERICAN PREPAREDNESS PROJECT: WHERE THE U.S. STANDS IN 201519
General Preparedness
The survey included questions about perceptions of general preparedness at the household and community levels. These included inquiries on household emergency preparedness as well as beliefs regarding community response plans in place in the case of terrorist attacks or natural disasters, first responder response time expecta-tions, and the government’s ability to respond adequately in the event of disaster.
50% of Americans report having a household emergency plan in place that all family members know about, a steady increase from 35% in 2003 (see Figure 1). However, only 68% of households that report having a house-hold emergency plan in place actually have plans that include all necessary items (see Figure 2).
% of population reporting having a family emergency preparedness plan.
Figure 12
Those who are married or living with a partner are much more likely to have an emergency plan that all family members are aware of (56.1%) than single people who have never been married (39.8%).
Respondents living in the Western United States are more likely than any other region to report having a family emergency preparedness plan that all members know about.
key findings IN 2015
THE AMERICAN PREPAREDNESS PROJECT: WHERE THE U.S. STANDS IN 2015 20
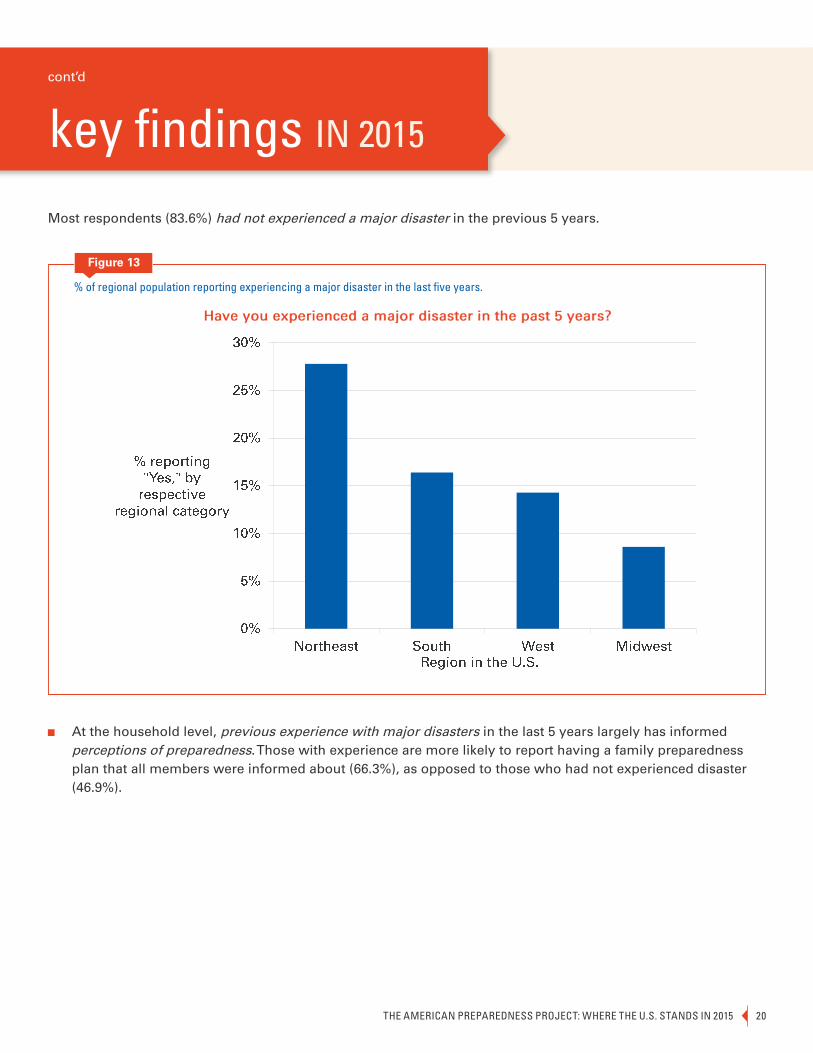
% of regional population reporting experiencing a major disaster in the last five years.
Figure 13
Most respondents (83.6%) had not experienced a major disaster in the previous 5 years.
At the household level, previous experience with major disasters in the last 5 years largely has informed perceptions of preparedness. Those with experience are more likely to report having a family preparedness plan that all members were informed about (66.3%), as opposed to those who had not experienced disaster (46.9%).
key findings IN 2015
cont’d
THE AMERICAN PREPAREDNESS PROJECT: WHERE THE U.S. STANDS IN 201521
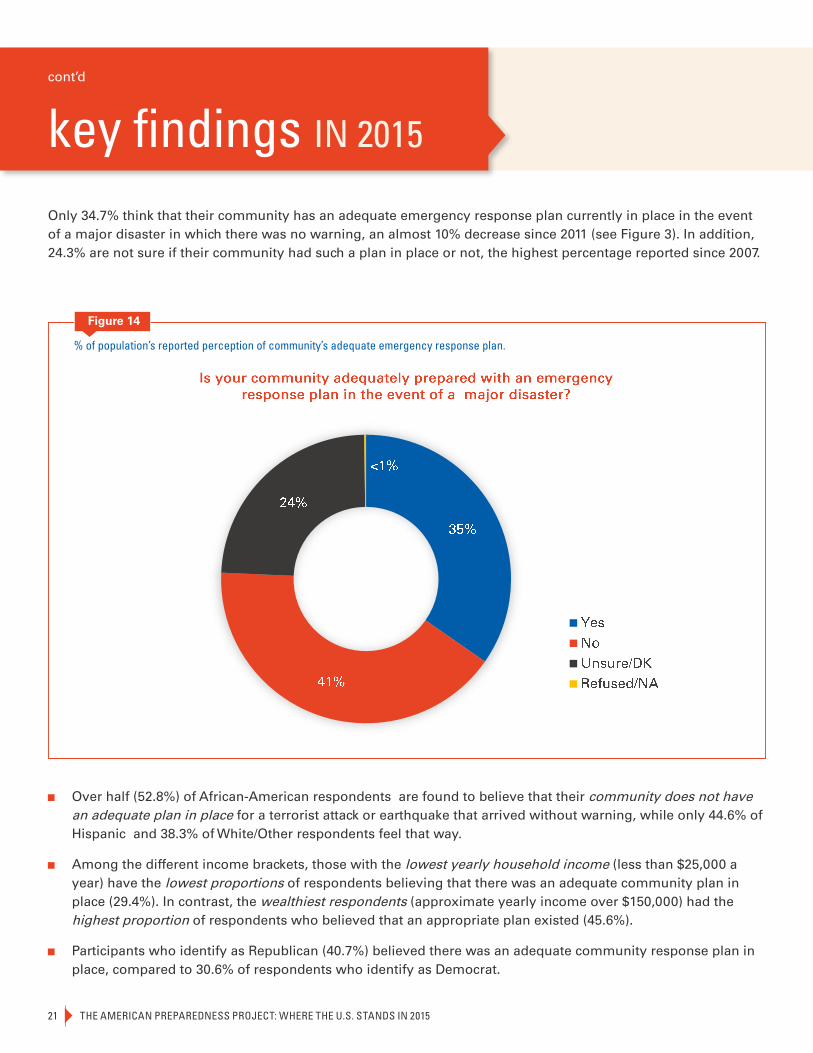
Only 34.7% think that their community has an adequate emergency response plan currently in place in the event of a major disaster in which there was no warning, an almost 10% decrease since 2011 (see Figure 3). In addition, 24.3% are not sure if their community had such a plan in place or not, the highest percentage reported since 2007.
% of population’s reported perception of community’s adequate emergency response plan.
Figure 14
Over half (52.8%) of African-American respondents are found to believe that their community does not have an adequate plan in place for a terrorist attack or earthquake that arrived without warning, while only 44.6% of Hispanic and 38.3% of White/Other respondents feel that way.
Among the different income brackets, those with the lowest yearly household income (less than $25,000 a year) have the lowest proportions of respondents believing that there was an adequate community plan in place (29.4%). In contrast, the wealthiest respondents (approximate yearly income over $150,000) had the highest proportion of respondents who believed that an appropriate plan existed (45.6%).
Participants who identify as Republican (40.7%) believed there was an adequate community response plan in place, compared to 30.6% of respondents who identify as Democrat.
key findings IN 2015
cont’d

THE AMERICAN PREPAREDNESS PROJECT: WHERE THE U.S. STANDS IN 2015 22
% of population reporting the timing of emergency response.
Figure 15
Over half of Americans believe that in the event of a major emergency, help will arrive in under 1 hour, an in-crease since 2006 (see Figure 4)
17.9% of respondents living in the Northeast report believing that following a major disaster, first responders would arrive within several hours. In comparison, over a quarter (28.4%) of respondents who live in the West believe the same.
African-American (59.7%) and Hispanic respondents (60.2%) are more likely than White/Other respondents (47.5%) to believe that first responders would be able to arrive and assist in the event of a disaster in under one hour.
key findings IN 2015
cont’d
THE AMERICAN PREPAREDNESS PROJECT: WHERE THE U.S. STANDS IN 201523
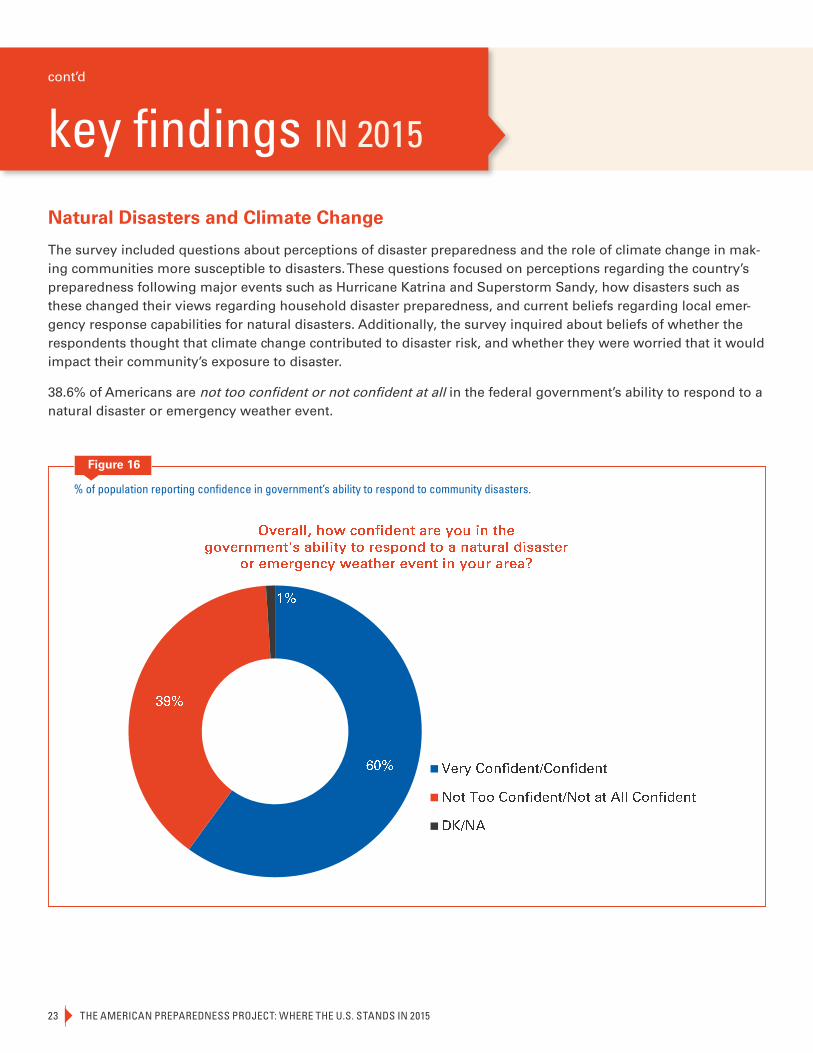
Natural Disasters and Climate Change
The survey included questions about perceptions of disaster preparedness and the role of climate change in mak-ing communities more susceptible to disasters. These questions focused on perceptions regarding the country’s preparedness following major events such as Hurricane Katrina and Superstorm Sandy, how disasters such as these changed their views regarding household disaster preparedness, and current beliefs regarding local emer-gency response capabilities for natural disasters. Additionally, the survey inquired about beliefs of whether the respondents thought that climate change contributed to disaster risk, and whether they were worried that it would impact their community’s exposure to disaster.
38.6% of Americans are not too confident or not confident at all in the federal government’s ability to respond to a natural disaster or emergency weather event.
% of population reporting confidence in government’s ability to respond to community disasters.
Figure 16
key findings IN 2015
cont’d
THE AMERICAN PREPAREDNESS PROJECT: WHERE THE U.S. STANDS IN 2015 24
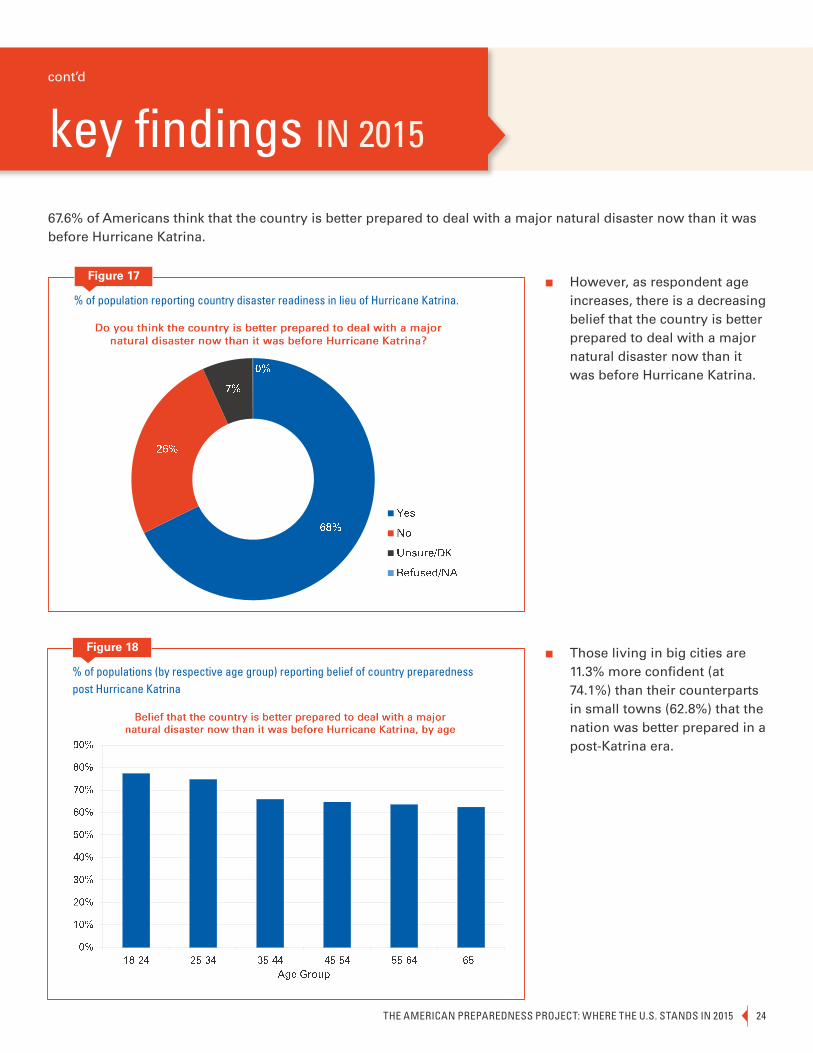
% of population reporting country disaster readiness in lieu of Hurricane Katrina.
Figure 17
67.6% of Americans think that the country is better prepared to deal with a major natural disaster now than it was before Hurricane Katrina.
However, as respondent age increases, there is a decreasing belief that the country is better prepared to deal with a major natural disaster now than it was before Hurricane Katrina.
% of populations (by respective age group) reporting belief of country preparedness post Hurricane Katrina
Figure 18 Those living in big cities are 11.3% more confident (at 74.1%) than their counterparts in small towns (62.8%) that the nation was better prepared in a post-Katrina era.
key findings IN 2015
cont’d

THE AMERICAN PREPAREDNESS PROJECT: WHERE THE U.S. STANDS IN 201525
50.2% report that major natural disasters such as Hurricane Katrina or Superstorm Sandy changed how they view their household’s preparedness for disasters.
% of population reporting no change or changed perception of personal household disaster prepraredness.
Figure 19
The Northeast has the highest proportion of respondents, compared to other regions in the U.S., who report having their views on their household preparedness changed after disasters such Superstorm Sandy and Hurricane Katrina.
key findings IN 2015
cont’d

THE AMERICAN PREPAREDNESS PROJECT: WHERE THE U.S. STANDS IN 2015 26
% of regional population reporting changed perception of household preparedness.
Figure 20
African-American respondents are most likely to report having changed views regarding household prepared-ness (62.1%) compared to Hispanic (52.8%) and White/Other (47.7%) respondents.
Those living in rural areas are least likely to have had their opinions on household preparedness changed after disasters such as Superstorm Sandy or Hurricane Katrina, and are also the most likely to report that they felt their household was ready for a disaster (65%, compared to 51.9% of big city respondents).
key findings IN 2015
cont’d

THE AMERICAN PREPAREDNESS PROJECT: WHERE THE U.S. STANDS IN 201527
66.9% of Americans express some level of worry that climate change is contributing to more frequent and severe natural disasters; 20% of them are worried a lot. Similarly, 65.2% express some level of worry that climate change will impact their community’s exposure to disasters, and 13% overall are very worried.
% of population reporting worry about climate change contributing frequent and sever disasters.
Figure 21
% of population reporting levels of worry about climate change impacts to their community.
Figure 22
key findings IN 2015
cont’d

THE AMERICAN PREPAREDNESS PROJECT: WHERE THE U.S. STANDS IN 2015 28
Those who had experienced a major disaster in the past 5 years are significantly more likely to respond that they worry a lot that climate change would impact their community’s exposure to disasters, compared to those who had not (24.3% versus 11.3%).
Women are consistently more likely than men to report being concerned about the impacts of climate change.. While 39.9% of men report being not worried at all that climate change is contributing to more frequent and severe natural disasters, only 25.1% of women report feeling the same way. Additionally, while 24.4% of women report worrying a fair amount that climate change would impact their community’s exposure to disasters, only 14.7% of male respondents feel the same way.
African-American respondents are markedly more likely to report that they worry a lot that climate change would impact their community’s exposure to disasters (24.6%) than Hispanic (20.1%) and White/Other respon-dents (10.3%).
Those with a household income of less than $25,000 a year are most likely to report worrying a lot about climate change contributing to more frequent and severe natural disasters (28%) and impacting their com-munity’s exposure to disasters ( 21.5%). Conversely, those making over $150,000 are least likely to report this same level of concern about climate change contributing to more frequent and severe natural disasters (11.2% ) and impacting their community’s exposure to disasters (6.8%). In fact, 51.1% of the wealthiest group report feeling not worried at all about climate change contributing to more frequent and natural disasters, and 57.2% report not worrying at all that climate change would impact their community’s exposure to disasters.
While respondents who identify as Democrat are most likely to report worrying a lot about climate change’s contribution to more frequent and severe natural disasters (30.7%), those who identify as Republican are most likely to report feeling not at all worried (51.2%).
key findings IN 2015
cont’d

THE AMERICAN PREPAREDNESS PROJECT: WHERE THE U.S. STANDS IN 201529
Terrorism
The survey included two questions about perceptions of vulnerability to and protection from terrorist attacks in the United States. These questions surveyed how concerned respondents are about the possibility of more ter-ror attacks in the U.S., and how confident they feel in the government’s ability to protect their area of residence. Again, it is worth noting that this survey was administered in the period shortly following the November 15th, 2015 terrorist attacks in Paris, and for some respondents, after the San Bernardino terrorist attack on December 2nd, 2015.
83.4% of Americans report feeling concerned or very concerned about the possibility of there being more terror at-tacks in the United States. Additionally, 52.9% report being not very confident or not confident at all in the govern-ment’s ability to protect the area where they live from a terrorist attack. Although concern about terrorist attacks has fluctuated over time, no trend can be detected (see Figure 6). Similarly, trust in the government has fluctuated over time but an increasing percentage of the population is not feeling confident in the government’s ability to protect the area where they live (see Figure 5).
% of population reporting levels of concern over possibility of more terror attacks in the U.S.
Figure 23
91% of respondents who identify as Republican report feeling concerned/very concerned about the possibility of a terror attack in the U.S., while 81% of Democrats report feeling this level of worry.
key findings IN 2015
cont’d

THE AMERICAN PREPAREDNESS PROJECT: WHERE THE U.S. STANDS IN 2015 30
% of population reporting levels of confidence in government protection against community terror attacks.
Figure 24
Women are more likely than men to report feeling very concerned about the possibility of there being more terror attacks in the United States (55.1% versus 44.7%). They are also less confident than men in the govern-ment’s ability to protect their area of residence from an attack.
The 35 to 44 age group is much more likely than the 18 to 24 age group to report feeling very concerned about the possibility of more terror attacks in the United States (57.7% versus 36%). They are also more likely to report feeling not too confident about the government’s ability to protect their area of residence from an attack, compared to the youngest 18 to 24 age group (26.4% versus 11%).
While respondents from small cities are the most likely to respond feeling confident/very confident in the government to protect the area where they live from a terrorist attack (50%), those from rural areas are least likely to share the sentiment (33%).
key findings IN 2015
cont’d

THE AMERICAN PREPAREDNESS PROJECT: WHERE THE U.S. STANDS IN 201531
Children and Disasters
The survey also included child-focused questions, surveying perceptions regarding the community’s ability to meet the needs of children, familiarity with emergency and evacuation plans at children’s daycares and schools, and expectations about reunification with children and resuming normal activities at child serving institutions in the aftermath of a disaster.
Only 47% of Americans report being confident or very confident in the federal government’s ability to meet the unique needs of children in disasters, while 51% do not feel too confident or not confident at all.
% of population reporting confidence in the government’s ability to serve children’s needs in disasters.
Figure 25
Hispanic respondents are most likely to respond being not too confident or not confident at all (55%) followed by White/Other (51%) and African American (47%) respondents.
key findings IN 2015
cont’d
THE AMERICAN PREPAREDNESS PROJECT: WHERE THE U.S. STANDS IN 2015 32
% of population reporting confidence in the community’s ability to serve children’s needs in disasters.
Figure 26
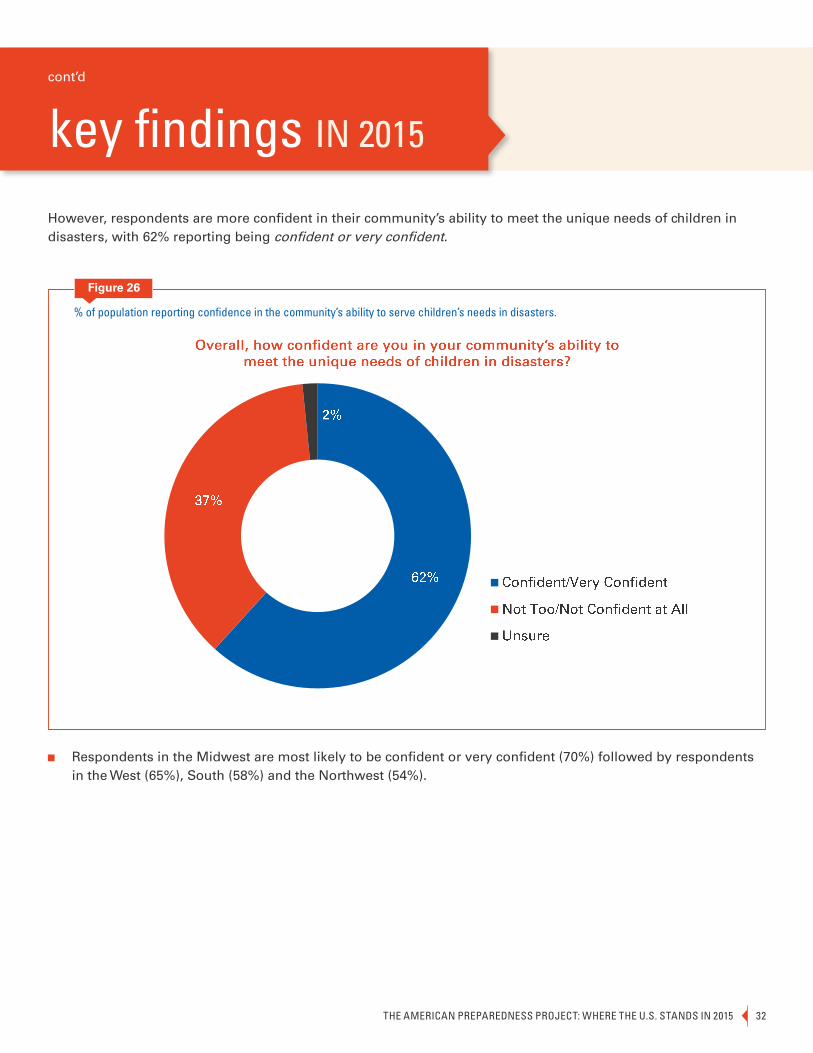
However, respondents are more confident in their community’s ability to meet the unique needs of children in disasters, with 62% reporting being confident or very confident.
Respondents in the Midwest are most likely to be confident or very confident (70%) followed by respondents in the West (65%), South (58%) and the Northwest (54%).
key findings IN 2015
cont’d

THE AMERICAN PREPAREDNESS PROJECT: WHERE THE U.S. STANDS IN 201533
% of population reporting confidence about inclusion of child-serving institutions in community’s disaster plan.
Figure 27
In addition, nearly two-thirds (57.3%) of U.S. respondents express confidence in child-serving institution being included as part of their community’s disaster plan.
Participants from the Midwest (63%) are most likely and participants from the Northeast are least likely (46.6%) to be confident or very confident.
key findings IN 2015
cont’d

THE AMERICAN PREPAREDNESS PROJECT: WHERE THE U.S. STANDS IN 2015 34
% of population reporting expectations about the timing of being reunited with children after a disaster.
Figure 28
Over half of U.S. parents are confident they’d be reunited with their children within several hours after a major disaster, while only 2% believe it would take more than several days to reunite with their children.
key findings IN 2015
cont’d

THE AMERICAN PREPAREDNESS PROJECT: WHERE THE U.S. STANDS IN 201535
% of population reporting knowledge of school’s evacuation destination location.
Figure 29
In the event of a major disaster, 41% of American households with children (n= 365) do not know the location to which their child would be evacuated as part of their school’s disaster plan. This is despite the fact that 64.5% of parents say they are familiar with their school’s plan (See Figure 31).
key findings IN 2015
cont’d

THE AMERICAN PREPAREDNESS PROJECT: WHERE THE U.S. STANDS IN 2015 36
% of population (by size of town) reporting knowledge of evacuation destination at schools.
Figure 30
Respondents in big cities are least likely (47%) to know their child’s evacuation point.
key findings IN 2015
cont’d
THE AMERICAN PREPAREDNESS PROJECT: WHERE THE U.S. STANDS IN 201537
% of population reporting having familiarity with school’s evacuation plan.
Figure 31
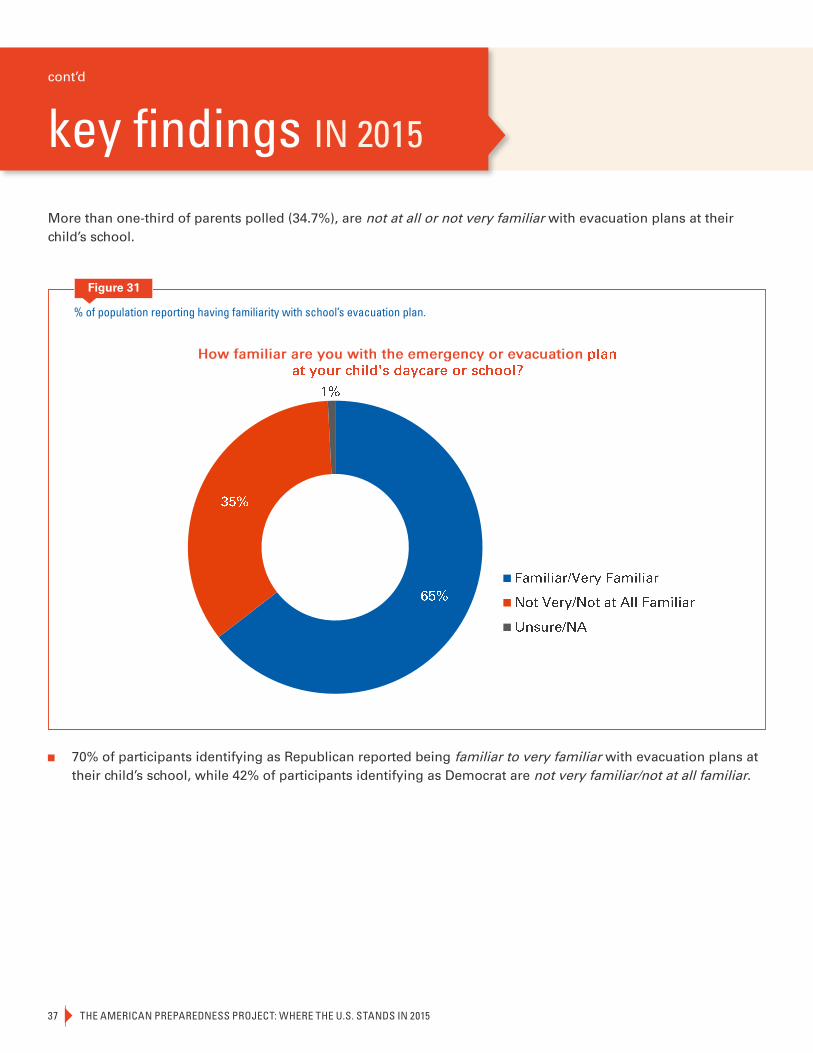
More than one-third of parents polled (34.7%), are not at all or not very familiar with evacuation plans at their child’s school.
70% of participants identifying as Republican reported being familiar to very familiar with evacuation plans at their child’s school, while 42% of participants identifying as Democrat are not very familiar/not at all familiar.
key findings IN 2015
cont’d
THE AMERICAN PREPAREDNESS PROJECT: WHERE THE U.S. STANDS IN 2015 38
% of population reporting strength in community infrastructure.
Figure 32
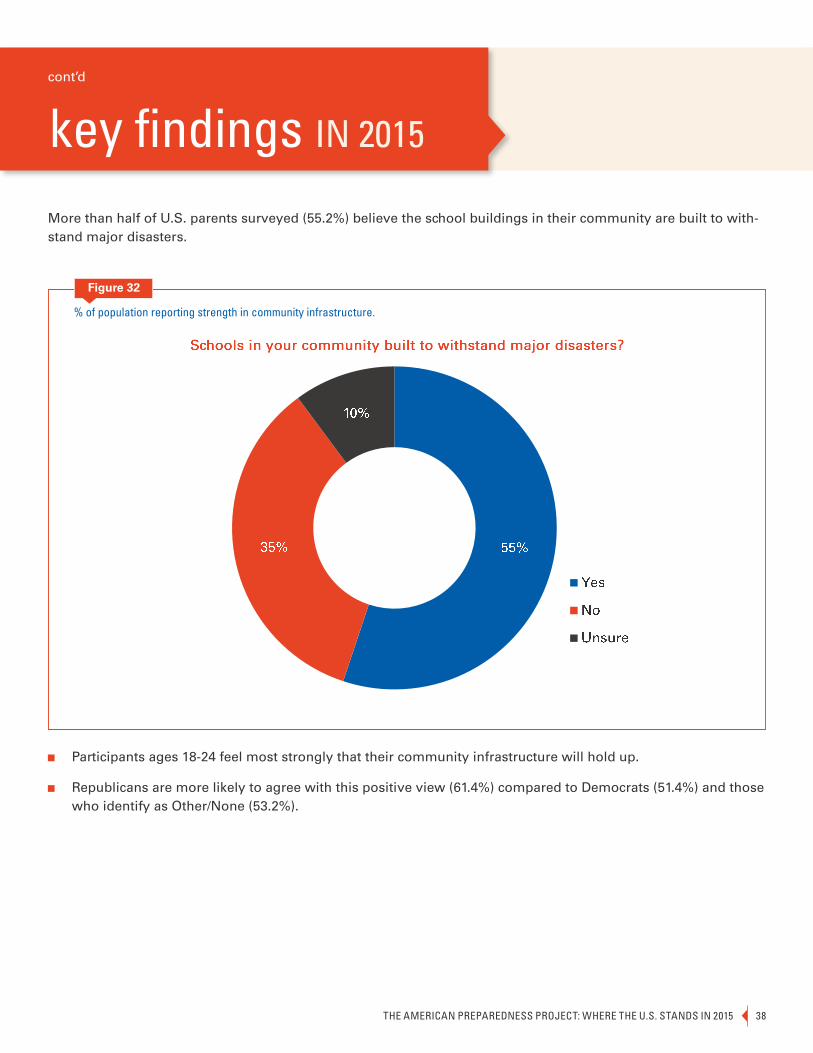
More than half of U.S. parents surveyed (55.2%) believe the school buildings in their community are built to with-stand major disasters.
Participants ages 18-24 feel most strongly that their community infrastructure will hold up.
Republicans are more likely to agree with this positive view (61.4%) compared to Democrats (51.4%) and those who identify as Other/None (53.2%).
key findings IN 2015
cont’d
THE AMERICAN PREPAREDNESS PROJECT: WHERE THE U.S. STANDS IN 201539
% of population reporting concerns over terrorism against child-serving institutions.
Figure 33
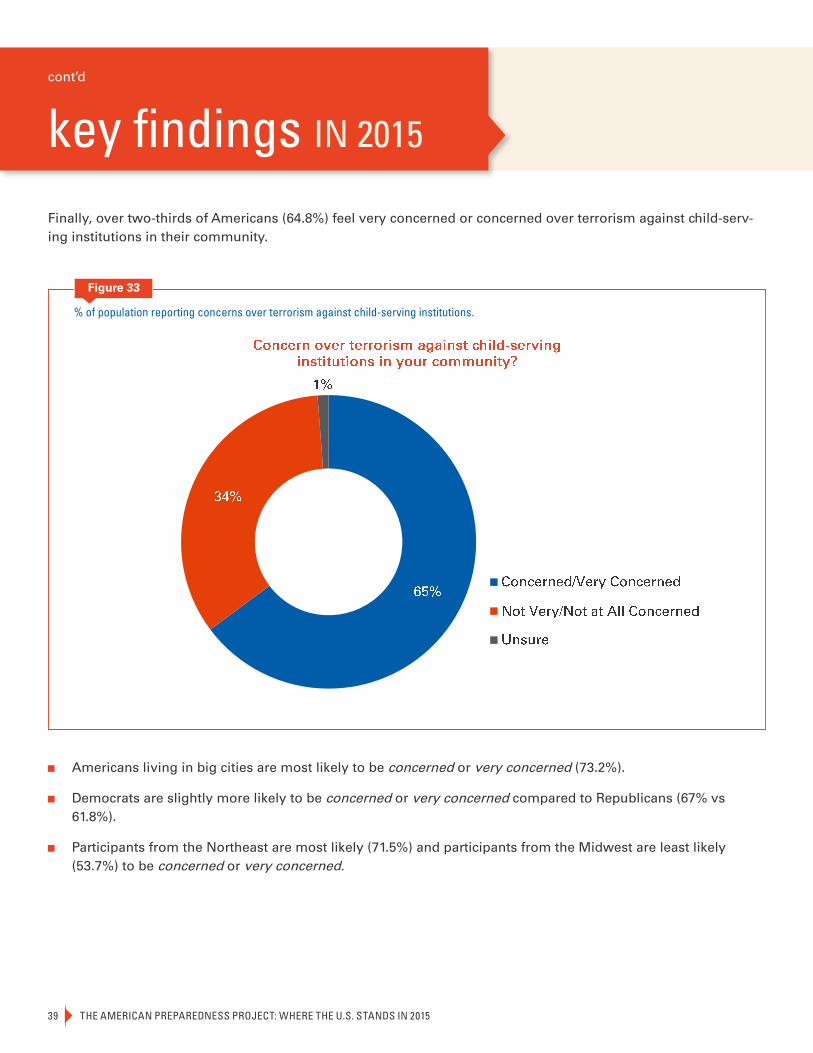
Finally, over two-thirds of Americans (64.8%) feel very concerned or concerned over terrorism against child-serv-ing institutions in their community.
Americans living in big cities are most likely to be concerned or very concerned (73.2%).
Democrats are slightly more likely to be concerned or very concerned compared to Republicans (67% vs 61.8%).
Participants from the Northeast are most likely (71.5%) and participants from the Midwest are least likely (53.7%) to be concerned or very concerned.
key findings IN 2015
cont’d

THE AMERICAN PREPAREDNESS PROJECT: WHERE THE U.S. STANDS IN 2015 40
cont’d
conclusions & RECOMMENDATIONS
The report presented data from the American Preparedness Project survey that has been administered eight times since the launch of the project in 2002. Although the general preparedness of American households has improved slowly but steadily over time, two thirds still do not have adequate preparedness plans in place that all family members know about. Familiarity with school preparedness and evacuation plans among American households with children has also improved only marginally. Furthermore, 14 years after 9/11 and 10 years after Hurricane Katrina, the overwhelming majority of Americans remain concerned about future terrorist attacks and many lack trust in the government’s ability to respond to terrorist attacks and natural disasters. Finally, the majority of Americans are currently worried about the impact of climate change on natural disasters and the potential impacts on their communities.
More frequent administration of the American Preparedness Project survey could be beneficial in monitoring progress in disaster planning and preparedness at the household, community, and national levels over time, the aftermath of disasters or after the implementation of specific interventions and policies. Since the survey has been carried out using the phone-based Random Digit Dial method to date, more frequent administration has not been possible due to cost constraints. NCDP is currently carting out a comparative assessment of various web, phone and mixed-mode survey methodologies in order to determine the most efficient and reliable approach to conducting the survey in years to come.
It is important to note that the data presented in this report reflect public perceptions and opinions on disaster preparedness, and that these perceptions may not reflect the actual level of disaster planning and preparedness. Members of the preparedness, policy, and practice communities should examine these findings to consider ways to more effectively communicate with individuals and households in their community and to integrate various organizations and stakeholders into preparedness programs.
Specific recommendations include:
Individuals and households should invest more into ensuring their preparedness in a disaster. Although additional financial investment may be out of reach for many families, seeking information from local emer-gency management, first responders, and child-serving institutions could yield more understanding of response capabilities and expectations. This would then allow for more targeted and effective household-level preparedness. Where resources or planning falls short, this investment may take the form of advocating for additional resources for their community and encouraging the development of answers to their preparedness questions.
Governmental agencies should cooperate with trusted community leaders and organizations in order to ensure better community and individual engagement in disaster planning. In identifying ways to enhance community and individual participation in planning efforts, there should be a particular emphasis on what is assumed and what can realistically be expected in the response during a disaster. Such active community and individual engagement could also lead to increased confidence in the government’s response to disasters.
The impact of climate change on disasters should be better understood and integrated into communications and preparedness programs. Since Americans are not only worried about the impacts of climate change on disasters but also about the potential impacts in their communities, planners can collaborate with local community organizations because they can play a role in better understanding specific concerns and address them in the disaster planning process.
THE AMERICAN PREPAREDNESS PROJECT: WHERE THE U.S. STANDS IN 201541
cont’d
conclusions & RECOMMENDATIONS
Preparedness programs could benefit from taking into consideration the disparities in responses from dif-ferent geographic, socio-economic and other strata of the presented data to better target programs for popu-lations that that have insufficient trust in government and/or community and/or are more concerned about their vulnerability. Emergency planners could review these data and consider a similar analysis for their communities to better understand the expectations and potential behaviors in a disaster, and of individuals in their areas of responsibility.
First responders should work with their communities to ensure that they are prepared to meet the response expectations of their community in a disaster. Community members could also be educated on the factors that will impact the timeline for response if expectations are not realistic. Outreach to all members of the community should also be integrated into and enhanced as part of preparedness programs.
cont’d
THE AMERICAN PREPAREDNESS PROJECT: WHERE THE U.S. STANDS IN 2015 42
APPENDIX PREPAREDNESS SURVEY DATA TABLES

QUESTION 1. IN THE EVENT OF A MAJOR DISASTER WHERE THERE WAS NO WARNING SUCH AS A TERRORIST ATTACK OR EARTHQUAKE, DO YOU THINK YOUR COMMUNITY HAS AN ADEQUATE EMERGENCY RESPONSE PLAN CURRENTLY IN PLACE, OR NOT? [N=1048]
Yes, this is adequate No, is not adequate Unsure/Don’t Know Refused Not Applicable # of Resp
# Resp Col % # Resp Col % # Resp Col % # Resp Col % # Resp Col % Total
TOTAL 364 34.7% 430 41.0% 253 24.1% 2 .2% 1048
Sex
Men 194 38.1% 204 40.1% 109 21.4% 0 .1% 2 .3% 508
Women 170 31.5% 226 41.8% 144 26.7% 540
Age
18-24 38 27.9% 61 44.7% 37 27.4% 136
25-34 63 34.6% 81 44.5% 36 19.9% 2 1.0% 182
35-44 63 33.9% 79 42.8% 43 23.4% 185
45-54 73 36.4% 74 36.9% 54 26.7% 201
55-64 60 36.6% 70 42.6% 34 20.8% 163
65+ 67 37.1% 65 36.0% 48 26.7% 180
Ethnicity
White/Other 279 36.1% 296 38.3% 195 25.3% 2 .2% 773
African-American 40 30.5% 70 52.8% 22 16.7% 132
Hispanic 44 30.9% 64 44.6% 35 24.5% 143
Region
Northeast 55 29.5% 82 43.6% 51 26.9% 188
Midwest 82 36.1% 89 39.0% 56 24.8% 227
South 136 34.8% 174 44.7% 77 19.9% 2 .5% 389
West 91 37.2% 85 34.9% 68 28.0% 244
Area
Big City 88 37.9% 87 37.4% 58 24.7% 233
Small City 58 30.4% 80 42.1% 52 27.6% 190
Suburban 69 37.6% 66 36.3% 46 25.1% 2 1.0% 182
Small town 82 33.8% 98 40.8% 61 25.2% 241
Rural Area 61 31.8% 97 50.4% 34 17.7% 192
NA 6 68.0% 1 11.3% 2 20.7% 9
Political Party
Democrat 145 30.6% 202 42.7% 126 26.6% 474
Republican 149 40.7% 149 40.7% 68 18.5% 365
Other/None 70 33.4% 79 37.6% 59 28.1% 2 .8% 209
Annual Income
Less than $25,000 53 29.4% 75 41.3% 51 28.3% 2 1.0% 181
Between $25,000 and $50,000
69 33.1% 89 43.0% 50 23.9% 207
Between $50,000 and $75,000
58 34.3% 74 43.7% 37 22.0% 169
Between $75,000 and $100,000
56 43.5% 47 36.2% 26 20.2% 129
Between $100,000 and $150,000
37 35.7% 42 40.3% 25 24.0% 105
Or over $150,000 35 45.6% 27 35.1% 15 19.3% 78
Refused/DK/NA 55 30.6% 76 42.2% 48 27.0% 179
Highest Level of Education Attained
High school or less 78 29.7% 112 42.6% 73 27.7% 263
Vocational or technical school/some college
124 34.3% 158 43.6% 79 21.7% 2 .5% 363
Four year college degree/some graduate credits
95 39.0% 92 37.8% 57 23.2% 244
Advanced degree (MA, MBA, PhD, etc.)
61 36.6% 64 38.4% 42 25.1% 166
Other/Refused 5 41.6% 4 30.8% 3 24.6% 12
Marital Status
Single, never married 83 31.7% 115 44.1% 61 23.5% 2 .7% 262
Married/Living with Do-
mestic Partner/Partner
227 38.5% 223 37.9% 139 23.5% 589
Separated/Divorced/
Widowed
47 26.3% 85 47.4% 47 26.3% 180
Refused/DK/NA 6 37.3% 5 31.8% 5 30.9% 17

QUESTION 2. IN THE EVENT OF A MAJOR DISASTER IN YOUR COMMUNITY, SUCH AS A TERRORIST ATTACK OR A CATASTROPHIC NATURAL DISASTER, HOW LONG DO YOU BELIEVE IT WILL TAKE FIRST RESPONDERS, SUCH AS FIRE, POLICE, PARAMEDICS, OR OTHERS SUCH AS THE NATIONAL GUARD TO ARRIVE AND ASSIST YOU IF NEEDED? [N=1048]
Under 1 hour Within several hours Within a day Within several days Never Unsure/DK Not ap-plicable
# of Resp
# of resp Col % # of resp
Col % # of resp
Col % # of resp Col % # of resp
Col %
# of resp
Col % # of resp
Col %
Total
TOTAL 532 50.8% 253 24.1% 118 11.2% 88 8.4% 11 1.0% 46 4.4% 1 .1% 1048
Sex
Men 256 50.3% 119 23.5% 61 12.0% 39 7.7% 7 1.4% 25 4.9% 1 .2% 508
Women 277 51.2% 133 24.7% 57 10.5% 49 9.0% 3 .6% 21 4.0% 540
Age
18-24 77 56.5% 42 30.8% 9 6.7% 7 5.1% 1 1.0% 136
25-34 87 47.7% 52 28.6% 20 10.8% 17 9.3% 6 3.0% 1 .6% 182
35-44 87 47.0% 52 28.3% 26 13.9% 11 6.0% 1 .6% 8 4.2% 185
45-54 112 55.4% 28 14.0% 23 11.6% 20 10.1% 5 2.6% 13 6.4% 201
55-64 70 43.0% 43 26.3% 24 14.6% 17 10.4% 2 1.5% 7 4.3% 163
65+ 99 55.4% 35 19.5% 16 8.9% 15 8.6% 2 1.0% 12 6.6% 180
Ethnicity
White/Other 367 47.5% 194 25.1% 98 12.7% 66 8.6% 8 1.0% 38 4.9% 1 .1% 773
African-American 79 59.7% 28 20.9% 13 9.9% 7 5.5% 5 4.0% 132
Hispanic 86 60.2% 31 21.4% 6 4.3% 14 9.8% 3 1.9% 3 2.4% 143
Region
Northeast 103 54.9% 34 17.9% 24 12.8% 13 7.0% 3 1.4% 10 5.4% 1 .5% 188
Midwest 114 50.2% 59 26.1% 29 12.6% 15 6.6% 2 .8% 8 3.7% 227
South 202 51.8% 90 23.2% 38 9.8% 35 9.1% 5 1.4% 18 4.7% 389
West 113 46.5% 69 28.4% 26 10.9% 24 10.0% 1 .3% 10 3.9% 244
Area
Big City 126 54.1% 52 22.4% 27 11.8% 20 8.8% 1 .3% 6 2.7% 233
Small City 105 55.5% 51 26.6% 17 8.7% 8 4.0% 1 .5% 9 4.6% 190
Suburban 93 50.9% 50 27.3% 14 7.7% 11 6.1% 3 1.8% 10 5.6% 1 .6% 182
Small town 131 54.2% 52 21.6% 22 9.1% 23 9.5% 2 .6% 12 5.0% 241
Rural Area 72 37.6% 47 24.3% 36 18.7% 26 13.4% 4 2.1% 8 4.0% 192
NA 5 55.2% 1 13.3% 2 18.8% 1 12.7% 9
Political Party
Democrat 249 52.5% 114 24.1% 53 11.1% 40 8.4% 2 .3% 17 3.6% 474
Republican 174 47.8% 93 25.5% 52 14.2% 28 7.6% 6 1.5% 11 3.1% 1 .3% 365
Other/None 109 52.1% 45 21.7% 13 6.2% 20 9.7% 3 1.6% 18 8.6% 209
Annual Income
Less than $25,000 96 53.0% 42 23.4% 12 6.9% 15 8.5% 6 3.3% 9 5.0% 181
Between $25,000 and $50,000
104 50.3% 48 23.2% 30 14.3% 15 7.3% 1 .3% 10 4.6% 207
Between $50,000 and $75,000
88 52.3% 44 25.9% 21 12.3% 14 8.3% 1 .3% 2 .9% 169
Between $75,000 and $100,000
51 39.9% 49 37.7% 18 14.2% 9 6.8% 1 .6% 1 .8% 129
Between $100,000 and $150,000
56 53.7% 21 20.3% 13 12.8% 11 10.2% 3 2.9% 105
Or over $150,000 36 46.0% 15 19.0% 12 15.3% 7 8.7% 2 2.0% 7 9.0% 78
Refused/DK/NA 100 55.9% 34 18.8% 11 6.2% 17 9.6% 1 .6% 15 8.3% 1 .6% 179
Highest Level of Education Attained
High school or less 133 50.6% 68 25.7% 25 9.5% 17 6.5% 4 1.7% 16 6.0% 263
Vocational or technical school/some college
189 52.0% 86 23.7% 37 10.1% 37 10.1% 2 .6% 13 3.5% 363
Four year college degree/some graduate credits
119 48.8% 64 26.1% 30 12.2% 19 7.7% 1 .5% 10 4.2% 1 .4% 244
Advanced degree (MA, MBA, PhD, etc.)
86 52.1% 34 20.3% 23 13.9% 14 8.5% 3 1.6% 6 3.7% 166
Other/Refused 5 41.5% 1 11.6% 3 23.8% 1 10.7% 2 12.5% 12
Marital Status
Single, never married 144 55.0% 68 26.0% 20 7.7% 16 6.2% 2 .6% 11 4.2% 1 .4% 262
Married/Living with Do-mestic Partner/Partner
291 49.3% 144 24.4% 78 13.2% 52 8.8% 8 1.3% 18 3.1% 589
Separated/Divorced/Widowed
92 51.1% 36 20.1% 18 9.8% 18 10.0% 1 .7% 15 8.3% 180
Refused/DK/NA 6 34.2% 4 26.7% 2 13.2% 2 11.9% 2 14.0% 17

QUESTION 3. DO YOU HAVE A FAMILY EMERGENCY PREPAREDNESS PLAN THAT ALL FAMILY MEMBERS KNOW ABOUT? [N=1048]
Yes No Unsure/DK Not applicable # of Resp
# of resp Col % # of resp Col % # of resp Col % # of resp Col % Total
TOTAL 525 50.1% 512 48.8% 10 .9% 2 .2% 1048
Sex
Men 273 53.8% 230 45.3% 4 .8% 1 .1% 508
Women 252 46.6% 281 52.1% 6 1.0% 1 .3% 540
Age
18-24 62 45.8% 71 52.1% 3 2.2% 136
25-34 84 45.8% 99 54.2% 182
35-44 98 52.8% 87 47.2% 185
45-54 106 52.9% 92 45.6% 3 1.5% 201
55-64 82 50.2% 79 48.5% 1 .8% 1 .5% 163
65+ 93 51.7% 83 46.4% 2 1.3% 1 .6% 180
Ethnicity
White/Other 399 51.6% 366 47.3% 6 .8% 2 .2% 773
African-American 65 49.2% 66 50.1% 1 .6% 132
Hispanic 61 42.4% 79 55.5% 3 2.1% 143
Region
Northeast 90 47.6% 95 50.5% 3 1.8% 188
Midwest 109 47.9% 113 49.6% 5 2.3% 1 0.2% 227
South 189 48.7% 199 51.2% 1 .1% 389
West 137 56.3% 105 43.0% 1 0.6% 244
Area
Big City 116 49.6% 115 49.2% 3 1.3% 233
Small City 81 42.8% 109 57.2% 190
Suburban 97 53.4% 84 46.1% 1 .3% 182
Small town 119 49.3% 118 48.9% 4 1.6% 1 .2% 241
Rural Area 107 55.5% 83 43.1% 2 1.0% 1 .4% 192
NA 5 56.2% 3 38.1% 1 5.7% 9
Political Party
Democrat 212 44.7% 261 55.1% 1 .1% 1 .2% 474
Republican 195 53.5% 163 44.6% 6 1.7% 1 .2% 365
Other/None 118 56.4% 88 42.0% 3 1.3% 1 .3% 209
Annual Income
Less than $25,000 82 45.4% 98 53.8% 1 .6% 1 .3% 181
Between $25,000 and $50,000 101 48.9% 104 50.3% 2 .8% 207
Between $50,000 and $75,000 85 50.7% 82 48.9% 1 .5% 169
Between $75,000 and $100,000 64 49.8% 65 50.2% 129
Between $100,000 and $150,000 59 56.4% 45 43.1% 1 .5% 105
Or over $150,000 40 51.7% 37 48.3% 78
Refused/DK/NA 92 51.5% 80 44.6% 6 3.6% 1 .3% 179
Highest Level of Education Attained
High school or less 116 44.2% 145 55.0% 2 .8% 263
Vocational or technical school/some college 197 54.2% 160 44.0% 5 1.4% 1 .4% 363
Four year college degree/some graduate credits
117 47.8% 127 52.0% 1 .2% 244
Advanced degree (MA, MBA, PhD, etc.) 88 53.3% 76 46.1% 1 .4% 166
Other/Refused 7 55.5% 4 32.0% 2 12.5% 12
Marital Status
Single, never married 104 39.8% 153 58.3% 4 1.4% 1 .5% 262
Married/Living with Domestic Partner/Partner
331 56.1% 258 43.7% 1 .2% 589
Separated/Divorced/Widowed 83 46.0% 94 52.0% 3 1.7% 1 .3% 180
Refused/DK/NA 7 42.5% 8 45.7% 2 11.8% 17

QUESTION 4. DOES YOUR FAMILY EMERGENCY PREPAREDNESS PLAN INCLUDE ALL, SOME, OR NONE OF THE FOLLOWING: AT LEAST TWO DAYS OF FOOD AND WATER, A FLASHLIGHT, A PORTABLE RADIO AND SPARE BATTERIES, EMERGENCY PHONE NUMBERS, AND A MEETING PLACE FOR FAMILY MEMBERS IN CASE OF EVACUATION? [N=525]
All Some None # of Resp
# of resp Col % # of resp Col % # of resp Col % Total
TOTAL 357 67.9% 157 30.0% 11 2.1% 525
Sex
Men 205 74.9% 67 24.4% 2 .7% 273
Women 152 60.4% 91 36.0% 9 3.6% 252
Age
18-24 36 57.3% 27 42.7% 62
25-34 47 56.3% 32 37.8% 5 5.9% 84
35-44 66 68.0% 31 32.0% 98
45-54 81 76.2% 24 23.0% 1 .9% 106
55-64 60 73.0% 21 25.5% 1 1.5% 82
65+ 67 71.7% 23 24.4% 4 4.0% 93
Ethnicity
White/Other 274 68.6% 118 29.6% 7 1.8% 399
African-American 41 63.1% 20 31.0% 4 5.9% 65
Hispanic 42 68.7% 19 31.3% 61
Region
Northeast 67 74.4% 23 25.6% 90
Midwest 72 65.9% 37 34.1% 109
South 124 65.3% 56 29.6% 10 5.0% 189
West 95 68.9% 41 30.1% 1 .9% 137
Area
Big City 76 66.1% 33 28.7% 6 5.1% 116
Small City 49 60.7% 32 39.3% 81
Suburban 62 64.1% 35 35.9% 97
Small town 90 75.9% 27 23.0% 1 1.1% 119
Rural Area 74 69.7% 29 26.9% 4 3.4% 107
NA 4 76.4% 1 23.6% 5
Political Party
Democrat 132 62.2% 73 34.3% 7 3.5% 212
Republican 138 70.8% 54 27.9% 3 1.3% 195
Other/None 87 73.4% 30 25.8% 1 .8% 118
Annual Income
Less than $25,000 54 65.4% 24 29.5% 4 5.1% 82
Between $25,000 and $50,000 72 71.1% 25 24.9% 4 4.0% 101
Between $50,000 and $75,000 55 64.2% 31 35.8% 85
Between $75,000 and $100,000 42 65.7% 22 34.3% 64
Between $100,000 and $150,000 35 58.9% 24 41.1% 59
Or over $150,000 34 84.9% 6 15.1% 40
Refused/DK/NA 65 70.1% 25 27.0% 3 2.8% 92
Highest Level of Education Attained
High school or less 78 66.8% 34 28.9% 5 4.2% 116
Vocational or technical school/some college 133 67.4% 58 29.6% 6 3.0% 197
Four year college degree/some graduate credits 72 61.9% 45 38.1% 117
Advanced degree (MA, MBA, PhD, etc.) 69 78.1% 19 21.9% 88
Other/Refused 5 74.2% 2 25.8% 7
Marital Status
Single, never married 65 62.3% 37 35.7% 2 2.0% 104
Married/Living with Domestic Partner/Partner 226 68.4% 100 30.2% 5 1.4% 331
Separated/Divorced/Widowed 62 75.2% 16 19.8% 4 5.1% 83
Refused/DK/NA 3 42.4% 4 57.6% 7

QUESTION 5. HOW HAS THE GOVERNMENT’S RESPONSE TO MAJOR DISEASE OUTBREAKS LIKE EBOLA CHANGED HOW YOU VIEW GOVERN-MENTS’ ABILITY TO RESPOND TO DISEASE OUTBREAKS? [N=1048]
More confident Less confident Has no effect Unsure/DK Refused Not applicable # of Resp
# of resp Col % # of resp Col % # of resp Col % # of resp Col % # of resp Col % # of resp Col % Total
TOTAL 248 23.6% 322 30.7% 442 42.1% 30 2.9% 5 .5% 1 .1% 1048
Sex
Men 128 25.2% 147 29.0% 216 42.4% 13 2.6% 4 .7% 508
Women 119 22.1% 175 32.4% 226 41.9% 17 3.1% 2 .3% 1 .2% 540
Age
18-24 34 24.6% 31 22.6% 66 48.4% 3 2.4% 3 1.9% 136
25-34 46 25.2% 58 31.6% 76 41.8% 3 1.4% 182
35-44 31 16.8% 57 30.9% 94 51.1% 1 .6% 1 .6% 185
45-54 50 24.9% 57 28.4% 84 41.9% 9 4.2% 1 .5% 201
55-64 37 22.7% 64 39.3% 54 33.4% 7 4.2% 1 .4% 163
65+ 50 27.7% 55 30.7% 66 36.8% 8 4.3% 1 .5% 180
Ethnicity
White/Other 170 22.0% 240 31.1% 331 42.9% 25 3.2% 5 .7% 1 .1% 773
African-American 45 34.3% 40 30.0% 44 33.3% 3 2.4% 132
Hispanic 32 22.6% 42 29.6% 66 46.4% 2 1.4% 143
Region
Northeast 45 24.1% 52 27.5% 88 46.6% 3 1.7% 188
Midwest 52 22.9% 61 27.0% 106 46.7% 5 2.1% 3 1.3% 227
South 93 24.0% 136 34.9% 146 37.5% 12 3.1% 1 .2% 1 .3% 389
West 57 23.4% 73 30.0% 102 41.8% 10 4.1% 2 .7% 244
Area
Big City 69 29.4% 64 27.5% 94 40.4% 4 1.8% 2 .8% 233
Small City 43 22.5% 67 35.3% 72 38.0% 8 4.1% 190
Suburban 45 24.6% 40 22.0% 93 50.9% 3 1.5% 2 .9% 182
Small town 54 22.4% 81 33.6% 96 39.7% 10 3.9% 1 .4% 241
Rural Area 35 18.3% 69 35.7% 81 42.1% 6 3.1% 1 .3% 1 .6% 192
NA 2 25.4% 1 12.7% 6 61.8% 9
Political Party
Democrat 149 31.4% 119 25.1% 190 40.1% 14 2.9% 3 .6% 474
Republican 63 17.2% 142 38.9% 146 39.9% 13 3.4% 1 .3% 1 .3% 365
Other/None 36 17.3% 62 29.5% 106 50.7% 4 2.0% 1 .6% 209
Annual Income
Less than $25,000 49 27.0% 56 30.9% 72 39.5% 5 2.5% 181
Between $25,000 and $50,000 45 21.8% 75 36.2% 78 37.6% 9 4.4% 207
Between $50,000 and $75,000 52 30.8% 36 21.2% 78 46.0% 3 2.0% 169
Between $75,000 and $100,000
32 24.7% 37 28.8% 55 42.9% 3 2.1% 2 1.5% 129
Between $100,000 and $150,000
22 21.5% 37 35.7% 40 38.1% 3 2.4% 1 1.2% 1 1.1% 105
Or over $150,000 13 16.5% 31 39.7% 33 42.6% 1 1.2% 78
Refused/DK/NA 34 19.1% 50 27.7% 86 48.1% 7 3.9% 2 1.1% 179
Highest Level of Education At-tained
High school or less 59 22.6% 84 31.9% 109 41.3% 9 3.6% 2 .7% 263
Vocational or technical school/some college
86 23.8% 120 33.1% 144 39.7% 12 3.2% 1 .3% 363
Four year college degree/some graduate credits
61 25.1% 67 27.5% 110 45.2% 3 1.3% 1 .4% 1 .5% 244
Advanced degree (MA, MBA, PhD, etc.)
39 23.3% 48 29.1% 72 43.4% 6 3.4% 1 .8% 166
Other/Refused 2 18.1% 3 23.3% 7 55.2% 12
Marital Status
Single, never married 69 26.2% 69 26.5% 119 45.6% 3 1.2% 1 .5% 262
Married/Living with Domestic Partner/Partner
128 21.7% 184 31.2% 254 43.1% 21 3.5% 2 .3% 1 .2% 589
Separated/Divorced/Wid-owed
47 25.9% 63 34.8% 64 35.5% 5 2.5% 2 1.3% 180
Refused/DK/NA 5 29.3% 6 36.1% 4 24.3% 2 10.3% 17
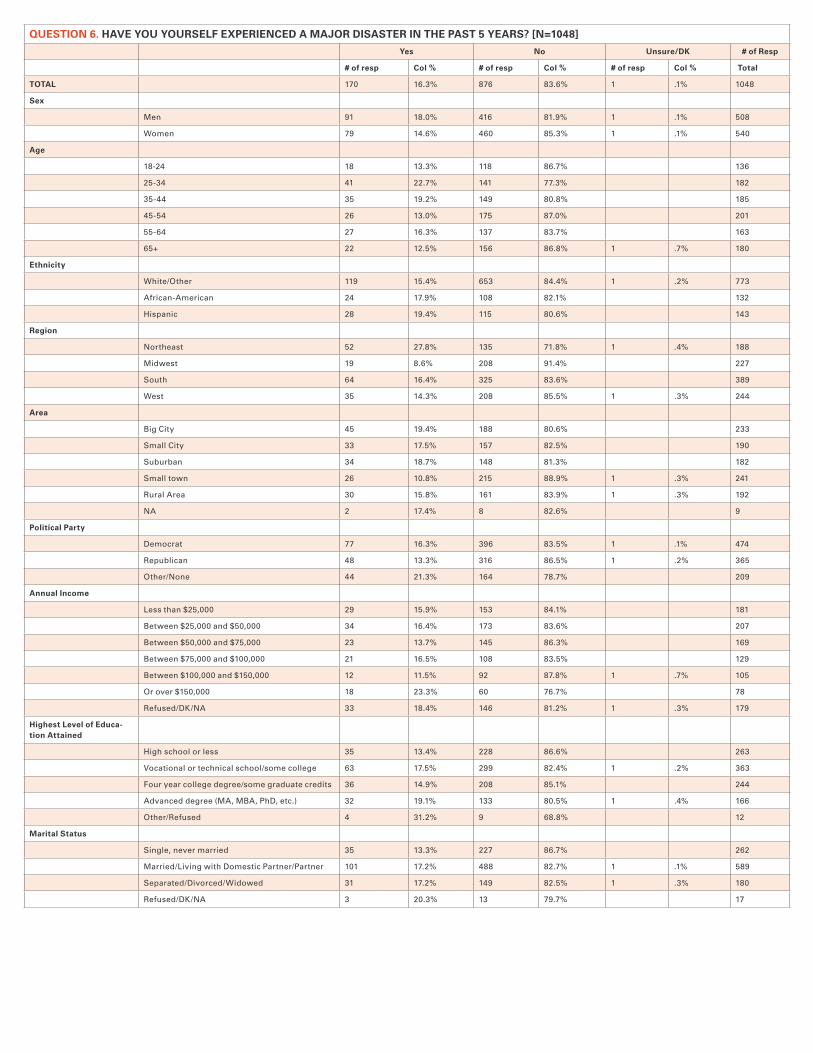
QUESTION 6. HAVE YOU YOURSELF EXPERIENCED A MAJOR DISASTER IN THE PAST 5 YEARS? [N=1048]
Yes No Unsure/DK # of Resp
# of resp Col % # of resp Col % # of resp Col % Total
TOTAL 170 16.3% 876 83.6% 1 .1% 1048
Sex
Men 91 18.0% 416 81.9% 1 .1% 508
Women 79 14.6% 460 85.3% 1 .1% 540
Age
18-24 18 13.3% 118 86.7% 136
25-34 41 22.7% 141 77.3% 182
35-44 35 19.2% 149 80.8% 185
45-54 26 13.0% 175 87.0% 201
55-64 27 16.3% 137 83.7% 163
65+ 22 12.5% 156 86.8% 1 .7% 180
Ethnicity
White/Other 119 15.4% 653 84.4% 1 .2% 773
African-American 24 17.9% 108 82.1% 132
Hispanic 28 19.4% 115 80.6% 143
Region
Northeast 52 27.8% 135 71.8% 1 .4% 188
Midwest 19 8.6% 208 91.4% 227
South 64 16.4% 325 83.6% 389
West 35 14.3% 208 85.5% 1 .3% 244
Area
Big City 45 19.4% 188 80.6% 233
Small City 33 17.5% 157 82.5% 190
Suburban 34 18.7% 148 81.3% 182
Small town 26 10.8% 215 88.9% 1 .3% 241
Rural Area 30 15.8% 161 83.9% 1 .3% 192
NA 2 17.4% 8 82.6% 9
Political Party
Democrat 77 16.3% 396 83.5% 1 .1% 474
Republican 48 13.3% 316 86.5% 1 .2% 365
Other/None 44 21.3% 164 78.7% 209
Annual Income
Less than $25,000 29 15.9% 153 84.1% 181
Between $25,000 and $50,000 34 16.4% 173 83.6% 207
Between $50,000 and $75,000 23 13.7% 145 86.3% 169
Between $75,000 and $100,000 21 16.5% 108 83.5% 129
Between $100,000 and $150,000 12 11.5% 92 87.8% 1 .7% 105
Or over $150,000 18 23.3% 60 76.7% 78
Refused/DK/NA 33 18.4% 146 81.2% 1 .3% 179
Highest Level of Educa-tion Attained
High school or less 35 13.4% 228 86.6% 263
Vocational or technical school/some college 63 17.5% 299 82.4% 1 .2% 363
Four year college degree/some graduate credits 36 14.9% 208 85.1% 244
Advanced degree (MA, MBA, PhD, etc.) 32 19.1% 133 80.5% 1 .4% 166
Other/Refused 4 31.2% 9 68.8% 12
Marital Status
Single, never married 35 13.3% 227 86.7% 262
Married/Living with Domestic Partner/Partner 101 17.2% 488 82.7% 1 .1% 589
Separated/Divorced/Widowed 31 17.2% 149 82.5% 1 .3% 180
Refused/DK/NA 3 20.3% 13 79.7% 17

QUESTION 7. DO YOU THINK THE COUNTRY IS BETTER PREPARED TO DEAL WITH A MAJOR NATURAL DISASTER NOW THAN IT WAS BEFORE HURRICANE KATRINA? [N=1048]
Yes No Unsure/DK Refused Not applicable # of Resp
# of resp Col % # of resp Col % # of resp Col % # of resp Col % # of resp Col % Total
TOTAL 709 67.6% 268 25.6% 70 6.7% 1 .1% 1048
Sex
Men 358 70.4% 120 23.5% 30 5.9% 508
Women 351 65.0% 148 27.4% 40 7.4% 1 .1% 540
Age
18-24 105 77.2% 23 16.9% 8 5.8% 136
25-34 136 74.6% 35 19.3% 11 6.1% 182
35-44 122 65.9% 56 30.5% 7 3.7% 185
45-54 130 64.7% 51 25.6% 20 9.8% 201
55-64 103 63.4% 49 30.3% 10 6.4% 163
65+ 112 62.4% 52 29.1% 14 8.0% 1 .3% 180
Ethnicity
White/Other 513 66.4% 200 25.9% 58 7.6% 1 .1% 773
African-American 90 68.5% 34 25.6% 8 5.9% 132
Hispanic 105 73.7% 34 23.5% 4 2.8% 143
Region
Northeast 118 62.6% 55 29.4% 15 8.0% 188
Midwest 161 70.7% 50 22.1% 16 7.3% 227
South 271 69.5% 93 23.9% 25 6.4% 1 .2% 389
West 160 65.7% 69 28.5% 14 5.6% 244
Area
Big City 173 74.1% 52 22.3% 8 3.4% 1 .3% 233
Small City 129 68.0% 51 26.6% 10 5.4% 190
Suburban 123 67.5% 50 27.4% 9 5.1% 182
Small town 152 62.8% 62 25.7% 27 11.3% 241
Rural Area 126 65.3% 51 26.5% 16 8.2% 192
NA 7 74.4% 2 25.6% 9
Political Party
Democrat 338 71.3% 108 22.8% 27 5.8% 1 .1% 474
Republican 242 66.4% 108 29.5% 15 4.0% 365
Other/None 129 61.6% 52 24.9% 28 13.5% 209
Annual Income
Less than $25,000 124 68.1% 46 25.4% 11 6.2% 1 .3% 181
Between $25,000 and $50,000 139 66.8% 51 24.4% 18 8.8% 207
Between $50,000 and $75,000 121 72.0% 36 21.5% 11 6.5% 169
Between $75,000 and $100,000 95 73.5% 30 23.5% 4 3.0% 129
Between $100,000 and $150,000 68 65.3% 30 28.7% 6 5.9% 105
Or over $150,000 52 66.9% 23 29.9% 3 3.2% 78
Refused/DK/NA 110 61.5% 51 28.7% 17 9.7% 179
Highest Level of Education Attained
High school or less 183 69.5% 61 23.2% 19 7.3% 263
Vocational or technical school/some college
234 64.6% 101 28.0% 26 7.2% 1 .2% 363
Four year college degree/some graduate credits
166 68.1% 66 26.9% 12 4.9% 244
Advanced degree (MA, MBA, PhD, etc.)
117 70.4% 38 23.2% 11 6.4% 166
Other/Refused 9 70.9% 1 8.5% 3 20.6% 12
Marital Status
Single, never married 186 70.9% 58 22.3% 18 6.8% 262
Married/Living with Domestic Partner/Partner
394 66.9% 160 27.1% 35 5.9% 589
Separated/Divorced/Widowed 116 64.4% 48 26.8% 15 8.5% 1 .3% 180
Refused/DK/NA 13 78.1% 1 7.9% 2 14.0% 17
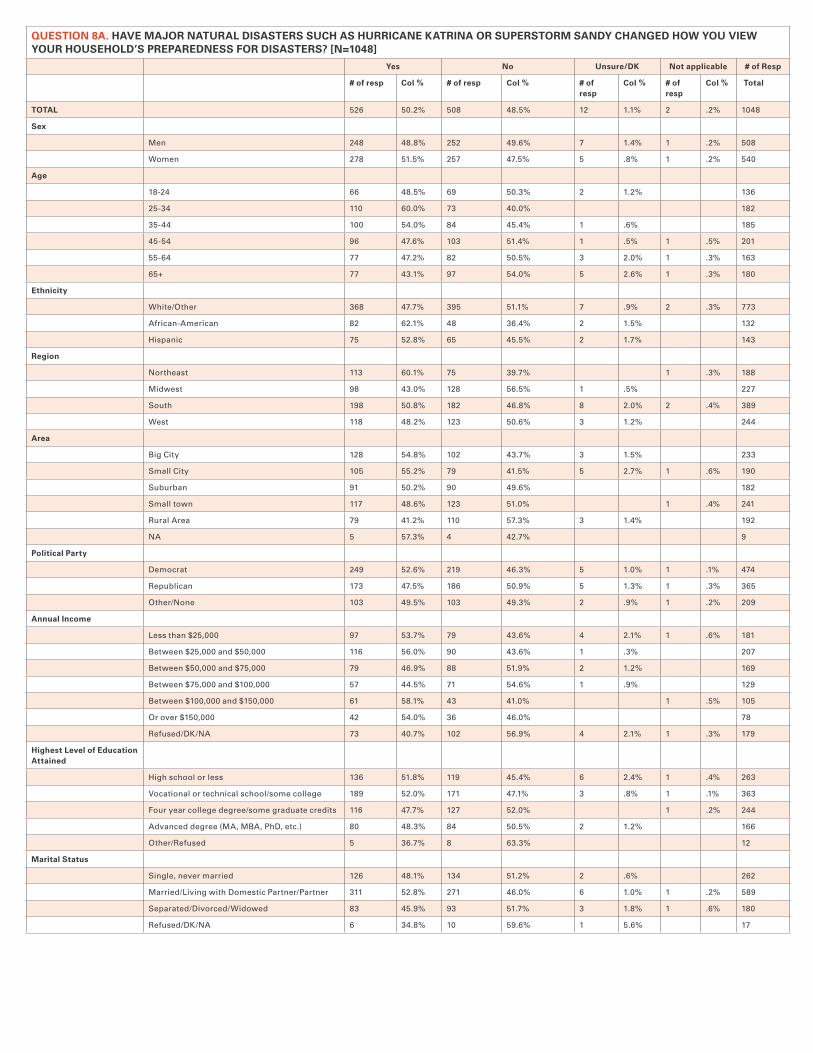
QUESTION 8A. HAVE MAJOR NATURAL DISASTERS SUCH AS HURRICANE KATRINA OR SUPERSTORM SANDY CHANGED HOW YOU VIEW YOUR HOUSEHOLD’S PREPAREDNESS FOR DISASTERS? [N=1048]
Yes No Unsure/DK Not applicable # of Resp
# of resp Col % # of resp Col % # of resp
Col % # of resp
Col % Total
TOTAL 526 50.2% 508 48.5% 12 1.1% 2 .2% 1048
Sex
Men 248 48.8% 252 49.6% 7 1.4% 1 .2% 508
Women 278 51.5% 257 47.5% 5 .8% 1 .2% 540
Age
18-24 66 48.5% 69 50.3% 2 1.2% 136
25-34 110 60.0% 73 40.0% 182
35-44 100 54.0% 84 45.4% 1 .6% 185
45-54 96 47.6% 103 51.4% 1 .5% 1 .5% 201
55-64 77 47.2% 82 50.5% 3 2.0% 1 .3% 163
65+ 77 43.1% 97 54.0% 5 2.6% 1 .3% 180
Ethnicity
White/Other 368 47.7% 395 51.1% 7 .9% 2 .3% 773
African-American 82 62.1% 48 36.4% 2 1.5% 132
Hispanic 75 52.8% 65 45.5% 2 1.7% 143
Region
Northeast 113 60.1% 75 39.7% 1 .3% 188
Midwest 98 43.0% 128 56.5% 1 .5% 227
South 198 50.8% 182 46.8% 8 2.0% 2 .4% 389
West 118 48.2% 123 50.6% 3 1.2% 244
Area
Big City 128 54.8% 102 43.7% 3 1.5% 233
Small City 105 55.2% 79 41.5% 5 2.7% 1 .6% 190
Suburban 91 50.2% 90 49.6% 182
Small town 117 48.6% 123 51.0% 1 .4% 241
Rural Area 79 41.2% 110 57.3% 3 1.4% 192
NA 5 57.3% 4 42.7% 9
Political Party
Democrat 249 52.6% 219 46.3% 5 1.0% 1 .1% 474
Republican 173 47.5% 186 50.9% 5 1.3% 1 .3% 365
Other/None 103 49.5% 103 49.3% 2 .9% 1 .2% 209
Annual Income
Less than $25,000 97 53.7% 79 43.6% 4 2.1% 1 .6% 181
Between $25,000 and $50,000 116 56.0% 90 43.6% 1 .3% 207
Between $50,000 and $75,000 79 46.9% 88 51.9% 2 1.2% 169
Between $75,000 and $100,000 57 44.5% 71 54.6% 1 .9% 129
Between $100,000 and $150,000 61 58.1% 43 41.0% 1 .5% 105
Or over $150,000 42 54.0% 36 46.0% 78
Refused/DK/NA 73 40.7% 102 56.9% 4 2.1% 1 .3% 179
Highest Level of Education Attained
High school or less 136 51.8% 119 45.4% 6 2.4% 1 .4% 263
Vocational or technical school/some college 189 52.0% 171 47.1% 3 .8% 1 .1% 363
Four year college degree/some graduate credits 116 47.7% 127 52.0% 1 .2% 244
Advanced degree (MA, MBA, PhD, etc.) 80 48.3% 84 50.5% 2 1.2% 166
Other/Refused 5 36.7% 8 63.3% 12
Marital Status
Single, never married 126 48.1% 134 51.2% 2 .6% 262
Married/Living with Domestic Partner/Partner 311 52.8% 271 46.0% 6 1.0% 1 .2% 589
Separated/Divorced/Widowed 83 45.9% 93 51.7% 3 1.8% 1 .6% 180
Refused/DK/NA 6 34.8% 10 59.6% 1 5.6% 17

QUESTION 8B. DO YOU FEEL THAT YOUR HOUSEHOLD IS READY FOR A DISASTER, OR NOT? [N=1048]
Yes No Unsure/DK Not applicable # of Resp
# of resp Col % # of resp Col % # of resp
Col % # of resp Col % Total
TOTAL 599 57.1% 408 38.9% 41 3.9% 1048
Sex
Men 332 65.3% 164 32.3% 12 2.3% 508
Women 267 49.4% 244 45.1% 29 5.4% 1 .1% 540
Age
18-24 75 54.8% 54 39.3% 8 6.0% 136
25-34 93 50.9% 87 47.7% 3 1.4% 182
35-44 104 56.1% 72 39.2% 9 4.7% 185
45-54 113 56.0% 86 42.6% 3 1.4% 201
55-64 103 63.0% 53 32.7% 7 4.1% 1 .3% 163
65+ 112 62.4% 56 31.0% 12 6.6% 180
Ethnicity
White/Other 481 62.3% 263 34.0% 28 3.7% 1 .1% 773
African-American 61 46.1% 66 50.2% 5 3.7% 132
Hispanic 57 39.6% 79 55.1% 8 5.4% 143
Region
Northeast 117 62.1% 65 34.6% 6 3.4% 188
Midwest 127 55.8% 93 40.7% 8 3.5% 227
South 220 56.6% 154 39.6% 15 3.7% 1 .1% 389
West 135 55.5% 96 39.5% 12 4.9% 244
Area
Big City 121 51.9% 101 43.1% 12 5.0% 233
Small City 104 54.9% 80 42.0% 6 3.0% 190
Suburban 107 58.5% 69 38.0% 6 3.5% 182
Small town 135 56.0% 97 40.1% 9 3.9% 241
Rural Area 125 65.0% 60 31.1% 7 3.6% 1 .3% 192
NA 7 75.0% 2 18.0% 1 7.0% 9
Political Party
Democrat 247 52.1% 208 43.9% 18 3.9% 1 .1% 474
Republican 218 59.7% 133 36.4% 14 3.9% 365
Other/None 134 64.0% 67 32.1% 8 3.9% 209
Annual Income
Less than $25,000 93 51.2% 82 45.3% 6 3.5% 181
Between $25,000 and $50,000 106 51.3% 90 43.4% 11 5.3% 207
Between $50,000 and $75,000 97 57.5% 64 38.1% 7 4.1% 1 .3% 169
Between $75,000 and $100,000 84 65.4% 43 33.2% 2 1.4% 129
Between $100,000 and $150,000 69 65.6% 34 32.6% 2 1.8% 105
Or over $150,000 46 59.5% 27 35.1% 4 5.4% 78
Refused/DK/NA 103 57.7% 67 37.4% 9 4.9% 179
Highest Level of Education At-tained
High school or less 140 53.3% 113 42.8% 10 3.9% 263
Vocational or technical school/some college
205 56.5% 139 38.4% 18 4.9% 1 .1% 363
Four year college degree/some graduate credits
144 58.9% 93 38.0% 7 3.1% 244
Advanced degree (MA, MBA, PhD, etc.)
103 62.4% 58 35.0% 4 2.6% 166
Other/Refused 6 51.6% 5 40.1% 1 8.4% 12
Marital Status
Single, never married 132 50.5% 116 44.4% 13 5.1% 262
Married/Living with Domestic Part-ner/Partner
369 62.6% 201 34.2% 19 3.2% 1 .1% 589
Separated/Divorced/Widowed 88 49.0% 85 47.2% 7 3.7% 180
Refused/DK/NA 9 57.0% 5 30.3% 2 12.8% 17

QUESTION 9. OVERALL, HOW CONFIDENT ARE YOU IN THE GOVERNMENT’S ABILITY TO RESPOND TO A NATURAL DISASTER OR EMERGENCY WEATHER EVENT IN YOUR AREA? [N=1048]
Very Confident Confident Not Too Confident Not confident at all Unsure/DK Refused # of Resp
# of resp Col % # of resp Col % # of resp
Col % # of resp
Col % # of resp
Col % # of resp
Col % Total
TOTAL 126 12.0% 502 47.9% 307 29.3% 101 9.7% 9 .9% 3 .3% 1048
Sex
Men 76 14.9% 240 47.3% 131 25.8% 52 10.3% 7 1.3% 2 .3% 508
Women 50 9.2% 261 48.4% 176 32.6% 49 9.0% 2 .5% 2 .3% 540
Age
18-24 16 11.8% 69 50.4% 42 30.6% 7 5.0% 2 1.2% 1 1.0% 136
25-34 23 12.7% 87 47.7% 52 28.6% 19 10.4% 1 .7% 182
35-44 26 14.3% 87 47.0% 55 29.8% 16 8.9% 185
45-54 19 9.6% 101 50.2% 57 28.3% 20 10.0% 3 1.6% 1 .5% 201
55-64 20 12.5% 70 42.9% 55 33.6% 17 10.6% 1 .4% 163
65+ 20 11.3% 88 49.1% 46 25.5% 22 12.1% 3 1.4% 1 .6% 180
Ethnicity
White/Other 92 11.9% 374 48.4% 222 28.8% 74 9.6% 8 1.0% 3 .4% 773
African-American 17 13.2% 64 37 27.9% 14 10.4% 132
Hispanic 16 11.5% 64 48 33.3% 13 9.4% 2 1.2% 143
Region
Northeast 15 8.0% 100 53.1% 51 27.2% 21 11.2% 1 .3% 188
Midwest 31 13.8% 118 52.1% 58 25.7% 16 6.9% 2 .9% 1 .6% 227
South 49 12.6% 174 115 29.7% 44 11.3% 5 1.3% 2 .4% 389
West 30 12.4% 110 82 33.6% 20 8.4% 2 .7% 244
Area
Big City 33 14.4% 118 50.8% 61 26.1% 19 8.2% 1 .5% 233
Small City 24 12.8% 91 47.9% 56 29.5% 17 8.8% 1 .5% 1 .5% 190
Suburban 29 15.9% 92 50.3% 45 24.8% 13 7.4% 1 .6% 2 1.0% 182
Small town 16 6.8% 109 45.0% 85 35.1% 29 11.9% 2 .9% 1 .3% 241
Rural Area 22 11.3% 87 56 29.3% 23 12.1% 4 2.0% 192
NA 1 7.0% 5 4 38.7% 9
Political Party
Democrat 64 13.5% 241 50.7% 138 29.1% 30 6.4% 1 .2% 474
Republican 37 10.2% 172 47.0% 111 30.5% 40 11.1% 4 1.1% 365
Other/None 24 11.5% 90 42.9% 57 27.5% 31 14.7% 4 1.9% 3 1.6% 209
Annual Income
Less than $25,000 27 15.0% 73 40.1% 57 31.2% 23 12.8% 2 1.0% 181
Between $25,000 and $50,000 22 10.5% 95 46.0% 67 32.4% 20 9.9% 3 1.2% 207
Between $50,000 and $75,000 17 9.9% 99 58.6% 42 24.7% 12 6.9% 169
Between $75,000 and $100,000 21 15.9% 71 54.7% 34 26.7% 4 2.8% 129
Between $100,000 and $150,000
12 11.4% 48 31 30.1% 10 9.7% 2 1.5% 1 1.2% 105
Or over $150,000 14 18.3% 31 40.3% 20 25.9% 12 14.9% 1 .7% 78
Refused/DK/NA 13 7.4% 85 47.4% 55 30.9% 21 11.6% 3 1.5% 2 1.1% 179
Highest Level of Education Attained
High school or less 37 13.9% 106 40.2% 88 33.6% 30 11.3% 2 .6% 1 .4% 263
Vocational or technical school/some college
33 9.1% 172 47.6% 118 32.6% 36 10.0% 3 .8% 363
Four year college degree/some graduate credits
41 16.8% 127 52.0% 57 23.4% 16 6.4% 3 1.3% 244
Advanced degree (MA, MBA, PhD, etc.)
14 8.3% 92 55.4% 40 24.4% 16 9.8% 2 1.0% 2 1.2% 166
Other/Refused 1 10.2% 5 39.4% 3 24.5% 3 25.9% 12
Marital Status
Single, never married 33 12.5% 124 47.4% 77 29.5% 26 9.8% 2 .6% 262
Married/Living with Domestic Partner/Partner
76 12.9% 286 48.5% 168 28.6% 53 9.0% 6 1.0% 589
Separated/Divorced/Widowed 13 7.4% 89 55 30.6% 19 10.4% 1 .8% 3 1.6% 180
Refused/DK/NA 3 20.5% 4 21.2% 6 37.0% 4 21.4% 17

QUESTION 10. HOW WORRIED ARE YOU THAT CLIMATE CHANGE IS CONTRIBUTING TO MORE FREQUENT AND SEVERE NATURAL DISASTERS? [N=1048]
Worried a lot Worried a fair amount
Worried a little Not at all worried
Unsure/DK Refused # of Resp
# of resp Col % # of resp
Col % # of resp Col % # of resp
Col % # of resp
Col %
# of resp
Col % Total
TOTAL 205 19.6% 223 21.3% 273 26.0% 338 32.2% 8 .8% 1048
Sex
Men 94 18.4% 93 18.3% 114 22.4% 203 39.9% 4 .8% 508
Women 112 20.7% 130 24.0% 159 29.4% 135 25.1% 4 .8% 540
Age
18-24 28 20.2% 34 24.8% 50 36.6% 23 16.7% 2 1.8% 136
25-34 51 27.7% 48 26.5% 39 21.5% 43 23.6% 1 .7% 182
35-44 37 20.0% 36 19.3% 51 27.7% 61 33.0% 185
45-54 32 15.7% 42 20.7% 44 21.8% 84 41.8% 201
55-64 32 19.3% 34 20.6% 40 24.5% 57 34.7% 1 .9% 163
65+ 27 15.1% 30 16.5% 49 27.2% 71 39.3% 3 1.8% 180
Ethnicity
White/Other 142 18.4% 143 18.5% 206 26.6% 274 35.5% 7 .9% 773
African-American 34 25.6% 28 21.3% 37 27.8% 32 24.3% 1 1.0% 132
Hispanic 29 20.4% 52 36.3% 30 21.2% 31 22.0% 143
Region
Northeast 40 21.3% 44 23.4% 54 28.6% 49 25.9% 1 .6% 188
Midwest 44 19.2% 42 18.3% 67 29.6% 71 31.4% 3 1.4% 227
South 65 16.6% 82 21.1% 101 26.0% 139 35.7% 3 .7% 389
West 57 23.4% 55 22.7% 51 20.9% 79 32.5% 1 .5% 244
Area
Big City 69 29.4% 48 20.7% 49 21.1% 66 28.5% 1 .3% 233
Small City 41 21.5% 52 27.2% 46 24.4% 49 25.7% 2 1.3% 190
Suburban 33 17.9% 40 22.2% 51 27.9% 57 31.3% 1 .4% 182
Small town 32 13.4% 45 18.7% 76 31.4% 86 35.5% 2 1.0% 241
Rural Area 31 16.2% 35 18.0% 48 25.2% 77 39.9% 1 .7% 192
NA 3 30.7% 2 25.6% 3 36.7% 1 7.0% 9
Political Party
Democrat 146 30.7% 135 28.4% 125 26.4% 66 14.0% 2 .4% 474
Republican 25 6.8% 53 14.5% 98 26.9% 187 51.2% 2 .5% 365
Other/None 35 16.7% 35 16.9% 49 23.7% 85 40.5% 4 2.0% 209
Annual Income
Less than $25,000 51 28.0% 31 17.3% 49 27.3% 48 26.6% 1 .8% 181
Between $25,000 and $50,000 38 18.2% 55 26.7% 61 29.4% 51 24.7% 2 .9% 207
Between $50,000 and $75,000 36 21.6% 38 22.8% 40 23.9% 52 31.0% 1 .6% 169
Between $75,000 and $100,000 28 21.8% 22 16.7% 41 31.4% 39 30.1% 129
Between $100,000 and $150,000
15 14.0% 23 22.2% 20 19.5% 45 43.2% 1 1.2% 105
Or over $150,000 9 11.2% 15 19.9% 14 17.8% 40 51.1% 78
Refused/DK/NA 29 16.1% 38 20.9% 47 26.4% 62 34.8% 3 1.4% 179
Highest Level of Education Attained
High school or less 55 21.1% 58 21.9% 64 24.3% 83 31.4% 3 1.3% 263
Vocational or technical school/some college
59 16.2% 75 20.6% 110 30.2% 116 31.9% 4 1.1% 363
Four year college degree/some graduate credits
63 25.9% 46 18.9% 60 24.6% 73 30.0% 1 .4% 244
Advanced degree (MA, MBA, PhD, etc.)
28 16.7% 43 25.7% 36 21.7% 59 35.9% 166
Other/Refused 1 4.4% 2 13.9% 3 25.0% 7 56.7% 12
Marital Status
Single, never married 60 23.0% 66 25.3% 70 26.8% 59 22.5% 6 2.2% 262
Married/Living with Domestic Partner/Partner
114 19.3% 118 20.1% 145 24.7% 212 35.9% 589
Separated/Divorced/Widowed 29 15.9% 36 20.0% 55 30.3% 58 32.4% 2 1.4% 180
Refused/DK/NA 3 16.3% 2 13.1% 3 15.9% 9 54.7% 17

QUESTION 11. HOW WORRIED ARE YOU THAT CLIMATE CHANGE WILL IMPACT YOUR COMMUNITY’S EXPOSURE TO DISASTERS? [N=1048]
Worried a lot Worried a fair amount Worried a little Not at all worried Unsure/DK Refused # of Resp
# of resp Col % # of resp Col % # of resp Col % # of resp
Col % # of resp
Col % # of resp
Col %
Total
TOTAL 141 13.4% 206 19.7% 336 32.1% 360 34.3% 4 .4% 1 .1% 1048
Sex
Men 70 13.8% 75 14.7% 158 31.1% 205 40.3% 508
Women 70 13.0% 131 24.4% 178 33.1% 155 28.7% 4 .7% 1 .1% 540
Age
18-24 22 15.9% 41 30.1% 47 34.8% 26 19.2% 136
25-34 40 21.8% 37 20.5% 61 33.7% 44 24.0% 182
35-44 27 14.3% 31 17.0% 61 33.2% 66 35.4% 185
45-54 17 8.4% 31 15.4% 60 30.0% 92 45.7% 1 .5% 201
55-64 18 11.0% 34 20.6% 49 29.7% 63 38.3% 1 .3% 163
65+ 18 10.0% 31 17.4% 57 31.9% 69 38.7% 3 1.4% 1 .6% 180
Ethnicity
White/Other 79 10.3% 145 18.7% 247 31.9% 298 38.6% 3 .3% 1 .1% 773
African-American 32 24.6% 22 16.8% 43 32.3% 33 25.3% 1 1.0% 132
Hispanic 29 20.1% 39 27.6% 47 32.8% 28 19.5% 143
Region
Northeast 27 14.3% 45 24.2% 58 30.8% 57 30.4% 188
Midwest 19 8.3% 42 18.4% 77 34.1% 88 38.9% 1 .2% 227
South 63 16.2% 68 17.4% 115 29.6% 140 36.1% 2 .6% 1 .2% 389
West 32 13.0% 51 20.9% 86 35.3% 74 30.2% 1 .5% 244
Area
Big City 51 21.9% 51 21.8% 64 27.3% 67 28.7% 1 .3% 233
Small City 33 17.5% 50 26.6% 52 27.5% 53 28.0% 1 .5% 190
Suburban 15 8.2% 39 21.2% 64 35.1% 64 35.2% 182
Small town 19 7.8% 42 17.5% 94 39.0% 84 35.0% 1 .5% 1 .3% 241
Rural Area 23 11.7% 23 11.9% 59 30.7% 87 45.4% 1 .3% 192
NA 1 11.8% 4 38.8% 4 43.7% 1 5.7% 9
Political Party
Democrat 98 20.7% 136 28.7% 160 33.7% 78 16.5% 2 .4% 474
Republican 15 4.2% 41 11.3% 118 32.3% 190 52.1% 1 .2% 365
Other/None 27 13.1% 29 13.7% 59 28.1% 92 43.9% 2 .8% 1 .5% 209
Annual Income
Less than $25,000 39 21.5% 34 18.9% 55 30.5% 50 27.8% 2 1.3% 181
Between $25,000 and $50,000 25 12.0% 43 20.9% 84 40.7% 55 26.4% 207
Between $50,000 and $75,000 26 15.3% 22 12.9% 65 38.7% 56 33.1% 169
Between $75,000 and $100,000
21 16.4% 29 22.7% 34 26.7% 44 34.3% 129
Between $100,000 and $150,000
9 8.4% 22 21.3% 25 24.2% 48 46.1% 105
Or over $150,000 5 6.8% 11 14.7% 17 21.4% 44 57.2% 78
Refused/DK/NA 16 8.7% 44 24.5% 55 30.8% 62 34.6% 2 .9% 1 .6% 179
Highest Level of Education Attained
High school or less 44 16.6% 56 21.2% 79 30.1% 82 31.3% 2 .8% 263
Vocational or technical school/some college
53 14.6% 52 14.4% 135 37.2% 121 33.3% 2 .5% 363
Four year college degree/some graduate credits
26 10.8% 67 27.4% 70 28.7% 80 33.0% 244
Advanced degree (MA, MBA, PhD, etc.)
17 10.4% 30 17.9% 51 30.5% 68 40.9% 1 .4% 166
Other/Refused 1 4.4% 2 13.9% 2 14.5% 8 67.2% 12
Marital Status
Single, never married 49 18.6% 62 23.8% 86 32.7% 63 24.2% 1 .5% 262
Married/Living with Domestic Partner/Partner
72 12.3% 102 17.3% 192 32.5% 224 37.9% 589
Separated/Divorced/Widowed 18 9.8% 39 21.6% 57 31.7% 63 35.0% 3 1.5% 1 .3% 180
Refused/DK/NA 2 13.2% 3 16.3% 2 11.3% 10 59.3% 17
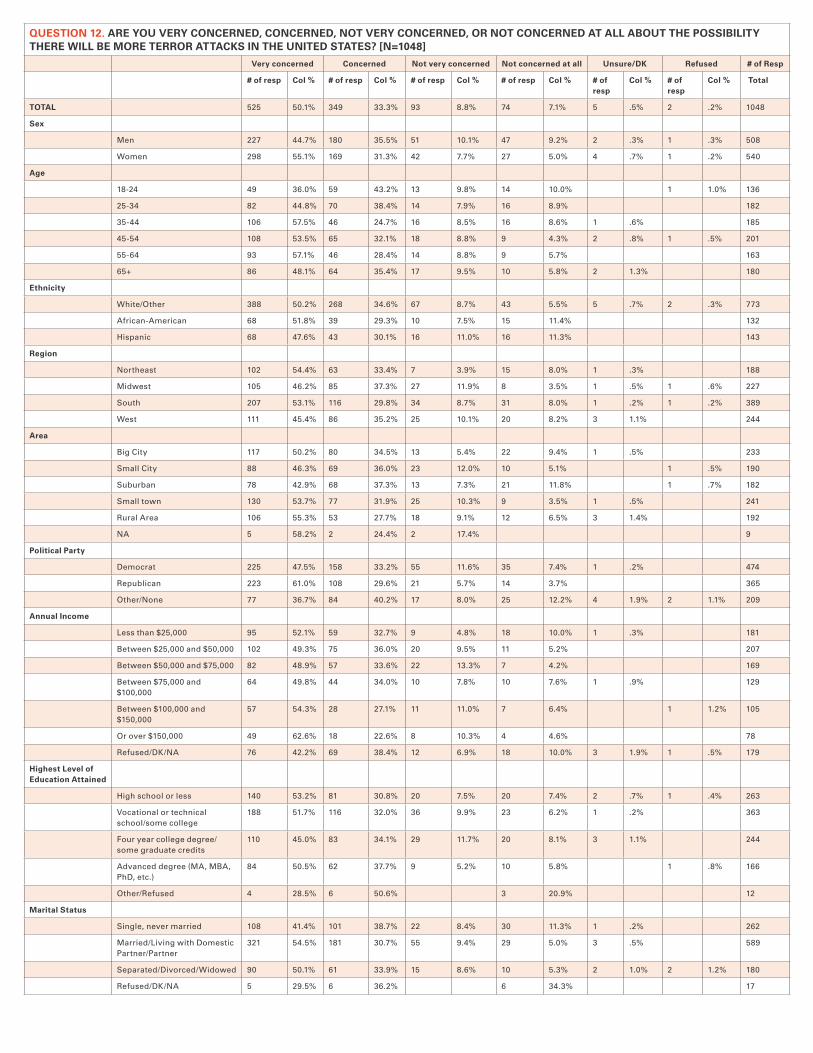
QUESTION 12. ARE YOU VERY CONCERNED, CONCERNED, NOT VERY CONCERNED, OR NOT CONCERNED AT ALL ABOUT THE POSSIBILITY THERE WILL BE MORE TERROR ATTACKS IN THE UNITED STATES? [N=1048]
Very concerned Concerned Not very concerned Not concerned at all Unsure/DK Refused # of Resp
# of resp Col % # of resp Col % # of resp Col % # of resp Col % # of resp
Col % # of resp
Col % Total
TOTAL 525 50.1% 349 33.3% 93 8.8% 74 7.1% 5 .5% 2 .2% 1048
Sex
Men 227 44.7% 180 35.5% 51 10.1% 47 9.2% 2 .3% 1 .3% 508
Women 298 55.1% 169 31.3% 42 7.7% 27 5.0% 4 .7% 1 .2% 540
Age
18-24 49 36.0% 59 43.2% 13 9.8% 14 10.0% 1 1.0% 136
25-34 82 44.8% 70 38.4% 14 7.9% 16 8.9% 182
35-44 106 57.5% 46 24.7% 16 8.5% 16 8.6% 1 .6% 185
45-54 108 53.5% 65 32.1% 18 8.8% 9 4.3% 2 .8% 1 .5% 201
55-64 93 57.1% 46 28.4% 14 8.8% 9 5.7% 163
65+ 86 48.1% 64 35.4% 17 9.5% 10 5.8% 2 1.3% 180
Ethnicity
White/Other 388 50.2% 268 34.6% 67 8.7% 43 5.5% 5 .7% 2 .3% 773
African-American 68 51.8% 39 29.3% 10 7.5% 15 11.4% 132
Hispanic 68 47.6% 43 30.1% 16 11.0% 16 11.3% 143
Region
Northeast 102 54.4% 63 33.4% 7 3.9% 15 8.0% 1 .3% 188
Midwest 105 46.2% 85 37.3% 27 11.9% 8 3.5% 1 .5% 1 .6% 227
South 207 53.1% 116 29.8% 34 8.7% 31 8.0% 1 .2% 1 .2% 389
West 111 45.4% 86 35.2% 25 10.1% 20 8.2% 3 1.1% 244
Area
Big City 117 50.2% 80 34.5% 13 5.4% 22 9.4% 1 .5% 233
Small City 88 46.3% 69 36.0% 23 12.0% 10 5.1% 1 .5% 190
Suburban 78 42.9% 68 37.3% 13 7.3% 21 11.8% 1 .7% 182
Small town 130 53.7% 77 31.9% 25 10.3% 9 3.5% 1 .5% 241
Rural Area 106 55.3% 53 27.7% 18 9.1% 12 6.5% 3 1.4% 192
NA 5 58.2% 2 24.4% 2 17.4% 9
Political Party
Democrat 225 47.5% 158 33.2% 55 11.6% 35 7.4% 1 .2% 474
Republican 223 61.0% 108 29.6% 21 5.7% 14 3.7% 365
Other/None 77 36.7% 84 40.2% 17 8.0% 25 12.2% 4 1.9% 2 1.1% 209
Annual Income
Less than $25,000 95 52.1% 59 32.7% 9 4.8% 18 10.0% 1 .3% 181
Between $25,000 and $50,000 102 49.3% 75 36.0% 20 9.5% 11 5.2% 207
Between $50,000 and $75,000 82 48.9% 57 33.6% 22 13.3% 7 4.2% 169
Between $75,000 and $100,000
64 49.8% 44 34.0% 10 7.8% 10 7.6% 1 .9% 129
Between $100,000 and $150,000
57 54.3% 28 27.1% 11 11.0% 7 6.4% 1 1.2% 105
Or over $150,000 49 62.6% 18 22.6% 8 10.3% 4 4.6% 78
Refused/DK/NA 76 42.2% 69 38.4% 12 6.9% 18 10.0% 3 1.9% 1 .5% 179
Highest Level of Education Attained
High school or less 140 53.2% 81 30.8% 20 7.5% 20 7.4% 2 .7% 1 .4% 263
Vocational or technical school/some college
188 51.7% 116 32.0% 36 9.9% 23 6.2% 1 .2% 363
Four year college degree/some graduate credits
110 45.0% 83 34.1% 29 11.7% 20 8.1% 3 1.1% 244
Advanced degree (MA, MBA, PhD, etc.)
84 50.5% 62 37.7% 9 5.2% 10 5.8% 1 .8% 166
Other/Refused 4 28.5% 6 50.6% 3 20.9% 12
Marital Status
Single, never married 108 41.4% 101 38.7% 22 8.4% 30 11.3% 1 .2% 262
Married/Living with Domestic Partner/Partner
321 54.5% 181 30.7% 55 9.4% 29 5.0% 3 .5% 589
Separated/Divorced/Widowed 90 50.1% 61 33.9% 15 8.6% 10 5.3% 2 1.0% 2 1.2% 180
Refused/DK/NA 5 29.5% 6 36.2% 6 34.3% 17
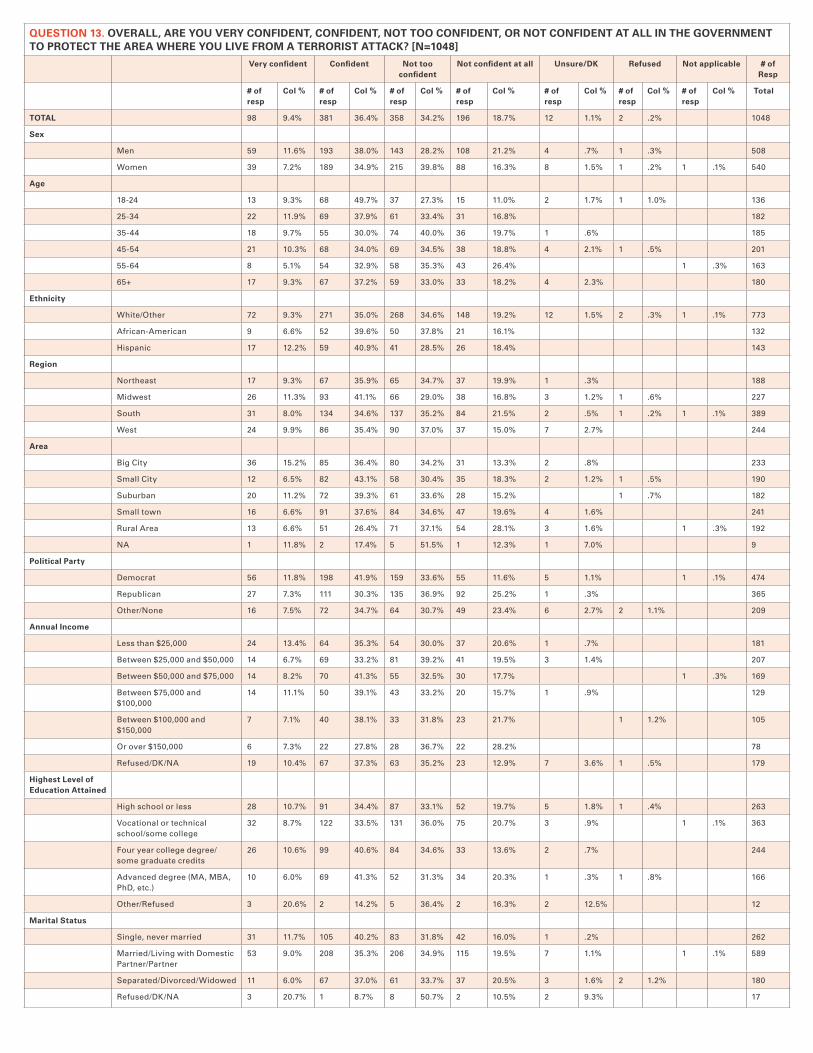
QUESTION 13. OVERALL, ARE YOU VERY CONFIDENT, CONFIDENT, NOT TOO CONFIDENT, OR NOT CONFIDENT AT ALL IN THE GOVERNMENT TO PROTECT THE AREA WHERE YOU LIVE FROM A TERRORIST ATTACK? [N=1048]
Very confident Confident Not too confident
Not confident at all Unsure/DK Refused Not applicable # of Resp
# of resp
Col % # of resp
Col % # of resp
Col % # of resp
Col % # of resp
Col % # of resp
Col % # of resp
Col % Total
TOTAL 98 9.4% 381 36.4% 358 34.2% 196 18.7% 12 1.1% 2 .2% 1048
Sex
Men 59 11.6% 193 38.0% 143 28.2% 108 21.2% 4 .7% 1 .3% 508
Women 39 7.2% 189 34.9% 215 39.8% 88 16.3% 8 1.5% 1 .2% 1 .1% 540
Age
18-24 13 9.3% 68 49.7% 37 27.3% 15 11.0% 2 1.7% 1 1.0% 136
25-34 22 11.9% 69 37.9% 61 33.4% 31 16.8% 182
35-44 18 9.7% 55 30.0% 74 40.0% 36 19.7% 1 .6% 185
45-54 21 10.3% 68 34.0% 69 34.5% 38 18.8% 4 2.1% 1 .5% 201
55-64 8 5.1% 54 32.9% 58 35.3% 43 26.4% 1 .3% 163
65+ 17 9.3% 67 37.2% 59 33.0% 33 18.2% 4 2.3% 180
Ethnicity
White/Other 72 9.3% 271 35.0% 268 34.6% 148 19.2% 12 1.5% 2 .3% 1 .1% 773
African-American 9 6.6% 52 39.6% 50 37.8% 21 16.1% 132
Hispanic 17 12.2% 59 40.9% 41 28.5% 26 18.4% 143
Region
Northeast 17 9.3% 67 35.9% 65 34.7% 37 19.9% 1 .3% 188
Midwest 26 11.3% 93 41.1% 66 29.0% 38 16.8% 3 1.2% 1 .6% 227
South 31 8.0% 134 34.6% 137 35.2% 84 21.5% 2 .5% 1 .2% 1 .1% 389
West 24 9.9% 86 35.4% 90 37.0% 37 15.0% 7 2.7% 244
Area
Big City 36 15.2% 85 36.4% 80 34.2% 31 13.3% 2 .8% 233
Small City 12 6.5% 82 43.1% 58 30.4% 35 18.3% 2 1.2% 1 .5% 190
Suburban 20 11.2% 72 39.3% 61 33.6% 28 15.2% 1 .7% 182
Small town 16 6.6% 91 37.6% 84 34.6% 47 19.6% 4 1.6% 241
Rural Area 13 6.6% 51 26.4% 71 37.1% 54 28.1% 3 1.6% 1 .3% 192
NA 1 11.8% 2 17.4% 5 51.5% 1 12.3% 1 7.0% 9
Political Party
Democrat 56 11.8% 198 41.9% 159 33.6% 55 11.6% 5 1.1% 1 .1% 474
Republican 27 7.3% 111 30.3% 135 36.9% 92 25.2% 1 .3% 365
Other/None 16 7.5% 72 34.7% 64 30.7% 49 23.4% 6 2.7% 2 1.1% 209
Annual Income
Less than $25,000 24 13.4% 64 35.3% 54 30.0% 37 20.6% 1 .7% 181
Between $25,000 and $50,000 14 6.7% 69 33.2% 81 39.2% 41 19.5% 3 1.4% 207
Between $50,000 and $75,000 14 8.2% 70 41.3% 55 32.5% 30 17.7% 1 .3% 169
Between $75,000 and $100,000
14 11.1% 50 39.1% 43 33.2% 20 15.7% 1 .9% 129
Between $100,000 and $150,000
7 7.1% 40 38.1% 33 31.8% 23 21.7% 1 1.2% 105
Or over $150,000 6 7.3% 22 27.8% 28 36.7% 22 28.2% 78
Refused/DK/NA 19 10.4% 67 37.3% 63 35.2% 23 12.9% 7 3.6% 1 .5% 179
Highest Level of Education Attained
High school or less 28 10.7% 91 34.4% 87 33.1% 52 19.7% 5 1.8% 1 .4% 263
Vocational or technical school/some college
32 8.7% 122 33.5% 131 36.0% 75 20.7% 3 .9% 1 .1% 363
Four year college degree/some graduate credits
26 10.6% 99 40.6% 84 34.6% 33 13.6% 2 .7% 244
Advanced degree (MA, MBA, PhD, etc.)
10 6.0% 69 41.3% 52 31.3% 34 20.3% 1 .3% 1 .8% 166
Other/Refused 3 20.6% 2 14.2% 5 36.4% 2 16.3% 2 12.5% 12
Marital Status
Single, never married 31 11.7% 105 40.2% 83 31.8% 42 16.0% 1 .2% 262
Married/Living with Domestic Partner/Partner
53 9.0% 208 35.3% 206 34.9% 115 19.5% 7 1.1% 1 .1% 589
Separated/Divorced/Widowed 11 6.0% 67 37.0% 61 33.7% 37 20.5% 3 1.6% 2 1.2% 180
Refused/DK/NA 3 20.7% 1 8.7% 8 50.7% 2 10.5% 2 9.3% 17

QUESTION 14. OVERALL, HOW CONFIDENT ARE YOU IN THE FEDERAL GOVERNMENT’S ABILITY TO MEET THE UNIQUE NEEDS OF CHILDREN IN DISASTERS? [N= 1048]
Very confident Confident Not too confident Not confident at all Unsure/DK # of Resp
# Resp Col % # Resp Col % # Resp Col % # Resp Col % # Resp Col % Total
TOTAL 75 7.2% 417 39.8% 382 36.4% 155 14.8% 1048
Sex
Men 44 8.7% 214 42.1% 157 30.9% 84 16.5% 9 1.8% 508
Women 31 5.7% 203 37.5% 225 41.7% 72 13.3% 10 1.8% 540
Age
18-24 12 8.8% 67 48.9% 50 36.7% 8 5.6% 136
25-34 11 5.9% 87 47.6% 51 28.1% 32 17.7% 1 .7% 182
35-44 13 6.8% 67 36.2% 78 42.4% 24 12.9% 3 1.8% 185
45-54 15 7.4% 75 37.2% 76 37.9% 27 13.4% 8 4.1% 201
55-64 11 7.0% 55 33.4% 66 40.3% 31 19.0% 1 .4% 163
65+ 14 7.5% 67 37.3% 60 33.5% 34 18.8% 5 2.9% 180
Ethnicity
White/Other 48 6.2% 312 40.4% 280 36.2% 117 15.1% 17 2.1% 773
African-American 13 9.5% 55 41.6% 41 31.1% 21 16.2% 2 1.6% 132
Hispanic 15 10.3% 50 34.9% 61 42.8% 17 12.0% 143
Region
Northeast 16 8.5% 61 32.5% 81 43.3% 26 13.9% 3 1.7% 188
Midwest 18 7.9% 105 46.2% 77 34.1% 25 10.9% 2 .9% 227
South 31 8.0% 149 38.2% 137 35.1% 66 17.0% 7 1.7% 389
West 10 4.2% 102 41.8% 86 35.5% 39 15.9% 7 2.7% 244
Area
Big City 27 11.7% 93 39.9% 73 31.4% 37 15.7% 3 1.3% 233
Small City 8 4.3% 82 43.1% 78 41.1% 21 11.1% 1 .5% 190
Suburban 8 4.5% 79 43.3% 64 35.4% 24 13.4% 6 3.3% 182
Small town 22 9.1% 99 41.0% 81 33.5% 37 15.5% 2 .9% 241
Rural Area 8 4.1% 63 32.7% 81 42.0% 36 18.7% 5 2.5% 192
NA 2 17.4% 1 13.6% 5 50.2% 2 18.8% 9
Political Party
Democrat 46 9.8% 197 41.6% 174 36.7% 44 9.2% 13 2.7% 474
Republican 16 4.4% 141 38.7% 137 37.4% 68 18.7% 3 .7% 365
Other/None 13 6.1% 78 37.3% 71 34.1% 44 20.9% 3 1.6% 209
Annual Income
Less than $25,000 18 9.8% 75 41.6% 56 30.6% 30 16.3% 3 1.7% 181
Between $25,000-$50,000 9 4.1% 81 38.9% 89 43.0% 27 13.2% 2 .8% 207
Between $50,000-$75,000 17 9.9% 58 34.5% 70 41.4% 21 12.4% 3 1.8% 169
Between $75,000-$100,000 15 11.4% 56 43.1% 39 30.2% 17 13.4% 2 1.9% 129
Between $100,000 and $150,000 4 4.1% 41 38.9% 40 38.1% 19 18.0% 1 .9% 105
Over $150,000 5 7.0% 22 28.3% 31 40.3% 18 22.9% 1 1.5% 78
Refused/DK/NA 8 4.3% 84 47.1% 57 31.9% 24 13.2% 6 3.5% 179
Highest Level of Edu-cation Attained
High school or less 23 8.7% 115 43.7% 92 34.9% 32 12.2% 1 .4% 263
Vocational or technical school/some college
28 7.7% 127 34.9% 140 38.7% 62 17.1% 6 1.6% 363
Four year college degree/some graduate credits
17 6.8% 97 39.9% 94 38.7% 29 11.8% 7 2.9% 244
Advanced degree (MA, MBA, PhD, etc.)
7 4.5% 70 42.3% 55 32.9% 29 17.6% 4 2.7% 166
Other/Refused 8 63.5% 1 7.1% 3 25.9% 12
Marital Status
Single, never married 21 7.9% 121 46.1% 79 30.3% 36 13.6% 5 2.1% 262
Married/Living with Domestic Partner/Partner
42 7.1% 216 36.6% 234 39.7% 90 15.3% 8 1.3% 589
Separated/Divorced/Widowed 13 7.1% 69 38.1% 66 36.5% 28 15.6% 5 2.7% 180
Refused/DK/NA 12 69.8% 3 16.9% 2 10.7% 17

QUESTION 15. OVERALL, HOW CONFIDENT ARE YOU IN YOUR COMMUNITY’S ABILITY TO MEET THE UNIQUE NEEDS OF CHILDREN IN DISAS-TERS? [N= 1048]
Very confident Confident Not too confident Not confident at all Unsure/DK Refused Not applicable # of Resp
# of resp
Col % # of resp
Col % # of resp
Col % # of resp
Col % # of resp
Col % # of resp
Col %
# of resp
Col % Total
TOTAL 155 14.8% 492 296 28.2% 89 8.5% 14 1.4% 2 .2% 1 .1% 1048
Sex
Men 79 15.5% 242 47.6% 132 26.0% 48 9.4% 6 1.2% 2 .3% 508
Women 76 14.1% 250 164 30.4% 41 7.6% 8 1.5% 1 .1% 1 .1% 540
Age
18-24 24 17.8% 62 44 32.2% 6 4.6% 136
25-34 29 15.8% 91 49.9% 38 20.9% 20 11.1% 4 2.3% 182
35-44 23 12.7% 85 46.0% 58 31.3% 16 8.5% 2 .9% 1 .7% 185
45-54 31 15.6% 91 45.1% 62 30.9% 13 6.6% 4 1.8% 201
55-64 24 14.5% 71 43.4% 48 29.4% 19 11.9% 1 .9% 163
65+ 23 13.0% 92 51.1% 46 25.5% 14 7.6% 3 1.9% 1 .6% 1 .3% 180
Ethnicity
White/Other 123 15.9% 363 205 26.5% 66 8.5% 14 1.8% 2 .3% 1 .1% 773
African-American 13 9.8% 66 36 27.3% 17 12.7% 1 .5% 132
Hispanic 19 13.3% 63 55 38.4% 6 4.2% 143
Region
Northeast 21 11.4% 81 43.0% 70 37.1% 15 8.1% 188
Midwest 35 15.6% 124 54.5% 46 20.2% 17 7.3% 5 2.0% 1 .3% 227
South 61 15.6% 166 42.8% 113 29.0% 42 10.7% 7 1.8% 1 .2% 389
West 38 15.4% 120 67 27.6% 15 6.2% 2 .9% 1 .5% 244
Area
Big City 33 14.2% 112 66 28.4% 18 7.8% 3 1.3% 1 .3% 233
Small City 21 10.8% 95 49.9% 52 27.6% 16 8.6% 5 2.5% 1 .7% 190
Suburban 26 14.0% 84 46.4% 56 30.6% 15 8.5% 1 .3% 182
Small town 43 17.7% 116 48.1% 66 27.5% 15 6.3% 1 .3% 241
Rural Area 31 16.3% 80 41.5% 54 28.0% 23 11.9% 4 2.2% 192
NA 2 17.4% 5 49.7% 1 13.3% 1 5.6% 1 14.0% 9
Political Party
Democrat 64 13.5% 219 146 30.8% 36 7.6% 8 1.8% 1 .1% 474
Republican 57 15.7% 184 50.4% 89 24.3% 34 9.3% 1 .2% 365
Other/None 33 16.0% 88 42.3% 61 29.3% 19 8.9% 5 2.6% 2 .8% 209
Annual Income
Less than $25,000 29 16.0% 81 46 25.1% 23 12.4% 2 1.3% 1 .3% 181
Between $25,000 and $50,000 26 12.7% 105 50.4% 56 27.0% 18 8.8% 2 .8% 1 .3% 207
Between $50,000 and $75,000 23 13.6% 82 48.4% 48 28.7% 12 7.3% 2 1.3% 1 .7% 169
Between $75,000 and $100,000
24 18.5% 66 51.5% 34 26.6% 3 2.7% 1 .8% 129
Between $100,000 and $150,000
20 18.9% 42 39.9% 31 29.3% 11 10.4% 2 1.5% 105
Over $150,000 10 12.8% 40 51.8% 22 28.5% 4 5.3% 1 1.5% 78
Refused/DK/NA 23 12.8% 76 42.2% 59 32.9% 17 9.5% 4 2.4% 179
Highest Level of Education Attained
High school or less 48 18.1% 114 80 30.4% 18 6.9% 3 1.2% 1 .2% 263
Vocational or technical school/some college
53 14.5% 166 45.9% 108 29.8% 32 8.7% 2 .6% 2 .5% 363
Four year college degree/some graduate credits
42 17.2% 121 49.6% 58 23.7% 16 6.7% 6 2.7% 244
Advanced degree (MA, MBA, PhD, etc.)
11 6.7% 86 52.1% 46 27.9% 19 11.7% 3 1.7% 166
Other/Refused 2 14.6% 4 33.1% 4 28.8% 3 23.5% 12
Marital Status
Single, never married 42 16.2% 116 74 28.4% 24 9.2% 5 1.8% 262
Married/Living with Domestic Partner/Partner
87 14.7% 289 49.1% 158 26.8% 46 7.8% 8 1.4% 1 .2% 589
Separated/Divorced/Wid-owed
23 12.7% 82 57 31.5% 17 9.2% 1 .7% 1 .3% 1 .3% 180
Refused/DK/NA 3 16.6% 5 29.3% 7 41.0% 2 13.1% 17

QUESTION 16. OVERALL, HOW CONFIDENT ARE YOU THAT YOUR COMMUNITY’S SCHOOLS AND OTHER CHILD-SERVING INSTITUTIONS, SUCH AS DAYCARES, ARE PART OF YOUR COMMUNITY’S DISASTER PLAN? [N= 1048]
Very confident Confident Not too confident Not confident at all Unsure/DK Refused Not applicable # Resp
# of resp
Col % # of resp
Col % # of resp
Col % # of resp
Col % # of resp
Col % # of resp
Col %
# of resp
Col % Total
TOTAL 147 14.0% 454 43.3% 291 27.8% 94 8.9% 59 5.6% 1 .1% 2 .2% 1048
Sex
Men 70 13.8% 220 43.3% 136 26.8% 50 9.8% 30 5.8% 2 .3% 508
Women 77 14.2% 234 43.3% 155 28.7% 44 8.1% 29 5.4% 1 .1% 1 .1% 540
Age
18-24 16 11.8% 67 49.4% 42 30.6% 10 7.2% 1 1.0% 136
25-34 32 17.3% 64 35.3% 61 33.4% 12 6.7% 12 6.3% 2 1.0% 182
35-44 31 16.5% 77 41.8% 51 27.8% 17 9.1% 9 4.7% 185
45-54 23 11.2% 104 51.7% 43 21.2% 18 8.8% 14 7.0% 201
55-64 22 13.5% 64 39.0% 42 25.6% 26 15.6% 10 6.3% 163
65+ 24 13.4% 77 42.8% 53 29.3% 12 6.5% 13 7.2% 1 .5% 1 .3% 180
Ethnicity
White/Other 95 12.3% 358 46.3% 197 25.5% 68 8.8% 51 6.6% 1 .1% 2 .3% 773
African-American 22 16.5% 51 38.6% 42 31.4% 12 9.0% 6 4.4% 132
Hispanic 30 20.9% 45 31.5% 52 36.5% 14 9.6% 2 1.5% 143
Region
Northeast 17 9.2% 70 37.4% 66 35.2% 19 10.1% 15 8.1% 188
Midwest 36 16.0% 107 47.0% 59 26.2% 15 6.7% 9 3.9% 1 .3% 227
South 53 13.6% 166 42.6% 107 27.4% 39 10.0% 22 5.7% 1 .3% 2 .5% 389
West 40 16.5% 111 45.6% 59 24.2% 21 8.5% 13 5.1% 244
Area
Big City 38 16.2% 81 34.8% 69 29.7% 28 11.8% 17 7.3% 233
Small City 24 12.7% 96 50.3% 51 26.9% 13 6.6% 6 3.4% 190
Suburban 24 13.4% 79 43.3% 54 29.6% 8 4.2% 16 8.6% 2 1.0% 182
Small town 31 12.7% 105 43.6% 75 31.0% 17 7.0% 12 5.2% 1 .3% 1 .3% 241
Rural Area 28 14.5% 89 46.3% 41 21.5% 27 14.2% 7 3.5% 192
NA 2 24.0% 4 44.4% 1 5.7% 2 18.9% 1 7.0% 9
Political Party
Democrat 72 15.3% 203 42.7% 137 28.8% 34 7.2% 28 6.0% 474
Republican 50 13.7% 173 47.4% 88 24.2% 40 10.9% 13 3.6% 1 .2% 365
Other/None 25 11.8% 78 37.6% 66 31.8% 19 9.3% 18 8.4% 1 .3% 2 .8% 209
Annual Income
Less than $25,000 30 16.6% 72 39.5% 51 28.2% 20 10.8% 7 3.9% 2 1.0% 181
Between $25,000 and $50,000 31 14.9% 89 43.1% 64 31.0% 14 7.0% 8 3.7% 1 .3% 207
Between $50,000 and $75,000 24 14.5% 73 43.1% 49 29.3% 16 9.8% 6 3.4% 169
Between $75,000 and $100,000
15 11.3% 71 55.0% 28 21.3% 11 8.2% 5 4.1% 129
Between $100,000 and $150,000
15 14.2% 41 38.7% 30 28.8% 14 13.4% 5 4.9% 105
Over $150,000 11 14.5% 37 47.3% 22 28.4% 5 6.1% 3 3.7% 78
Refused/DK/NA 21 11.6% 72 40.2% 47 26.0% 14 7.7% 25 14.0% 1 .5% 179
Highest Level of Education Attained
High school or less 263 25.1% 43 16.3% 104 39.5% 81 30.6% 21 8.1% 14 263
Vocational or technical school/some college
363 34.6% 50 13.7% 159 44.0% 97 26.6% 37 10.2% 18 363
Four year college degree/some graduate credits
244 23.3% 37 15.1% 116 47.6% 60 24.6% 16 6.5% 15 244
Advanced degree (MA, MBA, PhD, etc.)
166 15.8% 16 9.7% 70 41.9% 49 29.7% 18 11.1% 12 1 .4% 166
Other/Refused 12 1.2% 1 10.2% 5 39.0% 5 39.2% 1 7.6% 0 12
Marital Status
Single, never married 40 15.3% 103 39.2% 86 32.8% 19 7.4% 12 4.6% 2 .7% 262
Married/Living with Domestic Partner/Partner
86 14.6% 274 46.5% 141 23.9% 59 10.0% 29 4.9% 589
Separated/Divorced/Wid-owed
19 10.5% 72 39.7% 58 32.1% 15 8.1% 16 9.0% 1 .3% 1 .3% 180
Refused/DK/NA 2 11.5% 6 34.3% 6 39.2% 1 5.7% 2 9.3% 17
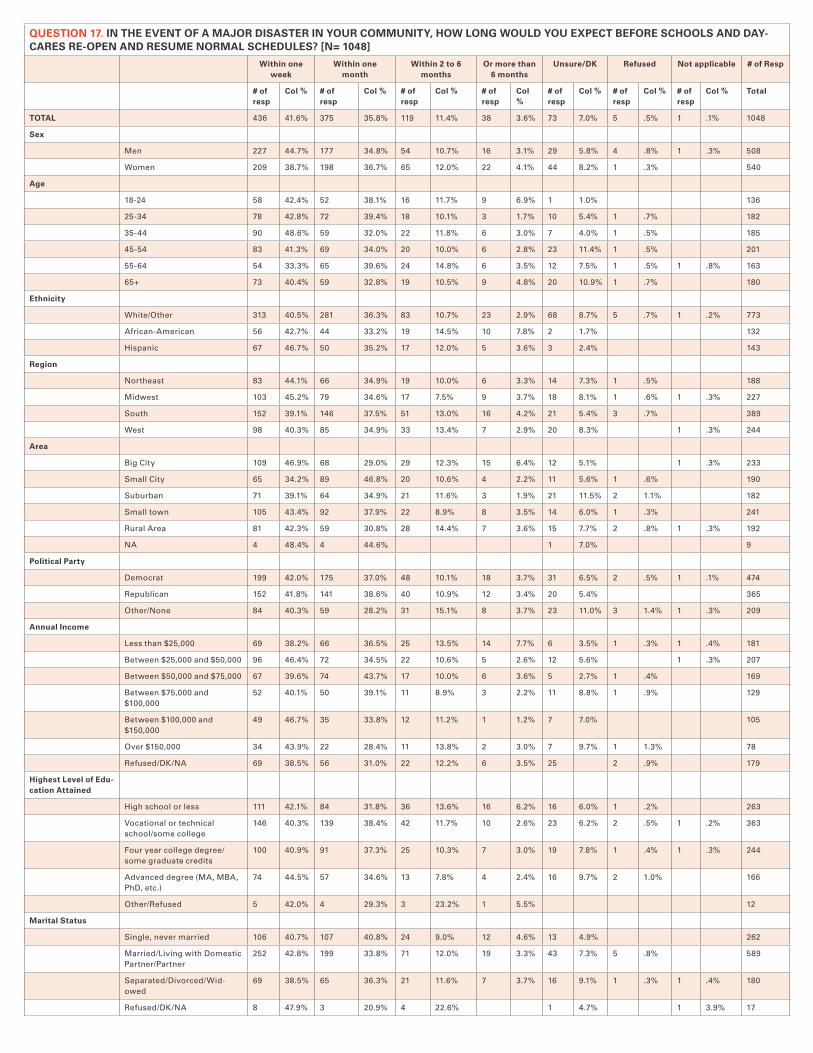
QUESTION 17. IN THE EVENT OF A MAJOR DISASTER IN YOUR COMMUNITY, HOW LONG WOULD YOU EXPECT BEFORE SCHOOLS AND DAY-CARES RE-OPEN AND RESUME NORMAL SCHEDULES? [N= 1048]
Within one week
Within one month
Within 2 to 6 months
Or more than 6 months
Unsure/DK Refused Not applicable # of Resp
# of resp
Col % # of resp
Col % # of resp
Col % # of resp
Col %
# of resp
Col % # of resp
Col % # of resp
Col % Total
TOTAL 436 41.6% 375 35.8% 119 11.4% 38 3.6% 73 7.0% 5 .5% 1 .1% 1048
Sex
Men 227 44.7% 177 34.8% 54 10.7% 16 3.1% 29 5.8% 4 .8% 1 .3% 508
Women 209 38.7% 198 36.7% 65 12.0% 22 4.1% 44 8.2% 1 .3% 540
Age
18-24 58 42.4% 52 38.1% 16 11.7% 9 6.9% 1 1.0% 136
25-34 78 42.8% 72 39.4% 18 10.1% 3 1.7% 10 5.4% 1 .7% 182
35-44 90 48.6% 59 32.0% 22 11.8% 6 3.0% 7 4.0% 1 .5% 185
45-54 83 41.3% 69 34.0% 20 10.0% 6 2.8% 23 11.4% 1 .5% 201
55-64 54 33.3% 65 39.6% 24 14.8% 6 3.5% 12 7.5% 1 .5% 1 .8% 163
65+ 73 40.4% 59 32.8% 19 10.5% 9 4.8% 20 10.9% 1 .7% 180
Ethnicity
White/Other 313 40.5% 281 36.3% 83 10.7% 23 2.9% 68 8.7% 5 .7% 1 .2% 773
African-American 56 42.7% 44 33.2% 19 14.5% 10 7.8% 2 1.7% 132
Hispanic 67 46.7% 50 35.2% 17 12.0% 5 3.6% 3 2.4% 143
Region
Northeast 83 44.1% 66 34.9% 19 10.0% 6 3.3% 14 7.3% 1 .5% 188
Midwest 103 45.2% 79 34.6% 17 7.5% 9 3.7% 18 8.1% 1 .6% 1 .3% 227
South 152 39.1% 146 37.5% 51 13.0% 16 4.2% 21 5.4% 3 .7% 389
West 98 40.3% 85 34.9% 33 13.4% 7 2.9% 20 8.3% 1 .3% 244
Area
Big City 109 46.9% 68 29.0% 29 12.3% 15 6.4% 12 5.1% 1 .3% 233
Small City 65 34.2% 89 46.8% 20 10.6% 4 2.2% 11 5.6% 1 .6% 190
Suburban 71 39.1% 64 34.9% 21 11.6% 3 1.9% 21 11.5% 2 1.1% 182
Small town 105 43.4% 92 37.9% 22 8.9% 8 3.5% 14 6.0% 1 .3% 241
Rural Area 81 42.3% 59 30.8% 28 14.4% 7 3.6% 15 7.7% 2 .8% 1 .3% 192
NA 4 48.4% 4 44.6% 1 7.0% 9
Political Party
Democrat 199 42.0% 175 37.0% 48 10.1% 18 3.7% 31 6.5% 2 .5% 1 .1% 474
Republican 152 41.8% 141 38.6% 40 10.9% 12 3.4% 20 5.4% 365
Other/None 84 40.3% 59 28.2% 31 15.1% 8 3.7% 23 11.0% 3 1.4% 1 .3% 209
Annual Income
Less than $25,000 69 38.2% 66 36.5% 25 13.5% 14 7.7% 6 3.5% 1 .3% 1 .4% 181
Between $25,000 and $50,000 96 46.4% 72 34.5% 22 10.6% 5 2.6% 12 5.6% 1 .3% 207
Between $50,000 and $75,000 67 39.6% 74 43.7% 17 10.0% 6 3.6% 5 2.7% 1 .4% 169
Between $75,000 and $100,000
52 40.1% 50 39.1% 11 8.9% 3 2.2% 11 8.8% 1 .9% 129
Between $100,000 and $150,000
49 46.7% 35 33.8% 12 11.2% 1 1.2% 7 7.0% 105
Over $150,000 34 43.9% 22 28.4% 11 13.8% 2 3.0% 7 9.7% 1 1.3% 78
Refused/DK/NA 69 38.5% 56 31.0% 22 12.2% 6 3.5% 25 2 .9% 179
Highest Level of Edu-cation Attained
High school or less 111 42.1% 84 31.8% 36 13.6% 16 6.2% 16 6.0% 1 .2% 263
Vocational or technical school/some college
146 40.3% 139 38.4% 42 11.7% 10 2.6% 23 6.2% 2 .5% 1 .2% 363
Four year college degree/some graduate credits
100 40.9% 91 37.3% 25 10.3% 7 3.0% 19 7.8% 1 .4% 1 .3% 244
Advanced degree (MA, MBA, PhD, etc.)
74 44.5% 57 34.6% 13 7.8% 4 2.4% 16 9.7% 2 1.0% 166
Other/Refused 5 42.0% 4 29.3% 3 23.2% 1 5.5% 12
Marital Status
Single, never married 106 40.7% 107 40.8% 24 9.0% 12 4.6% 13 4.9% 262
Married/Living with Domestic Partner/Partner
252 42.8% 199 33.8% 71 12.0% 19 3.3% 43 7.3% 5 .8% 589
Separated/Divorced/Wid-owed
69 38.5% 65 36.3% 21 11.6% 7 3.7% 16 9.1% 1 .3% 1 .4% 180
Refused/DK/NA 8 47.9% 3 20.9% 4 22.6% 1 4.7% 1 3.9% 17

QUESTION 18. DO YOU THINK THAT THE SCHOOLS IN YOUR COMMUNITY WERE BUILT TO HOLD UP IN A MAJOR DISASTER? [N= 1048]
Yes No Unsure/DK Not applicable # of Resp
# Resp Col % # Resp Col % # Resp Col % # Resp Col % Total
TOTAL 579 55.2% 363 34.7% 104 9.9% 2 .2% 1048
Sex
Men 297 58.4% 161 31.7% 50 9.8% 508
Women 282 52.3% 202 37.4% 54 10.0% 1 .3% 540
Age
18-24 88 64.9% 40 29.3% 8 5.8% 136
25-34 85 46.8% 76 41.4% 22 11.8% 182
35-44 106 57.3% 65 35.2% 14 7.4% 185
45-54 124 61.6% 53 26.5% 24 11.9% 201
55-64 87 53.0% 64 39.5% 12 7.1% 1 .5% 163
65+ 89 49.3% 65 36.1% 25 14.1% 1 .5% 180
Ethnicity
White/Other 431 55.7% 263 34.1% 77 10.0% 2 .2% 773
African-American 70 52.7% 52 39.3% 11 8.0% 132
Hispanic 79 55.1% 48 33.7% 16 11.3% 143
Region
Northeast 112 59.4% 59 31.6% 17 8.8% 188
Midwest 143 63.0% 62 27.4% 20 9.0% 1 .6% 227
South 194 49.9% 153 39.3% 42 10.8% 389
West 130 53.3% 89 36.4% 25 10.3% 244
Area
Big City 133 57.2% 73 31.4% 26 11.3% 233
Small City 98 51.5% 70 36.8% 22 11.7% 190
Suburban 105 57.7% 57 31.3% 20 11.1% 182
Small town 138 57.0% 87 36.1% 16 6.6% 1 .3% 241
Rural Area 102 53.0% 72 37.5% 17 9.1% 1 .4% 192
NA 3 36.2% 4 44.5% 2 19.4% 9
Political Party
Democrat 244 51.4% 180 37.9% 50 10.6% 474
Republican 224 61.4% 114 31.2% 26 7.1% 1 .4% 365
Other/None 111 53.2% 70 33.4% 28 13.5% 209
Annual Income
Less than $25,000 99 54.5% 67 36.7% 16 8.8% 181
Between $25,000 and $50,000 110 52.9% 81 39.1% 16 7.7% 1 .3% 207
Between $50,000 and $75,000 102 60.6% 49 29.3% 16 9.7% 1 .4% 169
Between $75,000 and $100,000 78 60.5% 46 35.8% 5 3.7% 129
Between $100,000 and $150,000 62 58.9% 34 32.3% 9 8.8% 105
Over $150,000 45 58.0% 26 33.4% 6 8.2% 78
Refused/DK/NA 83 46.6% 61 33.8% 35 19.7% 179
Highest Level of Edu-cation Attained
High school or less 135 51.5% 106 40.3% 21 8.0% 1 .2% 263
Vocational or technical school/some college 200 55.2% 119 32.8% 42 11.7% 1 .3% 363
Four year college degree/some graduate credits 150 61.6% 72 29.4% 22 9.0% 244
Advanced degree (MA, MBA, PhD, etc.) 88 53.1% 60 36.1% 18 10.8% 166
Other/Refused 5 39.3% 6 52.3% 1 8.4% 12
Marital Status
Single, never married 151 57.6% 86 33.0% 25 9.4% 262
Married/Living with Domestic Partner/Partner 323 54.7% 211 35.8% 54 9.2% 1 .2% 589
Separated/Divorced/Widowed 98 54.3% 59 32.6% 23 12.8% 1 .3% 180
Refused/DK/NA 7 45.2% 7 42.4% 2 12.5% 17

QUESTION 19. HOW CONCERNED ARE YOU ABOUT ACTS OF TERRORISM OR MASS VIOLENCE AGAINST SCHOOLS OR OTHER CHILD-SERVING INSTITUTIONS, SUCH AS DAYCARES, IN YOUR COMMUNITY? [N= 1048]
Very concerned Concerned Not very concerned
Not concerned at all
Unsure/DK Refused Not applicable # of Resp
# of resp
Col % # of resp
Col % # of resp
Col % # of resp
Col % # of resp
Col %
# of resp
Col %
# of resp
Col % Total
TOTAL 302 28.9% 376 35.9% 246 23.4% 111 10.6% 11 1.0% 2 .2% 1 .1% 1048
Sex
Men 128 25.3% 187 36.7% 115 22.5% 71 13.9% 6 1.2% 2 .3% 508
Women 174 32.2% 189 35.0% 131 24.3% 40 7.5% 5 .9% 1 .1% 540
Age
18-24 33 24.5% 43 31.6% 43 31.9% 15 11.1% 1 1.0% 136
25-34 52 28.3% 63 34.6% 41 22.2% 26 14.3% 1 .7% 182
35-44 59 32.0% 60 32.2% 47 25.6% 19 10.1% 185
45-54 62 30.7% 70 34.6% 44 21.9% 22 10.9% 4 1.9% 201
55-64 50 30.7% 66 40.3% 34 20.9% 12 7.6% 1 .6% 163
65+ 46 25.7% 75 41.6% 36 20.1% 17 9.3% 5 2.6% 1 .3% 180
Ethnicity
White/Other 192 24.8% 286 37.0% 200 25.9% 85 11.0% 8 1.0% 2 .2% 1 .1% 773
African-American 58 44.3% 39 29.7% 25 18.8% 9 6.6% 1 .6% 132
Hispanic 52 36.5% 50 35.1% 21 14.6% 18 12.3% 2 1.5% 143
Region
Northeast 74 39.5% 60 31.9% 37 19.8% 15 7.8% 1 .6% 188
Midwest 47 20.6% 75 33.1% 68 29.8% 33 14.5% 2 1.1% 1 .6% 1 .3% 227
South 117 30.0% 140 36.1% 90 23.0% 39 10.0% 3 .9% 389
West 65 26.5% 100 41.0% 51 20.9% 24 10.0% 4 1.5% 244
Area
Big City 87 37.5% 83 35.7% 40 17.1% 20 8.4% 3 1.3% 233
Small City 49 26.0% 80 42.1% 44 23.3% 13 7.1% 3 1.5% 190
Suburban 54 29.5% 57 31.4% 50 27.4% 18 9.6% 2 1.1% 2 1.0% 182
Small town 62 25.8% 80 33.3% 70 28.9% 28 11.4% 1 .3% 1 .3% 241
Rural Area 47 24.6% 70 36.7% 41 21.2% 31 16.4% 2 1.1% 192
NA 2 24.2% 4 46.6% 1 11.8% 2 17.4% 9
Political Party
Democrat 149 31.5% 169 35.5% 109 23.0% 43 9.0% 5 1.0% 474
Republican 96 26.4% 129 35.4% 90 24.7% 44 12.1% 4 1.2% 1 .2% 365
Other/None 57 27.2% 78 37.3% 46 22.2% 25 11.7% 2 .8% 2 .8% 209
Annual Income
Less than $25,000 79 43.3% 65 35.7% 20 11.3% 14 7.8% 3 1.9% 181
Between $25,000 and $50,000 66 31.9% 73 35.4% 50 24.0% 15 7.1% 3 1.2% 1 .3% 207
Between $50,000 and $75,000 34 20.0% 68 40.3% 48 28.7% 18 10.9% 169
Between $75,000 and $100,000
32 24.5% 43 33.6% 34 26.6% 19 14.5% 1 .7% 129
Between $100,000 and $150,000
28 27.1% 37 35.8% 25 24.0% 12 11.2% 1 .6% 1 1.2% 105
Over $150,000 13 16.8% 29 37.4% 23 30.2% 12 15.6% 78
Refused/DK/NA 51 28.3% 60 33.3% 44 24.6% 21 11.8% 3 1.8% 179
Highest Level of Edu-cation Attained
High school or less 103 39.2% 92 34.8% 45 17.0% 20 7.5% 3 1.3% 1 .2% 263
Vocational or technical school/some college
107 29.4% 134 37.0% 80 22.0% 37 10.3% 5 1.3% 363
Four year college degree/some graduate credits
55 22.4% 74 30.2% 85 34.7% 29 11.9% 2 .7% 244
Advanced degree (MA, MBA, PhD, etc.)
35 21.2% 72 43.4% 35 21.3% 21 12.8% 1 .5% 1 .8% 166
Other/Refused 3 21.9% 4 36.3% 1 10.4% 4 31.3% 12
Marital Status
Single, never married 68 26.0% 81 31.0% 68 26.0% 40 15.2% 5 1.7% 262
Married/Living with Domestic Partner/Partner
171 29.1% 227 38.6% 134 22.8% 52 8.9% 4 .7% 589
Separated/Divorced/Wid-owed
60 33.0% 63 34.7% 40 22.2% 14 7.8% 2 1.2% 1 .7% 1 .3% 180
Refused/DK/NA 3 20.4% 5 29.3% 4 21.6% 5 28.7% 17
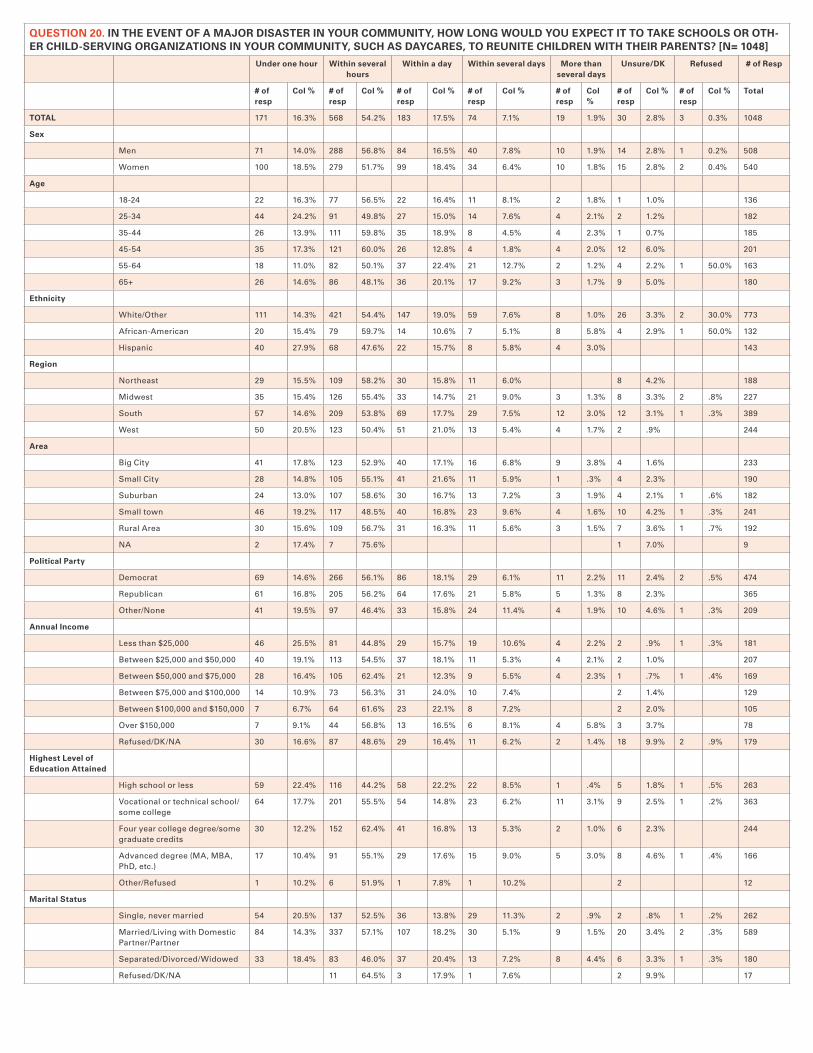
QUESTION 20. IN THE EVENT OF A MAJOR DISASTER IN YOUR COMMUNITY, HOW LONG WOULD YOU EXPECT IT TO TAKE SCHOOLS OR OTH-ER CHILD-SERVING ORGANIZATIONS IN YOUR COMMUNITY, SUCH AS DAYCARES, TO REUNITE CHILDREN WITH THEIR PARENTS? [N= 1048]
Under one hour Within several hours
Within a day Within several days More than several days
Unsure/DK Refused # of Resp
# of resp
Col % # of resp
Col % # of resp
Col % # of resp
Col % # of resp
Col %
# of resp
Col % # of resp
Col % Total
TOTAL 171 16.3% 568 54.2% 183 17.5% 74 7.1% 19 1.9% 30 2.8% 3 0.3% 1048
Sex
Men 71 14.0% 288 56.8% 84 16.5% 40 7.8% 10 1.9% 14 2.8% 1 0.2% 508
Women 100 18.5% 279 51.7% 99 18.4% 34 6.4% 10 1.8% 15 2.8% 2 0.4% 540
Age
18-24 22 16.3% 77 56.5% 22 16.4% 11 8.1% 2 1.8% 1 1.0% 136
25-34 44 24.2% 91 49.8% 27 15.0% 14 7.6% 4 2.1% 2 1.2% 182
35-44 26 13.9% 111 59.8% 35 18.9% 8 4.5% 4 2.3% 1 0.7% 185
45-54 35 17.3% 121 60.0% 26 12.8% 4 1.8% 4 2.0% 12 6.0% 201
55-64 18 11.0% 82 50.1% 37 22.4% 21 12.7% 2 1.2% 4 2.2% 1 50.0% 163
65+ 26 14.6% 86 48.1% 36 20.1% 17 9.2% 3 1.7% 9 5.0% 180
Ethnicity
White/Other 111 14.3% 421 54.4% 147 19.0% 59 7.6% 8 1.0% 26 3.3% 2 30.0% 773
African-American 20 15.4% 79 59.7% 14 10.6% 7 5.1% 8 5.8% 4 2.9% 1 50.0% 132
Hispanic 40 27.9% 68 47.6% 22 15.7% 8 5.8% 4 3.0% 143
Region
Northeast 29 15.5% 109 58.2% 30 15.8% 11 6.0% 8 4.2% 188
Midwest 35 15.4% 126 55.4% 33 14.7% 21 9.0% 3 1.3% 8 3.3% 2 .8% 227
South 57 14.6% 209 53.8% 69 17.7% 29 7.5% 12 3.0% 12 3.1% 1 .3% 389
West 50 20.5% 123 50.4% 51 21.0% 13 5.4% 4 1.7% 2 .9% 244
Area
Big City 41 17.8% 123 52.9% 40 17.1% 16 6.8% 9 3.8% 4 1.6% 233
Small City 28 14.8% 105 55.1% 41 21.6% 11 5.9% 1 .3% 4 2.3% 190
Suburban 24 13.0% 107 58.6% 30 16.7% 13 7.2% 3 1.9% 4 2.1% 1 .6% 182
Small town 46 19.2% 117 48.5% 40 16.8% 23 9.6% 4 1.6% 10 4.2% 1 .3% 241
Rural Area 30 15.6% 109 56.7% 31 16.3% 11 5.6% 3 1.5% 7 3.6% 1 .7% 192
NA 2 17.4% 7 75.6% 1 7.0% 9
Political Party
Democrat 69 14.6% 266 56.1% 86 18.1% 29 6.1% 11 2.2% 11 2.4% 2 .5% 474
Republican 61 16.8% 205 56.2% 64 17.6% 21 5.8% 5 1.3% 8 2.3% 365
Other/None 41 19.5% 97 46.4% 33 15.8% 24 11.4% 4 1.9% 10 4.6% 1 .3% 209
Annual Income
Less than $25,000 46 25.5% 81 44.8% 29 15.7% 19 10.6% 4 2.2% 2 .9% 1 .3% 181
Between $25,000 and $50,000 40 19.1% 113 54.5% 37 18.1% 11 5.3% 4 2.1% 2 1.0% 207
Between $50,000 and $75,000 28 16.4% 105 62.4% 21 12.3% 9 5.5% 4 2.3% 1 .7% 1 .4% 169
Between $75,000 and $100,000 14 10.9% 73 56.3% 31 24.0% 10 7.4% 2 1.4% 129
Between $100,000 and $150,000 7 6.7% 64 61.6% 23 22.1% 8 7.2% 2 2.0% 105
Over $150,000 7 9.1% 44 56.8% 13 16.5% 6 8.1% 4 5.8% 3 3.7% 78
Refused/DK/NA 30 16.6% 87 48.6% 29 16.4% 11 6.2% 2 1.4% 18 9.9% 2 .9% 179
Highest Level of Education Attained
High school or less 59 22.4% 116 44.2% 58 22.2% 22 8.5% 1 .4% 5 1.8% 1 .5% 263
Vocational or technical school/some college
64 17.7% 201 55.5% 54 14.8% 23 6.2% 11 3.1% 9 2.5% 1 .2% 363
Four year college degree/some graduate credits
30 12.2% 152 62.4% 41 16.8% 13 5.3% 2 1.0% 6 2.3% 244
Advanced degree (MA, MBA, PhD, etc.)
17 10.4% 91 55.1% 29 17.6% 15 9.0% 5 3.0% 8 4.6% 1 .4% 166
Other/Refused 1 10.2% 6 51.9% 1 7.8% 1 10.2% 2 12
Marital Status
Single, never married 54 20.5% 137 52.5% 36 13.8% 29 11.3% 2 .9% 2 .8% 1 .2% 262
Married/Living with Domestic Partner/Partner
84 14.3% 337 57.1% 107 18.2% 30 5.1% 9 1.5% 20 3.4% 2 .3% 589
Separated/Divorced/Widowed 33 18.4% 83 46.0% 37 20.4% 13 7.2% 8 4.4% 6 3.3% 1 .3% 180
Refused/DK/NA 11 64.5% 3 17.9% 1 7.6% 2 9.9% 17
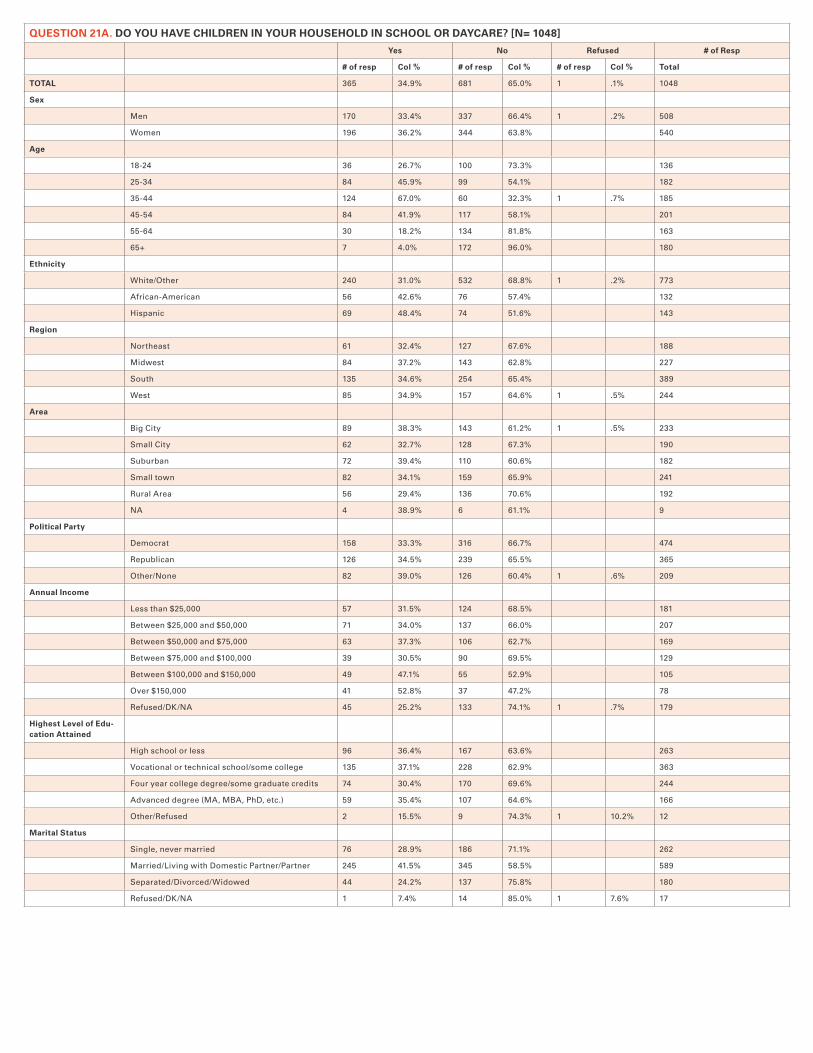
QUESTION 21A. DO YOU HAVE CHILDREN IN YOUR HOUSEHOLD IN SCHOOL OR DAYCARE? [N= 1048]
Yes No Refused # of Resp
# of resp Col % # of resp Col % # of resp Col % Total
TOTAL 365 34.9% 681 65.0% 1 .1% 1048
Sex
Men 170 33.4% 337 66.4% 1 .2% 508
Women 196 36.2% 344 63.8% 540
Age
18-24 36 26.7% 100 73.3% 136
25-34 84 45.9% 99 54.1% 182
35-44 124 67.0% 60 32.3% 1 .7% 185
45-54 84 41.9% 117 58.1% 201
55-64 30 18.2% 134 81.8% 163
65+ 7 4.0% 172 96.0% 180
Ethnicity
White/Other 240 31.0% 532 68.8% 1 .2% 773
African-American 56 42.6% 76 57.4% 132
Hispanic 69 48.4% 74 51.6% 143
Region
Northeast 61 32.4% 127 67.6% 188
Midwest 84 37.2% 143 62.8% 227
South 135 34.6% 254 65.4% 389
West 85 34.9% 157 64.6% 1 .5% 244
Area
Big City 89 38.3% 143 61.2% 1 .5% 233
Small City 62 32.7% 128 67.3% 190
Suburban 72 39.4% 110 60.6% 182
Small town 82 34.1% 159 65.9% 241
Rural Area 56 29.4% 136 70.6% 192
NA 4 38.9% 6 61.1% 9
Political Party
Democrat 158 33.3% 316 66.7% 474
Republican 126 34.5% 239 65.5% 365
Other/None 82 39.0% 126 60.4% 1 .6% 209
Annual Income
Less than $25,000 57 31.5% 124 68.5% 181
Between $25,000 and $50,000 71 34.0% 137 66.0% 207
Between $50,000 and $75,000 63 37.3% 106 62.7% 169
Between $75,000 and $100,000 39 30.5% 90 69.5% 129
Between $100,000 and $150,000 49 47.1% 55 52.9% 105
Over $150,000 41 52.8% 37 47.2% 78
Refused/DK/NA 45 25.2% 133 74.1% 1 .7% 179
Highest Level of Edu-cation Attained
High school or less 96 36.4% 167 63.6% 263
Vocational or technical school/some college 135 37.1% 228 62.9% 363
Four year college degree/some graduate credits 74 30.4% 170 69.6% 244
Advanced degree (MA, MBA, PhD, etc.) 59 35.4% 107 64.6% 166
Other/Refused 2 15.5% 9 74.3% 1 10.2% 12
Marital Status
Single, never married 76 28.9% 186 71.1% 262
Married/Living with Domestic Partner/Partner 245 41.5% 345 58.5% 589
Separated/Divorced/Widowed 44 24.2% 137 75.8% 180
Refused/DK/NA 1 7.4% 14 85.0% 1 7.6% 17
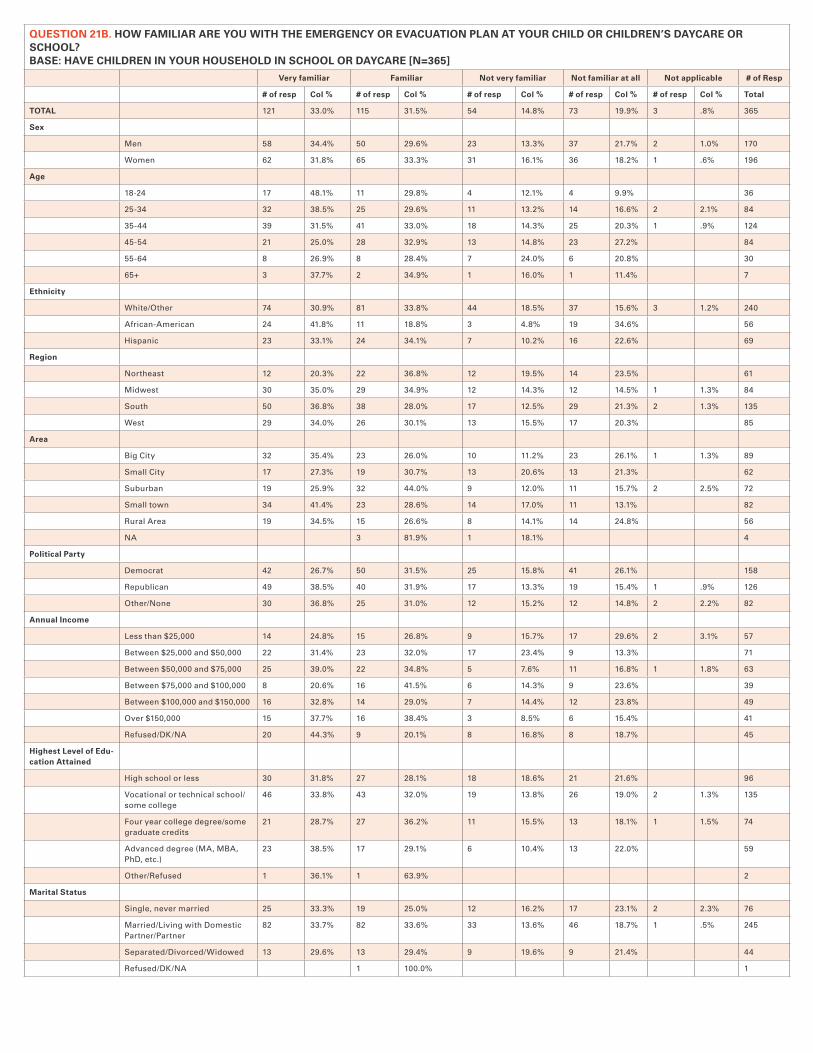
QUESTION 21B. HOW FAMILIAR ARE YOU WITH THE EMERGENCY OR EVACUATION PLAN AT YOUR CHILD OR CHILDREN’S DAYCARE OR SCHOOL? BASE: HAVE CHILDREN IN YOUR HOUSEHOLD IN SCHOOL OR DAYCARE [N=365]
Very familiar Familiar Not very familiar Not familiar at all Not applicable # of Resp
# of resp Col % # of resp Col % # of resp Col % # of resp Col % # of resp Col % Total
TOTAL 121 33.0% 115 31.5% 54 14.8% 73 19.9% 3 .8% 365
Sex
Men 58 34.4% 50 29.6% 23 13.3% 37 21.7% 2 1.0% 170
Women 62 31.8% 65 33.3% 31 16.1% 36 18.2% 1 .6% 196
Age
18-24 17 48.1% 11 29.8% 4 12.1% 4 9.9% 36
25-34 32 38.5% 25 29.6% 11 13.2% 14 16.6% 2 2.1% 84
35-44 39 31.5% 41 33.0% 18 14.3% 25 20.3% 1 .9% 124
45-54 21 25.0% 28 32.9% 13 14.8% 23 27.2% 84
55-64 8 26.9% 8 28.4% 7 24.0% 6 20.8% 30
65+ 3 37.7% 2 34.9% 1 16.0% 1 11.4% 7
Ethnicity
White/Other 74 30.9% 81 33.8% 44 18.5% 37 15.6% 3 1.2% 240
African-American 24 41.8% 11 18.8% 3 4.8% 19 34.6% 56
Hispanic 23 33.1% 24 34.1% 7 10.2% 16 22.6% 69
Region
Northeast 12 20.3% 22 36.8% 12 19.5% 14 23.5% 61
Midwest 30 35.0% 29 34.9% 12 14.3% 12 14.5% 1 1.3% 84
South 50 36.8% 38 28.0% 17 12.5% 29 21.3% 2 1.3% 135
West 29 34.0% 26 30.1% 13 15.5% 17 20.3% 85
Area
Big City 32 35.4% 23 26.0% 10 11.2% 23 26.1% 1 1.3% 89
Small City 17 27.3% 19 30.7% 13 20.6% 13 21.3% 62
Suburban 19 25.9% 32 44.0% 9 12.0% 11 15.7% 2 2.5% 72
Small town 34 41.4% 23 28.6% 14 17.0% 11 13.1% 82
Rural Area 19 34.5% 15 26.6% 8 14.1% 14 24.8% 56
NA 3 81.9% 1 18.1% 4
Political Party
Democrat 42 26.7% 50 31.5% 25 15.8% 41 26.1% 158
Republican 49 38.5% 40 31.9% 17 13.3% 19 15.4% 1 .9% 126
Other/None 30 36.8% 25 31.0% 12 15.2% 12 14.8% 2 2.2% 82
Annual Income
Less than $25,000 14 24.8% 15 26.8% 9 15.7% 17 29.6% 2 3.1% 57
Between $25,000 and $50,000 22 31.4% 23 32.0% 17 23.4% 9 13.3% 71
Between $50,000 and $75,000 25 39.0% 22 34.8% 5 7.6% 11 16.8% 1 1.8% 63
Between $75,000 and $100,000 8 20.6% 16 41.5% 6 14.3% 9 23.6% 39
Between $100,000 and $150,000 16 32.8% 14 29.0% 7 14.4% 12 23.8% 49
Over $150,000 15 37.7% 16 38.4% 3 8.5% 6 15.4% 41
Refused/DK/NA 20 44.3% 9 20.1% 8 16.8% 8 18.7% 45
Highest Level of Edu-cation Attained
High school or less 30 31.8% 27 28.1% 18 18.6% 21 21.6% 96
Vocational or technical school/some college
46 33.8% 43 32.0% 19 13.8% 26 19.0% 2 1.3% 135
Four year college degree/some graduate credits
21 28.7% 27 36.2% 11 15.5% 13 18.1% 1 1.5% 74
Advanced degree (MA, MBA, PhD, etc.)
23 38.5% 17 29.1% 6 10.4% 13 22.0% 59
Other/Refused 1 36.1% 1 63.9% 2
Marital Status
Single, never married 25 33.3% 19 25.0% 12 16.2% 17 23.1% 2 2.3% 76
Married/Living with Domestic Partner/Partner
82 33.7% 82 33.6% 33 13.6% 46 18.7% 1 .5% 245
Separated/Divorced/Widowed 13 29.6% 13 29.4% 9 19.6% 9 21.4% 44
Refused/DK/NA 1 100.0% 1

QUESTION 22. DO YOU KNOW WHERE YOUR CHILD OR CHILDREN WOULD BE EVACUATED TO IF THEIR SCHOOL HAD TO EVACUATE? BASE: HAVE CHILDREN IN YOUR HOUSEHOLD IN SCHOOL OR DAYCARE [N=365]
Yes No Unsure/DK Not applicable # of Resp
# of resp Col % # of resp Col % # of resp Col % # of resp Col % Total
TOTAL 209 57.2% 151 41.2% 3 .8% 3 .8% 365
Sex
Men 104 61.3% 62 36.3% 2 1.3% 2 1.0% 170
Women 105 53.6% 89 45.5% 1 .3% 1 .6% 196
Age
18-24 16 44.7% 18 50.7% 2 4.6% 36
25-34 51 61.4% 31 36.5% 2 2.1% 84
35-44 71 57.6% 51 41.4% 1 .9% 124
45-54 49 57.8% 36 42.2% 84
55-64 16 52.2% 14 45.9% 1 1.9% 30
65+ 6 78.2% 1 13.8% 1 8.0% 7
Ethnicity
White/Other 142 59.3% 95 39.5% 3 1.2% 240
African-American 32 57.8% 23 41.2% 1 1.0% 56
Hispanic 34 49.6% 33 47.2% 2 3.3% 69
Region
Northeast 26 42.1% 35 56.9% 1 .9% 61
Midwest 53 63.2% 30 35.4% 1 1.3% 84
South 77 57.0% 54 40.0% 2 1.7% 2 1.3% 135
West 53 62.3% 32 37.7% 85
Area
Big City 42 47.2% 45 50.9% 1 .6% 1 1.3% 89
Small City 30 48.6% 32 51.4% 62
Suburban 45 63.0% 25 34.6% 2 2.5% 72
Small town 54 65.3% 28 34.0% 1 .7% 82
Rural Area 35 62.8% 19 34.2% 2 3.0% 56
NA 2 65.8% 1 34.2% 4
Political Party
Democrat 91 57.4% 66 41.8% 1 .7% 158
Republican 70 55.3% 55 43.8% 1 .9% 126
Other/None 49 59.7% 29 36.1% 2 2.1% 2 2.2% 82
Annual Income
Less than $25,000 28 48.2% 27 47.7% 1 1.0% 2 3.1% 57
Between $25,000 and $50,000 45 64.0% 24 33.6% 2 2.4% 71
Between $50,000 and $75,000 40 63.1% 21 34.2% 1 .9% 1 1.8% 63
Between $75,000 and $100,000
20 49.6% 20 50.4% 39
Between $100,000 and $150,000
31 62.9% 18 37.1% 49
Over $150,000 23 55.3% 18 44.7% 41
Refused/DK/NA 23 51.8% 22 48.2% 45
Highest Level of Education Attained
High school or less 53 55.5% 41 42.8% 2 1.8% 96
Vocational or technical school/some college
72 53.4% 60 44.4% 1 .9% 2 1.3% 135
Four year college degree/some graduate credits
45 60.4% 28 38.0% 1 1.5% 74
Advanced degree (MA, MBA, PhD, etc.)
38 64.4% 21 35.6% 59
Other/Refused 1 63.9% 1 36.1% 2
Marital Status
Single, never married 28 37.4% 44 58.0% 2 2.2% 2 2.3% 76
Married/Living with Domestic Partner/Partner
157 64.2% 86 35.1% 1 .2% 1 .5% 245
Separated/Divorced/Wid-owed
22 51.2% 21 47.4% 1 1.3% 44
Refused/DK/NA 1 100.0% 1