American Journal of Respiratory and Critical Care Medicine ...
43
American Journal of Respiratory and Critical Care Medicine Copyright 2017 American Thoracic Society 2 Randomized controlled ethanol cookstove intervention and blood pressure in pregnant Nigerian women Donee Alexander 1 , Amanda Northcross 2 , Nathaniel Wilson 3 , Anindita Dutta 1, 4 , Rishi Pandya 5 , Tope Ibigbami 6 , Damilola Adu 6 , John Olamijulo 6 , Oludare Morhason-Bello 7 , Theodore Karrison 8 , Oladosu Ojengbede 7 , Christopher O Olopade 1,4 1 Center for Global Health, University of Chicago, Chicago, Illinois 2 Department of Environmental and Occupational Health, Milken Institute School of Public Health, The George Washington University, Washington, DC 3 Pritzker School of Medicine, University of Chicago, Chicago, Illinois 4 Department of Medicine, University of Chicago 5 Bellevue Hospital Center, New York, 6 Healthy Life for All Foundation, Ibadan, Nigeria 7 Department of Obstetrics and Gynecology, University of Ibadan, Ibadan, Nigeria 8 Department of Public Health Sciences, University of Chicago Corresponding author and person to whom reprint requests should be addressed: Christopher O Olopade The University of Chicago Medicine 5841 S. Maryland Avenue, MC 6076 Chicago, IL 60637 [email protected] Phone: (773) 702-6479 Fax: (773) 702-6500 Page 1 of 43
Transcript of American Journal of Respiratory and Critical Care Medicine ...
American Journal of Respiratory and Critical Care Medicine
Copyright 2017 American Thoracic Society
2
Randomized controlled ethanol cookstove intervention and blood pressure in pregnant
Nigerian women
Donee Alexander1, Amanda Northcross
2, Nathaniel Wilson
3, Anindita Dutta
1, 4, Rishi
Pandya5, Tope Ibigbami
6, Damilola Adu
6, John Olamijulo
6, Oludare Morhason-Bello
7,
Theodore Karrison8, Oladosu Ojengbede
7, Christopher O Olopade
1,4
1Center for Global Health, University of Chicago, Chicago, Illinois
2Department of Environmental and Occupational Health, Milken Institute School of Public
Health, The George Washington University, Washington, DC
3Pritzker School of Medicine, University of Chicago, Chicago, Illinois
4Department of Medicine, University of Chicago
5Bellevue Hospital Center, New York,
6Healthy Life for All Foundation, Ibadan, Nigeria
7 Department of Obstetrics and Gynecology, University of Ibadan, Ibadan, Nigeria
8Department of Public Health Sciences, University of Chicago
Corresponding author and person to whom reprint requests should be addressed:
Christopher O Olopade
The University of Chicago Medicine
5841 S. Maryland Avenue, MC 6076
Chicago, IL 60637
Phone: (773) 702-6479
Fax: (773) 702-6500
Page 1 of 43

American Journal of Respiratory and Critical Care Medicine
Copyright 2017 American Thoracic Society
Author Contributions:
Donee Alexander: study design, study implementation, data collection and writing first draft
of manuscript; Amanda Northcross: study design, exposure assessment, data analysis and
manuscript editing; Nathaniel Wilson: study design, data collection and manuscript editing;
Anindita Dutta: data review and manuscript editing; Rishi Pandya: data collection and
manuscript editing; Tope Ibigbami: data collection, project leadership and manuscript
editing; Damilola Adu: study implementation, data collection and manuscript editing; John
Olamijulo: data collection and manuscript editing; Oludare Morhasson-Bello: study design
and manuscript editing; Theodore Karrison; study design, randomization schedule, statistical
analysis and manuscript editing; Oladosu Ojengbede: project design, leadership
and
manuscript editing: Christopher O. Olopade: project concept and study design, project
leadership, data review, manuscript review and finalization.
All source(s) of support in the form of grants, gifts, equipment, and/or drugs
FUNDING: Global Alliance for Clean Cookstoves (United Nations Foundation)
Short running head: Maternal blood pressure and ethanol cookstove RCT
List ONE descriptor number that best classifies the subject of your manuscript, using
the Subject Category List for Authors
(http://www.atsjournals.org/page/AJRCCM/subject_codes)
Total word count for the body of the manuscript = 3632
Include an “At a Glance Commentary” which addresses the following two issues:
Hypertensive disease during pregnancy is a major cause of mortality and morbidity in
pregnant women and their developing fetus. Exposure to household air pollution has been
demonstrated to increase the risk of adverse pregnancy outcomes, but there are no
Page 2 of 43
American Journal of Respiratory and Critical Care Medicine
Copyright 2017 American Thoracic Society
randomized, controlled interventions that have investigated the efficacy of clean fuels in
mitigating challenges related to hypertension in pregnant women.
Scientific Knowledge on the Subject, and What This Study Adds to the Field. The entire
"At a Glance" section should not exceed 200 words. Please note that this same text
should be included at the end of your Manuscript
In the first randomized, controlled intervention study to investigate the role of improved
cooking fuel on BP changes during pregnancy, we show that ethanol fuel for cooking led to
significant reductions in diastolic BP and prevalence of systemic hypertension. In this study,
pregnant women who cooked initially with kerosene or firewood were randomized into either
an intervention group that cooked with a CleanCook ethanol stove or a control arm that
continued to cook with kerosene or firewood. We demonstrate the ability of a clean-burning
ethanol cookstove to reduce diastolic BP and hypertension during pregnancy and the potential
for clean cooking fuels to reduce adverse health impacts associated with HAP.
Page 3 of 43

American Journal of Respiratory and Critical Care Medicine
Copyright 2017 American Thoracic Society
Abstract
Rationale: Hypertension during pregnancy is a leading cause of maternal mortality.
Exposure to household air pollution (HAP) elevates blood pressure (BP).
Objectives: Investigate ability of clean cookstove intervention to lower BP during
pregnancy.
Methods: A randomized, controlled trial (RCT) was conducted in Nigeria. Pregnant women
cooking with kerosene or firewood were randomly assigned to ethanol (n = 162) or control
arms (n = 162). BP measurements were taken during 6 antenatal visits. Primary analysis
compared ethanol users with controls. Subgroup analyses compared baseline kerosene users
assigned to intervention with kerosene controls and baseline firewood users assigned to
ethanol with firewood controls.
Measurements and Main Results: The change in diastolic BP (DBP) over time was
significantly different between ethanol users and controls (p = 0.040); systolic BP (SBP) did
not differ (p = 0.86). In subgroup analyses, there was no significant intervention effect for
SBP; a significant difference for DBP (p = 0.031) existed among pre-intervention kerosene
users. At last visit, mean DBP was 2.8 mmHg higher in controls vs. ethanol users (3.6 mmHg
greater in controls vs. ethanol users among pre-intervention kerosene users); 6.4% of controls
were hypertensive (SBP ≥ 140 and/or DBP ≥ 90) vs. 1.9% of ethanol users (p=0.051).
Among pre-intervention kerosene users, 8.8% of controls were hypertensive compared to
1.8% of ethanol users (p=0.029).
Conclusions: This is the first cookstove RCT examining prenatal BP. Ethanol cookstoves
have potential to reduce DBP and hypertension during pregnancy. Accordingly, clean
cooking fuels may reduce adverse health impacts associated with HAP.
Word count (Abstract) = 250
Page 4 of 43

American Journal of Respiratory and Critical Care Medicine
Copyright 2017 American Thoracic Society
Key terms (3-5 keywords only): ethanol cookstove intervention, hypertension,
pregnancy, household air pollution, blood pressure
Introduction
Approximately 40% of the global population uses solid fuels (wood, crop wastes, charcoal,
coal, dung) for daily energy needs.(1) In sub-Saharan Africa, 75% of households use solid
fuels for cooking and heating. Burning solid fuels in traditional stoves results in incomplete
combustion, which produces high levels of household air pollution (HAP) and levels of fine
particulate matter (PM) that far exceeds the World Health Organization’s (WHO) indoor air
quality guidelines.(2) Exposure to HAP is the eighth leading risk factor for global disease
burden, contributing to 2.9 million deaths in 2015.(3) The majority of HAP-associated
morbidity and mortality occurs in low- to middle-income countries (LMICs)
disproportionally impacting women and children.(4) An estimated 60% of HAP-related
deaths are due to cardiovascular disease.(5)
Additionally, over 500 million households worldwide use kerosene,(6) another important
contributor to HAP. Known health impacts of kerosene smoke exposure include small-for-
gestational-age babies and increased risk of tuberculosis.(7, 8) Accordingly, WHO has
discouraged using kerosene for household energy needs.(9)
PM exposure is associated with elevated BP.(10-12) Studies of ambient PM have shown that
variances in long-term exposures as small as 2 µg/m3 can result in differences in BP as high
as 3.1 mmHg.(10, 13, 14) Exposure to ambient air pollution has been associated with adverse
pregnancy outcomes (15-18); HAP exposure is also a risk factor for increased BP.(19-21)
Interventions aimed at reducing HAP exposures through use of advanced biomass stoves
Page 5 of 43

American Journal of Respiratory and Critical Care Medicine
Copyright 2017 American Thoracic Society
(stoves that are cleaner burning or more efficient than traditional stoves) have resulted in
reductions in BP.(22-24) The exact mechanism of PM-induced BP changes is unclear; it
likely involves oxidative stress, endothelial injury, systemic inflammation, and thrombosis,
eventually resulting in atherosclerosis and increased peripheral vascular resistance. (25, 26)
BP changes have important implications for hypertensive disorders in pregnancy. Gestational
hypertension is a leading cause of maternal mortality complicating about 7% of
pregnancies.(27) In LMICs, pregnancy-induced hypertension accounts for 10-15% of
maternal deaths.(28) Preeclampsia, defined by gestational hypertension and end-organ
dysfunction, is the most severe gestational hypertensive disorder. It is responsible for 15% of
preterm births and is associated with a fivefold increase in perinatal mortality.(27) Severe
gestational hypertension is associated with prematurity and small-for-gestational-age babies.
(27)
Pregnant women and their fetuses are vulnerable to impacts of HAP exposure because the
women do most household cooking. Maternal exposure to PM2.5 (PM less than 2.5µm in
diameter) from biomass and kerosene smoke can cause elevated BP, which may explain
associations between HAP and increased risk of low birthweight and stillbirth in meta-
analysis. (29) Evidence of effects of prenatal HAP exposure on changes in BP and
cardiovascular health in women from LMICs is essential for protecting the health of mothers
and their fetuses.(30)
Optimal BP control during pregnancy is critical for maternal-fetal health. The impact of using
dirty fuels is currently unquantified. Though some studies have studied the impact of
advanced biomass stoves on respiratory health (31), no studies have evaluated the effects of
Page 6 of 43

American Journal of Respiratory and Critical Care Medicine
Copyright 2017 American Thoracic Society
using clean fuels on BP changes during pregnancy. Clean-burning fuels may reduce HAP
exposure and achieve WHO Indoor Air Quality Guidelines for household fuel
combustion.(32) Therefore, evaluation of the effects of reducing HAP exposure on BP
during pregnancy is crucial.
In Nigeria, over 90 million households cook with solid fuels and approximately 23% use
kerosene for household energy.(33) This randomized, controlled trial (RCT) investigated the
impact of clean-burning ethanol cookstoves on BP in pregnant women who cooked
predominantly with kerosene or firewood prior to enrollment in Ibadan, Nigeria. Some of the
results of these studies were previously reported as an abstract.(34)
Methods
Institutional review boards at the University of Ibadan (Ibadan, Nigeria) and the University of
Chicago (Chicago, USA) approved this study.
Study population. This RCT was conducted between June 2013 and October 2015 with 324
pregnant women (predominantly Yoruba descent) living in Ibadan, Nigeria, a city of over 3
million. Pregnant women were screened for eligibility when visiting one of four primary
health care centers (PHCs) in Ibadan or adjoining peri-urban areas. Reported numbers of
births at these PHCs from 2013 to 2015 ranged from 555- 796 (Agbongbon), 721-867
(Oranyan), 38-88 (Ijaye), and 44-62 (Olorishaoko).
Eligible women had to be their household’s primary cook, <18 weeks pregnant (determined
by self-reported first day of last known menstrual period and ultrasound biometry), and use
wood and/or kerosene as their primary cooking fuel. Randomization was not stratified by
type of primary cooking fuel because when the study began only women using wood-burning
Page 7 of 43

American Journal of Respiratory and Critical Care Medicine
Copyright 2017 American Thoracic Society
stoves were intended to be included. Due to the lower-than-expected number of such
families, the study was expanded to include kerosene controls. The secondary analyses
stratify (post-hoc) by pre-intervention stove type. Women were excluded if they were HIV
positive, smoked, lived with a smoker, cooked for a living, or had a high-risk pregnancy
(multiple gestations, uncontrolled maternal hypertension, >35 for first delivery, three or more
miscarriages, or Caesarean-section).
Enrollment. Upon presentation at an eligible PHC, women were given a detailed study
description, participation requirements, and associated benefits and risks. Consenting women
were evaluated against inclusion and exclusion criteria, asked to give written consent, and
indicate their primary cooking fuel.
Consented women were stratified by parity (<=4 vs. >4 children) and presence of diabetes,
then randomized using the method of permuted blocks and the MT64 random number
generator in STATA (College Station, TX).(35) REDCap’s web-based randomization module
conveyed the assigned treatment. Of 324 women, 50% were assigned to the ethanol stove
group (111 used kerosene; 51 used firewood pre-intervention). These women were given a
two-burner, aluminum CleanCook ethanol stove (CLEANCOOK Sweden AB) and an initial
supply of fuel during a home visit between 16-18 weeks gestational age (GA);
comprehensive training regarding dangers of smoke exposure and proper use of the ethanol
stove were provided simultaneously. Additionally, staff observed each woman use the stove
for the first time and hung the stove manual in their kitchen. The control group continued to
use their kerosene (n=104) or firewood stove (n=58). They were given education on dangers
of smoke exposure and were encouraged to reduce smoke exposure through behavioral and
environmental modification.
Page 8 of 43

American Journal of Respiratory and Critical Care Medicine
Copyright 2017 American Thoracic Society
Data Collection. Data collection began the day of study enrollment. An interview with
structured questionnaire was administered in the local language (Yoruba) to gather
information on socio-economic status, education, obstetrics history, current health status, past
medical history, and family history. Afterwards, when participants had been seated for at
least 10 minutes, a trained nurse took BP measurements. An automatic BP monitor
(Microlife BP 3BM1-3, Switzerland) measured systolic BP (SBP) and diastolic BP (DBP) in
the supported left arm of the seated participant. The monitor automatically takes 3
consecutive readings and calculates an averaged result. BP measurements were taken during
the first PHC visit (before randomization) and at each subsequent visit (approximately 20, 26,
30, 34, and 38 weeks GA), totaling 6 serial BP measurements. Figure 1 depicts a detailed
breakdown of the study flow and data collection.
All data were collected on paper case report forms by staff and entered into Dell tablets
(Venue 8 pro) on the same day. Two additional data technicians verified the data entered into
the tablet with the paper copies. All data were synced to a secure server at Healthy Life for
All Foundation (Ibadan, Nigeria) and sent to a secure site at the University of Chicago
weekly, where a biostatistician checked again for completeness and anomalies. The field
team corrected flagged erroneous values.
Data Analysis. Baseline categorical data are summarized by frequency distributions, while
continuous variables are summarized by mean, standard deviation (SD), and range. Analysis
of longitudinal BP measurements was performed using mixed-effects regression models.(36)
Two different models were fitted. The first grouped the post-randomization data by visit and
used the pre-intervention BP as a covariate. Subjects were treated as a random effect
Page 9 of 43

American Journal of Respiratory and Critical Care Medicine
Copyright 2017 American Thoracic Society
(allowing for correlation within subject). Fixed effects were a group indicator variable
(ethanol vs. control), visit, and group-by visit interaction terms. Letting ��� denote the
measurement for subject � at post-intervention visit �(� = 2, 3, . . . 6), the model is
��� = ����� + (�� + ����)���� + (�� + ����)���� +⋯+ (�� + ����)���� + �� + ��� (1)
where ��� is the baseline BP obtained at pre-intervention visit 1, � is an indicator variable for
treatment group, ����, ����, … , ���� are indicator variables specifying the visit number at which
the measurement was obtained, �� is the random subject effect, and ��� is residual error.
Under this parameterization, ��� , ��� , ���,��� , and ��� are the treatment group differences at
visits 2, 3, 4, 5, and 6, respectively. A joint test of the null hypothesis ��� = ��� = ��� =
��� = ��� = 0, based on five degrees-of-freedom (df), was performed to determine the
statistical significance of the effect of the intervention.
Because BP is known to decrease, then rise during pregnancy (37, 38), we also fit a mixed
effects model quadratic in time, using the exact date of each visit relative to the date of
randomization. This model, which included both random subject intercept and slope terms, is
given by
��� = � + ����� + ��� + (��+���)!�� + (��+���)!��� + �� + "�!�� + ��� , (2)
where ���is the baseline BP treated as a covariate, �� and "� are the random intercept and slope
for subject �, and ��� is the residual error. This model is less robust than model (1), but provides a
potentially more powerful, three degrees-of-freedom test of the overall treatment effect (�� = �� =
�� = 0). We assessed whether the quadratic model provided a good fit to the data by examining the
trend in BPs over time using a locally weighted smoother (LOWESS) (44) and by examining residual
diagnostic plots from the fitted regression curves. Models (1) and (2) were compared using the
Akaike information criterion (AIC).
Page 10 of 43
American Journal of Respiratory and Critical Care Medicine
Copyright 2017 American Thoracic Society
The primary analyses compared the ethanol (E) and control (C) arms. However, the
firewood and kerosene groups were recruited from different areas within Ibadan. Kerosene
users were primarily urban, while firewood users mostly lived in peri-urban areas. To
investigate the impact of possible differences in ambient exposures, lifestyle differences, and
different traditional cooking fuels, subgroup analyses are presented in addition to the main
comparison. Baseline kerosene users randomized to ethanol are denoted as group K→E
(switched from kerosene to ethanol), and baseline kerosene users randomized to control
(continued kerosene use) as K→K. Similarly, baseline firewood users randomized to
ethanol or control, are denoted F→E and F→F, respectively. Subgroup analyses compared
ethanol to kerosene among the subgroup of kerosene users at baseline (K→E vs. K→K), and
ethanol to firewood among the subgroup of firewood users at baseline (F→E vs. F→F).
In addition to longitudinal analysis of BP measurements, patients were categorized as normal
(SBP <120 and DBP <80 mmHg), pre-hypertensive (SBP 120-139 or DBP 80-89 mmHg), or
hypertensive (SBP ≥ 140 and/or DBP ≥ 90 mmHg) at their final prenatal visit. Fisher’s
exact test was performed to compare frequencies across the three classes in the two treatment
arms (3x2 table) as well as the number of frankly hypertensive women in each group (i.e.,
hypertensive vs. pre-hypertensive/normal).
Results
Study Population. In total, 324 women were randomized into the trial, 162 to ethanol and
162 to control. This study population consisted of 215 baseline kerosene users randomized to
ethanol (K→E: n=111) or kerosene (K→K: n=104), and 109 baseline firewood users
randomized to ethanol (F→E: n=51) or firewood (F→F: n=58).
Page 11 of 43

American Journal of Respiratory and Critical Care Medicine
Copyright 2017 American Thoracic Society
Table 1 shows baseline clinical and demographic variables by intervention arm. Overall, few
participants had diabetes and most had two or fewer children at enrollment. Mean age was
approximately 28 years (range 14-42). Mean body mass index (BMI) was approximately 24
kg/m2 (range 14-45). Education varied from none to beyond high school. Mean GA at entry
was 13 weeks. Over 25% of the women had prior miscarriage, and 8% had prior stillbirth.
Randomization resulted in similar baseline distributions in the ethanol and control arms. Of
note, baseline firewood users tended to reside in peri-urban regions (69% vs. 13%), had more
children (8.2% with >4 children vs. 2.8%), and received less education (56% none vs. 22%)
than baseline kerosene users.
Table 2 provides descriptive statistics on BP levels over time. Supplemental Table S1
provides the same statistics stratified by type of stove use at entry. Mean BP values
decreased and then rose to baseline levels or higher over the course of the pregnancy.
Figures 2A and 2B show plots of individual BP values vs. time since randomization for SBP
and DBP, respectively. The solid lines are LOWESS curves depicting the overall trend in BP
over time in the two treatment groups. The curves confirm the expected pattern of decline in
BP during early-to-mid pregnancy followed by a rise during the third trimester. Mean values
(± SE) grouped by visit number are shown in Figures 3A and 3B. From the mixed effects
model (1), the post-randomization differences in SBP between the ethanol and control groups
are not statistically significant adjusting for the baseline (pre-intervention) values (#�� =
1.93,p=0.86). The DBP profiles, however, differed significantly between the two groups
(#�� = 11.66,p=0.040). Results obtained from fitting the quadratic model (2) were similar
(SBP: #�� = 1.57, p=0.67; DBP:#�
� = 10.19, p=0.017). Based on the AIC criterion, in both
instances the quadratic model provided the better fit, but the basic findings are the same.
Page 12 of 43

American Journal of Respiratory and Critical Care Medicine
Copyright 2017 American Thoracic Society
Analysis of mean BPs at the final time point (visit 6) also yielded similar results. SBPs were
not significantly different (mean ± SEM, E: 111.5 ± 0.99 mmHg vs. C: 112.8 ± 1.20 mmHg,
p=0.40 by two-sample t test), whereas mean DBPs differed significantly (E: 70.1 ± 0.70
mmHg vs. C: 72.9 ± 0.87 mmHg, p=0.014).
Results of analyses of the subgroup of participants who were kerosene users at baseline are
summarized in Figures 4A and 4B for SBP and DBP, respectively. (Scatter and LOWESS
plots are available as Supplemental Figures 1A and 1B.) There was no statistically significant
intervention effect on SBP (model 1 #�� = 2.75,p=0.74; model 2 #�
� = 0.91,p=0.82) but
there was a significant effect for DBP (model 1 #�� = 12.29,p=0.031; model 2 #�
� =
10.40,p=0.016=). The mean difference in DBP between the ethanol and control arms at the
final visit was 3.6 mmHg among baseline kerosene users (mean ± SEM, E: 70.9 ± 0.85 vs. C:
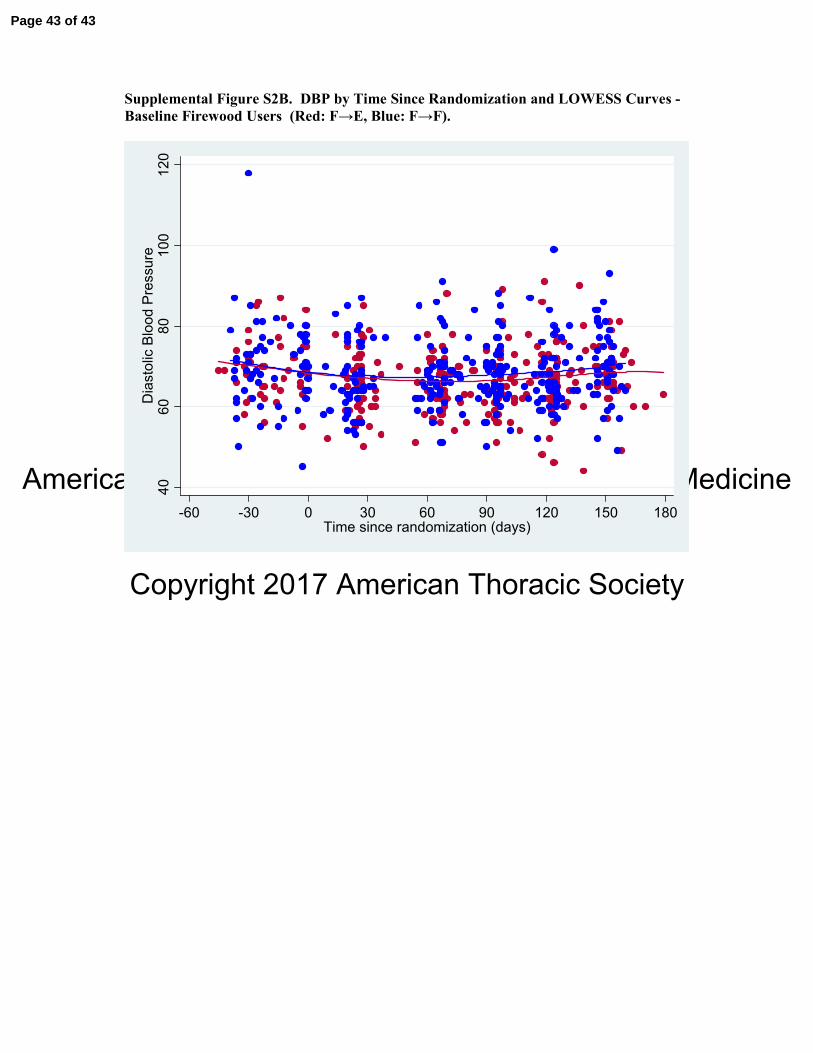
74.5 ± 1.16, p=0.011). Figures 5A and 5B (and supplemental Figures 2A and 2B) show
results for the subgroup of firewood users at baseline. No statistically significant differences
emerged for either SBP (model 1 #�� = 4.69,p=0.45; model 2 #�
� = 3.44,p=0.33) or DBP
(model 1 #�� = 5.24,p=0.39; model 2 #�
� = 2.09,p=0.55).
Table 3 shows the number of participants with normal BP, pre-hypertension, or hypertension
at their last prenatal visit. Hypertensives were further subdivided according to systolic
hypertension, diastolic hypertension, or both. The percentage of participants with
hypertension in the different intervention groups was compared using Fisher’s exact test. The
results parallel those above from the longitudinal analyses. In the overall ethanol and control
comparison, there was a borderline significant difference in the proportion of patients with
hypertension, with fewer in the ethanol group than in the control arm (1.9% vs. 6.4%,
Page 13 of 43
American Journal of Respiratory and Critical Care Medicine
Copyright 2017 American Thoracic Society
p=0.051). This difference reached statistical significance in the subgroup of baseline kerosene
users (p=0.029). Results from the 3x2 table analyses (normal, pre-hypertensive, or
hypertensive by treatment group) were slightly weaker but still favored the ethanol group.
Only one woman in each intervention arm was hypertensive at the last prenatal visit within
the subgroup of baseline firewood users.
Discussion
There have been several epidemiologic studies on HAP and BP, including a recent paper by
Quinn et al. (39) highlighting the positive association between exposure to carbon monoxide
and DBP in pregnant women.(21-24, 39, 40) However, this study is the first cookstove RCT
to examine serial BP levels of pregnant women. Study results reveal statistically significant
differences in DBP profiles when comparing pregnant women in intervention and control
arms (p=0.0051). Lower BP during late pregnancy was observed among the ethanol users
compared to control subjects. Subgroup analyses indicate that this difference is driven by BP
differences between kerosene users randomized to ethanol versus kerosene users in the
control group.
For uncomplicated pregnancies, SBP and DBP decrease in early and mid-pregnancy, but
sustained increases in both SBP and DBP occur during the 3rd trimester through the post-
partum period.(37, 38) Rebelo and colleagues (38) found that excessive weight gain early in
pregnancy was associated with greater increases in both SBP and DBP. In our cohort, similar
physiologic changes in both SBP and DBP were observed in the ethanol and control arms
during pregnancy. However, the women in the intervention group who were younger than
women in the Brazilian study conducted by Rebelo et al. and had normal BMI had
significantly lower DBP at the end of pregnancy relative to controls.(38) A higher percentage
Page 14 of 43
American Journal of Respiratory and Critical Care Medicine
Copyright 2017 American Thoracic Society
of women in the control group also developed systolic and diastolic hypertension near
delivery.(38)
Compared to other studies of HAP and BP, our finding of a difference of approximately 3
mmHg in DBP is similar to that previously reported in McCracken et al.’s RCT.(23)
However, their study (23)focused on elderly women with low BP over an 18-month period,
where SBP was also reduced. A reduction in BP, beginning at about 100-120 days post-
randomization (30-34 weeks gestation) and rising to approximately 3 mmHg toward the end
of pregnancy, is clinically significant, as it has the potential to reduce the risks of
cardiovascular complications such as preeclampsia and eclampsia that can lead to adverse
pregnancy outcomes. The reduction of BP to this degree has not been previously observed in
a cookstove RCT that involved a young cohort such as this one.
Most investigations of the health effects of HAP have focused on biomass fuels, but recently,
there has been a surge in evidence pointing toward the toxicity of kerosene. In a cross-
sectional study conducted in Bangalore, India, Choi et al. (41) found an increased risk of
respiratory illness associated with kerosene fuel use among urban-dwelling women relative to
those cooking with liquid petroleum gas (LPG).(41) Bates and colleagues (42) investigated
the association between household cooking fuel type and acute lower respiratory infections
(ALRI) in young children in Nepal.(42) Their case-control study showed a positive
association between 3 fuel types (LPG, kerosene, and biomass) and ALRI relative to use of
electricity for cooking. Notably, the odds ratio (OR) for kerosene stove use compared to
electricity was similar to the OR for biomass stove use compared to electricity (2.33; 95% CI:
1.40, 3.86 and 2.13; 95% CI: 1.34, 3.41, respectively). Additionally, a study conducted in
Nepal by Pokhrel and colleagues (7) on the risk factors for pulmonary tuberculosis reported
Page 15 of 43
American Journal of Respiratory and Critical Care Medicine
Copyright 2017 American Thoracic Society
stronger associations with kerosene cooking (OR = 3.36; 95% CI: 1.01, 11.22) than cooking
with biomass (OR = 1.21; 95% CI: 0.48, 3.05).(7)
These studies, and others, have led WHO to discourage the use of kerosene for household
cooking until further research is conducted.(1) This RCT provides further evidence on
kerosene’s detrimental health effects. Specifically, this is the first study to demonstrate
elevated BP levels in pregnant women using kerosene for cooking compared to cooking with
an ethanol stove that meets ISO IWA tier 4 cookstove performance standards for indoor
emissions.(43)
This study demonstrates that clean cookstove interventions have the potential to impact the
health of pregnant women, though intervention is both a challenging task and a complex
process.(44) This is true even in urban settings where ambient concentrations of PM can be
high enough to potentially reduce the impact of a clean-burning cookstove on personal
exposures.
A limitation of the study is the smaller number of firewood users enrolled into the trial. As a
consequence, the lack of any statistically significant difference in favor of ethanol in this
subgroup may be due to insufficient power. Additionally, as part of the education program,
both groups were informed about potential harmful effects of smoke exposure, and the
control group was encouraged to cook in ventilated rooms or outside to reduce their
exposure. The training given to the control group may have artificially lowered their exposure
throughout the duration of the study; however, this cannot be verified, as everyone in the
control group received this education. Although not shown here, more stacking (combining
usage of the intervention stoves with the traditional ones) was observed in firewood users
Page 16 of 43
American Journal of Respiratory and Critical Care Medicine
Copyright 2017 American Thoracic Society
randomized to ethanol than kerosene users randomized to ethanol, potentially decreasing the
impact of the intervention on firewood users. This is likely due to the differences in cooking
styles of firewood users compared to kerosene users.
Another limitation is that, over time, the number of patients with blood pressure readings
available declined from n=320 at baseline to n=286 at visit 6 (approximately 11%). The
mixed effects regression model assumes that these values are "missing at random (MAR),"
which means that the missingness is unrelated to the true (but unobserved) value, although it
can depend on previous observed values and therefore with longitudinal data MAR is not
considered a restrictive assumption. MAR would be violated if, for example, patients with
high (low) blood pressure dropped out of the study before their elevated (reduced) pressures
were observed.
A strength of these findings is that the differences in longitudinal profiles in DBP were
followed by borderline significant (primary comparison) or significant (kerosene subgroup)
differences in the rates of evident hypertension. These differences occurred after only 6
months of cookstove use in a relatively young cohort, which shows the potential for the
CleanCook stove to impact health in a relatively short timeframe. A weakness is the lack of a
concomitant significant difference in SBP, although SBP levels were consistently higher in
the control arm.
Hypertension during pregnancy is a risk factor for numerous health effects including preterm
delivery and small-for-gestational-age babies and is a leading cause of maternal and perinatal
mortality. The statistically significant difference in rates of hypertension between control and
intervention groups illustrate the damaging impact of prenatal HAP exposure and may
Page 17 of 43

American Journal of Respiratory and Critical Care Medicine
Copyright 2017 American Thoracic Society
explain why HAP has been associated with an increased risk of low birthweight and stillbirth
in meta-analysis.(29, 45, 46)
This paper provides evidence that cooking with an ethanol-burning cookstove can positively
impact BP. This reduction not only reduces pregnancy risks, but also the wider burden of
disease for those exposed to HAP.
Acknowledgements:
Shell Exploratory Company, Nigeria for the provision of ethanol for the conduct of the study.
The Nigeria National Biotechnology Development Agency for the provision of the ethanol
stoves. Project Gaia for the support and advocacy is getting the ethanol stoves donated to the
project, Richard and Susan Kiphart for supplemental funding support, the staff of Healthy
Life for All foundation for logistical support with the field studies, and Monica Palese and
Kristyna Hulland for editorial assistance.
REFERENCES
1. WHO. Household air pollution and health. World Health Organization Fact Sheet; 2014.
2. Bonjour S, Adair-Rohani H, Wolf J, Bruce NG, Mehta S, Pruss-Ustun A, Lahiff M,
Rehfuess EA, Mishra V, Smith KR. Solid fuel use for household cooking: country and
regional estimates for 1980-2010. Environ Health Perspect 2013; 121: 784-790.
3. Forouzanfar MH, Afshin A, Alexander LT, Anderson HR, Bhutta ZA, al. e. Global,
regional, and national comparative risk assessment of 79 behavioural, environmental
and occupational, and metabolic risks or clusters of risks, 1990-2015: a systematic
analysis for the Global Burden of Disease Study 2015. Lancet 2016; 388: 1659-1724.
4. Lim SS, Vos T, Flaxman AD, Danaei G, Shibuya K, al e. A comparative risk assessment of
burden of disease and injury attributable to 67 risk factor and risk factor clusters in 21
regions, 1990-2010: systematic analysis for the Global Burden of Disease Study 2010.
Lancet 2012; 380: 2224-2260.
5. WHO | Global Burden of Disease (GBD) 2010. Available from:
http://www.who.int/healthinfo/global_burden_disease/gbd/en/.
6. Lam NL, Smith KR, Gauthier A, Bates MN. KEROSENE: A REVIEW OF HOUSEHOLD
USES AND THEIR HAZARDS IN LOW- AND MIDDLE-INCOME COUNTRIES.
Page 18 of 43

American Journal of Respiratory and Critical Care Medicine
Copyright 2017 American Thoracic Society
Journal of toxicology and environmental health Part B, Critical reviews 2012; 15:
396-432.
7. Pokhrel AK, Bates MN, Verma SC, Joshi HS, Sreeramareddy CT, Smith KR. Tuberculosis
and indoor biomass and kerosene use in Nepal: a case-control study. Environ Health
Perspect 2010; 118: 558-564.
8. Aimakhu CO, Olayemi O. Maternal haematocrit and pregnancy outcome in Nigerian
women. West Afr J Med 2003; 22: 18-21.
9. WHO. Frequently Asked Questions WHO guidelines for indoor air quality: household fuel
combustion November 2014. 2014 [cited 2016 06/07]. Available from:
http://www.who.int/indoorair/guidelines/hhfc/FAQs_Nov2014.pdf.
10. Chuang K-J, Yan Y-H, Cheng T-J. Effect of air pollution on blood pressure, blood lipids,
and blood sugar: a population-based approach. Journal of Occupational and
Environmental Medicine / American College of Occupational and Environmental
Medicine 2010; 52: 258-262.
11. Auchincloss AH, Diez Roux AV, Dvonch JT, Brown PL, Barr RG, Daviglus ML, Goff
DC, Kaufman JD, O’Neill MS. Associations between Recent Exposure to Ambient
Fine Particulate Matter and Blood Pressure in the Multi-Ethnic Study of
Atherosclerosis (MESA). Environmental Health Perspectives 2008; 116: 486-491.
12. Kateryna F, Sabine H, Anja V, Michael N, Susanne M, Hermann J, Christoph K,
Raimund E, Karl-Heinz J, Barbara H. Long-term Urban Background Particulate Air
Pollution Increases Arterial Blood Pressure. A48 AIR POLLUTION AND
CARDIOVASCULAR DISEASE, UPDATE ON MECHANISMS AND
EPIDEMIOLOGY: American Thoracic Society; 2010. p. A1712-A1712.
13. Fuks K, Moebus S, Hertel S, Viehmann A, Nonnemacher M, Dragano N, Möhlenkamp S,
Jakobs H, Kessler C, Erbel R. Long-term urban particulate air pollution, traffic noise,
and arterial blood pressure. Environmental Health Perspectives 2011; 119: 1706.
14. Schwartz J, Alexeeff SE, Mordukhovich I, Gryparis A, Vokonas P, Suh H, Coull BA.
Association between long-term exposure to traffic particles and blood pressure in the
Veterans Administration Normative Aging Study. Occupational and environmental
medicine 2012; 69: 422-427.
15. Dadvand P, Ostro B, Figueras F, Foraster M, Basagaña X, Valentín A, Martinez D,
Beelen R, Cirach M, Hoek G. Residential proximity to major roads and term low birth
weight: the roles of air pollution, heat, noise, and road-adjacent trees. Epidemiology
2014; 25: 518-525.
16. Brook RD, Rajagopalan S, Pope CAI, Brook JR, Bhatnagar A, Diez-Roux AV, al. e.
Particulate matter air pollution and cardiovascular disease: an update to the scientific
statement from the American Heart Association. Circulation 2010; 68: 224-230.
17. Schultz ES, Hallberg J, Bellander T, Bergström A, Bottai M, Chiesa F, Gustafsson PM,
Gruzieva O, Thunqvist P, Pershagen G, Melén E. Early-Life Exposure to Traffic-
related Air Pollution and Lung Function in Adolescence. American Journal of
Respiratory and Critical Care Medicine 2015; 193: 171-177.
18. Chuang K-J, Chan C-C, Su T-C, Lee C-T, Tang C-S. The Effect of Urban Air Pollution
on Inflammation, Oxidative Stress, Coagulation, and Autonomic Dysfunction in
Young Adults. American Journal of Respiratory and Critical Care Medicine 2007;
176: 370-376.
19. Lee M-S, Hang J, Zhang F, Dai H, Su L, Christiani DC. In-home solid fuel use and
cardiovascular disease: a cross-sectional analysis of the Shanghai Putuo study.
Environ Health 2012; 11: 1-8.
20. Dutta A, Ray MR. Hypertension and respiratory health in biomass smoke-exposed
premenopausal Indian women. Air Qual Atmos Health 2014; 7: 229-238.
Page 19 of 43

American Journal of Respiratory and Critical Care Medicine
Copyright 2017 American Thoracic Society
21. Baumgartner J, Schauer JJ, Ezzati M, Lu L, Cheng C, Patz JA, Bautista LE. Indoor air
pollution and blood pressure in adult women living in rural china. Environ Health
Perspect 2011; 119: 1390-1395.
22. Alexander D, Larson T, Bolton S, Vedal S. Systolic blood pressure changes in indigenous
Bolivian women associated with an improved cookstove intervention. Air Quality,
Atmosphere & Health 2014; 8: 47-53.
23. McCracken JP, Smith KR, Diaz A, Mittleman MA, Schwartz J. Chimney stove
intervention to reduce long-term wood smoke exposure lowers blood pressure among
Guatemalan women. Environ Health Perspect 2007; 115: 996-1001.
24. Clark ML, Bachand AM, Heiderscheidt JM, Yoder SA, Luna B, Volckens J, Koehler KA,
Conway S, Reynolds SJ, Peel JL. Impact of a cleaner-burning cookstove intervention
on blood pressure in Nicaraguan women. Indoor Air 2013; 23: 105-114.
25. Mutlu GM, Green D, Bellmeyer A, Baker CM, Burgess Z, Rajamannan N, Christman JW,
Foiles N, Kamp DW, Ghio AJ, Chandel NS, Dean DA, Sznajder JI, Budinger GR.
Ambient particulate matter accelerates coagulation via an IL-6-dependent pathway.
The Journal of clinical investigation 2007; 117: 2952-2961.
26. Bartoli CR, Wellenius GA, Diaz EA, Lawrence J, Coull BA, Akiyama I, Lee LM, Okabe
K, Verrier RL, Godleski JJ. Mechanisms of inhaled fine particulate air pollution-
induced arterial blood pressure changes. Environmental Health Perspectives 2009;
117: 361-366.
27. Buchbinder A, Sibai BM, Caritis S, Macpherson C, Hauth J, Lindheimer MD, Klebanoff
M, Vandorsten P, Landon M, Paul R, Miodovnik M, Meis P, Thurnau G, Units
NIoCHaHDNoM-FM. Adverse perinatal outcomes are significantly higher in severe
gestational hypertension than in mild preeclampsia. American Journal of Obstetrics
and Gynecology 2002; 186: 66-71.
28. van Middendorp D, ten Asbroek A, Bio FY, Edusei A, Meijjer L, Newton S, Agyemang
C. Rural and urban differences in blood pressure and pregnancy-induced hypertension
among pregnant women in Ghana. Globalization and Health 2013; 9: 59.
29. Pope DP, Mishra V, Thompson L, Siddiqui AR, Rehfuess EA, Weber M, Bruce N. Risk
of low birth weight and stillbirth associated with indoor air pollution from solid fuel
use in developing countries. Epidemiol Rev 2010; 32: 70-81.
30. Gall ET, Carter EM, Earnest CM, Stephens B. Indoor air pollution in developing
countries: research and implementation needs for improvements in global public
health. American Journal of Public Health 2013; 103: e67-72.
31. Romieu I, Riojas-Rodriguez H, Marron-Mares AT, Schilmann A, Perez-Padilla R,
Masera O. Improved biomass stove intervention in rural Mexico: impact on the
respiratory health of women. Am J Respir Crit Care Med 2009; 180: 649-656.
32. Organization WH. Indoor Air Quality Guidelines: Household Fuel Combustion. 2014.
33. Brauer M, Bartlett K, Regalado-Pineda J, Perez-Padilla R. Assessment of Particulate
Concentrations from Domestic
Biomass Combustion in Rural Mexico. ENVIRONMENTAL SCIENCE & TECHNOLOGY
1996; 30: 104-109.
34. Alexander D, Northcross A, Pandya R, Adu D, Ibigbami T, Olajumilo J, Karrison T,
Ojengbede O, Olopade C. RAndomized controlled study of bioethanol stove
intervention on blood pressure changes during pregnancy in nigerian women. Chest
2015; 148: 763A-763A.
35. Matts JP, Lachin JM. Properties of permuted-block randomization in clinical trials.
Controlled Clinical Trials 1988; 9: 327-344.
36. Diggle P, Heagerty P, Liang K-Y, Zeger S. Analysis of longitudinal data. OUP Oxford;
2013.
Page 20 of 43

American Journal of Respiratory and Critical Care Medicine
Copyright 2017 American Thoracic Society
37. Hermida RC, Ayala DE, Mojon A, Fernandez JR, Alonso I, Silva I, Ucieda R, Iglesias M.
Blood pressure patterns in normal pregnancy, gestational hypertension, and
preeclampsia. Hypertension (Dallas, Tex : 1979) 2000; 36: 149-158.
38. Rebelo F, Farias DR, Mendes RH, Schlüssel MM, Kac G. Blood Pressure Variation
Throughout Pregnancy According to Early Gestational BMI: A Brazilian Cohort.
Arquivos Brasileiros de Cardiologia 2015; 104: 284-291.
39. Quinn AK, Ae-Ngibise KA, Jack DW, Boamah EA, Enuameh Y, Mujtaba MN, Chillrud
SN, Wylie BJ, Owusu-Agyei S, Kinney PL, Asante KP. Association of Carbon
Monoxide exposure with blood pressure among pregnant women in rural Ghana:
Evidence from GRAPHS. International journal of hygiene and environmental health
2016; 219: 176-183.
40. Norris C, Goldberg MS, Marshall JD, Valois M-F, Pradeep T, Narayanswamy M, Jain G,
Sethuraman K, Baumgartner J. A panel study of the acute effects of personal exposure
to household air pollution on ambulatory blood pressure in rural Indian women.
Environmental Research 2016; 147: 331-342.
41. Choi J-Y, Baumgartner J, Harnden S, Alexander BH, Town RJ, D'Souza G,
Ramachandran G. Increased risk of respiratory illness associated with kerosene fuel
use among women and children in urban Bangalore, India. Occupational and
Environmental Medicine 2014: oemed-2014-102472.
42. Bates MN, Chandyo RK, Valentiner-Branth P, Pokhrel AK, Mathisen M, Basnet S,
Shrestha PS, Strand TA, Smith KR. Acute lower respiratory infection in childhood
and household fuel use in Bhaktapur, Nepal. Environ Health Perspect 2013; 121: 637-
642.
43. IWA. Guidelines for evaluating cookstove performance. 2012 [cited 2016 May 2].
Available from: http://www.iso.org/iso/catalogue_detail?csnumber=61975.
44. Naeher LP. Biomass-fueled intervention stoves in the developing world: potential and
challenges. Am J Respir Crit Care Med 2009; 180: 586-587.
45. Lee P-C, Roberts JM, Catov JM, Talbott EO, Ritz B. First trimester exposure to ambient
air pollution, pregnancy complications and adverse birth outcomes in Allegheny
County, PA. Maternal and child health journal 2013; 17: 545-555.
46. van den Hooven EH, de Kluizenaar Y, Pierik FH, Hofman A, van Ratingen SW,
Zandveld PY, Mackenbach JP, Steegers EA, Miedema HM, Jaddoe VW. Air
pollution, blood pressure, and the risk of hypertensive complications during
pregnancy the generation R study. Hypertension (Dallas, Tex : 1979) 2011; 57: 406-
412.
Page 21 of 43

American Journal of Respiratory and Critical Care Medicine
Copyright 2017 American Thoracic Society
Tables
Table 1. Baseline Demographic and Clinical Distributions by Intervention Arm
Variable Ethanol
(n = 162)
Control
(n = 162)
Clinic
Agbongbon 76 (47.2%) 68 (42.2%)
Olorisaoko 43 (26.7%) 47 (29.2%)
Oranyan 42 (26.1%) 46 (28.6%)
Missing 1 1
Diabetic
Yes 2 (1.2%) 3 (1.9%)
No 159 (98.8%) 158 (98.1%)
Missing 1 1
Number of
Children
None 41 (25.5%) 42 (25.9%)
1-2 72 (44.7%) 71 (43.8%)
3-4 37 (23.0%) 45 (27.8%)
>4 11 (6.8%) 4 (2.5%)
Missing 1 0
Marital Status
Single 17 (10.6%) 7 (4.3%)
Married 143 (88.8%) 155 (95.7%)
Page 22 of 43

American Journal of Respiratory and Critical Care Medicine
Copyright 2017 American Thoracic Society
Separated 1 (0.6%) 0 (0.0%)
Missing 1 0
Age (years)
Mean, SD 28.0, 6.1 27.9, 5.4
(range) (15 – 44) (14 – 42)
Missing 10 12
BMI (kg/m2)
Mean, SD 23.2, 4.2 24.7, 5.3
(range) (14.2-36.2) (17.1 – 45.0)
Missing 10 12
Education Level
None 51 (31.7%) 58 (35.8%)
Primary
School
16 (9.9%) 17 (10.5%)
Junior
Secondary
9 (5.6%) 13 (8.0%)
Senior
Secondary
68 (42.2%) 60 (37.0%)
High School 10 (6.2%) 6 (3.7%)
Polytechnic 7 (4.4%) 6 (3.7%)
University 0 (0.0%) 2 (1.2%)
Missing 1 0
Literate
Yes 100 (62.1%) 92 (56.8%)
Page 23 of 43

American Journal of Respiratory and Critical Care Medicine
Copyright 2017 American Thoracic Society
No 61 (37.9%) 70 (43.2%)
Missing 1 0
Gestational Age
at Entry (weeks)
Mean, SD 12.9, 3.0 13.1, 3.0
(range) (6.7 – 18.0) (7.1 – 18.0)
Missing 3 5
Prior
Miscarriage
Yes 43 (26.7%) 47 (29.0%)
No 118 (73.3%) 115 (71.0%)
Missing 1 0
# of
Miscarriages
None 118 (73.3%) 115 (71.0%)
1 30 (18.6%) 36 (22.2%)
2 10(6.2%) 7 (1.8%)
=> 3 3 (1.9%) 4 (2.5%)
Missing 1 0
Prior Stillbirth
Yes 12 (7.4%) 14 (8.6%)
No 149 (92.6%) 148 (91.4%)
Missing 1 0
Page 24 of 43

American Journal of Respiratory and Critical Care Medicine
Copyright 2017 American Thoracic Society
Table 2. Mean Systolic and Diastolic Blood Pressure at Each Prenatal Visit
Ethanol Control
N Mean
mm Hg
SD N Mean
mm Hg
SD
Visit 1 SBP
DBP
161 110.4 11.9 159 111.3 10.8
161 69.2 9.5 159 70.0 103
Visit 2 SBP
DBP
150 107.2 11.4 153 109.0 10.5
150 66.7 83 153 66.3 8.6
Visit 3 SBP
DBP
148 107.6 110 144 108.7 10.5
148 67.1 7.9 144 67.3 8
Visit 4 SBP
DBP
150 108.3 10.3 146 109.9 11.1
151 66.5 9.1 146 68.2 8.2
Visit 5 SBP
DBP
149 109.5 12.2 135 111.0 11.1
148 68.9 8.3 135 70.0 9.0
Visit 6 SBP
DBP
148 111.5 12.1 138 112.8 14.1
148 70.1 8.6 137 72.9 10.2
SD: standard deviation; Visit 1: baseline, Visits 2-6: post randomization
Page 25 of 43

American Journal of Respiratory and Critical Care Medicine
Copyright 2017 American Thoracic Society
Table 3. Prevalence of hypertension at last visit prior to delivery
A. Ethanol vs. Control
Arterial blood pressure Ethanol (E)
(n=158) a
Control (C)
(n= 155) a
P value
Normal (SBP <120 and DBP <80 mmHg) 118 (74.7%) 106 (68.0%)
Pre-hypertension (SBP 120-139 and DBP
80-89 mmHg)
37 (23.4%) 39(25.2%)
Hypertension (SBP ≥ 140 and/or DBP ≥
90 mmHg)
3 (1.9%) 10 (6.4%)
0.051b
Fisher’s exact test, 3x2 table: p= 0.106
B. K→E vs. K→K
Arterial blood pressure (K→E)
(n=110)a
(K→K)
(n= 102)a
P value
Normal (SBP <120 and DBP <80 mmHg) 79 (71.8%) 66 (64.7%)
Pre-hypertension (SBP 120-139 and DBP
80-89 mmHg)
29 (26.4%) 27 (26.5%)
Hypertension (SBP ≥ 140 and/or DBP ≥
90 mmHg)
2 (1.8%) 9 (8.8%)
0.029b
Fisher’s exact test, 3x2 table: p=0.065
Page 26 of 43
American Journal of Respiratory and Critical Care Medicine
Copyright 2017 American Thoracic Society
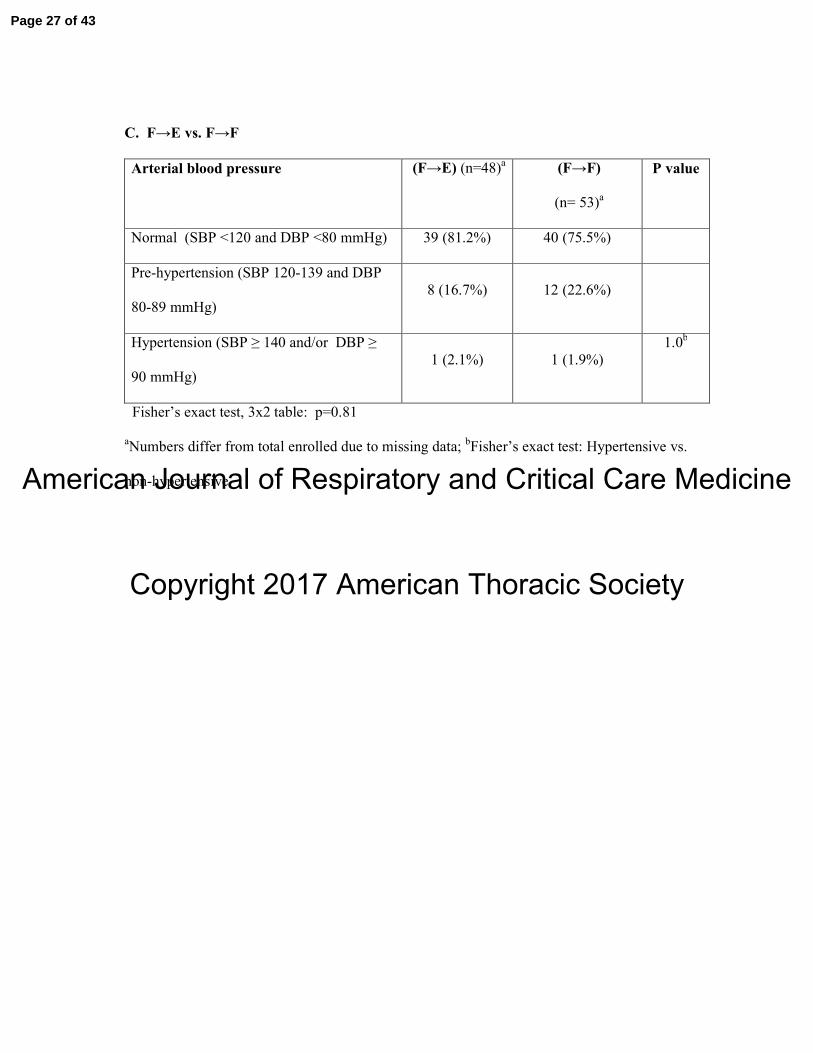
C. F→E vs. F→F
Arterial blood pressure (F→E) (n=48)a (F→F)
(n= 53)a
P value
Normal (SBP <120 and DBP <80 mmHg) 39 (81.2%) 40 (75.5%)
Pre-hypertension (SBP 120-139 and DBP
80-89 mmHg)
8 (16.7%) 12 (22.6%)
Hypertension (SBP ≥ 140 and/or DBP ≥
90 mmHg)
1 (2.1%) 1 (1.9%)
1.0b
Fisher’s exact test, 3x2 table: p=0.81
aNumbers differ from total enrolled due to missing data;
bFisher’s exact test: Hypertensive vs.
non-hypertensive
Page 27 of 43
American Journal of Respiratory and Critical Care Medicine
Copyright 2017 American Thoracic Society
Figure legends
Figure 1. Visual representation of study flow and data collection. The number randomized
per treatment group and the number of subjects with blood pressure data available at each
clinic visit are also shown.
Figure 2A. SBP by Time Since Randomization and LOWESS curves– All Participants
(Red: Ethanol, Blue: Control).
Figure 2B. DBP by Time Since Randomization and LOWESS curves– All Participants
(Red: Ethanol, Blue: Control).
Figure 3A. Mean SBP by Visit – All Participants
(Red: Ethanol, Blue: Control). Error bars indicate one standard error. BL: Baseline.
Figure 3B. Mean DBP by Visit – All Participants
(Red: Ethanol, Blue: Control). Error bars indicate one standard error. BL: Baseline.
Figure 4A. Mean SBP by Visit – Baseline Kerosene Users
(Red: Ethanol, Blue: Control), Error bars indicate one standard error. BL: Baseline.
Figure 4B. Mean DBP by Visit – Baseline Kerosene Users
(Red: Ethanol, Blue: Control), Error bars indicate one standard error. BL: Baseline.
Figure 5A. Mean SBP by Visit – Baseline Firewood Users
(Red: Ethanol, Blue: Control), Error bars indicate one standard error. BL: Baseline.
Figure 5B. Mean DBP by Visit – Baseline Firewood Users
(Red: Ethanol, Blue: Control), Error bars indicate one standard error. BL: Baseline.
Page 28 of 43

American Journal of Respiratory and Critical Care Medicine
Copyright 2017 American Thoracic Society
Figure 1. Visual representation of study flow and data collection
Randomized
Ibadan Cookstoves and Low Birth Weight Study
Local Community Hospital
(N=161) Clinic Visit 1: Eligibility, Consent, Questionnaires, BP Measurement #1 (N=159)
Exclusion Criteria
• Smoker(s)
• Twins or more
• > 18 weeks gestation
• Fetal anomalies
• ≥ 3 miscarriages
• Previous C-section
• 1st pregnancy > 35
• Uncontrolled hypertension
• Cook for income
Kerosene/Firewood
(N=162) Ethanol stoves
(N=162)
Home Visit: Monitor installation, Exposure Education
(N=150) Clinic Visit 2: ~20-Week Gestational Age, BP Measurement #2 (N=153)
(N=148) Clinic Visit 3: ~26-Week Gestational Age, BP Measurement #3 (N=144)
(N=150) Clinic Visit 4: ~30-Week Gestational Age, BP Measurement #4 (N=146)
(N=149) Clinic Visit 5: ~34-Week Gestational Age, BP Measurement #5 (N=135)
(N=148) Clinic Visit 6: ~38-Week Gestational Age, BP Measurement #6 (N=138)
Page 29 of 43

American Journal of Respiratory and Critical Care Medicine
Copyright 2017 American Thoracic Society
Figure 2A. SBP by Time Since Randomization and LOWESS Curves– All Participants
(Red: Ethanol, Blue: Control).
60
80
100
120
140
160
180
Systo
lic B
lood P
ressure
-60 -30 0 30 60 90 120 150 180Time since randomization (days)
Page 30 of 43

American Journal of Respiratory and Critical Care Medicine
Copyright 2017 American Thoracic Society
Figure 2B. DBP by Time Since Randomization and LOWESS Curves– All Participants
(Red: Ethanol, Blue: Control).
40
60
80
100
120
Dia
sto
lic B
lood P
ressure
-60 -30 0 30 60 90 120 150 180Time since randomization (days)
Page 31 of 43

American Journal of Respiratory and Critical Care Medicine
Copyright 2017 American Thoracic Society
Figure 3A. Mean SBP by Visit – All Participants (Red: Ethanol, Blue: Control). Error bars indicate one standard error. BL: Baseline.
100
105
110
115
Mean S
BP
13 Wk (BL) 20 Wk 26 Wk 30 Wk 34 Wk 38 WkGestational Age
Page 32 of 43

American Journal of Respiratory and Critical Care Medicine
Copyright 2017 American Thoracic Society
Figure 3B. Mean DBP by Visit – All Participants
(Red: Ethanol, Blue: Control). Error bars indicate one standard error. BL: Baseline.
60
65
70
75
Mean D
BP
13 Wk (BL) 20 Wk 26 Wk 30 Wk 34 Wk 38 WkGestational Age
Page 33 of 43

American Journal of Respiratory and Critical Care Medicine
Copyright 2017 American Thoracic Society
Figure 4A. Mean SBP by Visit – Baseline Kerosene Users
(Red: Ethanol, Blue: Control). Error bars indicate one standard error. BL: Baseline.
100
105
110
115
Mean S
BP
13 Wk (BL) 20 Wk 26 Wk 30 Wk 34 Wk 38 WkGestational Age
Page 34 of 43

American Journal of Respiratory and Critical Care Medicine
Copyright 2017 American Thoracic Society
Figure 4B. Mean DBP by Visit – Baseline Kerosene Users
(Red: Ethanol, Blue: Control). Error bars indicate one standard error. BL: Baseline.
60
65
70
75
Mean D
BP
13 WK (BL) 20 Wk 26 Wk 30 Wk 34 Wk 38 WkGestational Age
Page 35 of 43

American Journal of Respiratory and Critical Care Medicine
Copyright 2017 American Thoracic Society
Figure 5A. Mean SBP by Visit – Baseline Firewood Users
(Red: Ethanol, Blue: Control). Error bars indicate one standard error. BL: Baseline.
100
105
110
115
Mean S
BP
13 Wk (BL) 20 Wk 26 Wk 30 Wk 34 Wk 38 WkGestational Age
Page 36 of 43

American Journal of Respiratory and Critical Care Medicine
Copyright 2017 American Thoracic Society
Figure 5B. Mean DBP by Visit – Baseline Firewood Users
(Red: Ethanol, Blue: Control). Error bars indicate one standard error. BL: Baseline.
60
65
70
75
Mean D
BP
13 Wk (BL) 20 Wk 26 Wk 30 Wk 34 Wk 38 WkGestational Age
Page 37 of 43

American Journal of Respiratory and Critical Care Medicine
Copyright 2017 American Thoracic Society
Supplemental Table S1. Mean Systolic and Diastolic Blood Pressure at Each Prenatal Visit
by Stove Type at Entry.
Baseline Kerosene Users Baseline Firewood Users
K→E K→K F→E F→F
N Mean
mm Hg
SD N Mean
mm Hg
SD N Mean
mm Hg
SD N Mean
mm Hg
SD
Visit 1 SBP
DBP
110 110.4 12.5 102 111.0 11.2 51 110.4 10.6 57 111.6 10.1
110 68.8 10.1 102 70.0 10.0 51 69.9 8.1 57 70.0 10.8
Visit 2 SBP
DBP
100 108.5 11.5 98 109.0 10.9 50 104.7 10.9 55 108.9 9.8
100 67.2 8.8 98 66.2 8.7 50 65.9 7.0 55 66.5 8.6
Visit 3 SBP
DBP
99 108.4 11.6 94 109.2 11.2 49 105.9 9.6 50 107.8 9.0
99 675 8.4 94 67.1 9.1 49 66.2 6.9 50 67.7 8.1
Visit 4 SBP
DBP
100 109.1 9.6 92 109.9 11.8 50 106.6 11.5 54 110.1 9.9
101 67.0 9.8 92 68.6 8.5 50 65.5 7.4 54 67.6 7.8
Visit 5 SBP
DBP
98 111.0 12.9 89 112.8 11.7 51 106.7 10.4 46 107.5 9.0
97 69.7 8.6 89 71.3 8.9 51 67.4 7.6 46 67.5 8.8
Visit 6 SBP
DBP
98 112.5 12.9 87 114.3 16.0 50 109.6 10.3 51 110.2 9.5
98 70.9 8.4 86 74.5 10.7 50 68.7 8.7 51 70.2 8.8
SD: standard deviation; Visit 1: baseline, Visits 2-6: post randomization
Page 38 of 43
American Journal of Respiratory and Critical Care Medicine
Copyright 2017 American Thoracic Society
Figure legends
Supplemental Figure S1A. SBP by Time Since Randomization and LOWESS Curves-
Baseline Kerosene Users (Red: K→E, Blue: K→K).
Supplemental Figure S1B. DBP by Time Since Randomization and LOWESS Curves-
Baseline Kerosene Users (Red: K→E, Blue: K→K).
Supplemental Figure S2A. SBP by Time Since Randomization and LOWESS Curves-
Baseline Firewood Users (Red: F→E, Blue: F→F).
Supplemental Figure S2B. DBP by Time Since Randomization and LOWESS Curves-
Baseline Firewood Users (Red: F→E, Blue: F→F).
Page 39 of 43

American Journal of Respiratory and Critical Care Medicine
Copyright 2017 American Thoracic Society
Supplemental Figure S1A. SBP by Time Since Randomization and LOWESS Curves -
Baseline Kerosene Users (Red: K→E: Blue: K→K).
60
80
100
120
140
160
180
Systo
lic B
lood P
ressure
-60 -30 0 30 60 90 120 150 180Time since randomization (days)
Page 40 of 43

American Journal of Respiratory and Critical Care Medicine
Copyright 2017 American Thoracic Society
Supplemental Figure S1B. DBP by Time Since Randomization and LOWESS Curves -
Baseline Kerosene Users (Red: K→E, Blue: K→K).
40
60
80
100
120
Dia
sto
lic B
lood P
ressure
-60 -30 0 30 60 90 120 150 180Time since randomization (days)
Page 41 of 43

American Journal of Respiratory and Critical Care Medicine
Copyright 2017 American Thoracic Society
Supplemental Figure S2A. SBP by Time Since Randomization and LOWESS Curves -
Baseline Firewood Users (Red: F→E, Blue: F→F).
60
80
100
120
140
160
180
Systo
lic B
lood P
ressure
-60 -30 0 30 60 90 120 150 180Time since randomization (days)
Page 42 of 43
American Journal of Respiratory and Critical Care Medicine
Copyright 2017 American Thoracic Society
Supplemental Figure S2B. DBP by Time Since Randomization and LOWESS Curves -
Baseline Firewood Users (Red: F→E, Blue: F→F).
40
60
80
100
120
Dia
sto
lic B
lood P
ressure
-60 -30 0 30 60 90 120 150 180Time since randomization (days)
Page 43 of 43