American Gas Association Financial Forum...UGI Corporation | AGA Financial Forum 2 . UGI Corporation...
52
American Gas Association Financial Forum May 2017
Transcript of American Gas Association Financial Forum...UGI Corporation | AGA Financial Forum 2 . UGI Corporation...
American Gas Association Financial Forum
May 2017
About This Presentation
This presentation contains certain forward-looking statements that management believes to be reasonable as of today’s date only. Actual results may differ significantly because of risks and uncertainties that are difficult to predict and many of which are beyond management’s control. You should read UGI’s Annual Report on Form 10-K for a more extensive list of factors that could affect results. Among them are adverse weather conditions, cost volatility and availability of all energy products, including propane, natural gas, electricity and fuel oil, increased customer conservation measures, the impact of pending and future legal proceedings, liability for uninsured claims and for claims in excess of insurance coverage, domestic and international political, regulatory and economic conditions in the United States and in foreign countries, including the current conflicts in the Middle East, and foreign currency fluctuations (particularly the euro), changes in Marcellus Shale gas production, the availability, timing and success of our acquisitions, commercial initiatives and investments to grow our business, our ability to successfully integrate acquired businesses and achieve anticipated synergies, and the interruption, disruption, failure, malfunction, or breach of information technology systems, including due to cyber attack. UGI undertakes no obligation to release revisions to its forward-looking statements to reflect events or circumstances occurring after today. In addition, this presentation uses certain non-GAAP financial measures. Please see the appendix for reconciliations of these measures to the most comparable GAAP financial measure.
2 UGI Corporation | AGA Financial Forum
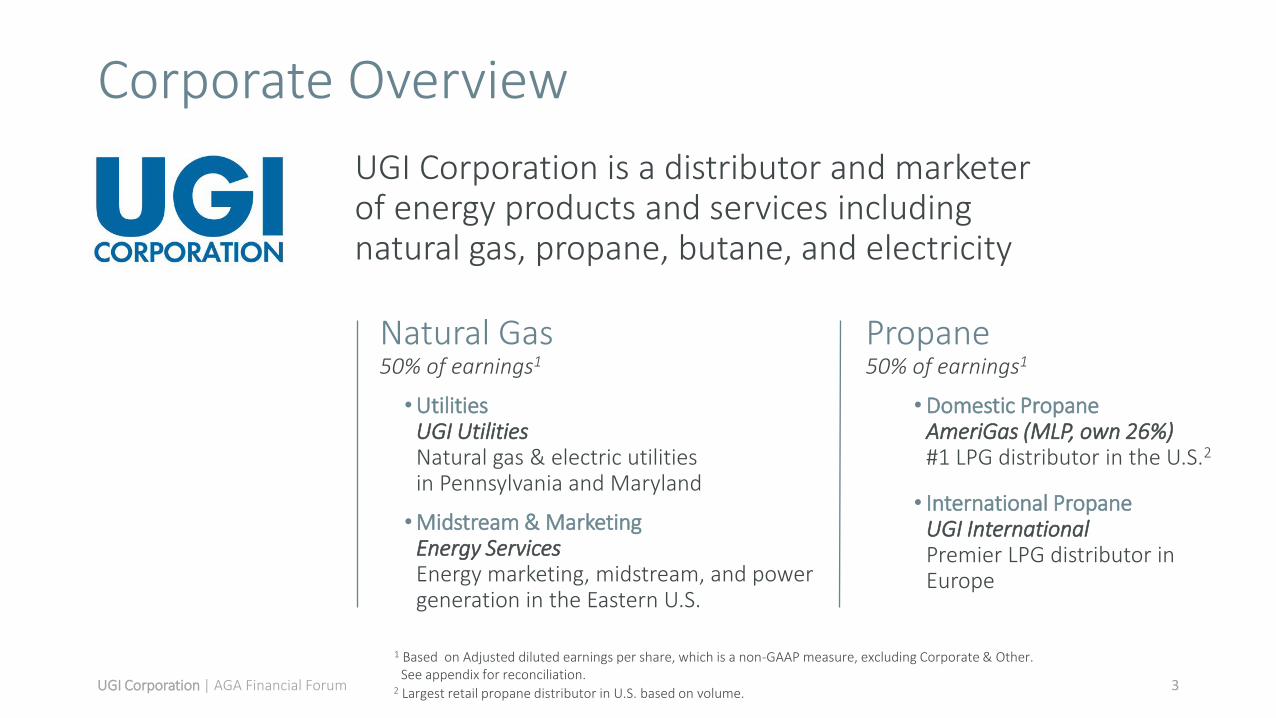
UGI Corporation is a distributor and marketer of energy products and services including natural gas, propane, butane, and electricity
Propane 50% of earnings1
• Domestic Propane AmeriGas (MLP, own 26%) #1 LPG distributor in the U.S.2
• International Propane UGI International Premier LPG distributor in Europe
3
Corporate Overview
Natural Gas 50% of earnings1
• Utilities UGI Utilities Natural gas & electric utilities in Pennsylvania and Maryland
• Midstream & Marketing Energy Services Energy marketing, midstream, and power generation in the Eastern U.S.
1 Based on Adjusted diluted earnings per share, which is a non-GAAP measure, excluding Corporate & Other. See appendix for reconciliation. 2 Largest retail propane distributor in U.S. based on volume.
UGI Corporation | AGA Financial Forum
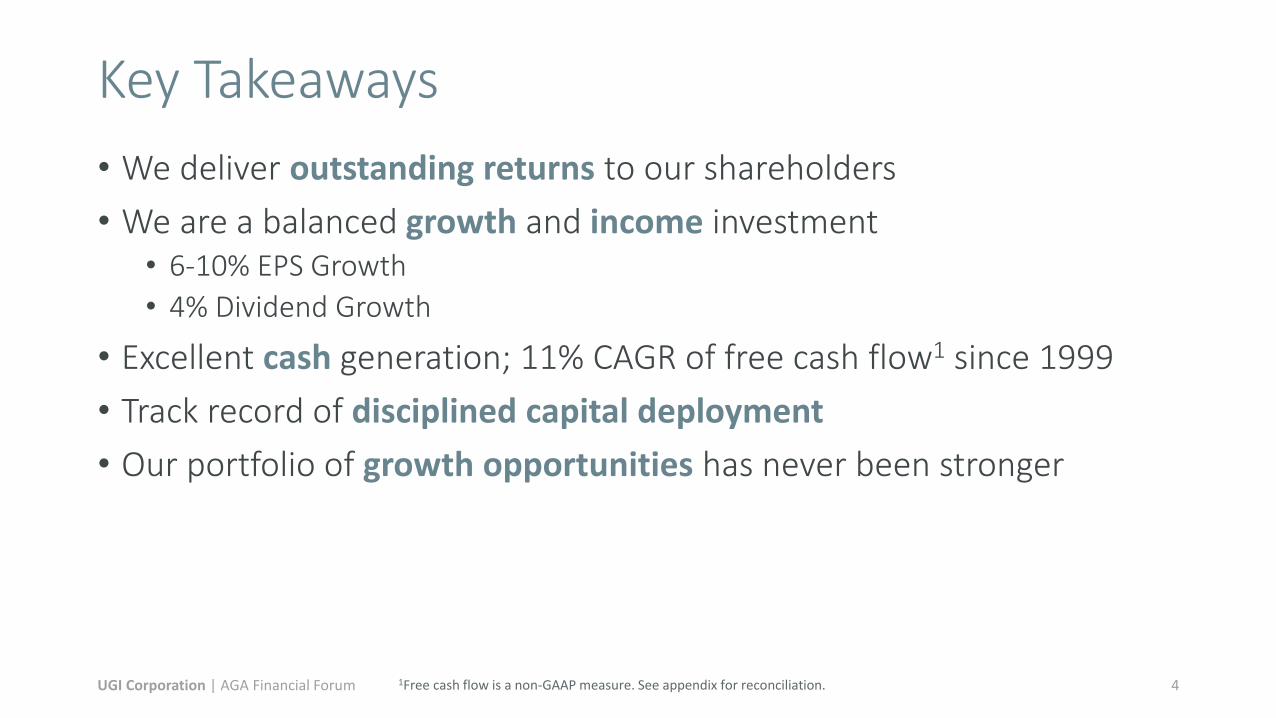
Key Takeaways
• We deliver outstanding returns to our shareholders
• We are a balanced growth and income investment • 6-10% EPS Growth
• 4% Dividend Growth
• Excellent cash generation; 11% CAGR of free cash flow1 since 1999
• Track record of disciplined capital deployment
• Our portfolio of growth opportunities has never been stronger
4 1Free cash flow is a non-GAAP measure. See appendix for reconciliation. UGI Corporation | AGA Financial Forum
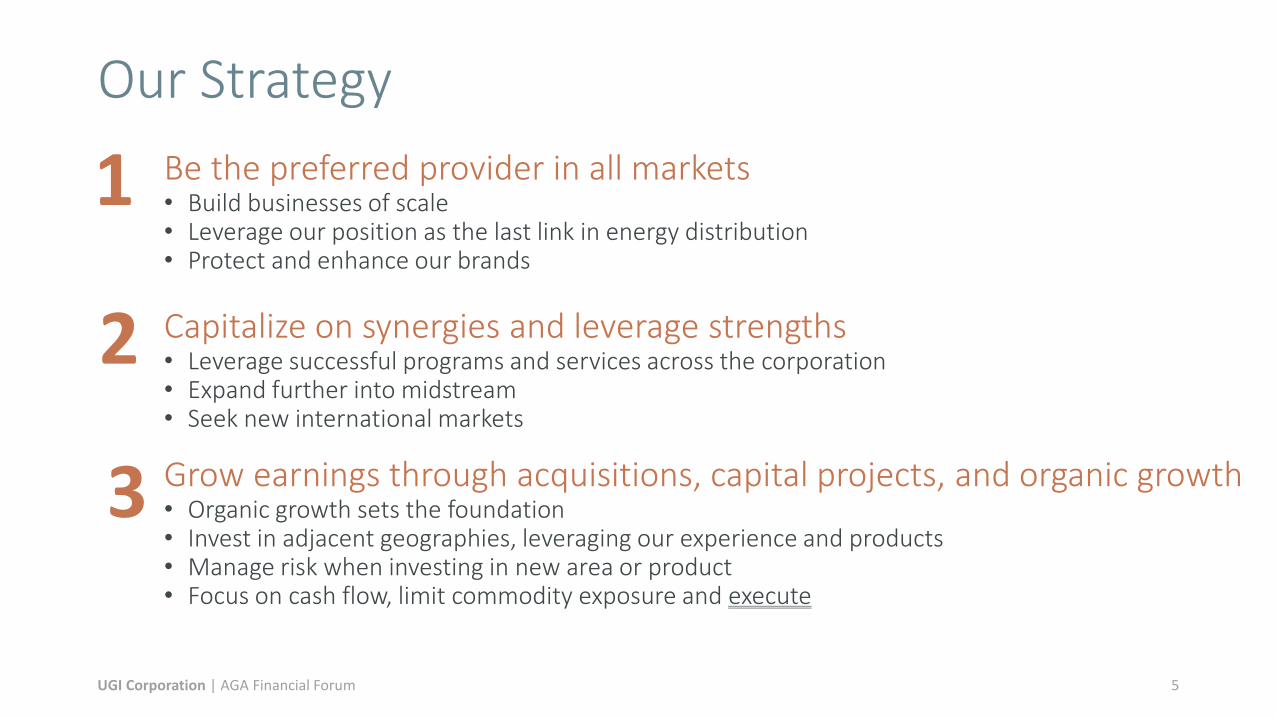
Our Strategy
5
Be the preferred provider in all markets • Build businesses of scale • Leverage our position as the last link in energy distribution • Protect and enhance our brands
1
Capitalize on synergies and leverage strengths • Leverage successful programs and services across the corporation • Expand further into midstream • Seek new international markets
2
Grow earnings through acquisitions, capital projects, and organic growth • Organic growth sets the foundation • Invest in adjacent geographies, leveraging our experience and products • Manage risk when investing in new area or product • Focus on cash flow, limit commodity exposure and execute
3
UGI Corporation | AGA Financial Forum

How Have We Executed on Strategy?
• Successfully invested $8.4 billion from 2000-2016 to build our current business portfolio
• Dramatically expanded our legacy businesses - Utilities and AmeriGas
• Rapidly grew two major business units – Energy Services and UGI International
• Strong financial attributes of UGI’s business contributed to superior financial results
• FY2012A – FY2017 Guidance1 adjusted EPS CAGR of 13.0%2
• Five year (FY2011 – FY2016) free cash flow CAGR of 15.9%2
• 10 & 20-year average total shareholder returns of 13.0% and 16.3%, respectively, for periods ending 4/30/17.
6
2Adjusted earnings per share and free cash flow are non-GAAP measures. See appendix for reconciliation.
UGI Corporation | Investor Overview
1 Based on low-end of FY 2017 guidance range of $2.30 – 2.45.
Because we are unable to predict certain potentially material items affecting diluted earnings per share on a GAAP basis, principally mark-to-market gains and losses on commodity derivative instruments and Finagaz integration expenses, we cannot reconcile 2017 adjusted diluted earnings per share, a non-GAAP measure, to diluted earnings per share, the most directly comparable GAAP measure, in reliance on the “unreasonable efforts” exception set forth in SEC rules.

UGI Growth Engine
Income-producing businesses support disciplined growth objectives by generating cash for growth opportunities and dividends
7 Note: all figures represent multi-year average targets. 1 After business unit CAPEX
Base business earnings growth
3-4%
Dividends
$160 MM-$180 MM
Incremental earnings growth
3-6%
Organic Investment and M&A1
$190 MM-$220 MM
Cash Flow
$350 MM-$400 MM
6-10% EPS Growth and 4% Dividend Growth
UGI Corporation | AGA Financial Forum

How Have We Executed on Strategy?
• Successfully invested $8.4 billion from 2000-2016 to build our current business portfolio
• Dramatically expanded our legacy businesses - Utilities and AmeriGas
• Rapidly grew two major business units – Energy Services and UGI International
• Strong financial attributes of UGI’s business contributed to superior financial results
• FY2012A – FY2017 Guidance1 adjusted EPS CAGR of 13.0%2
• Five year (FY2011 – FY2016) free cash flow CAGR of 15.9%2
• 10 & 20-year average total shareholder returns of 13.0% and 16.3%, respectively, for periods ending 4/30/17.
8
2Adjusted earnings per share and free cash flow are non-GAAP measures. See appendix for reconciliation.
1 Based on low-end of FY 2017 guidance range of $2.30 – 2.45.
Because we are unable to predict certain potentially material items affecting diluted earnings per share on a GAAP basis, principally mark-to-market gains and losses on commodity derivative instruments and Finagaz integration expenses, we cannot reconcile 2017 adjusted diluted earnings per share, a non-GAAP measure, to diluted earnings per share, the most directly comparable GAAP measure, in reliance on the “unreasonable efforts” exception set forth in SEC rules. UGI Corporation | AGA Financial Forum

UGI Has Consistently Outperformed Total Shareholder Return as of 4/30/17
9
0%
10%
20%
30%
UGI S&P 500Utilities
S&P 400Midcap
S&P 500
1 Year Total Return
0%
5%
10%
15%
20%
25%
UGI S&P 500Utilities
S&P 400Midcap
S&P 500
3 Year Total Return
0%
10%
20%
30%
UGI S&P 500Utilities
S&P 400Midcap
S&P 500
5 Year Total Return
0%
5%
10%
15%
UGI S&P 500Utilities
S&P 400Midcap
S&P 500
10 Year Total Return
0%
5%
10%
15%
20%
UGI S&P 500Utilities
S&P 400Midcap
S&P 500
15 Year Total Return
0%
5%
10%
15%
20%
UGI S&P 500Utilities
S&P 400Midcap
S&P 500
20 Year Total Return
UGI Corporation | AGA Financial Forum
10
$0
$200
$400
$600
$800
1999 2000 2001 2002 2003 2004 2005 2006 2007 2008 2009 2010 2011 2012 2013 2014 2015 2016
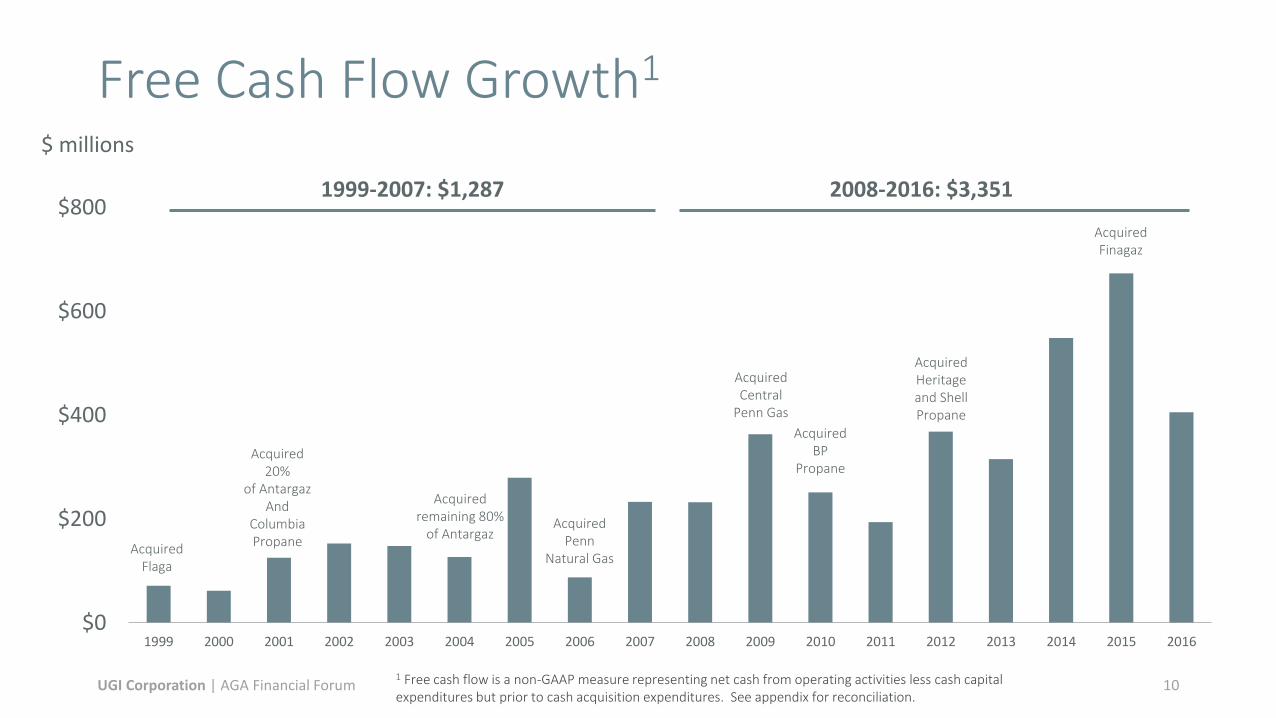
Free Cash Flow Growth1
Acquired Flaga
Acquired 20%
of Antargaz And
Columbia Propane
Acquired remaining 80%
of Antargaz Acquired
Penn Natural Gas
Acquired Central
Penn Gas
Acquired Finagaz
Acquired Heritage and Shell Propane
Acquired BP
Propane
$ millions
1999-2007: $1,287 2008-2016: $3,351
1 Free cash flow is a non-GAAP measure representing net cash from operating activities less cash capital expenditures but prior to cash acquisition expenditures. See appendix for reconciliation.
UGI Corporation | AGA Financial Forum

2012 – 2017 Comparison
$ 1.32 $ 0.07
$ 0.37
$ 0.27 $ 0.14 $ 0.05 $ 2.22
YTD 2012 AmeriGas UGI
International Midstream &
Marketing UGI Utilities Corp & other YTD 2017
$2.50
$2.00
$1.50
$1.00
$0.50
$-
Adjusted EPS1
1Adjusted EPS is a non-GAAP measure. See appendix for reconciliation. UGI Corporation | AGA Financial Forum 11
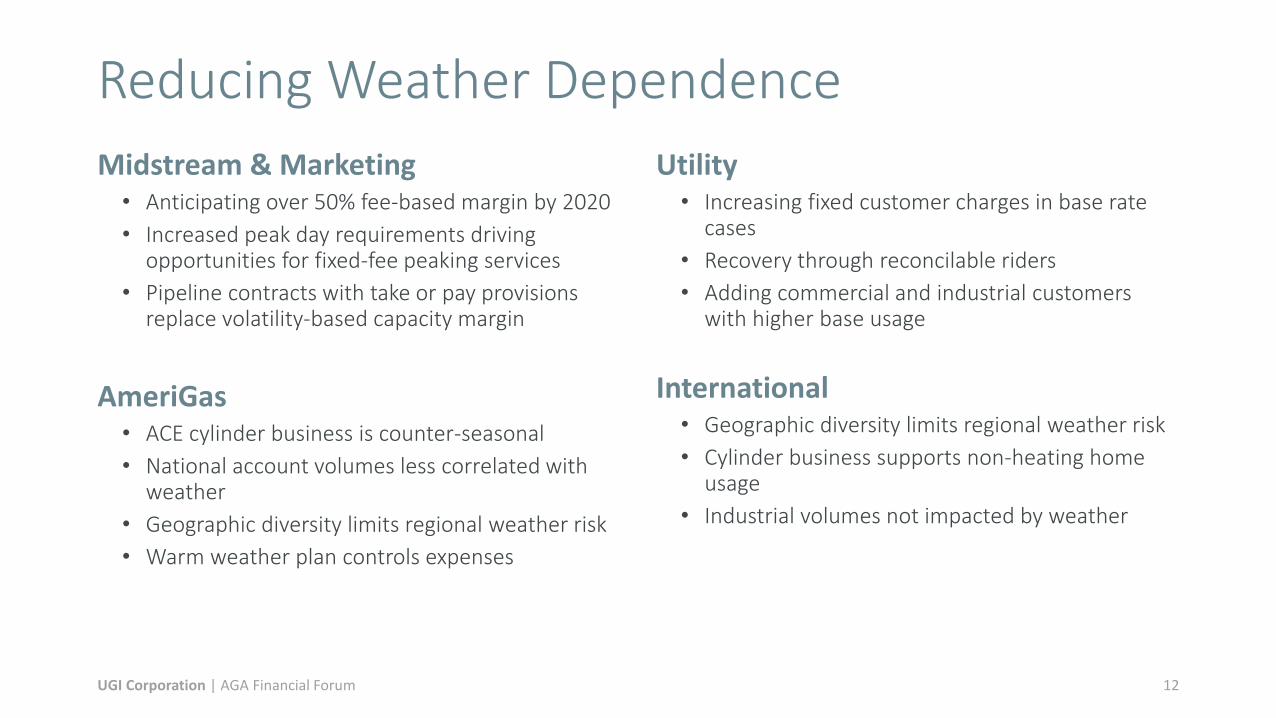
Midstream & Marketing • Anticipating over 50% fee-based margin by 2020
• Increased peak day requirements driving opportunities for fixed-fee peaking services
• Pipeline contracts with take or pay provisions replace volatility-based capacity margin
AmeriGas • ACE cylinder business is counter-seasonal
• National account volumes less correlated with weather
• Geographic diversity limits regional weather risk
• Warm weather plan controls expenses
Utility • Increasing fixed customer charges in base rate
cases
• Recovery through reconcilable riders
• Adding commercial and industrial customers with higher base usage
International • Geographic diversity limits regional weather risk
• Cylinder business supports non-heating home usage
• Industrial volumes not impacted by weather
12
Reducing Weather Dependence
UGI Corporation | AGA Financial Forum

Business Unit Growth Drives UGI Performance
13
$0.00
$0.50
$1.00
$1.50
$2.00
$2.50
$3.00
$3.50
FY17 Guidance FY20 Estimate
Ad
just
ed E
PS3
$2.85 - $3.152
$2.30 to $2.451
1 Guidance provided on October 12, 2016. 2Estimated using long-term EPS guidance of 6-10% from the midpoint of 2017 guidance. 3Adjusted EPS is a non-GAAP measure. Because we are unable to predict certain potentially material items affecting diluted earnings per share on a GAAP basis, principally mark-to-market gains and losses on derivative instruments and Finagaz integration expenses, we cannot reconcile 2017 and 2020 Adjusted EPS to diluted EPS, the most comparable GAAP measure.
UGI Corporation | AGA Financial Forum
UG
I Uti
litie
s
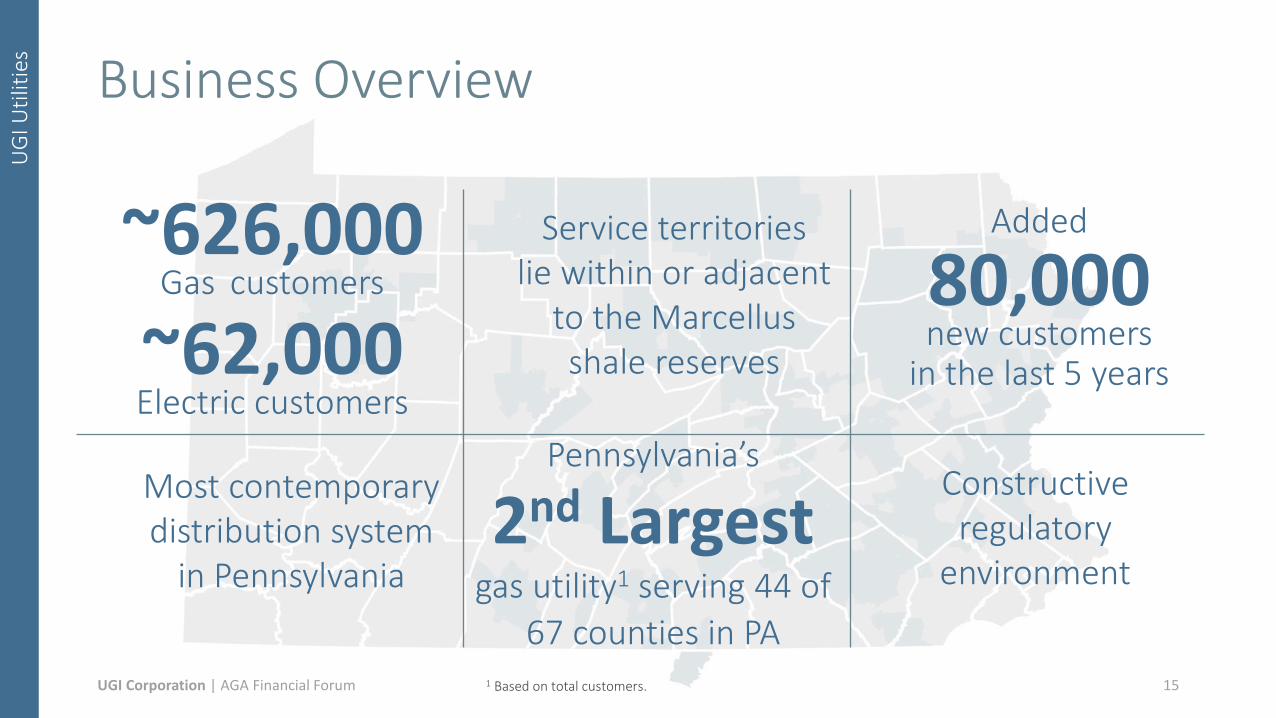
Business Overview
15
Most contemporary distribution system
in Pennsylvania
Pennsylvania’s
2nd Largest gas utility1 serving 44 of
67 counties in PA
~626,000 Gas customers
~62,000 Electric customers
Service territories lie within or adjacent
to the Marcellus shale reserves
80,000 new customers
in the last 5 years
Added
Constructive regulatory
environment
1 Based on total customers. UGI Corporation | AGA Financial Forum

UG
I Uti
litie
s
Marcellus Advantage
• Over 90% of UGI Utilities natural gas sourced from the Marcellus Shale
• Marcellus NG priced at over 45% discount to NYMEX during FY16
• Added three power plant customers since 2010 • Combined generation capacity of >2,000 MWs
• Fourth scheduled in 2017 (~1,400 MWs)
• Favorable environment for economic development
• Added an average of 12,400 new residential heating and commercial customers over the past 10 years
16
Natural Gas Electric Marcellus Shale Area
UGI Corporation | AGA Financial Forum

UG
I Uti
litie
s
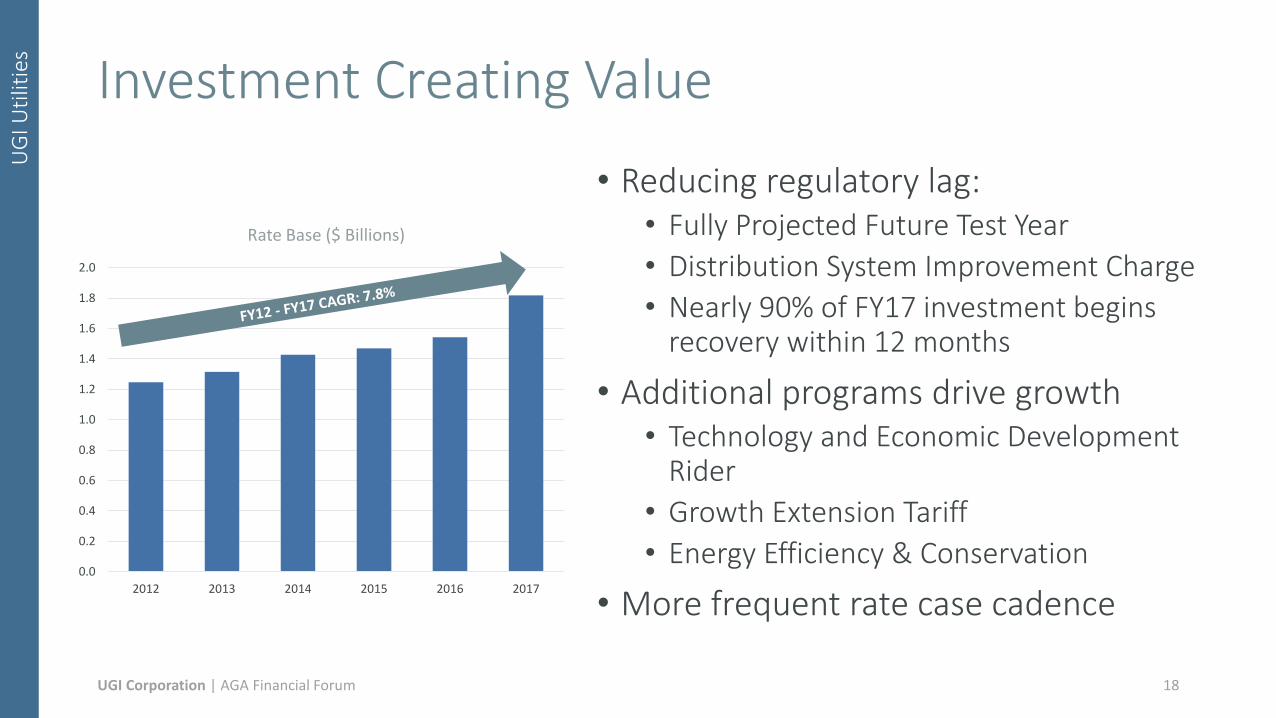
Increasing Capital Investment
17
$0
$50
$100
$150
$200
$250
$300
$350
$400
2012 2013 2014 2015 2016 2017B
Capital Spend ($MM)
Replacement and Betterment Growth Other Electric IT
UGI Corporation | AGA Financial Forum
UG
I Uti
litie
s
0.0
0.2
0.4
0.6
0.8
1.0
1.2
1.4
1.6
1.8
2.0
2012 2013 2014 2015 2016 2017
Rate Base ($ Billions)
• Reducing regulatory lag: • Fully Projected Future Test Year
• Distribution System Improvement Charge
• Nearly 90% of FY17 investment begins recovery within 12 months
• Additional programs drive growth • Technology and Economic Development
Rider
• Growth Extension Tariff
• Energy Efficiency & Conservation
• More frequent rate case cadence
18
Investment Creating Value
UGI Corporation | AGA Financial Forum

UG
I En
ergy
Ser
vice
s
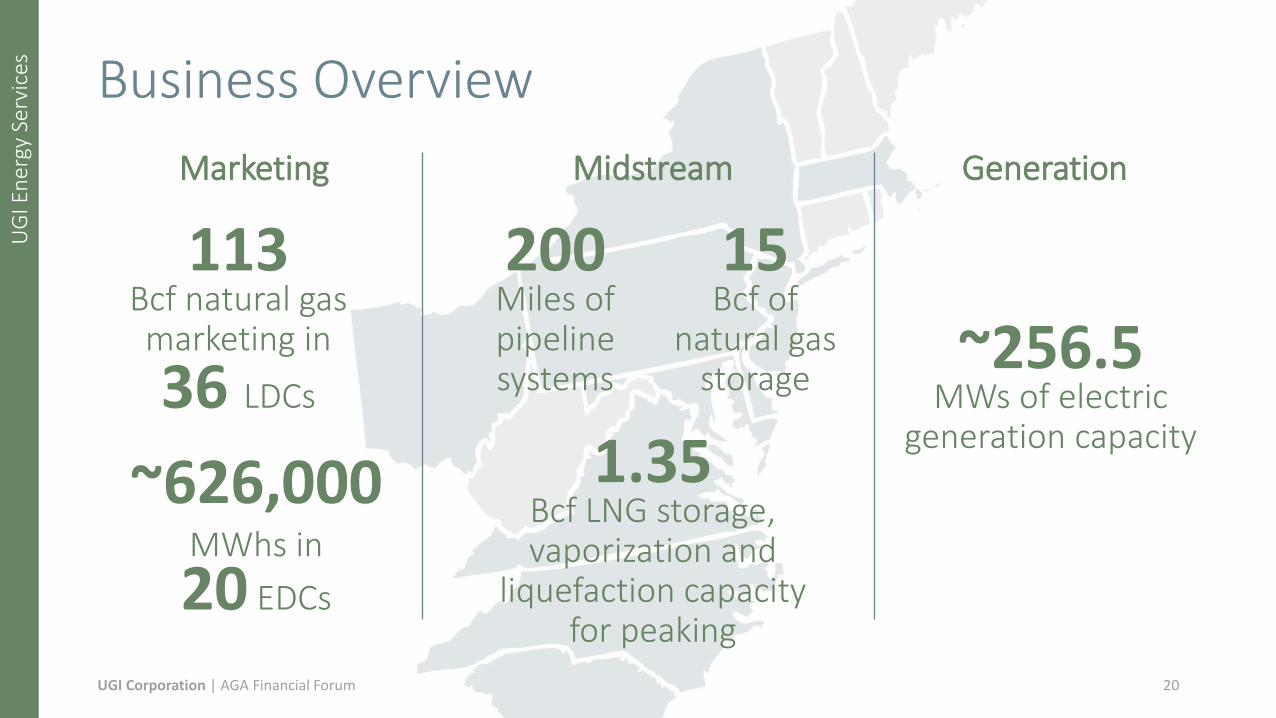
Business Overview
20
113 Bcf natural gas marketing in
36 LDCs
200 Miles of pipeline systems
15 Bcf of
natural gas storage
1.35 Bcf LNG storage, vaporization and
liquefaction capacity for peaking
Marketing Midstream Generation
~626,000 MWhs in
20 EDCs
~256.5 MWs of electric
generation capacity
UGI Corporation | AGA Financial Forum
UG
I En
ergy
Ser
vice
s
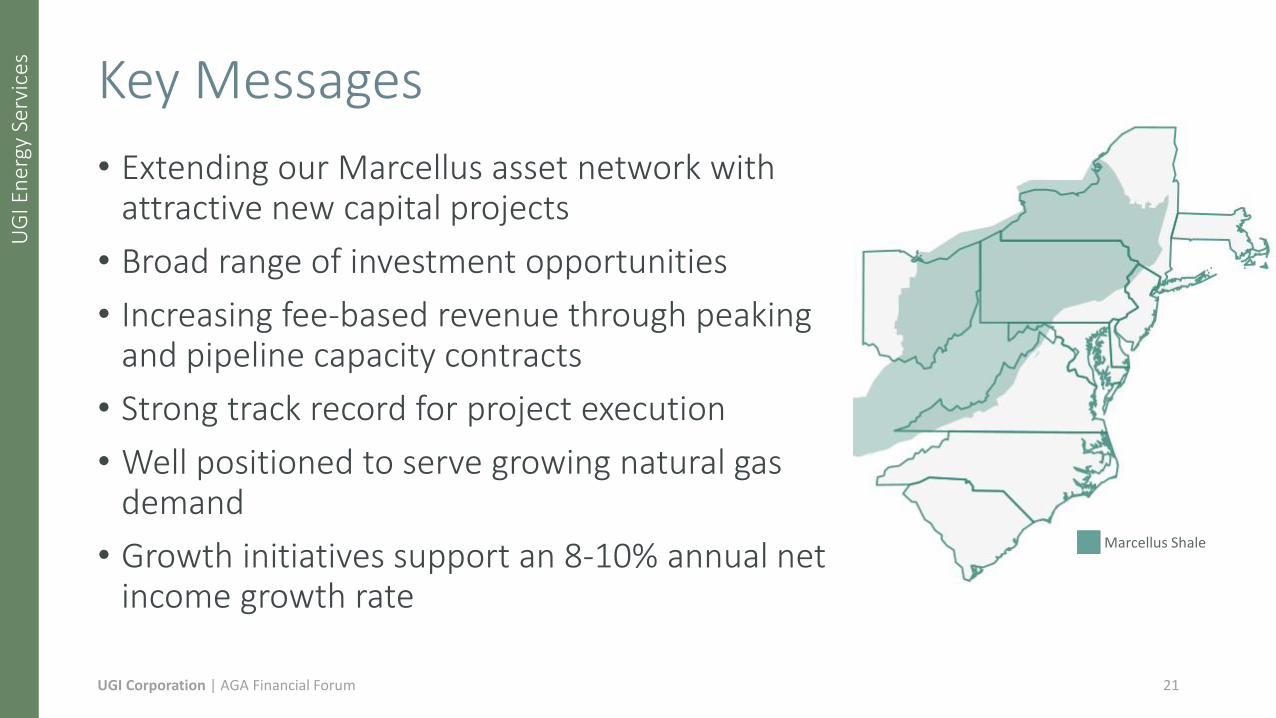
• Extending our Marcellus asset network with attractive new capital projects
• Broad range of investment opportunities
• Increasing fee-based revenue through peaking and pipeline capacity contracts
• Strong track record for project execution
• Well positioned to serve growing natural gas demand
• Growth initiatives support an 8-10% annual net income growth rate
21
Key Messages
Marcellus Shale
UGI Corporation | AGA Financial Forum

UG
I En
ergy
Ser
vice
s
Midstream Assets Overview
22
LNG Peaking: • Temple LNG (205,000 Dth/day
vaporization, 1.25 BCF storage) • Manning liquefaction (10,000 Dth/day) • Steelton vaporization (65,000 Dth/day) Pipelines: • Auburn system (470,000 Dth/day) • Sunbury pipeline (200,000 Dth/day) • Union Dale (100,000 Dth/day) • PennEast pipeline (1 Bcf/day) Storage: • 15 Bcf natural gas storage
UGI Corporation | AGA Financial Forum

UG
I En
ergy
Ser
vice
s
$-
$50,000
$100,000
$150,000
$200,000
$250,000
$300,000
$350,000
1999 2000 2001 2002 2003 2004 2005 2006 2007 2008 2009 2010 2011 2012 2013 2014 2015 2016
Mar
gin
(in
00
0s)
Commodity Marketing Midstream Generation HVAC
Sustainable Business Growth
23
11% colder than
normal winter
12% colder than
normal winter
21% warmer
than normal winter
1Margin is a non-GAAP measure. See appendix for reconciliation.
Increasing midstream margin drives overall growth1
22% warmer
than normal winter
UGI Corporation | AGA Financial Forum

Am
eriG
as
Business Overview
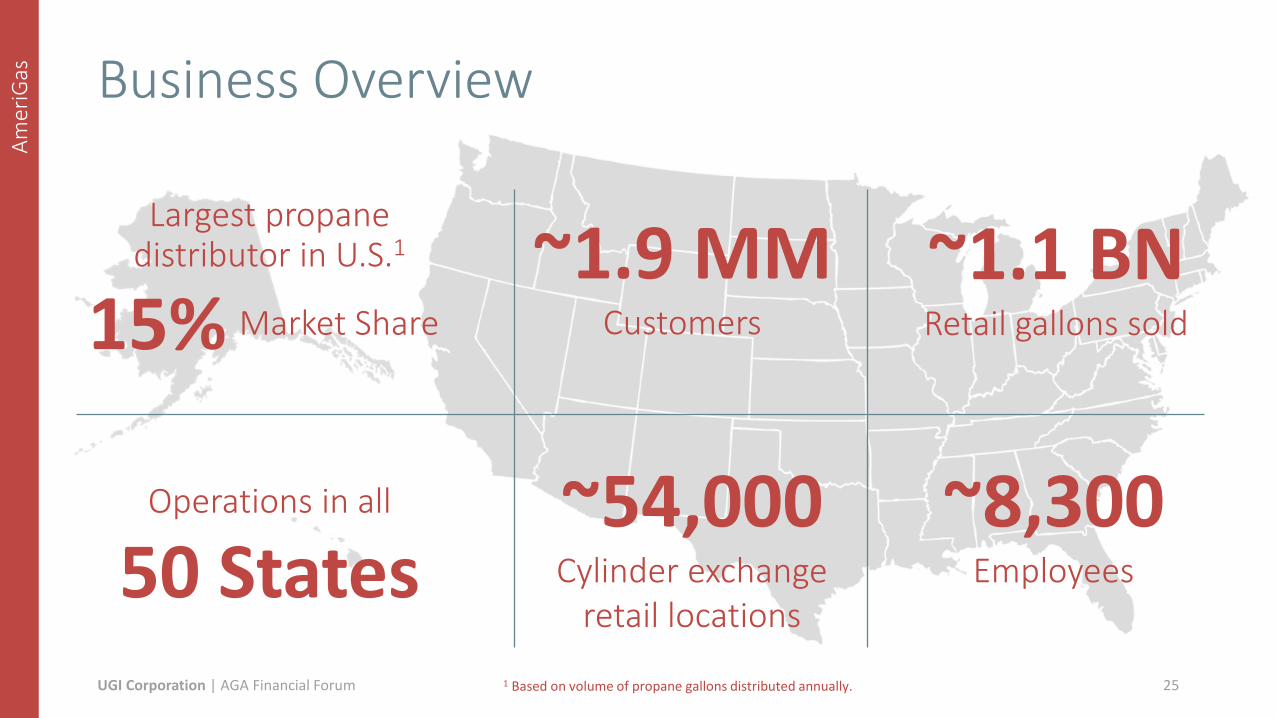
Largest propane distributor in U.S.1 ~1.9 MM
Customers
~1.1 BN Retail gallons sold
~54,000 Cylinder exchange
retail locations
Operations in all
50 States
15% Market Share
~8,300 Employees
25 1 Based on volume of propane gallons distributed annually. UGI Corporation | AGA Financial Forum
Am
eriG
as
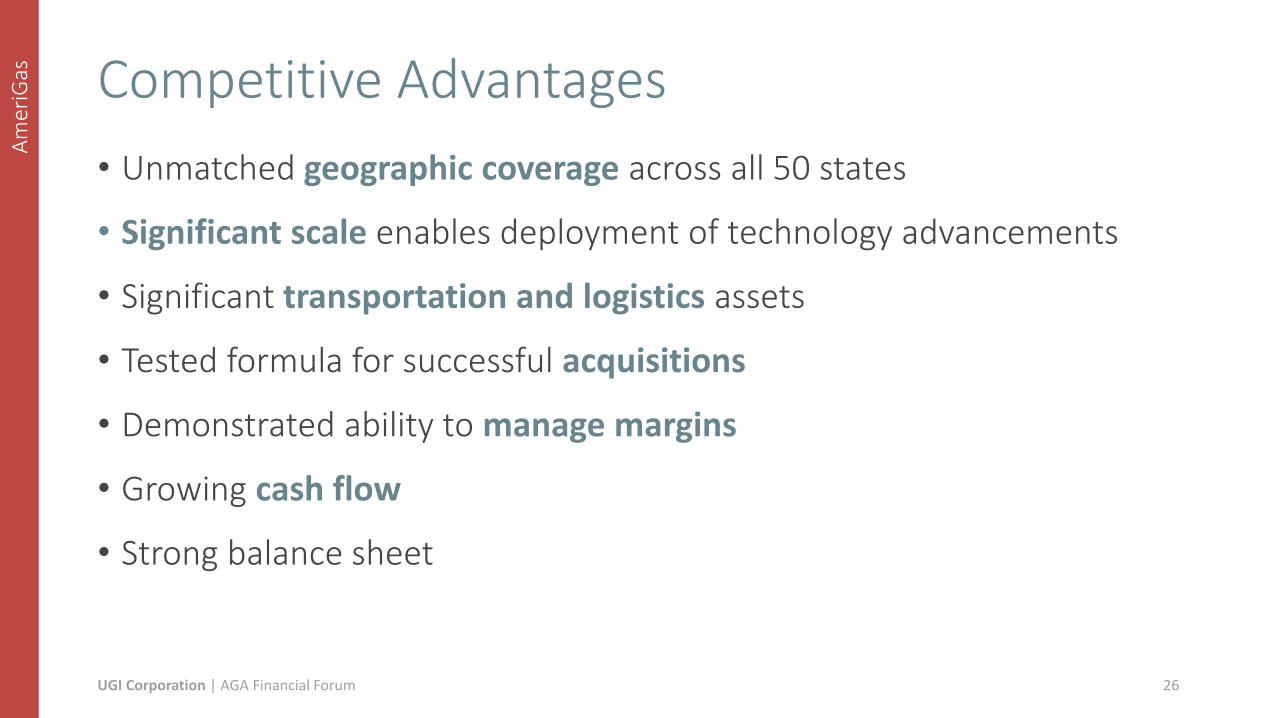
Competitive Advantages
• Unmatched geographic coverage across all 50 states
• Significant scale enables deployment of technology advancements
• Significant transportation and logistics assets
• Tested formula for successful acquisitions
• Demonstrated ability to manage margins
• Growing cash flow
• Strong balance sheet
26 UGI Corporation | AGA Financial Forum
Am
eriG
as
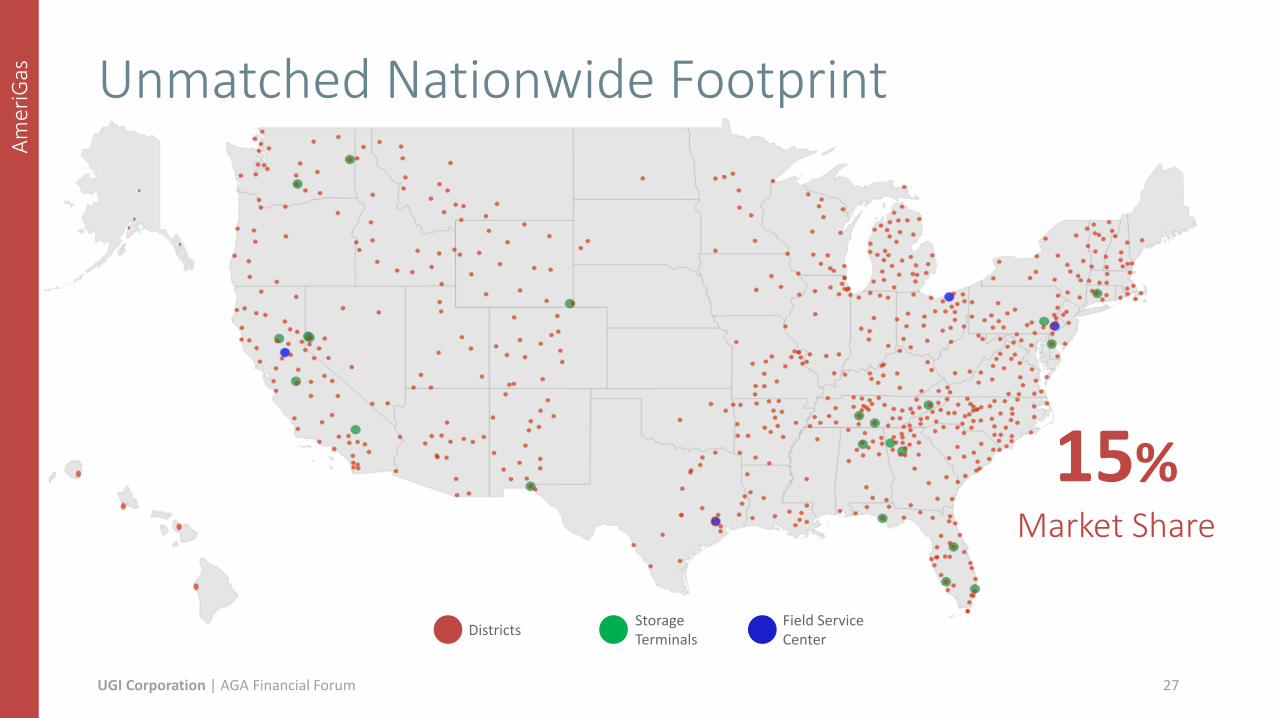
Unmatched Nationwide Footprint
27
15% Market Share
Districts
Storage Terminals
Field Service Center
UGI Corporation | AGA Financial Forum

Am
eriG
as
Technology Investments Across a Broad Platform
AmeriMobile • Real-time field
communication
28
AmeriGas.com • Online bill pay • Will-call orders
District Tools • Real-time key performance
indicators
Networked Call Centers • Re-route calls based on
volume • 24/7 Emergency Call Center
Investments in technology reduce operational costs while improving the customer experience
UGI Corporation | AGA Financial Forum

Am
eriG
as
Key Drivers of Growth
29
ACE Cylinder Exchange
2-3% Growth National Accounts
6-7% Growth
Acquisitions
$5-6 MM Annual EBITDA Addition
Structural Conservation offset by:
Technology Enhancements
Margin Management
Customer Retention
3-4% Annual EBITDA Growth
UGI Corporation | AGA Financial Forum

Am
eriG
as
Outperformance Over the Long Term
30
-50
0
50
100
150
200
AmeriGasAlerianS&P 500
AmeriGas: 9.8% Alerian: 6.3%
S&P 500: 7.1%
10 Year CAGR
UGI Corporation | AGA Financial Forum
UG
I In
tern
atio
nal
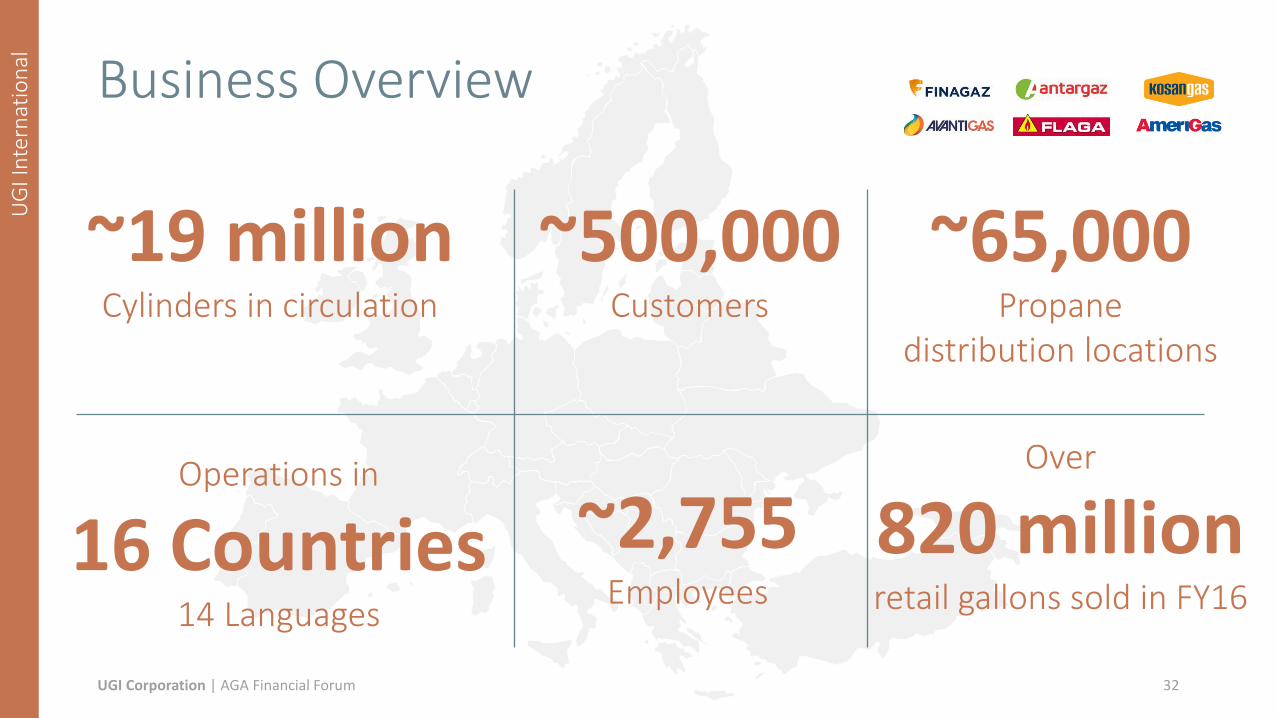
Business Overview
32
~500,000 Customers
Over
820 million retail gallons sold in FY16
~65,000 Propane
distribution locations
Operations in
16 Countries 14 Languages
~2,755 Employees
~19 million Cylinders in circulation
UGI Corporation | AGA Financial Forum

UG
I In
tern
atio
nal
UGI International Timeline
33
Flaga Acquisition in Austria, Hungary and the Czech Republic
Antargaz Acquisition in France
Shell Acquisitions in Poland, the UK and the Nordics
Finagaz Acquisition in France
2001 2006 2011 2016
2001 Retail Gallons Sold: 74MM1
Operating Income : $0.8MM
2016 Retail Gallons Sold: 821MM
Operating Income: $206.6MM
1 Volume includes Flaga and pro forma 20% ownership interest in Antargaz in 2001. UGI Corporation | AGA Financial Forum
UG
I In
tern
atio
nal
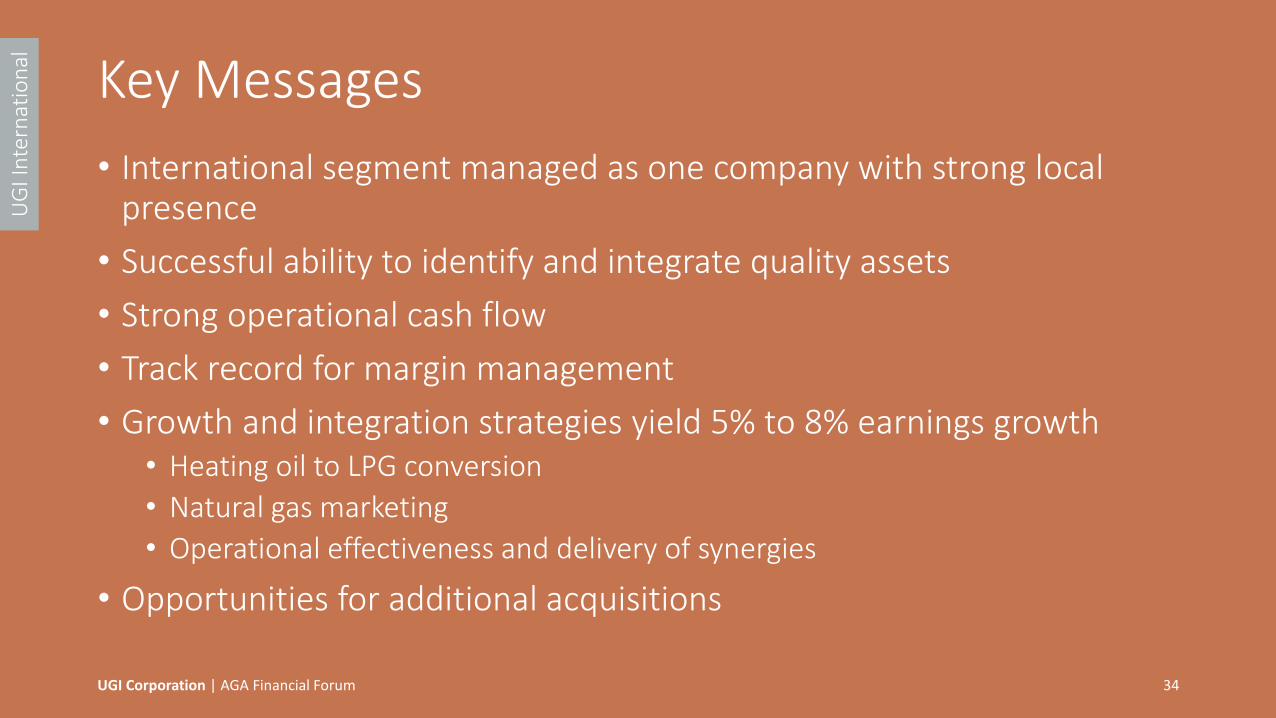
Key Messages
• International segment managed as one company with strong local presence
• Successful ability to identify and integrate quality assets
• Strong operational cash flow
• Track record for margin management
• Growth and integration strategies yield 5% to 8% earnings growth • Heating oil to LPG conversion
• Natural gas marketing
• Operational effectiveness and delivery of synergies
• Opportunities for additional acquisitions
34 UGI Corporation | AGA Financial Forum

UG
I In
tern
atio
nal
Serving a Diverse Customer Base
35
70%
22%
8%
FY16 Volume by Segment
Bulk
Cylinder
Auto Gas
50% 29%
11%
5% 4%
FY16 Volume by Segment
Commercial & Industrial
Residential
Agricultural
Autogas
Aerosol
UGI Corporation | AGA Financial Forum

Key Takeaways
• UGI is a balanced growth & income investment
• Positioned to deliver strong earnings and cash flow growth • Utilities – customer growth and infrastructure investment
• Energy Services – capitalizing on infrastructure gap and unique Marcellus asset portfolio
• AmeriGas – ACE, National Accounts, and bolt-on acquisitions
• UGI International – region specific growth strategies
• Proven track record for capital stewardship • $190MM - $220MM annual cash available for investment
• Superior cash flow and balance sheet enable growth
36 UGI Corporation | AGA Financial Forum

APPENDIX
Strong EPS and Dividend Growth
38
$0.00
$0.50
$1.00
$1.50
$2.00
$2.50
19
99
20
00
20
01
20
02
20
03
20
04
20
05
20
06
20
07
20
08
20
09
20
10
20
11
20
12
20
13
20
14
20
15
20
16
20
17
E
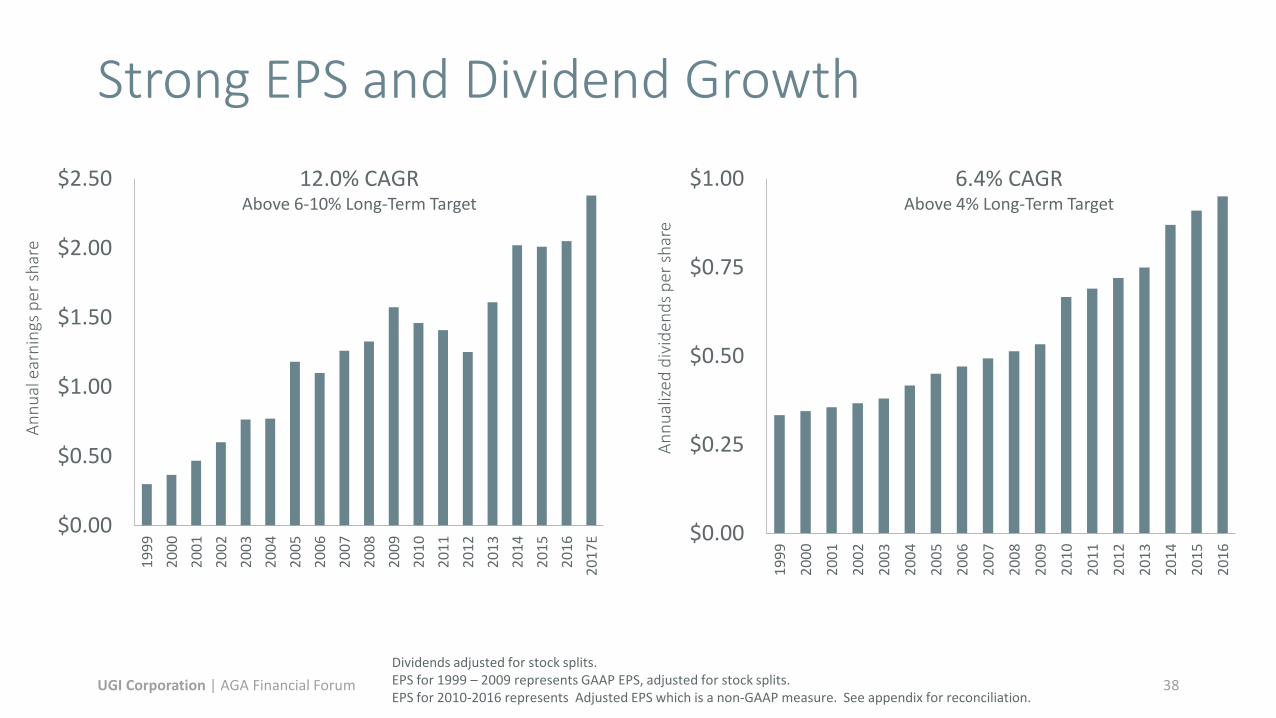
12.0% CAGR Above 6-10% Long-Term Target
Dividends adjusted for stock splits. EPS for 1999 – 2009 represents GAAP EPS, adjusted for stock splits. EPS for 2010-2016 represents Adjusted EPS which is a non-GAAP measure. See appendix for reconciliation.
$0.00
$0.25
$0.50
$0.75
$1.00
19
99
20
00
20
01
20
02
20
03
20
04
20
05
20
06
20
07
20
08
20
09
20
10
20
11
20
12
20
13
20
14
20
15
20
16
6.4% CAGR Above 4% Long-Term Target
An
nu
aliz
ed d
ivid
end
s p
er s
har
e
An
nu
al e
arn
ings
per
sh
are
UGI Corporation | AGA Financial Forum
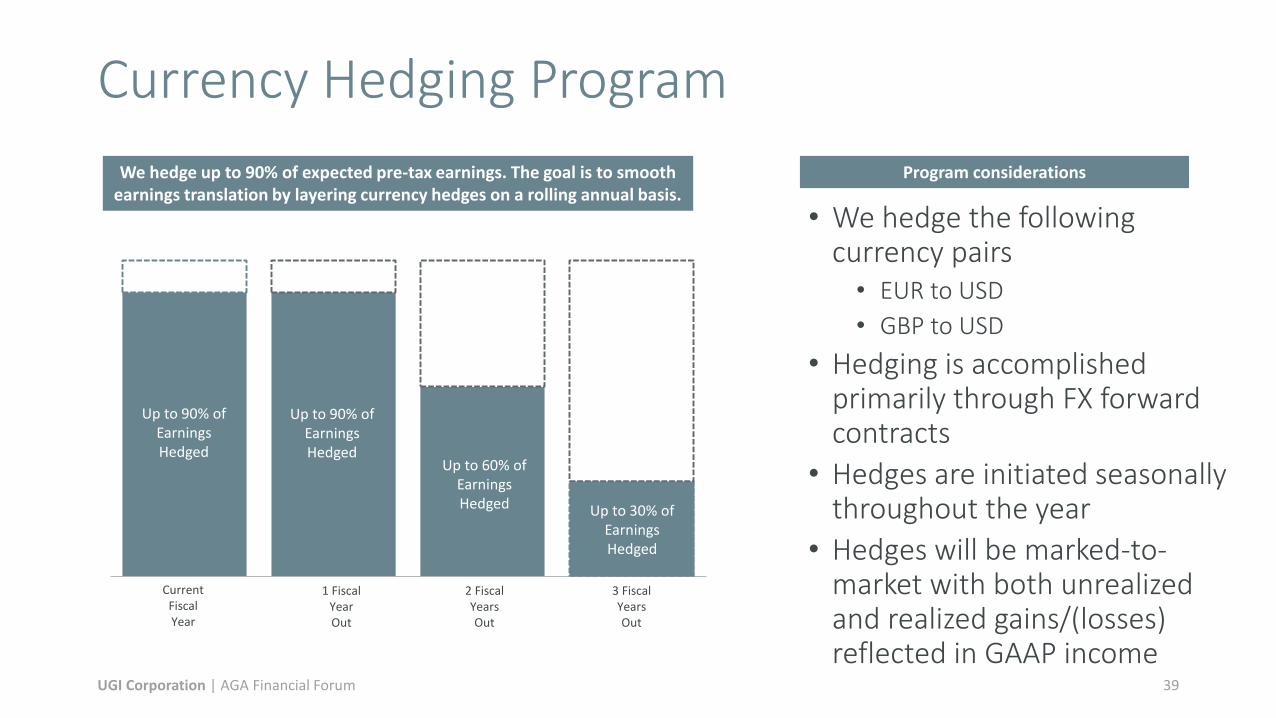
Currency Hedging Program
39
• We hedge the following currency pairs
• EUR to USD
• GBP to USD
• Hedging is accomplished primarily through FX forward contracts
• Hedges are initiated seasonally throughout the year
• Hedges will be marked-to-market with both unrealized and realized gains/(losses) reflected in GAAP income
Current FiscalYear
1 Fiscal YearOut
2 Fiscal Yearsout
3 Fiscal Yearsout
Up to 60% of Earnings Hedged
Current Fiscal Year
1 Fiscal Year Out
2 Fiscal Years Out
3 Fiscal Years Out
We hedge up to 90% of expected pre-tax earnings. The goal is to smooth earnings translation by layering currency hedges on a rolling annual basis.
Program considerations
Up to 90% of Earnings Hedged
Up to 30% of Earnings Hedged
Up to 90% of Earnings Hedged
UGI Corporation | AGA Financial Forum
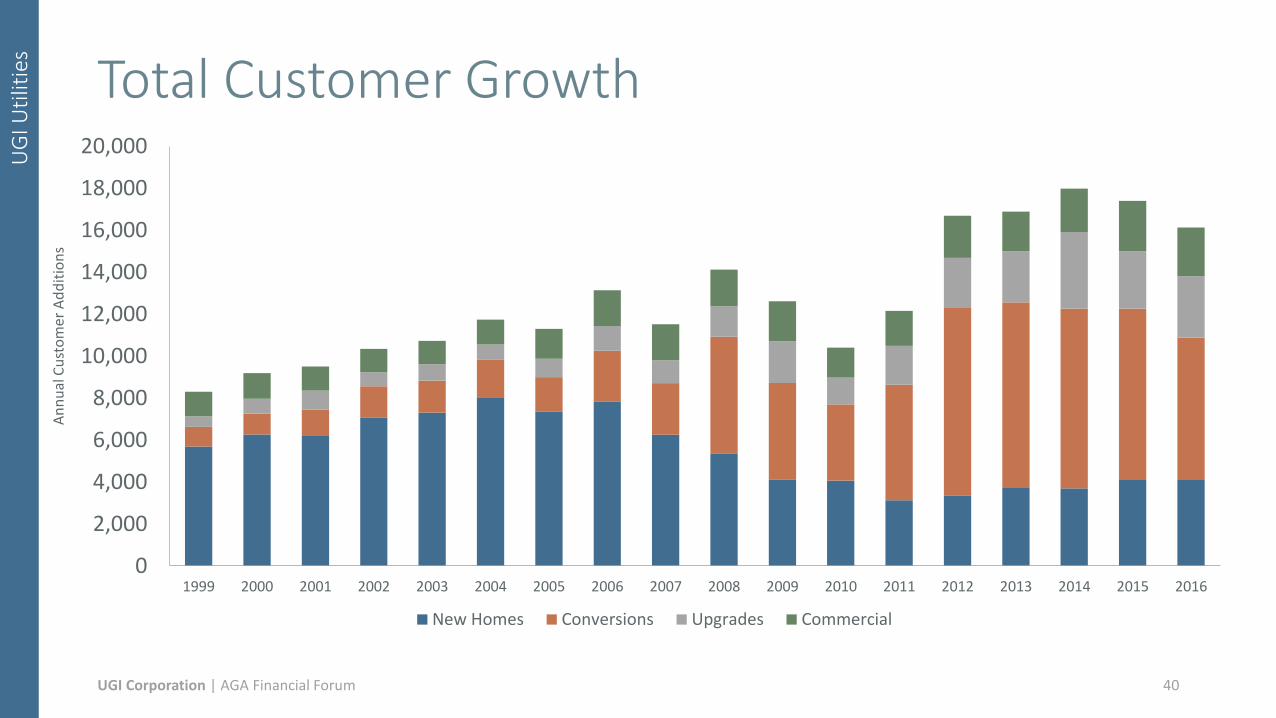
UG
I Uti
litie
s
Total Customer Growth
40
0
2,000
4,000
6,000
8,000
10,000
12,000
14,000
16,000
18,000
20,000
1999 2000 2001 2002 2003 2004 2005 2006 2007 2008 2009 2010 2011 2012 2013 2014 2015 2016
New Homes Conversions Upgrades Commercial
An
nu
al C
ust
om
er
Ad
dit
ion
s
UGI Corporation | AGA Financial Forum

UG
I En
ergy
Ser
vice
s
$0
$10,000
$20,000
$30,000
$40,000
$50,000
$60,000
$70,000
$80,000
1999 2000 2001 2002 2003 2004 2005 2006 2007 2008 2009 2010 2011 2012 2013 2014 2015 2016
Natural Gas Retail Power
Commodity Marketing Consistent, disciplined approach results in steady margin growth through numerous disruptive events
41
22% warmer than normal
winter
Polar Vortex 11% colder
than normal winter
Commodity spike
Total margin is a non-GAAP measure. See appendix for reconciliation.
21% warmer than normal
winter
Enron Collapse
Katrina/ Rita
Tota
l Mar
gin
(00
0s)
UGI Corporation | AGA Financial Forum

UG
I En
ergy
Ser
vice
s
UGI Energy Services Total Margin
42
($ in millions)
Year Ended September 30,
1999 2000 2001 2002 2003 2004 2005 2006 2007 2008 2009 2010 2011 2012 2013 2014 2015 2016
Total Revenues 90.4$ 150.7$ 409.2$ 380.6$ 714.5$ 1,025.4$ 1,420.2$ 1,486.5$ 1,409.8$ 1,696.4$ 1,309.5$ 1,222.6$ 1,155.9$ 942.2$ 1,122.8$ 1,473.7$ 1,181.4$ 876.6$
Total Cost of Sales (84.4) (143.0) (378.8) (340.3) (659.9) (947.5) (1,323.9) (1,375.3) (1,282.3) (1,541.0) (1,147.8) (1,055.5) (986.5) (779.7) (927.3) (1,149.8) (872.4) (612.2)
Net Margin 6.0$ 7.6$ 30.4$ 40.3$ 54.6$ 77.9$ 96.3$ 111.2$ 127.5$ 155.3$ 161.7$ 167.1$ 169.4$ 162.5$ 195.5$ 323.9$ 309.0$ 264.4$
Margin Breakdown:
Commodity Marketing 6.0$ 6.2$ 13.4$ 18.8$ 25.2$ 32.2$ 40.0$ 36.0$ 42.7$ 38.9$ 42.2$ 60.2$ 67.5$ 56.9$ 57.6$ 61.9$ 60.6$ 45.7$
Natural Gas Marketing 6.0 6.2 13.4 18.8 25.2 32.0 39.3 35.3 41.8 37.0 37.5 45.7 50.4 35.3 46.2 59.4 52.2 39.8
Retail Power Marketing - - - - - 0.2 0.8 0.7 0.9 1.9 4.6 14.5 17.2 21.6 11.4 2.5 8.4 5.9
Midstream - - - 2.6 3.0 5.2 13.1 26.0 30.7 46.1 49.0 47.4 51.7 57.5 74.9 184.9 180.4 161.1
Power Generation - - - 2.6 7.4 17.5 20.5 24.1 27.5 39.2 35.0 27.7 18.2 16.0 31.5 45.5 43.6 34.2
HVAC - 1.4 17.0 16.3 19.0 22.9 22.7 25.1 26.6 31.2 35.5 31.9 31.9 32.1 31.5 31.7 24.4 23.3
Net Margin 6.0$ 7.6$ 30.4$ 40.3$ 54.6$ 77.9$ 96.3$ 111.2$ 127.5$ 155.3$ 161.7$ 167.1$ 169.4$ 162.5$ 195.6$ 323.9$ 309.0$ 264.4$
Revenues and cost of sales excludes net pre-tax gains and losses on commodity derivative instruments not associated with current period transactions.
UGI Corporation | AGA Financial Forum
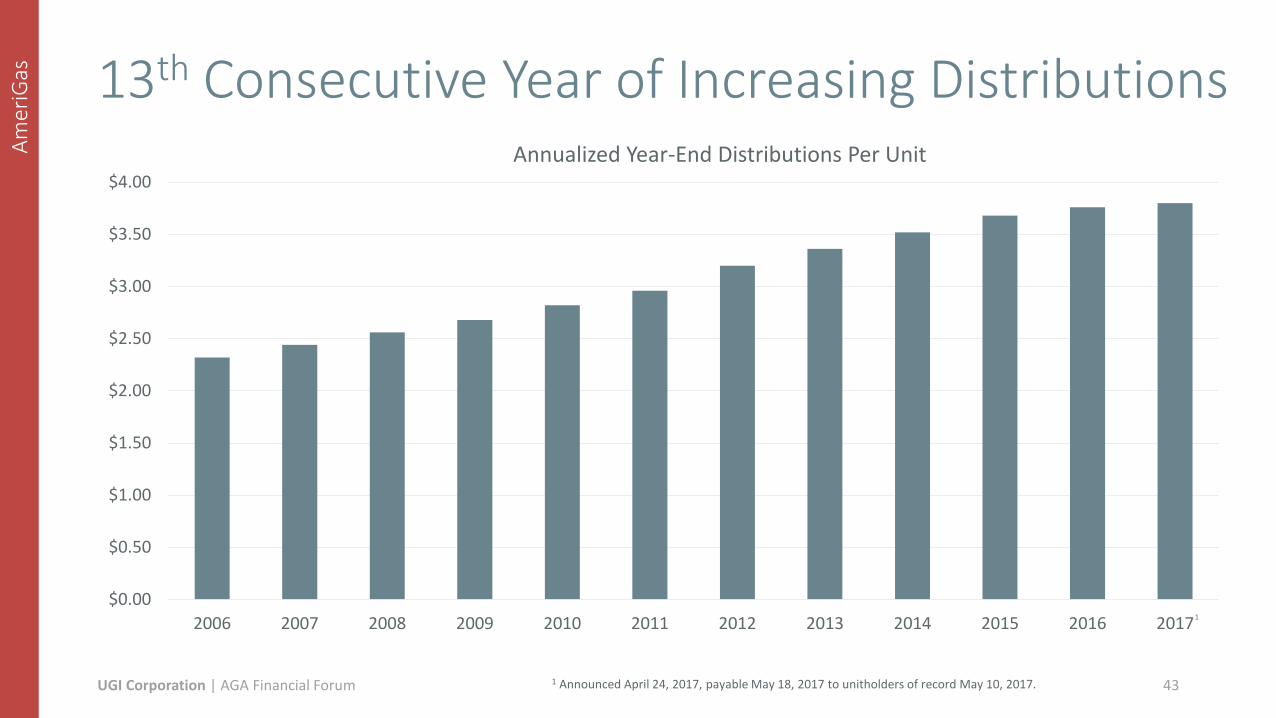
Am
eriG
as
13th Consecutive Year of Increasing Distributions
43
$0.00
$0.50
$1.00
$1.50
$2.00
$2.50
$3.00
$3.50
$4.00
2006 2007 2008 2009 2010 2011 2012 2013 2014 2015 2016 2017
Annualized Year-End Distributions Per Unit
1
UGI Corporation | AGA Financial Forum 1 Announced April 24, 2017, payable May 18, 2017 to unitholders of record May 10, 2017.
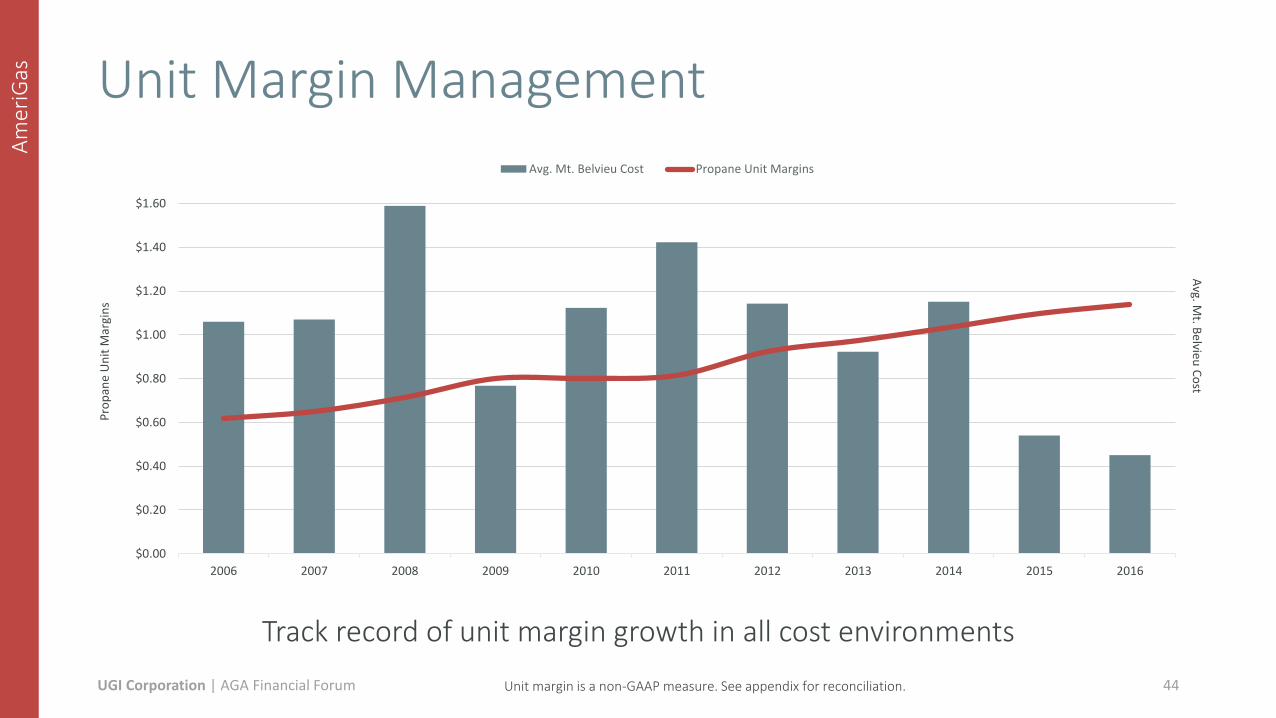
Am
eriG
as
Unit Margin Management
44
$0.00
$0.20
$0.40
$0.60
$0.80
$1.00
$1.20
$1.40
$1.60
2006 2007 2008 2009 2010 2011 2012 2013 2014 2015 2016
Avg. M
t. Belvieu
Co
st
Pro
pan
e U
nit
Mar
gin
s
Avg. Mt. Belvieu Cost Propane Unit Margins
Track record of unit margin growth in all cost environments
Unit margin is a non-GAAP measure. See appendix for reconciliation. UGI Corporation | AGA Financial Forum
Am
eriG
as
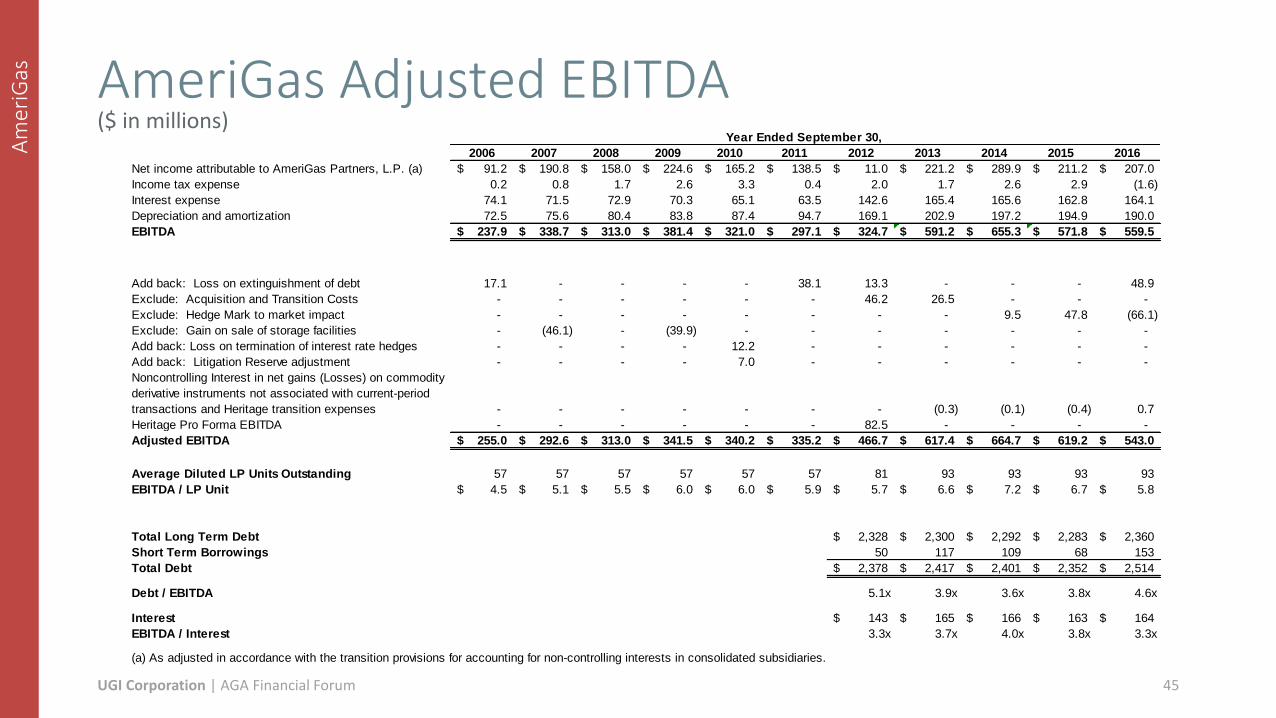
AmeriGas Adjusted EBITDA
45
($ in millions) Year Ended September 30,
2006 2007 2008 2009 2010 2011 2012 2013 2014 2015 2016
Net income attributable to AmeriGas Partners, L.P. (a) 91.2$ 190.8$ 158.0$ 224.6$ 165.2$ 138.5$ 11.0$ 221.2$ 289.9$ 211.2$ 207.0$
Income tax expense 0.2 0.8 1.7 2.6 3.3 0.4 2.0 1.7 2.6 2.9 (1.6)
Interest expense 74.1 71.5 72.9 70.3 65.1 63.5 142.6 165.4 165.6 162.8 164.1
Depreciation and amortization 72.5 75.6 80.4 83.8 87.4 94.7 169.1 202.9 197.2 194.9 190.0
EBITDA 237.9$ 338.7$ 313.0$ 381.4$ 321.0$ 297.1$ 324.7$ 591.2$ 655.3$ 571.8$ 559.5$
Add back: Loss on extinguishment of debt 17.1 - - - - 38.1 13.3 - - - 48.9
Exclude: Acquisition and Transition Costs - - - - - - 46.2 26.5 - - -
Exclude: Hedge Mark to market impact - - - - - - - - 9.5 47.8 (66.1)
Exclude: Gain on sale of storage facilities - (46.1) - (39.9) - - - - - - -
Add back: Loss on termination of interest rate hedges - - - - 12.2 - - - - - -
Add back: Litigation Reserve adjustment - - - - 7.0 - - - - - -
Noncontrolling Interest in net gains (Losses) on commodity
derivative instruments not associated with current-period
transactions and Heritage transition expenses - - - - - - - (0.3) (0.1) (0.4) 0.7
Heritage Pro Forma EBITDA - - - - - - 82.5 - - - -
Adjusted EBITDA 255.0$ 292.6$ 313.0$ 341.5$ 340.2$ 335.2$ 466.7$ 617.4$ 664.7$ 619.2$ 543.0$
Average Diluted LP Units Outstanding 57 57 57 57 57 57 81 93 93 93 93
EBITDA / LP Unit 4.5$ 5.1$ 5.5$ 6.0$ 6.0$ 5.9$ 5.7$ 6.6$ 7.2$ 6.7$ 5.8$
Total Long Term Debt 2,328$ 2,300$ 2,292$ 2,283$ 2,360$
Short Term Borrowings 50 117 109 68 153
Total Debt 2,378$ 2,417$ 2,401$ 2,352$ 2,514$
Debt / EBITDA 5.1x 3.9x 3.6x 3.8x 4.6x
Interest 143$ 165$ 166$ 163$ 164$
EBITDA / Interest 3.3x 3.7x 4.0x 3.8x 3.3x
(a) As adjusted in accordance with the transition provisions for accounting for non-controlling interests in consolidated subsidiaries.
UGI Corporation | AGA Financial Forum
Am
eriG
as
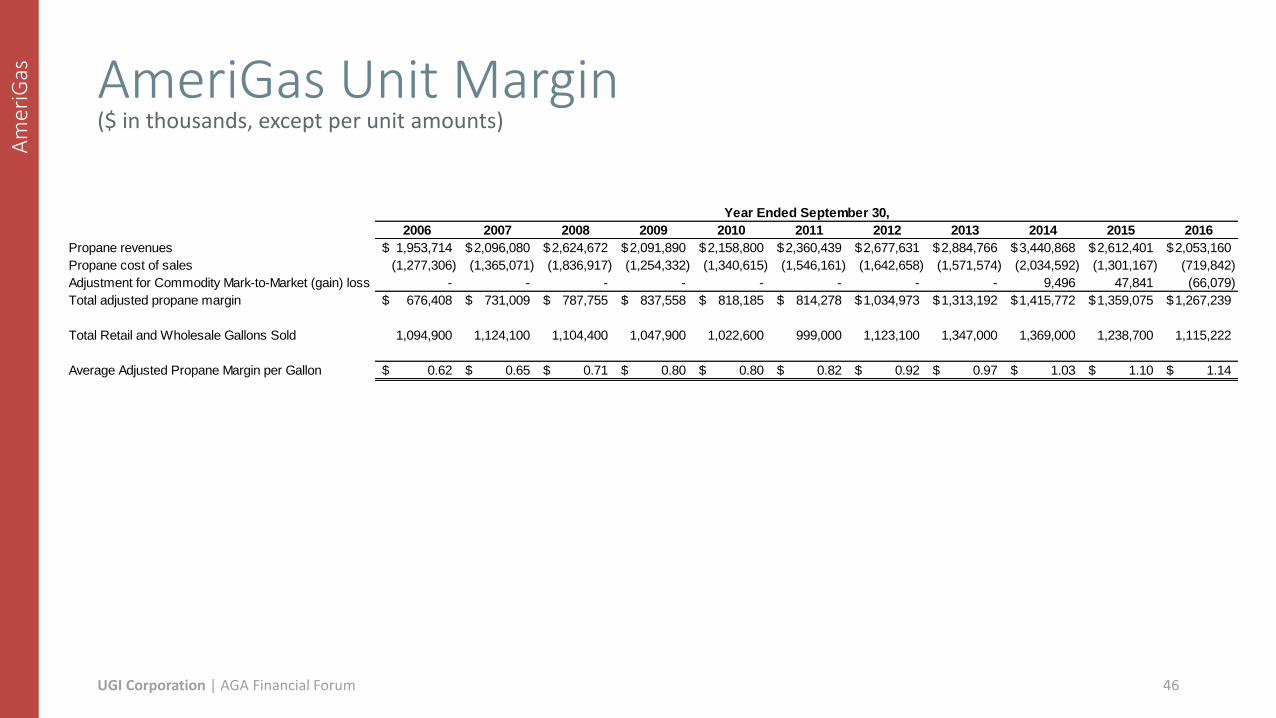
AmeriGas Unit Margin
46
Year Ended September 30,
2006 2007 2008 2009 2010 2011 2012 2013 2014 2015 2016
Propane revenues 1,953,714$ 2,096,080$ 2,624,672$ 2,091,890$ 2,158,800$ 2,360,439$ 2,677,631$ 2,884,766$ 3,440,868$ 2,612,401$ 2,053,160$
Propane cost of sales (1,277,306) (1,365,071) (1,836,917) (1,254,332) (1,340,615) (1,546,161) (1,642,658) (1,571,574) (2,034,592) (1,301,167) (719,842)
Adjustment for Commodity Mark-to-Market (gain) loss - - - - - - - - 9,496 47,841 (66,079)
Total adjusted propane margin 676,408$ 731,009$ 787,755$ 837,558$ 818,185$ 814,278$ 1,034,973$ 1,313,192$ 1,415,772$ 1,359,075$ 1,267,239$
Total Retail and Wholesale Gallons Sold 1,094,900 1,124,100 1,104,400 1,047,900 1,022,600 999,000 1,123,100 1,347,000 1,369,000 1,238,700 1,115,222
Average Adjusted Propane Margin per Gallon 0.62$ 0.65$ 0.71$ 0.80$ 0.80$ 0.82$ 0.92$ 0.97$ 1.03$ 1.10$ 1.14$
($ in thousands, except per unit amounts)
UGI Corporation | AGA Financial Forum
UG
I In
tern
atio
nal
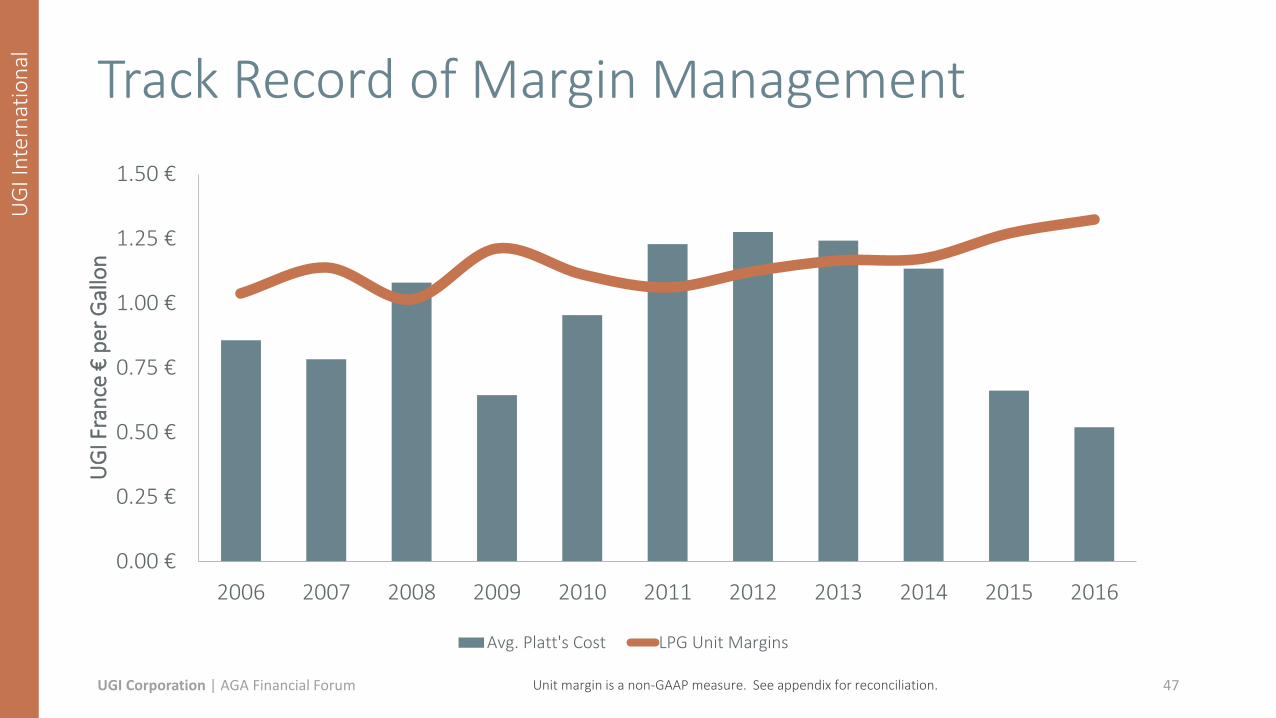
Track Record of Margin Management
47
0.00 €
0.25 €
0.50 €
0.75 €
1.00 €
1.25 €
1.50 €
2006 2007 2008 2009 2010 2011 2012 2013 2014 2015 2016
UG
I Fra
nce
€ p
er G
allo
n
Avg. Platt's Cost LPG Unit Margins
Unit margin is a non-GAAP measure. See appendix for reconciliation. UGI Corporation | AGA Financial Forum

UG
I In
tern
atio
nal
UGI France Unit Margins
48
(thousands)
Year Ended September 30,
2006 2007 2008 2009 2010 2011 2012 2013 2014 2015 2016
LPG revenues 881,900$ 796,653$ 1,062,561$ 837,676$ 887,067$ 1,050,628$ 1,083,666$ 1,244,753$ 1,169,610$ 942,511$ 1,160,013$
LPG cost of sales (478,400) (384,810) (615,944) (362,425) (465,867) (649,824) (650,305) (774,097) (727,029) (471,511) (418,358)
Adjustment for Commodity Mark-to-Market (gain) loss - - - - - - - - - 9,944 (14,071) Total adjusted LPG margin (USD) 403,500$ 411,842$ 446,617$ 475,251$ 421,200$ 400,804$ 433,361$ 470,656$ 442,581$ 480,944$ 727,584$
Foreign Currency Exchange Rates (Euro/USD) 1.23 1.34 1.51 1.35 1.36 1.40 1.30 1.31 1.36 1.15 1.11
Total adjusted LPG margin (Euro) 327,224€ 308,406€ 296,261€ 350,903€ 310,608€ 286,427€ 332,758€ 358,630€ 326,279€ 418,212€ 657,678€
Total Retail Tons Sold 611 525 567 561 542 524 575 596 539 639 963
Gallons/ton 516 516 516 516 516 516 516 516 516 516 516
Total Retail Gallons Sold 315,224 270,719 292,616 289,290 279,889 270,542 296,704 307,771 278,320 329,947 497,028
Average Adjusted LPG Margin per Gallon 1.04€ 1.14€ 1.01€ 1.21€ 1.11€ 1.06€ 1.12€ 1.17€ 1.17€ 1.27€ 1.32€
UGI Corporation | AGA Financial Forum

UGI Corporation Adjusted Earnings Per Share
49
Year Ended September 30,
2010 2011 2012 2013 2014 2015 2016
NON-GAAP RECONCILIATION:
Adjusted net income attributable to UGI Corporation:
Net income attributable to UGI Corporation $ 251.8 $ 245.4 $ 210.2 278.1$ $ 337.2 281.0$ 364.7$
Net (gains) losses on commodity derivative instruments not associated with current-period transactions (net of tax of $(5.8),
$11.5, $6.3, $3.1, $(4.5), $(30.9), and $13.5, respectively) (a) (b)8.2 (17.4) (8.9) (4.3) 6.6 53.3 (29.9)
Integration and acquisition expenses associated with Finagaz acquired on May 29, 2015 (net of tax of $0, $0, $0, $0, $(2.2),
$(7.7), and $(10.6), respectively) (a)- - - - 4.3 14.9 17.3
Loss on extinguishments of debt (net of tax of $0, $0, $(1.4), $0, $0, $0, and $(5.0), respectively) (a) - - 2.2 - - - 7.9
Costs associated with extinguishment of debt (net of tax of $0, $(6.6), $0, $0, $0, $(5.7), and $0, respectively) (a) (c) - 10.4 - - - 4.6 -
Impact of retroactive change in French tax law - - - - 5.7 - -
Integration and acquisition expenses associated with the retail propane businesses of Energy Transfer Partners, L.P. (“Heritage
Propane”) acquired by the Partnership on January 12, 2012 (net of tax of $0, $0, $(5.6), $(2.8), $0, $0, and $0, respectively) (a)- - 8.8 4.4 - - -
Gain on sale of Atlantic Energy (net of tax of $19.3 in 2010) (17.2)
Adjusted net income attributable to UGI Corporation (d) 242.8$ 238.4$ 212.3$ 278.2$ 353.8$ 353.8$ 360.0$
Adjusted earnings per common share attributable to UGI stockholders:
UGI Corporation earnings per share - diluted 1.52$ 1.45$ 1.24$ 1.60$ 1.92$ 1.60$ 2.08$
Net (gains) losses on commodity derivative instruments not associated with current-period transactions (b) 0.05 (0.10) (0.05) (0.02) 0.04 0.30 (0.17)
Integration and acquisition expenses associated with Finagaz acquired on May 29, 2015 - - 0.03 0.08 0.10
Loss on extinguishments of debt 0.06 0.01 - - - 0.04
Costs associated with extinguishment of debt - - - 0.03 -
Impact of retroactive change in French tax law - - 0.03 - -
Integration and acquisition expenses associated with the retail propane businesses of Energy Transfer Partners, L.P. (“Heritage
Propane”) acquired by the Partnership on January 12, 20120.05 0.03 - - -
Gain on sale of Atlantic Energy (0.11)
Adjusted diluted earnings per share (d) 1.46$ 1.41$ 1.25$ 1.61$ 2.02$ 2.01$ 2.05$
(a) Income taxes associated with pre-tax adjustments determined using statutory business unit tax rate.
(b) Includes the effects of rounding.
(c) Costs associated with extinguishment of debt in 2015 are included in interest expense on the Consolidated Statements of Income.
(d) Management uses "adjusted net income attributable to UGI" and "adjusted diluted earnings per share," both of which are nonGAAP financial measures, when evaluating UGI's overall performance. Adjusted net income attributable to
UGI is net income attributable to UGI after excluding net after-tax gains and losses on commodity derivative instruments not associated with current-period transactions (principally comprising unrealized gains and losses on commodity
derivative instruments), losses and costs associated with extinguishments of debt, Finagaz and Heritage Propane integration and acquisition expenses, a gain on the sale of Atlantic Energy, and the impact of a retroactive change in
French tax law.
UGI Corporation | AGA Financial Forum

UGI Corporation 2016 Adjusted EPS by Segment
50
Total
AmeriGas
Propane UGI Utilities
Midstream &
Marketing
UGI
International
Corporate &
Other
Adjusted diluted earnings per share:
UGI Corporation earnings per share - diluted $ 2.08 $ 0.25 $ 0.55 $ 0.50 $ 0.64 $ 0.14
Net gains on commodity derivative instruments not associated
with current-period transactions (a) (0.17) (0.17)
Loss on extinguishments of debt 0.04 0.04
Integration expenses associated with Finagaz 0.10 0.10
Adjusted diluted earnings per share $ 2.05 $ 0.29 $ 0.55 $ 0.50 $ 0.74 $ (0.03)
(a) Includes the effects of rounding.
UGI Corporation | AGA Financial Forum
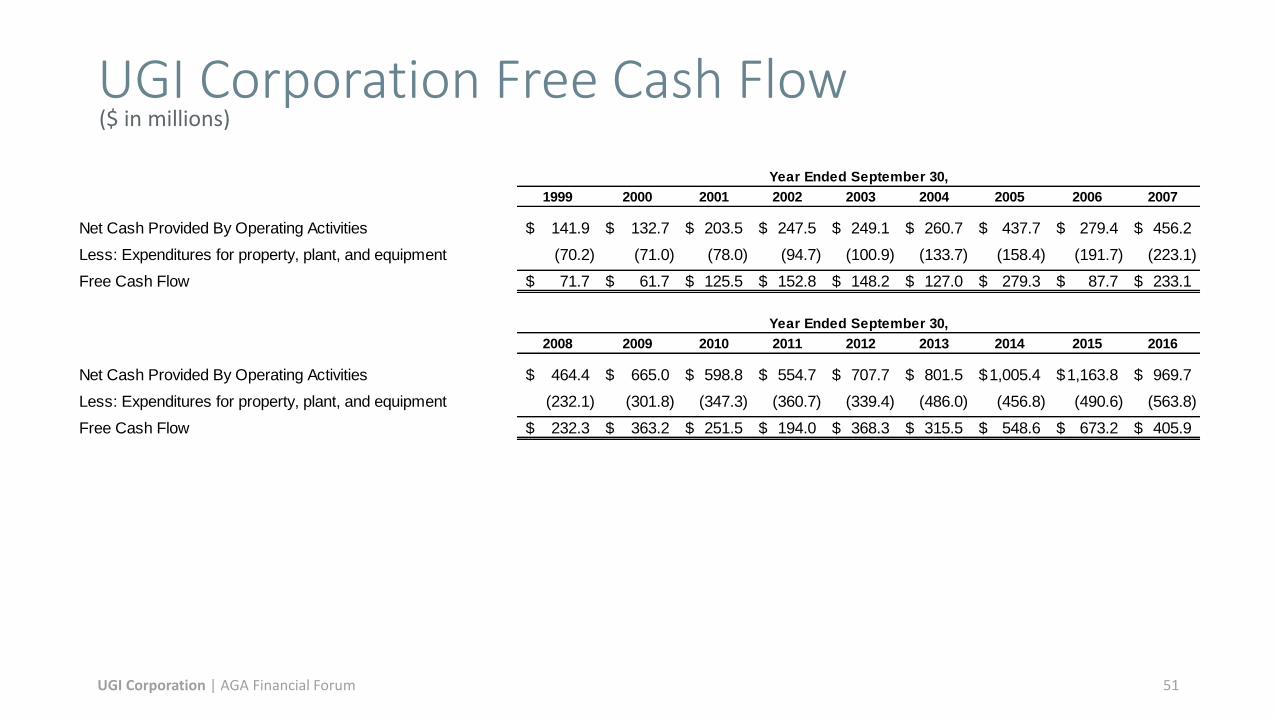
UGI Corporation Free Cash Flow
51
($ in millions)
Year Ended September 30,
1999 2000 2001 2002 2003 2004 2005 2006 2007
Net Cash Provided By Operating Activities 141.9$ 132.7$ 203.5$ 247.5$ 249.1$ 260.7$ 437.7$ 279.4$ 456.2$
Less: Expenditures for property, plant, and equipment (70.2) (71.0) (78.0) (94.7) (100.9) (133.7) (158.4) (191.7) (223.1)
Free Cash Flow 71.7$ 61.7$ 125.5$ 152.8$ 148.2$ 127.0$ 279.3$ 87.7$ 233.1$
Year Ended September 30,
2008 2009 2010 2011 2012 2013 2014 2015 2016
Net Cash Provided By Operating Activities 464.4$ 665.0$ 598.8$ 554.7$ 707.7$ 801.5$ 1,005.4$ 1,163.8$ 969.7$
Less: Expenditures for property, plant, and equipment (232.1) (301.8) (347.3) (360.7) (339.4) (486.0) (456.8) (490.6) (563.8)
Free Cash Flow 232.3$ 363.2$ 251.5$ 194.0$ 368.3$ 315.5$ 548.6$ 673.2$ 405.9$
UGI Corporation | AGA Financial Forum

UGI Adjusted Net Income and EPS
52
($ in millions)
UGI Corporation | AGA Financial Forum
Six Months Ended March 31, 2017 TotalAmeriGas
Propane
UGI
International
Midstream &
MarketingUGI Utilities
Corporate &
Other
Adjusted net income attributable to UGI Corporation:
Net income attributable to UGI Corporation 450.6$ $ 48.6 $ 167.6 $ 80.1 $ 109.4 $ 44.9
Net gains on commodity derivative instruments not associated with current period transactions (net
of tax of $34.8) (a)(49.1) - - - - (49.1)
Loss on extinguishments of debt (net of tax of $(5.7)) (a) 8.9 8.9 - - - -
Integration expenses associated with Finagaz (net of tax of $(5.1))(a) 9.7 - 9.7 - - -
Impact from change in French tax rate (27.4) - (27.4) - - -
Adjusted net income (loss) attributable to UGI Corporation 392.7$ 57.5$ 149.9$ 80.1$ 109.4$ (4.2)$
Adjusted diluted earnings per share:
UGI Corporation earnings per share - diluted 2.55$ $ 0.27 $ 0.95 $ 0.45 $ 0.62 $ 0.26
Net gains on commodity derivative instruments not associated with current period transactions (0.28) - - - - (0.28)
Loss on extinguishments of debt 0.05 0.05 - - - -
Integration expenses associated with Finagaz 0.05 - 0.05 - - -
Impact from change in French tax rate (0.15) - (0.15) - - -
Adjusted diluted earnings (loss) per share 2.22$ $ 0.32 $ 0.85 $ 0.45 $ 0.62 $ (0.02)
Six Months Ended March 31, 2012 TotalAmeriGas
Propane
UGI
International
Midstream &
MarketingUGI Utilities
Corporate &
Other
Adjusted net income attributable to UGI Corporation:
Net income (loss) attributable to UGI Corporation 211.1$ $ 37.7 $ 81.1 $ 30.0 $ 81.6 $ (19.3)
Net losses on commodity derivative instruments not associated with current period transactions (net
of taxes of ($5.5)) (a)7.8 - - - - 7.8
Loss on extinguishments of debt (net of tax of $1.5) (a) 2.1 2.1 - - - -
Integration expenses associated with Heritage (net of tax of $1.6) (a) 2.1 2.1 - - - -
Adjusted net income (loss) attributable to UGI Corporation 223.1$ 41.9$ 81.1$ 30.0$ 81.6$ (11.5)$
Adjusted diluted earnings per share:
UGI Corporation earnings per share - diluted 1.24$ $ 0.22 $ 0.48 $ 0.18 $ 0.48 $ (0.12)
Net losses on commodity derivative instruments not associated with current period transactions 0.05 - - - - 0.05
Loss on extinguishments of debt 0.01 0.01 - - - -
Integration expenses associated with Heritage 0.01 0.01 - - - -
Adjusted diluted earnings (loss) per share 1.31$ $ 0.25 $ 0.48 $ 0.18 $ 0.48 $ (0.07)
(a) Income taxes associated with pre-tax adjustments determined using statutory business unit tax rates.