American Community Survey (ACS) 1 Oregon State Data Center Meeting Portland State University April...
66
American Community Survey (ACS) 1 Oregon State Data Center Meeting Portland State University April 14, 2009 1
-
Upload
randolph-warren -
Category
Documents
-
view
214 -
download
0
Transcript of American Community Survey (ACS) 1 Oregon State Data Center Meeting Portland State University April...

American Community Survey(ACS)
1
Oregon State Data Center Meeting Portland State University
April 14, 20091
Agenda
• ACS & the Decennial Census• Census 2000• 2010 Census• Key Differences in the ACS
• ACS Data Releases
• ACS Survey Methodology
• ACS Multiyear Estimates
• ACS Data Products
• Accessing ACS Data Online2

Census 2000
3

44
ACS and the Decennial CensusCensus 2000
In 2000, the Census used two questionnaires
1. Short form (“counts”)
Asked basic demographic and housing information, such as age, sex, race, how many people lived in the housing unit, and if the housing unit was owned or rented by the resident
2. Long form (“characteristics”)
Collected the same information as the short form but also collected more in-depth information such as income, education, and language spoken at home
Only a portion of the population - - called a sample - - received the long form (average of 1 in 6 nationwide)
2010 Census
5
66
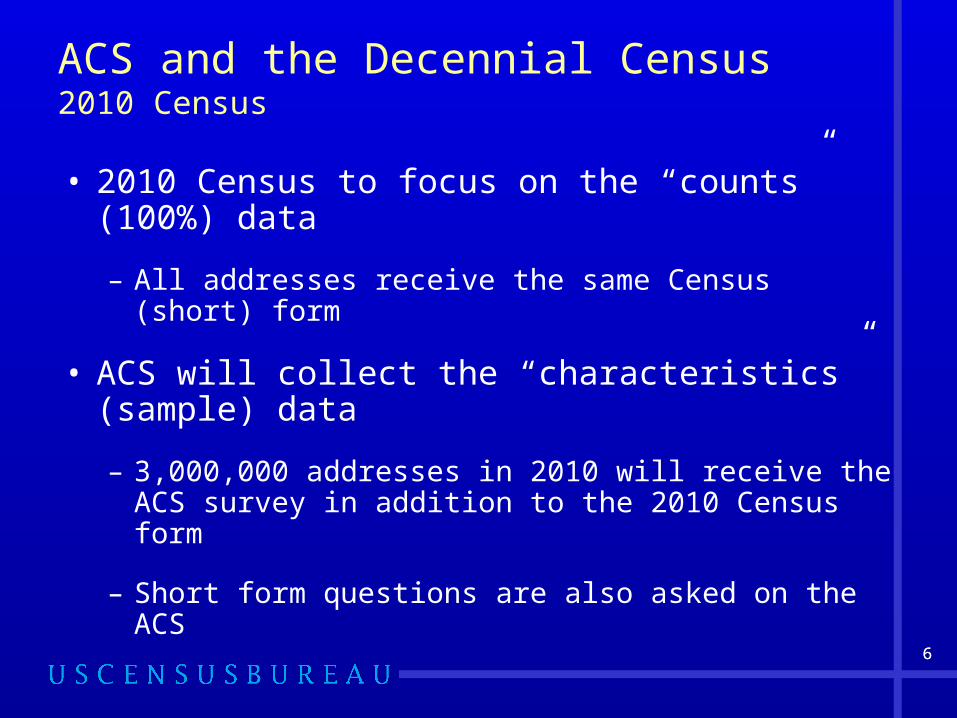
ACS and the Decennial Census2010 Census
• 2010 Census to focus on the “counts” (100%) data
– All addresses receive the same Census (short) form
• ACS will collect the “characteristics” (sample) data
– 3,000,000 addresses in 2010 will receive the ACS survey in addition to the 2010 Census form
– Short form questions are also asked on the ACS

Key Differencesbetween the ACS and Census 2000
7
88
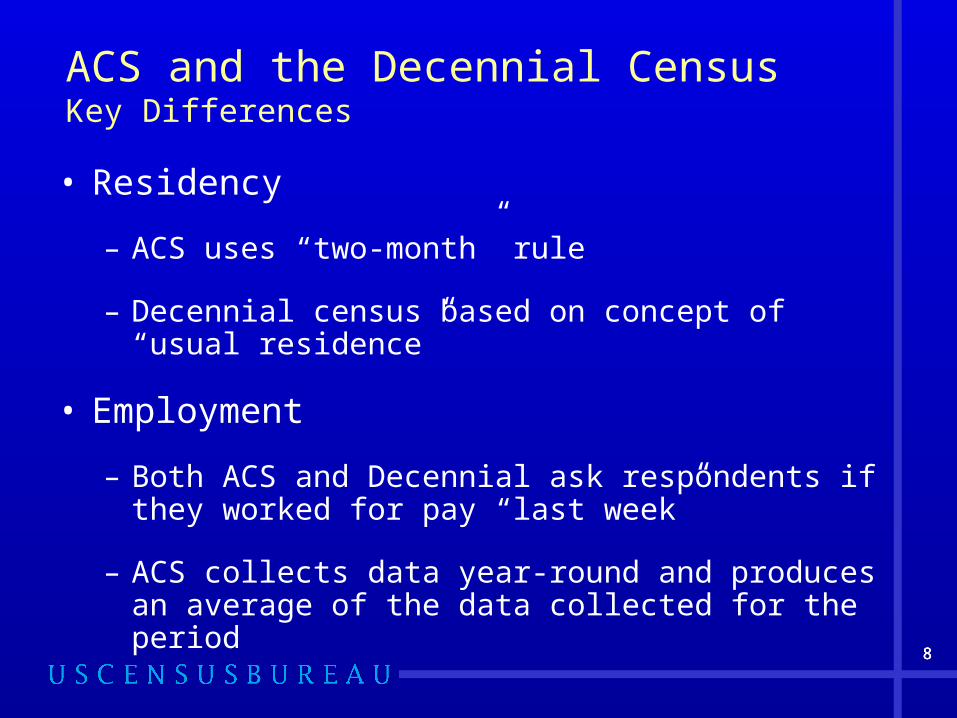
ACS and the Decennial CensusKey Differences
• Residency
– ACS uses “two-month” rule
– Decennial census based on concept of “usual residence”
• Employment
– Both ACS and Decennial ask respondents if they worked for pay “last week”
– ACS collects data year-round and produces an average of the data collected for the period
8
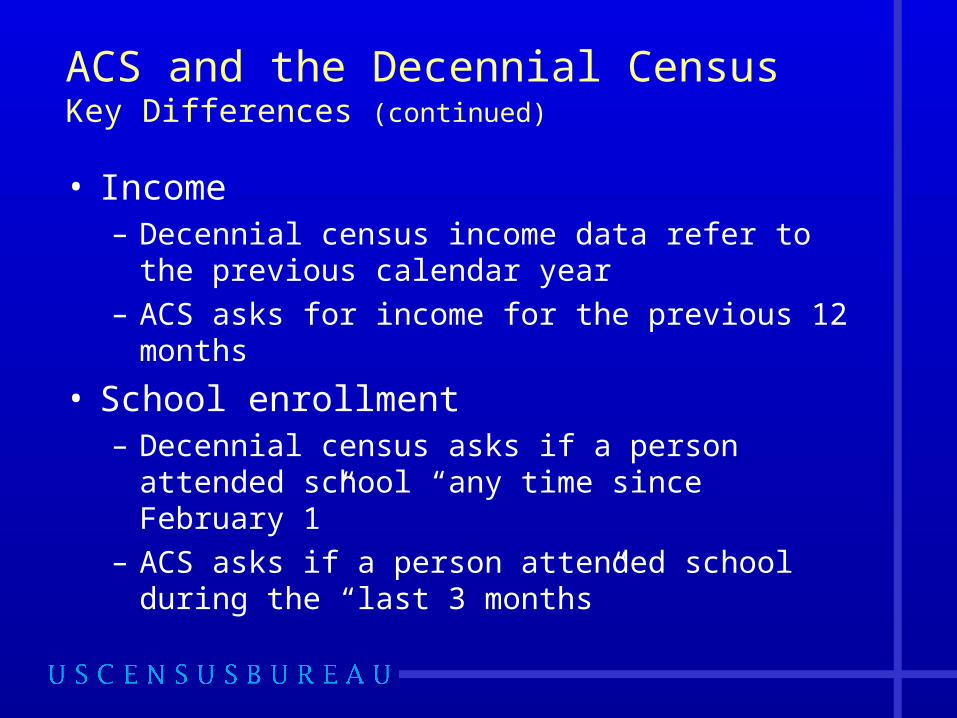
ACS and the Decennial CensusKey Differences (continued)
• Income– Decennial census income data refer to the
previous calendar year– ACS asks for income for the previous 12 months
• School enrollment– Decennial census asks if a person attended
school “any time since February 1”– ACS asks if a person attended school during the
“last 3 months”

Data Releases
10
1111
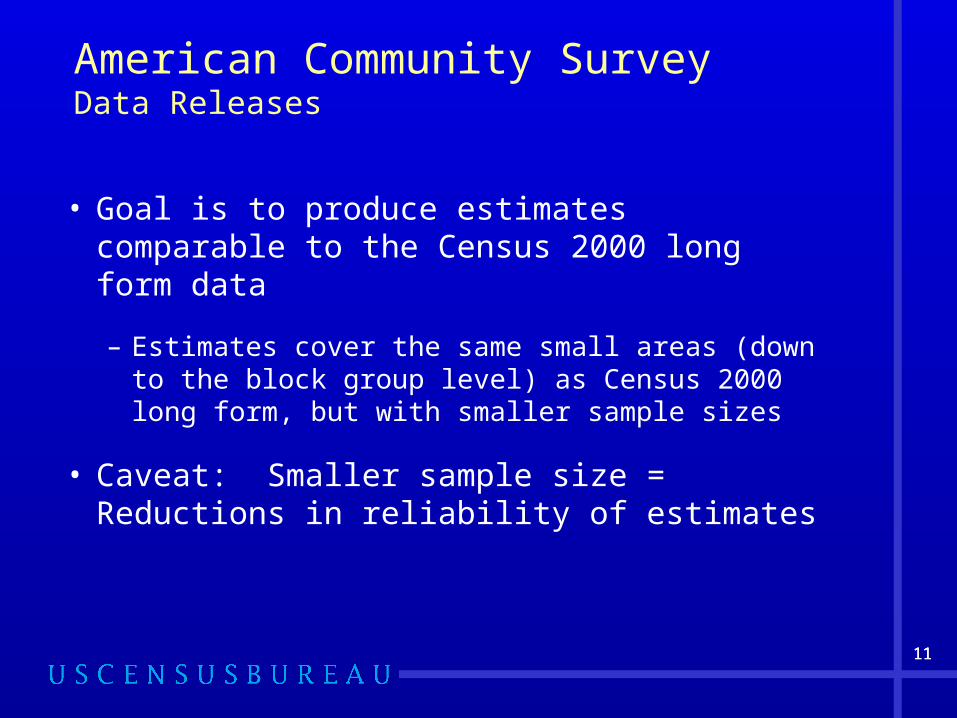
American Community SurveyData Releases
• Goal is to produce estimates comparable to the Census 2000 long form data
– Estimates cover the same small areas (down to the block group level) as Census 2000 long form, but with smaller sample sizes
• Caveat: Smaller sample size = Reductions in reliability of estimates
11

1212
American Community Survey Data Releases
• ACS estimates are period estimates– Describe the average characteristics over a
specified period– Contrast with point-in-time estimates that describe
the characteristics of an area on a specific date
• ACS releases 1-year, 3-year, and 5-year estimates for geographic areas that meet specific population thresholds

1313
American Community Survey Data Releases: Schedule

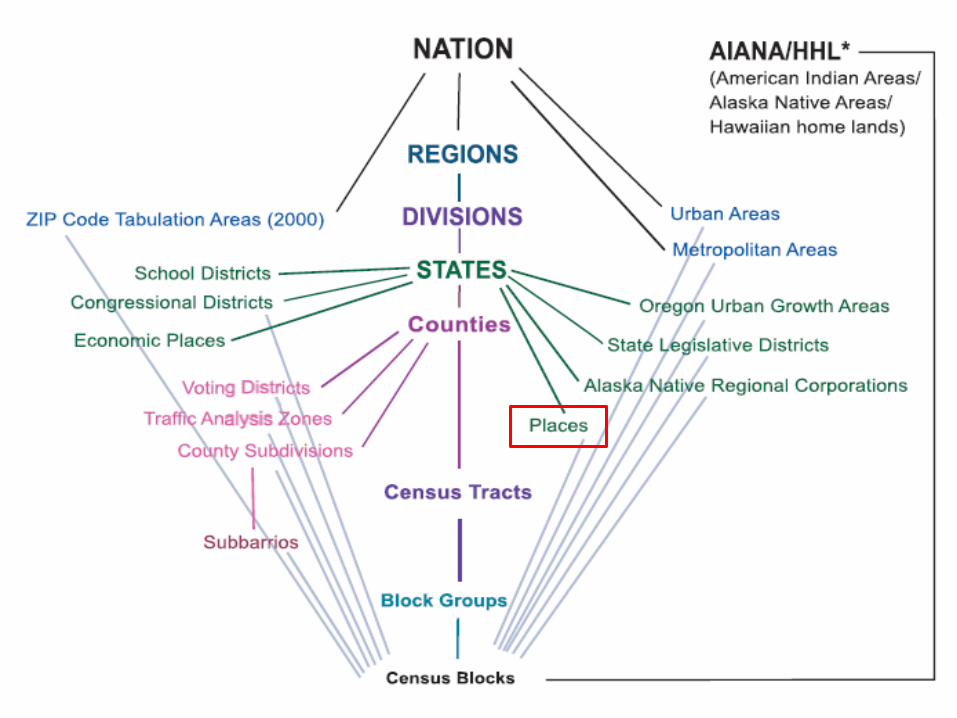
Census Geographic Entities: Hierarchy
14
15

Survey Methodology
16
1717
American Community Survey Methodology
• Sample includes about 250,000 addresses per month, or 3 million addresses each year,
• Group quarters populations included in the ACS since 2006
• Data collected continuously throughout the year by three modes– Mail– Phone– Personal visit
18
Caveats
• ACS data are estimates
• ACS data are not counts of the population or housing
• Population counts are produced from the decennial census
– Counts are updated throughout the decade through the Population Estimates Program
1919
ACS Estimates: Period Estimates
• Period estimates describe the average characteristics over a specific time period
• Point-in-time estimates describe characteristics as of a specific date
20
Sampling Error
• The uncertainty associated with an estimate that is based on data gathered from a sample of the population rather than the full population
• Margin of error (MOE) measures the precision of an estimate at a given level of confidence
• MOEs at the 90% confidence level for all published ACS estimates

21
ACS Multiyear Estimates

22
ACS Multiyear Estimates
Definition
• A period estimate that encompasses more than one calendar year
• Period for ACS multiyear estimates is either 3 or 5 calendar years– First release for 3-year estimate is 2008 (for
period 2005-2007)– First release for 5-year estimate is 2010 (for
period 2005-2009)

23
Constructing Multiyear Estimates
• Data are pooled across 36 or 60 months
• Data are weighted to produce estimates
• Estimates are controlled for age, sex, race, and Hispanic origin
• Multiyear estimates are not an average of 1-year estimates

24
When to Use Multiyear Estimates
• No one-year estimate is available
• Margins of error for 1-year estimates are larger than required
• Analyzing data for small population groups

25
Currency vs. Reliability
Currency Reliability
1-year estimates provide information based on the last year
Larger sample sizes produce estimates that are more statistically reliable
3-year estimates provide information based on the last year and the 2 years before that
3-year estimates are based on 3 times as many sample cases as 1-year estimates
5-year estimates provide information based on the last year and the 4 years before that
5-year estimates are based on 5 times as many sample cases as 1-year estimates
26
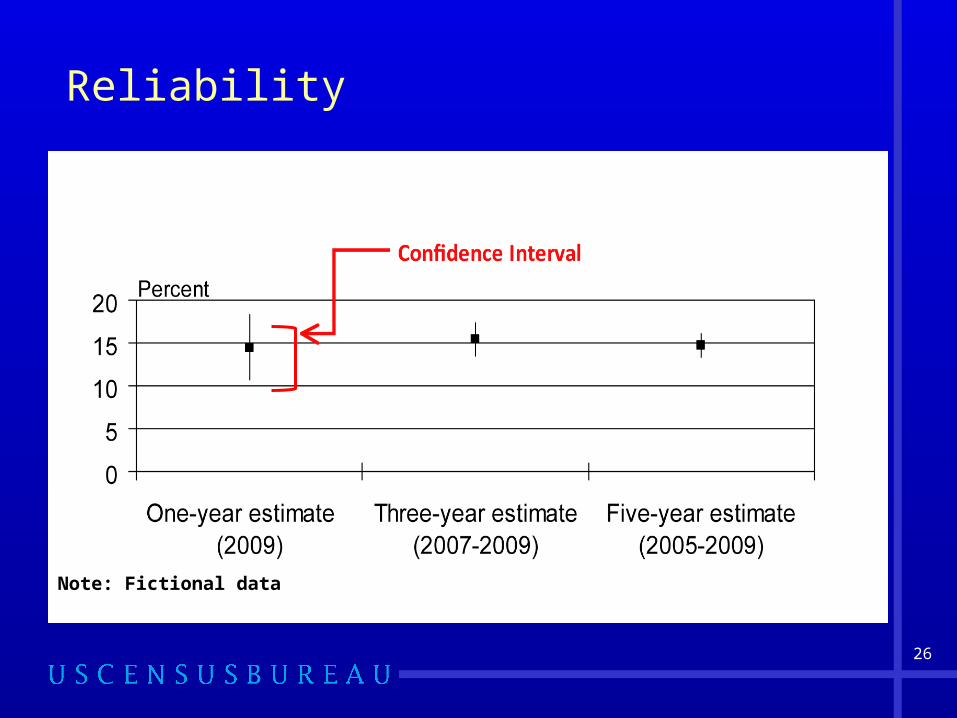
Reliability
Note: Fictional data
27
How to Label Multiyear Estimates
• Multiyear estimates do not represent any one year nor the midpoint of a period
• ACS estimates based on data collected from 2005-2007 should not be labeled “2006” or “2007” estimates
• Correct labeling for multiyear estimate: “The child poverty rate for the 2005-2007 period was X percent.”
28
Inflation Adjustment
• Dollar-valued data items are inflation adjusted to the most recent year for the period
• Income, rent, home value, and energy costs
• Adjusted using inflation factors based on the Consumer Price Index (CPI)
• Adjustment designed to put the data into dollars with equal purchasing power

29
Population Controls
• Estimates of housing units and people controlled to the population estimates derived from the Population Estimates Program
• Multiyear estimates controlled to the average of the individual year’s estimates for the period
30
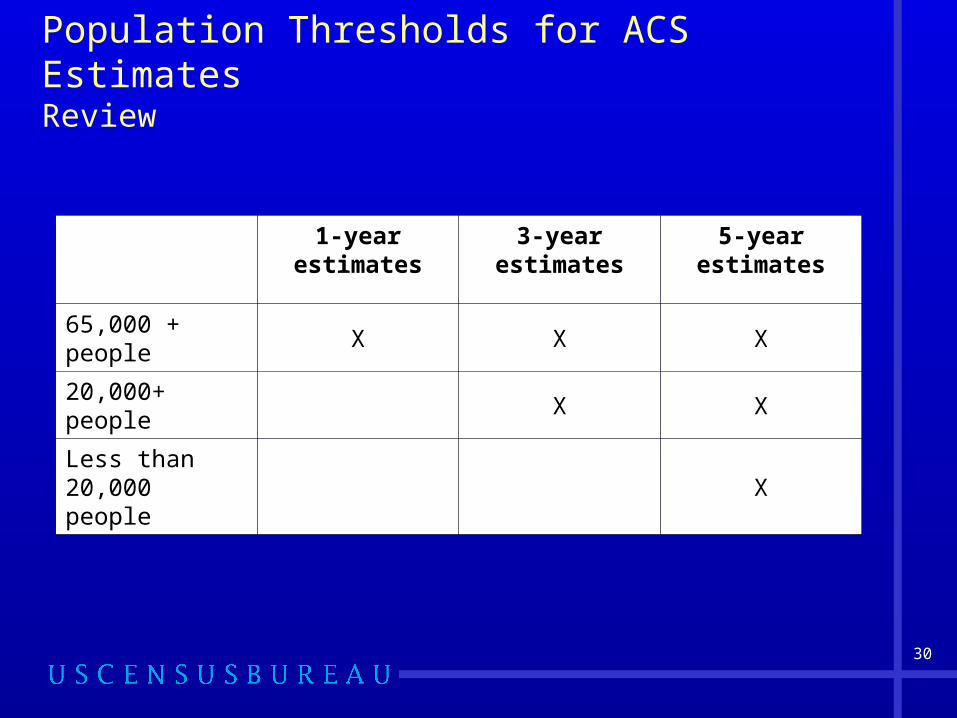
Population Thresholds for ACS EstimatesReview
1-year estimates
3-year estimates
5-year estimates
65,000 + people X X X
20,000+ people X X
Less than 20,000 people X

31
Geographic Boundaries
• Multiyear estimates are based on geographic boundaries as of January 1 of the last year in the multiyear period
• Boundary Annexation Survey collects boundary changes
• Boundaries of other statistical areas will be updated every decade in conjunction with the decennial census
32
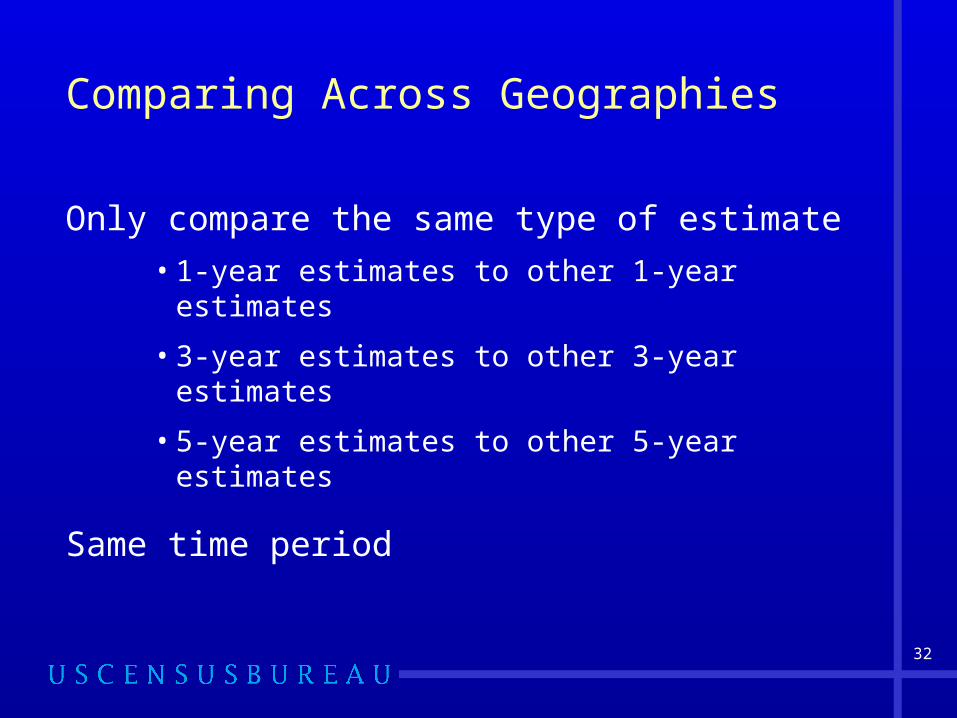
Comparing Across Geographies
Only compare the same type of estimate
• 1-year estimates to other 1-year estimates
• 3-year estimates to other 3-year estimates
• 5-year estimates to other 5-year estimates
Same time period
33
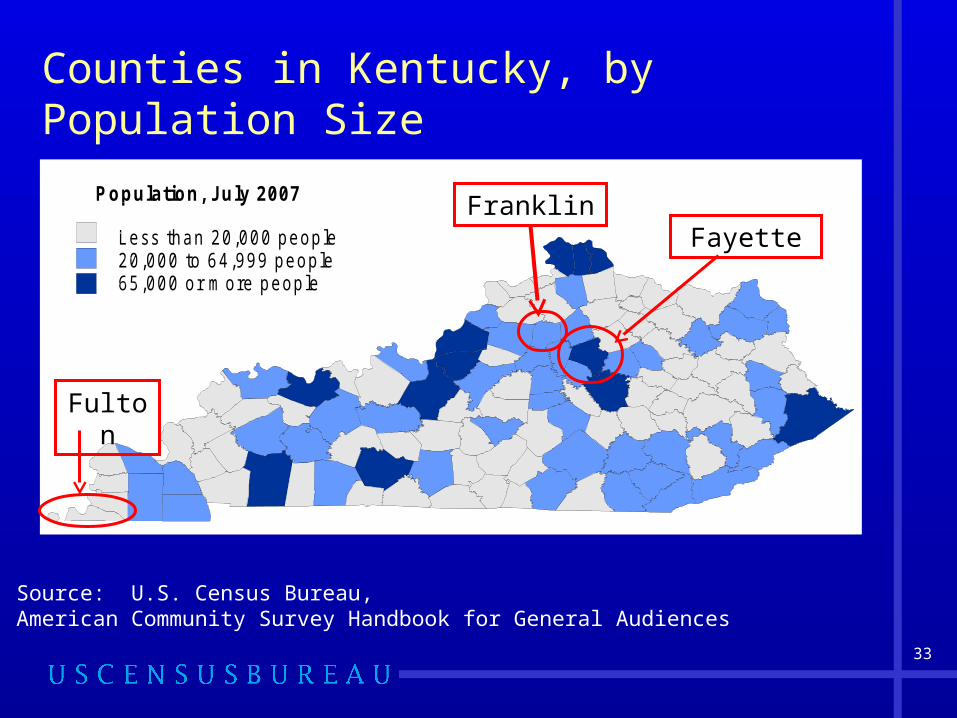
Counties in Kentucky, by Population Size
Source: U.S. Census Bureau, American Community Survey Handbook for General Audiences
Less than 20,000 people20,000 to 64,999 people65,000 or m ore people
Population, July 2007
Figure 3: Counties in Kentucky by Population Size, 2007
P opulation, July 2007
0.00 to 20000.00
20000.00 to 65000.00
65000.00 to 800000.00
Fulton
FranklinFayette
34
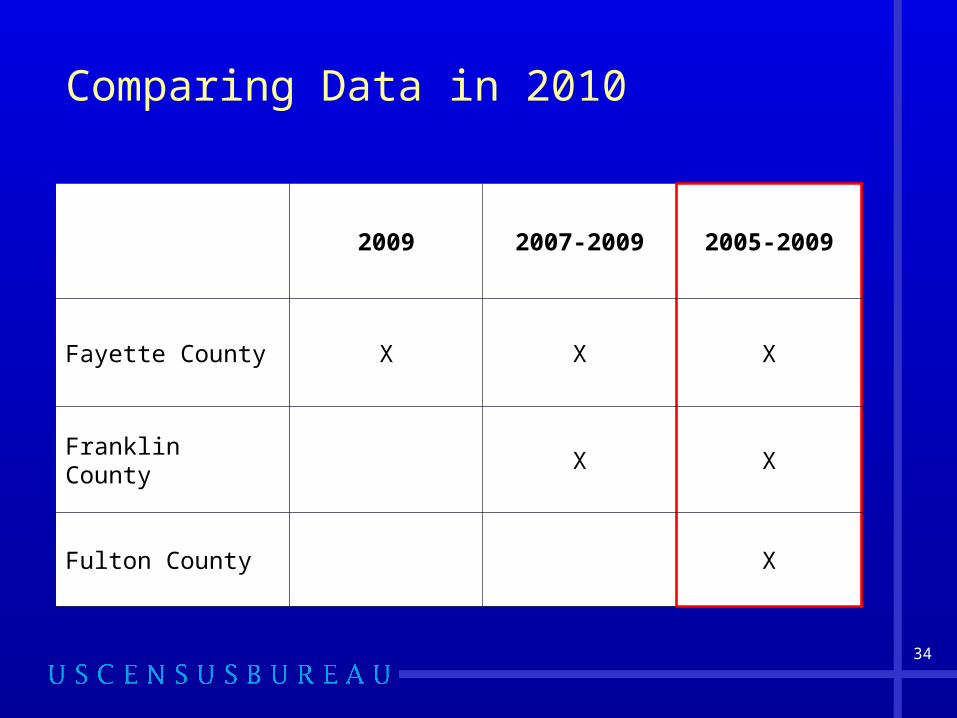
Comparing Data in 2010
2009 2007-2009 2005-2009
Fayette County X X X
Franklin County X X
Fulton County X
35
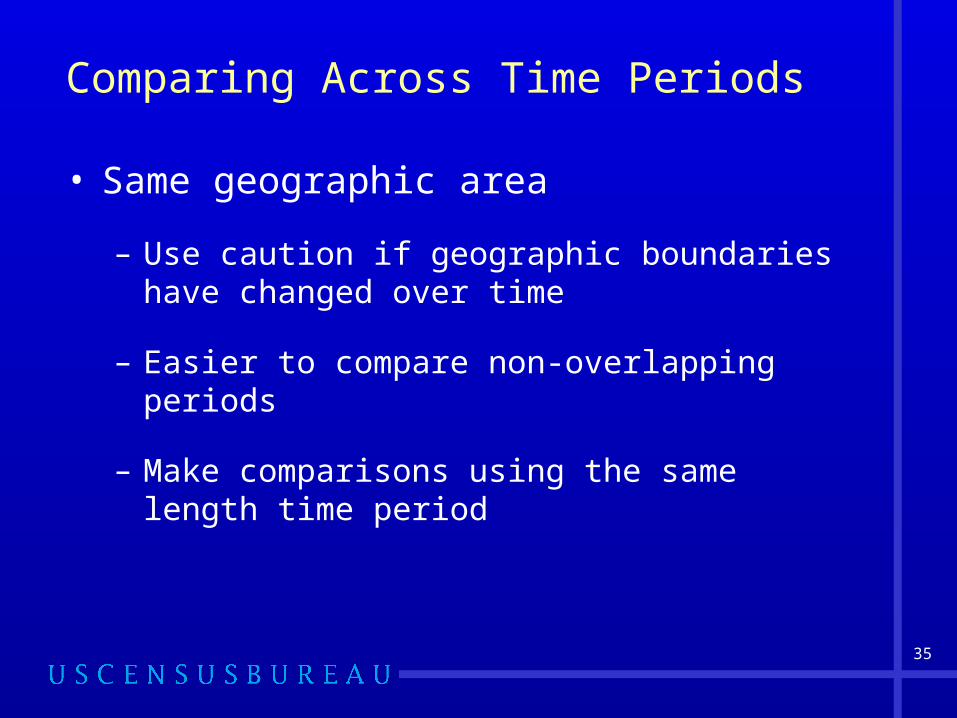
Comparing Across Time Periods
• Same geographic area
– Use caution if geographic boundaries have changed over time
– Easier to compare non-overlapping periods
– Make comparisons using the same length time period

36
Comparing ACS Data with Census 2000
• Differences exist between ACS and Census 2000
• Comparisons can be made for most population and housing subjects
• Crosswalk available
– “Compare”
– “Compare with Caution”
– “Do Not Compare”
http://www.census.gov/acs/www/UseData/compACS.htm
37
Choosing the Estimates
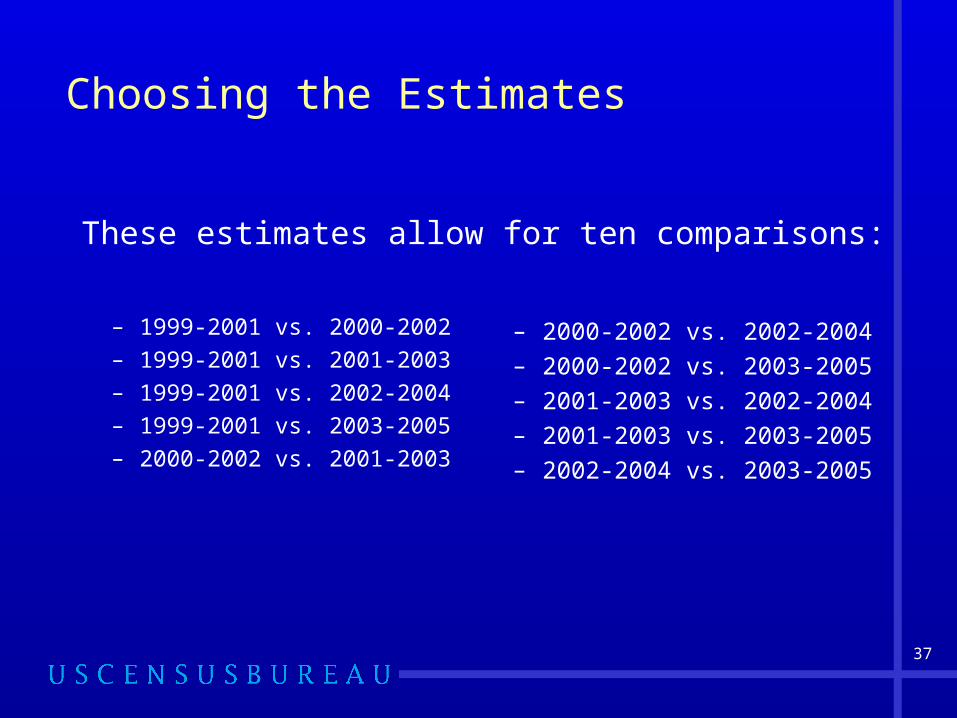
– 1999-2001 vs. 2000-2002
– 1999-2001 vs. 2001-2003
– 1999-2001 vs. 2002-2004
– 1999-2001 vs. 2003-2005
– 2000-2002 vs. 2001-2003
– 2000-2002 vs. 2002-2004
– 2000-2002 vs. 2003-2005
– 2001-2003 vs. 2002-2004
– 2001-2003 vs. 2003-2005
– 2002-2004 vs. 2003-2005
These estimates allow for ten comparisons:
38
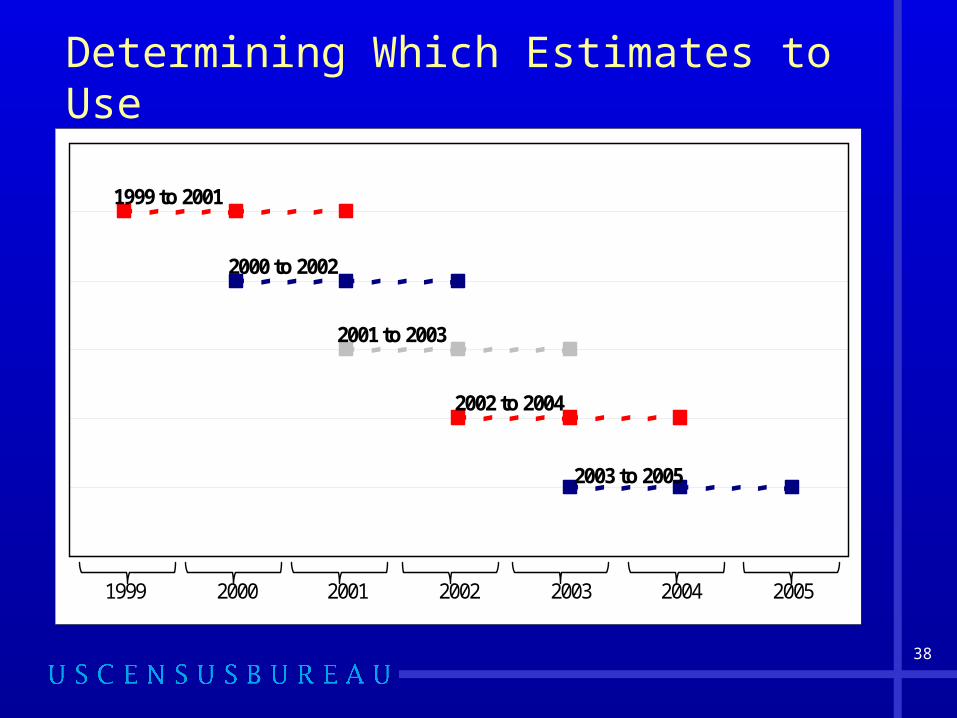
Determining Which Estimates to Use
1999 to 2001
2000 to 2002
2001 to 2003
2002 to 2004
2003 to 2005
1999 2000 2001 2002 2003 2004 2005
39
Summary on Multiyear Estimates
• Multiyear estimates are period estimates and should be interpreted and labeled as such
• Data users should consider the tradeoffs of currency versus reliability
• Comparisons between estimates of different geographies should be based on ACS data from the same time periods
• It is easier to compare estimates from non-overlapping periods
40
ACS Data Products
40
41
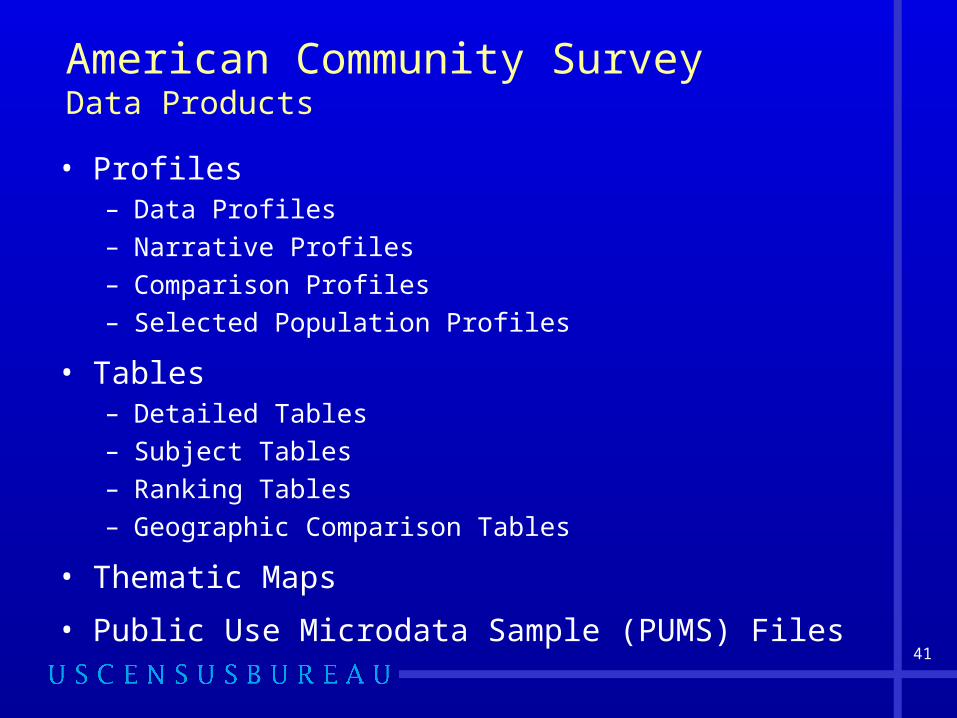
American Community SurveyData Products
• Profiles– Data Profiles– Narrative Profiles– Comparison Profiles– Selected Population Profiles
• Tables– Detailed Tables– Subject Tables– Ranking Tables– Geographic Comparison Tables
• Thematic Maps
• Public Use Microdata Sample (PUMS) Files

42
Data Profiles Data Profile

4343
Narrative Profiles
Narrative Profile
44
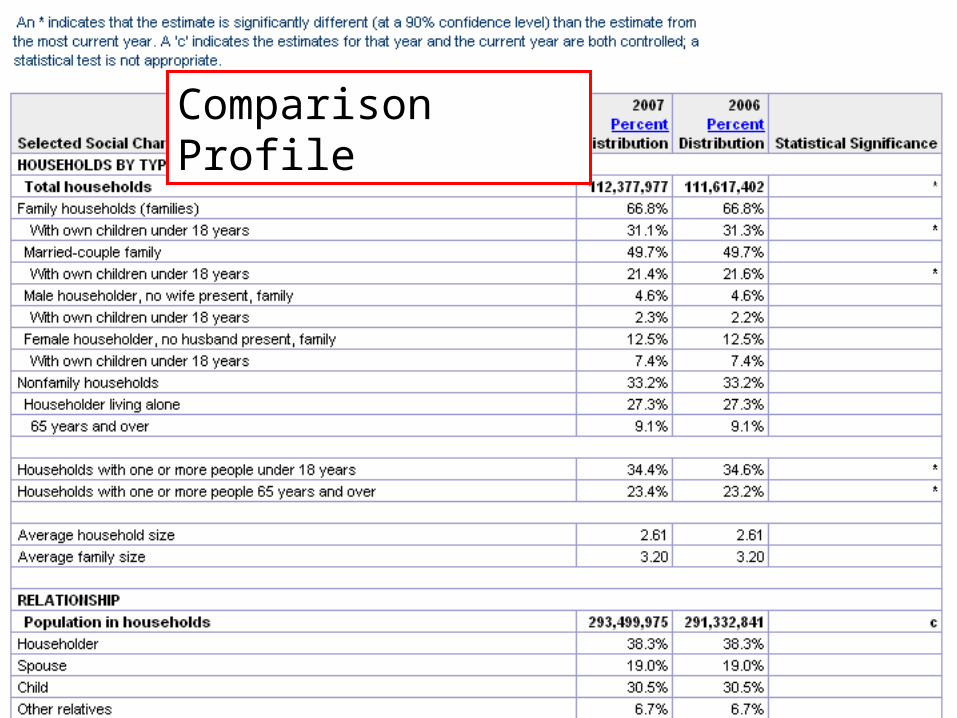
Comparison Profiles
44
Comparison Profile

45
Selected
45
Selected Population
Profiles

4646
Selected Population ProfilesSelected
Population Profiles

4747
Detailed TablesExamples
• Sex by Age by Race and Hispanic Origin
• Means of Transportation to Work by Travel Time to Work
• Median Number of Rooms in Housing Units
• School Enrollment by Level of School
• Poverty Status in the past 12 Months by Sex and Age
4848
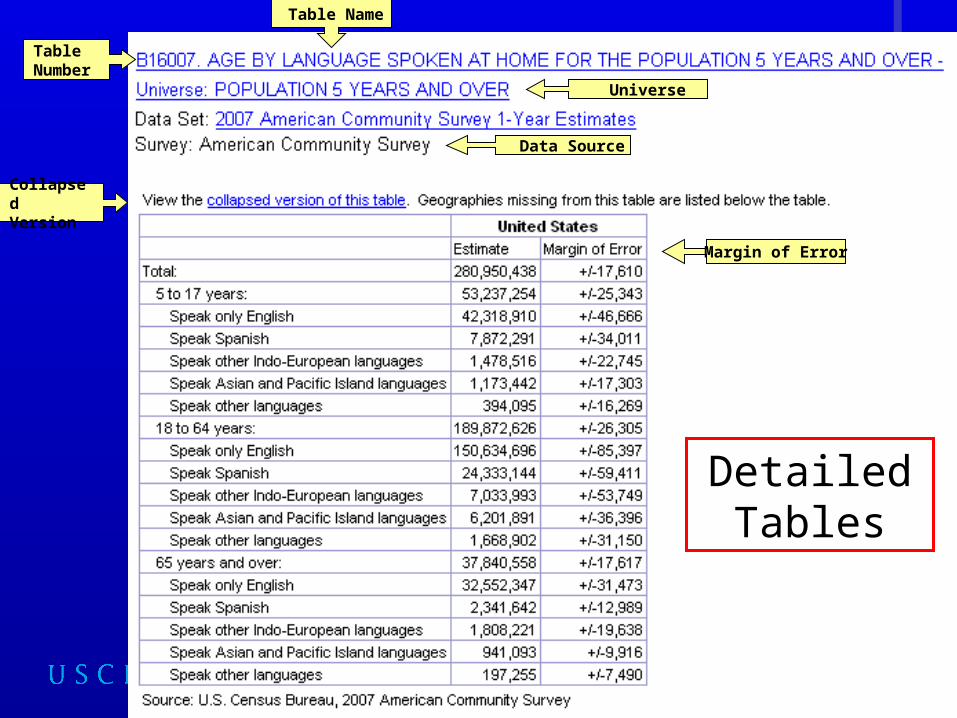
Data Source
Universe
Margin of Error
Table Name
Table Number
Collapsed Version
Detailed Tables

49
Detailed Tables – Collapsed Version
49
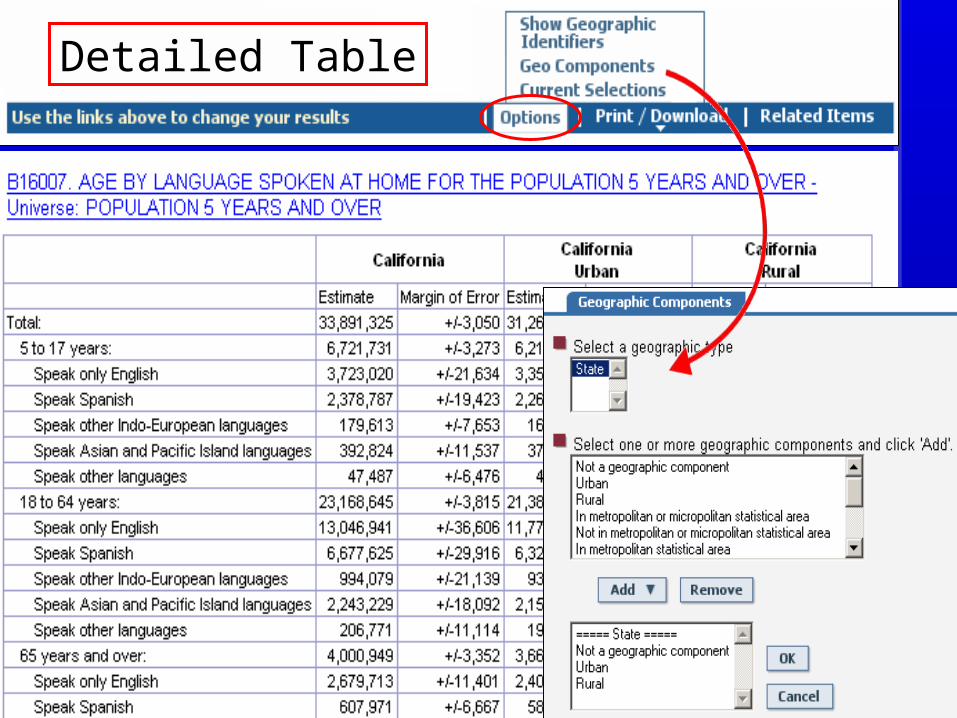
50
Detailed Table

51
Detailed Tables for Quality Measures
Detailed Tables for
Quality Measures
5252
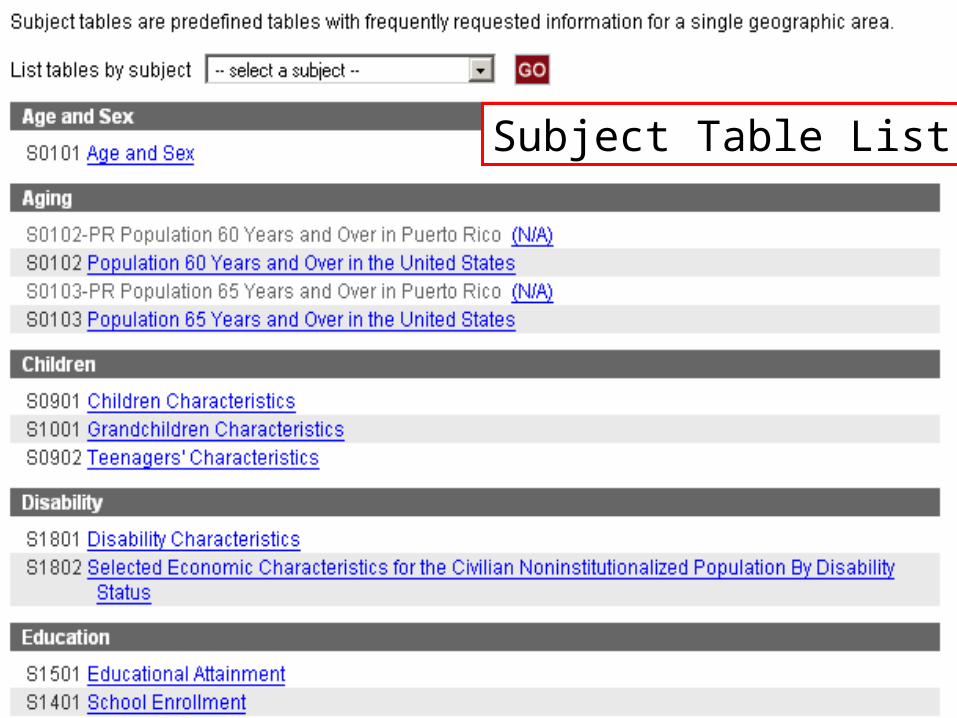
Subject Table ListSubject Table List

5353
Subject Tables Subject Table
5454
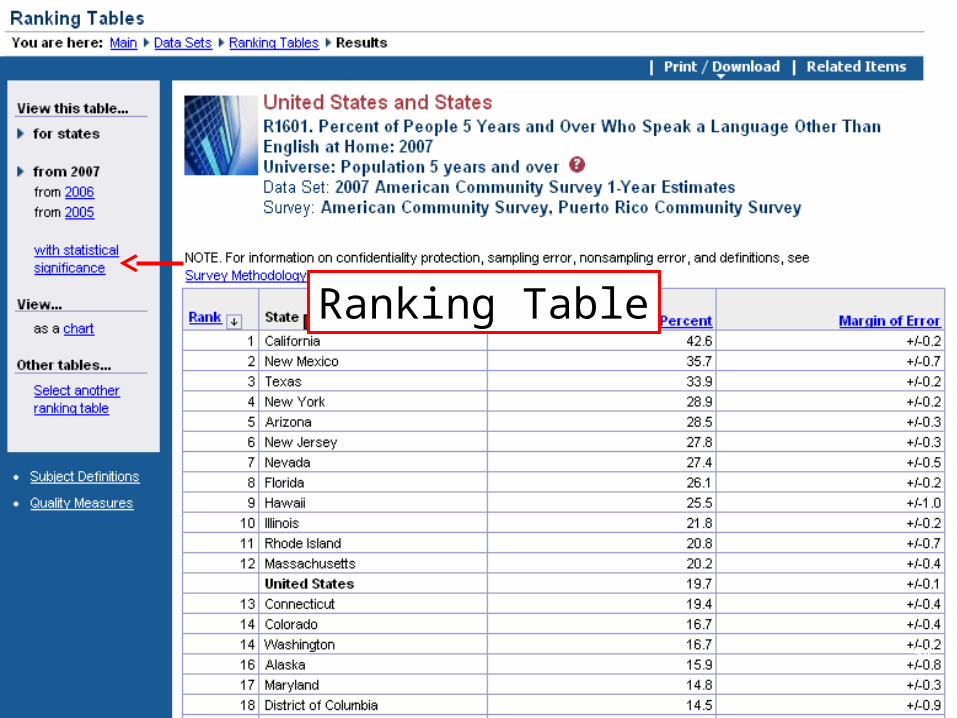
Ranking Table

5555
Ranking Table
56
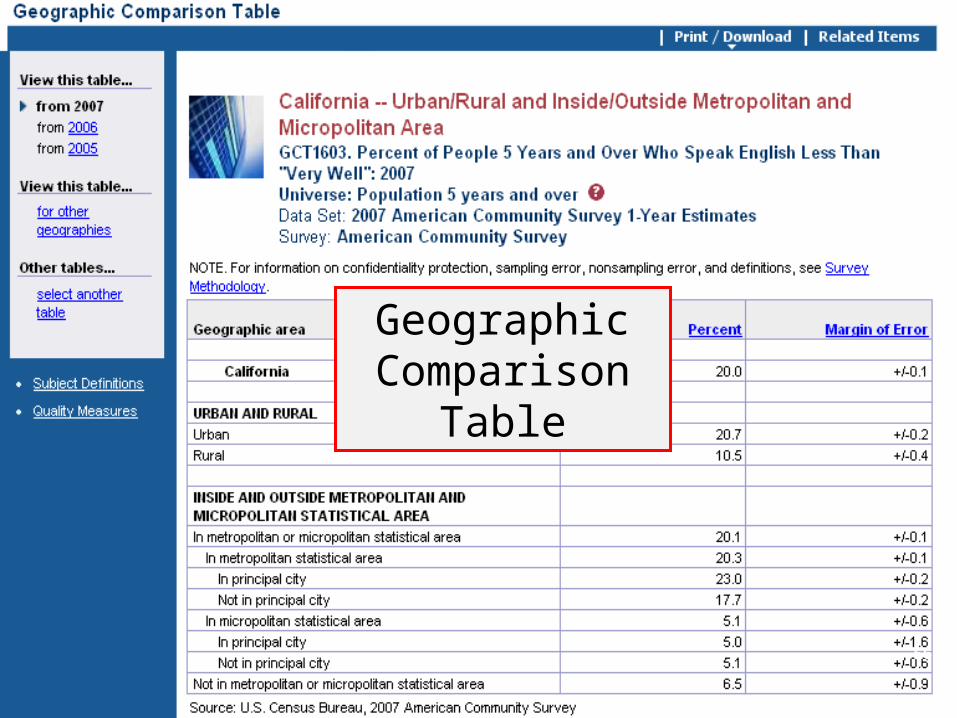
Geographic Comparison Table
56
Geographic Comparison
Table

5757
Thematic Map
58
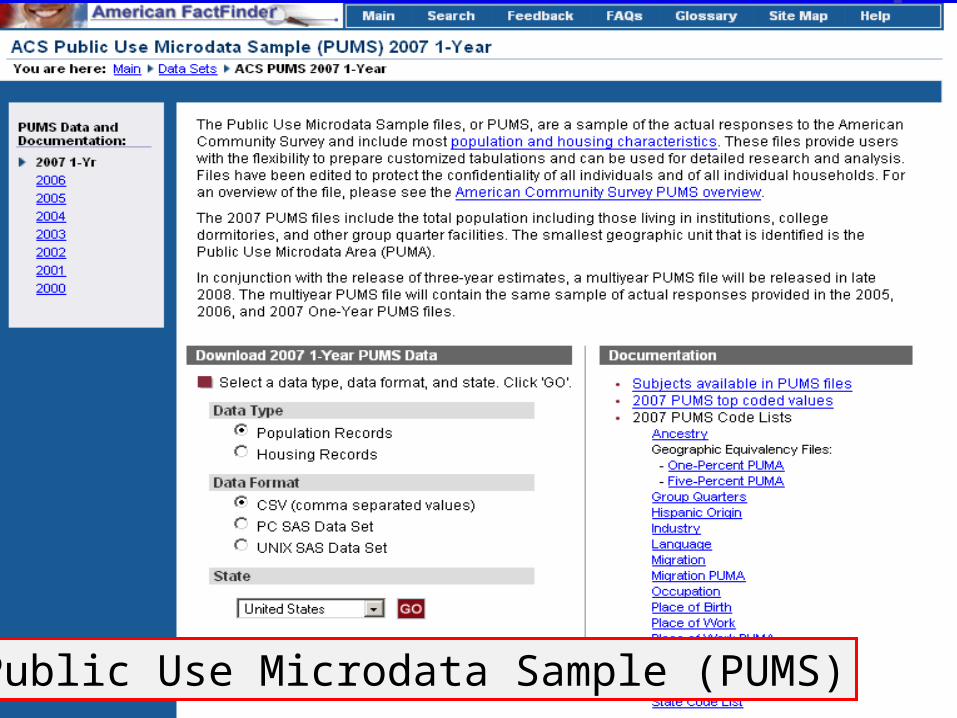
Public Use Microdata Sample (PUMS)
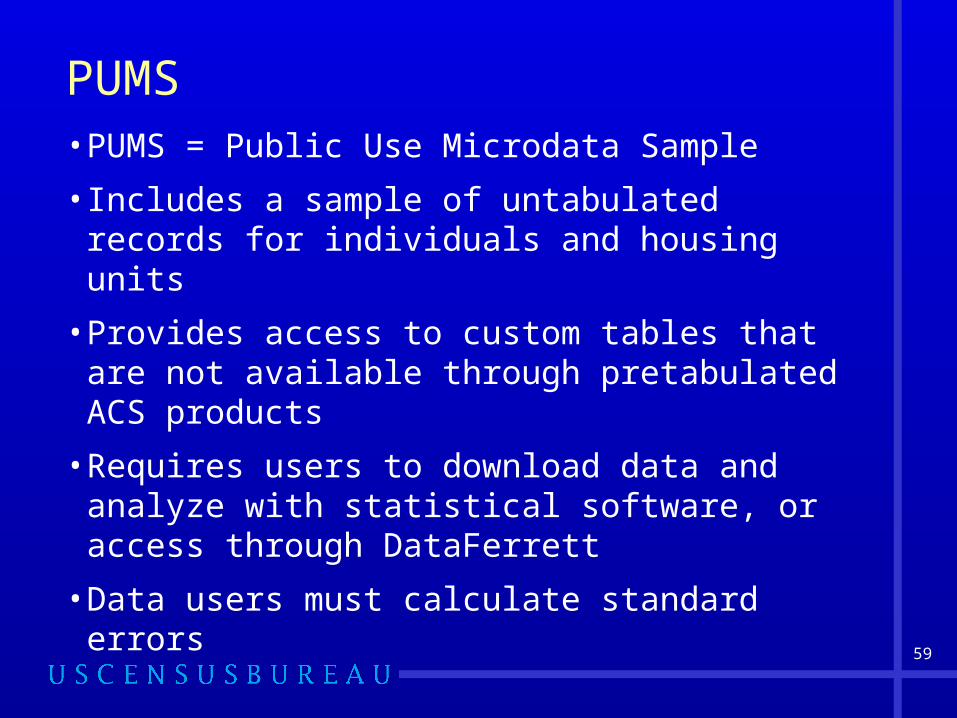
PUMS• PUMS = Public Use Microdata Sample
• Includes a sample of untabulated records for individuals and housing units
• Provides access to custom tables that are not available through pretabulated ACS products
• Requires users to download data and analyze with statistical software, or access through DataFerrett
• Data users must calculate standard errors
59

Accessing ACS Data Online
60

Census Bureau Home Pagehttp://www.census.gov
61
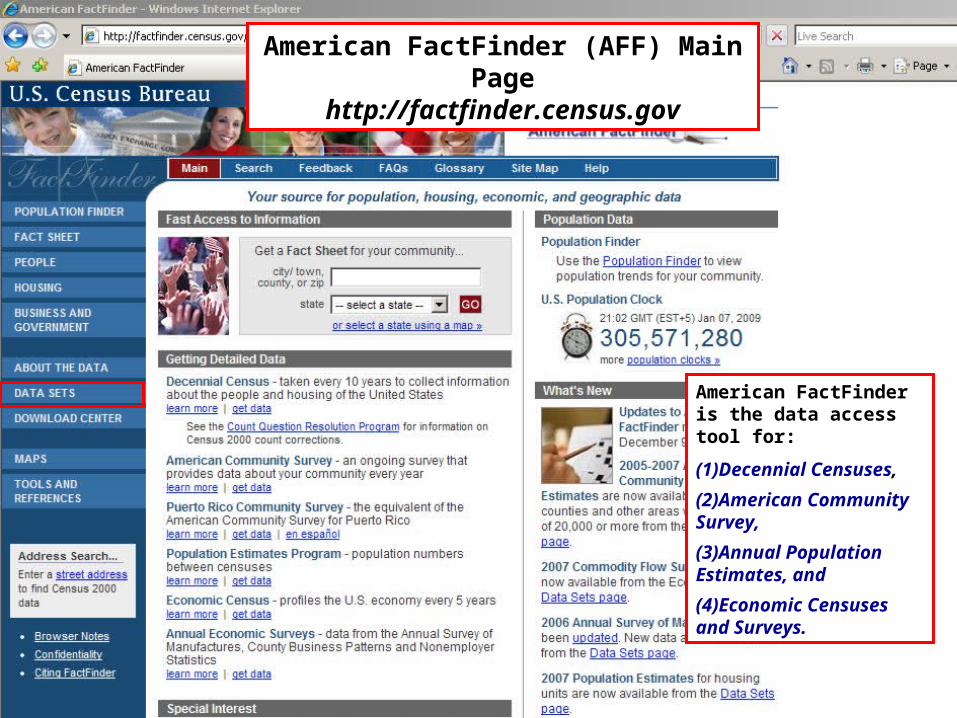
American FactFinder (AFF) Main Pagehttp://factfinder.census.gov
American FactFinder is the data access tool for:
(1)Decennial Censuses,
(2)American Community Survey,
(3)Annual Population Estimates, and
(4)Economic Censuses and Surveys.
62
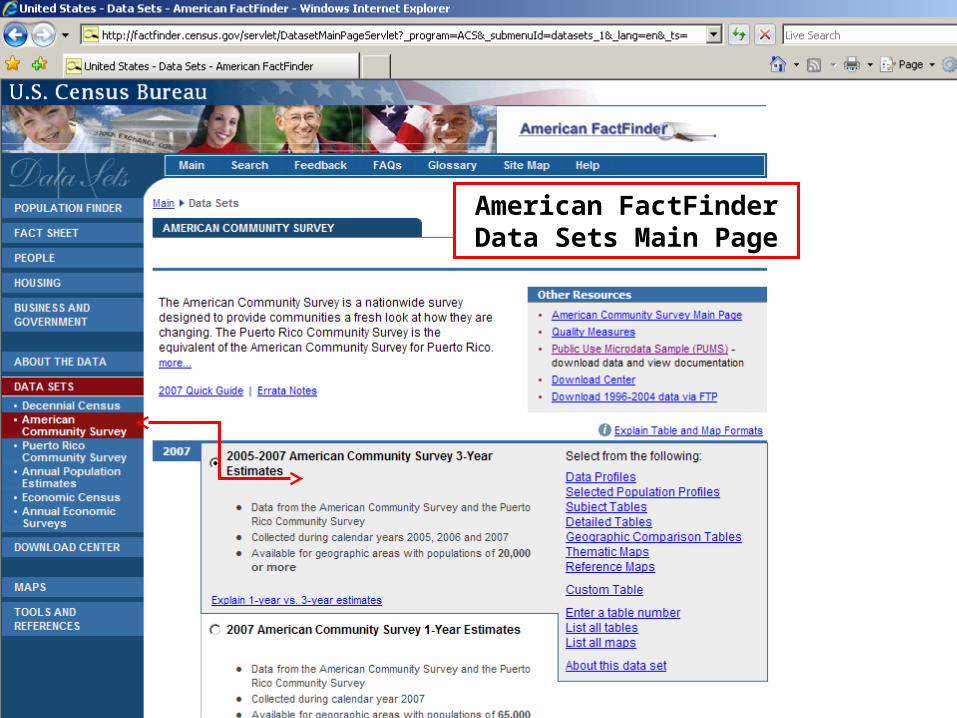
American FactFinderData Sets Main Page
63

American Community Survey Main Pagehttp://www.census.gov/acs/www
64

66
Linda ClarkInformation Services Specialist
Seattle Regional Census Center(425) 908-3062
Questions?