American Boondoggle - Calusa...
23
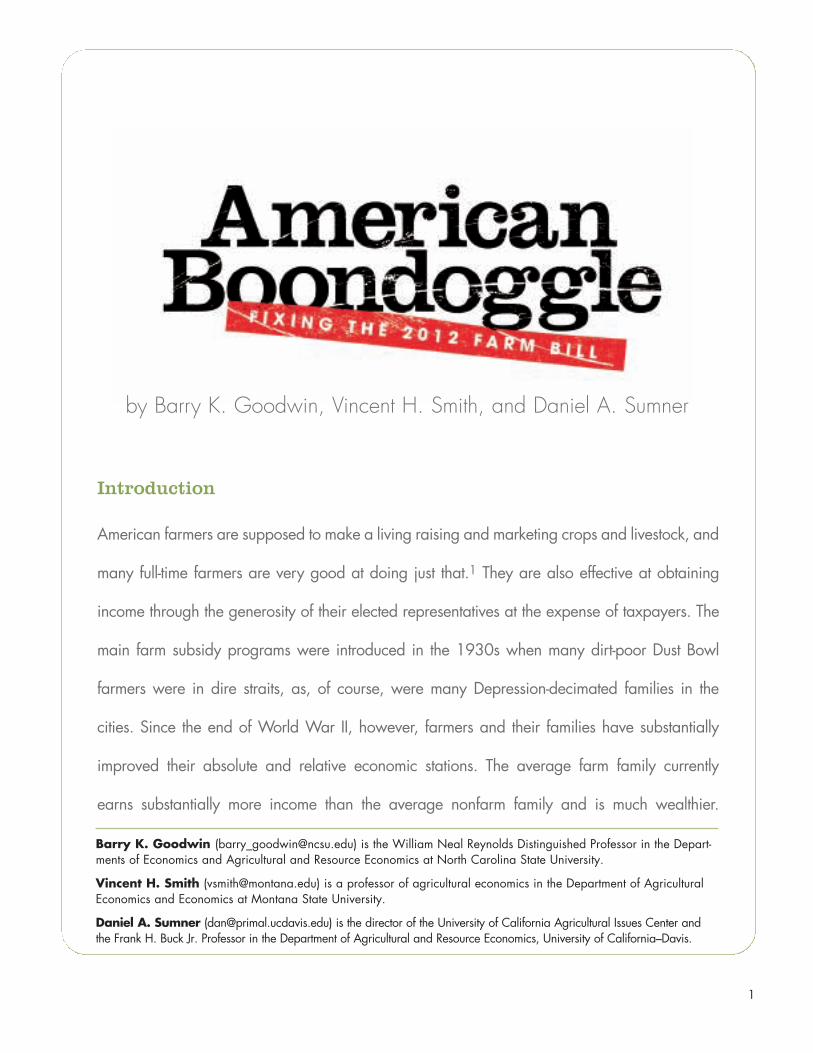
American Boondoggle Fixing the 2012 Farm Bill by Barry K. Goodwin, Vincent H. Smith, and Daniel A. Sumner
Transcript of American Boondoggle - Calusa...

American Boondoggle Fixing the 2012 Farm Bill
by Barry K. Goodwin, Vincent H. Smith, and Daniel A. Sumner

Barry K. Goodwin ([email protected]) is the William Neal Reynolds Distinguished Professor in the Depart-ments of Economics and Agricultural and Resource Economics at North Carolina State University.
Vincent H. Smith ([email protected]) is a professor of agricultural economics in the Department of AgriculturalEconomics and Economics at Montana State University.
Daniel A. Sumner ([email protected]) is the director of the University of California Agricultural Issues Center andthe Frank H. Buck Jr. Professor in the Department of Agricultural and Resource Economics, University of California–Davis.
Introduction
American farmers are supposed to make a living raising and marketing crops and livestock, and
many full-time farmers are very good at doing just that.1 They are also effective at obtaining
income through the generosity of their elected representatives at the expense of taxpayers. The
main farm subsidy programs were introduced in the 1930s when many dirt-poor Dust Bowl
farmers were in dire straits, as, of course, were many Depression-decimated families in the
cities. Since the end of World War II, however, farmers and their families have substantially
improved their absolute and relative economic stations. The average farm family currently
earns substantially more income than the average nonfarm family and is much wealthier.
1
by Barry K. Goodwin, Vincent H. Smith, and Daniel A. Sumner

2 American Boondoggle: Fixing the 2012 Farm Bill
Moreover, debt-to-asset ratios are far lower amongfamily farm businesses than family-owned main-street businesses—or, for that matter, most largecorporations—and have been much lower for mostof the last thirty years.
Farms and farm households have no more needfor federal programs that subsidize incomes andrisk-protection strategies than other businesses orhouseholds. Nevertheless, farm lobbies have contin-ued to be effective in obtaining government aid,partly through selling anecdotal sad stories aboutfifth-generation Vermont dairy families and fourth-generation Iowa corn farmers facing the loss of theirfarm inheritance, and partly through brute-force“buy our votes” politics in farm states and congres-sional districts. Ironically, most farm subsidies go tosubstantial and successful operations and providerelatively little for the types of farms in the tragicanecdotes. Moreover, many of the programs createbarriers to more efficient agriculture in the UnitedStates, interfere with international trade, and haveadverse effects on farmers in developing countrieswho are among the world’s poorest people.
This paper reviews the implications of someimportant basic facts and analyses as guidance for the2012 Farm Bill. The main focus is on programs thatprovide subsidies and revenues to farmers, whilerecognizing that food, food safety, and nutritionprograms involve substantial policy and resourceissues and, especially in the case of nutrition, exten-sive federal outlays. This paper builds on a collectionof detailed policy papers commissioned by theAmerican Enterprise Institute. We begin with anassessment of arguments that are commonly used tojustify price- and income-support policies for farmers.We then highlight some recent history of US farmprograms in the context of the current state of the US agricultural economy, and assess major programs,their rationales, and the potential for budgetarysavings and improvements in economic welfare in theUnited States and worldwide associated with theirreform. The most important conclusion is that,overall, farm program subsidies could be eliminated,or at least reduced from current levels by about $8 to
$10 billion, without affecting the US food supply orthe financial viability of US agriculture.
Myths and Legends: The “Usual Suspect” Rationales for Farm Subsidies
Legends and myths usually contain seeds of histori-cal truths. As far as we can tell, Robin Hood andMaid Marian did not exist as historical figures, butalmost surely their legends reflect the reality thatsome guerilla leaders in the north of Englandrebelled against Norman rule during the reign ofKing John in the early thirteenth century. The rationales continually used to justify farm subsidies(which seem to be inverse Robin Hood programs,taking from the relatively poor to give for the mostpart to the relatively rich) are much like manymyths, legends, and old wives’ tales, with their ori-gins in an increasingly distant past. They containassertions and stories that were or may have beentrue once upon a time, or may still be true foratypical farms and farm households, but no longerhold for most full-time farmers and their families.
Economists typically look for some market failure orgross income inequities as rationales for governmentsubsidies or regulation. In the case of US agriculture,market failures and gross income inequities that could rationalize farm subsidies are hard to find. Supporters of farm subsidies often point to the intan-gible importance of agriculture and self-reliance forbasic necessities such as food and fiber. However, those arguments generally fail to identify any specific marketfailure that would validate subsidies or other forms ofintervention. Exceptions may exist in the case of environmental and conservation programs, thougheven in those cases it may be difficult to separate market failures from standard rent-seeking behavior.There is, however, a credible positive externality/public-good argument for public investments in agri-cultural research, development, and education, whichhave dynamic benefits that spill over to all US house-holds in the form of lower commodity and food prices.
In the end, though, there is little evidence that themajority of programs in the Farm Bill address actualmarket failures or lead to improved societal welfare.Rather, farm program benefits are best viewed asrents that result from effective lobbying efforts thatare intended to benefit a politically powerful andrelatively well-off segment of the US economy.
Another deep-rooted view is that farmers operateunder adverse economic circumstances relative toother firms. This view persists despite evidence thatthe farms that receive most of the subsidies aresuccessful businesses operated by high-wealth indi-viduals. Similarly, farm lobbies claim that farming issubject to greater risk than other sectors of theeconomy and that farms and farm families are morein need (more deserving) of government support thanother sectors. This assertion is based largely on thefact that agriculture is subject to unpredictable ran-dom shocks caused by unfavorable weather events,pest damages, and other natural disasters and thatthose shocks cause farm prices to be volatile.
Proponents of farm subsidies also argue that farmsare relatively small businesses with limited assetbases and therefore less able to manage risk. Sucharguments typically ignore the general trend towardlarger farms over the last century, with consolidationof farm assets proceeding at a relatively rapid pace in recent years. It is true that large fixed costs areassociated with agriculture in developed economiesbecause of the capital-intensive and land-intensivenature of agricultural production. As a result,
agricultural producers are often believed to be morehighly leveraged against their relatively small assetbases than small nonagricultural businesses.
But the facts do not support this perspective.Debt-to-asset ratios in US agriculture (which averageabout 12 percent) are at historic lows, have beenaround that level since the early 2000s, and are sig-nificantly below debt-to-asset ratios in many othersectors of the economy. Many farms have no debt atall, and those that carry significant debt tend to bethe larger farms. Of course, nonfarm industries alsoface considerable risks, including input price volatil-ity (for example, the trucking industry), outputprice volatility (for example, the mining sector), andcomplete loss of markets because of technical inno-vation by competing firms (for example, amongfirms manufacturing and marketing laptops andiPad-like tablets). The farm lobby and sympatheticpolicymakers argue that farms fail at alarming rates,but the simple fact is that business failure and disso-lution rates are much higher for nonagriculturalbusinesses than for farms. Indeed, business failurerates are more than five times greater in the nonfarmsector than in the farm sector. Like Dorothy, mostmain-street and many other businesses are not inKansas anymore (and many, of course, were neverthere), do not raise wheat or corn, and do not regu-larly enjoy extensive federal subsidies.
In the same vein, proponents of subsidies claimthat farmers and their families have lower incomes(as well as lower wealth) than nonfarm families.Those claims may have been true seven decades ago when farm subsidies began, but farmers todaytypically have higher incomes (as reflected in eitheraverage or median household incomes) than nonfarm households and are far wealthier.
It is important to recognize that there can behuge differences in the economic performance offarms and the economic well-being of farm house-holds. Many farm households have significant non-farm earnings. These include off-farm employmentincome, retirement income, income from nonfarminvestments, and income from nonfarm businesses.Most small farms are very much part-time activities
Barry K. Goodwin, Vincent H. Smith, and Daniel A. Sumner 3
Farm program subsidies could be
eliminated, or at least reduced from
current levels by about $8 to
$10 billion, without affecting the
US food supply or the financial
viability of US agriculture.

that never earn a profit because they produce little output. The empirical fact is that even when farms fail to earnprofits (the average US farm claims a net loss on its Schedule F taxable netincome), the typical farm household isnot poor.2
Simply put, there are no persuasivearguments for income inequity, marketfailure, or excessive risk to justify farmsubsidies. Moreover, the farm programsthat do transfer incomes to farmers pro-vide benefits roughly in proportion toproduction and inevitably subsidize largerand more successful commercial farms.These programs are simply unrelated toany antipoverty goals: they pay more tofarms that are bigger and wealthier andthey are intended to do so.
Where Farm ProgramsStand Today
The 2008 Farm Bill, the omnibus pack-age of farm legislation for the UnitedStates, was “scored” by the CongressionalBudget Office (CBO) at $284 billion in2008 but will cost much more than thatbefore its provisions expire in 2012 (seetable 1). Sources of cost overruns include increasedexpenditures on food and nutrition programs,higher-than-expected crop insurance subsidies, andan extremely expensive disaster program for crops.Discussions among policymakers about the direc-tion of US agricultural policy in the urgent contextof the federal budget deficit are continually evolvingto reflect the changing political landscape. The 2010elections, which returned Republicans to control ofthe House and reduced the Democratic majority inthe Senate, had important impacts on the pace ofprogress toward a new Farm Bill.
Before the 2010 elections, discussions and nego-tiations appeared to be moving rapidly under the
direction of House Committee on Agriculture chairCollin Peterson (D-MN). The current committeechair, Frank Lucas (R-OK), has indicated that the 2012 Farm Bill will be completed on a muchslower schedule and sent to the president for his signature before the 2012 election.3 Deliberationsover new Farm Bill legislation are taking place in a budgetary environment that is without precedent in peacetime. According to the CBO, total federalrevenues were $2.163 trillion in 2010 but federaloutlays were $3.456 trillion, leaving a deficit of$1.294 trillion.4 This deficit represented 14.9 per-cent of gross domestic product (GDP), a levelcomparable to some of the largest federal deficits
4 American Boondoggle: Fixing the 2012 Farm Bill
Figure 2: Implied Volatilities for Corn, Wheat, and Soybeans
SOURCE: Commedity Research Bureau/Bridge Futures Market Price database.
Implie
dV
olatil
ity(A
nnua
lized
Perc
ent)
SoybeansCorn Wheat
0
10
20
30
40
50
60
70
80
Crop Year
1/5/
90
1/5/
91
1/5/
92
1/5/
93
1/5/
97
1/5/
94
1/5/
96
1/5/
98
1/5/
99
1/5/
00
1/5/
01
1/5/
03
1/5/
05
1/5/
02
1/5/
04
1/5/
06
1/5/
07
1/5/
08
1/5/
09
1/5/
10
1/5/
95
Figure 1: Nearby Futures Prices for Corn, Wheat, and Soybeans
SOURCE: Commodity Research Bureau/Bridge Futures Market Price database.
Futu
res
Pric
e(C
ents
/Bus
hel)
Crop Year
0200400600800
10001200140016001800
Soybeans Corn Wheat
1/8/
60
1/8/
63
1/8/
66
1/8/
69
1/8/
78
1/8/
72
1/8/
75
1/8/
81
1/8/
84
1/8/
87
1/8/
90
1/8/
96
1/8/
02
1/8/
93
1/8/
99
1/8/
05
1/8/
08

ever realized, including during World War II. Even under optimistic economic growth projec-tions, the CBO forecasts that the federal deficit will persist for many years. The fact that spendingon mandatory programs, such as Medicare andSocial Security, and interest payments on publicdebt are projected to continue to increase in total and as a proportion of GDP adds further pres-sure to the need to address the federal budgetdeficit. In the current fiscal environment, spendingsubstantial federal funds on farm programs that have no real economic or equity justification ishighly problematic.
Other factors are relevant to the current state ofthe US agricultural economy. Historical prices forcorn, wheat, and soybeans and their volatilities arepresented in figures 1 and 2. Over the past fouryears, prices for major subsidized commodities havereached historic high levels (see figure 1). Highprices for grains like corn and wheat and oilseedslike soybeans are directly relevant to the operationof, and lack of need for, price- or income-supportprograms such as marketing loans and loan-deficiency payments. The current average nationalloan rate for corn, which represents a support pricefor producers, is $1.95 per bushel. In comparison,in May 2011, new crop corn futures were trading atover $6.60 per bushel and corn was selling at morethan $5.50 in many cash markets. Similarly highprices for other subsidized crops, including sugar,imply that price-support programs are unlikely to be relevant in the near or medium term. Moreover,the US Department of Agriculture (USDA) and other forecasting groups project market prices farhigher than the support prices for all crops withprice-support programs. Agricultural commodityprices have been volatile over the past four years (seefigure 2), but they have not been sufficiently variableto lower prices for major crops like grains andoilseeds even close to levels that would trigger price-support payments. In fact, the last four years havegenerated record-high gross farm revenues frommarket sales and record-high net farm incomes forfarm households.
Biofuels Policy
Much of the increase in program-crop prices is attrib-utable to US bioenergy policies, which have signifi-cantly increased nonfood demand for corn andoilseeds, raising food- and feed-related demand forwheat and other grains. At the same time, as landhas shifted to corn and soybeans, fewer acres havebeen available for other crops, also contributing to thehigh prices of those commodities. The US EnergyIndependence and Security Act of 2007 has been par-ticularly important because it raised mandated use ofrenewable fuels, specifically traditional ethanol madefrom corn, even though there is compelling evidencethat corn-based ethanol provides no measurablereductions in greenhouse gas emissions.5 The 2007legislation mandated that at least 36 billion gallons ofrenewable fuels be blended into gasoline by 2022—alevel nearly five times higher than the 7.5 billion–gallon renewable fuel mandate for 2012 established inthe 2005 Energy Policy Act. Recent and projectedfarm subsidies have mainly consisted of crop insur-ance subsidies, direct payments largely unrelated toon-farm activities, and conservation payments, andthis trend will continue.6 In contrast, before 2005, theagricultural sector was characterized by periods oflow prices that triggered marketing loan gains, loan-deficiency payments, and countercyclical paymentsrelatively frequently.
Where the Farm Bill Subsidy Dollars Go
Food and Nutrition Subsidies. The bulk of Farm Billspending is not for farms at all, but for food and nutri-tional assistance programs that constitute the largestmeans-tested federal poverty programs outsideMedicare. Of the $284 billion that the CBO projectedthe 2008 Farm Bill would cost (for the 2008–2012 fiscal year period), $189 billion (about 65 per-cent) was spent on Title IV programs, which includefood stamps (now known as the Supplemental Nutri-tion Assistance Program), the Women, Infants, and
Barry K. Goodwin, Vincent H. Smith, and Daniel A. Sumner 5

Children program, school lunch programs, and othersuch programs that are mainly aimed at providingassistance to children and adults from all families whosuffer from poverty.
Current policy debates about these programs generally concern whether the programs should beused to target increased consumption of specific categories of food (for example, fruits and vegetables),which poor families and individuals should be pro-gram eligible, and how much the country can affordto spend on these types of targeted income-transferprograms.7 The issue of targeting food assistance toparticular foods to reduce obesity, especially amongchildren, and to more generally encourage healthydiets will be among the most hotly contested FarmBill issues.8
An important policy process issue is whether foodassistance programs should be in the Farm Bill at all.
It would seem natural to address poverty that leads to nutritional problems in separate nutritionprogram legislation under the purview of the con-gressional committees that address other antipovertywelfare programs. Separating the nutrition programsfrom the farm subsidy provisions of the Farm Billwould reduce the potential for logrolling, which has meant that members from urban districts and states vote in favor of farm subsidies to obtainsupport for nutrition programs. In addition, sincemembers representing farm constituencies dominatethe agriculture committees in Congress, they do not have a background or interest in nutrition programs, which represent the bulk of the outlaysunder their purview. There is no natural connec-tion between these parts of the Farm Bill, and to continue the linkage reduces the quality of policy on both sides.
6 American Boondoggle: Fixing the 2012 Farm Bill
Table 1: CBO-Projected Cost of the 2008 Farm Bill (Fiscal Years 2008–2012)
Section Title CBO Score ($Million)
Commodities Title I 41,628
Conservation Title II 24,112
Trade/Food Aid Title III 1,853
Nutrition Title IV 188,902
Credit Title V –1,424
Rural Development Title VI 194
Research Title VII 321
Forestry Title VIII 38
Energy Title IX 643
Horticulture/Organic Title X 402
Livestock Title XI 1
Crop Insurance Title XII 21,858
Commodity Futures Title XIII 0
Miscellaneous Title XIV 6,382
Disaster Assistance Title XV 3,807
Tax/Other Title XV -4,798
Total 283,921
SOURCE: J. Monke and R. Johnson, Actual Farm Bill Spending and Cost Estimates (Washington, DC: Congressional Research Service, December 13, 2010).Numbers may not sum due to rounding.
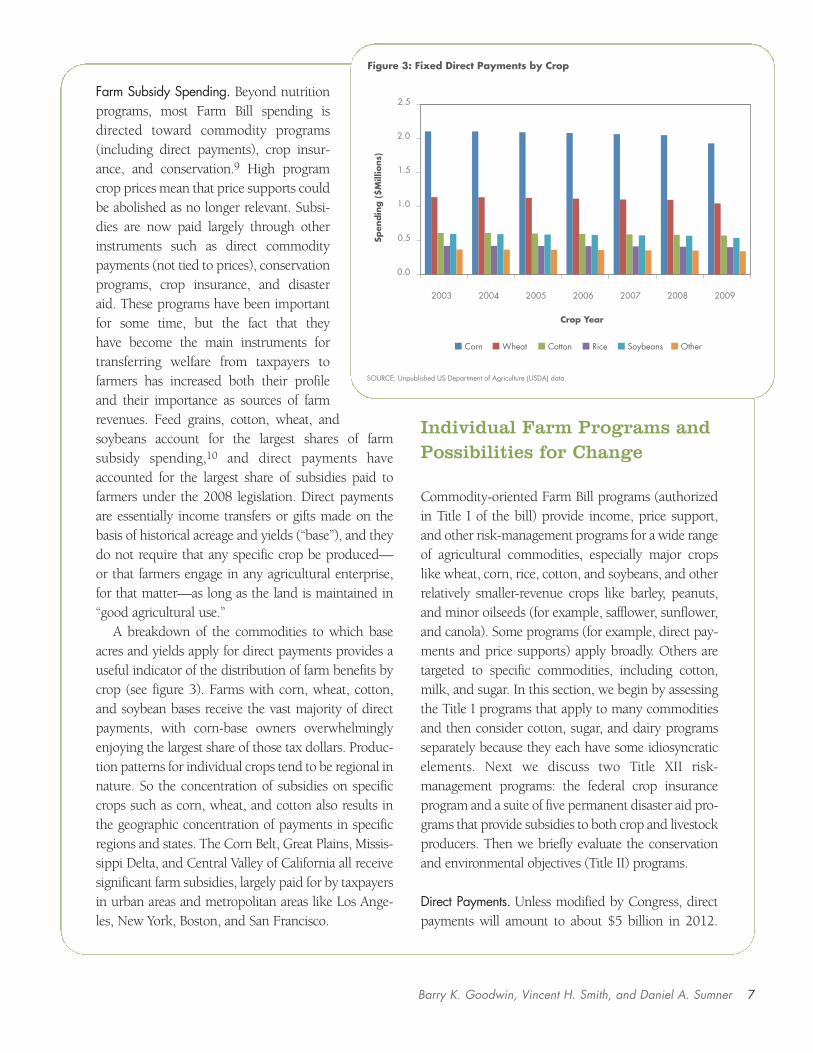
Farm Subsidy Spending. Beyond nutritionprograms, most Farm Bill spending isdirected toward commodity programs(including direct payments), crop insur-ance, and conservation.9 High programcrop prices mean that price supports couldbe abolished as no longer relevant. Subsi-dies are now paid largely through otherinstruments such as direct commoditypayments (not tied to prices), conservationprograms, crop insurance, and disaster aid. These programs have been importantfor some time, but the fact that they have become the main instruments fortransferring welfare from taxpayers tofarmers has increased both their profileand their importance as sources of farmrevenues. Feed grains, cotton, wheat, andsoybeans account for the largest shares of farm subsidy spending,10 and direct payments haveaccounted for the largest share of subsidies paid tofarmers under the 2008 legislation. Direct paymentsare essentially income transfers or gifts made on thebasis of historical acreage and yields (“base”), and theydo not require that any specific crop be produced—or that farmers engage in any agricultural enterprise,for that matter—as long as the land is maintained in“good agricultural use.”
A breakdown of the commodities to which baseacres and yields apply for direct payments provides auseful indicator of the distribution of farm benefits bycrop (see figure 3). Farms with corn, wheat, cotton,and soybean bases receive the vast majority of directpayments, with corn-base owners overwhelminglyenjoying the largest share of those tax dollars. Produc-tion patterns for individual crops tend to be regional innature. So the concentration of subsidies on specificcrops such as corn, wheat, and cotton also results inthe geographic concentration of payments in specificregions and states. The Corn Belt, Great Plains, Missis-sippi Delta, and Central Valley of California all receivesignificant farm subsidies, largely paid for by taxpayersin urban areas and metropolitan areas like Los Ange-les, New York, Boston, and San Francisco.
Individual Farm Programs and Possibilities for Change
Commodity-oriented Farm Bill programs (authorizedin Title I of the bill) provide income, price support,and other risk-management programs for a wide rangeof agricultural commodities, especially major cropslike wheat, corn, rice, cotton, and soybeans, and otherrelatively smaller-revenue crops like barley, peanuts,and minor oilseeds (for example, safflower, sunflower,and canola). Some programs (for example, direct pay-ments and price supports) apply broadly. Others aretargeted to specific commodities, including cotton,milk, and sugar. In this section, we begin by assessingthe Title I programs that apply to many commoditiesand then consider cotton, sugar, and dairy programsseparately because they each have some idiosyncraticelements. Next we discuss two Title XII risk-management programs: the federal crop insuranceprogram and a suite of five permanent disaster aid pro-grams that provide subsidies to both crop and livestockproducers. Then we briefly evaluate the conservationand environmental objectives (Title II) programs.
Direct Payments. Unless modified by Congress, directpayments will amount to about $5 billion in 2012.
Barry K. Goodwin, Vincent H. Smith, and Daniel A. Sumner 7
Figure 3: Fixed Direct Payments by Crop
SOURCE: Unpublished US Department of Agriculture (USDA) data.
0.0
0.5
1.0
1.5
2.0
2.5
2003 2004 2005 2006 2007 2008 2009
Spen
din
g($
Mill
ions
)
Crop Year
Corn Wheat Cotton Rice Soybeans Other

These payments are based on acres of program cropsplanted between 1983 and 1985 or between 1998 and2001, and on estimated per-acre average yields forthose crops between 1983 and 1985. As discussedabove, and in more detail by Babcock,11 the paymentsare essentially gifts to farmers and landowners fromtaxpayers that are generally unrelated to the currentuse of the land (although fruits and vegetables cannotbe planted on those acres). They are not targeted tolow-income farm households, and larger farms andwealthier farm families and landowners generallyreceive larger payments. There is no market-failure orincome-inequity justification for these payments, andthey all could be abolished without measurably affect-ing on-farm production decisions.12 The resultingbudgetary savings from eliminating direct paymentscould be reallocated in several ways, including reduc-ing the federal budget deficit. Alternatively, a portion ofthe savings could be allocated to programs that reducerural poverty, or to public research and development(R&D) programs that have been shown to have highrates of return and provide broad-based benefits to allconsumers by increasing on-farm productivity andlowering agricultural commodity prices.13
Price Supports. The longstanding loan rate programand its related elements (marketing loan gains and loan-deficiency payments) involve price supports forprogram crops such as feed grains, wheat, soybeans,rice, cotton, and peanuts that are well below currentand expected future prices for those commodities.The price-support levels were established and viewedas reasonable by Congress in 2008 when energyprices (a major source of input price volatility in agri-cultural production) were, as now, relatively high.Given that market prices for those crops are likely tocontinue to remain well above the levels that wouldtrigger such payments, there is no need for Congressto continue the loan rate programs. These programsare unlikely to cost much, making it a good time tosimply eliminate programs that serve no social pur-pose. If prices do decline, payments to producerswould rise, driving prices even lower and stimulatingmore market price volatility.
Countercyclical Payments. Similarly, the target pricesthat drive countercyclical payments for program commodities are set at levels that would also triggerprogram payments and are also well below currentmarket prices. Further, for at least as long as the fed-eral biofuels mandate remains in place, prices for grainand oilseed commodities are likely to remain abovethe prices that would trigger countercyclical pay-ments. Countercyclical payments are tied to marketprices but not effectively linked to current plantingdecisions for program crops. So, for example, a farmermay receive countercyclical payments based on lowcotton prices while making huge profits growing corn.
Countercyclical and loan rate programs for cottonand peanuts have provided loan rate or countercyclicalpayments in some years since 2008 (for example,countercyclical payments to cotton were $727 millionin 2009 and $889 million in 2010, and loan rate pay-ments to cotton were $131.2 million in 2009, whilepeanuts received $92.2 million in countercyclical pay-ments in 2008). Cotton loan rate and countercyclicalpayment subsidies were found to violate US obligationsunder the terms of the 1994 World Trade Organization(WTO) agreements and have caused serious problemsfor the United States in trade negotiations. Hence, ongrounds of irrelevance, income equity, and problemsafflicting the United States with respect to internationalmarket access, all the loan rate and countercyclical pro-grams could usefully be eliminated.
The 2008 Average Crop Revenue Election (ACRE) Program. The ACRE program was created in 2008 asan end run around the loan rate and countercyclical
8 American Boondoggle: Fixing the 2012 Farm Bill
In the current fiscal environment,
spending substantial federal
funds on farm programs that have
no real economic or equity
justification is highly problematic.

payment programs, which were not providing corn,wheat, and other small grains producers with suffi-cient government subsidies because market prices hadbeen too high to trigger payments over the period2003–2007. Proposed by senators from Illinois andOhio, the ACRE program pays farmers substantialsubsidies when prices for their crops fall more than 10percent below their national average levels for the pre-vious two years. The trigger is a statewide revenueguarantee based on a five-year average (dropping highand low values) for statewide crop yields and the two-year national average price for each crop, but because most statewide yields exhibit relatively lit-tle year-to-year variation, the driving force for actualACRE subsidy payments has been declines in prices.Given that farm prices have standard deviationsaround their national averages of about 20 percent, theACRE program is likely to provide subsidies relativelyfrequently. Farm groups claim that ACRE was anoptional risk-protection program because, for farmersto obtain ACRE payments, they had to sacrifice 20percent of their direct payments, accept a much lowerloan rate for each program crop (70 percent of the loanrate that would otherwise be available), and forgocountercyclical payments. However, because com-modity prices for many program crops were expectedto be too high to trigger loan rate and countercyclicalpayments, the only real cost to farmers was a smallportion of their direct payments. Therefore, the ACREprogram was seen as a way to gain subsidies thatwould otherwise not be available.
There is almost no redeeming feature to the ACRE program: it has increased farm subsidies for grains,rice, and soybean producers, and it will continue to doso if reauthorized. It did not reduce subsidy paymentsfor cotton producers because most opted to stay withthe baseline direct payments, countercyclical pay-ments, and loan rate programs. Further, cotton pricesare now at record highs, and cotton farmers may soonshift to ACRE to obtain large subsidies that would notbe available in the other programs. In addition, ACREis yet another risk-management subsidy program forfarmers who already receive large subsidies throughthe federal crop insurance and disaster aid programs.
Its complex rules allow most farmers to receive ACREpayments on most or all of the acres they plant, explic-itly violating WTO commitments not to introducenew programs directly linked to current production.Of course, as with other programs, the ACRE programtherefore generates much larger payments for largefarms than for small farms.
As woeful as the current ACRE program is, several farm groups are lobbying for a county-based ACRE program that would provide even more subsidies,because county average crop yields are much morevariable than statewide crop yields. Under any criteria,other than shifting ever more tax money to well-offfarmers, the current ACRE program should be abol-ished and certainly should not be replaced by acounty- or other substate-based program that wouldbe even more expensive.
Dairy Policy. Some Title I programs target specificcommodities and classes of farm operations, includingdairy, sugar, and cotton. Taxpayers have provided milk producers with approximately $1 billion inannual subsidies, regardless of whether or not thedairy sector faced financial difficulties because of highinput costs or low milk prices. Consumers, many ofwhom are also taxpayers, have also indirectly subsi-dized milk producers through higher prices to thetune of more than $1 billion a year as a direct result ofFarm Bill–sanctioned programs.14 Since 2008, thedairy industry has struggled with high grain andoilseed prices that have benefited producers of thosecrops, and milk prices have been highly variable. Attimes over the past four years, milk prices have beenlow enough to result in short-term shortfalls inrevenues relative to variable costs; at other times, theyhave been more than high enough to generate sub-stantial net returns.
Besides a price-support program, the other main components of US dairy policy are tariff rate quotasthat limit the free flow of imports and regional mar-keting orders that set minimum prices for milk by enduse, limit movement of milk across regions, andimpose revenue pooling for those that supply differentend uses. In the run-up to the current Farm Bill
Barry K. Goodwin, Vincent H. Smith, and Daniel A. Sumner 9
debate, major dairy farm organizations argued that thecurrent price-support program was no longer usefulbecause the support price had declined in nominalterms over the past thirty years and there was littlechance that Congress would raise the support price togenerate substantial transfers of revenue from tax-payers. Consequently, these groups argued that pricesupports should be replaced by other policies thatwould generate higher revenues for the industry.
The main adjustments in milk marketing ordersand trade barriers have typically taken place outsidethe Farm Bill. Congress has adjusted marketing ordersin ad hoc legislation, and import barriers have beendealt with in trade agreements. Both have interferedwith the functioning of markets and have increasedthe costs while reducing the variety of dairy productsavailable to consumers.
Most current Farm Bill discussion and analysisabout dairy issues centers on new proposals for supply management. The United States has previouslyused ad hoc supply-reduction tools to attempt to raise milk prices. For example, after the 1985 FarmBill, the United States purchased whole herds of dairycattle that were subsequently slaughtered, but despitethe waste of resources, little long-term or medium-term increase in dairy prices resulted. More recently, a group of major cooperatives, representing the major-ity of the milk production in the United States, hasoperated a production buyout and export subsidyscheme to attempt to raise milk prices. The resultshave been disappointing.
Now, dairy industry proposals for the 2012 Farm Bill would establish permanent supply-managementprograms to limit national milk production. Futureproduction rights would be distributed roughly inproportion to base-period production, and any excessproduction would be allowed only if the farm paid aper-unit fee whenever prices (or the margins betweenmilk prices and some cost index) were below a pre-determined trigger. These policies would almost surelyincrease dairy prices and discourage the efficient use ofdairy resources by milk producers.15
Introducing supply-management programs formilk would represent a significant step backward for
US farm policy. Since the mid-1990s, the United States has abandoned supply-management programsfor tobacco and peanuts. Moreover, the EuropeanUnion recently removed its dairy supply-managementprogram for dairy production because the programhad raised costs of production and reduced innovationand enterprise in the industry. In Canada, where supply-management programs have operated fordecades, the value of production rights has increasedso much that while a milk cow costs about $1,000, thecost of the legal permit to sell milk from the cow isabout $20,000 or more. By making it more difficult toachieve farm consolidation, the policy has reduced thespread of scale economies and cost reductions thatwould occur when the most innovative producersincreased the scope of their activities.
Besides raising prices to milk consumers, especiallychildren and young mothers, a milk supply controlprogram would reduce export potential, adverselyaffect trade relations with other countries, adverselyaffect competitive innovation by discouraging entryand the development and adoption of new technolo-gies and products, and, depending on its implementa-tion, substantially raise transportation and other costsassociated with the production and marketing of dairyproducts. Not a good idea.
Sugar. The sugar program does not transfer moneyfrom taxpayers to sugar producers. It does raise USsugar prices well above world prices in most years,typically increasing domestic prices paid for sugar by almost 100 percent. In a typical year, the sugar program increases sugar expenditures by domesticconsumers by about $2.4 billion and generates about$1.4 billion in extra income for sugar producers. Theprogram achieves these transfers through import quotas that are binding when world prices fall belowthe support price.16 In 2010 and 2011, world sugarprices were well above support levels for the first time in about thirty years, and so impacts of the sugar program have recently been negligible. In most years, however, the sugar program benefits the relatively wealthy few at the expense of almost all consumers.
10 American Boondoggle: Fixing the 2012 Farm Bill

As the figures quoted above indicate, the sugar program is an expensive way to transfer income—wasting $1 billion to transfer $1.4 billion. That is, theprogram costs about $0.66 for every $1 received bycane or beet farmers, or sugar processors.17 The sugarprogram has depressed world sugar prices, loweringincomes for some of the world’s poorest farmers whoraise cane sugar in tropical climates. Given that currentworld sugar prices are well above the price-supportlevel and the industry is especially healthy, this wouldbe an ideal time to end the program.
Cotton. Aspects of the cotton program (and commod-ity export guarantee programs more generally) havecreated extensive problems for the United States givenits commitments under the agreements that estab-lished the WTO. After seven years of WTO dispute-resolution hearings and appeals, US cotton programswere found to be out of compliance with several pro-visions of the General Agreement on Tariffs and Trade, and the United States was instructed to end theoffending programs or remove the effects that violateWTO rules. Despite losing the case and all the appeals,the United States has been unwilling to make all therequired policy adjustments, and Brazil has been giventhe right to retaliate with punitive trade measures orreceive compensation.
The basic dispute hinged on Brazil’s claims thatvarious US farm programs constituted productionsubsidies, export subsidies, or violations of the princi-ple of equal treatment for imports once they enter amarket. In 2006, the United States removed some ofthe offending programs, in particular the cotton-specific export subsidy and domestic content subsidy,but refused to eliminate other offending programs.Until 2010, cotton producers continued to receiveloan rate and countercyclical payment subsidies, whileproducers of many other commodities (for example,corn and wheat) have not received those types of subsidies because of high commodity prices.
The WTO ruled that loan rate program benefitsand countercyclical payments for cotton constitutedproduction subsidies and had depressed the worldprice of cotton and harmed Brazilian cotton producers.
Moreover, the WTO ruled that export credit guaran-tees used to facilitate exports of cotton and other farmcommodities constituted prohibited export subsidies.In the last round of litigation, Brazil claimed that theseprograms caused hundreds of millions of dollars ofdamage to Brazilian producers.
The United States continued to refuse to reformcotton subsidies in the 2008 Farm Bill, and Brazil wasgiven the right to withdraw trade concessions thatfavored the United States. Brazil compiled a list ofhigher tariffs and measures that affected other agricul-tural commodities and other sectors of the USeconomy (for example, restricting intellectual propertyrights for US software products in the Brazilian mar-ket). In response, the United States then agreed to paydirect annual compensation to Brazil in the amount ofat least $147 million and payments were initiated in2010. The odd prospect of US taxpayers subsidizingBrazilian cotton farmers as a condition of continuingsubsidies for US cotton farmers (and exports of othercommodities through credit guarantees) has high-lighted the lack of a consistent rationale for farm sub-sidy programs in general.
Finally, in June 2011, as part of reducing overall spending to meet budget caps, the House Sub-committee on Agricultural Appropriations took thefurther step of removing funding for the 2012 pay-ment to Brazil. This initiative was in direct response toa proposal to fund the Brazilian payment directly fromreductions in outlays for cotton subsidies. When thatidea failed to attract majority support, the committeesimply voted to eliminate funding for the payment—aclear violation of the negotiated settlement. UnlessCongress restores funding, Brazil may return to itsoriginal strategy, raising tariffs on US exports to Brazil and restricting intellectual property rights for USproducts in the Brazilian market. Failing to complywith WTO obligations in the cotton case has also damaged the reputation of the United States as a
trustworthy negotiating partner in future trade negotiations, with the consequence that expandedtrade benefits will be lost by the US agricultural sector,other US exporters, and the world economy as a whole.
Barry K. Goodwin, Vincent H. Smith, and Daniel A. Sumner 11

Crop Insurance and Disaster Aid Programs. Two Title XII risk-management program areas, the federalcrop insurance program and the 2008 Farm Bill suiteof disaster programs, also involve substantial incometransfers to farmers. No one opposes commercialinsurance for farmers, but subsidized insurance raisesa host of problems. Among the Farm Bill programsthat directly transfer substantial amounts of income tofarmers, the federal crop insurance program places thelargest burden on taxpayers—on average about $5.6billion since 2007. These subsidies represent over one-third of total expenditures on income transfers andother government payments for programs targeteddirectly to farmers. As several studies and the historyof crop insurance in the United States and elsewheredemonstrate, the “multiple peril” products that are thecore elements of the federal crop insurance programwould never be purchased commercially by the over-whelming majority of farmers. The price that com-mercial insurance companies would have to charge tocover their costs of managing the products is simplytoo high.18 Ironically, about 58 percent of those tax-payer outlays have ended up in the hands of agricul-tural insurance companies and agricultural insuranceagents. In fact, since 2005, the agricultural insuranceindustry has received $1.44 for every $1.00 farmersreceived in crop insurance subsidies. Thus, the US fed-eral crop insurance program has become one of themost expensive ways of transferring income to farmerswhile supplying products that, absent subsidies, mostfarmers would never buy.
The program also includes design features that gen-erate moral-hazard behavior by encouraging farmersto plant more risky crops or undertake other riskypractices that waste resources. And, of course, becausebenefits are generally in proportion to farm size, largerand wealthier farmers gain much more than smallerand poorer farmers.
Ideally, the entire crop insurance edifice would beended. However, because of the massive subsidies tothe crop insurance industry and because the programappears to help farmers in their times of need, it islikely to continue—despite the fact that, as discussedabove, most farmers have more than sufficient
financial depth to cope with year-to-year revenue variability. As also discussed above, farm debt-to-assetratios are low, farm wealth is high, and farm familiesgenerally have substantial off-farm sources of income.If crop insurance subsidies are continued, the programshould be reformed in several ways. The most urgentreforms include capping total subsidies to any individ-ual farmer, eliminating insurance schemes thatencourage more risky practices that waste resourcesand cause farms to enter risky markets mainly toobtain insurance subsidy benefits, introducing prod-ucts that are less costly to deliver (such as weather-based insurance), and developing less costly programdelivery systems.
Congress seems to love disaster aid. Wheneverweather or other problems cause widespread losses,Congress consistently makes “emergency” paymentsto farmers based on local or regional crop losses. Theirlocal or regional nature makes disaster aid paymentsespecially attractive to members of Congress whoclaim to be bringing federal funds to their home dis-tricts when farmers are in need. As a result, between1995 and 2009, Congress provided nearly $19 billionin ad hoc disaster relief to US farmers (see table 2).19
Ad hoc farm disaster assistance programs have a longhistory, leading many to question the validity of theirrole in current US farm policy.20
In 2008, once again claiming an end to ad hoc disaster relief, Congress introduced a suite of five “permanent” disaster programs for both crops andlivestock (including farm-raised fish and honeybees)that are on their way to becoming the permanent policy disaster their name implies. Inevitably, abouteighteen months later, then–chair of the Senate Committee on Agriculture, Blanche Lincoln (D-AR),pushed for ad hoc disaster aid for farmers in her statewho would also have received substantial benefitsunder the new permanent disaster program. Three ofthe five new disaster aid programs are targeted to live-stock concerns involving events that cause substantial losses of forage and animals, and a fourth is targetedtoward tree and orchard operations.21 Expenditureson those programs in 2008 were relatively modest($185 million).
12 American Boondoggle: Fixing the 2012 Farm Bill
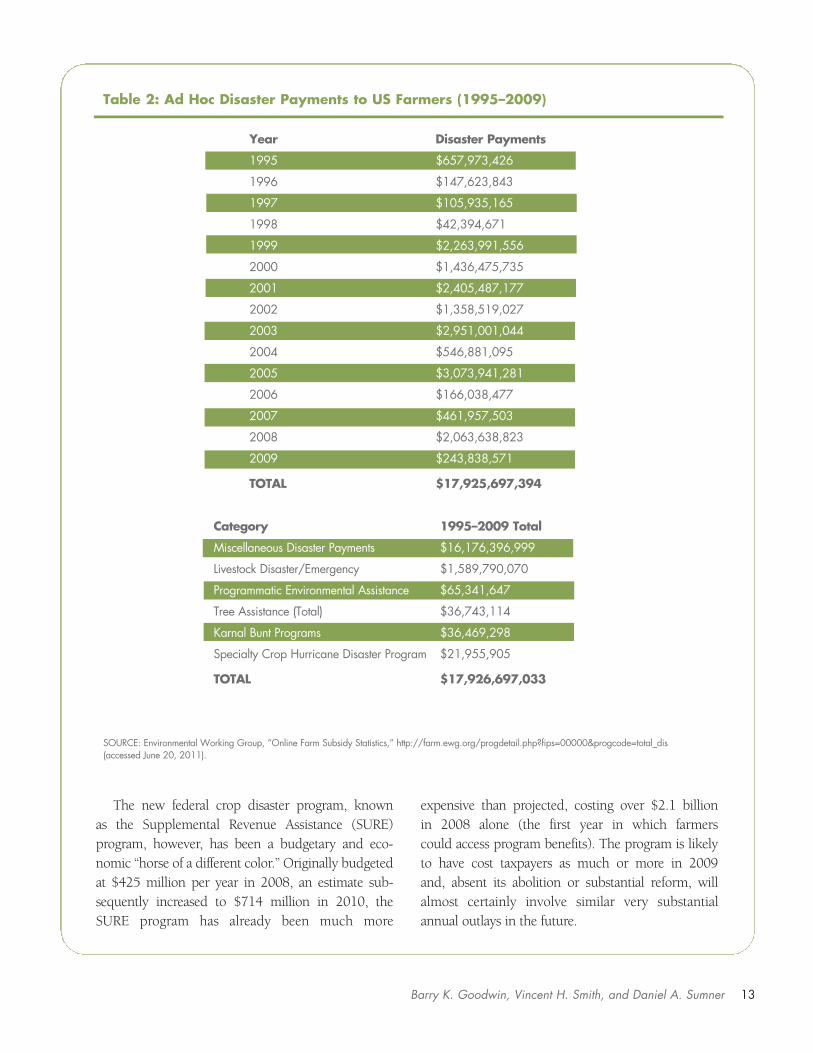
The new federal crop disaster program, known as the Supplemental Revenue Assistance (SURE) program, however, has been a budgetary and eco-nomic “horse of a different color.” Originally budgetedat $425 million per year in 2008, an estimate sub-sequently increased to $714 million in 2010, the SURE program has already been much more
expensive than projected, costing over $2.1 billion in 2008 alone (the first year in which farmers could access program benefits). The program is likelyto have cost taxpayers as much or more in 2009 and, absent its abolition or substantial reform, willalmost certainly involve similar very substantial annual outlays in the future.
Barry K. Goodwin, Vincent H. Smith, and Daniel A. Sumner 13
Table 2: Ad Hoc Disaster Payments to US Farmers (1995–2009)
Year Disaster Payments
1995 $657,973,426
1996 $147,623,843
1997 $105,935,165
1998 $42,394,671
1999 $2,263,991,556
2000 $1,436,475,735
2001 $2,405,487,177
2002 $1,358,519,027
2003 $2,951,001,044
2004 $546,881,095
2005 $3,073,941,281
2006 $166,038,477
2007 $461,957,503
2008 $2,063,638,823
2009 $243,838,571
TOTAL $17,925,697,394
Category 1995–2009 Total
Miscellaneous Disaster Payments $16,176,396,999
Livestock Disaster/Emergency $1,589,790,070
Programmatic Environmental Assistance $65,341,647
Tree Assistance (Total) $36,743,114
Karnal Bunt Programs $36,469,298
Specialty Crop Hurricane Disaster Program $21,955,905
TOTAL $17,926,697,033
SOURCE: Environmental Working Group, “Online Farm Subsidy Statistics,” http://farm.ewg.org/progdetail.php?fips=00000&progcode=total_dis (accessed June 20, 2011).

The SURE program is not only more expensivethan ad hoc disaster aid, but also wasteful. Essentially,it operates as an add-on to existing federal crop insur-ance programs, which are already heavily subsidizedand provide many crop producers with an extensive,publicly funded safety net that buys down their insur-ance deductibles.22 The result is to encourage farmersto adjust their production practices to incur indem-nifiable losses more frequently and to increase the sizeof indemnity payments, wasting economic resourcesand increasing taxpayers’ costs for both the SURE pro-gram and federal crop insurance. The SURE programis an ideal candidate for elimination.
If the SURE program is to be retained, however,Watts and Bekkerman argue that several majorchanges would reduce its most egregious impacts. The conditions under which counties are declared bythe secretary of agriculture to be disaster areas andtherefore become eligible for SURE payments shouldbe tightened. Also, the minimum losses necessary totrigger payments should be raised. These changeswould reduce the frequency with which farms expectto become eligible for payments, and would thereforereduce moral-hazard incentives and reduce superflu-ous monetary transfers to farms not suffering from catastrophic losses. Further reductions in federal outlays and behavior-distorting effects could beachieved by weakening the link between the SURErevenue guarantee and market prices because whenmarket prices are atypically high, total SURE outlaysincrease substantially.
Conservation Programs. Title II of the Farm Bill con-tains a plethora of conservation programs with animpressive array of acronyms. These programs fall intotwo categories: land-retirement initiatives such as theConservation Reserve Program (CRP), and working-land and land-preservation programs such as the Conservation Stewardship Program (CStP), the Environmental Quality Incentives Program (EQIP),and the Farmland Protection Program (FPP).
A key feature of almost all Title II conservation programs that endears them to many farmers is thatfarmers are subsidized to adopt practices that conserve
resources and reduce pollutant emissions instead ofbeing required to conserve or reduce pollution emissions. Certainly farms face regulations, taxes, andenvironmental constraints, but, unlike other busi-nesses, farms also receive subsidies rather than simplybeing regulated or taxed. For example, through theCRP and other land-retirement programs, farmlandowners submit bids to enter land into the program and receive an annual rental rate to keep their landfrom being used to produce crops. Under the EQIPprogram, farmers receive substantial subsidies toinstall ditches, culverts, and fencing and to make otherphysical changes to their land that USDA experts seeas improving soil conservation and reducing pollutantemissions. Under the CStP, many farmers are paid sim-ply to continue farming practices that conserve landand reduce pollutant emissions relative to other, lessenvironmentally sound practices that they did noteven use in the first place.
This general approach stands in stark contrast tothe environmental regulation of pollution emissionsby firms in other industries (for example, dry cleaningor electric power generation) where the “polluter pays”principle rather than a “taxpayer subsidizes” principleunderpins the policy approach to managing environ-mental externalities. The result is that taxpayers nowfund Farm Bill conservation programs of about $5 bil-lion per year, with an increasing share of the fundsbeing allocated to working-land programs like CStPand EQIP, for which the budget has steadily increasedfrom $1 billion in 2004 to $2.1 billon in 2011.23 Thisshift has taken place at least partly because recent highprices for major crops like corn and wheat have made the CRP less attractive. In addition, becauseworking-land subsidies are also available to livestockproducers, the shift is partly in response to lobbyingfor government help in managing livestock waste bybeef, poultry, dairy, and hog producers.
A major concern with the current portfolio of Title II conservation programs is that they operatelargely independently of one another. This means that,as Lichtenberg and Vukina point out, working-landand land-retirement programs often compete with oneanother for the same land, raising the taxpayer costs of
14 American Boondoggle: Fixing the 2012 Farm Bill

farmers placing their land in one program or theother.24 A first and fundamentally important step to arational conservation policy, therefore, is to ensure thatconservation programs are integrated and to evaluatefarm “bids” for program participation on the basis of awhole farm or whole conservation program.25
A second and perhaps more controversial step may be to replace the current taxpayer-pays approachwith a polluter-pays principle, with farmers mandatedto reduce emissions or soil erosion. This shift is implicitin several proposals to deal with nonpoint-source pollu-tion associated with the widespread application of haz-ardous agricultural chemicals.26 For example, Vukinasuggests the use of ambient taxes or fines on all farmersin a watershed when the relevant lakes and riversbecome polluted. Alternately, taxes on the purchase ofagricultural chemicals (the potential general cause of thenonpoint-source problem) have been proposed.
It is by no means clear whether spending on conservation programs is too high or too low, orwhether the current level of effort to control pollutionemissions from agricultural production practices isideal. However, it is clear that farming is treated differently from other sectors of the economy when itcomes to environmental issues and pollution. More-over, the cost to taxpayers of the current array of conservation policies is not trivial. There is consider-able agreement that, even if Congress chooses to continue a taxpayer-pays approach to conservation,conservation programs could be more effectively integrated and more efficient.
The Farm Bill and InternationalEconomic Concerns
The Farm Bill has substantive implications for othersectors of the US economy and for people in othercountries, including some of the poorest people in thepoorest countries in the world. For example, subsidiesprovided by the Farm Bill to US cotton producersprovide banner headlines about the adverse conse-quences for other US industries and very poor farmersin desperately poor countries. The US sugar program
is another frequently cited example of what is viewedelsewhere as “US domestic agricultural policy callous-ness” with respect to the plight of very poor farmers inthird-world countries and as a comprehensive disre-gard for the benefits that flow from free trade.
By May 2011, any impetus left for a major agree-ment in the decade-long WTO negotiations of theDoha Development Agenda had evaporated, and dis-cussion has turned to finding a small deal to reach aconsensus quickly. The US negotiating position, whichhas been to resist thorough reform or elimination offarm subsidy programs, especially with respect to cot-ton, was a significant reason for the breakdown. TheUS failure to comply with WTO rules even after losingits cotton dispute with Brazil has been seen as evidencethat, even if an agreement could be reached, theUnited States could not be trusted to implement pro-visions that are politically uncomfortable.
As a result, we no longer have the option of a newcomprehensive WTO agreement that would open mar-kets for US farm exports and exports from other sectorsof the US economy in return for a modest reduction inagricultural trade barriers and an end to trade-distortingcotton subsidies. There is some potential for a smalldeal to be concluded by December 2011 to includeimportant reforms in US agricultural policies thatwould then probably have to be implemented throughthe 2012 Farm Bill. Three elements are most promi-nent. First, the United States and other WTO membercountries would eliminate any remaining agriculturalexport subsidies and remove commercial subsidy elements from export credit programs and food aid.Removing export subsidies would reduce budget com-mitments while having little impact on farm incomesbecause export subsidies have a small impact on USexports of farm commodities. Implementation wouldalso help comply with the WTO cotton rulings andreduce some of the most wasteful aspects of the USfood aid program because there is no policy rationalefor linking food assistance for hungry people to themandatory use of US commodities. Second, WTOcountries would pledge to forego export restrictions ortaxes when global commodity price spikes or shortagesoccur. The United States has endorsed this idea, which
Barry K. Goodwin, Vincent H. Smith, and Daniel A. Sumner 15

would likely have the beneficial effect of reducing one“justification” for barriers to the import of agriculturalcommodities used by other countries.
Third, it may be feasible to craft a specific agree-ment with African cotton exporters and others, includ-ing Brazil, to remove trade-distorting cotton subsidies.Cotton prices are very high and are projected toremain above prices that would trigger the main trade-distorting subsidies for some time. Now is the time tonegotiate an end to a set of programs that have hadmajor negative spillovers for all negotiations.
A WTO dispute-resolution panel is also examiningthe US country-of-origin labeling (COOL) regulationsfor livestock products mandated by the 2008 Farm Bill.While the WTO clearly permits COOL in general, itrequires that all products be treated equally and not besubject to discrimination based on origin. Mexico andCanada recently filed a WTO trade dispute case againstthe United States on the grounds that US COOL regu-lations discriminate against livestock (cattle, hog, andpoultry) imports from those countries and adverselyaffect access to the US market. The WTO dispute-resolution panel has not yet reported its findings. However, some of the US farm groups that lobbiedmost vigorously for the legislation clearly believed thatit would harm imports to the benefit of domestic live-stock producers. In fact, the COOL regulationsincreased processing and marketing costs for alllivestock, almost certainly depressing cattle, hog, andother livestock prices to the detriment of US farmers. Inthe trade context, the COOL dispute is seen as furtherevidence that the United States does not really supportopen markets and freer trade and is not a trustworthypartner in trade negotiations. This is a serious disadvan-tage for globally competitive US farmers, for whomtrade negotiations open up and expand export markets,increase demand, and, as a result, raise product prices.
Food Safety
Food-safety issues are not usually associated with theFarm Bill, but they are a central concern for consumersand farmers. In fact, public attention to food safety has
probably exceeded any other food or agricultural issuein recent years. The United States enacted a far-reaching law in 2010 after decades of discussion aboutenhancing the government’s involvement in food-safety issues to reduce contamination. The votes topass the Food Safety Modernization Act came afterpublicity over the salmonella contamination of eggs.In May and June 2011, as Congress considered fund-ing to implement the new law, concerns about E. colicontamination of fresh produce in Europe were usedas rationales for more spending to regulate food mar-keting in the United States.
Two issues deserve further consideration in assessing additional legislation or regulation on foodsafety.27 First, does regulation improve the safety offood? Second, at what cost? Recent responses to foodcontamination outbreaks prematurely identified thesource of the problem, misinforming consumers andharming blameless industries. For example, in 2008,the Food and Drug Administration (FDA) originallyblamed a salmonella event on tomatoes, but thenreversed itself to claim that peppers were the culprit.This resulted in hundreds of millions of dollars of revenue lost in the destruction of safe tomatoes andconsumers unnecessarily discouraged from consumingfresh vegetables. As with other activities, the FDA wasnot able to balance benefits against costs and has astrong incentive to avoid risks for its bureaucracy at thecost of reductions in food safety and nutrition.
European food marketing regulations werethought to be stronger than those in the United States. Certainly, many European farms are smallerand there is even more emphasis on local consump-tion of local production. However, the recent E. colioutbreak demonstrated the failures of intrusive regula-tion in Europe. After first blaming Spanish cucumbersand suggesting that imported produce in general was a problem—which imposed job losses on thou-sands of workers and losses to consumers, marketers,and producers—officials have now acknowledged that the source of the contamination affecting German consumers was German-produced organicbean sprouts. The implication, which is applicable tothe United States, is that small local and organic
16 American Boondoggle: Fixing the 2012 Farm Bill

farms do not ensure food safety and that regulationsshould not be biased in favor of such operations.
Lost in the noise created by the publicity surround-ing food system breakdowns are the following ques-tions: how effective are the new rules, and how usefulis regulation relative to current pressures on food companies to avoid the market effects and liabilitiesassociated with food contamination? Industries facing negative publicity about food-safety events and risksalso face monetary losses that threaten to bankruptcompanies and decimate the revenues of farms andmarketing industries. One policy challenge is that individual farms and firms may impose losses on thewhole industry (and consumers) while not bearing thefull costs themselves, unless food can be fully tracedand liability established. Marketing firms and indus-tries therefore have strong incentives to develop tech-nologies and create marketing systems that most effectively link the liability for damages to individualproducers and marketers. Such systems may include arole for public policy, but regulations may just as easilyallow firms to shift responsibility, resulting in incentivesthat are less direct and food that may be less safe.
Federal Agricultural R&D Policy
Over the past 150 years, public investments in agri-cultural R&D have played a major role in improvingthe economic well-being of all US families, as well asensuring that American farmers remain competitivein global markets and enabling global food supplies tomeet the needs of a rapidly increasing world popula-tion. Public R&D investments have directly generatednew technologies (higher-yielding crop varieties,improved treatments of animal diseases, and so on)and have synergistically provided basic and appliedresearch that has encouraged increased private invest-ments that also generate new technologies. Theresults have been substantive and sustained increasesin agricultural productivity, massive increases in agri-cultural output and supplies, and much lower pricesfor agricultural commodities and the food that house-holds purchase and consume. Hundreds of studies of
the benefits of those investments consistently reportannual social rates of return in excess of 30 percent.
Nevertheless, as Pardey and Alston show, since theearly 1990s federal investments in R&D targetedtoward on-farm productivity have failed to keep up.28
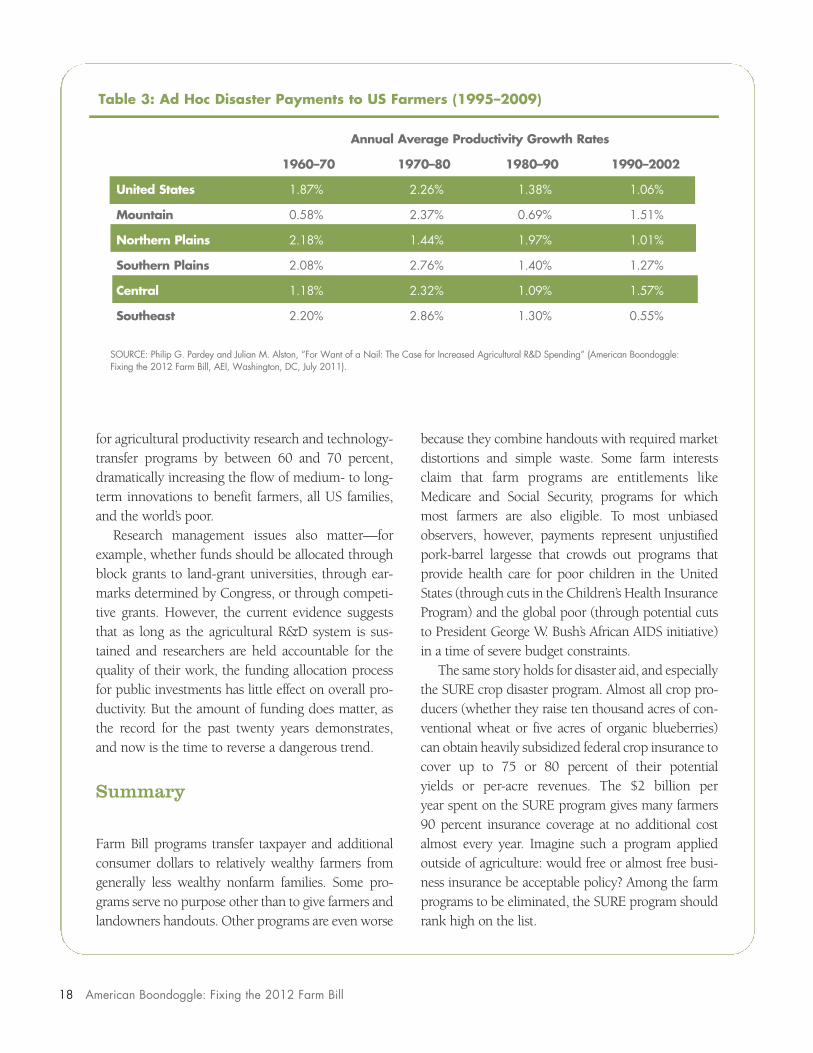
Figure 4 shows that the annual average growth ratefor total public spending on agricultural R&Ddeclined to less than 1 percent in the 1990s and2000s, while in earlier periods public spendingincreased much more rapidly. Pardey and Alston alsoshow that the share of those funds allocated to on-farm productivity declined, resulting in a stagnantlevel of public funding for productivity-orientedresearch since the early 1990s. Subsequently, despitesome variations among regions, overall on-farm productivity growth rates substantially declined, asillustrated in table 3.
There are many reasons for the decline in research and technology-transfer funding targeted toward on-farm productivity. Two factors may have been par-ticularly important. First, other interest groups withinand beyond the USDA have accessed a larger share ofthe federal research budget for other agendas, includ-ing research targeted toward environmental objec-tives, public health, and nutrition. While these invest-ments may be worthwhile in and of themselves, theconsequence appears to have been adverse effects onagricultural productivity growth. Second, at the fed-eral level, major farm lobbies have been more focusedon pure income subsidies than on the long-term ben-efits that flow from public agricultural R&Dprograms. Especially in the context of increasingenergy demand for corn and other food and feedcrops, and rising prices for those crops, R&D pro-grams that increase on-farm productivity are likely tohave even more substantial payoffs for all families,and perhaps especially poor households, than in thepast. Hence, this is one area of Farm Bill policy thatclearly deserves increased federal funding, notwith-standing current concerns about the federal budgetdeficit. Ending direct payments and the SURE disas-ter program, for example, would generate about $7billion in annual savings. Reallocating $1 billion ofthose savings to R&D would increase federal funding
Barry K. Goodwin, Vincent H. Smith, and Daniel A. Sumner 17
for agricultural productivity research and technology-transfer programs by between 60 and 70 percent,dramatically increasing the flow of medium- to long-term innovations to benefit farmers, all US families,and the world’s poor.
Research management issues also matter—forexample, whether funds should be allocated throughblock grants to land-grant universities, through ear-marks determined by Congress, or through competi-tive grants. However, the current evidence suggeststhat as long as the agricultural R&D system is sus-tained and researchers are held accountable for thequality of their work, the funding allocation processfor public investments has little effect on overall pro-ductivity. But the amount of funding does matter, asthe record for the past twenty years demonstrates,and now is the time to reverse a dangerous trend.
Summary
Farm Bill programs transfer taxpayer and additionalconsumer dollars to relatively wealthy farmers fromgenerally less wealthy nonfarm families. Some pro-grams serve no purpose other than to give farmers andlandowners handouts. Other programs are even worse
because they combine handouts with required marketdistortions and simple waste. Some farm interestsclaim that farm programs are entitlements likeMedicare and Social Security, programs for whichmost farmers are also eligible. To most unbiasedobservers, however, payments represent unjustifiedpork-barrel largesse that crowds out programs thatprovide health care for poor children in the UnitedStates (through cuts in the Children’s Health InsuranceProgram) and the global poor (through potential cutsto President George W. Bush’s African AIDS initiative)in a time of severe budget constraints.
The same story holds for disaster aid, and especiallythe SURE crop disaster program. Almost all crop pro-ducers (whether they raise ten thousand acres of con-ventional wheat or five acres of organic blueberries)can obtain heavily subsidized federal crop insurance tocover up to 75 or 80 percent of their potential yields or per-acre revenues. The $2 billion per year spent on the SURE program gives many farmers90 percent insurance coverage at no additional costalmost every year. Imagine such a program appliedoutside of agriculture: would free or almost free busi-ness insurance be acceptable policy? Among the farmprograms to be eliminated, the SURE program shouldrank high on the list.
18 American Boondoggle: Fixing the 2012 Farm Bill
Table 3: Ad Hoc Disaster Payments to US Farmers (1995–2009)
Annual Average Productivity Growth Rates
1960–70 1970–80 1980–90 1990–2002
United States 1.87% 2.26% 1.38% 1.06%
Mountain 0.58% 2.37% 0.69% 1.51%
Northern Plains 2.18% 1.44% 1.97% 1.01%
Southern Plains 2.08% 2.76% 1.40% 1.27%
Central 1.18% 2.32% 1.09% 1.57%
Southeast 2.20% 2.86% 1.30% 0.55%
SOURCE: Philip G. Pardey and Julian M. Alston, “For Want of a Nail: The Case for Increased Agricultural R&D Spending” (American Boondoggle: Fixing the 2012 Farm Bill, AEI, Washington, DC, July 2011).

The best solution for subsidized crop insurance isto eliminate the subsidy and let the program competein the commercial market. The subsidized agricul-tural insurance program is a scandal not least becauseof the extent to which agricultural insurance com-panies and agents benefit from a program sold as abenefit to farmers. Other countries deliver subsidizedagricultural insurance schemes at a much lower costper dollar of subsidy accruing to farmers. Reformingthe crop insurance delivery system could almost certainly save over $1 billion of taxpayer funds, andreducing producer subsidies by about 20 percent(from 59 percent of the actuarially fair premium toonly 47 percent for the most frequently purchasedinsurance policies) would save about another $500 million dollars.
Cotton, dairy subsidy, and sugar programs alsoneed to be eliminated. All three programs create substantive problems for the United States in traderelations and trade negotiations, and inhibit the development of agricultural export markets. The cotton program has also caused serious difficulties
for other sectors of the economy and jeopardized access to Brazil’s growing markets. Ending all three programs wouldbring annual average savings to taxpayersof about $1.5 billion and $2–3 billion inadditional savings for US consumers.
Conservation and environmental pro-grams raise more complex issues becausethe control of pollution (in the form of soilerosion or chemicals) is generally benefi-cial and market incentives are relativelyweak. However, a shift to a polluter-paysprinciple from a taxpayer-pays principlefor achieving conservation and reducingemissions would at least benefit taxpayers,and from a market-efficiency standpoint itwould improve signals about the real cost
of agricultural production. In addition, some conservation programs such as the CStP (which pays farmers to do what they were doing anyway) are clearly wasteful and inefficient. Further,conservation programs need to be rationalized andintegrated so they do not compete with one another for the same land.
Finally, publicly managed agricultural R&D ori-ented to on-farm productivity is one important areathat clearly needs additional federal funding. Privateincentives for agricultural R&D are insufficient andrates of return for public agricultural R&D areextremely high. Moreover, the benefits have beenwidely shared by producers and consumers in theUnited States and have spilled over to people in manyother countries, including the world’s poorest families.Federal funding for agricultural R&D targeted towardon-farm productivity stagnated in the late 1980s and,subsequently, agricultural productivity growth in theUnited States also stagnated. With historically highprices for farm commodities, now is the time to renewthe public commitment to productivity-enhancingagricultural R&D.
Barry K. Goodwin, Vincent H. Smith, and Daniel A. Sumner 19
Figure 4: Agricultural Research Spending Slowdown
Perc
enta
ge
SOURCE: Public agricultural R&D series (excluding forestry) is from USDA sources cited in J. M. Alston, M. A. Andersen,J. S. James, and P. G. Pardey, Persistence Pays: US Agricultural Productivity Growth and the Benefits from Public R&DSpending (New York: Springer, 2010), appendix III; and for more recent years, from USDA Current Research InformationSystem, unpublished annual data files, 1970–2009.
NOTES: Public agricultural R&D includes SAES and USDA intramural spending, exclusive of forestry research. The serieswas deflated using an agricultural R&D deflator from P. G. Pardey, M. A. Andersen, and C. Chan-Kang, “A US PublicAgricultural R&D Price Deflator, 1890–2009” (Department of Applied Economics staff paper, University of Minnesota,St. Paul, MN, forthcoming 2011). Average annual growth rates are calculated using the exponential growth rate method(which assumes continuous growth) described in World Bank, “Statistical Manual-Growth Rates,” http://web.worldbank.org/WBSITE/EXTERNAL/DATASTATISTICS/EXTDECSTAMAN/0,,contentMDK:20878490~menuPK:2648303~pagePK:64168445~piPK:64168309~theSitePK:2077967~isCURL:Y,00.html (accessed May 27, 2011).
0.0
0.5
1.0
1.5
2.0
2.5
3.0
3.5
4.0
1950s–1960s 1970s–1980s 1990s–2000s
Year

Notes1. Most farms, as measured by the USDA, are very small,
many with sales of less than $10,000 a year, and are operated ona part-time or even a hobby-farm basis.
2. Barry K. Goodwin, “We’re Not in Kansas Anymore: Is There Any Case for Ag Subsidies?” (American Boondoggle: Fixingthe 2012 Farm Bill, AEI, Washington, DC, July 2011).
3. See J. Hagstrom, “Farm Bill Target Date: 2012,” Agweek,April 19, 2011.
4. Federal budget statistics are taken from CBO analysis ofthe president’s 2012 budget, available online at www.cbo.gov/ftpdocs/121xx/doc12103/2011-03-18-APB-PreliminaryReport.pdf.
5. Christopher R. Knittel, “Corn Belt Moonshine: The Costsand Benefits of US Ethanol Subsidies” (American Boondoggle:Fixing the 2012 Farm Bill, AEI, Washington, DC, July 2011).
6. J. Monke and R. Johnson, Actual Farm Bill Spending and Cost Estimates (Washington, DC: Congressional ResearchService, December 13, 2010), 13.
7. Julian M. Alston, “Food and Nutrition in the 2012 FarmBill” (American Boondoggle: Fixing the 2012 Farm Bill, AEI,Washington, DC, forthcoming 2011).
8. Recent evidence demonstrates that, although most recipi-ents spend more on food than their subsidy allotments, these programs increase food consumption by more than cash transfers. In fact, one concern about these programs is thatthey encourage additional food consumption in general amonga population that tends to suffer from higher-than-average ratesof obesity.
9. Dennis A. Shields, Jim Monke, and Randy Schnepf, Farm Safety Net Programs: Issues for the Next Farm Bill (Washington, DC: Congressional Research Service, September10, 2010), 21.
10. Ibid.11. Bruce A. Babcock, “Something for Nothing? Direct
Payments and Title I Farm Programs” (American Boondoggle:Fixing the 2012 Farm Bill, AEI, Washington DC, July 2011).
12. On the plus side, direct payments do little to wasteresources by distorting production decisions, as was arguedwhen they were introduced in the 1990s.
13.Philip G. Pardey and Julian M. Alston. “For Want of a Nail:The Case for Increased Agricultural R&D Spending” (AmericanBoondoggle: Fixing the 2012 Farm Bill, AEI, Washington, DC,July 2011).
14. Joseph V. Balagtas, “Milking Consumers and Taxpayers:The Folly of US Dairy Policy” (American Boondoggle: Fixing the2012 Farm Bill, AEI, Washington, DC, July 2011).
15. Ibid.16. Michael K. Wohlgenant, “Sweets for the Sweet: The Costly
Benefits of the US Sugar Program” (American Boondoggle: Fixing the 2012 Farm Bill, AEI, Washington, DC, July 2011).
17. Ibid.
18. Vincent H. Smith and Barry K. Goodwin, “Private andPublic Roles in Providing Agricultural Insurance in the United States,” in Public Insurance and Private Markets, ed. Jeffrey Brown (Washington, DC: AEI Press, 2009), www.aei.org/book /100045; and Vincent H. Smith and Myles J. Watts,“Index Based Agricultural Insurance in Developing Countries:Feasibility, Scalability, and Sustainability” (working paper, Montana State University, Bozeman, MT, November 2009).
19. Disaster payment statistics were obtained from the Environmental Working Group online farm subsidy database.
20. Such questions are not new. In vetoing a drought-relief measure in 1887, President Grover Cleveland famouslydeclared, “I do not believe that the power and duty of the General Government ought to be extended to the relief of individual suffering which is in no manner related to the public service or benefit. . . . Federal aid . . . encourages theexpectation of paternal care on the part of the government andweakens the sturdiness of our national character.” See D. A.Moss, “Courting Disaster? The Transformation of Federal Disaster Policy since 1803,” in The Financing of Catastrophe Risk, ed. K. Froot (Chicago, IL: University of Chicago Press,1999), 307–362.
21. The four programs are the Livestock Forage Disaster Pro-gram, the Livestock Forage Indemnity Program, the EmergencyAssistance for Livestock, Honey Bees, and Farm-Raised FishProgram, and the Tree Assistance Program for Orchardists andTree Growers.
22. Myles Watts and Anton Bekkerman, “Agricultural Disas-ter Aid Programs: A SURE Invitation to Wasteful Spending” (American Boondoggle: Fixing the 2012 Farm Bill, AEI, Washington, DC, July 2011); and Vincent H. Smith and MylesJ. Watts, “The New Standing Disaster Program: A SURE Invita-tion to Moral Hazard Behavior,” Applied Economic Perspectivesand Policy 32, no. 1 (2010): 154–69.
23. Tomislav Vukina, “Conserving Our Future: How toReform Title II of the Farm Bill,” (American Boondoggle: Fixingthe 2012 Farm Bill, AEI, Washington, DC, July 2011).
24. Eric Lichtenberg, “Are Green Payments Good for the Environment?” Agricultural and Resource Economics Review 33(April 2004): 138–47; and Tomislav Vukina, “Conserving OurFuture: How to Reform Title II of the Farm Bill.”
25. Tomislav Vukina, “Conserving Our Future: How toReform Title II of the Farm Bill.”
26. Point sources of pollution are sources that can readily beidentified (for example, animal waste ponds on hog farms).Nonpoint sources are sources of pollution that cannot be readily identified (for example, nitrogen applied as fertilizer tomillions of acres of corn in Iowa).
27. Sébastien Pouliot, “Food Safety: Background, Analysis,and Recommendations” (American Boondoggle: Fixing the2012 Farm Bill, AEI, Washington, DC, forthcoming 2011).
28. Philip G. Pardey and Julian M. Alston. “For Want of a Nail:The Case for Increased Agricultural R&D Spending.”
20 American Boondoggle: Fixing the 2012 Farm Bill

American Boondoggle Fixing the 2012 Farm Bill
by Barry K. Goodwin, Vincent H. Smith, and Daniel A. Sumner
Most farm subsidies go to substantial and successful operations and provide little support for the farms they were onceintended to benefit. Many of the programs create barriers to more efficient agriculture in the United States, interfere with international trade, and have adverse effects on farmers in developing countries. This overview paper reviews the implications of some important basic facts and analyses as guidance for the 2012 Farm Bill. Some of the conclu-sions include:
1) Commodity programs should be eliminated: Direct payments will cost $5 billion in 2012. There is no rational justification for them, and they could be abolished without measurably affecting on-farm production decisions. Because market prices for crops eligible for price supports are likely to remain well above trigger levels, there is no need to continue loan rate programs. Countercyclical payments should also be eliminated on grounds of irrelevance, income equity, and barriers created to international market access. The Average Crop Revenue Election program has further increased farm subsidies for grains, rice, and soybean producers and will continue to do so if reauthorized; it, too, should be abolished.
2) Crop insurance and disaster aid subsidies should be eliminated: The crop insurance program has become one of the most expensive ways of transferring income to farmers while supplying products that, absent subsidies, most farmers would never buy. The program has averaged $5.6 billion annually since 2007, one-third of total expenditures on income transfers. For disaster aid, the Supplemental Revenue Assistance Payments program cost $2.1 billion in 2008—almost five times the projected cost—encourages inefficient farming, and should thus be eliminated.
3) Cotton, dairy, and sugar programs should be eliminated: These three programs create substantial problems for the United States in trade relations and negotiations, and inhibit the development of agriculture export markets. Ending all three programs would bring annual average savings to taxpayers of about $1.5 billion and $2–3 billion in additional savings for US consumers.
4) Conservation programs should be integrated and follow a “polluter pays” principle:A polluter-pays system would achieve conservation and reduce emissions at a benefit to taxpayers and would improve signals about the real cost of agricultural production. Conservation programs should also be integrated, reducing competition among programs for the same land, and farms should be evaluated for program participation based on the whole farm or conservation program.
5) Public funding for agricultural research and development should be increased: Privateincentives for investment are inefficient, and returns on public investment are extremely high. Moreover,benefits have been widely shared by producers and consumers in the United States and worldwide.
There is little evidence that most programs in the Farm Bill address actual market failures or improve societal welfare.Farm program subsidies could be eliminated, or at least reduced from current levels by about $8–10 billion, without affecting the US food supply or the viability of US agriculture.
A Project of the American Enterprise Institute1150 Seventeenth Street, NW, Washington, DC 20036www.aei.org/AmericanBoondoggle