America Movil Transformation -...
13
America Movil Transformation Fernando Hitos
Transcript of America Movil Transformation -...

America Movil Transformation Fernando Hitos

America Movil Transformation
Service Provider Challenges 1
Changing the Economics of Networking 2
Key Success Factors 3
Planning Business Transformation 4
Additional Opportunities 5
Conclusions 6
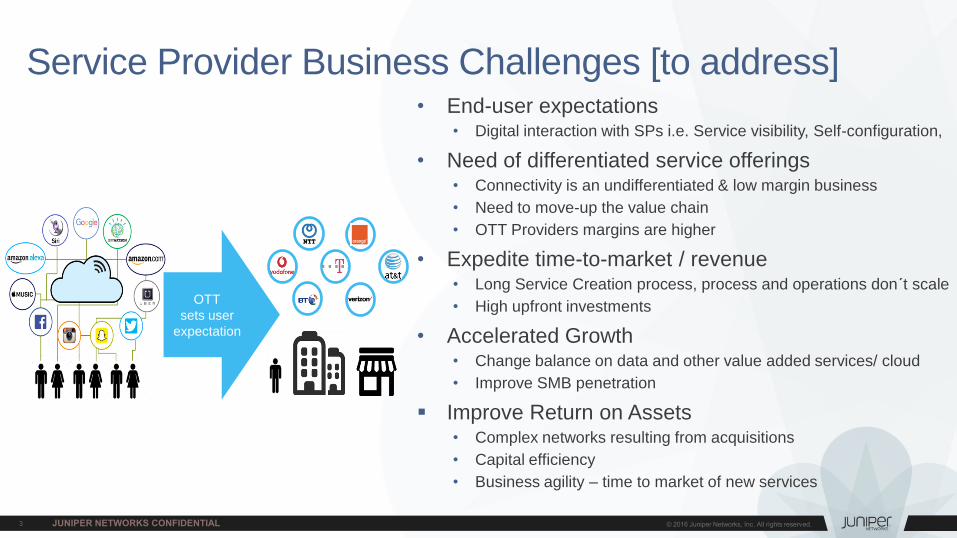
• End-user expectations • Digital interaction with SPs i.e. Service visibility, Self-configuration,
• Need of differentiated service offerings • Connectivity is an undifferentiated & low margin business
• Need to move-up the value chain
• OTT Providers margins are higher
• Expedite time-to-market / revenue • Long Service Creation process, process and operations don´t scale
• High upfront investments
• Accelerated Growth • Change balance on data and other value added services/ cloud
• Improve SMB penetration
Improve Return on Assets • Complex networks resulting from acquisitions
• Capital efficiency
• Business agility – time to market of new services
Service Provider Business Challenges [to address]
OTT
sets user
expectation

TIME TO SERVICE
DEPLOYMENT Code to production launch
OPERATIONAL
COMPLEXITY # of SKUs to manage
OPERATING
EXPENSES Servers managed per admin
WEB 2.0 PROVIDERS ARE INNOVATING FASTER More Dynamic-enabled Networks and Improved Service Automation is a key priority
GOOGLE: 1 per 15,000 servers Each admin can operate ~15,000 servers
Industry: Less than 100
Operator DC: Each admin can manage up to ~100 servers = large headcount
AMAZON: Few seconds Every 11 seconds; Avg 10K or max 30K
servers at a time
Industry: 6-7 Months
China Mobile Quote: 6-7 months per service; mostly manually
GOOGLE: 10s of Configs Google: ~10 shared hardware system
bundles
Industry: Thousands configs
NSN: 1000’s of SKUs to manage makes IT overly complex

Changing the Economics of Networking
Capital Efficiency,
Variable Costs
Demand Uncertainty Provisioning to Peak High Fixed Overhead
Traditional Model
Revenue Growth,
Service Agility
Restricted Geo & Markets Limited Services Choice Static Biz Model
Month1 Month2 Month3 Month4 Month5 Month6
0 1 2 3 4 5 6 7 8 9 1011121314151617181920212223
Demandvaria on
Idle
Hours
$$
NewBranch1
NewBranch2
NewBranch3
NewBranch4DataCenter
$$
$$ $$
Operational Efficiency,
Automation
Time to Deploy Service Service Fulfillment Service Assurance
6 - 10 Months
4 - 6 Weeks
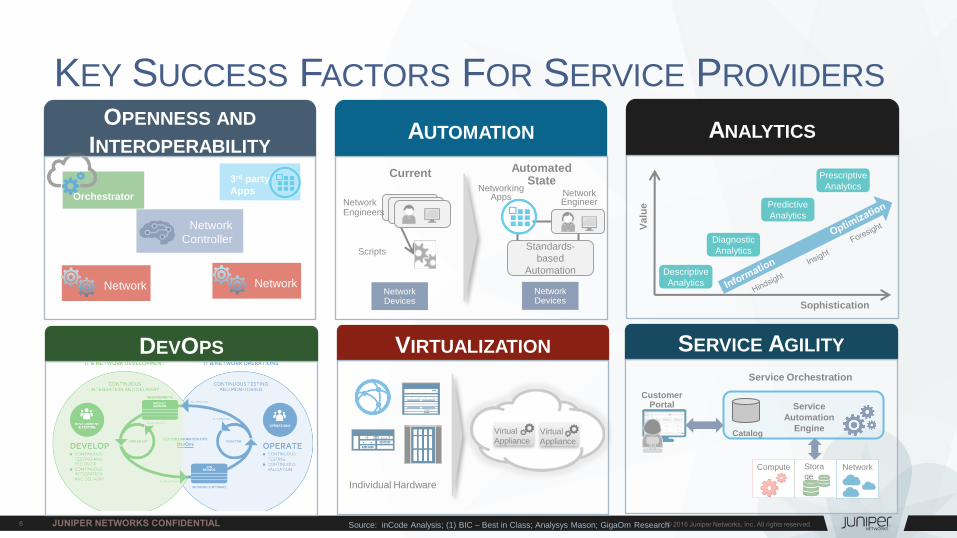
KEY SUCCESS FACTORS FOR SERVICE PROVIDERS
Orchestrator
Source: inCode Analysis; (1) BIC – Best in Class; Analysys Mason; GigaOm Research
OPENNESS AND
INTEROPERABILITY AUTOMATION
VIRTUALIZATION DEVOPS SERVICE AGILITY
Individual Hardware
Current Automated State
Network Engineers
Scripts
Network Engineer
Networking Apps
Standards-
based
Automation
Network Devices
ANALYTICS
Descriptive
Analytics
Diagnostic
Analytics
Predictive
Analytics
Prescriptive
Analytics
Va
lue
Sophistication
Customer Portal
Service Orchestration
Service
Automation
Engine
Compute Stora
ge Network
Catalog
Network
Controller
3rd party
Apps
Virtual
Appliance Virtual
Appliance
Network Network Network Devices
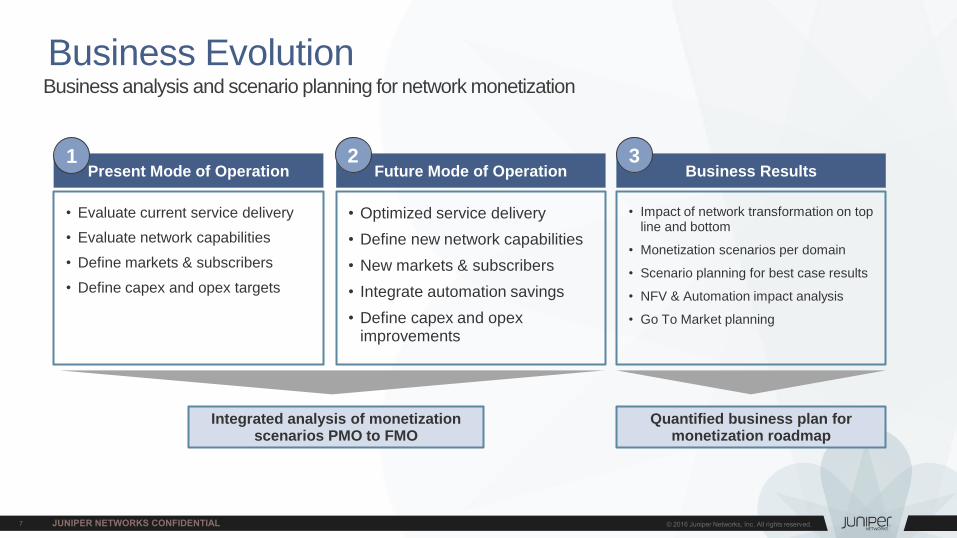
Present Mode of Operation Future Mode of Operation Business Results
• Evaluate current service delivery
• Evaluate network capabilities
• Define markets & subscribers
• Define capex and opex targets
• Optimized service delivery
• Define new network capabilities
• New markets & subscribers
• Integrate automation savings
• Define capex and opex improvements
• Impact of network transformation on top line and bottom
• Monetization scenarios per domain
• Scenario planning for best case results
• NFV & Automation impact analysis
• Go To Market planning
Integrated analysis of monetization
scenarios PMO to FMO
Business Evolution Business analysis and scenario planning for network monetization
1 2 3
Quantified business plan for monetization roadmap

Additional Managed Services Opportunities
8
Does your organization currently purchase or plan to purchase any of the following technology or value-add services that may be bundled with the WAN service?
N = 605 Base=All Respondents Notes: Managed by IDC's Quantitative Research Group. ;Data Not Weighted ;Use caution when interpreting small sample sizes. Source: Software-Defined WAN (SD-WAN) Survey, IDC, April, 2016
53,9%
33,9%
38,0%
35,2%
27,1%
23,6%
9,9%
20,5%
28,6%
29,4%
30,9%
31,9%
29,8%
14,5%
14,7%
21,3%
17,9%
18,5%
19,8%
23,1%
18,8%
9,9%
14,9%
13,1%
13,6%
16,5%
17,2%
26,9%
1,0%
1,3%
1,7%
1,8%
4,6%
6,3%
29,8%
0% 10% 20% 30% 40% 50% 60% 70% 80% 90% 100%
Firewall
Intrusion Detection/Intrusion Protection
WAN Optimization
Content Filtering
DDoS
DPI
Other
Currently Purchase Plan to purchase within 12 months Plan to purchase 12-24 months from now
Don't use and no plans to purchase Don't Know

Realize Juniper SDN/NFV Solution as a Revenue Platform
36% Revenue Increase
90% EBITDA Increase
88% Operating Income
Increase
Sample TCO/ROI Benefit for Hybrid Cloud CPE
Source: Juniper/InCode Analysis
Secure Programmable WAN
SECURE
Best of Breed Ecosystem
OPEN
Agile Service Delivery
SIMPLIFY
55% Reduction in
service delivery
cost per site
31% Reduction in
trouble
resolution
53% Decrease in
quote-to-cash
period
80% Decrease in
time to resolve
network events

TECHNOLOGY AND BUSINESS TRANSFORMATION
Unprecedented
Scale &
Security
MX
Series
PTX
Series SRX
Series
QFX
Series “We partnered with Juniper for its proven
capability to deliver end-to-end solutions, its
innovative technologies and strong leadership.”
– Joaquin Mata, CTO, Telefónica Spain
Virtualization &
Automation
Carrier Grade
Orchestration &
Analytics
“We’re working with Juniper to build and deploy
the next generation of networking services.”
- John Donovan, Sr EVP, AT&T
Contrail Service
Orchestration
Contrail
Networking
“…separating ourselves…with the vSRX and
its ability to spin up services… within minutes
instead of months”
- John White, Director Product Strategy NorthStar vSRX
vMX
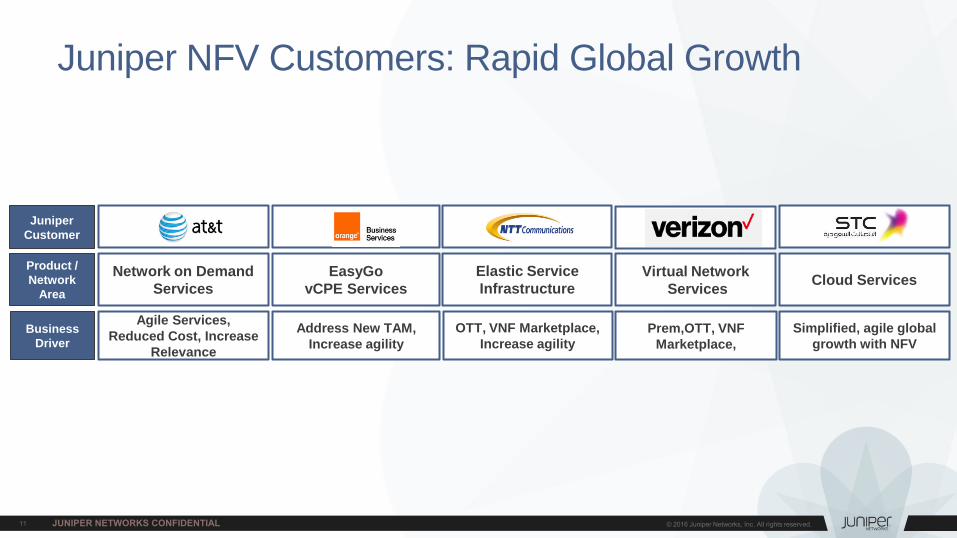
Juniper NFV Customers: Rapid Global Growth
Product /
Network
Area
Network on Demand
Services
EasyGo
vCPE Services
Business
Driver
Agile Services,
Reduced Cost, Increase
Relevance
Address New TAM,
Increase agility
Elastic Service
Infrastructure
OTT, VNF Marketplace,
Increase agility
Juniper
Customer
Virtual Network
Services
Prem,OTT, VNF
Marketplace,
Cloud Services
Simplified, agile global
growth with NFV
Conclusion
NFV/SDN are technologies that help service providers
transform their business and operations, making them
more like the cloud and “over-the-top” providers.
NFV capabilities are complementary to physical
network environments, enabling networks to evolve based on pragmatic, business-driven decisions.
Service providers can amplify the value of their NFV
efforts by using automation and orchestration tools to
dynamically create service chains to monetize your network.
With automation eliminating manual intervention,
virtualized services can be created, customized, and
delivered in minutes rather than months, and service provisioning can be extended directly to the customer.

Obrigado