America Movil Lobbying Practices -...
28
Ooredoo Group 9M 2016 Results 31 October 2016
Transcript of America Movil Lobbying Practices -...

Ooredoo Group9M 2016 Results
31 October 2016

9M 2016 | Ooredoo Group Results Call 2|
Ooredoo (parent company Ooredoo Q.S.C.) and the group of companies which it forms part of (“Ooredoo Group”) cautions investors
that certain statements contained in this document state Ooredoo Group management's intentions, hopes, beliefs, expectations, or
predictions of the future and, as such, are forward-looking statements.
Ooredoo Group management wishes to further caution the reader that forward-looking statements are not historical facts and are only
estimates or predictions. Actual results may differ materially from those projected as a result of risks and uncertainties including, but
not limited to:
– Our ability to manage domestic and international growth and maintain a high level of customer service
– Future sales growth
– Market acceptance of our product and service offerings
– Our ability to secure adequate financing or equity capital to fund our operations
– Network expansion
– Performance of our network and equipment
– Our ability to enter into strategic alliances or transactions
– Cooperation of incumbent local exchange carriers in provisioning lines and interconnecting our equipment
– Regulatory approval processes
– Changes in technology
– Price competition
– Other market conditions and associated risks
This presentation does not constitute an offering of securities or otherwise constitute an invitation or inducement to any person to
underwrite, subscribe for or otherwise acquire or dispose of securities in any company within the Ooredoo Group.
The Ooredoo Group undertakes no obligation to update publicly or otherwise any forward-looking statements, whether as a result of
future events, new information, or otherwise.
Disclaimer

9M 2016 | Ooredoo Group Results Call 3|
1. Results Review
2. Operations Review
3. Additional Information
Contents
9M 2016 | Ooredoo Group Results Call 4|
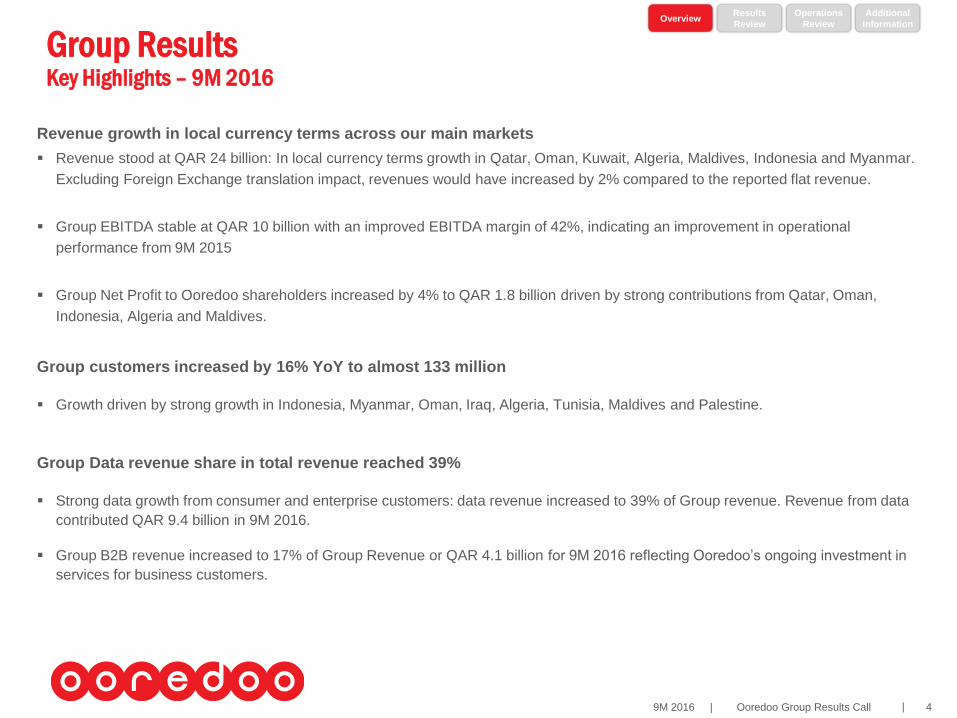
Revenue growth in local currency terms across our main markets
Revenue stood at QAR 24 billion: In local currency terms growth in Qatar, Oman, Kuwait, Algeria, Maldives, Indonesia and Myanmar.
Excluding Foreign Exchange translation impact, revenues would have increased by 2% compared to the reported flat revenue.
Group EBITDA stable at QAR 10 billion with an improved EBITDA margin of 42%, indicating an improvement in operational
performance from 9M 2015
Group Net Profit to Ooredoo shareholders increased by 4% to QAR 1.8 billion driven by strong contributions from Qatar, Oman,
Indonesia, Algeria and Maldives.
Group customers increased by 16% YoY to almost 133 million
Growth driven by strong growth in Indonesia, Myanmar, Oman, Iraq, Algeria, Tunisia, Maldives and Palestine.
Group Data revenue share in total revenue reached 39%
Strong data growth from consumer and enterprise customers: data revenue increased to 39% of Group revenue. Revenue from data
contributed QAR 9.4 billion in 9M 2016.
Group B2B revenue increased to 17% of Group Revenue or QAR 4.1 billion for 9M 2016 reflecting Ooredoo’s ongoing investment in
services for business customers.
Group ResultsKey Highlights – 9M 2016
Results
Review
Operations
Review
Additional
InformationOverview

9M 2016 | Ooredoo Group Results Call 5|
25,477 24,839
24,196 24,266
9M'13 9M'14 9M'15 9M'16
Group ResultsRevenue and EBITDA
Revenue (QARm) EBITDA (QARm) & EBITDA Margin
Note: All Indosat results as reported adhere to IFRS which may in some instances differ from INDOGAAP
-3%-3% 0%
Negative Revenue and EBITDA trend reversed
Higher revenue in Indonesia, Oman and Myanmar, challenging environment in Iraq and Tunisia
Excluding FX impact: Revenue up 2% and EBITDA up 3%
11,225
10,234 10,012 10,156
44%41% 41% 42%
9M'13 9M'14 9M'15 9M'16
-9% -2% +1%
Results
Review
Operations
Review
Additional
InformationOverview

9M 2016 | Ooredoo Group Results Call 6|
(582)
(128)(485)
200
2,651
2,207 2,2431,632
9M'13 9M'14 9M'15 9M'16
1,7582,079
1,832
2,069
Group ResultsNet Profit and Net Debt
Net Profit Attributable to Ooredoo Shareholders
(QARm)Net Debt (QARm) & Net Debt/EBITDA ratio
Note: Net Debt = Total interest bearing loans and borrowings (Net of project finance entities)+ contingent liabilities (letters of guarantee + letters of credit + finance lease + vendor financing) – cash (net of restricted
cash and below BBB+ rating)
Net Profit improved despite Iraqi security situation
Net Debt improved significantly due to better operational cash flow generation
Net Foreign Exchange
Results
Review
Operations
Review
Additional
InformationOverview
0%-15%
28,805 30,530
27,789 28,297
2.02.3 2.2 2.2
9M'13 9M'14 9M'15 9M'16
+6%
-9% +2%
+4%

9M 2016 | Ooredoo Group Results Call 7|
Group ResultsFree Cash Flow and Capital Expenditure
Free Cash Flow (QARm) CAPEX (QARm) & CAPEX/Revenue (%)
Note: Free cash flow = Net profit plus depreciation and amortization less Capex; Capex excludes license fee obligations; Net profit adjusted for extraordinary items.
Free Cash Flow improvement supported by lower CAPEX
Investment into network continued to maintain strong competitive position, Q4 traditionally highest Capex period
Results
Review
Operations
Review
Additional
InformationOverview
2,255
1,893 2,138
4,780
9M'13 9M'14 9M'15 9M'16
+13%-16%
+124%
6,165 6,209
5,647
3,642
24% 25%23%
15%
9M'13 9M'14 9M'15 9M'16
+1%
-9%
-36%
9M 2016 | Ooredoo Group Results Call 8|
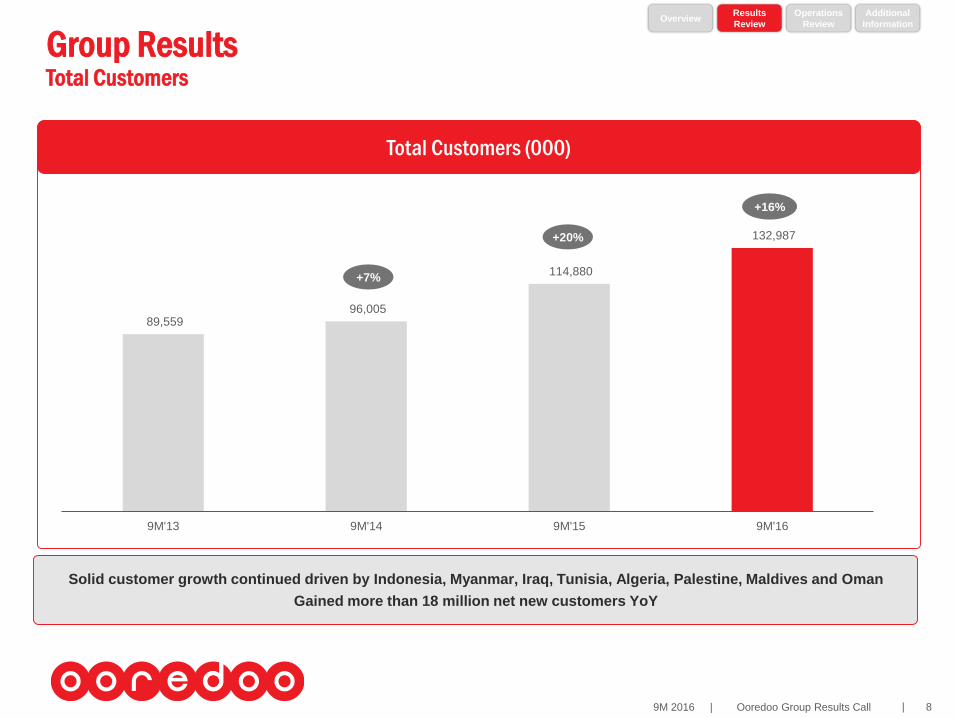
Group ResultsTotal Customers
Solid customer growth continued driven by Indonesia, Myanmar, Iraq, Tunisia, Algeria, Palestine, Maldives and Oman
Gained more than 18 million net new customers YoY
Total Customers (000)
89,559 96,005
114,880
132,987
9M'13 9M'14 9M'15 9M'16
+7%
+20%
+16%
Results
Review
Operations
Review
Additional
InformationOverview

9M 2016 | Ooredoo Group Results Call 9|
Group ResultsTotal Group Debt Breakdown
Total Group Debt (QARm)Total Group Debt Breakdown
(as of September 30, 2016)
Note: Includes Ooredoo International Finance Limited and Ooredoo Tamweel Limited
Temporary increase in Group debt due to prefunding of USD
1 Billion Bond, repaid on 14th October 2016
33,65637,726
40,463 38,462
8,1224,916
2,318 6,884
9M'13 9M'14 9M'15 9M'16
Short Term
Long Term
45,346
42,642
33,771
42,781 41,778
Qatar78%
Indonesia12%
Others10%
Results
Review
Operations
Review
Additional
InformationOverview
Group debt mainly at Corporate level

9M 2016 | Ooredoo Group Results Call 10|
Group ResultsDebt Profile – Ooredoo Q.S.C. level
Total outstanding debt as at 30 September 2016 at Ooredoo Q.S.C. level USD 9,750 million
Total Loans 3,474 2,650 Total Bonds and Sukuk 7,100
¹ Fully drawn basis
² USD 1bn bond repaid on 14 October 2016
1000
1250
1600
650
1000 1000 1000
750
500 500 500
0
200
400
600
800
1,000
1,200
1,400
1,600
1,800
2016 2017 2018 2019 2020 2021 2022 2023 2024 2025 2026 2028 2043
Bonds SukukBonds SukukLoans
Loan Type (in USD mn) Amount Usage Rate¹ Maturity
QAR3bn RCF 824 0 QAR Money Market 31 Jan 2017
USD1bn RCF 1,000 1,000 Libor + 100bps 17 May 2019
USD 500mn RCF 500 500 Libor + 100bps 06 May 2020
USD150mn Term Loan 150 150 Libor + 90bps 31 Aug 2020
USD1bn RCF 1,000 1000 Libor + 140bps 07 Jun 2022
Bonds/Sukuk (in USD mn)Issue
Amount
Interest/
Profit RateMaturity Listed in
Fixed Rate Bonds due 2016 ² 1,000 3.375% 14 Oct 2016 LSE
Fixed Rate Bonds due 2019 600 7.875% 10 Jun 2019 LSE
Fixed Rate Bonds due 2021 1,000 4.75% 16 Feb 2021 LSE
Fixed Rate Bonds due 2023 1,000 3.25% 21 Feb 2023 ISE
Fixed Rate Bonds due 2025 750 5.00% 19 Oct 2025 LSE
Fixed Rate Bonds due 2026 500 3.75% 22 Jun 2026 ISE
Fixed Rate Bonds due 2028 500 3.875% 31 Jan 2028 ISE
Fixed Rate Bonds due 2043 500 4.50% 31 Jan 2043 ISE
Sukuk due 2018 1,250 3.039% 03 Dec 2018ISE
Results
Review
Operations
Review
Additional
InformationOverview
Long term debt profile remains well balanced- refinancing risk reduced
9M 2016 | Ooredoo Group Results Call 11|
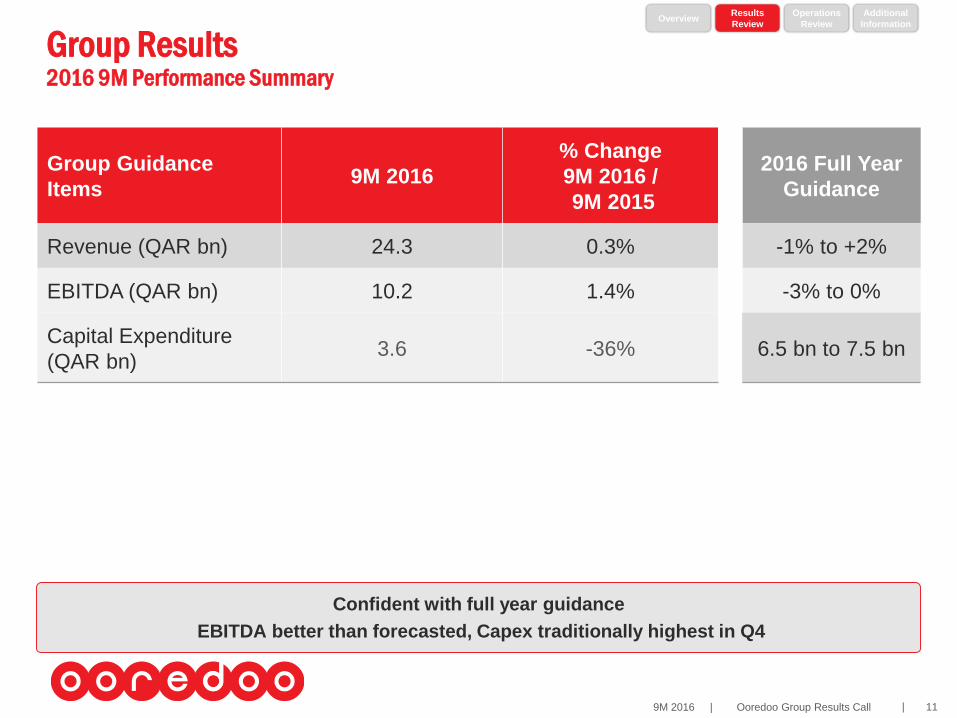
Group Results2016 9M Performance Summary
Confident with full year guidance
EBITDA better than forecasted, Capex traditionally highest in Q4
Results
Review
Operations
Review
Additional
InformationOverview
Group Guidance
Items9M 2016
% Change
9M 2016 /
9M 2015
2016 Full Year
Guidance
Revenue (QAR bn) 24.3 0.3% -1% to +2%
EBITDA (QAR bn) 10.2 1.4% -3% to 0%
Capital Expenditure
(QAR bn)3.6 -36% 6.5 bn to 7.5 bn

9M 2016 | Ooredoo Group Results Call 12|
1. Results Review
2. Operations Review
3. Additional Information
Contents

9M 2016 | Ooredoo Group Results Call 13|
3,0503,051
52% 51%
9M'15 9M'16
Market leadership position maintained – Ooredoo’s mobile
and fixed line networks ranked among the fastest globally
Results approximately in line with previous year, slight growth
in Revenue and EBITDA
3.4 mill customer numbers (-1% yoy, +1% sequentially)
Completed the landing of the new high capacity Asia-Africa-
Europe-1 (AAE-1) subsea cable system to provide more and
faster bandwidth
Ooredoo Qatar CEO, Waleed Al Sayed was named ‘Telecoms
CEO of the Year’ at the 2016 CEO Middle East Award, in
recognition for his strong leadership
Rio Olympics full coverage on Ooredoo TV
Successful iPhone 7 launch event
Reference Infrastructure Access Offer (RIAO) still under
negotiation with the Regulator
Qatar fiber rollout: more than 408K homes passed with more
than 293K homes connected across the country
Group OperationsQatar
QARm
+1%Revenue
EBITDA & Margin
0%
1 US$ = 3.6415 Qatari Riyal (QAR)1
Qatar
5,897 5,982
9M'15 9M'16
Note: (1) Constant pegged currency
Results
Review
Operations
Review
Additional
InformationOverview
9M 2016 | Ooredoo Group Results Call 14|
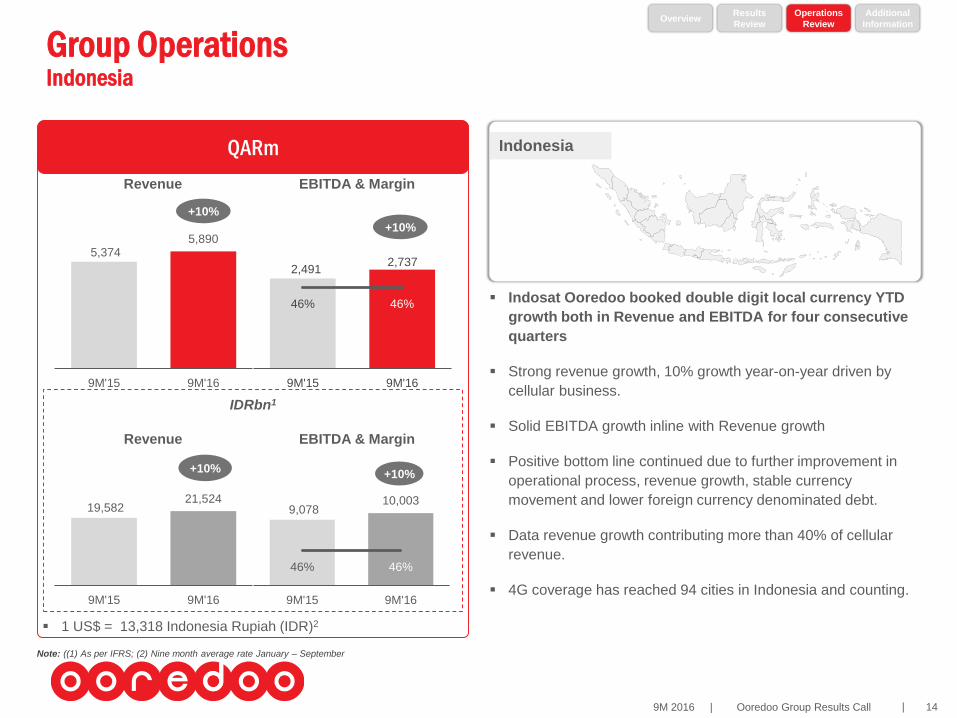
9,07810,003
46% 46%
9M'15 9M'16
2,491 2,737
46% 46%
9M'15 9M'16
5,3745,890
9M'15 9M'16
Group OperationsIndonesia
QARm
1 US$ = 13,318 Indonesia Rupiah (IDR)2
+10%
Revenue
+10%
EBITDA & Margin
IDRbn1
Revenue EBITDA & Margin
Note: ((1) As per IFRS; (2) Nine month average rate January – September
Indosat Ooredoo booked double digit local currency YTD
growth both in Revenue and EBITDA for four consecutive
quarters
Strong revenue growth, 10% growth year-on-year driven by
cellular business.
Solid EBITDA growth inline with Revenue growth
Positive bottom line continued due to further improvement in
operational process, revenue growth, stable currency
movement and lower foreign currency denominated debt.
Data revenue growth contributing more than 40% of cellular
revenue.
4G coverage has reached 94 cities in Indonesia and counting.
Indonesia
Results
Review
Operations
Review
Additional
InformationOverview
19,58221,524
9M'15 9M'16
+10%+10%

9M 2016 | Ooredoo Group Results Call 15|
1,612 1,462
43% 46%
9M'15 9M'16
3,712
3,161
9M'15 9M'16
Group OperationsIraq
QARm
Revenue
EBITDA & Margin
-15%
-9%
Asiacell revenue market leadership maintained thanks to its
strong 3G network and increased data usage.
Revenue and EBITDA declined due to the security situation in
parts of Iraq
Company-wide cost optimization program in place and strict
control helped to improve EBITDA margin.
Customer base increased to 11.2 million as of September 2016
(up by 5%)
Overall security situation has started to show some
improvements in key areas of the country where Asiacell has
started to reactivate some parts of its network (Anbar,
Salahadeen and Mosul)
Iraq
Results
Review
Operations
Review
Additional
InformationOverview
9M 2016 | Ooredoo Group Results Call 16|
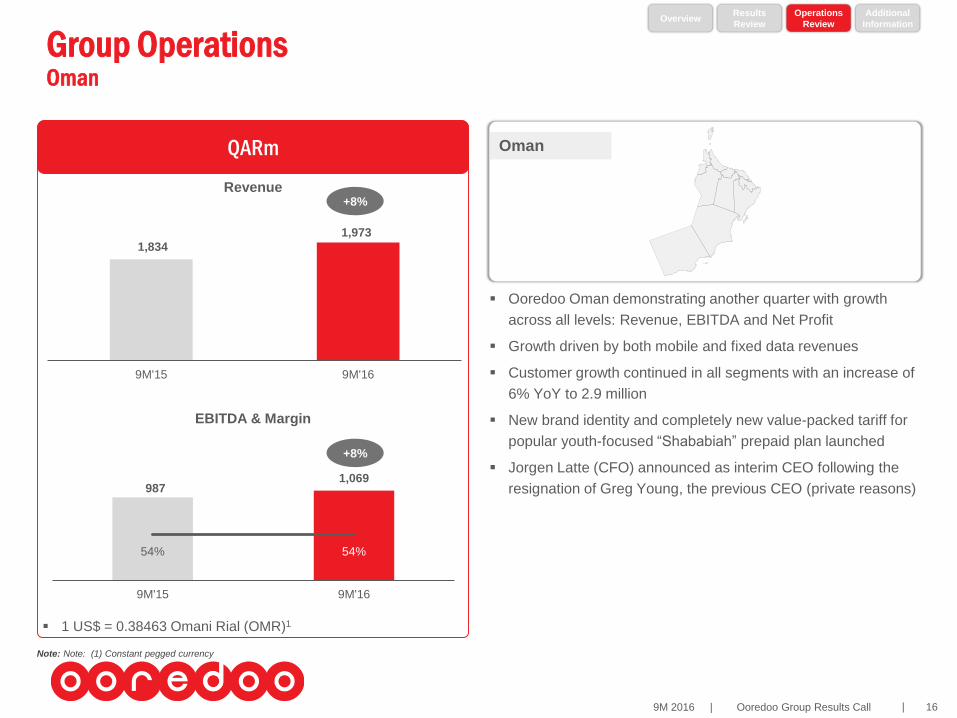
9871,069
54% 54%
9M'15 9M'16
1,834
1,973
9M'15 9M'16
Group OperationsOman
QARm
Revenue
EBITDA & Margin
+8%
+8%
1 US$ = 0.38463 Omani Rial (OMR)1
Note: Note: (1) Constant pegged currency
Ooredoo Oman demonstrating another quarter with growth
across all levels: Revenue, EBITDA and Net Profit
Growth driven by both mobile and fixed data revenues
Customer growth continued in all segments with an increase of
6% YoY to 2.9 million
New brand identity and completely new value-packed tariff for
popular youth-focused “Shababiah” prepaid plan launched
Jorgen Latte (CFO) announced as interim CEO following the
resignation of Greg Young, the previous CEO (private reasons)
Oman
Results
Review
Operations
Review
Additional
InformationOverview

9M 2016 | Ooredoo Group Results Call 17|
418 434
25% 24%
9M'15 9M'16
1,6861,795
9M'15 9M'16
Group OperationsKuwait
QARm
1 US$ = 0.3017 Kuwait Dinar1
+6%
Revenue
+4%
EBITDA & Margin
KWDm
Revenue EBITDA & Margin
Note: (1) Nine month average rate January – September
Kuwait
Ooredoo Kuwait Revenue and EBITDA increased by 6% and
4% respectively despite the backdrop of fierce competition and
challenging economic situation
Customer number stood at 2.4 million similar to Sep 2015
Pre paid and WBB (wireless broadband) remains very
competitive
Superior network speed confirmed by Ookla Speed test award
Retail foot print increasing further
Cost saving initiatives in place, results visible in lower Opex
Integration of FASTtelco on track
Results
Review
Operations
Review
Additional
InformationOverview
35 36
25% 24%
9M'15 9M'16
139149
9M'15 9M'16
+4%
+6%

9M 2016 | Ooredoo Group Results Call 18|
3,103 2,829
9M'15 9M'16
-9%
Group OperationsAlgeria
QARm
1 US$ = 109.1 Algerian Dinar (DZD)1
Revenue EBITDA & Margin
DZDm
Revenue EBITDA & Margin
Note: (1) Nine month average rate January – September
Algeria
Revenue slightly up in Algerian Dinar terms
Ooredoo Algeria maintains revenue market share growth
despite challenging market conditions and fierce price
competition.
Outperforming competition reaching an all-time high value
market share of 38%
Ooredoo Algeria 4G commercial launch post period in October
2016
Results
Review
Operations
Review
Additional
InformationOverview
1,166 1,038
38% 37%
9M'15 9M'16
-11%
31,499 31,085
38% 37%
9M'15 9M'16
-1%
+1%
83,636 84,742
9M'15 9M'16

9M 2016 | Ooredoo Group Results Call 19|
1,414 1,290
9M'15 9M'16
Group OperationsTunisia
QARm
1 USD = 2.105Tunisian Dinar (TND) 1
Revenue EBITDA & Margin
TNDm
Revenue EBITDA & Margin
Note: (1) Nine month average rate January – September
Tunisia
Ooredoo Tunisia maintained its market leadership position
amid still subdued Tunisian economic environment and a new
Tunisian Dinar currency record low
Results improved sequentially in terms of Revenue, EBITDA
and Net profit.
Customers number reached 7.8 million, an increase of 4%
Strong growth of mobile data thanks to accelerated network
modernization
Cost optimization program enabled savings
Results
Review
Operations
Review
Additional
InformationOverview
626504
44%39%
9M'15 9M'16
-19%
756 746
9M'15 9M'16
334293
44% 39%
9M'15 9M'16
-1%
-12%
-9%

9M 2016 | Ooredoo Group Results Call 20|
Group OperationsMyanmar
QARm
Revenue
EBITDA & Margin
Myanmar
Ooredoo Myanmar maintained its growth performance and
generated revenue of QAR 1,105 million in 9M 2016
Customer base reached 8.8 million at the end of the period
across the country an increase of 84% over last year
Continue to gain revenue market share in a highly competitive
market
ARPU 4503 Kyat (approximately USD 3.46)
Further progress rolling out 4G network
Network coverage in constant expansion in new areas, now -
offering high quality data and voice services to more than 80%
of the Myanmar population
Considerable cost savings initiatives through extensive co-
sharing and co-locations, and discounts negotiated for new
contracts and contracts renewals with key suppliers
Smooth transition from the former military led government to
new government
Results
Review
Operations
Review
Additional
InformationOverview
-30
-7
9M'15 9M'16
782
1,105
9M'15 9M'16
+41%
+77%

9M 2016 | Ooredoo Group Results Call 21|
Qatar Exchange 2016 IR Excellence Program for Qatar
Please do vote for Ooredoo QSC, we do appreciate your support !
https://www.surveymonkey.com/r/IRExcellenceArabic
https://www.surveymonkey.com/r/IRExcellenceEnglish
Thank you

9M 2016 | Ooredoo Group Results Call 22|
Q & A

9M 2016 | Ooredoo Group Results Call 23|
1. Results Review
2. Operations Review
3. Additional Information
Contents

9M 2016 | Ooredoo Group Results Call 24|
Additional InformationGroup Revenue and EBITDA Breakdown
Revenue (QARm) EBITDA (QARm)
9M'13 9M'14 9M'15 9M'16
Qatar 4,860 5,286 5,897 5,982
Indonesia 6,459 5,501 5,374 5,890
Iraq 5,310 4,804 3,712 3,161
Kuwait 1,916 1,615 1,686 1,795
Algeria 2,879 3,507 3,103 2,829
Tunisia 1,890 1,780 1,414 1,290
Oman 1,470 1,636 1,834 1,973
Myanmar - 54 782 1,105
Others 693 656 394 241
9M'13 9M'14 9M'15 9M'16
Qatar 2,368 2,626 3,050 3,051
Indonesia 3,060 2,504 2,491 2,737
Iraq 2,800 2,272 1,612 1,462
Kuwait 526 340 418 434
Algeria 1,200 1,366 1,166 1,038
Tunisia 999 854 626 504
Oman 675 839 987 1,069
Myanmar - (251) (30) (7)
Others (403) (316) (308) (132)
10,012 10,156
24,19625,477 24,83924,266 11,225
10,234
Results
Review
Operations
Review
Additional
InformationOverview

9M 2016 | Ooredoo Group Results Call 25|
Additional InformationGroup CAPEX and Customers Breakdown
CAPEX Breakdown (%) Customers Breakdown (%)
Qatar17%
Iraq9%
Indonesia21%
Oman10%
Kuwait8%
Algeria11%
Tunisia6%
Myanmar16%
Others2%
Qatar3%
Iraq8%
Indonesia, 61%
Oman2%
Kuwait2%
Algeria10%
Myanmar7%
Tunisia6%
Others1%
Results
Review
Operations
Review
Additional
InformationOverview
9M 2016 CAPEX = QAR 3,642 m 9M 2016 Total Customers = 133 m
9M 2016 | Ooredoo Group Results Call 26|
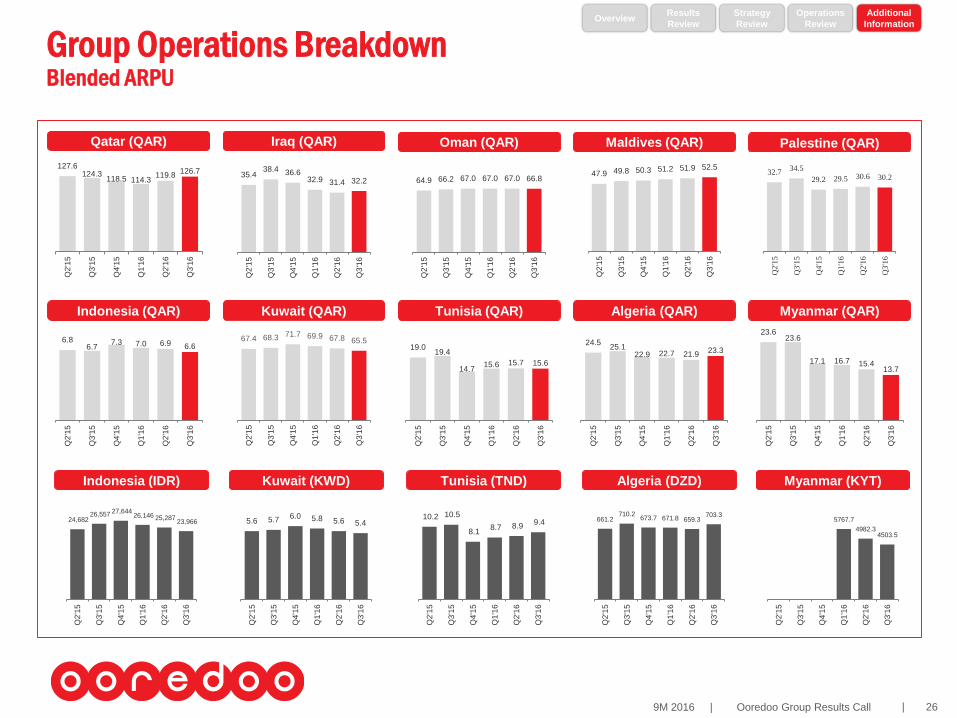
Group Operations BreakdownBlended ARPU
Results
Review
Strategy
Review
Operations
Review
Additional
InformationOverview
127.6124.3
118.5 114.3119.8
126.7
Q2
'15
Q3
'15
Q4
'15
Q1
'16
Q2
'16
Q3
'16
Qatar (QAR) Iraq (QAR) Oman (QAR) Maldives (QAR) Palestine (QAR)
6.86.7
7.3 7.0 6.9 6.6
Q2
'15
Q3
'15
Q4
'15
Q1
'16
Q2
'16
Q3
'16
Indonesia (QAR) Kuwait (QAR) Tunisia (QAR) Algeria (QAR) Myanmar (QAR)
19.019.4
14.715.6 15.7 15.6
Q2
'15
Q3
'15
Q4
'15
Q1
'16
Q2
'16
Q3
'16
24.525.1
22.9 22.7 21.923.3
Q2
'15
Q3
'15
Q4
'15
Q1
'16
Q2
'16
Q3
'16
23.623.6
17.1 16.7 15.413.7
Q2
'15
Q3
'15
Q4
'15
Q1
'16
Q2
'16
Q3
'16
Indonesia (IDR) Algeria (DZD)Tunisia (TND)Kuwait (KWD)
35.438.4 36.6
32.9 31.4 32.2
Q2
'15
Q3
'15
Q4
'15
Q1
'16
Q2
'16
Q3
'16
64.9 66.2 67.0 67.0 67.0 66.8
Q2
'15
Q3
'15
Q4
'15
Q1
'16
Q2
'16
Q3
'16
47.9 49.8 50.3 51.2 51.9 52.5
Q2
'15
Q3
'15
Q4
'15
Q1
'16
Q2
'16
Q3
'16
32.734.5
29.2 29.5 30.6 30.2
Q2'1
5
Q3'1
5
Q4'1
5
Q1'1
6
Q2'1
6
Q3'1
6
67.4 68.3 71.7 69.9 67.8 65.5
Q2
'15
Q3
'15
Q4
'15
Q1
'16
Q2
'16
Q3
'16
24,682 26,557 27,644
26,146 25,287 23,966
Q2
'15
Q3
'15
Q4
'15
Q1
'16
Q2
'16
Q3
'16
5.6 5.7 6.0 5.8 5.6 5.4
Q2
'15
Q3
'15
Q4
'15
Q1
'16
Q2
'16
Q3
'16
10.2 10.5
8.1 8.7 8.9
9.4
Q2
'15
Q3
'15
Q4
'15
Q1
'16
Q2
'16
Q3
'16
661.2710.2
673.7 671.8 659.3703.3
Q2
'15
Q3
'15
Q4
'15
Q1
'16
Q2
'16
Q3
'16
Myanmar (KYT)
5767.7
4982.34503.5
Q2
'15
Q3
'15
Q4
'15
Q1
'16
Q2
'16
Q3
'16

9M 2016 | Ooredoo Group Results Call 27|
Additional InformationStatutory Corporate Tax Rates
Algeria 26% 4 years
Indonesia 25% 5 years
Iraq 15% 5 years
Kuwait 15% 3 yearsGCC companies (including NMTC)are exempted and are subjected to 4.5% Zakat, KFAS &
national Labour Support Tax on consolidated profits
Maldives 15% 5 years
Myanmar 25% 3 years
Oman 12% 5 years
Palestine 20% 5 years
Qatar 10% 3 years Qatari/GCC owned companies and companies listed on Qatar Exchange are exempt
Singapore 17% Indefinitely
Tunisia 35% 5 years1) 25% is the standard tax rate; 2) 35% tax rate applies to oil companies, banks, financial
institutions including insurance companies and telecommunication companies
NotesStatutory
Tax Rate
Losses C/Fwd
Allowed
Results
Review
Operations
Review
Additional
InformationOverview