
AMERIABANK ANNUAL REPORT 2017
106
Transcript of AMERIABANK ANNUAL REPORT 2017


AMERIABANK ANNUAL REPORT 2017

31
THE ARMENIAN ALPHABET
The Armenian alphabet is one of the greatest symbols of the Armenian identity and culture. It is
a unique representation of an ancient language that is in its shape, form and in its phonetics. According to historical references following many years of studies Mesrop Mashtots created the Armenian alphabet in 405 AD. This historic achievement is the cornerstone on which the Armenian culture witnessed an unprecedented Renaissance of religious, historical, scientific and philosophical manuscripts and numerous invaluable literature pieces for the next millennia. Originally, the Armenian alphabet was designed to have 36 letters. To adapt with the developing linguistic requirements, 3 additional letters were added many years later. Compared to the other Indo-European languages, the Armenian language also has unique punctuation marks and enjoys a unique pronunciation on its own.
The celebration of the Armenian alphabet is visibly evident in modern Armenia.
Perhaps one of the most symbolic manifestations of this reality is experienced on Mesrop Mashtots avenue, the largest and the most central avenue of in the capital of Armenia – Yerevan where the national library of manuscripts – Matenadaran is located, which means “Repository of Manuscripts”
in Armenian. It is a scientific research institute and a one-of-a-kind museum of Armenian cultural treasures - the monumental cradle of over 23,000 authentic manuscripts, fragments and parchments.
In order to celebrate the majesty and uniqueness of the Armenian alphabet and to celebrate its heritage of over 1600 years, a monument constituting of 39 separate letters has been erected on the lush green slopes of mount Aragats. The sole fact of having a dedicated monument for the alphabet describes in itself the pride that Armenians feel towards their own 39 letters. Throughout time, the Armenian alphabet has been the symbol of endurance, progress and agility. Over the past 1600 years this writing system remained unchained, yet proving sufficient solidity and flexibility to be able to adapt to the evolving challenges and demands of the world around it.
The Armenian language is spoken by over 10 million Armenians over around the world; it stands as the most powerful tool that preserves their cultural and national identity, and the covenant to passing and transferring their traditions to future generations.

4 5
CONTENTS
BUSINESS REVIEW
7 Performance Highlights
8 Chairman’s Statement
10 Chief Executive’s Review
12 Historic Milestones
19 Global Partners
24 Awards
25 Key Performance Indicators
26 Development of Technologies and Infrastructure
STRATEGIC REPORT
31 External Environment
36 Banking Sector in Armenia
44 Position of Ameriabank in the Banking Sector
47 Business Model and Strategy
49 Retail Banking
54 Corporate Banking
57 Investment Banking and Trading
GOVERNANCE REPORT
61 Chairman’s Corporate Governance Statement
62 Corporate Governance Structure
63 Board of Directors
65 Board Committees
67 Members Of The Board Of Directors
72 Management Board
79 Our People
82 Organizational Chart
RISK MANAGEMENT
85 Risk Management Objectives and Principles
88 Risk Appetite
89 Key Risks and Risk Profile
102 Key Risk Management Focus
104 Risk Management Framework
106 Risk Organization and Governance
SUMMARY FINANCIAL STATEMENTS
111 Independent Auditor’s Report
115 Financial Statements

6 7
FOLLOWTIME AND VALUE HISTORY TO REACH THE DESIRED DESTINATION
BUSINESS REVIEWPERFORMANCE HIGHLIGHTS
Leader of Armenian Banking Sector by
Assets AMD 677,722 mln
Equity AMD 69,902 mln
Loans AMD 475,519 mln
LiabilitiesAMD 607,820 mln
Profit AMD 7,650 mln
TOPCONTENTS

8 9
BUSINESS REVIEWCHAIRMAN’S STATEMENT
Dear Customers, Shareholders and Partners,
It is my pleasure to announce that we have had yet another remarkable year, while reinforcing our market leadership position by all key financial indicators. We significantly increased our market share and registered a double-digit growth in profit as a direct result of our increased focus on efficiency and profitability.
Overall, it was quite a positive year for the Armenian economy, with robust recovery after stagnation in 2016. The economy registered an impressive GDP growth primarily from manufacturing and foreign trade sectors. The foreign exchange market remained relatively stable in 2017, while annual CPI registered slight increase finally ending deflationary trends prevailing in 2016.
In 2017 Armenia signed the Comprehensive and Enhanced Partnership Agreement (CEPA) with the EU, confirming the country’s intentions to strengthen economic ties with Europe. We expect this major event to stimulate further growth and diversification of Armenia’s exports.
A new government is to be formed by the end of April 2018 following constitutional reforms, after which Armenia will switch to a parliamentary republic. We expect that the overall geopolitical vector will remain unchanged, and the country will continue benefiting
Andrew MkrtchyanChairman of the Board of Directors
from its successful partnerships both with the EU and the EEU.
Notwithstanding the positive macroeconomic environment, the year was quite challenging for the banking sector, as banks were trying to utilize massive liquidity raised as new equity in 2015 and 2016 in compliance with the Central Bank’s requirement to increase regulatory capital. The fierce competition on the supply side resulted in a drastic drop in interest rates, putting immense pressure on interest margins and overall profitability of the banks. Nonetheless, Ameriabank managed to considerably increase net profit for the year and outperform the market by profitability indicators.
With sound financial results in 2017, we have come one step closer to our strategic goal of launching an IPO in the international capital markets. In 2018 we will continue our course towards that direction, setting and reaching relevant business goals accordingly. We aim to maintain our leading position in the local market with more focus on efficiency. Increasing the share of SME and retail banking in our overall portfolio will be another strategic objective for 2018. As always, we remain open to non-organic growth opportunities as well, exploring several M&A possibilities in the local market. We believe that absolute market leadership, sustainable growth and efficiency are the minimum
prerequisites of a successful IPO in international capital markets.
Ameriabank has always been actively investing in IT infrastructure and digital products, and in 2017 we moved a step forward by launching a comprehensive digitalization project with the ambition to become the best digital bank in Armenia. We strongly believe that digitalization is an indispensable part of the future of banking, and expect the digitalization project to have a significantly positive impact on our efficiency and market competitiveness in the years to come.
Remaining committed to the best corporate governance standards and practices, we launched a corporate governance framework transformation process setting up Board committees, formalizing committee procedures and introducing best practice board automation and overall decision-making processes at the Board level. Aiming to enhance the decision making process at the executive level as well and to reach the desired strategic targets of efficiency and flexibility, we have also initiated a comprehensive business model revision, a lending process optimization and efficiency enhancement project, the results of which will already be registered by early 2018.
As always, our success in 2017 was without doubt due to our talented and professional people. Human capital remains our most important asset defining our leadership in the local market. A merit based reward system remains the essence of our successful human resources development strategy. I would like to thank our management and their respective teams for their hard work in 2017 and for meeting their business targets.
And of course all our achievements would be impossible without the loyalty and trust of our customers and partners. Our pledge to them is to continue delivering the best quality of service that they deserve.
Summing up, I would like to express my gratitude to our shareholders for their continuing support. We remain committed to our strategy and will do our best to deliver the performance and value creation that our shareholders expect from us.
BUSINESS REVIEW
TOPTOPCONTENTS CONTENTS

10 11
I n 2017, we continued our successful journey, delivering on all our major business targets.
We maintained our position of market leader and remained the largest financial institution in Armenia by all key indicators: assets, customer liabilities, loans, equity and net profit. We closed the year with double digit growth of net profit and significantly improved profitability.
The year was positive in terms of macroeconomic indicators too, with impressive growth of GDP, double digit growth in foreign trade volumes and significant growth in manufacturing. We expect further positive dynamics in 2018 as well. The banking sector indicators improved slightly as a result, but overall the banking system did not overcome the major issues prevailing in 2016: newly attracted equity investment utilization issue, decreasing interest rates and the over-competitive environment that triggered price wars. Moreover, banks continued to bear the costs of Central Bank’s restrictive monetary policy with significantly high reservation rates. Despite these challenges, Ameriabank registered 23.2% growth of net profit. Our profit share increased by 2.5 pp reaching 15.2% among profit-making banks. Our 12 month ROE comprised 11.4%, an increase by 1.2 pp, over-performing market average by 7.5 pp. We remain committed to further improve the Bank’s profitability.
BUSINESS REVIEWCHIEF EXECUTIVE’S REVIEW
Artak HanesyanChairman of the ManagementBoard-General Director
In 2017 we continued our efforts towards risk mitigation and focused on improving our asset quality. Our NPL (PAR 1+) stood at 3.5% as of year-end, which is far below market average of 7.4%, while NPL (PAR 90+) comprised 2.9%.
We continued our successful partnership with all major IFIs active in the region, with new large deals signed in 2017. We signed a USD 30 mln Loan Agreement with responsAbility Investments AG’s Global Climate Partnership Fund for renewable energy and energy efficiency projects financing. Another USD 30 mln Loan Agreement was signed with the Dutch development bank (FMO) aimed at financing younger retail clientele and SMEs led by young entrepreneurs. Aiming to have diversified and balanced funding sources, we will be actively working with our partner IFIs in 2018 as well. An equity replenishment deal of USD 30 mln was thoroughly tailored with Asian Development Bank throughout 2017 to be closed in early 2018. The new equity is to be already reflected in financial reports as of Q1 2018 results.
As a manifestation of our success in 2017, we received a number of reputable global awards and recognitions of excellence. Ameriabank was named the Bank of the Year 2017 in Armenia by The Banker,
a premier publication of Financial Times. This is the third consecutive and the fifth overall Bank of the Year award of Ameriabank from The Banker. We also received the “2017 Award for Excellence” from Euromoney Magazine for the fifth time in the past seven years. Global Finance Magazine named Ameriabank the Best Bank and the Best Investment Bank in Armenia for 2017. This was the sixth consecutive year for Ameriabank to be honored as the Best Bank in Armenia and the second consecutive year – as the best Investment Bank in Armenia by Global Finance Magazine. We maintained our positions of the most active investment bank in the local capital markets leading arrangers’ league table in Armenia. Ameriabank is the largest bond issuer in the market with USD 64.4 mln total bonds outstanding and c. 30.0% market share in corporate bonds market as of year-end 2017. We will continue our issuance programs in 2018 to further diversify and lower the cost of our funding.
We aim to retain our absolute leadership in the market by continuously increasing our market share via organic and non-organic growth. The CAGR of the Bank’s assets for the last 5 years has been 23.0%, resulting in market share increase from 10.2% to 15.5%.
Noteworthy 2017 was significant in terms of large-scale projects. Aiming to expand our retail banking services we have initiated efficiency enhancement and digitalization projects that will give us the necessary speed of processes and availability of services for our clients anywhere anytime. We will be able to register positive results from the implementation of these projects already in 2018.
Looking ahead, I would like to restate our intention to be the absolute leader in the market by further diversifying our services and ensuring best quality of services for our clients with innovative banking solutions and cutting-edge technologies.
BUSINESS REVIEW
TOPTOPCONTENTS CONTENTS

12 13
BUSINESS REVIEWHISTORIC MILESTONES
1910 – 2007
The Erivan Branch of Tiflis Trade Bank was built on Ter-Ghukasov Street in 1910. In 1916 Tiflis Trade Bank was renamed Caucasus Bank. According to archive records, most of monetary resources transferred to Armenia came through the Erivan Branch of Caucasus Bank. The latter was nationalized by the December 18, 1920 Decree of Revolutionary Committee. From February 1921 till March 1922 the building was occupied by the Armenian Telegraph Agency. On March 24, 1922 the State Bank of Armenia moved in. The Communal Bank of Armenia was established in March 1924 and started its operations at 2 Nalbandyan Street (former Ter Ghukasov Street). In 1959 the Communal Bank was disbanded, and its assets and liabilities were passed to the Armenian branch of Stroybank located in the same historical building at 2 Nalbandyan. In 1974, the Armenian branch of Vneshtorgbank of USSR was established in the same building, the Armenian branch of Stroybank having moved to another location. In 1988, the Armenian Branch of Vnesheconombank of USSR was established in the building, to be reorganized into Armimpexbank (Armenian Import and Export Bank) CJSC in 1992. In 1995, the majority share of the bank was acquired by Computron Industries Establishment, which made it a bank with foreign capital.
2007 – 2009
In 2007 the majority (96%) of Armimpexbank shares was acquired by TDA Holdings Limited, and one of the oldest banks in Armenia embarked on a new development stage that became the turning point in its history. The Bank sharply replenished its resource stock and developed its services to best local and international standards. In 2008 Armimpexbank was renamed Ameriabank CJSC.
Awards & Certificates
In 2009 Ameriabank received a certificate of compliance with the ISO 9001:2008 international quality management standards.
Infrastructure & Innovation► In 2009, 2 branches were opened – in Kajaran
(Syunik region) and in Yerevan (Kentron Branch), while the Head Office moved to a new building in Yerevan.
► In the same year, the Bank became a principal member of VISA International and a member of Armenian Stock Exchange (ASE), followed by the launch of a new product offering in Armenia – full Visa Gold and MasterCard Gold package including
additional services, such as IAPA discounts and travel insurance.
► Joined the International Finance Corporation’s (IFC) Global Trade Finance Program as an issuing bank.
Financial Deals
► IFC: USD 5 mln trade guarantee as part of Global Trade Finance Program and USD 15 mln loan for renewable energy finance in Armenia in 2009.
► The Netherlands Development Finance Company (FMO), Deutsche Investitions und Entwicklungsgesellschaft mbH (DEG): USD 30 mln debt financing agreement, including USD 20 mln for small and medium enterprises (SME) and USD 10 mln for renewable energy (December 2009).
2010 – 2011
The Agreement on the Plan of a Merger between Ameriabank and Cascade Bank was executed and registered in June 2010. In November 2011 the sole shareholder TDA Holding Limited was renamed Ameria Group (CY) Limited. The Bank’s regulatory capital steadily increased throughout 2007-2013.
Awards & Certificates► Commerzbank: Award for Excellence for high
quality international operations and Award for Excellence in Trade Finance in 2010, STP Award 2011 for Excellence in performance of international transfers by straight through processing (99.85%).
► Finalized and completed the introduction of environmental and social risk management system with assistance from FMO and DEG. Awarded certificate for appreciation by FMO and DEG receiving a reduction of the interest rate under the loan agreement executed earlier in December 2009.
► IFC’s GTFP Award 2010 as the most active issuing bank in the Caucasus under the Global Trade Finance Program and GTFP Award 2011 as the best issuing bank in the Caucasus.
► Germany-based TŰV Rheinland reconfirmed the ISO 9001:2008 quality management certificate and extended it for 3 years.
► The Best Bank of Armenia in 2010 award by The Banker magazine of Financial Times.
► Euromoney 2011 Award for Excellence as the Best Bank in Armenia.
Infrastructure & Innovation► Opened 5 branches – 2 in outer regions (Dilijan,
Vanadzor) and 3 in Yerevan (Cascade, Komitas and Moskovyan branches).
► Received the status of Agent in medium and long-term Armenian Government (treasury) coupon bonds.
► Signed International Swaps and Derivatives Association Master Agreement with IFC, which is an internationally recognized standard for risk management operations.
Financial Deals► The European Bank for Reconstruction and
Development (EBRD): USD 10 mln loan agreement for development of private sector.
► The Eurasian Development Bank (EDB): USD 30 mln credit facility agreement for SME financing.
► The Asian Development Bank (ADB): USD 20 mln credit facility agreement for SME financing.
► Commerzbank: a bank guarantee was issued in national currency (AMD) and a major loan facility without collateral was provided (bilateral loan). For the first time ever such facility was provided by an international financial institution to an Armenian bank.
► Citibank: CARTA (Continuing Agreement for Reimbursement of Trade Advances) in the amount of USD 4 mln with Citibank. For the first time ever Citibank provided funds to an Armenian bank based only on good financial standing and reliable activities.
BUSINESS REVIEW
TOPTOPCONTENTS CONTENTS

14 15
2012 – 2013
Ameriabank became the largest bank in Armenia by total assets and liabilities to customers.
Awards & Certificates► Commerzbank: Best Trade Financing Partner
2012 Award, STP Award 2012 for excellence (99%) in performance of international transfers, Excellence in Trade Finance Award 2013.
► Best Issuing Bank in Europe and Central Asia by IFC.
► Best GTFP Issuing Bank for Energy Efficiency in Europe and Central Asia by IFC.
► The most active TF issuer in Armenia in 2012 according to EBRD.
► Germany-based TŰV Rheinland reconfirmed the ISO 9001:2008 quality management certificate.
► 2012 and 2013: Best Foreign Exchange Provider in Armenia, Best Trade Finance Bank in Armenia and the Best Bank in Armenia by Global Finance.
► Euromoney 2012 Award for Excellence for the second year in a row.
► Bank of the Year 2013 in Armenia by The Banker magazine of Financial Times.
Infrastructure & Innovation► Opened 2 branches in Yerevan (Shengavit and
Sayat-Nova branches).
► Joined Factors Chain International, a major global factoring network, in 2013.
► First in Armenia, offered a unique opportunity to obtain debut sovereign USD-denominated Eurobonds of Armenia circulated in international capital markets.
► Launched Visa Internet acquiring services.
► First in the Armenian banking sector was granted a confirming bank status by EBRD under Global Trade Facilitation Program.
Financial Deals► Provided USD 15 mln for the reconstruction of
a steelmaking plant in Charentsavan, Armenia, under the Global Trade Finance Program of IFC.
► DEG: USD 20 mln loan agreement for SME financing.
► EBRD: USD 12 mln loan agreement for SME, renewable energy and energy efficiency financing.
► Proparco: USD 15 mln credit facility agreement for SME financing in agriculture and food industry (Proparco’s first investment in Armenia).
► Austrian Development Bank (OeEB): USD 15 mln loan facility agreement for SME, renewable energy and energy efficiency financing.
► Signed an unprecedented deal for Armenian banking system: confirmed a letter of credit to a Kazakh bank, which is part of a large banking group.
BUSINESS REVIEWHISTORIC MILESTONES
BUSINESS REVIEW
► STP Award 2013 for excellence in performance of international transfers by Commerzbank.
► Best Exchange Member in Foreign Currency Market, Best Exchange Member in Repo/Swap Transactions (new nomination) and Best Account Operator-Custodian of Depository System in Foreign Securities Market by NASDAQ OMX Armenia.
► Germany-based TŰV Rheinland re-confirmed Ameriabank’s ISO 9001:2008 international quality management certificate and extended it for 3 years.
► Global Finance named Ameriabank the Best Bank in Armenia (2014, 2015), Best Securities Services Provider in Armenia 2015, Best Trade Finance Provider in Armenia (2014, 2015), Best Foreign Exchange provider in Armenia (2014, 2015).
► Euromoney 2014 Award for Excellence.
► Bank of the Year 2015 in Armenia by The Banker magazine of Financial Times.
Infrastructure & Innovation► Opened 3 branches – Arshakunyats and
Arshakunyats plus branches in Yerevan and Kapan branch in Syunik region.
► Launched an in-house Contact Center with cutting-edge technologies and started 24/7 card service support through the latter.
► Introduced new solution for online banking users – AmeriaToken mobile application generating one-time passwords. This was the first such application introduced in the banking sector of Armenia.
► Launched Ameria Mobile Banking mobile application enabling clients to bank and manage their accounts via smartphones and tablets.
► Marketed new online card transfer system enabling to perform card-to-card and card-to-account transfers through Ameriabank’s website from any bank’s MasterCard, Visa or ArCa card to Ameriabank cards and accounts
2014 – 2015
Sustained the position of the leading bank in the Armenian economy by crossing the threshold of USD 1 bln in assets for the first time in the history of the Armenian banking sector.
Awards & Certificates► In 2015, Fitch Ratings reconfirmed Ameriabank’s
foreign currency Long-Term Issuer Default Rating at “B+” (with Negative Outlook). The Bank’s IDRs were driven by its “B+” Viability Rating. Ameriabank became the first Armenian company to receive a rating equal to that of the country sovereign rating – which is the best indicator used in the international practice to assess a company rating.
► The Best Bank in Armenia by factoring transactions based on FY 2013 by International Corporate Intl Magazine 2014 Global Awards.
► “Deal of the Year 2013” by EBRD for the deal between Ameriabank and Commerzbank guaranteed by EBRD.
TOPTOPCONTENTS CONTENTS

16 17
Financial Deals► Signed the 80th trade finance deal under the
EBRD Trade Facilitation Program.
► Upgraded the Bank’s portfolio through the purchase of a new credit portfolio from Norvik Universal Credit Organization.
► OPEC fund for International Development (OFID): USD 20 mln loan agreement for SME financing.
► FMO and OeEB: USD 25 mln syndicated loan agreement for SME, renewable energy and energy efficiency projects financing in Armenia.
► FMO: USD 20 mln convertible subordinated debt facility agreement in 2014. For the first time in Armenia a local bank attracted convertible subordinated loan from an international financial institution.
► IFC: USD 50 mln subordinated loan agreement was signed in 2015.
► EBRD: USD 40 mln investment and Ameriabank equity stake acquisition was made in 2015; at the first stage EBRD invested USD 30 mln to acquire a 20.7% share, while the remaining USD 10 mln will be used for further top-up of capital.
► Signed an agreement with Irish CR2 on introduction of BankWorld omni-channel remote banking platform – the first project of CR2 in Armenia.
► Launched new banking service in Armenia – Ameria TV Banking jointly with UCom fiber-optic network provider.
► In the scope of queue management initiatives payment and cash-in terminals were installed in key locations of Yerevan and main branches of Ameriabank. Queue management software was introduced in several branches as a pilot project.
► Introduced and upgraded several tools aimed at automation of bank operations and service improvement, such as:
► Customer identification system for Phone banking, ArCa, TV banking via SMS passwords,
► MobileDigipass app for Blackberry to generate one-time passwords for online banking and mobile banking. Later the new MobileDigipass for iPhone/iPad was introduced.
BUSINESS REVIEWHISTORIC MILESTONES
2016-2017
Sustained the position of the leading bank of the Armenian banking sector by all five main financial indicators.
Awards & Certificates
► Fitch Ratings revised the Outlook on Ameriabank’s Long-Term Issuer Default Rating to Stable from Negative, while affirming the IDR at “B+”, reflecting Fitch’s expectation for the Bank’s leading position in the market and resilience to the challenges and pressures of the external environment.
► STP Award by Commerzbank for excellence in processing international transactions based on 2015 results.
► “Deal of the Year - Energy Efficiency” by EBRD for improving the energy efficiency of greenhouse infrastructure in Armenia during 2015.
► “Gold Award: Environmental & Social Innovation 2017” for Green TFP from EBRD.
► Bank of the Year Europe Banking Awards 2015 by EMEA Finance magazine.
► Best Foreign Exchange Provider in Armenia (2016, 2017), Best Securities Services provider (2016, 2017), Best Foreign Exchange provider (2016, 2017), Best Investment Bank in Armenia (2016, 2017) Best Bank in Armenia (2016, 2017) by Global Finance magazine.
► Euromoney 2016 and 2017 Awards for Excellence.
► Bank of the Year 2016 and 2017 in Armenia by The Banker magazine of Financial Times.
► Ameriabank was awarded Citibank STP Award 2015 and STP Award 2016 for excellence in processing international transactions.
Infrastructure & Innovation
► Opened a branch in the second largest city of Armenia-Gyumri (Kumayri branch).
► Expanded its network of extended working schedule branches, opening two more in Yerevan (Yeritasardakan branch in Metronome shopping center and Kochar branch in RIO mall entertainment center).
► Opened five express banking 24/7 self-service points in Yerevan.
► Expanded the range of services provided via phone banking to include loan component as well.
► Signed a memorandum with Golden State Bank, US, providing the entities from United States access to Ameriabank services via Golden State Bank’s referral and vice versa.
► Improved card payment vPOS module enabling customers to register their card once and make payments without having to enter the same data each time.
► Started and expanded cooperation with Ministry of Justice within the framework of United Office for Public Services Provision.
► Became the mutual settlement bank from Armenia for integration of Armenian and Russian national payment systems. Integrated with “MIR” Russian payment system and issued “ArCa-Mir” cards to be serviced both in Russia through MIR system and in Armenia through ArCa system.
BUSINESS REVIEW
TOPTOPCONTENTS CONTENTS

18 19
► Placed USD 20 mln debt securities with four Luxembourg-based funds via its new international partner - investment manager responsAbility Investments AG, with its proceeds channeled into SME lending and renewable energy financing.
► Signed USD 30 mln loan agreement aimed at Retail and young entrepreneurs’ SME financing with FMO.
Corporate Social Responsibility
Ameriabank is proud of its successful track record of balancing the interests of its stakeholders, including shareholders, clients, employees and the communities, in which it operates.
The Bank has nourished integrity, trust, and highly ethical behavior as the main foundation of its business conduct. The uncompromised dedication to these values has allowed the Bank to prudently serve individuals as well as businesses of all sizes and win their mutual trust and loyalty. The financial strength of the Bank ensures the fulfillment of its main responsibility for keeping its clients’ financial assets safe. The Bank has become an economic driver for Armenia as the leading financial company in the country.
In 2017 Ameriabank continued to demonstrate its responsible approach towards addressing the social problems of the community via sustainable and sound corporate social responsibility (CSR) activities that extended beyond its business practices to sharing professional knowledge with the younger generation and the business community, financing educational programs, supporting children’s healthcare and welfare, as well as undertaking community development initiatives.
In Ameriabank the decisions regarding the selection of Corporate Social Responsibility partners and projects are taken by a dedicated collegial body - Corporate Social Responsibility Committee. The committee, consisting of 7 members from 7 different departments in the Bank, ensures that CSR decisions are well-grounded and holistic.
► Introduced new “Drops” system for scheduling and automatic write off of payments by small amounts, thus making the burden of one-time large utility bills, loan repayments and other payments lighter.
Financial Deals
► Signed the 100th trade finance deal under the EBRD Trade Facilitation Program.
► Signed a credit line agreement of USD 10 mln within the framework of Women in Business program aimed to support female entrepreneurship with EBRD
► Signed USD 20 mln loan agreement aimed at SME financing with DEG.
► Signed USD 20 mln loan agreement aimed at SME, energy efficiency, renewable energy, health and education project financing with Proparco.
► Signed USD 30 mln unsecured loan agreement aimed at financing renewable energy and energy efficiency projects with Global Climate Partnership Fund (GCPF).
BUSINESS REVIEWHISTORIC MILESTONES
BUSINESS REVIEWGLOBAL PARTNERS
The cooperation with the European Bank for Reconstruction and Development (EBRD) started in 2010 when EBRD provided USD 10 mln line of credit to Ameriabank for SME financing. The same year the permanent and prolific cooperation began in Trade finance when EBRD provided the Bank a credit limit of USD 2 mln with the purpose of trade finance development, which currently amounts to USD 52 mln.
In 2016 The Bank signed its 100th trade finance deal covered by the Trade Facilitation Program of the EBRD. The same year Ameriabank became the first financial institution in Armenia to join EBRD’s Women in Business (WiB) program, aimed to support female entrepreneurship. The credit line agreement totaling USD 10 mln equivalent in local currency was signed in December 2016.
As a result of the successful partnership in trade finance EBRD has granted various awards to the Bank for many years on. Among such awards are the Most Active Issuer in Armenia, the Deal of the Year for financing the building of the new generation fiber-optic network in Armenia (2013), Deal of the year – Energy Efficiency for the greenhouse energy efficiency improvement project (2015). Ameriabank
also became the first bank in Armenia to receive a confirming bank status under the Trade Facilitation Program (TFP) by EBRD.
In December 2015, EBRD signed its largest single ticket equity deal in the region with up to USD 40 mln contractual amount (of which 30 mln is already disbursed). EBRD acquired a stake of around 20.7%. The goal of the investment was to strengthen Ameriabank and prepare the Bank for a future IPO. In the course of 2016 a non-executive member joined Ameriabank’s Board of Directors representing EBRD.
Asian Development Bank (ADB) and Ameriabank commenced their cooperation in 2011 having signed agreements, which allowed both to attract funds and to support trade finance transactions promoting sustainable growth of the local businesses. In 2011, a credit facility of USD 20 mln was provided to the Bank aimed to support SME development in the country. As a result of successful cooperation in trade finance, in 2017, the limit for trade finance reached USD 27 mln.
In August 2017, the ADB Board approved USD 60 mln debt and equity package for Ameriabank. In fact, the first equity deal in the region with USD 30 mln participation in Ameriabank. As a result, in February 2018 ADB acquired 13.98% stake in the Bank. The purpose of the investment package was to support Ameriabank en route to its IPO. It is expected that a new non-executive member on behalf of ADB will be joining Ameriabank’s Board of Directors in the course of 2018.
TOPTOPCONTENTS CONTENTS

20 21
Ameriabank started its cooperation with International Finance Corporation (IFC), a member of the World Bank Group, in 2009, expanding its financing to the renewable energy sector: a USD 15 mln loan was provided to the Bank to finance small hydropower plants funding programs in the country. The cooperation also included trade finance transactions, which had its contribution to the process of Ameriabank becoming the leading trade financier in the country. By and large, this cooperation also impacted the development of trade finance instruments in Armenia. Thanks to increasing mutual trust and strong cooperation, IFC extended the credit limit in trade finance provided to Ameriabank up to USD 40 mln to foster international trade.
The Most Active GTFP Issuing Bank in the Caucasus award in 2011 and The Best GTFP Issuing Bank for Energy Efficiency in Europe and Central Asia in 2012 are the best evidence of successful and fruitful cooperation between the Bank and IFC. Moreover, these are the first awards that IFC granted to a bank in South Caucasus.
In 2014 IFC provided USD 9 mln loan on its own account and also mobilized another USD 9 mln loan from DEG for the construction of the first green business center in Armenia, implemented by Property Development Company. The total value of the project is about USD 37 mln, the rest of the investment being provided by the company itself.
In December 2015, IFC provided USD 50 mln subordinated loan to Ameriabank, to support its capital and boost its capacity to lend to local enterprises, expanding access to finance and helping drive economic growth and job creation.
By providing long-term capital support, IFC has aimed to increase the stability of Armenia’s banking sector and support the strategic goals of Ameriabank. Considering the quality of Ameriabank’s corporate governance, coupled with its solid growth, IFC’s USD 50 mln subordinated loan will help the bank grow and prepare for an initial public offering.
Ameriabank started cooperation with The Netherlands Development Finance Company (FMO) in 2009 by signing a USD 30 mln loan facility agreement. The aim of this cooperation was to finance local SMEs and renewable energy programs. As a result, Ameriabank expanded its opportunities in the renewable energy and SME financing sectors.
In 2010, Ameriabank with the support of FMO and DEG successfully completed the introduction and implementation of an Environmental and Social Management System (ESMS). Ameriabank was one of the pioneers in the region to have developed and implemented ESMS. As a result of this, FMO and DEG awarded Ameriabank a certificate of appreciation, as well as a reduction in the interest rate of the facility signed between FMO, DEG and Ameriabank in December 2009.
BUSINESS REVIEWGLOBAL PARTNERS
BUSINESS REVIEW
In 2013, Proparco, the private sector financing arm of Agence Française de Développement (AFD), and Ameriabank signed a USD 15 mln credit facility agreement. The transaction was Proparco’s first investment in Armenia and the second one in the South Caucasus aimed at opening new long-term financing opportunities for SMEs involved in agribusiness and the food processing industry.
Ameriabank’s steady position in the banking sector stimulated the signing of the second USD 20 mln loan agreement in 2016. The new facility was aimed at SME, energy efficiency, renewable energy, health and education project financing.
The Bank started its cooperation with Deutsche Investitions und Entwicklungsgesellschaft mbH (DEG) in 2009, when a joint Term Facility Agreement was signed together with FMO. Since then the cooperation developed into the level of strategic partnership, when the second round of USD 20 mln bilateral loan agreement was signed with DEG in November 2012. The eight-year loan facility was designated to foster SME financing in Armenia. This cooperation was in line with the Bank’s strategy where SME financing is at the forefront of the Bank’s lending policy. Moreover, in May 2016 Ameriabank reaffirmed its strategic focus on SME segment, by signing another USD 20 mln loan agreement with DEG.
In 2014, Ameriabank and FMO signed a USD 20 mln convertible subordinated debt facility agreement. For the first time since the formation of the banking system of the RA a convertible subordinate debt agreement has been signed between an International Financial Institution (IFI) and an Armenian bank which symbolized the growth of trust of international investors towards the Armenian banking sector.
In 2017, the Bank signed another senior debt facility for USD 30 mln targeting youth financing and SME.
TOPTOPCONTENTS CONTENTS

22 23
In 2013, the Austrian Development Bank (OeEB) and Ameriabank signed a USD 15 mln loan agreement for a term of 8 years. In 2015, a USD 25 mln syndicated loan facility agreement was signed with FMO, OeEB and Ameriabank. In both cases, the loans were directed at financing of SMEs, renewable energy and energy efficiency projects in Armenia.
In 2016, Ameriabank strengthened its reputation in international capital markets by placing USD 20 mln debt securities with four Luxembourg-based funds via its investment manager responsAbility Investments AG. The proceeds from security placement were channeled into SME financing renewable energy and energy efficiency projects in Armenia.
In 2010, as a result of successful cooperation with Eurasian Development Bank (EDB), the Bank received USD 30 mln loan facility for SME financing in Armenia.
BUSINESS REVIEWGLOBAL PARTNERS
BUSINESS REVIEW
In June 2015, Ameriabank and the OPEC Fund for International Development (OFID) signed a USD 20 mln loan agreement. This long-term facility was dedicated to SME financing in Armenia.
Cooperation with Black Sea Trade and Development Bank (BSTDB) commenced in 2014, when USD 10 mln loan was issued to Ameriabank for a term of 6 years under the mandate agreement. The project aimed to facilitate the Bank’s SME financing programs.
The list of global partners was updated with another esteemed lender, such as Global Climate Partnership Fund (GCPF), with whom Ameriabank signed USD 30 mln unsecured loan agreement in December 2016. The facility will be aimed at financing renewable energy and energy efficiency projects.
TOPTOPCONTENTS CONTENTS
24 25
Since 2010 Ameriabank has been granted the Award for Excellence by Euromoney (2017, 2016,
2014, 2012, 2011) and The Banker magazine of the Financial Times Group (2017, 2016, 2015, 2013, 2010). Since 2012 for six consecutive years Ameriabank has received awards in several key nominations by Global Finance, among them The Best Foreign Exchange Provider in Armenia, The Best Trade Finance Bank in Armenia, The Best Securities Services Provider Bank in Armenia, The Best Investment Bank in Armenia and Тhe Best Bank in Armenia. In 2017 for the second consecutive year Ameriabank was triple awarded the Best Bank by Euromoney, Global Finance and The Banker magazines. Moreover, this was the sixth consecutive year for Ameriabank to be awarded the Best Bank and the second consecutive year as the Best Investment Bank in Armenia by Global Finance, given the fact that this award is awarded for banks in Armenia for the second time in general.
This consistency in recognition by international publications and partners was also maintained in specific areas of business. Ameriabank won Citibank STP Award 2015 and STP Award 2016 for excellence in processing international transactions. Citibank grants the award to its best partner banks worldwide in recognition of high performance in international transactions both quantity and quality-wise. Ameriabank received “The Best Investment Bank in Armenia in 2017” award by Cbonds leading financial news agency. Ameriabank was also recognized as the leading bonds issuer bank in Armenia by Cbonds based on the results of 2016 as the Arrangers’ league table for domestic bonds of Caucasus was published. During the 2017 EBRD Annual meeting Ameriabank received “2017 Environmental & Social Innovation Gold Award”.
BUSINESS REVIEWAWARDS
Fivefold winner ofThe Best Bank award
Fivefold winner ofAward for Excellence
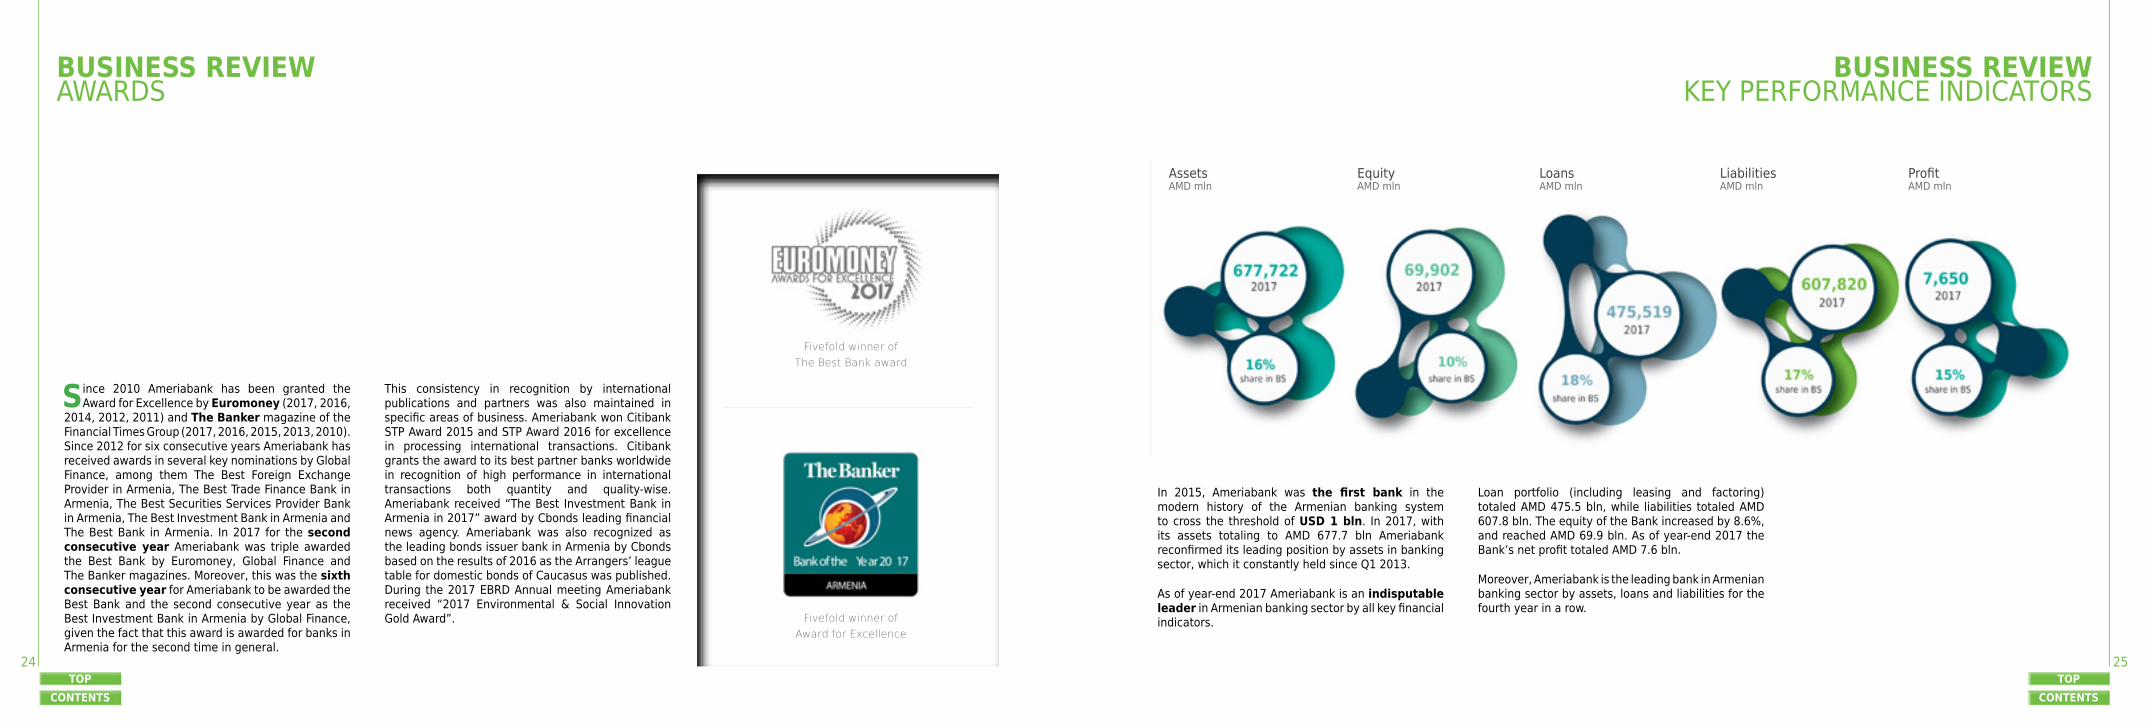
In 2015, Ameriabank was the first bank in the modern history of the Armenian banking system to cross the threshold of USD 1 bln. In 2017, with its assets totaling to AMD 677.7 bln Ameriabank reconfirmed its leading position by assets in banking sector, which it constantly held since Q1 2013.
As of year-end 2017 Ameriabank is an indisputable leader in Armenian banking sector by all key financial indicators.
Loan portfolio (including leasing and factoring) totaled AMD 475.5 bln, while liabilities totaled AMD 607.8 bln. The equity of the Bank increased by 8.6%, and reached AMD 69.9 bln. As of year-end 2017 the Bank’s net profit totaled AMD 7.6 bln.
Moreover, Ameriabank is the leading bank in Armenian banking sector by assets, loans and liabilities for the fourth year in a row.
BUSINESS REVIEWKEY PERFORMANCE INDICATORS
Assets AMD mln
Equity AMD mln
Loans AMD mln
Liabilities AMD mln
Profit AMD mln
TOPTOPCONTENTS CONTENTS

26 27
BUSINESS REVIEWDEVELOPMENT OF TECHNOLOGIES AND INFRASTRUCTURE
Development of Technologies
Ameriabank is constantly working towards advancing in its client service and providing comfort to its clients. Innovation is and has always been firmly anchored in the mission of the Bank as a driving force for development. The Bank sees its clients as partners and is striving to offer them innovative, all-embracing and high quality financial solutions. This refers to both individuals and businesses both in local and regional markets. The Bank continuously invests in financial R&D aiming to ease the processing of banking operations, to optimize and further personalize user-experience through distance banking services, in particular through digital banking, and to match the complexity of clients’ needs with tailor-made financing solutions, namely; developing special offers for employees of specific sectors of economy, providing rewards for referrals, special rates for loans for purchasing energy efficient technology etc.
While implementing innovative policies, Ameriabank promotes the following principles:
► Innovation policy aligned with the strategic goals, ongoing development and progress of the Bank.
► Orientation towards the best international practices, constant upgrading of technologies and implementation of modern banking solutions.
► Client-oriented approach and state-of-the-art banking solutions tailored to client needs.
The synergy of these principles in the technological development expeditiously spurred the Bank into a leading position in the Armenian banking system. Currently Ameriabank is a major financial institution standing by its clients as a reliable partner ready to face and overcome new challenges, keep the pace of trends and developments of international market, contriving innovative solutions and implementing cutting-edge technologies.
Customer Experience Improvements
Keeping abreast of modern banking technologies, Ameriabank is striving to provide the most up-to-date solutions to its clients. In 2017, Ameriabank implemented a series of internal and external improvements in order to make the Bank’s services and core non-banking services more accessible, secure and comfortable to use.
Following its principle of being accessible anywhere anytime, Ameriabank expanded its network of payment terminals and ATMs with cash-out, cash-in and other payment and information inquiry functionalities (for more details see Geographical Footprint). The Bank expanded its cooperation with the United Office for Public Services program of Ministry of Justice, within the framework of which clients can get centralized state services (e.g. receiving references regarding state registration of real estate ownership rights and legal entities, etc.) directly at Ameriabank’s branch.
On its path to digitalization the Bank also further expanded its distance banking channels. In order to provide fast and convenient transactions Ameria Online/Mobile banking was further developed to include new services as well as 24/7 automatic processing of a number of payments. Mobile queue management system was launched in cooperation with the developing company, to provide hassle-free registration and quick service avoiding any queues. Moreover, in order to enable the clients to easily make online transactions during travel without necessarily activating roaming service or having access to their mobile device, 3D secure system integration was further enhanced. As a result while making online
transactions the Bank’s clients currently receive their secure codes not only on their mobile device, but also on their e-mail address.
In order to improve customer experience, Ameriabank continuously expands the scope of services provided via the Contact Center. In 2017, this list broadened to include also the lending component. One of the main challenges for 2017 was implementing a new pre-approved loan concept, which assumed developing individual offers for clients and delivering them a new level of lending experience. Finally, as one of its major focus areas, Ameriabank is currently at the final stage of full-scale preparation for the launch of CR2 BankWorld omni-channel banking platform. This innovative system will not only move the clients’ digital banking experience to a new level, but also activate new-to-market financial solutions.
Ameriabank is constantly making steps towards its digital transformation. As a result of developments and changes in the habits of the Bank’s clients in 2017 the number of Internet/Mobile banking users grew by 33% and the transactions through internet/mobile banking grew by 77%. The number of total transactions through digital channels (including ATMs, Express banking self-service spots and terminals)
grew by 32%. The share of transactions through digital banking channels in overall transactions constituted 68% and shows positive trends, Whereas the share of other channels (in-branch transactions, back-office proceeded transactions and phone banking) decreased by 7%, which distinctively showed the readiness of Ameriabank’s clients to go digital with the Bank.
Financial Solutions
Ameriabank also works towards designing tailor-made financial solutions, which will best meet the needs and expectations of specific client segments, thus the Bank marketed several new products. Namely, in order to diminish the load of payments “Drops” payment system was launched in cooperation with the developing company.
“Refer a friend” referral program was extended to include brokerage services, so that anyone can offer other people to use Ameriabank’s brokerage services and get rewards for each successful referral.
In 2016, in cooperation with Best Card LLC, Ameriabank introduced its “AYO” cashback program, which was further expanded in 2017 to include loan component, thus allowing the clients to not only get cashback rewards but also to have a credit line available on their Visa AYO Classic and Visa AYO Gold cards. Within the framework of the program up to 20% cashback is provided to all cardholders (except Business Card and Gift Card holders) of the Bank while making payments at a broad range of partner companies. Currently, the additional loan component enables the clients to enjoy the benefits of hassle-free shopping experience.
BUSINESS REVIEW
TOPTOPCONTENTS CONTENTS

28 29
In order to expand the geography of ArCa card and provide additional comfort to its clients traveling to or having business or personal ties with Russia, Ameriabank introduced its ArCa-MIR Card integrated with Russian MIR payment system. Thus, Ameriabank’s ArCa cardholders can use their card not only in Armenia but also in Russia and other countries that have implemented MIR payment system.
Moreover, in order to provide tailored solutions to its clients, Ameriabank introduced its new risk-based individual loan campaigns for mortgage and SME loans. According to the campaign loan conditions are offered individually to each client based on his/her loan period, collateral and revenue.
Special product was developed for women entrepreneurs in cooperation with EBRD within its “Women in Business” program.
Geographical Footprint
In 2017, the Bank opened two branches: Kumayri branch in the second largest city of Armenia Gyumri as well as another branch with extended servicing schedule Kochar branch in RIO Mall entertainment
center. The Bank’s geography covers major metropolitan areas of the country, namely; Vanadzor (Lori region), Dilijan (Tavush region), Kajaran (Syunik region), Kapan (Syunik region), Gyumri (Shirak region) and the most dynamic districts of Yerevan (the head office, and 8 branches in Yerevan). The operations of all branches and the head office are synchronized with a unified software infrastructure that allows Ameriabank’s clients to bank at any branch, irrespective of where the account was initially opened.
Along with the expansion of the branch network, Ameriabank is also committed to enhancing and optimizing the ATM and POS chain aiming to provide better comfort for distance banking services to its clients. Hence, during 2017 Ameriabank opened three more Express Banking self-service corners. The geography of these corners was also expanded towards the new point where Ameriabank opened its branch to include Gyumri - the second largest city of Armenia. As of year-end 2017 the Bank had 122 ATMs, 1,619 POS terminals, 255 virtual POS terminals and 39 POS Cash terminals installed.
BUSINESS REVIEWDEVELOPMENT OF TECHNOLOGIES AND INFRASTRUCTURE
BUSINESS REVIEW
TOPTOPCONTENTS CONTENTS

30 31
Focuson vision, zooming out to the environment and zooming in to core values and goals
STRATEGIC REPORTEXTERNAL ENVIRONMENT
Macroeconomic prerequisites
During 2017 the banking system of Armenia was operating in a macroeconomic environment characterized by significant recovery economic growth after the slowdown in 2016 conditioned by negative regional impact due to the fragile economic situation in Russia and the slowdown of emerging economies since 2014. After a sharp decline in 2009 the economy was characterized by a period of moderate recovery during the period of 2010 to 2015 with an average annual growth of 4.0% and a slowdown of 0.2% in 2016. However, with a 7.5% surge in GDP, the economic growth in 2017 is clearly the highest rate the Armenian economy has witnessed within the last 10 years. This level of growth is also the highest compared to other countries in the region as well as in the Eurasian Economic Union (EEU).
The factors that might have had an impact on creating a positive economic climate in Armenia include: slow growth in the global economy during the period of 2015-2016, especially in emerging countries (Russia in particular); low prices for most of the commodities; the geopolitical situation in the region. These trends had changed in 2017. With the slow increase of oil prices in global markets, the Russian economy started to grow again, resulting in a significant recovery of remittances to Armenia, and hence the reactivation of foreign trade as a result. However, foreign direct investments to Armenia still remain very low.
The development of the economy of Armenia
depends majorly on the economic situation in Russia, as Armenia’s main trade partner country. Armenia joined EEU in January 2015, which made its ties with the Russian economy even stronger. Particularly, Armenia, as an EEU member, receives a fixed share of total customs duties in the Union and other benefits. After a significant decrease registered in 2015-2016 Imports and Exports in EEU countries started to grow in 2017. The level of private remittances from Russia to Armenia also decreased during 2014-2016, resulting in total 33.4% decline compared to 2013 (7.8% in 2014, 23.2% in 2015 and 6.1% in 2016), however in 2017 the changing trend with 18.7% growth came to recover around half of the decline registered during previous 3 years.
Economic developments in Armenia during 2017 continued with relatively narrow current account balance deficit, stable exchange rates and consumer prices. The country is expected to witness moderate economic growth during upcoming 2-3 years. According to the forecasts of international organizations (IMF (2.9%), WB (3.1%), EBRD (3.5%)) economic growth for 2018 is expected at 2.9-3.5%.
The consumer price index in 2017 (December to December) was 102.6%, which was within the targeted inflation rate of 4.0% (± 1.5%) by the CBA. During the previous 2 years deflation was registered in Armenia. At the same time, the average annual inflation was at 1.0%. This was the lowest annual average price change indicator in last 12 years,
except for the deflation registered in 2016. Low inflation was mainly conditioned by comparatively steady prices for almost all groups of products during the year. Some increase in prices of food products, fuel and air transport services were evidenced in the second part of the year, while AMD/USD exchange rate remained stable. CPI is expected to remain comparatively steady, i.e. to be within the range of targeted inflation rate in 2018.
The nominal GDP in 2017 equals AMD 5.58 trn – the highest ever level in the history. The 2017 GDP in real terms exceeds the pre-recession level of GDP (2008) by 17.2%. However, the nominal USD-denominated GDP still lags behind the pre-recession level. The nominal USD-denominated GDP in 2017 comprised USD 11.56 bln, which is higher than 2015-2016 GDP, but lower than 2014 GDP by 0.4%. This was due to 15.0% depreciation of AMD against USD that in turn was conditioned by exchange rate fluctuations registered in December 2014.
Acceleration of economic growth in 2017 was mainly conditioned by increase in main sectors such as trade (16.4% growth, with contribution to GDP growth of 1.7 pp instead of 0.1 pp contribution in 2016) and manufacturing (11.7% growth, with 1.1 pp contribution to GDP growth instead of 0.5 pp contribution in 2016). Three other sectors also had large contribution to 2017 GDP growth: net taxes on products (1.0 pp contribution instead of -0.5 pp in 2016), finance and insurance (1.0 pp contribution
TOPCONTENTS

32 33
Share of sectors in GDP
Gross Domestic Product (GDP)
STRATEGIC REPORTEXTERNAL ENVIRONMENT
STRATEGIC REPORT
Exchange & CPIAMD/USD Exchange rate
Foreign Trade BalanceUSD mln
Import and Export (of goods)USD mln
TOPTOPCONTENTS CONTENTS

34 35
instead of 0.1 pp in 2016) and arts, entertainment and recreation services (0.9 pp contribution instead of 1.1 pp in 2016). High economic growth is recorded even with continuous decline in agriculture - 4.0% decline in 2017 and 5.8% decline in 2016, with -0.6 pp and -1.0 pp contribution to GDP growth. It is worth to mention that in 2017 construction sector started to grow finally after continuous decline during previous 5 years. Among other service sectors, impressive growth is registered in transportation and storage (17.2%), accommodation and food service (24.7%) and IT services (over 27%).
Furthermore, the economy seems to change its lead sector. Being the leader up to 2015 (following the construction sector in 2008 and with an average annual growth of 7.2% during 2011-2015) agriculture continued to decrease in 2017 as well (-4.0%) after a decline in 2016 (-5.8%). The decrease was conditioned by decline in plant growing subsector, mainly due to less favorable climate conditions and adjustments based on 2014 Agriculture census. At the same time animal husbandry and aquaculture subsectors kept growing. Nevertheless, it continued to be the largest sector by share in GDP in 2017 as well (14.7%); the share started to decrease since 2013 (18.4%). Indeed, in 2017 a number of programs were implemented to boost the sector growth: State
subsidy policy in the agricultural sector was revised; a number of new programs of State support were launched; efforts have been exerted to promote the export of agricultural products; pilot programs were initiated aimed at partial subsidization of interest rates for the lease of farm machinery etc. It is expected that the sector will return to its growth pattern within the next years: programs for 2018 are already planned and developed. The 2018 State programs will mostly be aimed at developing the livestock sector and fodder production. EEU membership along with existence of agricultural product import embargo from the Western countries to Russia have facilitated and are to further facilitate the export of Armenian agricultural products to Russia which is accordingly expected to contribute to agriculture in Armenia.
Another former top sector construction (leader before 2008) started the year not at the most positive note. With the first two quarters’ results the sector could have been classified among the ones that were slowing the country’s 2017 GDP growth (in line with Agriculture). Yet starting from 3Q 2017 this picture started to change, and, by annual results, the sector registered 3.1% growth vs a 4-year consequent decline. The growth was mainly driven by construction financed by international loan projects, however population financed construction also contributed to
the overall growth pattern.
The financial and insurance services’ sector, one of the main contributors to the country’s economic growth during the reporting year, was the most rapidly growing sector in GDP for 2011-2014. However, after two-digit average growth in 2010-2014, the sector faced 7.2% decline in 2015 mainly explained by the slowdown of economic developments in the region along with 2014 year-end increasing risks of national currency depreciation. The sector registered recovery growth of 3.2% in 2016. This growth pursued with accelerating trends in 2017, registering 24.7% increase.
The increase in the two main contributors to 2017 growth – manufacturing and trade, can to some extent be explained with the growth in external trade volume. Almost half of the 11.7% growth in manufacturing was contributed by growth in 2 subsectors: beverage production and tobacco production, which also had their direct impact on the growth of exports.
The growth trend started in 2016 in the country’s external trade (after the quite tangible contraction experienced in 2015, due to worsened trade conditions affected by the slowdown of Russia’s GDP
STRATEGIC REPORTEXTERNAL ENVIRONMENT
STRATEGIC REPORT
growth, drop of metal prices as well as depreciation of regional currencies against USD and AMD) was maintained in 2017 as well. Both exports and imports registered double digit growth for more than 25.0%. According to 2017 results export increased by 25.2% compared to the previous year maintaining the double digit growth. Imports continued to recover starting from 2016, registering a 27.8% increase in 2017. Nevertheless, despite recording over 20.0% increase in both exports and imports, trade deficit in 2017 registered some increase against the same period last year. In 2017 the current account deficit increased to 3.5% of GDP (vs 2.3% in 2016), which is still much lower compared to 2008-2014 figures (11.4% on average).
In 2017, the external public debt of Armenia amounted to 47.5% of the GDP vs 45.5% in 2016. The total amount of external public debt as of year-end 2017 was USD 5,495 mln, up by 14.3% vs a year earlier. Government debt constituted 89.1% of the total external public (vs 89.5% in YE2016) and the rest 10.9% (vs 10.5%) – the CBA. Even with the growth of debt in 2017, the country’s external debt-to-GDP ratio is not considered to be under high risk category according to international organizations. Nevertheless, the RA government plans to cut the country’s external public debt by 2.0% in 2018.
During 2017, the official foreign currency reserves increased by 5.0% comprising USD 2.3 bln vs a 24.0% increase of a year earlier (USD 2.2 bln).
In 2017, Armenia continued active economic cooperation with international institutions and allocation of funds raised from WB, IMF, ADB, and EU. In particular, during 2017 the World Bank’s portfolio had over 20 projects in active implementation. The projects were implemented across many sectors including roads, energy, agriculture, education, health, irrigation, rural development, public administration and judiciary. The country operations business plan (COBP) for 2017–2019 developed by the Asian Development Bank (ADB) for Armenia is aligned with the Armenian Government’s Development Strategy for 2014–2025. The COBP is consistent with the strategic priorities set out in ADB’s Midterm Review of Strategy 2020, and is in line with the main directions and strategic priorities outlined in ADB’s country partnership strategy (CPS) for Armenia for 2014–2018. EBRD strategy in Armenia focuses on the following strategic orientations: enhancing private sector competitiveness by strengthening capacity, increasing corporate transparency and improving the business environment, developing capital markets and promoting local currency financing, developing sustainable and commercialized public utilities.
Over the past few years Armenia has taken steps towards improving the investment and business climate in the country. As stated in “Doing Business 2018” report by the World Bank Group, Armenia ranked 47th out of 190 countries. Even with decrease in ranking position, the country registered slight improvement in “Distance to Frontier” indicator (72.51 vs 71.92 in “Doing Business 2017”), which measures the distance from best performance observed. The country registered an increase of 6 positions in World Economic Forum’s “Competitiveness index 2017-2018” - 73rd vs 79th by the same index of 2016-2017. According to Heritage Foundation’s “Economic Freedom Index 2018” the country ranked the 44th in the world and 20th among countries in the region.
Positive trends in real sector FDI are noticed in 2017. Net inflow of FDI in real sector comprised USD 193 mln, which is higher than in previous 2 years, but still much lower compared to 2008-2014.
TOPTOPCONTENTS CONTENTS
36 37
The financial sector of Armenia continued to grow during 2017 and reported growth in key indicators. Even though this year’s growth was less pronounced than the one of the previous year, the banking system’s assets registered an increase of almost 9%, and loans of 4.9%. Growth came notably from other financial service players in the sector, namely credit organizations’ assets grew by 21%, loans by 15%. Similarly insurance companies and other financial system players demonstrated growth. Aggregate pension funds grew by around 70% totaling 105 billion AMD or 2% of GDP.
Remarkable events and trends of 2017; key challenges
► The new statutory capital standard came into force on January 1, 2017, whereby banks are required to secure an AMD 30 bln minimum capital instead of the former AMD 5 bln. During the 2-year window allotted by the Central Bank most banks were able to raise new equity – either through additional investment from their current investors or through attracting new ones.
► Several banks, on the other hand, chose to merge or consolidate – another way to deal with the increased capital challenge.
As a result, during the last two years the total number of commercial banks decreased from 21 to 17.
► Meanwhile, despite the high liquidity of banking sector in general, increased competition among banks and growth of financial outreach revealed the need to continue the processes of capitalization:
► Certain banks are still facing the challenge of maintaining statutory capital on the required level.
► Nevertheless, even with sufficient statutory capital banks are not always able to expand their businesses maintaining the required level of CAR (CAR of Armenian banks decreased in 2017 from 19.95% to 18.57%, required minimum standard being 12%).
► At the same time, tough competition, struggle for clients and the need of economy for credit resources (especially among major industrial players) make the banks to increase the volume of financial intermediation, which, for a number of sector players, proves to be difficult without further capitalization.
► Another key challenge for the banking sector is high level of dollarization in line with the need for resources in local currency:
► Though dollarization in Armenia grew drastically after the devaluation in 1999 –
from 40% to 75%, the currency shock at the end of 2014, shifted the indicator towards the AMD component,
► At the end of 2016 the ratio of USD-denominated deposits to those in AMD was 65% to 35%, in 2017 – 60% to 40%.
This increases the banks’ ability to lend in local currency.
► A new focus in Armenian banking system development is upgrading and digitalization of bank products and internal operations. Growth of competition and rapid penetration of digital technologies into all sectors of economy worldwide have eventually driven Armenian players to review and modernize their businesses, too.
► Many banks started to more actively cooperate with IT companies to speed up the process of digitalization of banking services.
► Larger outreach, increase in client-base require the banks to reorganize their data management system - big data management solutions.
► One of the new trends among banks is going online which, in line with the change
STRATEGIC REPORTBANKING SECTOR IN ARMENIA
STRATEGIC REPORT
in customers’ mentality is to gradually decrease the need for banks’ physical presence.
Currently banks’ efforts are directed to technological transformation of their businesses, optimization, cost-cutting and attraction of quality borrowers.
► In 2017, banks started to actively raise funds through bond issuance on local market:
► Over a year the volume of issued securities was more than doubled reaching AMD 155 bln.
► This resulted in corporate bond boom on NASDAQ OMX Armenia: the highest volume of corporate bond trade since 2003.
► The record-high volume of trade in corporate bonds – AMD 11 bln was mostly resulted by statutory benefits offered to banks by the Central Bank.
Overall, issuance activities on Armenian corporate bonds market over the last 2 years were high, most issuers being local banks and several credit organizations.
► In 2017, the Armenian stock market continued to grow:
► Stock market’s capitalization grew by 7% in 2017 reaching AMD 143 bln.
► Corporate bonds market was highly active registering 83% growth of transactions - trend of the year.
► Government bonds trade registered 20% growth; remarkable boost was seen in repo and swap – 38 times the 2016 indicator.
► In April 2017, the Government bonds platform moved from CBA to NASDAQ OMX. This change can make the Armenian government bonds more visible and accessible for foreign markets.
► An important development on stock market was the online trading system for government bonds. It enables individuals to buy government bonds online, without visiting any agency or office.
In 2018, Armenian stock exchange is expected to implement a crowdfunding platform – a startup platform for beginner entrepreneurs to raise capital. Moreover, the new platform will enable startup businesses to have access to foreign investments.
► In May 2017, Armenian Card (ArCa) national payment system in cooperation with the National Payment Cards System of Russia launched a new
joint card project. Since July 2017, Armenian ArCa cards are being served in Russia’s Mir system and vice versa.
► On July 7 the Central Bank of Armenia registered the Mir cards operator – National Payment Cards System of Russia – as a payment and settlement system.
► Likewise, the Russian regulatory body certified Armenian national payment system as a payment and settlement system in Russia.
► The pilot project for integration of national payment systems of the two countries was completed in August.
Currently these payment cards are accepted as means of payment in both countries. All settlements are performed in national currencies – rubles and drams, through Ameriabank standing as the settlement bank, without converting to dollars or euros as is the case with international payment systems. Currently the Mir-ArCa project is the first and one of a kind system in Eurasian Economic Union.
TOPTOPCONTENTS CONTENTS

38 39
Financial Institutions Operating in Armenia
1 There were 17 commercial banks, however, CBA registration of the M&A deal of one of the banks was still pending at the end of 2016.2 Panarmenian Bank was a development bank. Licensed in 2011, the sole shareholder of the Panarmenian Bank was the Central Bank of Armenia. Later CBA reorganized the bank to secure more flexibility to effectively handle set goals and objectives. In august 2017 Panarmenian Bank was transformed into Panarmenian Investment Fund.
STRATEGIC REPORTBANKING SECTOR IN ARMENIA
STRATEGIC REPORT
Fitch and Moody’s Outlook Armenia
► Fitch forecasted the Armenian banking sector outlook to remain stable in 2018.
► Moody’s Investors Service confirmed Armenia’s long-term issuer rating and the rating of unsecured debt obligations at the level of B1, with Stable forecast saying the B1 issuer rating was supported by the country’s track record of robust economic and financial management through effective fiscal and monetary policies and high debt affordability.
Continuous Growth of Banking Sector in 2017
2017 has been another year of growth for RA banking system: it registered positive change by all the major financial indicators.
During 2017, the sector’s combined capital continued to grow registering 6.1% increase vs a year earlier and reaching AMD 701bln. Thus, with the 2017 results, the indicator’s participation in the country’s GDP comprised 12.6%.
Growth of capital was accompanied by the growth of assets and liabilities by the end of the year. In 2017, assets of the Armenian banks increased by 8.5% to AMD 4.4 trn, while loans jumped by 4.9% to AMD 2.6 trn. As a result, the sector’s combined assets’ share in RA GDP comprised 78.2%, that of
loans – 47.4%.
Banks’ liabilities grew by 9.0% to AMD 3.7 trn, registering a participation in the country’s GDP of 65.6%. Meantime, liabilities to clients increased by 12.4% to AMD 2.6 trn. As already mentioned, in 2017 system players started to actively raise funds from the local capital market through issuing securities, hence, including securities issued by the banks, the growth will comprise 15.1% and the absolute volume - AMD 2.7 trn.
Total profit of the Armenian banking sector in 2017 increased to AMD 38.3 bln vs. AMD 33.0 bln in 2016 registering a growth of 16.2%. In 2017 only 2 banks reported loss compared with the 4 banks of the previous year.
Currently the banking sector has sound liquidity ratios and capital to ensure financial stability. This is also evidenced by regulatory indicators of banks, set by the CBA and showing that all the banks have high potential for financing the economy and accumulating new funds:
► Capital adequacy ratio of the banking system is 18.6% compared to 12% minimum prudential of CBA
► Liquidity ratios are rather high as well: N2.1 – 32.2% vs CBA requirement of 15%, N2.2 – 141.7%. vs CBA requirement of 60%.
Loan Portfolio Quality
NPLs (non-performing loans) remained one of the big challenges facing the Armenian banking sector in 2017 as well. Nevertheless, compared to a year earlier the quality of the overall sector portfolio has started to recover. According to 2017 year-end results, the indicator comprised 5.5% (according to CBA data). Meanwhile, several banks still have very high level of non-performing loans in their loan portfolios.
However, as a result of registered improvement the banks not only managed to suppress further worsening of credit quality, but also to clean up the loan portfolios from past due loans. Among the factors that facilitated this were loss loan write-offs, growth of lending and partial recovery of “bad” loans.
According to CBA the share of foreign capital in the banking sector of Armenia constituted 61.8%. Long-term funds from IFIs to support the Armenian economy and joint projects are another proof of trust and interest in the Armenian banking sector. In 2017 banks continued to attract long-term funds to invest in the development of different sectors of economy.
TOPTOPCONTENTS CONTENTS

40 41
Key Performance Indicators of the Banking sector of Armenia
Liabilities to Clients(incl. securities issued by the Bank)AMD bln
Loans AMD bln
Assets AMD bln
STRATEGIC REPORTBANKING SECTOR IN ARMENIA
STRATEGIC REPORT
Key Performance Indicators of the Banking sector of Armenia
Equity AMD bln
Profit AMD bln
TOPTOPCONTENTS CONTENTS

42 43
Growth Rates of Key Performance Indicators
Qualitative Indicators of the Banking Sector of Armenia
NPL
Assets
ROE
Loans
ROA
Liabilities to Clients (Incl. securities issued by the Bank)
STRATEGIC REPORTBANKING SECTOR IN ARMENIA
STRATEGIC REPORT
Legal Framework
In 2017 a number of laws of the Republic of Armenia were amended, among them the following acts related to finance and banking: Civil Code, RA Law on Currency Regulation and Currency Control, RA Law on Compulsory Enforcement of Court Decrees, RA Civil Procedure Code and a newly elaborated CBA Regulation 8/06 on mode of application and procedural requirements of business rules of communication with guarantors.
The Following Clauses were amended:
► Civil Code of Armenia: article 372 dedicated to the maximum amount of penalties and its deduction. Due to the amendments, the legislator has limited the maximum amount of penalties that can be applied up to the fourfold of the CBA settlement rate. Moreover, the aggregate amount of the applied penalties cannot exceed the principal debt amount due as of the date of penalty application.
► Law on Currency Regulation and Currency Control: article 6, point 2 in compliance with which interest for the loans disbursed and deposits attracted in foreign currencies can be paid in the same currency as the loan and deposit if the client wishes so.
► Law on Compulsory Enforcement of Court Decrees: a number of amendments referring to the improvement of the functions of the courts and Compulsory execution service. Particularly, articles 23 and 31 have been edited essentially. According to the mentioned essential amendments the procedure of issuing, presenting to execution and returning enforcement acts has been amended. Simultaneously, it is worth to highlight a significant amendment related to granting the Compulsory Enforcement Service the right to define the property that can be put under arrest as well as the maximum size/amount of the arrest.
► Republic of Armenia Civil Procedure Code: a number of amendments that will ensure examination of claims of up to AMD 2 mln
within a reasonable time limit as such claims will be examined within one month and the court decree relating to such claims will inure in 15 days. Moreover, the competent court of universal jurisdiction is entitled to apply the mentioned simplified procedure of examining claims provided that there is the written consent of the parties and no participant to the procedure protests against such procedure within the time limit defined for presenting a response to the claim.
► Regulation 8/06 on mode of application and procedural requirements of business rules of communication with guarantors: newly adopted Regulation, which states mandatory rules of communication with guarantors as well as defines a wide scope of information that has to be communicated to the guarantors via agreed means of communication within a limited time period defined by the mentioned Regulation.
TOPTOPCONTENTS CONTENTS

44 45
Over the last three years Ameriabank showed high growth rates quite remarkably surpassing the banking sector average. Even if by certain indicators the Bank registered some slowdown in growth or decline, yet a clear leadership position has been maintained.
CAGR growth of main financial indicator for 2015-2017
STRATEGIC REPORTPOSITION OF AMERIABANK IN BANKING SECTOR
STRATEGIC REPORT
According to 2017 year-end results the Bank is the absolute leader among the RA banking system players by equity, profit, assets, loans, liabilities as well as liabilities to customers (including securities issued by the Bank). Over the last three years – in 2017 vs 2014, registering more than 65.1% growth in equity, the Bank now accounts for about 10% of total banking sector equity. Over the mentioned period it showed about 70.1% growth in assets and liabilities, as a result owning correspondingly 15.5% and 16.6% of the banking sector assets’ and liabilities’ total combined volume. Similar growth is seen also with loans’ and liabilities’ to customers (both with and without including the securities issued by the Bank) indicators. Namely, over the reviewed period, loans increased by 66.2% registering a market share of 18% as of year-end 2017; and liabilities to customers by 79.8% (94.7% including securities), market share – 14.7% (15.0% correspondingly).
Growth of main financial indicators’ over the last 3 years /2017 vs 2014/
TOPTOPCONTENTS CONTENTS

46 47
ROE dynamics ROA dynamics
The dynamics of the Bank’s key financial indicators as well as the corresponding shares in the system are presented in the following graphs.
► Gaining top positions in the market by total capital due to a new investor in 2015, the Bank further boosted its leadership in 2016 and 2017 as well. The Bank’s total capital grew by AMD 5.5 bln or 8.6% with the 2017 year-end results vs a year earlier. The Bank’s share in the banking sector by total capital reached 10.0% vs 9.8% in
2016. Total growth in the sector was 6.1%.
► As of year-end 2017 the Bank’s profit increased by 23.2% compared with a year earlier, meantime in banking system the indicator comprised only 16.2%.
► Ameriabank’s ROA and ROE ratios are quite significantly exceeding the banking sector average indicators; indeed the Bank has always paid extra attention to its profitability indicators.
► The Bank has always been very careful towards its portfolio quality and always maintained the NPL indicator at minimum level. As of now the share of the Bank’s NPL in total loan portfolio is about 2 times lower than that of the banking sector.
STRATEGIC REPORTPOSITION OF AMERIABANK IN BANKING SECTOR
customer service technology, constantly working towards enhancement of product mix, building a skilled and professional staff and striving to ensure the required resource base. The Bank re-affirms its position to pursue adopted strategy of building a universal bank. 2017 was another year of huge work in the mentioned direction: the Bank broadened the list of its retail services’, continued investments in branch and ATM network expansion, in addition, remarkable changes were made in the structure of Retail banking department, which resulted to a more active retail business.
The key goal of the strategy is to further strengthen the Bank’s leading positions in all key areas of the Armenian banking sector, in particular:
▶ To be an absolute leader in terms of service quality via following customer centric approach adopted back in 2008,
▶ To be the leader in terms of innovations in order to keep up with best practice international banking solutions and to address dynamically changing client needs,
▶ To maintain the position of the largest universal bank by assets with balanced corporate, retail and SME portfolio,
▶ To improve leading position in the banking sector by main financial indicators
▶ To increase financial efficiency of the Bank (in regards to ROE & CIR),
▶ To sustain high value of its Brand through customer centric approach and consistent activities aimed at further raising brand awareness and positive brand perception,
▶ To enhance product mix to meet most sophisticated client needs,
▶ To make continuous investment in distance banking channels,
T he year 2017 was another quite successful year of operations for Ameriabank. The Bank
strengthened its positions among leading banks in Armenia, proving to be a stable, modern, liquid, rapidly growing and competitive financial institution still with huge opportunities of further growth and development.
With special focus on banking services and quality, the Bank has already positioned itself as a leader in innovation and service standards. Moreover, the Bank has been continually honing its work organization and corporate governance practices,
STRATEGIC REPORTBUSINESS MODEL AND STRATEGY
TOPTOPCONTENTS CONTENTS

48 49
▶ To extensively exercise best corporate governance practices,
▶ To further enhance staff loyalty and motivation and invest in human capital, including mentoring and growth of new talents.
Mission
To improve the quality of life by:
▶ Providing world-class financial services and business solutions to our clients,
▶ Implementing business and social projects significantly impacting the well-being of the society,
▶ Creating unique corporate culture and development model of an international company, uniting the efforts of successful people,
▶ Consistently increasing our shareholder value.
Vision
▶ To become an international company, providing financial and business solutions.
▶ Be service quality and efficiency leader in target markets, uniting exceptional people with common values.
In order to achieve the objectives set in Mission and Vision statements as well as Strategic goals described above, Ameriabank has set the following short to mid-term objectives:
▶ To maintain the position of leader, the Bank plans to further increase assets volume, reach higher net profit and further enhance its customer base,
▶ To ensure outpacing growth of main indicators also being among champions per efficiency indicators,
▶ To stress retail and SME business, further develop investment banking services ,
▶ To increase the number of card services and their role in the Bank’s activities ,
▶ To improve the Bank’s service quality ,
▶ To further develop remote banking channels, delivering new banking and investment services and innovative solutions, in particular, multi-channel distance banking services in line with the best international practices,
▶ To carry out effective allocation of assets - assets’ diversification,
▶ To apply effective decision-making tools (scoring system),
▶ To further enhance financial stability hence providing additional security to all stakeholders with revised risk parameters,
▶ To ensure effective management of Bank’s key risks, maintaining low level of credit risk, as well as, improve the assessment and management systems of market, operational and other risks,
▶ To contribute to continuous learning, development and motivation of the team,
▶ To accomplish the IPO preparation project to become the first Armenian listed financial institution on international prime market,
▶ To address social issues and contribute to the community via sustainable and sound corporate social responsibility (CSR) activities focused on SMEs and business community development, financial technology evolution, professional knowledge sharing with younger generation, educational programs, support to children’s healthcare and welfare, as well as community development in general.
STRATEGIC REPORTBUSINESS MODEL AND STRATEGY
STRATEGIC REPORTRETAIL BANKING
Over the last years the development of retail banking was one of the key strategic objectives.
Ameriabank’s business decisions are made with its customers’ satisfaction in mind.
Now as a major full-service Retail Bank, Ameriabank has leadership in the main segments and continues strengthening its position in the mass market.
In 2017, the Bank continued its digital transformation, which should impact significantly customer experience especially in terms of enabling clients to apply and receive loans online.
Multi-channel Distribution Network
Within the framework of the complex projects aimed at empowering the Bank’s multichannel distribution network, certain activities have been initiated to facilitate expansion of the branch network:
► New “Kochar” branch was opened at a large shopping mall in Yerevan.
► New “Kumayri” branch was opened in the center of Gyumri.
Ameriabank is continuously developing new technologies and investing in digital and mobile capabilities in order to improve customer experience
and differentiate the offers, aiming to make banking and interactions faster and more convenient for its clients.
A fundamental principle of Ameriabank’s Multi-channel Distribution Network policy is to use new technology on a par with branch network capacity, enabling to ensure interaction with customers when and how they want it.
On the way towards Digital Banking, the Contact Centre remains one of the most important service channels. In 2017, Ameriabank continued to expand the list of services provided via Contact Centre and included lending component. One of the main challenges for 2017 was implementing a new pre-approved loan concept, which assumed developing individual offers for clients and delivering them a new level of lending experience.
The annual year-end growth of the total number of Internet/mobile banking users as of December 2017 constituted 33% and that of the total number of transactions via remote channels comprised 77%.
New Products & Propositions
The Special proposal for several most important sectors of economy products has been improved and widened based on research of needs to include new sectors. The proposal includes preferential
conditions for card service, lending including lower rates and higher than standard loan to value ratio for secured loans, special terms for distance banking channels and most importantly: simplified lending process. With this offer Ameriabank aims to make the banking experience for these sectors’ employees more simplified and comfortable, giving them an opportunity to concentrate on their important mission.
In cooperation with EBRD the “Women in business” product was developed, offering loans in local currency with low interest rate and high LTV. Under the umbrella of this offer, special event was organized to encourage women entrepreneurs.
Ameriabank continued to expand its cooperation with Best Card LLC within the framework of “AYO” cash back program. AYO program is a cashback reward program enabling Ameriabank cardholders to earn up to 20% cashback on transactions made by amount Ameriabank cards at partner merchants and service-providers. All cards issued by Ameriabank, other than Gift and Business cards, are eligible to participate in cashback program. In 2017 credit line was developed for AYO cardholders in order to provide them better shopping experience.
Car lending was one of the main strategic directions in 2017. The Bank is continually expanding its cooperation with auto dealers, as a result of which
TOPTOPCONTENTS CONTENTS

50 51
special terms campaigns were announced for Toyota and Kia cars in case of purchasing them from primary market. The campaign offered two significant advantages to Ameriabank clients:
► Improved LTV ratio
► Preferential interest rate
New Consumer finance product “Aparik” was developed and launched in the end of 2017 for mass market. This product enables customers to buy goods on installment plan directly at the store. Consumer finance decision is made online just in a few minutes.
Client Service
Ameriabank aims to provide superior service to its clients for creating, growing and retaining their wealth in a sustainable way.
Retail Banking provides simple and transparent banking products to its customers, enabling them to anticipate and fulfil their financial needs.
The customer service experience is remaining the main focus for the Bank. During 2017 several actions have been taken to improve the customer queue experience. Mobile queue management system was implemented in cooperation with Early one, providing the clients possibility to register through mobile application and avoid waiting in the queue at branches.
Client Base & Deposits
Due to revised customer strategy and improved customer experience the Retail business segment portfolio increased by 30.4% along with 8.2% increase of the number of individual customers.
Despite the continuous decrease of deposit rates, the
deposit base demonstrated significant improvement patterns. In particular, continuous expansion resulted in 42.8% increase in demand deposit of retail segment, totaling to AMD 58,843 mln and 24.0% increase in time deposit of retail segment, totaling to AMD 160,442 mln.
The growth of demand deposits is an important indicator for the Bank since it is considered to be the result of increased Customer trust and loyalty.
In 2017, the total amount of bonds issued by the Bank constituted AMD 31,221 mln, AMD 25,368 mln of which was acquired by individuals. This was an indicator of high level of trust and effective cooperation with the clients of the Bank.
Payment Cards
Payment cards business has always been among the strategic priorities of the Bank for both quantity and
STRATEGIC REPORTRETAIL BANKING
STRATEGIC REPORT
quality perspectives.
High quality and ease of access are the pillars underlying the development of the Bank’s card business. The 24/7 card monitoring and help-desk services enable provision of high quality assistance to the clients. Due to these and other relevant efforts, the Bank improved its key performance indicators in this business resulting in 14% growth of the total number of cards.
The Bank is continually developing its cooperation with Payment Systems. In 2017 special campaigns were launched with both VISA and MasterCard aiming card expansion and non-cash turnover increase, especially among mid-segment customers.
The Bank considers credit lines as another important component of the card business. Significant efforts in this direction resulted in a 33.4% increase of the credit card portfolio indicator.
The Bank maintains leading position on the market by indicators related to E-Commerce and POS business. Targeting enhancement of the customer shopping experience influenced the development of the Bank’s POS and virtual POS network. In 2017, the number of virtual POS terminals increased by 46%, totaling to 255 and the total volume of respective transactions increased by 171%. The number of POS terminals increased by 32%, totaling to 1,619 and the total volume of transactions increased by 36%.
Retail Lending
In 2017, a complex set of actions has been taken to improve customer lending experience. The Bank revised and fundamentally improved its lending conditions in several material aspects, such as:
► Interest rate review (lowered rates for all currencies), floating rates for all types of short terms loans were settled and promoted.
► Review of non-interest lending terms and conditions, implementation of risk-based pricing, enabling customers with low risk criteria to get loans with low interest rate.
Wide-scale campaigns for SME and Mortgage loans were launched in September 2017. The main component of these campaigns was risk-based pricing. Over 400 SME and Mortgage loans with the amount of around AMD 12,000 mln have been provided within the framework of above-mentioned campaigns.
2017 resulted in an increase of the Bank’s retail portfolio by 30.4%. As of the year-end 2017 the retail segment of loan portfolio constituted AMD 78,531 mln. The volume of mortgage portfolio reached AMD 28,602 mln (42.6% increase over the previous year), that of the auto loans – AMD 2,041 mln, and of the credit cards – AMD 19,025 mln.
TOPTOPCONTENTS CONTENTS

52 53
2015 2016143,694 170,607
2015 201647,928 60,2402016
170,6072015143,694 2016
95,057201587,870
201660,240
201547,928 2016
75,154201568,497
Loans AMD mln
Deposits & BondsAMD mln
Number of Payment Cards
Clients
170,607
60,240 75,203
2016
2016 2016
2017
2017
2017
2017
219,285
78,531
95,564
86,044
STRATEGIC REPORTRETAIL BANKING
STRATEGIC REPORT
Breakdown of Ameriabank Retail segment loan portfolio
TOPTOPCONTENTS CONTENTS

54 55
Ameriabank stands out in the banking sector with its sterling reputation as a reliable strategic
partner. The Bank demonstrates an individual approach to each client, offering tailored solutions comprising a mix of various financial tools.
During the reporting period, Ameriabank maintained the 29% growth rates of its corporate segment client base.The portfolio of corporate demand deposits constituted AMD 101,413 mln and the corporate time deposits portfolio AMD 82,359 mln. In 2017 Ameriabank continued to issue corporate bonds and successfully placed all of them.
While working with corporate clients, Ameriabank applies the following principles:
► Individual approach,
► High quality of service,
► Partnership (including comprehensive counsel on the business efficiency of financial solutions available in the local and external markets),
► Assistance in growth and transparency of
operations,
► Access to targeted program funds.
During 2017, the Bank maintained its leading position in corporate lending for 8-th consecutive year. The loans to large corporates amounted to 413 billion AMD.
Following its strategy in 2017 the Bank continued to pay special attention to SME lending by offering competitive and new financing products to the SME sector. The targeted policy of the Bank in SME lending resulted in the increase of SME loans to the corporate segment by 5% to AMD 66.9 bln (equivalent of USD 138.2 mln) as of year-end 2017. The main reasons for this increase were providing more financing to innovative and green SME projects with competitive rates and high quality service. Individual approach to each client has also remained to be an important part of the Bank’s financing procedures. SME financing was targeted to the main developing industry sectors in the Armenia economy, namely the energy sector, agriculture, construction, tourism, etc. The Bank placed stronger emphasis on energy efficiency and energy saving projects, offering most favorable terms
of financing to companies.
Financial Lease & Factoring
During the previous year Ameriabank reviewed the structure of its financial lease offering, especially for the real estate deals. Significant increase was reported in the volume of energy efficient equipment and machinery purchased by Ameriabank’s clients via financial lease mechanism. In 2017 Ameriabank’s financial lease service was most popular with the companies that needed financing without pledging real estate or any other property and who wanted to replenish the fixed assets of the company with new equipment, vehicles and other technical facilities. In order to offer more attractive terms to its customers, cooperation agreements have been signed by Ameriabank with companies in various industries, such as car dealers Avangard Motors, Capital Motors, Euro Truck. Ameriabank also closely cooperates with major medical equipment suppliers in the market. Moreover, to encourage environmentally friendly businesses, special terms are offered to clients to finance highly demanded solar power plants as part of the GAF project.
STRATEGIC REPORTCORPORATE BANKING
STRATEGIC REPORT
Another important direction of financing in 2017 remained factoring as the most appropriate commercial solution for short-term financing. As of year-end 2017, Ameriabank’s factoring portfolio amounted to AMD 6.8 bln which represents a 61% increase compared to 2016. The significant portion of the transactions falls upon export factoring as was the case in previous years. While focusing on export factoring transactions the Bank continued working closely with a diverse range of clients (of all sizes, engaged in various industries) facing working capital and cash flow shortages. Operating with multifaceted clients enhances Ameriabank’s opportunities to develop non-standard, individual approaches for any client, who networks with partners within the scope of deferred payment options.
Ameriabank is an associated member of Factors Chain International since 2013, which has become the global representative body for the Factoring & Receivables Finance Industry (latter joined IFG (International Factors Group) in 2016). It is a unique platform both for exporters and importers to cooperate closely in the international arena and to develop a framework for worldwide factoring operations.
Trade Finance
Ameriabank is one of the main providers of trade finance services in Armenia. The trade finance products offered by the Bank are designed to reduce the possible risks when doing business both abroad and in domestic market.
The Bank has received awards from prestigious international organizations for many years due to the high quality of service, interesting projects and significant amount of issued letters of credit and bank guarantees. Among such awards are: the Most Active Issuer in Armenia by EBRD, the Most active GTFP Issuing Bank in the Caucasus by IFC, the Deal of the Year by EBRD for financing the building of the new generation fiber-optic network in Armenia, the Deal of the Year– Energy Efficiency by EBRD for greenhouse energy efficiency improvement project, the Best GTFP Issuing Bank for Energy Efficiency by IFC, Award for Excellent Cooperation in Trade Finance by Commerzbank AG. It’s noteworthy that in 2013 Ameriabank also became the first bank in Armenia to receive a confirming bank status under the Trade Facilitation Program (TFP) by EBRD.
Ameriabank cooperates with a number of international banks. Ameriabank has a long history of cooperation with Commerzbank, including a number of award-winning transactions with their active participation. The Uncommitted Bilateral USD/EUR Trade Finance Facility with Commerzbank is in force since 2010. Through years of cooperation Unicredit has proven to be a reliable partner for Ameriabank, providing Trade Finance services under established credit limits. Ameriabank and Unicredit are continuously expanding the areas of cooperation creating new opportunities for clients involved in external trade. Another step to such expansion was the conclusion between Ameriabank and Unicredit of a Master Trade Loan Agreement in 2017 which will create new opportunities for trade facilitation in Armenia. Ameriabank and Citibank have effectively cooperated for years, gradually increasing the amounts and numbers of transactions and thereby providing cheaper financing to Armenian companies. In 2011, Ameriabank and Citibank signed CARTA Agreement (Continuing Agreement for Reimbursement of Trade Advances). Due to successful cooperation under this and other agreements Citibank has increased financial limits for Ameriabank.
TOPTOPCONTENTS CONTENTS
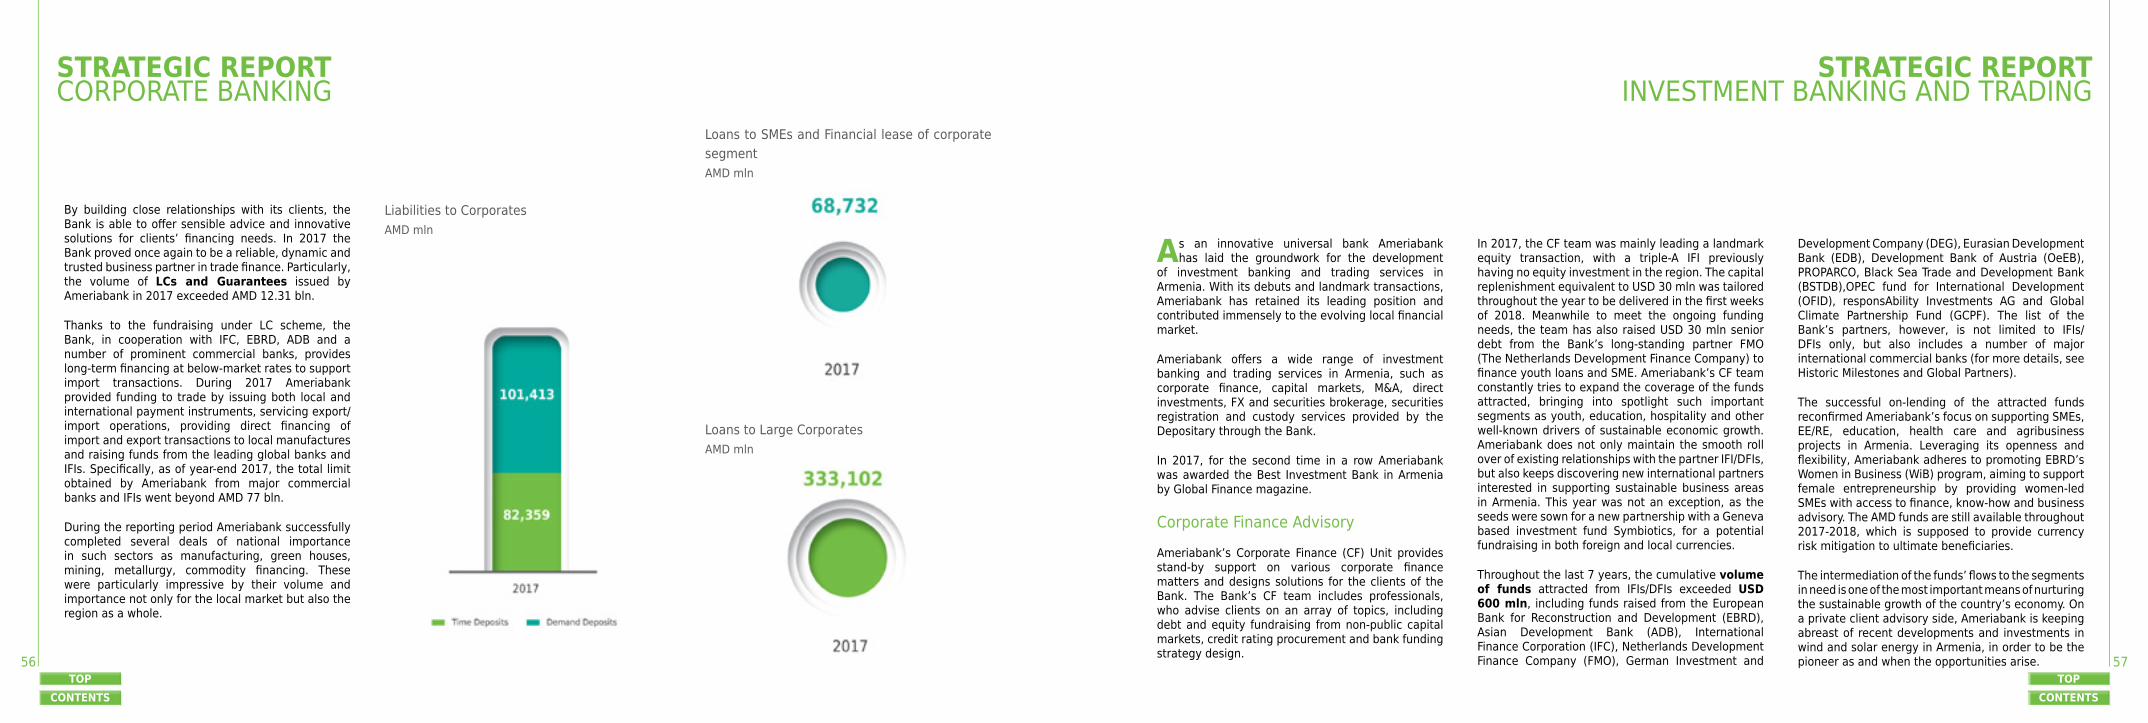
56 57
By building close relationships with its clients, the Bank is able to offer sensible advice and innovative solutions for clients’ financing needs. In 2017 the Bank proved once again to be a reliable, dynamic and trusted business partner in trade finance. Particularly, the volume of LCs and Guarantees issued by Ameriabank in 2017 exceeded AMD 12.31 bln.
Thanks to the fundraising under LC scheme, the Bank, in cooperation with IFC, EBRD, ADB and a number of prominent commercial banks, provides long-term financing at below-market rates to support import transactions. During 2017 Ameriabank provided funding to trade by issuing both local and international payment instruments, servicing export/ import operations, providing direct financing of import and export transactions to local manufactures and raising funds from the leading global banks and IFIs. Specifically, as of year-end 2017, the total limit obtained by Ameriabank from major commercial banks and IFIs went beyond AMD 77 bln.
During the reporting period Ameriabank successfully completed several deals of national importance in such sectors as manufacturing, green houses, mining, metallurgy, commodity financing. These were particularly impressive by their volume and importance not only for the local market but also the region as a whole.
Liabilities to CorporatesAMD mln
Loans to SMEs and Financial lease of corporate segmentAMD mln
Loans to Large CorporatesAMD mln
STRATEGIC REPORTCORPORATE BANKING
STRATEGIC REPORTINVESTMENT BANKING AND TRADING
As an innovative universal bank Ameriabank has laid the groundwork for the development
of investment banking and trading services in Armenia. With its debuts and landmark transactions, Ameriabank has retained its leading position and contributed immensely to the evolving local financial market.
Ameriabank offers a wide range of investment banking and trading services in Armenia, such as corporate finance, capital markets, M&A, direct investments, FX and securities brokerage, securities registration and custody services provided by the Depositary through the Bank.
In 2017, for the second time in a row Ameriabank was awarded the Best Investment Bank in Armenia by Global Finance magazine.
Corporate Finance Advisory
Ameriabank’s Corporate Finance (CF) Unit provides stand-by support on various corporate finance matters and designs solutions for the clients of the Bank. The Bank’s CF team includes professionals, who advise clients on an array of topics, including debt and equity fundraising from non-public capital markets, credit rating procurement and bank funding strategy design.
In 2017, the CF team was mainly leading a landmark equity transaction, with a triple-A IFI previously having no equity investment in the region. The capital replenishment equivalent to USD 30 mln was tailored throughout the year to be delivered in the first weeks of 2018. Meanwhile to meet the ongoing funding needs, the team has also raised USD 30 mln senior debt from the Bank’s long-standing partner FMO (The Netherlands Development Finance Company) to finance youth loans and SME. Ameriabank’s CF team constantly tries to expand the coverage of the funds attracted, bringing into spotlight such important segments as youth, education, hospitality and other well-known drivers of sustainable economic growth. Ameriabank does not only maintain the smooth roll over of existing relationships with the partner IFI/DFIs, but also keeps discovering new international partners interested in supporting sustainable business areas in Armenia. This year was not an exception, as the seeds were sown for a new partnership with a Geneva based investment fund Symbiotics, for a potential fundraising in both foreign and local currencies.
Throughout the last 7 years, the cumulative volume of funds attracted from IFIs/DFIs exceeded USD 600 mln, including funds raised from the European Bank for Reconstruction and Development (EBRD), Asian Development Bank (ADB), International Finance Corporation (IFC), Netherlands Development Finance Company (FMO), German Investment and
Development Company (DEG), Eurasian Development Bank (EDB), Development Bank of Austria (OeEB), PROPARCO, Black Sea Trade and Development Bank (BSTDB),OPEC fund for International Development (OFID), responsAbility Investments AG and Global Climate Partnership Fund (GCPF). The list of the Bank’s partners, however, is not limited to IFIs/DFIs only, but also includes a number of major international commercial banks (for more details, see Historic Milestones and Global Partners).
The successful on-lending of the attracted funds reconfirmed Ameriabank’s focus on supporting SMEs, EE/RE, education, health care and agribusiness projects in Armenia. Leveraging its openness and flexibility, Ameriabank adheres to promoting EBRD’s Women in Business (WiB) program, aiming to support female entrepreneurship by providing women-led SMEs with access to finance, know-how and business advisory. The AMD funds are still available throughout 2017-2018, which is supposed to provide currency risk mitigation to ultimate beneficiaries.
The intermediation of the funds’ flows to the segments in need is one of the most important means of nurturing the sustainable growth of the country’s economy. On a private client advisory side, Ameriabank is keeping abreast of recent developments and investments in wind and solar energy in Armenia, in order to be the pioneer as and when the opportunities arise.
TOPTOPCONTENTS CONTENTS

58 59
Capital Markets
With its dedicated and experienced capital markets team, Ameriabank offers full range services to local debt and equity issuers, including corporate bond originations, IPOs/SPOs, market making services and IPO advisory. In 2017, Ameriabank maintained its leading position in the local capital market with 5 closed bond projects totaling around USD 42 mln. Ameriabank successfully allocated 3 tranches of USD bonds with a total volume of USD 35 mln and had its debuted Euro denominated bond placement in 2017. The Bank also continued its active participation in local currency bond market with an AMD 1.5 bln bond placement in 2017.
As of 31 December 2017, the total volume of outstanding bonds comprised USD 64 mln which made up around 30% of the overall corporate bond market in Armenia.
Currently Ameriabank has 8 bond tranches listed and floating on Nasdaq OMX Armenia Stock Exchange, where secondary market liquidity is ensured by engaged market makers for all tranches.
Ameriabank was also active in terms of advisory, providing IPO and DCM advisory to a number of corporate clients, with expected deal closings in
2018.
Ameriabank is also one of the leading market making service providers in the local market with total exposure of USD 33 mln.
Ameriabank’s leading position on the local capital markets was one of the most important factors considered by Global Finance magazine for naming Ameriabank the Best Investment Bank in Armenia in 2017.
Ameriabank still advocates the capital market development in Armenia and in the region, believing in and contributing to the promising future of both
local equity and debt securities markets.
Mergers & Acquisitions
Ameriabank’s M&A team offers wide range of corporate finance services, including the identification of potential investors or targets, preparation of relevant investor outreach documents (teaser, information memorandum), transaction design and financial modeling, business valuation reports, synergy valuation report, post-deal review and analysis, etc. Ameriabank takes the advantage of unique market knowledge and networking with business community in Armenia and abroad.
STRATEGIC REPORTINVESTMENT BANKING AND TRADING
STRATEGIC REPORT
In 2017, M&A team focused on HORECA, financial services, mining, specialty retail, commercial real estate, telecommunication services, hospitals and healthcare services and food processing sectors. Ameriabank has advised its clients in various sectors, including real estate, transport, telecommunication, IT, international franchising, agriculture and power generation, water processing and production.
Minimum regulatory capital requirement set by the Central Bank of Armenia effective since 01 January 2017 was an M&A catalyst in the banking sector during the last two years. Notwithstanding a couple of small regulatory driven ticket deals, the propensity to systemic deals remains high driven by increasing competitive tensions and tightening margins which will lead to inevitable consolidation in the banking sector. Ameriabank’s M&A team has advised in three major bank M&A deals and will keep further developments under its radar to reveal shareholder value accretive M&A opportunities.
Trading
According to FY 2017 results, Ameriabank ranked 2nd in the local market by trading operations. In 2017, the net income from trading (foreign exchange, gold and securities) and revaluation recorded an increase to constitute a significant share of 18% in the banking
sector trading operations.
During 2017, Armenian foreign exchange market was relatively stable and there were no significant exchange rate fluctuations. The Bank kept its leading position in the foreign exchange market and recorded a more than 54% growth in the number of clients’ foreign exchange transactions and more than 14% growth in the income from currency operations. Ameriabank continued to be very active in the market of Armenian and other sovereign Eurobonds and was still one of the largest investors in the Armenian banking sector by volumes of investments into corporate bonds.
In 2017, the number of Ameriabank clients using brokerage services grew by more than 30%. The Bank launched brokerage services referral program, and simplified its brokerage account opening process.
Ameriabank’s brokerage services are available on more than 100 specialized platforms in 23 countries worldwide, enabling clients to trade in multiple securities and keep track of the latest market developments. Brokerage accounts with Ameriabank give access to all major stock exchanges worldwide such as NYSE, NASDAQ, AMEX, ARCA, CBOT and others (US), Toronto Stock Exchange, Montreal Exchange (Canada), LSE, LSE International Order Book (UK), Frankfurt Stock Exchange FWB (Germany), Vienna
Stock Exchange VSE (Austria), Euronext Brussels Stocks, Nasdaq OMX Europe NUROEN (Belgium), Euronext France SBF (France), Swiss Exchange SWX (Switzerland), Borsa Italiana (Italy), Bolsa de Madrid (Spain), Tokyo Stock Exchange TSE JPN (Japan), Hong Kong Stock Exchange SEHK (China), Australian Stock Exchange ASX (Australia) and many others. The Bank’s brokerage clients can trade in securities denominated in multiple currencies and follow quotations in real time.
TOPTOPCONTENTS CONTENTS

60 61
STRATEGIC REPORTForecastthe sentiments and motives of actions, keep open communication and create an atmosphere with unique values
GOVERNANCE REPORTCHAIRMAN’S CORPORATE GOVERNANCE STATEMENT
As a bank committed to the best international standards in corporate governance, Ameriabank has been setting and following relevant benchmarks in corporate governance best practices. Moreover, our plan to become a public company through launching an IPO in the international capital markets sets additional requirements and regulatory standards for us to follow well in advance, and we are proud to mark our success in having most of the standards already in place.
We have made significant improvements in our corporate governance system in 2017. After setting up Board committees and formalizing committee regulations in 2016, we started the actual work of the committees in 2017, which we believe will significantly enhance and streamline the decision making process at the Board level.
We can proudly announce that today we have one of the most experienced and professional Boards in the market, with non-executive directors from quite diverse spheres who enjoy profound knowledge and experience in their respective fields.
Considering the importance of independent judgement by the Board members and the ability of the Board to make balanced and independent decisions as a whole, we aim to reach the optimal number of independent directors on the Board. The Board has reviewed and assessed the independence of all 7 Board members in 2017, and although all Board members act independently and impartially, for some of them there are existing relationships that could appear to affect their independence in certain situations. As we have made a decision to follow the strictest rules of defining independence, the Board, based on the recommendations of the Corporate Governance and Nominations Committee, is considering Mr. Robert von Rekowsky as independent Board member.
We will further focus on the efficiency and independence of decision making processes at the Board level, ensuring the balance of skills and desired number of independent non-executive directors.
Understanding the importance of sound risk management and internal control systems, the Board
has kept these spheres under focus throughout 2017. As the Audit Committee started its actual work in 2017, we anticipate significantly enhanced efficiency in the oversight of the internal controls functions.
We remain determined to reach the highest standards in corporate governance, as challenging as it may be. We believe that strong and effective corporate governance system is crucial for further growth of our business and for creating sustainable long-term value for our shareholders.
Andrew MkrtchyanChairman of the Board of Directors
Dear Shareholders,
TOPCONTENTS

62 63
GOVERNANCE REPORTCORPORATE GOVERNANCE STRUCTURE
Being committed to the best standards the Bank’s corporate governance structure ensures
the necessary checks and balances for effectively managing the relationship between the executive management, the Board and shareholders. The Bank’s corporate governance include the following bodies: the General Meeting of Shareholders (GMS), which is the supreme governing body regulating and managing the main business directions of the and has the authority to approve all key decisions regarding the strategic development of the Bank, the Board of Directors, the Board Committees and the Management Board.
GOVERNANCE REPORT BOARD OF DIRECTORS
T he Board is responsible for the long-term success of the Bank by setting the strategy, defining core
values and overseeing the management. Its purpose is to ensure maximum investment value for the Bank’s shareholders and protect other stakeholders’ interests.
A key objective of the Board is to ensure the implementation of effective internal control system and proper control of risks associated with the Bank’s activities, by determining the acceptable risk appetite. There is an ongoing process for identifying, evaluating and managing significant risks, including those risks related to social, environmental and ethical matters. The Board develops policies and procedures, while the role of management is to implement the Board’s policies on risk and control and provide assurance on compliance with these policies. The overall responsibility for the systems of internal control and review of their effectiveness also rests with the Board.
The Board has primary responsibility for ensuring that, as a collective body, it has the appropriate skills, knowledge and experience to perform its role effectively. Key to ensuring the Board’s effectiveness is enabling Directors’ full access to information and management across the Bank. All Directors make every effort to attend each meeting, whether in person or with remote access. The Bank has a dedicated online platform for Board interaction – a Board Members’ portal. It’s a unique and highly secure environment enabling Board Members and corporate secretaries to collaborate, participate
in daily Board-related activities and gather all the Board related data, including resolutions, meeting minutes, presentations, approvals and reports in one place. Users can access the portal from various devices, which provides the Board Members an opportunity to participate in discussions and decision making process from any part of the world with remote access. In addition, the Chairman and the Board members frequently conduct site visits and interact with staff at all levels. This gives them an opportunity to witness the culture and values of the organization in action, and also provides context to the formal information that they receive for Board meetings. The Board consistently probes, questions and explores the logic behind management actions, both in formal Board meetings and other informal interactions. The Chairman plays a particularly important role by ensuring that all Board members have the opportunity to contribute fully in all Board discussions.
The Board at Ameriabank is governed by the Board of Directors Regulation that outlines the key goals and objectives, scope of authorities, procedure of preparation, summoning and holding of the meetings of the Board.
The tenure of BoD members is defined by GMS and cannot be less than five years and more than ten years. The BoD Chairman and members can be re-elected. Those shareholders who own 10% and over of the placed shares of the Bank may be appointed BoD members or represented there without elections. Minority shareholders have the right to collectively
include their representatives in the BoD.
The size and composition of the Board, the qualifications of its members and the balance of their skills have a significant impact on its effectiveness. The Board regularly reviews these matters, both in terms of what is needed now and what might be needed to be successful in the future. Recognizing the benefits of diversity in the Board, the current members of the Board have a wide range of skills and experience required to govern the Bank. Geographic diversity together with key professional expertise in banking, asset management, advisory, finance, investor relations and international business form the core components of our Board succession planning.
The aim of Board’s succession planning is to ensure that the Board and management are always well resourced with the right people in terms of skills, expertise, and experience. The core principal is that even though new faces bring fresh ideas and perspective to how things are done, continued tenure brings a depth of the Bank specific knowledge that is important to retain.
The performance of the Board is a fundamental component of the Bank’s success. The Bank has Directors’ ongoing development program in place that is tailored to the needs of each Director, and is committed to the Directors’ continual development, so that they may build upon their expertise and develop an ever more detailed understanding of the business and the markets.
TOPTOPCONTENTS CONTENTS

64 65
The Board held 19 Board meetings in 2017, of which 2 were in-person meetings. During each in-person meeting the Board discussed the performance and results presented by the CEO and CFO. As a rule the strategy and annual business plans are discussed during in-person Board meetings. The Board has received regular reports from the Risks Department, Internal Audit and Compliance, Strategy Development, Human Resources and Investor Relations.
3 The biographies of Directors are given on pages 67 to 71. 4 In 2013 Andrew Mkrtchyan succeeded Ruben Vardanyan in the position of the Chairman of the Board. Ruben Vardanyan was appointed to the position of Non-executive Board member.
The Board of Directors Structure5
As of 31 December 2017 the Board was comprised of seven directors:
GOVERNANCE REPORT BOARD OF DIRECTORS
GOVERNANCE REPORT BOARD COMMITTEES
I n order to assist the Board in implementing its functions efficiently, the Board has established
Board Committees. The legal background for the committees was established in 2016 while in 2017 the actual work has commenced.
Delegation of some functions to the committees does not affect or reduce the authority or responsibility
Audit Committee
The main purpose of the Committee is to ensure that the interests of shareholders are properly protected by overseeing and increasing the efficiency of financial reporting, external audit, risk management and internal compliance functions at the Bank.
In 2017, the Audit Committee held 5 meetings during which the Committee discussed and made recommendations regarding quarterly IFRS reporting, Internal Audit quarterly reports and the overall effectiveness of the internal control systems.
The Committee is to assist the Board in developing and maintaining effective remuneration system in the Bank, ensuring assessment of its quality and monitoring of the applicable remuneration practices for attracting and retaining the best qualified directors and eliminating any possibility of abuse.
In 2017, the Remuneration Committee held 4 meetings. As a common practice the Committee held a meeting after semi-annual/annual evaluations and made recommendations to the Board on bonus pools, executive remuneration and reviewed the overall performance evaluation system. The committee also initiated a review of Employee Share Participation Scheme (ESPS) concept and made relevant recommendations to the Board. A new ESPS concept is to be implemented in 2018.
The committee’s role is to create a solid pool of highly experienced and competent candidates with relevant skills and integrity to be engaged on the Board of Directors, its committees and top management, to ensure succession planning and workforce optimization, as well as implementation of corporate governance principles and structure in line with the legislative requirements and best practice.
In 2017, the Committee held 1 meeting. The Committee reviewed and assessed the independence of all 7 Board members and made relevant recommendations to the Board for deeming certain Board members independent. The Committee has also reviewed the current criteria for assessing independence to make sure the Bank follows the best international practice and standards with this regard.
Remuneration Committee
Corporate Governance and Nominations Committee
of the Board of Directors. The committees perform their responsibilities independently. However, final resolution of relevant issues is ensured via submitting the committee’s decisions and projects to the Board of Directors for approval. As per Bank’s internal regulations, any topic that needs thorough elaboration should be first discussed at the committees՛ level prior to the Board discussion.
The Bank currently has three Board level committees: Audit Committee, Remuneration Committee, Corporate Governance and Nominations Committee.
TOPTOPCONTENTS CONTENTS

66 67
Andrew Mkrtchyan
Ruben Vardanyan
Noubar Afeyan
Robert von Rekowsky
Pierre Gurdjian
Oleg Tsarkov
Alexey Germanovich
COMMITTEES RemunerationCommittee
Corporate Governance CGand Nomination CommitteeAudit Committee
Chairman
MemberChairman
Member
Member
Member
Chairman
Member
Member
GOVERNANCE REPORT BOARD COMMITTEES
GOVERNANCE REPORTMEMBERS OF THE BOARD OF DIRECTORS
Mr. Mkrtchyan was awarded Order of Honor by His Holiness Supreme Patriarch and Catholicos of All Armenians for his benevolent activities for Armenian Apostolic Church.
Education:
Mr. Mkrtchyan graduated from Yerevan State University, Department of Economics. He received a scholarship from American Economic Association (AEA) for his scholar studies at Economics Institute, Colorado State University, as well as participated in number of executive programs in different universities, including Kingston Business School, Harvard Business School, INSEAD and others.
Andrew Mkrtchyan Chairman of the Board of Directors
Born on December 02, 1973
Andrew Mkrtchyan was appointed Chairman on 27 November, 2013. Mr. Mkrtchyan served as Board member from 2007 to 2013 before being elected as the Chairman.
Skills and Experience:
Mr. Mkrtchyan serves as the CEO and the Chairman of the Board of Directors of Ameria CJSC. He is standing at the roots of investment banking and management advisory in Armenia. Mr. Mkrtchyan has extensive experience in strategic management, which has been the key to the successful growth and development of the Group. Andrew Mkrtchyan is the first businessman from Armenia to be a Founding Member of World Economic Forum New Champions Chapter. He is a Board Member to a number of private and public organizations.
Robert von RekowskyIndependent Member of the Board of Directors
Born on July 26, 1966
Robert von Rekowsky was appointed Board Member in October 2012.
Skills and Experience:
Mr. von Rekowsky has around 30 years of experience in global asset management. He was a vice-president at Emerging Markets Strategy and portfolio manager for Fidelity Investments. He’s been managing several institutional and retail emerging market equity funds for U.S. and Canadian investors.
Mr. von Rekowsky joined Fidelity’s fixed-income division in 1989. In 1995, he moved along with the emerging markets debt group into the company’s high-income division as a sovereign debt analyst. He continued in that role while working from Fidelity’s London office (1996 - 1998), when
TOPTOPCONTENTS CONTENTS

68 69
he moved into European equity research. From 2002 to 2004, Mr. von Rekowsky was an associate fund manager for the emerging market equity funds, responsible for the EMEA region. In 2004, he relocated to Boston to assume responsibility for Fidelity’s global emerging market equity funds.
Education:
He received a Bachelor’s Degree in Political Science and Government from the University of New York at Albany (SUNY), a Master of Arts Degree in Political Science from Northeastern University and a Master of Science Degree in Finance from Brandeis University.
Ruben VardanyanNon-executive Member of the Board of Directors
Born on May 25,1968
Ruben Vardanyan was appointed Board member on November 27, 2013. Mr. Vardanyan served as the Chairman of the Board starting from the incorporation of the Bank from 2007 till November 2013.
Skills and Experience:
Mr. Vardanyan is an impact investor and social entrepreneur, a prominent investment banker with more than 25 years of experience, a key figure in Russia’s capital markets establishment. He is currently a founding partner and president of LLC VARDANYAN, BROITMAN AND PARTNERS and a board member at numerous entities in Russia and abroad. Mr. Vardanyan is also a member of the Economic Advisory Board at the International Finance Corporation. Prior to the merger with Sberbank in January 2012, he served as CEO, Chairman of the Board at Troika Dialog,
one of the oldest and largest investment banks in Russia and the CIS. Mr. Vardanyan is the Chairman of the Board at SOLLERS, a leading Russian automotive company, a Board member at KAMAZ and SIBUR Holding.
He is a member of the Investment Committee of Avica Property Investors International. He is a member of the Investment Council under the Chairman of the State Duma of the Russian Federation and a member of the Strategic Council for Investments in New Industries under the Ministry of Industry and Trade of Russia.
Mr. Vardanyan is a Founding Partner and Vice-Chairman of the International Advisory Board of Moscow School of Management SKOLKOVO, as well as Chairman of the SKOLKOVO Institute for Emerging Market Studies. He is also a co-founder of Scholae Mundi Foundation CIO and UWC Dilijan College in Armenia, a member of the International Advisory Councils at Fundação Dom Cabral business school in Brazil and GuangHua School of Management in China. He is a member of the Board of Trustees of the Russian Presidential Academy of National Economy and Public Administration and the Faculty of Economics at Lomonosov Moscow State University.
Mr. Vardanyan is a co-founder and Chairman of the Board of Charitable Foundation Initiatives for Development of Armenia (IDeA), a co-founder of 100 LIVES project and the Aurora Prize for Awakening Humanity award and a member of the Central Board of Directors of the Armenian General Benevolent Union (AGBU).
Education:
Mr. Vardanyan received a Master of Science Degree in Economics from Moscow State University. He also studied various professional courses and special programs at INSEAD, Harvard Business School, Yale University and Stanford University.
GOVERNANCE REPORTMEMBERS OF THE BOARD OF DIRECTORS
GOVERNANCE REPORT
Dr. Afeyan has co-founded and helped build over 35 successful life science and technology startups during the past three decades. He was the founder and CEO of PerSeptive Biosystems, a leader in the bio-instrumentation field. After PerSeptive’s acquisition by Applera Corporation, he was Senior Vice President and Chief Business Officer of Applera, where he initiated and oversaw the creation of Celera Genomics. Currently Dr. Afeyan serves on a number of public and private company boards including Codiak Biosciences, Evelo BioSciences, Kaleido BioSciences, Moderna Therapeutics, Axcella Health and Seres Therapeutics. He received a Technology Pioneer 2012 award from the World Economic Forum (WEF).
Dr. Afeyan also serves on the boards of the Armenian General Benevolent Union, the IDeA Foundation and the UWC Dilijan International School. He is engaged in a number of philanthropic initiatives and is a co-founder of 100 LIVES project and the Aurora Prize for Awakening Humanity award.
Education:
Dr. Afeyan has received Bachelor’s Degree in Chemical Engineering from McGill University. He has earned his PhD in Biochemical Engineering from the Massachusetts Institute of Technology.
Noubar AfeyanNon-executive Member of the Board of Directors
Born on July 25, 1962
Noubar Afeyan was appointed Board member in July 2010.
Skills and Experience:
Dr. Afeyan is the founder, senior managing partner and CEO of Flagship Pioneering, a private equity and venture capital firm that manages over $1.75 bln in funds focused on healthcare and biotechnology. He also leads the firm’s VentureLabs unit that invents and launches transformative startups.
Dr. Afeyan has been a senior lecturer at MIT’s Sloan School of Management where he has taught courses on technology-entrepreneurship, innovation, and leadership since 2000. He has authored numerous scientific publications and patents since earning his Ph.D. in Biochemical Engineering from MIT.
Pierre GurdjianNon-executive Member of the Board of Directors
Born on February 8, 1961
Pierre Gurdjian was appointed Board member in December 2016.
Skills and Experience:
Mr. Gurdjian is the President of the Board of Directors of the Free University of Brussels, one of Belgium’s largest universities. He is also a Philanthropy Partner at the RVVZ Foundation, focusing on the Foundation’s global philanthropic initiatives.
He was a Senior Partner at McKinsey & Company, where he was active for 27 years. He was the Managing Partner of the Belgian-Luxemburgish office between 2005 and 2012, after which he took the international responsibility of the Human Capital Service Line in EMEA. In this capacity, he served his clients on building personal and institutional
TOPTOPCONTENTS CONTENTS

70 71
leadership capabilities. He has had extensive experience serving clients in industrial and consumer industries on matters of governance, strategy, effectiveness, organization, operations and large-scale transformations across geographies, including post-merger integrations.
He was an active senior faculty member of several high profile client leadership forums (Bower Forum, Executive Transition workshop, Change Leaders workshop).
Mr. Gurdjian was also involved in internal learning programs for Senior Partners as the co-Dean of the pivotal program “Counseling Masterclass” in collaboration with leading academics from INSEAD and Harvard University. Mr. Gurdjian is a member of the World Presidents Organization (WPO) and is the President of the Board of Directors of YouthStart Belgium (formerly known as NFTE Belgium), and is Past President of the Harvard Club of Belgium. He has a passion for philosophy around which he has developed an innovative leadership development program (“Leadership and Wisdom”). He teaches a graduate course on “The CEO Perspective” at the Solvay Business School of the Free University of Brussels (ULB). He is also a member of the Board of Directors of UCB, a leading Belgian biopharmaceutical company.
He is a member of the Board of Trustees of Charitable Foundation Initiatives for Development of Armenia (IDeA) and a member of the Board of Governors and Trustees of UWC Dilijan College in Armenia.
Education:
Mr. Gurdjian has a Bachelor’s Degree in Commercial Engineering from the Free University of Brussels (VUB) and a Master of Business Administration from Harvard Business School.
Alexey GermanovichNon-executive Member of the Board of Directors
Born on July 19, 1977
Alexey Germanovich was appointed Board member in August 2016.
Skills and Experience:
Mr. Germanovich is a professional independent director, one of Russia’s leading professionals in corporate communications and investor relations. He has a 16-year experience of working in supervisory and executive boards in top Russian companies of various industries, including financial and automotive sector, aviation, transport, metals and mining, media and telecom.
Currently Mr. Germanovich serves as a board member at “Aeroflot – Russian Airlines”, “Saint-Petersburg” bank, “Unipro ” (formerly – “E.ON Russia”). Previous experience in the Boards of Directors includes the following companies:
State Transport Leasing company (GTLK), S7 Airlines, International Airport “Irkutsk”, “SG-Trans”, Broadcasting company “Ren-TV”, SOLLERS (Severstal-AUTO) and others. Additionally, he has an expertise of being an executive board member at Severstal group and Russian Direct Investment Fund.
He was named one of Russia’s top-50 best Independent Directors in 2013, 2014, 2015 and 2016 (according to the leading Russian professional rating issued by the Association of Independent Directors, PwC and the Russian Union of Industrialists and Entrepreneurs). Mr. Germanovich is also the Chairman of the Corporate Governance Committee for the Expert Council of Russian Federal agency for state property management (Rosimushchestvo). His career includes also a lecturer and mentor experience. He was a director of public projects, professor of practice at Moscow School of Management “SKOLKOVO”.
Mr. Germanovich is a Member of non-Executive Directors list of the Independent Directors Association (IDA), the Russian Institute of Directors (RID), the Russian Union of Industrialists and Entrepreneurs (RUIE), the Association of Corporate Directors and Managers (ACDM).
Education:
Mr. Germanovich graduated from Lomonosov Moscow State University with degrees in economics and journalism. He holds an Executive Master of Business Administration from Cranfield University, UK.
GOVERNANCE REPORTMEMBERS OF THE BOARD OF DIRECTORS
GOVERNANCE REPORT
ranked no.1 ruble bond underwriter.
From 1996 to 1998, Mr. Tsarkov was the CEO at Creditanstalt Grant, the leading Russian brokerage at the time. While working at Creditanstalt Grant, he was a member of the National Association of Stock Market Participants (NAUFOR), Depository Clearing Company, and the Russian Trade System (RTS). He has been working in financial markets since 1992.
Education:
Mr. Tsarkov received a Master’s degree in international finance markets at ISMA Business School at the University of Reading, UK.
Oleg TsarkovNon-executive Member of the Board of Directors
Born on September 22, 1966
Oleg Tsarkov was appointed Board member in September 2016.
Skills and Experience:
Mr. Tsarkov is the Chief Executive Officer at Phoenix Advisors, a company specializing in succession planning and wealth protection in business, personal finances and philanthropy. Prior to that, he was a Managing Partner at Svarog Capital Advisors, managing $500 million private equity funds since March 2004.
From 2000 to 2003, Mr. Tsarkov served as the Head of Investment Banking at Troika Dialog, one of the oldest and largest investment banks in Russia. Under the management of Mr. Tsarkov, Troika’s investment banking gained a leading position in the Russian mid-cap IB advisory market and was
TOPTOPCONTENTS CONTENTS
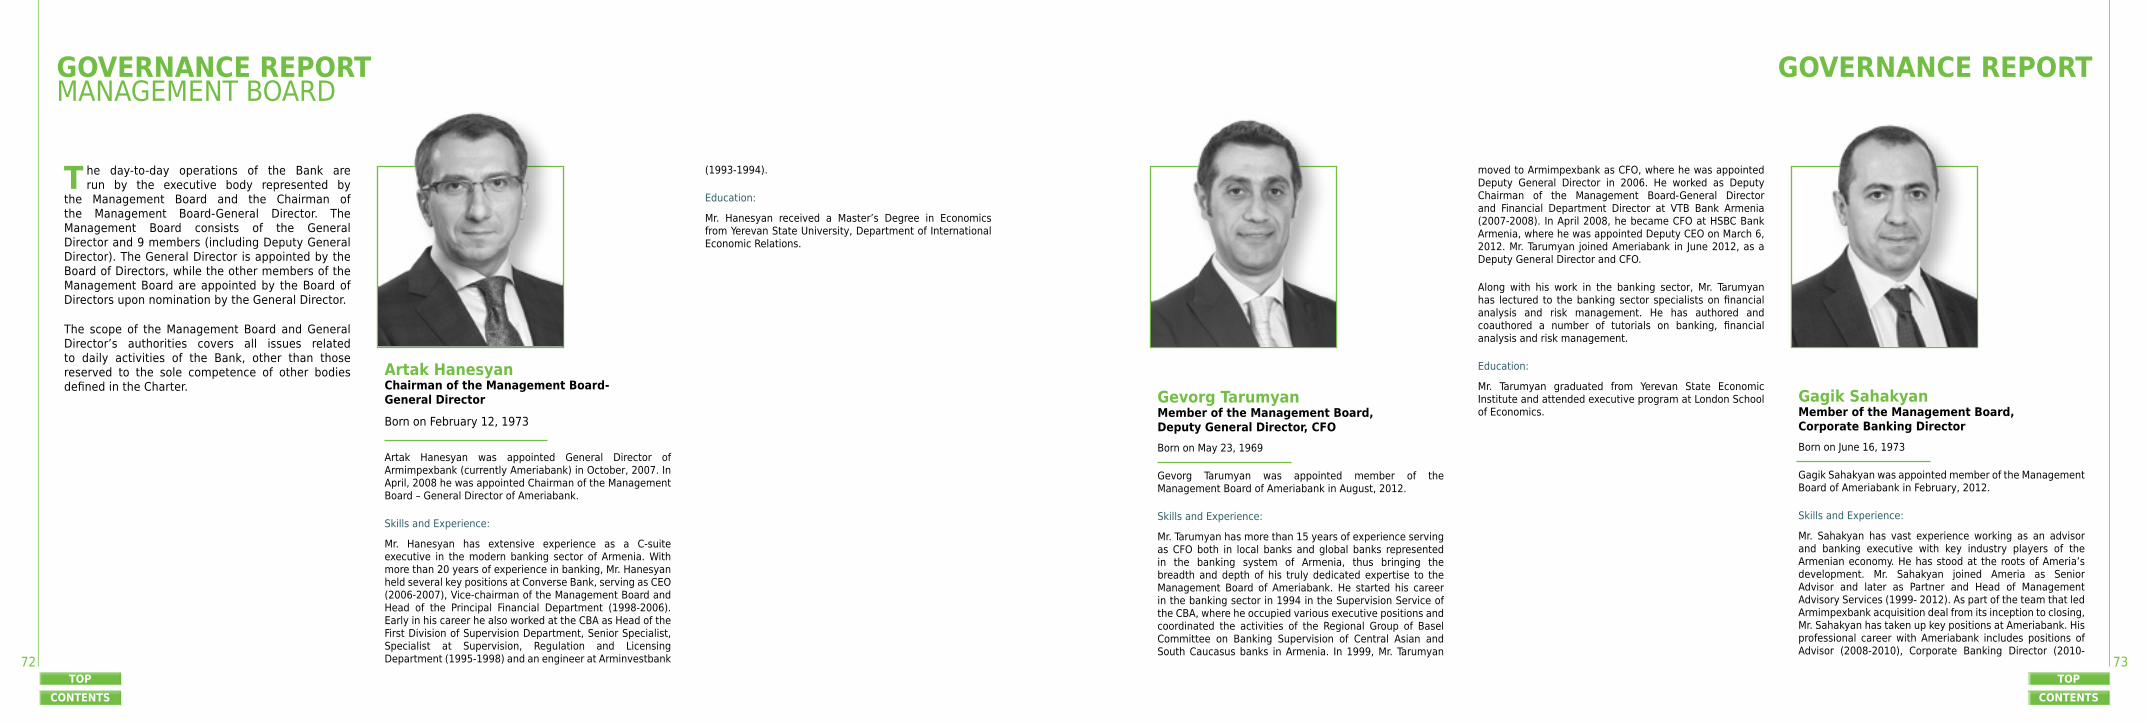
72 73
GOVERNANCE REPORTMANAGEMENT BOARD
T he day-to-day operations of the Bank are run by the executive body represented by
the Management Board and the Chairman of the Management Board-General Director. The Management Board consists of the General Director and 9 members (including Deputy General Director). The General Director is appointed by the Board of Directors, while the other members of the Management Board are appointed by the Board of Directors upon nomination by the General Director.
The scope of the Management Board and General Director’s authorities covers all issues related to daily activities of the Bank, other than those reserved to the sole competence of other bodies defined in the Charter.
Artak HanesyanChairman of the Management Board- General Director
Born on February 12, 1973
Artak Hanesyan was appointed General Director of Armimpexbank (currently Ameriabank) in October, 2007. In April, 2008 he was appointed Chairman of the Management Board – General Director of Ameriabank.
Skills and Experience:
Mr. Hanesyan has extensive experience as a C-suite executive in the modern banking sector of Armenia. With more than 20 years of experience in banking, Mr. Hanesyan held several key positions at Converse Bank, serving as CEO (2006-2007), Vice-chairman of the Management Board and Head of the Principal Financial Department (1998-2006). Early in his career he also worked at the CBA as Head of the First Division of Supervision Department, Senior Specialist, Specialist at Supervision, Regulation and Licensing Department (1995-1998) and an engineer at Arminvestbank
(1993-1994).
Education:
Mr. Hanesyan received a Master’s Degree in Economics from Yerevan State University, Department of International Economic Relations.
Gevorg TarumyanMember of the Management Board, Deputy General Director, CFO Born on May 23, 1969
Gevorg Tarumyan was appointed member of the Management Board of Ameriabank in August, 2012.
Skills and Experience:
Mr. Tarumyan has more than 15 years of experience serving as CFO both in local banks and global banks represented in the banking system of Armenia, thus bringing the breadth and depth of his truly dedicated expertise to the Management Board of Ameriabank. He started his career in the banking sector in 1994 in the Supervision Service of the CBA, where he occupied various executive positions and coordinated the activities of the Regional Group of Basel Committee on Banking Supervision of Central Asian and South Caucasus banks in Armenia. In 1999, Mr. Tarumyan
moved to Armimpexbank as CFO, where he was appointed Deputy General Director in 2006. He worked as Deputy Chairman of the Management Board-General Director and Financial Department Director at VTB Bank Armenia (2007-2008). In April 2008, he became CFO at HSBC Bank Armenia, where he was appointed Deputy CEO on March 6, 2012. Mr. Tarumyan joined Ameriabank in June 2012, as a Deputy General Director and CFO.
Along with his work in the banking sector, Mr. Tarumyan has lectured to the banking sector specialists on financial analysis and risk management. He has authored and coauthored a number of tutorials on banking, financial analysis and risk management.
Education:
Mr. Tarumyan graduated from Yerevan State Economic Institute and attended executive program at London School of Economics.
Gagik SahakyanMember of the Management Board, Corporate Banking Director Born on June 16, 1973
Gagik Sahakyan was appointed member of the Management Board of Ameriabank in February, 2012.
Skills and Experience:
Mr. Sahakyan has vast experience working as an advisor and banking executive with key industry players of the Armenian economy. He has stood at the roots of Ameria’s development. Mr. Sahakyan joined Ameria as Senior Advisor and later as Partner and Head of Management Advisory Services (1999- 2012). As part of the team that led Armimpexbank acquisition deal from its inception to closing, Mr. Sahakyan has taken up key positions at Ameriabank. His professional career with Ameriabank includes positions of Advisor (2008-2010), Corporate Banking Director (2010-
GOVERNANCE REPORT
TOPTOPCONTENTS CONTENTS

74 75
2012) and Member of the Management Board-Corporate Banking Director (from February 2012, up to present).
Education:Mr. Sahakyan graduated from the Yerevan State University, with a major in Mathematics. He received MBA degree from the American University of Armenia, College of Business and Management (1995-1997). In 2004 he attended executive program at Kennedy School of Government, Harvard University.
Arman BarseghyanMember of the Management Board, Retail Banking Director Born on July 1, 1976
Arman Barseghyan was appointed member of the Management Board of Ameriabank in September, 2012.
Skills and Experience:
Mr. Barseghyan has proven career track of about 20 years in retail banking. He started his career in banking in 1997 as a specialist at Financial Control Department in HSBC Bank Armenia CJSC (formerly Midland Armenia Bank J.S.C.). His career path at HSBC Bank Armenia assumed several key positions including Operations Manager at the Financial Control Department (2001-2004), Branch Manager (2004- 2008) and Retail Banking Director (2008-2012).
In June 2012, Mr. Barseghyan joined Ameriabank as Retail Banking Director.
Education:
Mr. Barseghyan graduated from Yerevan Institute of National Economy with major in International Economics. Later he was awarded with academic degree of Candidate of Economics at the Institute of Economics under the National Academy of Sciences of the Republic of Armenia.
GOVERNANCE REPORTMANAGEMENT BOARD
GOVERNANCE REPORT
Arthur BabayanMember of the Management Board, Trading Director Born on November 22, 1972
Arthur Babayan was appointed member of the Management Board of Ameriabank on December 24, 2013.
Skills and Experience:
Mr. Babayan started his professional career in banking in 1999 at Armimpexbank (currently Ameriabank) and has devoted himself to the development of the Bank since then. He worked as a dealer at the Division of FX&Stock Transactions (1999-2001), Chief Dealer (2001-2002), Head of Dealing Centre (2002-2013), Trading Director (2013-2013). He was appointed Acting Member of the Management Board (2013- 2013). Mr. Babayan has served as Member of the Management Board-Trading Director since December, 2013.
Education:
Mr. Babayan graduated from Yerevan State University, Department of Physics.
Tigran JrbashyanMember of the Management Board, Development Director Born on January 23, 1968
Tigran Jrbashyan was a member of the Management Board of Ameriabank from November, 2008 – December, 2011 and from June, 2013 to present.
Skills and Experience:
Mr. Jrbashyan has more than 20 years of management advisory experience in key economic sectors of Armenia. He is one of the leading experts in Armenia in the fields of strategy development, elaboration of sectorial reform packages, elaboration of legal normative acts and implementation of institutional building activities. He has designed and implemented solutions that have significantly improved performance of the private and public sector organizations by appropriately exploiting enterprise
TOPTOPCONTENTS CONTENTS

76 77
resources, skills and capabilities of human resources as well as increasing efficiency/designing business processes. He is an author of over 130 scientific articles and publications (on institutional economics, industrial economics, development of investment and financial markets, development of trade policy, theory of macroeconomics, integration of Armenia into EU, membership of Armenia to WTO, etc.), published in local and international magazines.
Mr. Jrbashyan joined Ameriabank as Advisor and then as Development Director in 2008. His first term as a member of the Management Board was from 2008 to 2011. He was re-appointed as member of the Management Board in 2013. Currently, Mr Jrbashyan is also Partner, Head of Management Advisory Services at Ameria.
Education:
Mr. Jrbashyan graduated from the State Engineering University of Armenia with a major in engineering and mechanics. He took a post-graduate course in Moscow State Technical University after Bauman in Russia and received a Ph.D. degree in economics from the Institute of Economic Research of Armenia.
Gohar KhachatryanMember of the Management Board, Chief Accountant
Born on May 03, 1963
Gohar Khachatryan was Acting Member of the Management Board from March, 2008 – June, 2008. She was appointed a member of the Management Board of Ameriabank in June, 2008.
Skills and Experience:
Mrs. Khachatryan has more than 25 years of experience holding key positions both in the regulatory body of the banking system and in private banks.
Mrs. Khachatryan built sterling career path in the CBA in the positions of an Accountant (1991-1992), Economist (1992-1994), Chief Economist (1994), Leading Specialist (1994-2000).
Afterwards, Mrs. Khachatryan joined Armimpexbank (currently Ameriabank) as Head of Balance Sheets and Reports Analyses Division, Financial Department (2000); Head of Financial Statements and Expenditures Control Department (2000-2001); Head of Administrative Accounting Division, Department of Finance (2001-2003), Chief Administrative Accountant (2003-2006); Chief Accountant/Admin Accounting Manager (2006 -2008). After the acquisition of Armimpexbank by TDA Holdings, Mrs. Khachatryan was promoted to Acting Member of the Management Board/Chief Accountant and Member of the Management Board/Chief Accountant (2008). Mrs. Khachatryan has combined her bank career with lecturing activities, and is a co-author of accounting related publications.
Education:
Mrs. Khachatryan graduated from Yerevan Institute of National Economy as an Economist.
GOVERNANCE REPORTMANAGEMENT BOARD
GOVERNANCE REPORT
Samvel AghababyanMember of the Management Board, Head of Security Services
Born on December 21, 1973
Samvel Aghababyan was appointed member of the Management Board of Ameriabank in February, 2012.
Skills and Experience:
Mr. Aghababyan has brought the valuable experience gained at the National Security Service of Armenia (1996-2007) and has focused his endeavors on the design and development of security services (including IT security and collection services as part of the Bank’s checks and balances system) at Ameriabank. As a result, Ameriabank is known for its exceptional and unique security structure in the market. Mr. Aghababyan joined Armimpexbank CJSC (currently Ameriabank) as Advisor to the General Director (2007) then he was appointed Head of Security Service (2008-present).
Andranik BarseghyanMember of the Management Board, Head of Risk Management Centre
Born on May 9, 1972
Andranik Barseghyan was appointed member of the Management Board of Ameriabank in December, 2009.
Skills and Experience:
Mr. Barseghyan has a distinguished career in banking, economics and risk management. Mr. Barseghyan started his career in banking technologies in the Department of Bank Technologies Automation at Armagrobank in 1995. Moving up the career ladder from an entry level to senior and leading specialist in the Automation Department, he was promoted to Chief Economist, later Head of the Liquidity and Resources Management Unit, then Head of Bank Risks Regulation Division, and finally Head of the Automation Division (1995-2002). In 2003, Mr. Barseghyan became
He has also served as Member of the Management Board of Ameriabank since February, 2012.
Education:
Mr. Aghababyan graduated from Yerevan Institute of Jurisprudence and Management. He received lawyer’s qualification at Moscow New Law Institute. In 2003-2004, he had accomplished executive security program at the Academy of Federal Security Service of the Russian Federation.
TOPTOPCONTENTS CONTENTS

78 79
Head of the Reporting & Analysis Division of Converse Bank. Later he was appointed Head of the Department of Risk Management and member of the Management Board of the Converse Bank. Mr. Barseghyan joined Ameriabank’s team in 2009 as head of the Risk Management Centre and member of the Management Board.
Mr. Barseghyan has authored a number of research papers and publications locally and internationally, some of which focus on bank management. He is a member of EURO working group on financial modeling (Erasmus University, Rotterdam).
Education:
Mr. Barseghyan graduated from the State Engineering University of Armenia (SEUA), Faculty of Computer Engineering and Informatics. He received a Master’s Degree at SEUA, followed with a PhD in Engineering (Candidate of Technical Sciences).
Burastan MovsisyanMember of the Management Board, Chief Technology and Services Officer
Born on June 23, 1972
Burastan Movsisyan was appointed member of the Management Board of Ameriabank in June, 2014.
Skills and Experience:
Mrs. Movsisyan had more than 15 years of experience in telecommunications when she joined Ameriabank in 2013. Mrs. Movsisyan worked at Beeline Armenia (formerly Armentel CJSC) in multiple positions (1996-2013), in particular serving as Head of Mobile Communication Department and Sales Director and Head of Customer Service. She played a critical role in implementation of communication-related projects in Armenia, including mobile and roaming services. Her unique experience in this adjacent industry that progressively integrates with
banking in the modern digital era is yet another strategic investment in successful innovation and transformation of banking technologies at Ameriabank.
Mrs. Movsisyan joined Ameriabank in September, 2013, as Chief Technology and Services Officer. In June, 2014, she was appointed to the position of the member of the Management Board-Chief Technology and Services Officer.
Education:
Mrs. Movsisyan graduated from Yerevan State University, Faculty of Physics. Mrs. Movsisyan participated in a number of executive trainings and received certification in communications from MACH, Luxembourg-based telecommunications company.
GOVERNANCE REPORTMANAGEMENT BOARD
A meriabank’s key landmark is to build and retain a Dream Team with its unique corporate culture.
The members of Ameria Dream Team have great potential with innovative thinking, are purposeful, daring flexible to changing economic environment and are always up-to-date with the cutting-edge technologies. Thanks to its teammates Ameriabank is the leader by its growth pace and absolute position in key financial indicators in the Armenian banking sector. Organization’s stability and growth is based on people who work and create together in the same culture. People are the greatest asset for Ameriabank which is valued above all else. The employees are provided with opportunities to build their career and accomplish their professional goals with the Bank, and ultimately make their and their families’ lives better.
Training & Development
Ongoing professional development is an intrinsic part of Ameriabank’s culture; it is based on effective synergy of self-development and guidance and investment on the part of employer. One of the essential components of the development program is executive trainings for top and mid managers, master
GOVERNANCE REPORTOUR PEOPLE
by and within Ameriabank.
Diversity and Recruitment underVarious Social Programs
Ameriabank is always open for enthusiastic, motivated, driven, ambitious and innovate people and is ready to invest in their professional development. For this purpose Ameriabank widely practices mentoring approach to ensure smooth onboarding and integration both for beginners and experienced professionals joining the team.
Ameriabank continues to cooperate with the best universities and colleges of Armenia as well as diaspora expanding its network of partners. Already around 200 young aspiring self-starters have joined the team through various programs for beginners, such as internship for students and “Generation A” program. In 2017 Ameriabank successfully launched the 7th “Generation A” program. This program is a perfect opportunity for 20-25 year-old graduates to gain theoretical and practical insight into finance and banking. They can interact with experienced professionals right on the site, see how business is done, learn about the corporate culture of the Bank,
classes conducted by world-class practitioners, professors, including founders of leading business schools, with years of global expertise.
On-the-job staff training (OJT) in cooperation with various international institutions is another valuable element of training and development, which has become a tradition in Ameriabank. It is also customary for Ameriabank staff to be actively involved in distance learning programs, regularly attend various webinars and international qualification programs in response to modern needs and technologies. During last year the Bank had a high rate of staff participation in online courses by such internationally-acclaimed schools as Stanford University, Chartered Management Institution, CFA Institute, ACCA and others, enabling the staff to balance studies and work, while acquiring most up-to-date and competitive knowledge. The Bank also maintains a continuously updated library, which gives the staff access to extensive repository of professional literature, both electronic and paper-based.
During 2017, Ameriabank employees attended 2,940 trainings. For the past 10 years the Bank staff participated in 23,885 trainings and workshops abroad and in Armenia, including seminars organized
TOPTOPCONTENTS CONTENTS

80 81
and then start their career path as professional recruits.
Another key aspect for Ameriabank is repatriation. The Bank encourages young talents to return to Armenia after completing their education or gaining professional experience abroad. Thus, Ameriabank actively cooperates with various foundations to create internship and job opportunities for this target group. Yet another reason to target diaspora candidates for Ameriabank is attracting key specialists with extensive knowledge and experience gained in international markets which can be invested in Armenia and create added value for the economy of the country.
Last but not the least Ameriabank is committed to equal opportunities policy, actively cooperating with organizations that help disabled people integrate into the professional job market. Ameriabank is open and always welcomes bright and talented team members with locomotor and other disabilities.
Recruitment process in Ameriabank includes internal promotions as well as external recruitment, giving current staff the opportunity to step up the career ladder and/or change their specialization. In 2017, about 4% of the staff members were promoted to managerial positions.
Employee Benefits
Motivating best employees is as important as nurturing young talents; the stronger the incentive,
based on which the available package of employee benefits was reviewed. Currently Ameriabank has an extensive package of benefits (special terms for banking, enabling staff to use banking services at minimum or no financial cost, health, travel and accident insurance, professional training and education opportunities, 40 hours of paid absence per year, etc.).
GOVERNANCE REPORTOUR PEOPLE
the longer and deeper the commitment and dedication to the team and organization’s mission and goals. In this respect it is essential to have a robust incentive system and permanently competitive benefits package. To ensure competitiveness, since 2012 Ameriabank has participated in salary and compensation survey of Armenia conducted by a leading audit company. The Bank also conducted satisfaction and motivation surveys among its staff
Total number of employees (as of YE 2017)
People at a glance
GOVERNANCE REPORT
TOPTOPCONTENTS CONTENTS

82 83
legaldirector
legaldepartment
AdministrativeLegal andLitigationPractice
Unit
BusinessDirections
LegalSupport
Unit
CorporateGovernance
Unit
INVESTMENTbanking
director
INVESTMENTbanking
department
BrokerageUnit
DealingCenter
tradingdepartment
tradingdirector
developmentdepartment
developmentdirector
Innovation&
QualityUnit
CRMUnit
PR &Marketing
Unit
Strategy&
ResearchUnit
OutreachUnit
IT &Automation
division
Operationaldepartment
administr ation
chief
technologyand
servicesofficer
Programming
Unit
ITAdministration
Unit
TechnicalSupport
Unit
AdministrativeUnit
BranchSet - Up
Unit
Administrative& Economic
Service
Payment&
Account
operationsUnit
Investment Operations
Group
CreditFacilities
ProcessingUnit
CustomerTransactions
UnitPayment
Instruments & Special(Escrow) Accounts
Unit
TradeFinance Division
CorporateClient
Managers’Service
CommercialCreditingDivision
corpor atebankingdirector
corpor atebanking
department
BigEnterpriseLending
Unit
SMELending
UnitFactoring
Unit
LeasingUnit
TaxPlanning
&Operations
Group
AccountingCenter
ExternalReporting
Group
CashOperations
Unit
Treasury Operations
Book-Keepingand
InternationalRelations
Unit
MI &FinancialPlanning
Unit
ALCMGroup
cfo-deputygeneraldirector
financialdepartment
ALCM,MI &
FinancialPlanningDivision
Treasury
ChiefAccountant
board ofdirectors
GENERAL MEETING OF
SHAREHOLDERS
generaldirector
HRMUNIT
INVESTORRELATIONS
UNIT
OPERATIONALCONTROL
UNIT
advisors
management board
Financical
Monitoring
Service
Board Secretariat
INTERNALAUDIT
DEPARTMENTInternalAudit Service
IT AuditUnit
securityservice
Riskmanagement
center
PaymentCardsUnit
Salary Projects Group
Card acquiring network
management unit
retailbankingdirector
retailbanking
department
Individualand
Premium ClientsManagers’
Service
IndividualClient
Managers’Unit
Branches Coordination
Division
RetailCredit Division
Contact
Center
PaymentSystems Group
CorporateFinance
Unit
DirectInvestments
Unit
AssetManagement
Unit
Mergers andAcquisitions
Unit
CapitalMarkets
Unit
Loans Processing and
Portfolio Maintenance
Group
GOVERNANCE REPORTORGANIZATIONAL CHART
TOPTOPCONTENTS CONTENTS

84 85
tHINKONE STEP AHEAD, TACKLE SWIFT CHANGES aND BUILD SECURITY IN ANY ENVIRONMENT
RISK MANAGEMENTRISK MANAGEMENT OBJECTIVES AND PRINCIPLES
Risk Management Policy of Ameriabank sets:
► The minimal criteria required for implementation of risk management system,
► Risk management objectives and principles,
► The allocation of authorities between the Bank’s decision-making bodies and other authorities in relation to risk-bearing operations,
► The key benchmarks and criteria of operations,
► Terms and conditions of exercising control over them,
► Other provisions.
Risk management is implemented by the Bank’s Board of Directors, Management Board, managers and other employees, starting from the development of the Bank’s strategy and involving all aspects of the Bank’s operation. By conducting this, the Bank aims at identifying and managing risks related to the Bank’s operations, and control of the Bank’s risk appetite (the acceptable level of risks for the Bank). Ameriabank’s Risk Management Policy is an integral part of the Bank’s development plans and serves as a basis for regulating the Bank’s risk-bearing
processes. It is a unity of principles adopted by the Board of Directors aiming to effectively organize the Bank’s operation by minimizing the probability of occurrence of adverse events. Provisions of the risk management policy are applicable to the Board of Directors, Management Board, Chairman of the Management Board - General Director, committees and all employees of the Bank. Risk management policy is subject to regular revision, depending on the Bank’s strategy and the current economic environment.
The Bank’s Risk Management Unit performs risk assessment on a monthly basis and reports the results to the Bank’s Management Board or specialized committees (Credit Committee, Assets and Liabilities Management Committee, etc.) as well as to the Bank’s Board. The primary goals of risk management in the Bank include:
► Creating quality portfolios of bank instruments which will maximize value for the Bank with minimum risks,
► Eliminating or minimizing losses caused by potential risks,
► Maintaining the profitability, liquidity and solvency ratios at an acceptable level.
The goal of risk management in the Bank is to be
achieved by fulfilling the following objectives:
► Timely identification of potential risks in the course of the Bank’s operation,
► Identification of factors impacting the specific types of risks,
► Qualitative and quantitative assessment of specific risks,
► Approving the acceptable risk limits,
► Collecting, processing and communicating appropriate information on potential risks to the management bodies,
► Approving the methods of internal control (monitoring) of risks,
► Defining the responsibilities of the Bank’s Board and the members of executive body for managing specific types of risks,
► Development of appropriate measures for managing risks,
► Control over the implementation of such measures.
The following are the key conditions for timely identification of risks: regular monitoring of
TOPCONTENTS

86 87
the Bank’s key internal prudential standards and adherence to acceptable risk limits; regular analysis of changes in the Bank’s balance sheet; adherence to the key prudential standards established by the CBA; various stress-scenario estimates; availability of internal regulations pertaining to management of specific risks in the Bank, describing the methodology and mechanisms of identification and management of risks, which would enable the Bank to timely address and manage them.
The Bank’s risk management policy is based on the following principles:
► Unified risk management system is implemented in the Bank and is one of the elements of the Bank’s strategic management.
► Risk management in the Bank has a proactive role and has a permanent and continuous nature. Risks are identified and duly assessed within all processes of the Bank and appropriate measures are constantly being taken to ensure adequate management of the latter.
► The Bank’s risk management system is based on a risk/income ratio of maximum accuracy. The Bank selects those risk-generating transactions which can be assessed and effectively handled
by the latter.
► The Bank strives to know its clients and understand their financial needs. The Bank avoids cooperating with the clients without having proper information on their financial position. The Bank is governed by the KYC (Know Your Customer) principle in its interaction with clients.
► The approval of risk-generating instruments is based on a “four-eye” principle, in some instances also involving independent risk management specialists (e.g. loan applications are approved by one credit officer and one authorized risk management officer). Approval process for each instrument is defined in details by the relevant policy and/or procedure.
► The scope of authorities (including approval limits) and responsibilities is clearly specified and documented for each of the Bank’s instruments and processes. Moreover, internal control mechanisms are documented for each process.
► Deviations from the Bank’s policies and other internal regulatory acts are authorized by the body approving the policy in question or the body having the relevant authority (Management
Board, Board of Directors).
► Each business within the Bank is responsible for identification and regular monitoring of risks.
► Relevant Management Information Systems (MIS) are in place, enabling more effective portfolio management.
► The risk management approach for each banking instrument (approval limits, acceptable parameters, portfolio volume, variances from adopted policies, etc.) is established by the relevant internal regulations and/or policies which are also subject to confirmation of the Risk Management Unit.
► The effectiveness of risk management function is regularly assessed by the Bank’s internal audit.
► The Bank’s operations are regularly analyzed and assessed by the Bank’s management bodies.
The Bank’s risk management system includes the following elements:
► Risk appetite: the Board defines the acceptable level of losses/risk. The risk appetite is structured around all the types of risks (i.e. credit, market
RISK MANAGEMENTRISK MANAGEMENT OBJECTIVES AND PRINCIPLES
and operational risks). Risk parameters and limitations to be managed are set depending on the risk appetite (acceptable loss) assigned to each type of the risk.
► Standards and reports: this structural element includes determination of (i) instruments approval standards, (ii) risk categories, (iii) instrument-specific standards, and (iv) management reporting standards (standardization).
► Limits and rules: approval, portfolio limits and appropriate rules are established for all instruments of the Bank.
► Investment guidelines and policies: the Bank’s investment strategies, criteria and acceptable level of variances are established. These guidelines serve as a basis for the Bank’s hedging, asset/liabilities management and other policies.
► Risk/income ratio: all instruments of the Bank are based on risk/income ratio both for the Bank and for the employees involved in the appropriate process. Accordingly, relevant employee incentive mechanisms are developed.
RISK MANAGEMENT
TOPTOPCONTENTS CONTENTS

88 89
RISK MANAGEMENTRISK APPETITE
R isk appetite is the acceptable level of possible losses/risk the Bank is ready to undertake,
which may be managed and recovered during a short period out of the available resources without any negative impact on the short/mid-term goals and plans of the Bank. The acceptable loss recovery period is 6 months. The Bank’s risk appetite is the level of losses the Bank is ready to undertake, which may not exceed 10% of the Bank’s capital book value, to be distributed among credit, market and operational risks at 60%, 30% and 10% respectively. Credit risk appetite is the amount of net losses on the loans and advances issued by the Bank (loan loss allowance). Market risk appetite with regard to the currency risk is the negative revaluation (loss) resulting from the open FX position; with regard to the floating rate risk, A&L maturity gap risk - possible losses resulting from interest rate changes; with regard to the investment risk - losses resulting from revaluation of securities portfolio due to the market price changes; Operational risk appetite relates to losses resulting from operational failures in the Bank’s processes/IT systems.
Risk appetite is managed by: ALCO/Large Credit Committee - where low and medium risks are taken into consideration, Management Board - in the high risk zones and Board of Directors - if the limit is breached.
RISK MANAGEMENTKEY RISKS AND RISK PROFILE
Within the framework of risk/return based approach and distribution of attributable Risk
Appetite the Bank uses different methods and tools to assess and mitigate the risk which is considered as the uncertainty about future negative occurrences. It is defined as the probability of occurrence of events likely to affect the Bank’s operations and implementation of its strategic goals, together with possible losses as a result. The risks to which the Bank is exposed or is likely to be exposed include both internal and external circumstances which may endanger the continuity of the Bank’s operations or have adverse effect on the Bank’s equity or profit.
The Bank’s risks are categorized into credit risks, market risks, operational risks and other risks.
Credit risk: the Bank is exposed to credit risk of losses due to the failure of clients or counterparties to meet their obligations to settle outstanding amounts in accordance with agreed terms. Credit risk is the most material risk faced by the Bank as long as it is engaged mainly in traditional lending activity with a simple balance sheet. Due to high dollarization of the economy, currency induced credit risk is one of the significant components of credit risk, which relates to risks arising from foreign currency-denominated loans to un-hedged borrowers in the Bank’s portfolio. Credit risk also includes concentration risk, which is
the risk related to credit portfolio quality deterioration due to large exposures provided to single borrowers or groups of connected borrowers.
A strong credit risk management function is critical for maintaining a balanced loan portfolio and delivering sustainable returns. For that purpose, a prudent credit risk environment has been established focusing on maintenance of efficient processes for credit risk identification, measurement, and monitoring. Credit risk management by credit risk teams - retail and corporate risk management teams - is performed both on a transaction and portfolio level. Credit risk management units are involved in transaction level analysis, loans risk rating and approval. Special internal risk evaluation, rating methodologies are applied. Credit risk management is aimed at portfolio oversight and quality monitoring as well as development and maintenance of the credit risk management framework based on stress testing, system of early warning and key risk indicators and parameters, sector-based analysis and monitoring.
The Bank uses risk oriented monitoring system to timely react to market developments identify weaknesses in the credit portfolio and outline solutions to make grounded risk management decisions. Monitoring processes encompass individual credit exposures, overall portfolio
performance and external trends that may impact the portfolio’s risk profile. Early warning signals serve as an important early alert system for the detection of credit deteriorations, leading to mitigating actions. Statistical analysis is applied to the monitoring of the overall performance of the portfolio. Regular oversight of monitoring and selective review is conducted by the credit risk management unit. The corporate credit risk management team is responsible for on-site monitoring of business loans. This process enables to promptly identify risky loans at an earlier stage and undertake corresponding actions.
The team analyses trends of the portfolio on a regular basis, including total credit portfolio exposure, portfolio quality, migration analysis, concentrations and portfolio quality performance and presents its findings in the Credit risk report to the Credit Committee on a monthly basis. Furthermore, reports related to the quality of the credit portfolio are presented to the Management Board and Board of Directors on a monthly basis. With the help of implemented credit risk management system the Bank is able to identify and mitigate the risks by amending its policies in a timely manner.
Market risk: market risk assessment and mitigation in the Bank is based on the same risk/return approach with dedicated risk appetite which in a turn
TOPTOPCONTENTS CONTENTS

90 91
is distributed between the following risks: interest rate risks, price risks, currency risks, equity price risks. Market risk exposure arises from mismatches of maturity, currency and interest rate structure between the assets and liabilities, all of which are exposed to market fluctuations, particularly in the prices of securities, real estate, other fixed assets owned by the Bank or attracted as collateral.
Generally, market risks are managed by ALCO. The Bank aims to manage market exposures, set up limitations and decision making system in order to keep possible market losses within the set risk appetite. Early warning and key risk indicators in line with a wide range of stress tests are aimed to build up estimates for different market scenarios and help to understand the limits of adequate market exposures distributed by all market risk sources. Scenarios for stress tests are being updated periodically according to market conditions. The set of risk parameters are designed intertwined with obligatory actions, responsible persons and zones of risk level, proper rules of reporting and decision making. The whole system of market risk management is reviewed and upgraded periodically in accordance with the Bank’s product line development and market conditions.
Currency risk: the Bank is exposed to currency risk due to large volume of assets and liabilities denominated in foreign currency (USD in majority), which in pair with weak liquidity on the local market, become the reason of open currency positions. In such environment currency exchange rate
fluctuations can move the value of risk weighted assets, moreover can build up pressure on the Bank’s Capital and CAR ratio. In order to mitigate currency risk the Bank applies VaR methodology for 250 days historical rates considering different currency rate historical correlations. The risk parameters system also includes aggregate currency open position parameters, which are limited by relevant zones of risk, decision makers and actions to be taken in case of limit violation. Several stress tests each with 3 main scenarios are used for early prediction of currency risk, open position loss, RWA growth with effect on Bank’s Capital, CAR ratio and liquidity. Additionally Ameriabank uses a more complicated extreme value approach which is based on a simulation engine and provides currency risk measures of high confidence level and used for operative exposure (expected loss) control.
Interest rate risk is considered to be the risk of reduction of net interest income over fixed time horizon due to changes in market interest rates. The other side of exposure is investment portfolio while part of securities are rate sensitive and debt instruments yield market fluctuations can generate losses leveraged by duration. Another source of interest rate risk is the non-zero gap between assets and liabilities under floating rate (LIBOR mainly). Since floating rate lending products are not well developed on local market, open position is exposed to floating rate volatility.
Exposure to interest rate risk is controlled and
mitigated via a large number of risk parameters, covering the fixed rate repricing gap value, the unhedged part of floating rate position and the security portfolio. There are more than 30 different layers in interest rate risk parameters system. The security portfolio risk is managed with a separate policy comprising portfolio parameters, stress testing, asset allocation decision making limits and early warning indicator systems which are updating in line with the growth of Bank’s business. The general policy set by the Board of Directors and managed by ALCO and the Management Board, implies the limitation of exposure to interest rate risk to be under specific risk appetite size. Possible loss is estimated based on stress testing scenarios.
Price risk: the Bank is exposed to price risk in terms of credit loss coverage reduction due to market fluctuations of collateral prices and equity instruments price fluctuations. The main source of price risk is supposed to be real estate pledge depreciation risk. The price risk also arises due to possible changes in market prices of equity instruments, commodities, fixed assets, movable collateral and other possible financial instruments affecting price risk.
The price risk is essential in terms of credit risk, when price fluctuations on real estate market can generate large uncovered credit exposures due to increase of LTV ratio. Another part of credit risk , which is related to price risk is the risk of reduction of creditworthiness of borrowers involved in international trade who hence could be exposed to market price risk of
RISK MANAGEMENTKEY RISKS AND RISK PROFILE
different goods and commodities. Systematic creditworthiness decay of domestic businesses is a part of macro environment risk monitoring. These risks are covered through tightening lending terms, system of limits for deviations, decision making solid hierarchy incorporated in global risk parameters system. The Bank has developed certain set of action plans to ensure business continuity and early reaction to handle the risks connected with possible price shocks, which are estimated within the general stress testing framework.
Liquidity risk is considered to be the risk that the Bank will not be able to meet its debt obligations without realizing essential losses. The liquidity risk can become essential in case of large gaps in assets and liabilities time structure, weak diversification of balance sheet, single large depositors and borrowers concentration, currency shocks on financial market with deposits outflow or conversion to foreign currency, lack of liquidity on financial markets, problems with quality of security portfolio, unexpected inaccessibility to financial instruments (repos, swaps, overnights, etc.) The Bank tends to ensure adequate level of highly liquid assets taking into account the volume of demand as well as short term liabilities and total assets. Allocated long term assets should have maximum liquidity through minimum losses in terms of profitability. The structure of highly liquid assets in terms of currency, cash and non-cash funds is subject to the structure of the Bank’s liabilities. While allocating funds the Bank tries to ensure diversification of instruments and continuous reduction of concentrations through
diversified distribution of funds per clients, groups of clients, tools, industries, etc., the Bank also defines and controls the weight of the allocated funds in the Bank’s total assets. The liquidity risk parameters (such as concentration, assets and liabilities gaps, interest rate gap, high liquid assets ratio’s and others) are set up in risk parameters’ system and the management of the latter is conducted within the general risk management framework including risk level limitation, reporting principles, action plans, decision making policies, specific responsible persons and stress testing principles.
Operational risk arises in the Bank as a result of failure or malfunctioning of internal processes and systems, as well as human factor, or external events. It includes legal risks, but excludes strategic and reputational risks.
To achieve these goals the Bank permanently and consistently performs identification and measurement of operational risks. A united system is used to manage the risk level.
Before launching new processes/products, the Bank assesses them in terms of their significance and sensitivity of the Bank to the operational risks connected with them. All the parties and/or units related to the newly launching process or product should be included in this review process. The business-processes and/or products are developed based on the results of this process. The risk likelihood-impact assessment plays a critical role
in the assessment of process-related and system-related risks. In order to be able to authentically calculate the likelihood and impact of incidents, the Bank keeps a database on operational incidents and losses. This database gives an opportunity to analyze sources of risks, their nature, identify the reasons and trends and make an internal calculation of capital volume required to cover the operational losses that may arise in future. The Bank also implemented a model of capital distribution per product using an in-house methodology. This model enabled the Bank to identify the priorities in assessment of the product issuance-related processes and systems.
To be protected from major emergencies, the Bank holds insurance policies to cover assets, operations, liabilities and its employees in line with best business practices. The Bank insures assets against a range of risks, including fire, lightning, flood, theft, vandalism as well as obtains third-party liability insurance coverage for its clients. The Bank also maintains Bankers’ Blanket Bond and Directors’ and Officers’ Liability Insurance.
Strategic risk arises when changes in market conditions, customer behavior and technology appear, which may impact the Bank’s results negatively if adaptability to the environment is compromised. Respectively the Bank is exposed to strategic risks.
Strategic risk management framework is based on periodic strategic discussions and planning,
RISK MANAGEMENT
TOPTOPCONTENTS CONTENTS

92 93
performance reporting to the Board of Directors and Management Board and ongoing control of all specific directions of development. The strategic planning and implementation processes in the Bank are subject to the Procedure of Strategic Analysis, Business Planning and Monitoring.
Twice a year the Bank holds strategy sessions to discuss the Bank’s strategy, goals and objectives for the upcoming years and submit them to the Board of Directors for review. The strategy sessions are followed by business planning for a 3-years perspective. Once the business plan is approved, it may be revisited only for essential amendments.
Moreover, the business plan performance is quarterly reviewed and discussed with the directors of corresponding lines to be further presented to the Management Board for and Board of Directors.
Environmental risk is an actual or potential threat of adverse effects on environment by effluents, emissions, wastes, resource depletion, etc., arising from the organization’s activities or the risk that a certain business activity will cause destruction to the surrounding natural environment. Environmental risk management seeks to define what environmental risks exist and then determine how to manage those risks in a way best suited to protect human health and the overall environment.
Social issues may emerge in the workplace of a client’s/investee’s operations and may also impact surrounding communities. Ameriabank has adopted the best international practices of environmental and social risk management and is committed to ensure that its clients (borrowers) properly comply with environmental and social obligations as well. The key elements of environmental and social risk management system are:
► Environmental and Social Risk Management Policy,
► Environmental and Social Risk Management Instruction,
► Tools required for introduction and implementation of the process.
The Bank has an environmental and social coordinator and an environmental and social risk management specialist responsible for implementation, maintenance and daily operation of the system.
The Bank is also exposed to other types of risks, such as reputational risk, compliance risk, legal risk and AML risk.
Reputational risk is the possible loss of the organization’s reputational capital resulting in
decline of the organization’s overall value and/ or increase of regulatory or other costs. It includes adverse events related to ethics, safety, security, sustainability, quality, and innovation. Reputational risks are managed on the level of the Management Board. In order to ensure sound decision making different departments, such as Customer Relations Management, PR, Security and other related teams are involved in the processes, where the Bank can be exposed to a reputational risk.
Reputational risks are mitigated through a dedicated body - Disclosure Committee. The Committee qualifies information as inside or not, approves the list of spokespeople, insider lists, disclosure IR announcements and advises on answers to public inquiries as well as market rumors.
Compliance risk is whan the Bank is exposed to compliance risk given that it is governed by local regulations as well as creditor covenants. Compliance risk is managed by a dedicated unit, legal service and ALM teams. The Bank meets regulator’s requirements and applies international standards to cover possible discrepancy in internal regulatory acts.
These risks are covered by internal policies and procedures, three level decision making and control structure including special units, specialized committees and the Management Board.
RISK MANAGEMENTKEY RISKS AND RISK PROFILE
RISK MANAGEMENT
Macroeconomic Risk Factors
Main factors that restrained the economic growth of RA and the banking sector during the reporting period are: still weak gross capital formation and low domestic demand even with the recovery growth registered in 2017, limited foreign direct investments; expectations of population and businesses (for more details on the macroeconomic analysis of Armenia, please see External Environment, Strategic Report).
Macro environment improved in comparison with the previous 3 years, and in 2017 Ameriabank operated under moderate risk pressure: all risks were within acceptable limits, including the Bank’s credit risk indicators. The credit risk level (NPL) improved essentially by year-end and was way below the Armenian banking sector average.
The main pressure on the quality of banking sector’s loan portfolio in 2017 was still weak domestic demand; low levels of remittances recovery and foreign direct investments; risks connected with local currency depreciation that may have had their negative influence on domestic demand, wages and loan servicing ratio.
Essential risks in 2017 were connected with oil and metal price volatility, Russian economy slowdown due to sanctions, geopolitical tensions, political decisions in the USA, uncertainty on the global debt market. The economic situation in Armenia was characterized with 110.2% economic activity index for 2017/2016and with GDP figure of 7.5% for 2017. The risk of armed conflict in the region relatively stabilized, but the problem is still valid and may be raised and affect local financial market.
CBA rates were decreased to 6.5%in 2017 (by 0.25%), obligatory reserves regime was still strict. There was a strong trend to market interest rate decrease, which influenced the Bank’s indicators. Obligatory reservation regime kept AMD exchange rate stable, but further tendencies are uncertain. LIBOR rate had strong growth tendency, which was mostly connected with Federal Reserve Funding rate expectations and growth in 2017. It has put pressure on the Bank’s IRR gap.
The planned risk appetite of the Bank in 2017 did not exceed the limit. Moreover unused buffer was 24% from total limit and actual losses were fully covered by the Bank’s capital. CAR level was acceptable throughout the year. Credit risk was the main source of risks in 2017. Actual losses from other sources of risk were insignificant.
TOPTOPCONTENTS CONTENTS

94 95
RISK MANAGEMENTKEY RISKS AND RISK PROFILE
Macro Environment Risks
Risks and Uncertainties
Main factors that influenced the economy of RA and the banking sector during the reporting period were low domestic demand, affected mainly by the Russian economy, limited foreign direct investments, still low levels of remittances, the risk of armed conflict in the region,
Macroeconomic Indicators:
GDP growth: 7.5%;
CPI: 2.7%;
FDI decreasing trend since 2008, decreased ~3 times;
Net Remittances increased by 2.1%;
Armenian banking sector:
NPL average: 5.0%;
CAR: 18.6%;
ROE: 5.7%;
Liquidity ratios exceeded regulator limits almost twice;
Total equity grew by 8.2%.
Actions Performed
Based on trends and expectations in 2017 the Bank:
► Defined lending regimes appropriate to macro risks/environment and internally announced reflective Optimistic regime for second half of 2017,
► Eased credit policy for reliable borrowers,
► Concentrated on non-performing loans recovery and risky loans monitoring
► Bank tried to enlarge credit product line, to enhance diversity and to attract new clients from the market.
RISK MANAGEMENT
Credit Risk
Risks and Uncertainties
During 2017, the Bank operated under an optimistic regime and medium credit risk pressure. Starting from the second half of 2016 the Bank’s credit risk indicators showed positive dynamics.
Key Risk Indicators
The Bank’s NPL5 showed positive dynamics by the year-end this indicator 3.5% was significantly lower than the industry average 5.3%. At the same time corporate segment loans’ NPL was 3.4%, and retail segment portfolio NPL was around 4.3%.
The cost of credit risk concluded to 1.2% of the loan portfolio. Loan loss reserves covered 80.7% of total NPL (without adjustments through pledge value). Sector concentrations were at a low level, maximum concentration for the biggest wholesale trade sector did not exceed 19.0% of loan portfolio. The quality of portfolios in different sectors improved on during the year, except only two sectors namely Industry and Human health due to one borrower influence.
Key risk indicators were flat. Overdue loans fraction significantly decreased and showed the positive tendency during the year.
Risk Mitigation Actions in 2017
► Actions performed in order to stimulate lending to the borrowers with strong financials and in general, some parameters eased to attract more low risk clients.
► Risk based pricing approach implemented in lending.
► New system developed for scoring based retail lending via digital channels and appropriate risk appetite allocated for that purpose.
5 NPL ratio is calculated by dividing the overdue loans to total loan portfolio. TOPTOPCONTENTS CONTENTS
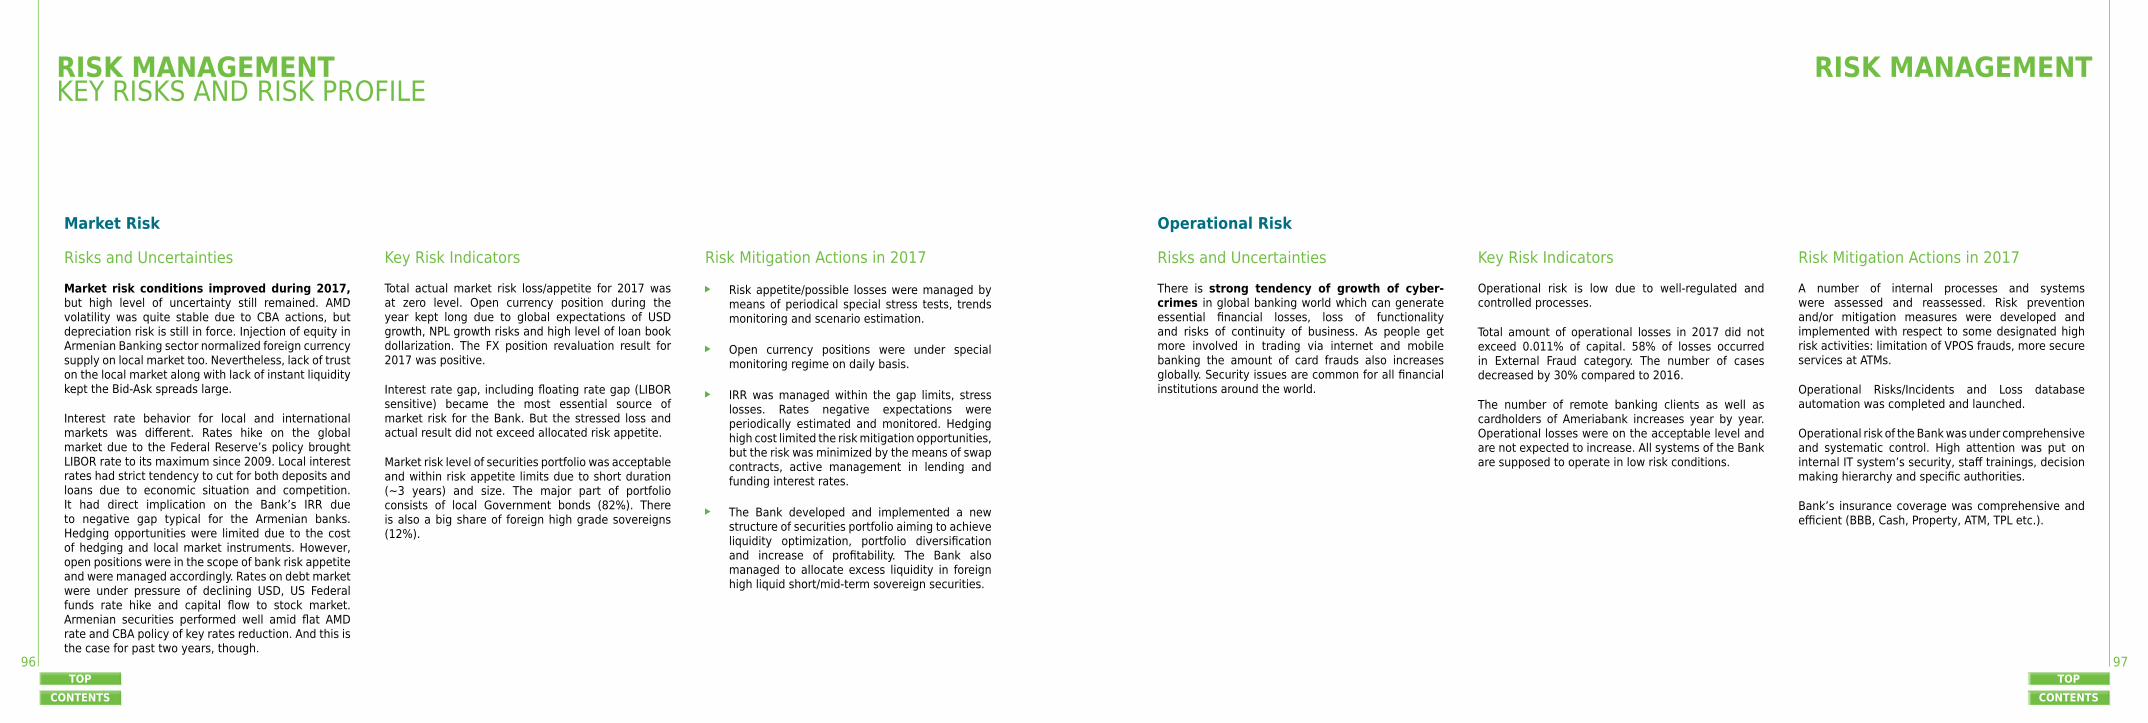
96 97
Market Risk
Risks and Uncertainties
Market risk conditions improved during 2017, but high level of uncertainty still remained. AMD volatility was quite stable due to CBA actions, but depreciation risk is still in force. Injection of equity in Armenian Banking sector normalized foreign currency supply on local market too. Nevertheless, lack of trust on the local market along with lack of instant liquidity kept the Bid-Ask spreads large.
Interest rate behavior for local and international markets was different. Rates hike on the global market due to the Federal Reserve’s policy brought LIBOR rate to its maximum since 2009. Local interest rates had strict tendency to cut for both deposits and loans due to economic situation and competition. It had direct implication on the Bank’s IRR due to negative gap typical for the Armenian banks. Hedging opportunities were limited due to the cost of hedging and local market instruments. However, open positions were in the scope of bank risk appetite and were managed accordingly. Rates on debt market were under pressure of declining USD, US Federal funds rate hike and capital flow to stock market. Armenian securities performed well amid flat AMD rate and CBA policy of key rates reduction. And this is the case for past two years, though.
Key Risk Indicators
Total actual market risk loss/appetite for 2017 was at zero level. Open currency position during the year kept long due to global expectations of USD growth, NPL growth risks and high level of loan book dollarization. The FX position revaluation result for 2017 was positive.
Interest rate gap, including floating rate gap (LIBOR sensitive) became the most essential source of market risk for the Bank. But the stressed loss and actual result did not exceed allocated risk appetite.
Market risk level of securities portfolio was acceptable and within risk appetite limits due to short duration (~3 years) and size. The major part of portfolio consists of local Government bonds (82%). There is also a big share of foreign high grade sovereigns (12%).
Risk Mitigation Actions in 2017
► Risk appetite/possible losses were managed by means of periodical special stress tests, trends monitoring and scenario estimation.
► Open currency positions were under special monitoring regime on daily basis.
► IRR was managed within the gap limits, stress losses. Rates negative expectations were periodically estimated and monitored. Hedging high cost limited the risk mitigation opportunities, but the risk was minimized by the means of swap contracts, active management in lending and funding interest rates.
► The Bank developed and implemented a new structure of securities portfolio aiming to achieve liquidity optimization, portfolio diversification and increase of profitability. The Bank also managed to allocate excess liquidity in foreign high liquid short/mid-term sovereign securities.
RISK MANAGEMENTKEY RISKS AND RISK PROFILE
RISK MANAGEMENT
Operational Risk
Risks and Uncertainties
There is strong tendency of growth of cyber-crimes in global banking world which can generate essential financial losses, loss of functionality and risks of continuity of business. As people get more involved in trading via internet and mobile banking the amount of card frauds also increases globally. Security issues are common for all financial institutions around the world.
Key Risk Indicators
Operational risk is low due to well-regulated and controlled processes.
Total amount of operational losses in 2017 did not exceed 0.011% of capital. 58% of losses occurred in External Fraud category. The number of cases decreased by 30% compared to 2016.
The number of remote banking clients as well as cardholders of Ameriabank increases year by year. Operational losses were on the acceptable level and are not expected to increase. All systems of the Bank are supposed to operate in low risk conditions.
Risk Mitigation Actions in 2017
A number of internal processes and systems were assessed and reassessed. Risk prevention and/or mitigation measures were developed and implemented with respect to some designated high risk activities: limitation of VPOS frauds, more secure services at ATMs.
Operational Risks/Incidents and Loss database automation was completed and launched.
Operational risk of the Bank was under comprehensive and systematic control. High attention was put on internal IT system’s security, staff trainings, decision making hierarchy and specific authorities.
Bank’s insurance coverage was comprehensive and efficient (BBB, Cash, Property, ATM, TPL etc.).
TOPTOPCONTENTS CONTENTS

98 99
Liquidity Risk
Risks and Uncertainties
Liquidity level in the Armenian banking sector is very high due to equity injection which was required by the CBA in order to improve domestic banking sector’s reliability and money demand.
Excessive supply of liquidity put pressure on both borrowing and lending interest rates and lending risk parameters. Long RSA and short RSL in balance sheet structure may cause huge problems for banks in case of interest rate rollback.
Key Risk Indicators
All liquidity ratios met regulator’s requirements even under the worst stress scenarios.
During 2017 liquidity risk was insignificant and was mitigated within the general risk parameters framework.
Stress testing on liquidity GAP showed very optimistic results even under most risky scenarios.
Risk Mitigation Actions in 2017
The allocation of high liquid assets was diversified through wide and high-grade counteragent network and more detailed investment portfolio structure. The Bank enlarged its counteragent network, established new connections with overseas financial institutions to have easy access to large number of financial instruments and liquidity providers.
To ensure deposit base stability and further growth, the Bank managed interest rates of deposits according to market tendency. The Bank also targeted other funding sources, e.g. IFIs.
RISK MANAGEMENTKEY RISKS AND RISK PROFILE
RISK MANAGEMENT
Risk Mitigation Actions in 2017
E&S risks were managed in accordance with the lending procedures of the Bank, by applying E&S risks management system effective at each particular time. This system is developed based on the international best practice (EBRD, ADB and IFC Performance Standards/Performance Requirements). Each project financed by Ameriabank was subject to E&S assessment, and included legal documentation review, risk identification and mitigation, monitoring and reporting. The findings of assessment, all inconsistencies were documented and reported in legal agreements as E&S terms and conditions of financing.
In order to ensure that borrowers meet best practices and standards of environmental and social risk management in 2017 the Bank continually implemented E&S Management System for High and High А category projects (including all Small Hydro Power Plants), describing the procedures that should be followed by the respective borrowers in their activities.
Environmental & Social Risk
Risks and Uncertainties
Environmental and Social (E&S) risks management has become more critical for business success of companies. It is important for the Bank’s stakeholders, namely its clients, investors, employees, community and environment in general. Ameriabank’s main purpose is to collaborate with those clients who properly manage their environmental and social risks. However, the Bank also suggests support to its clients in terms of organizing Environmental and Social Risks management. Ameriabank’s E&S frameworks encourage its clients to do business in a sustainable way. IFC, EBRD and ADB, Performance Standards/ Performance Requirements, which are the cornerstones of the E&S framework of Ameriabank, have become a benchmark for environmental and social risk assessment in the lending process. The Bank uses technical reference documents with general and industry-specific examples of Good International Industry Practice to identify E&S risks.
Key Risk Indicators
E&S risks of the Bank’s loan portfolio are assessed to be on an acceptable level. Over 85% of Environmental and Social Risks within the portfolio of Ameriabank is concentrated in low and medium risk categories. There were no “High A” risk borrowers in total loan portfolio. The Bank’s E&S and lending policy are designed to reduce the negative impacts of financed projects by means of financing conditions, instructions and terms to be implemented, consulting services, high quality involvement of E&S specialists.
TOPTOPCONTENTS CONTENTS

100 101
B ased on ICAAP Bank ensures adequate capital to support undertaken risks and determine
target capital level/benchmark adequate to the risk environment. Capital adequacy ratio (CAR) is calculated as a ratio of total regulatory capital and risk weighted assets (RWA). The minimum regulatory requirement is 12%. In order to assess the impact of losses from possible risks on capital, simultaneous stress tests are used, namely the scenario of simultaneous occurrence of all major risks is considered. The Bank assesses the size of the capital and its adequacy ratio over a certain time horizon, calculates the minimum required capital attributable to the risks assumed, as well as the capital benchmark and RWA. The types of risks in case of occurrence of which the Bank may incur losses are defined as follows: credit risk (portfolio risk, concentrations risk), market risk (floating rate, yield curve, IR gap, FX and equity instruments price risk); operational loss, RWA growth (FX stress) and other risks if any. Four separate stress scenarios are used for possible future loss and capital assessment, starting from base scenario without stress on risks up to the risks worst-case scenario. If as a result of the assessment the expected value of CAR, under the most probable (adequate to macro expectations) scenario, does not satisfy the minimum conditions specified by the CBA regulation, the Bank undertakes actions to keep CAR on acceptable level. Under the most probable scenario Capital adequacy will be around 13% during 2018 (regulatory requirement is
12%). Parameter is under strict control by high level management bodies of the Bank as for upcoming 3 years Bank adopted growth strategy which includes continuous equity replenishment and adequate asset growth.
RISK MANAGEMENTKEY RISKS AND RISK PROFILE
Internal Capital Adequacy AssessmentProcess
RISK MANAGEMENT
Stress testing: Capital ratio under cumulative scenario
TOPTOPCONTENTS CONTENTS

102 103
T o ensure the efficiency of the risk management system in the Bank in 2017 all principles,
processes and methodologies regarding risk assessment and mitigation has been reviewed.
In regard to credit risk management in 2017 the Bank implemented:
► New risk based loan monitoring principles.
► A lot of work is done to enhance risk provisioning approaches in order to comply with IFRS 9 reporting standards.
► New approaches to stress scenarios.
► Key components of Risk Based Pricing System.
► Risk assessment special methodologies for new scoring based lending product and consumer loans with installments.
The Bank’s management also was up to speed with the quality of the loan portfolio, data concerning various industries, loan products, key risk indicators and other risk factors and their dynamics via monthly reports on credit risk, which made it possible to give specific tasks aimed at risk assessment and mitigation. The loans that involved high risks were under ongoing control via out-of-turn inspections which helped to cut their volume significantly by the end of the year. Application of risk identification, assessment and management mechanisms enabled the Bank to minimize substantially the credit risk in 2017 and make it controllable to the most possible extent.
In regard to market risk management in 2017 the Bank:
► Implemented new system of securities portfolio structure and management for the purpose of ensuring excess liquidity and additional returns under acceptable level of risk.
► Reviewed and improved the whole system of trade limits.
► Improved methodologies for calculating and approving limits for partner financial institutions. According to new developments on the local corporate debt market, new approaches and methods were implemented for long term investment limits calculation and management.
► Improved current stress testing scenarios to be
RISK MANAGEMENTKEY RISK MANAGEMENT FOCUS
in line with the economic realities.
► Improved management of risks associated with brokerage: portfolio and client assessment approaches were developed, while high risk trading platforms and instruments was put out of operation. Special risk approach developed for those clients who trade in cryptocurrency markets.
► In the scope of the new IFRS9 reporting standard, new approaches were developed for risk provisioning of assets based on the idea of expected loss and macroeconomic forecasts.
RISK MANAGEMENT
In regard to operational risk management in 2017 the Bank:
► Assessed and reassessed a number of internal processes and systems (including new generation products for digital banking) in order to ensure proper management of operational risks.
► Developed risk prevention and/or mitigation measures and implemented with respect to some designated high risk activities.
► Operational Risks/Incidents and Loss database was automated and launched.
► Taking into account the growth of cyber-crimes the cyber risk insurance offer has been observed, optimization of collateral insurance offer has been observed and the reinsurance coverages
of partner insurance companies have been evaluated.
TOPTOPCONTENTS CONTENTS

104 105
RISK MANAGEMENTRISK MANAGEMENT FRAMEWORK
T he general logic of the Bank’s risk management framework is presented below. It is a well-
developed structure with a few lines of defense
ALM and liquidity management(ALM, Treasury, ALCO process)
Credit process (origination, decisionmaking, evaluation, rating, monitoring)
Operational banking(procedures, limits)
Deviations, limits managementRisk parameters/ KRIs decision making authorityOperational limits (lending, trading, cash, ...)
Strategy, business planning
Assets and liability management
ICAAP (econnomic capital, stress scenarios)
Macro risks (market) monitoring system
Internal risk parameters, KRIs, early warning indicators system
Stress testing system
Risk management model
Decision making limits system (Board of Directors, Management Board, Credit Commities, ALCO, AMLC, staff)
Business processes
Risk reporting and analytics
Internal Audit, Internal control and Compliance
Credit RM policy Market RM policy Operational RM policy E&S RM policy Liquidity RM policy
Bank Risk Appetite
Bank Risk Management Policy
against possible risks coming from external and internal sources.
RISK MANAGEMENT
TOPTOPCONTENTS CONTENTS

106 107
RISK MANAGEMENTRISK ORGANIZATION AND GOVERNANCE
T he Bank’s risk management is incorporated in all structures of the Bank. It reflects governance,
risk taking authority distribution based on the risk appetite of the Bank.
The Board of Directors (BoD) approves the Bank’s Strategy, as well as risk management, credit and other policies and internal regulatory acts necessary for its implementation; defines the Bank’s ‘risk appetite’ (the acceptable risk criteria and limits), including approval of the Instruction on Risk Management Parameters and Internal Standards; controls the effectiveness of risk management system, the level of risks accepted by the Bank, their compliance with the risk appetite; approves bank instruments which are beyond the Bank’s Management Board limits and criteria.
The executive management, namely the Chairman of the Management Board - General Director, the Management Board and its members accept risks within the scope of policies approved by the Board of Directors and perform their daily management, coordinating the units’ operations; carry out risk management under the risk management parameters established by the Board, and are accountable to the Board of Directors. The Management Board may reassign the above mentioned authorities to the specialized collegial bodies – committees (Assets and Liabilities Management Committee, Credit Committee, etc.).
RISK MANAGEMENT
Large Credit Committee (LCC)
The main purpose of the Large Credit Committee is to implement the lending policy of the Bank, to form loan portfolio with high profitability under acceptable level of credit risk. LCC makes decisions in lending based on conclusions containing opinions of business
divisions, risk management and security services within the limit of 10% from total balance capital. Lending with deviations are also subject to LCC review and approval.
Small Credit Committee (SCC)
The Small Credit Committee’s main purpose is the same as LCC, with reduced limit size and loan products. SCC is aimed at discussing and making decisions on retail and SME loans. Loans with negative opinion from one of the responsible divisions cannot be subject to SCC review and approval.
Assets and Liabilities Management Committee (ALCO)
The Assets and Liabilities Management Committee is a permanent corporate collegial body in the Bank entitled to adopt decisions within the framework of Assets and Liabilities management policy. The objective of the Committee is to ensure sufficient preconditions for efficient and harmonized management of the Bank’s assets and liabilities for achieving maximum profitability within the acceptable level of liquidity, interest rate and currency risks. Investment policy, interest rates, currency and liquidity management, capital adequacy and risk parameters management are subject to ALCO committee’s review and approval.
The system of specialized committees was established in the Bank with delegation of authorities from the Management Board in order to manage risks arising from all main business activities of the Bank.
TOPTOPCONTENTS CONTENTS

108 109
Non-Performing Loans (NPL) Committee
The NPL Committee was formed in 2014 after the crisis in the financial markets provoked by oil prices dropdown. The main objectives of this Committee are the same as those of LCC with sharp focus on problematic and risky loans, pledge liquidation and NPL recovery.
Anti-Money Laundering (AML)Committee
The key goal of the AML Committee is to secure and maintain the good reputation of the Bank by undertaking reasonable measures to avoid reputational and financial risks as part of combat against the financing of terrorism and money laundering both in Armenia and abroad. The key objectives of the Committee are combating terrorism financing and money laundering through ensuring that no such activity is performed through the Bank’s operations.
The lending decision making limits are distributed between different authorities including both collegial management bodies of the Bank and individual decision makers. Limits are designed within the general concept of risk appetite distribution between different authorities and are subject to periodic review.
RISK MANAGEMENTRISK ORGANIZATION AND GOVERNANCE
The deviations in lending parameters are also subject to the same limits structure depending on type and size, decisions are made based on corresponding voting schemes (simple majority, overwhelming majority). Furthermore, depending on macro environment stability, 1 out of 4 regimes of approval of loans with deviations have been adopted by the Management Board which tightens the limitation system, in the case of risky macroeconomic developments.
The Risk Management Centre has a wide range of responsibilities, which include but are not limited to the following:
► Develops risk management policy and structure;
► Implements risk management (internal control) system at the level of business processes;
► Provides risk management recommendations concerning newly implemented instruments;
► Provides conclusions on the Bank’s transactions within the established limits;
► Develops and elaborates risk management reports and presents them to the Bank’s management;
► Increases awareness and conducts trainings on risk management in the Bank.
Internal Audit assesses the effectiveness of risk management system implemented in the Bank and the adherence to the established criteria by the Bank’s subdivisions, as well as presents recommendations for enhancing the system’s effectiveness; reports to the Bank’s Management and Board of Directors on the identified risks.
In order to ensure efficient risk management system, relevant Management Information System (MIS) is established in the Bank, which provides adequate vertical and horizontal information flows for decision-making purposes.
The MIS is designed to provide the Bank‘s management team with the leading, lagging and coincident indicators concerning loan and other portfolios. The Board of Directors and Management Board have access to all designed reports concerning emerging risks, their possible consequences as well as collapse of control mechanisms.
In particular, the following data is presented to the Bank’s vertical and horizontal line managers in terms of specific instruments via different reporting lines:
► The structure of the instrument portfolios/ investments;
RISK MANAGEMENT
► The instruments’ yield and maturity structure;
► The structure of overdue assets and liabilities;
► The structure of pledged assets and accepted collaterals;
► Information concerning non-performing loans and concentrations;
► Collectability of defaulted loans;
► Other information on effectiveness.
TOPTOPCONTENTS CONTENTS
110 111
Maintainbalance in results and inputs and achieve excellence in actions
FINANCIAL STATEMENTSINDEPENDENT AUDITOR’S REPORTErnst & Young CJSC
1 North Ave., office 27Yerevan, 0001, ArmeniaTel: +374 (10) 500 790 +374 (10) 500 705Fax: +374 (10) 500 706www.ey.com/am
Independent auditor’s report
To the Shareholders and Board of Directors of Ameriabank Closed Joint-Stock Company
Opinion
We have audited the financial statements of Ameriabank Closed Joint-Stock Company (the Bank) which comprise the statement of comprehensive income for the year ended 31 December 2017, the statement of financial position as at 31 December 2017, the statement of cash flows and the statement of changes in equity for the year then ended, and notes to the financial statements, including a summary of significant accounting policies.
In our opinion, the accompanying financial statements present fairly, in all material respects, the financial position of the Bank as at 31 December 2017 and its financial performance and its cash flows for the year then ended in accordance with International Financial Reporting Standards (“IFRSs”).
Basis for opinion
We conducted our audit in accordance with International Standards on Auditing (“ISAs”). Our responsibilities under those standards are further described in the Auditor’s responsibilities for the audit
of the financial statements section of our report. We are independent of the Bank in accordance with the International Ethics Standards Board for Accountants’ Code of Ethics for Professional Accountants (“IESBA Code”), and we have fulfilled our other ethical responsibilities in accordance with the IESBA Code. We believe that the audit evidence we have obtained is sufficient and appropriate to provide a basis for our opinion.
Key audit matters
Key audit matters are those matters that, in our professional judgment, were of most significance in our audit of the financial statements of the current period. These matters were addressed in the context of our audit of the financial statements as a whole, and in forming our opinion thereon, and we do not provide a separate opinion on these matters. For each matter below, our description of how our audit addressed the matter is provided in that context.
We have fulfilled the responsibilities described in the Auditor’s responsibilities for the audit of the financial statements section of our report, including in relation to these matters. Accordingly, our audit included the
performance of procedures designed to respond to our assessment of the risks of material misstatement of the financial statements. The results of our audit procedures, including the procedures performed to address the matters below, provide the basis for our audit opinion on the accompanying financial statements.
TOPCONTENTS

112 113
FINANCIAL STATEMENTSINDEPENDENT AUDITOR’S REPORT
Key audit matter
Loan impairment allowance
Loan impairment allowance is a key area of judgement for management. The identification of impairment and the determination of the recoverable amount are an inherently uncertain process involving various assumptions and factors including the financial condition of the counterparty, expected future cash flows, expected net selling prices and expected realization period of the collateral. The use of different modelling techniques and assumptions could produce significantly different estimates of loan impairment allowance. This could have material effect on the financial results of the Bank.
Loan impairment allowance is a key audit matter due to both the significance of loans and advances to customers (70.8% of total assets of the Bank as at 31 December 2017) and subjectivity of underlying assumptions for impairment estimation.
We assessed controls over collective impairment calculations. We tested the models and assumptions used to determine collective impairment and checked the formulas and inputs to the underlying models, such as net write-offs and overdue days of loans.For impairment losses calculated on an individual basis we tested the assumptions underlying the impairment identification and quantification, including valuation of underlying collateral and forecasts of future cash flows. We focused on significant corporate loans with impairment indicators as of the reporting date.We also performed procedures regarding the financial statement disclosures (Note 21) of the Bank’s exposure to credit risk and key assumptions and judgments of the management for estimating the loan impairment allowance.
How our audit addressed itOther information included in the Bank’s 2017 Annual report Other information consists of the information included in the Annual Report other than the financial statements and our auditor’s report thereon. Management is responsible for the other information. The Annual Report is expected to be made available to us after the date of this auditor’s report.
Our opinion on the financial statements does not cover the other information and we will not express any form of assurance conclusion thereon.
In connection with our audit of the financial statements, our responsibility is to read the other information identified above when it becomes available and, in doing so, consider whether the other information is materially inconsistent with the financial statements or our knowledge obtained in the audit or otherwise appears to be materially misstated.
Responsibilities of management and the Board of Directors for the financial statementsManagement is responsible for the preparation and fair presentation of the financial statements in accordance with IFRSs, and for such internal control as management determines is necessary to enable
FINANCIAL STATEMENTS
the preparation of financial statements that are free from material misstatement, whether due to fraud or error.
In preparing the financial statements, management is responsible for assessing the Bank’s ability to continue as a going concern, disclosing, as applicable, matters related to going concern and using the going concern basis of accounting unless management either intends to liquidate the Bank or to cease operations, or has no realistic alternative but to do so.
The Board of Directors is responsible for overseeing the Bank’s financial reporting process.
Auditor’s responsibilities for the audit of the financial statementsOur objectives are to obtain reasonable assurance about whether the financial statements as a whole are free from material misstatement, whether due to fraud or error, and to issue an auditor’s report that includes our opinion. Reasonable assurance is a high level of assurance, but is not a guarantee that an audit conducted in accordance with ISAs will always detect a material misstatement when it exists. Misstatements can arise from fraud or error and are considered material if, individually or in the aggregate, they could reasonably be expected to influence the economic decisions of users taken on
the basis of these financial statements.
As part of an audit in accordance with ISAs, we exercise professional judgment and maintain professional skepticism throughout the audit. We also:
► Identify and assess the risks of material misstatement of the financial statements, whether due to fraud or error, design and perform audit procedures responsive to those risks, and obtain audit evidence that is sufficient and appropriate to provide a basis for our opinion. The risk of not detecting a material misstatement resulting from fraud is higher than for one resulting from error, as fraud may involve collusion, forgery, intentional omissions, misrepresentations, or the override of internal control.
► Obtain an understanding of internal control relevant to the audit in order to design audit procedures that are appropriate in the circumstances, but not for the purpose of expressing an opinion on the effectiveness of the Bank’s internal control.
► Evaluate the appropriateness of accounting policies used and the reasonableness of accounting estimates and related disclosures made by management.
► Conclude on the appropriateness of management’s use of the going concern basis of accounting and, based on the audit evidence obtained, whether a material uncertainty exists related to events or conditions that may cast significant doubt on the Bank’s ability to continue as a going concern. If we conclude that a material uncertainty exists, we are required to draw attention in our auditor’s report to the related disclosures in the financial statements or, if such disclosures are inadequate, to modify our opinion. Our conclusions are based on the audit evidence obtained up to the date of our auditor’s report. However, future events or conditions may cause the Bank to cease to continue as a going concern.
► Evaluate the overall presentation, structure and content of the financial statements, including the disclosures, and whether the financial statements represent the underlying transactions and events in a manner that achieves fair presentation.
We communicate with the Board of Directors regarding, among other matters, the planned scope and timing of the audit and significant audit findings, including any significant deficiencies in internal control that we identify during our audit.
TOPTOPCONTENTS CONTENTS

114 115
FINANCIAL STATEMENTSINDEPENDENT AUDITOR’S REPORT
We also provide the Board of Directors with a statement that we have complied with relevant ethical requirements regarding independence, and communicate with them all relationships and other matters that may reasonably be thought to bear on our independence, and where applicable, related safeguards.
From the matters communicated with Board of Directors, we determine those matters that were of most significance in the audit of the financial statements of the current period and are therefore the key audit matters. We describe these matters in our auditor’s report unless law or regulation precludes public disclosure about the matter or when, in extremely rare circumstances, we determine that a matter should not be communicated in our report because the adverse consequences of doing so would reasonably be expected to outweigh the public interest benefits of such communication.
The partner in charge of the audit resulting in this independent auditor’s report is Eric Hayrapetyan.
CJSC Ernst & Young Yerevan, Armenia
On behalf of General Director A. Sarkisyan (by power of attorney dated 1 August 2016)
Partner (Assurance) Eric Hayrapetyan
20 March 2018
Interest incomeInterest expenseNet interest income
Fee and commission incomeFee and commission expenseNet fee and commission income
Gain from cessionNet (loss)/gain on financial instruments at fair value through profit or lossNet foreign exchange gainNet gain on available-for-sale financial assetsOther operating incomeOther operating expensesOperating income
Impairment losses Operating income after impairment
Personnel expensesOther general administrative expensesProfit before income tax
Income tax expenseProfit for the year
2017AMD’000
49,297,198(30,932,889)18,364,309
3,577,025(791,890)
2,785,135
-(1,976,234)5,815,335424,708
2,159,541(1,892,480)25,680,314
(5,811,644)19,868,670
(6,240,813)(4,091,161)9,536,696
(1,886,709)7,649,987
Notes
55
67
8910
1112
13
14
15
Statement of comprehensive income for the year ended 31 December 2017
FINANCIAL STATEMENTS
2016 AMD’000
42,624,265(27,749,228)14,875,037
2,866,115(610,329)
2,255,786
1,096,8241,055,9092,465,343736,347
1,561,640(1,461,489)22,585,397
(5,434,401)17,150,996
(5,675,290)(3,746,410)7,729,296
(1,522,610)6,206,686
TOPTOPCONTENTS CONTENTS

116 117
Other comprehensive income, net of income taxItems that are or may be reclassified subsequently to profit or lossRevaluation reserve for available-for-sale financial assets-Net change in fair value-Net change in fair value transferred to profit or loss-Income tax effectTotal items that are or may be reclassified subsequently to profit or lossOther comprehensive income for the year, net of income taxTotal comprehensive income for the year
2016 AMD’000
1,435,355(736,347)(139,802)559,206559,206
6,765,892
2017 AMD’000
462,604(424,708)
(7,579)30,31730,317
7,680,304
The financial statements as set out on pages 116 to 206 were approved by the Management Board on 20 March 2018 and were signed on its behalf by:
FINANCIAL STATEMENTS
The statement of comprehensive income is to be read in conjunction with the Notes to, and forming part of, the financial statements.
AssetsCash and cash equivalents Financial instruments at fair value through profit or lossAvailable-for-sale financial assetsLoans and advances to banksAmounts receivable under reverse repurchase agreementsLoans and advances to customersHeld-to-maturity investments- Held by the Bank- Pledged under sale and repurchase agreementsProperty, equipment and intangible assets Current tax assetOther assets
Total assets
LiabilitiesFinancial instruments at fair value through profit or lossDeposits and balances from banks Amounts payable under repurchase agreementsCurrent accounts and deposits from customersDebt securities issuedOther borrowed fundsSubordinated borrowingsCurrent tax liabilityDeferred tax liabilityOther liabilitiesTotal liabilities
2017 AMD’000
107,616,3683,968,0649,888,07810,842,8908,675,394
479,640,981
37,337,5395,968,3057,126,916
-6,657,562
677,722,097
686,30640,004,0016,121,693
375,170,77940,932,59598,128,09440,919,768
990,2561,025,1033,841,631
607,820,226
Statement of financial position as at 31 December 2017
FINANCIAL STATEMENTS
2016 AMD’000
135,280,8723,130,07112,408,2924,853,3026,446,797
513,218,709
36,255,642-
3,651,2391,321,8012,796,698
719,363,423
2,535,28371,834,882
-414,608,68618,124,500102,735,03940,811,255
-1,442,8722,873,138
654,965,655
Notes
161718192021
222223
24
17252627282929
1530
TOPTOPCONTENTS CONTENTS

118 119
EquityShare capitalShare premium Revaluation reserve for available-for-sale financial assets Retained earnings Total equityTotal liabilities and equity
2016AMD’000
32,087,3607,755,179307,897
24,247,33264,397,768
719,363,423
2017 AMD’000
32,087,3607,755,179338,214
29,721,11869,901,871
677,722,097
Statement of financial position as at 31 December 2017
FINANCIAL STATEMENTS
Notes
31
The statement of financial position is to be read in conjunction with the Notes to, and forming part of, the financial statements.
Cash flows from operating activitiesInterest receiptsInterest paymentsFee and commission receiptsFee and commission paymentsNet payments from financial assets at fair value through profit and lossNet (payments)/receipts from foreign exchange transactionsOther operating expenses paymentsOther operating income receipts Salaries and other payments to employeesOther general administrative expenses payments
(Increase)/decrease in operating assetsFinancial instruments at fair value through profit or lossLoans and advances to banksAmounts receivable under reverse repurchase agreementsLoans and advances to customersOther assets
Increase/(decrease) in operating liabilitiesFinancial instruments at fair value through profit or lossDeposits and balances from banks Amounts payable under repurchase agreementsCurrent accounts and deposits from customersOther liabilitiesNet cash used in operating activities before income tax paid
Income tax paidCash flows from operations
2016 AMD’000
40,931,425(23,817,560)
2,866,115(610,329)676,407
2,724,237(1,461,489)1,427,995
(5,754,347)(2,967,916)
(2,665,582)2,754,468(464,617)
(193,906,455)(704,138)
2,330,73050,005,742
(18,999,995)119,077,450
(239,818)(28,797,677)
(930,000)(29,727,677)
2017 AMD’000
45,679,533(28,386,448)
3,577,025(791,890)
(1,933,348)3,601,374
(1,892,480)2,159,541
(5,726,848)(3,223,321)
(814,603)(5,003,619)(2,223,000)34,518,400(3,934,632)
(1,894,376)(31,378,969)
6,096,286(46,389,246)
359,730(37,600,891)
-(37,600,891)
Statement of cash flows for the year ended 31 December 2017
FINANCIAL STATEMENTS
Notes
TOPTOPCONTENTS CONTENTS

120 121
Cash flows from investing activitiesPurchases of property and equipment and intangible assetsProceeds from sale of property and equipment and intangible assetsPurchases of available-for-sale financial assetsProceeds from available-for-sale financial assetsPurchases of held-to-maturity investmentsProceeds from redemption of held-to-maturity investmentsPurchases of bonds of Armenian banks and credit organizationsCash flows used in investing activities
Cash flows from financing activitiesDividends paidReceipts of other borrowed fundsRepayment of other borrowed fundsProceeds from debt securities issuedCash flows from financing activitiesNet decrease in cash and cash equivalents
Effect of changes in exchange rates on cash and cash equiva-lentsCash and cash equivalents as at the beginning of the yearCash and cash equivalents as at the end of the year
2016 AMD’000
(1,373,907)145,298
(15,698,772)15,036,412
(38,114,289)21,633,698
-(18,371,560)
(1,685,286)77,618,450
(53,479,054)17,815,04440,269,154(7,830,083)
397,638142,713,317135,280,872
2017AMD’000
(4,345,562)2,048
(17,533,115)20,417,703
(79,345,696)72,727,616(612,754)
(8,689,760)
(2,176,201)67,496,831
(72,097,598)22,504,61015,727,642
(30,563,009)
2,898,505135,280,872107,616,368
Statement of cash flows for the year ended 31 December 2017
FINANCIAL STATEMENTS
The statement of cash flows is to be read in conjunction with the Notes to, and forming part of, the financial statements.
Notes
31
16
AMD’000
Balance as at 1 January 2016
Total comprehensive incomeProfit for the yearOther comprehensive in-come for the year Total comprehensive income for the year
Transactions with owners, recorded directly in equityDividendsTotal transactions with ownersBalance as at 31 December 2016
Balance as at 1 January 2017
Total comprehensive incomeProfit for the yearOther comprehensive income for the yearTotal comprehensive income for the year
Transactions with owners, recorded directly in equityDividendsTotal transactions with ownersBalance as at 31 December 2017
Total equity
59,317,162
6,206,686559,206
6,765,892
(1,685,286)(1,685,286)64,397,768
64,397,768
7,649,98730,317
7,680,304
(2,176,201)(2,176,201)69,901,871
Retained earnings
19,725,932
6,206,686-
6,206,686
(1,685,286)(1,685,286)24,247,332
24,247,332
7,649,987-
7,649,987
(2,176,201)(2,176,201)29,721,118
Revaluation reserve for
available-for-sale financial assets
(251,309)
-559,206559,206
--
307,897
307,897
-30,31730,317
--
338,214
Statement of changes in equityfor the year ended 31 December 2017
Share premium
7,755,179
---
--
7,755,179
7,755,179
---
--
7,755,179
Share capital
32,087,360
---
--
32,087,360
32,087,360
---
--
32,087,360
Notes
31
31
FINANCIAL STATEMENTS
The statement of changes in equity is to be read in conjunction with the Notes to, and forming part of, the financial statements.
TOPTOPCONTENTS CONTENTS

122 123
1. Background
(a) Organization and operations
Ameriabank CJSC (formerly Armimpexbank CJSC) (the Bank) was established on 8 December 1992 under the laws of the Republic of Armenia. In 2007 the Bank was acquired by TDA Holdings Limited, which purchased a shareholding of 96.15%. TDA Holdings Limited was renamed to Ameria Group (CY) during 2011. In 2013 Ameria Group (CY) Limited increased its share in the Bank to 100%. On 23 December 2015 European Bank for Reconstruction and Development (EBRD) purchased in full additionally issued 20,749 shares of the Bank.
On 21 December 2016 ESPS Holding Limited purchased 13.5% of Bank shares from Ameria Group (CY).
The shareholders of the Bank as at 31 December 2017 are Ameria Group (CY) (65.8%), EBRD (20.7%) and ESPS Holding Limited (13.5%).
The principal activities are deposit taking and customer account maintenance, lending, issuing guarantees, cash and settlement operations and operations with securities and foreign exchange. The activities of the Bank are regulated by the Central Bank of Armenia (CBA). The Bank has a general
banking license, and is a member of the state deposit insurance system in the Republic of Armenia. The majority of the Bank’s assets and liabilities are located in Armenia.
The Bank has 14 branches from which it conducts business throughout the Republic of Armenia. The registered address of the head office is 9 Grigor Lusavorich Street, Yerevan 0015, Republic of Armenia. The average number of the Bank’s employees for 2017 was 667 (2016: 597).
Related party transactions are detailed in Note 37.
(b) Armenian business environment
2017 has been rather positive for Armenian economy. GDP growth exceeded forecasts from previous year almost twice and is expected to be under 7% for the year. Main contributors for this growth were Trade, Manufacturing and Financial intermediation. CPI was much stable throughout the year at around 1% for 2017; the same can be said about AMD/USD exchange rate. Foreign trade registered above 20% growth both for exports and imports. After some contraction in 2016, remittances also registered
two-digit growth over the year. About 5% increase is observed in foreign reserves.
Given all above, management believes that it is taking appropriate measures to support the sustainability of the Bank’s business under the current circumstances as well as ensuring relevant buffers to observe potential shocks in the near future.
FINANCIAL STATEMENTS FINANCIAL STATEMENTS
2. Basis of preparation
(a) Statement of compliance
The accompanying financial statements are prepared in accordance with International Financial Reporting Standards (IFRS).
(b) Basis of measurement
The financial statements have been prepared under the historical cost basis except that financial instruments at fair value through profit or loss and available-for-sale financial assets are stated at fair value.
(c) Functional and presentation currency
The financial statements are presented in Armenian Drams (AMD), which is the Bank’s functional and presentation currency. Financial information presented in AMD is rounded to the nearest thousand. The official CBA exchange rates at 31 December 2017 and 31 December 2016, were 484.1 AMD and 483.94 AMD to 1 USD, and 580.1 AMD and 512.2 AMD to 1 EUR, respectively.
(d) Use of estimates and judgments
The preparation of financial statements in conformity
with IFRS requires management to make judgments, estimates and assumptions that affect the application of accounting policies and the reported amounts of assets, liabilities, income and expenses. Actual results could differ from those estimates.
Estimates and underlying assumptions are reviewed on an ongoing basis. Revisions to accounting estimates are recognized in the period in which the estimates are revised and in any future periods affected.
Information about significant areas of estimation uncertainty and critical judgments in applying accounting policies is described in Note 21 “Loans and advances to customers” and Note 38 “Financial assets and liabilities: fair values and accounting policies”.
(e) Changes in accounting policies and presentation
Changes in accounting policies
The Bank applied for the first time certain amendments to the standards, which are effective
for annual periods beginning on or after 1 January 2017. The Bank has not early adopted any standards, interpretations or amendments that have been issued but are not yet effective. The nature and the impact of each amendment is described below:
Amendments to IAS 7 Statement of Cash Flows: Disclosure Initiative
The amendments require entities to provide disclosure of changes in their liabilities arising from financing activities, including both changes arising from cash flows and non-cash changes (such as foreign exchange gains or losses). The Bank has provided the information for both the current and the comparative period in Note 39.
Amendments to IAS 12 Income Taxes: Recognition of Deferred Tax Assets for Unrealised Losses
The amendments clarify that an entity needs to consider whether tax law restricts the sources of taxable profits against which it may make deductions on the reversal of deductible temporary difference related to unrealised losses. Furthermore, the amendments provide guidance on how an entity
TOPTOPCONTENTS CONTENTS

124 125
should determine future taxable profits and explain the circumstances in which taxable profit may include the recovery of some assets for more than their carrying amount. Application of the amendments has no effect on the Bank’s financial position and performance as the Bank has no deductible temporary differences or assets that are in the scope of the amendments.
3. Significant accounting policies
The accounting policies set out below are applied consistently to all periods presented in these financial statements, except as explained in Note 2(e), which addresses changes in accounting policies.
(a) Foreign currency
Transactions in foreign currencies are translated to the functional currency of the Bank at exchange rates at the dates of the transactions. Monetary assets and liabilities denominated in foreign currencies at the reporting date are retranslated to the functional currency at the exchange rate at that date. The foreign currency gain or loss on monetary items is the difference between amortized cost in the functional currency at the beginning of the period, adjusted for effective interest and payments during the period, and the amortized cost in foreign currency translated at the exchange rate at the end of the reporting period. Non-monetary assets and liabilities denominated in foreign currencies that are measured at fair value are retranslated to the functional currency at the exchange rate at the date that the fair value is determined. Non-monetary items that are measured in terms of historical cost in a foreign currency are translated using the exchange rate at the date of
the transaction. Foreign currency differences arising on retranslation are recognized in profit or loss, except for differences arising on the retranslation of available-for-sale equity instruments unless the difference is due to impairment in which case foreign currency differences that have been recognized in other comprehensive income are reclassified to profit or loss; or qualifying cash flow hedges to the extent that the hedge is effective, which are recognized in other comprehensive income.
(b) Cash and cash equivalents
Cash and cash equivalents include Notes and coins on hand, balances held with the CBA, including obligatory reserves, unrestricted balances (nostro accounts) held with other banks. Cash and cash equivalents are carried at amortised cost in the statement of financial position.
(c) Financial instruments
(i) Classification
Financial instruments at fair value through profit or loss are financial assets or liabilities that are:
FINANCIAL STATEMENTS
► Acquired or incurred principally for the purpose of selling or repurchasing in the near term;
► Part of a portfolio of identified financial instruments that are managed together and for which there is evidence of a recent actual pattern of short-term profit-taking;
► Derivative financial instruments (except for derivative that is financial guarantee contract or designated and effective hedging instruments); or
► Upon initial recognition, designated as at fair value through profit or loss.
The Bank may designate financial assets and liabilities at fair value through profit or loss where either:
► The assets or liabilities are managed, evaluated and reported internally on a fair value basis;
► The designation eliminates or significantly reduces an accounting mismatch which would otherwise arise; or
► The asset or liability contains an embedded derivative that significantly modifies the cash flows that would otherwise be required under the contract.
All trading derivatives in a net receivable position (positive fair value), as well as options purchased, are reported as assets. All trading derivatives in a net payable position (negative fair value), as well as options written, are reported as liabilities.
Management determines the appropriate classification of financial instruments in this category at the time of the initial recognition. Derivative financial instruments and financial instruments designated as at fair value through profit or loss upon initial recognition are not reclassified out of at fair value through profit or loss category. Financial assets that would have met the definition of loans and receivables may be reclassified out of the fair value through profit or loss or available-for-sale category if the Bank has an intention and ability to hold them for the foreseeable future or until maturity.
Other financial instruments may be reclassified out of at fair value through profit or loss category only in rare circumstances. Rare circumstances arise from
a single event that is unusual and highly unlikely to recur in the near term.
Loans and receivables are non-derivative financial assets with fixed or determinable payments that are not quoted in an active market, other than those that the Bank:
► Intends to sell immediately or in the near term;
► Upon initial recognition designates as at fair value through profit or loss;
► Upon initial recognition designates as available-for-sale; or
► May not recover substantially all of its initial investment, other than because of credit deterioration.
Held-to-maturity investments are non-derivative financial assets with fixed or determinable payments and fixed maturity that the Bank has the positive intention and ability to hold to maturity, other than those that:
FINANCIAL STATEMENTS
TOPTOPCONTENTS CONTENTS

126 127
► The Bank upon initial recognition designates as at fair value through profit or loss;
► The Bank designates as available-for-sale; or
► Meet the definition of loans and receivables.
Available-for-sale financial assets are those non-derivative financial assets that are designated as available-for-sale or are not classified as loans and receivables, held-to-maturity investments or financial instruments at fair value through profit or loss.
(ii) Recognition
Financial assets and liabilities are recognized in the statement of financial position when the Bank becomes a party to the contractual provisions of the instrument. All regular way purchases of financial assets are accounted for at the trade date.
(iii) Measurement
A financial asset or liability is initially measured at its fair value plus, in the case of a financial asset or liability not at fair value through profit or loss,
transaction costs that are directly attributable to the acquisition or issue of the financial asset or liability.
Subsequent to initial recognition, financial assets, including derivatives that are assets, are measured at their fair values, without any deduction for transaction costs that may be incurred on sale or other disposal, except for:
► Loans and receivables which are measured at amortized cost using the effective interest method;
► Held-to-maturity investments that are measured at amortized cost using the effective interest method;
► Investments in equity instruments that do not have a quoted market price in an active market and whose fair value cannot be reliably measured which are measured at cost.
All financial liabilities, other than those designated at fair value through profit or loss and financial liabilities that arise when a transfer of a financial asset carried at fair value does not qualify for derecognition, are measured at amortized cost.
(iv) Amortized cost
The amortized cost of a financial asset or liability is the amount at which the financial asset or liability is measured at initial recognition, minus principal repayments, plus or minus the cumulative amortization using the effective interest method of any difference between the initial amount recognized and the maturity amount, minus any reduction for impairment. Premiums and discounts, including initial transaction costs, are included in the carrying amount of the related instrument and amortized based on the effective interest rate of the instrument.
(v) Fair value measurement principles
Fair value is the price that would be received to sell an asset or paid to transfer a liability in an orderly transaction between market participants at the measurement date in the principal, or in its absence, the most advantageous market to which the Bank has access at that date. The fair value of a liability reflects its non-performance risk.
When available, the Bank measures the fair value of an instrument using quoted prices in an active market
FINANCIAL STATEMENTS
for that instrument. A market is regarded as active if transactions for the asset or liability take place with sufficient frequency and volume to provide pricing information on an ongoing basis.
When there is no quoted price in an active market, the Bank uses valuation techniques that maximize the use of relevant observable inputs and minimize the use of unobservable inputs. The chosen valuation technique incorporates all the factors that market participants would take into account in these circumstances.
The best evidence of the fair value of a financial instrument at initial recognition is normally the transaction price, i.e. the fair value of the consideration given or received. If the Bank determines that the fair value at initial recognition differs from the transaction price and the fair value is evidenced neither by a quoted price in an active market for an identical asset or liability nor based on a valuation technique that uses only data from observable markets, the financial instrument is initially measured at fair value, adjusted to defer the difference between the fair value at initial recognition and the transaction price. Subsequently, that difference is recognized in
profit or loss on an appropriate basis over the life of the instrument but no later than when the valuation is supported wholly by observable market data or the transaction is closed out.
If an asset or a liability measured at fair value has a bid price and an ask price, the Bank measures assets and long positions at the bid price and liabilities and short positions at the ask price.
Portfolios of financial assets and financial liabilities that are exposed to market risk and credit risk that are managed by the Bank on the basis of the net exposure to either market or credit risk, are measured on the basis of a price that would be received to sell the net long position (or paid to transfer the net short position) for a particular risk exposure. Those portfolio-level adjustments are allocated to the individual assets and liabilities on the basis of the relative risk adjustment of each of the individual instruments in the portfolio.
(vi) Gains and losses on subsequent measurement
A gain or loss arising from a change in the fair value of a financial asset or liability is recognized as follows:
► A gain or loss on a financial instrument classified as at fair value through profit or loss is recognized in profit or loss. Interest in relation to an debt financial asset at fair value through profit or loss is recognized in profit or loss as interest income using the effective interest method;
► A gain or loss on an available-for-sale financial asset is recognized as other comprehensive income in equity (except for impairment losses and foreign exchange gains and losses on debt financial instruments available-for-sale) until the asset is derecognized, at which time the cumulative gain or loss previously recognized in equity is recognized in profit or loss. Interest in relation to an available-for-sale financial asset is recognized in profit or loss using the effective interest method.
For financial assets and liabilities carried at amortized cost, a gain or loss is recognized in profit or loss when the financial asset or liability is derecognized or impaired, and through the amortization process.
(vii) Derecognition
The Bank derecognizes a financial asset when the
FINANCIAL STATEMENTS
TOPTOPCONTENTS CONTENTS
128 129
contractual rights to the cash flows from the financial asset expire, or when it transfers the financial asset in a transaction in which substantially all the risks and rewards of ownership of the financial asset are transferred or in which the Bank neither transfers nor retains substantially all the risks and rewards of ownership and it does not retain control of the financial asset. Any interest in transferred financial assets that qualify for derecognition that is created or retained by the Bank is recognized as a separate asset or liability in the statement of financial position. The Bank derecognizes a financial liability when its contractual obligations are discharged or cancelled or expire.
Where an existing financial liability is replaced by another from the same lender on substantially different terms, or the terms of an existing liability are substantially modified, such an exchange or modification is treated as a derecognition of the original liability and the recognition of a new liability.
The Bank enters into transactions whereby it transfers assets recognized on its statement of financial position, but retains either all risks and rewards of the transferred assets or a portion of them. If all or
substantially all risks and rewards are retained, then the transferred assets are not derecognized.
In transactions where the Bank neither retains nor transfers substantially all the risks and rewards of ownership of a financial asset, it derecognizes the asset if control over the asset is lost.
In transfers where control over the asset is retained, the Bank continues to recognize the asset to the extent of its continuing involvement, determined by the extent to which it is exposed to changes in the value of the transferred assets.
The Bank writes off assets deemed to be uncollectible.
(viii) Repurchase and reverse repurchase agreements
Securities sold under sale and repurchase (repo) agreements are accounted for as secured financing transactions, with the securities retained in the statement of financial position and the counterparty liability included in amounts payable under repo transactions. The difference between the sale and repurchase prices represents interest expense and is
recognized in profit or loss over the term of the repo agreement using the effective interest method.
Securities purchased under agreements to resell (reverse repo) are recorded as amounts receivable under reverse repo transactions. The difference between the purchase and resale prices represents interest income and is recognized in profit or loss over the term of the repo agreement using the effective interest method.
If assets purchased under an agreement to resell are sold to third parties, the obligation to return securities is recorded as a trading liability and measured at fair value.
(ix) Derivative financial instruments
Derivative financial instruments include swaps, forwards, futures, and options in interest rates, foreign exchanges, precious metals and stock markets, and any combinations of these instruments.
Derivatives are initially recognized at fair value on the date on which a derivative contract is entered into and are subsequently remeasured at fair value.
FINANCIAL STATEMENTS
All derivatives are carried as assets when their fair value is positive and as liabilities when their fair value is negative.
Changes in the fair value of derivatives are recognized immediately in profit or loss.
Although the Bank trades in derivative instruments for risk hedging purposes, these instruments do not qualify for hedge accounting.
(x) Offsetting
Financial assets and liabilities are offset and the net amount reported in the statement of financial position when there is a legally enforceable right to set off the recognized amounts and there is an intention to settle on a net basis, or realize the asset and settle the liability simultaneously.
(d) Property and equipment
(i) Owned assets
Items of property and equipment are stated at cost less accumulated depreciation and impairment
losses.
Where an item of property and equipment comprises major components having different useful lives, they are accounted for as separate items of property and equipment.
(ii) Depreciation
Depreciation is charged to profit or loss on a straight-line basis over the estimated useful lives of the individual assets. Depreciation commences on the date of acquisition or, in respect of internally constructed assets, from the time an asset is completed and ready for use. The estimated useful lives are as follows:
Leasehold improvements 5-10 years
Computers and communication equipment 5 to 10 years
Fixtures and fittings 5 to 10 years
Motor vehicles 7 years
Leasehold improvements are depreciated over the shorter of the useful life of the asset and lease term.
(e) Intangible assets
Acquired intangible assets are stated at cost less accumulated amortization and impairment losses.
Acquired computer software licenses are capitalized on the basis of the costs incurred to acquire and bring to use the specific software. Amortization is charged to profit or loss on a straight-line basis over the estimated useful lives of intangible assets. The estimated useful lives range from 1 to 10 years.
(f) Assets held for sale
Non-current assets, or disposal groups comprising assets and liabilities, that are expected to be recovered primarily through sale rather than through continuing use, are classified as held for sale. Immediately before classification as held for sale, the assets, or components of a disposal group, are remeasured
FINANCIAL STATEMENTS
TOPTOPCONTENTS CONTENTS

130 131
in accordance with the Bank’s accounting policies. Thereafter generally, the assets, or disposal group, are measured at the lower of their carrying amount and fair value less cost to sell.
(g) Impairment
The Bank assesses at the end of each reporting period whether there is any objective evidence that a financial asset or group of financial assets is impaired. If any such evidence exists, the Bank determines the amount of any impairment loss.
A financial asset or a group of financial assets is impaired and impairment losses are incurred if, and only if, there is objective evidence of impairment as a result of one or more events that occurred after the initial recognition of the financial asset (a loss event) and that event (or events) has had an impact on the estimated future cash flows of the financial asset or group of financial assets that can be reliably estimated.
Objective evidence that financial assets are impaired can include default or delinquency by a borrower, breach of loan covenants or conditions, restructuring
of financial asset or group of financial assets that the Bank would not otherwise consider, indications that a borrower or issuer will enter bankruptcy, the disappearance of an active market for a security, deterioration in the value of collateral, or other observable data relating to a group of assets such as adverse changes in the payment status of borrowers in the group, or economic conditions that correlate with defaults in the group.
In addition, for an investment in an equity security available-for-sale a significant or prolonged decline in its fair value below its cost is objective evidence of impairment.
(i) Financial assets carried at amortized cost
Financial assets carried at amortized cost consist principally of loans and other receivables (loans and receivables). The Bank reviews its loans and receivables to assess impairment on a regular basis.
The Bank first assesses whether objective evidence of impairment exists individually for loans and receivables that are individually significant, and individually or collectively for loans and receivables
that are not individually significant. If the Bank determines that no objective evidence of impairment exists for an individually assessed loan or receivable, whether significant or not, it includes the loan or receivable in a group of loans and receivables with similar credit risk characteristics and collectively assesses them for impairment. Loans and receivables that are individually assessed for impairment and for which an impairment loss is or continues to be recognized are not included in a collective assessment of impairment.
If there is objective evidence that an impairment loss on a loan or receivable has been incurred, the amount of the loss is measured as the difference between the carrying amount of the loan or receivable and the present value of estimated future cash flows including amounts recoverable from guarantees and collateral discounted at the loan or receivable’s original effective interest rate.
Contractual cash flows and historical loss experience adjusted on the basis of relevant observable data that reflect current economic conditions provide the basis for estimating expected cash flows.
FINANCIAL STATEMENTS
In some cases the observable data required to estimate the amount of an impairment loss on a loan or receivable may be limited or no longer fully relevant to current circumstances. This may be the case when a borrower is in financial difficulties and there is little available historical data relating to similar borrowers. In such cases, the Bank uses its experience and judgment to estimate the amount of any impairment loss.
All impairment losses in respect of loans and receivables are recognized in profit or loss and are only reversed if a subsequent increase in recoverable amount can be related objectively to an event occurring after the impairment loss was recognized.
Renegotiated loans
Where possible, the Bank seeks to restructure loans rather than to take possession of collateral. This may involve extending the payment arrangements and the agreement of new loan conditions.
The accounting treatment of such restructuring is as follows:
► If the currency of the loan has been changed the old loan is derecognised and the new loan is recognised;
► If the loan restructuring is not caused by the financial difficulties of the borrower the Bank uses the same approach as for financial liabilities described above;
► If the loan restructuring is due to the financial difficulties of the borrower and the loan is impaired after restructuring, the Bank recognizes the difference between the present value of the new cash flows discounted using the original effective interest rate and the carrying amount before restructuring in the allowance charges for the period. In case loan is not impaired after restructuring the Bank recalculates the effective interest rate.
Once the terms have been renegotiated, the loan is no longer considered past due. Management continuously reviews renegotiated loans to ensure that all criteria are met and that future payments are likely to occur. The loans continue to be subject to an individual or collective impairment assessment, calculated using the loan’s original or current
effective interest rate.
When a loan is uncollectable, it is written off against the related allowance for loan impairment. The Bank writes off a loan balance (and any related allowances for loan losses) when management determines that the loans are uncollectible and when all necessary steps to collect the loan are completed.
(ii) Financial assets carried at cost
Financial assets carried at cost include unquoted equity instruments included in available-for-sale financial assets that are not carried at fair value because their fair value cannot be reliably measured. If there is objective evidence that such investments are impaired, the impairment loss is calculated as the difference between the carrying amount of the investment and the present value of the estimated future cash flows discounted at the current market rate of return for a similar financial asset.
All impairment losses in respect of these investments are recognized in profit or loss and cannot be reversed.
FINANCIAL STATEMENTS
TOPTOPCONTENTS CONTENTS

132 133
(iii) Available-for-sale financial assets
Impairment losses on available-for-sale financial assets are recognized by transferring the cumulative loss that is recognized in other comprehensive income to profit or loss as a reclassification adjustment. The cumulative loss that is reclassified from other comprehensive income to profit or loss is the difference between the acquisition cost, net of any principal repayment and amortization, and the current fair value, less any impairment loss previously recognized in profit or loss. Changes in impairment provisions attributable to time value are reflected as a component of interest income.
If, in a subsequent period, the fair value of an impaired available-for-sale debt security increases and the increase can be objectively related to an event occurring after the impairment loss was recognized in profit or loss, the impairment loss is reversed, with the amount of the reversal recognized in profit or loss. However, any subsequent recovery in the fair value of an impaired available-for-sale equity security is recognized in other comprehensive income.
(iv) Non-financial assets
Other non-financial assets, other than deferred taxes, are assessed at each reporting date for any indications of impairment. The recoverable amount of non financial assets is the greater of their fair value less costs to sell and value in use. In assessing value in use, the estimated future cash flows are discounted to their present value using a pre-tax discount rate that reflects current market assessments of the time value of money and the risks specific to the asset. For an asset that does not generate cash inflows largely independent of those from other assets, the recoverable amount is determined for the cash-generating unit to which the asset belongs. An impairment loss is recognized when the carrying amount of an asset or its cash-generating unit exceeds its recoverable amount.
All impairment losses in respect of non-financial assets are recognized in profit or loss and reversed only if there has been a change in the estimates used to determine the recoverable amount. Any impairment loss reversed is only reversed to the extent that the asset’s carrying amount does not exceed the carrying amount that would have been determined, net of depreciation or amortization, if no impairment loss had been recognized. An impairment
loss in respect of goodwill is not reversed.
(h) Provisions
A provision is recognized in the statement of financial position when the Bank has a legal or constructive obligation as a result of a past event, and it is probable that an outflow of economic benefits will be required to settle the obligation. If the effect is material, provisions are determined by discounting the expected future cash flows at a pre-tax rate that reflects current market assessments of the time value of money and, where appropriate, the risks specific to the liability.
A provision for restructuring is recognized when the Bank has approved a detailed and formal restructuring plan, and the restructuring either has commenced or has been announced publicly. Future operating costs are not provided for.
(i) Borrowings
Issued financial instruments or their components are classified as liabilities, where the substance of the contractual arrangement results in the
FINANCIAL STATEMENTS
Bank having an obligation either to deliver cash or another financial asset to the holder, or to satisfy the obligation other than by the exchange of a fixed amount of cash or another financial asset for a fixed number of own equity instruments. Such instruments include amounts due to the Central bank, amounts due to credit institutions, amounts due to customers, debt securities issued, other borrowed funds and subordinated loans. After initial recognition, borrowings are subsequently measured at amortised cost using the effective interest method. Gains and losses are recognised in profit or loss when the borrowings are derecognised as well as through the amortisation process.
(j) Credit related commitments
In the normal course of business, the Bank enters into credit related commitments, comprising undrawn loan commitments, letters of credit and guarantees, and provides other forms of credit insurance.
Financial guarantees are contracts that require the Bank to make specified payments to reimburse the holder for a loss it incurs because a specified debtor fails to make payment when due in accordance with
the terms of a debt instrument.
A financial guarantee liability is recognized initially at fair value net of associated transaction costs, and is measured subsequently at the higher of the amount initially recognized less cumulative amortization or the amount of provision for losses under the guarantee. Provisions for losses under financial guarantees and other credit related commitments are recognized when losses are considered probable and can be measured reliably.
Financial guarantee liabilities and provisions for other credit related commitment are included in other liabilities.
Loan commitments are not recognized, except for the followings:
► Loan commitments that the Bank designates as financial liabilities at fair value through profit or loss;
► If the Bank has a past practice of selling the assets resulting from its loan commitments shortly after origination, then the loan commitments in the
same class are treated as derivative instruments;
► Loan commitments that can be settled net in cash or by delivering or issuing another financial instrument;
► Commitments to provide a loan at a below-market interest rate.
(k) Share capital
Ordinary shares are classified as equity. Incremental costs directly attributable to the issue of ordinary shares and share options are recognized as a deduction from equity, net of any tax effects.
(i) Share premium
Any amount paid in excess of par value of shares issued is recognized as a share premium.
(ii) Repurchase of share capital
When share capital recognised as equity is repurchased, the amount of the consideration paid, including directly attributable costs, is recognised as
FINANCIAL STATEMENTS
TOPTOPCONTENTS CONTENTS

134 135
a decrease in equity.
(iii) Dividends
The ability of the Bank to declare and pay dividends is subject to the rules and regulations of the Armenian legislation.
Dividends in relation to ordinary shares are reflected as an appropriation of retained earnings in the period when they are declared and such decision is effective according to legislation of the Republic of Armenia.
(l) Segment reporting
The Bank’s segmental reporting is based on the following operating segments: Retail banking, Corporate banking, Trading and Investment Banking (IB).
(m) Taxation
Income tax comprises current and deferred tax. Income tax is recognized in profit or loss except to the extent that it relates to items of other comprehensive income or transactions with shareholders recognized
directly in equity, in which case it is recognized within other comprehensive income or directly within equity.
Current tax expense is the expected tax payable on the taxable income for the year, using tax rates enacted or substantially enacted at the reporting date, and any adjustment to tax payable in respect of previous years.
Deferred tax assets and liabilities are recognized in respect of temporary differences between the carrying amounts of assets and liabilities for financial reporting purposes and the amounts used for taxation purposes. Deferred tax assets and liabilities are not recognized for the following temporary differences: goodwill not deductible for tax purposes, the initial recognition of assets or liabilities that affect neither accounting nor taxable profit and temporary differences related to investments in subsidiaries where the parent is able to control the timing of the reversal of the temporary difference and it is probable that the temporary difference will not reverse in the foreseeable future.
The measurement of deferred tax assets and liabilities reflects the tax consequences that would
follow the manner in which the Bank expects, at the end of the reporting period, to recover or settle the carrying amount of its assets and liabilities.
Deferred tax assets and liabilities are measured at the tax rates that are expected to be applied to the temporary differences when they reverse, based on the laws that have been enacted or substantively enacted by the reporting date.
Deferred tax assets are recognized only to the extent that it is probable that future taxable profits will be available against which the temporary differences, unused tax losses and credits can be utilized. Deferred tax assets are reduced to the extent that taxable profit will be available against which the deductible temporary differences can be utilized.
(n) Income and expense recognition
Interest income and expense are recognized in profit or loss using the effective interest method.
Loan origination fees, loan servicing fees and other fees that are considered to be integral to the overall profitability of a loan, together with the related
FINANCIAL STATEMENTS
transaction costs, are deferred and amortized to interest income over the estimated life of the financial instrument using the effective interest method.
Other fees, commissions and other income and expense items are recognized in profit or loss when the corresponding service is provided.
Dividend income is recognized in profit or loss on the date that the dividend is declared.
Payments made under operating leases are recognized in profit or loss on a straight-line basis over the term of the lease. Lease incentives received are recognized as an integral part of the total lease expense, over the term of the lease.
(o) Leases
Finance − Bank as lessee
The Bank recognizes finance leases as assets and liabilities in the statement of financial position at the date of commencement of the lease term at amounts equal to the fair value of the leased property or, if lower, at the present value of the minimum lease
payments. In calculating the present value of the minimum lease payments the discount factor used is the interest rate implicit in the lease, when it is practicable to determine; otherwise, the Bank’s incremental borrowing rate is used. Initial direct costs incurred are included as part of the asset. Lease payments are apportioned between the finance charge and the reduction of the outstanding liability. The finance charge is allocated to periods during the lease term so as to produce a constant periodic rate of interest on the remaining balance of the liability for each period.
The costs identified as directly attributable to activities performed by the lessee for a finance lease, are included as part of the amount recognized as an asset under the lease.
Finance − Bank as lessor
The Bank recognizes lease receivables at value equal to the net investment in the lease, starting from the date of commencement of the lease term. Finance income is based on a pattern reflecting a constant periodic rate of return on the net investment outstanding. Initial direct costs are included in the
initial measurement of the lease receivables.
Operating − Bank as lessee
Leases of assets under which the risks and rewards of ownership are effectively retained by the lessor are classified as operating leases. Lease payments under an operating lease are recognized as expenses on a straight-line basis over the lease term and included into other operating expenses.
Operating − Bank as lessor
The Bank presents assets subject to operating leases in the statement of financial position according to the nature of the asset. Lease income from operating leases is recognized in profit or loss on a straight-line basis over the lease term. The aggregate cost of incentives provided to lessees is recognized as a reduction of rental income over the lease term on a straight-line basis. Initial direct costs incurred specifically to earn revenues from an operating lease are added to the carrying amount of the leased asset.
FINANCIAL STATEMENTS
TOPTOPCONTENTS CONTENTS

136 137
(p) New standards and interpretations not yet adopted
The standards and interpretations that are issued, but not yet effective, up to the date of issuance of the Bank’s financial statements are disclosed below. The Bank intends to adopt these standards, if applicable, when they become effective.
IFRS 9 Financial Instruments
In July 2014, the IASB issued IFRS 9 Financial Instruments that replaces IAS 39 Financial Instruments: Recognition and Measurement. IFRS 9 addresses classification and measurement, impairment and hedge accounting. IFRS 9 is effective for annual periods beginning on or after 1 January 2018. Except for hedge accounting, retrospective application is required but restating comparative information is not compulsory.
The Bank plans to adopt the new standard by recognizing the cumulative transition effect in opening retained earnings on 1 January 2018 and will not restate comparative information. The Bank is in the process of quantifying the effect of adoption of
IFRS 9, however no reasonable estimate of this effect is yet available.
(a) Classification and measurement
Under IFRS 9, all debt financial assets that do not meet a “solely payment of principal and interest” (SPPI) criterion, are classified at initial recognition as fair value through profit or loss (FVPL). Under this criterion, debt instruments that do not correspond to a “basic lending arrangement”, such as instruments containing embedded conversion options or “non-recourse” loans, are measured at FVPL. For debt financial assets that meet the SPPI criterion, classification at initial recognition is determined based on the business model, under which these instruments are managed:
► Instruments that are managed on a “hold to collect” basis are measured at amortized cost;
► Instruments that are managed on a “hold to collect and for sale” basis are measured at fair value through other comprehensive income (FVOCI);
► Instruments that are managed on other basis,
including trading financial assets, will be measured at FVPL.
Equity financial assets are required to be classified at initial recognition as FVPL unless an irrevocable designation is made to classify the instrument as FVOCI. For equity investments classified as FVOCI, all realized and unrealized gains and losses, except for dividend income, are recognized in other comprehensive income with no subsequent reclassification to profit and loss.
The classification and measurement of financial liabilities remain largely unchanged from the current IAS 39 requirements. Derivatives will continue to be measured at FVPL.
The Bank expects to continue measuring at fair value all financial assets currently held at fair value.
Trading debt securities will continue to be classified as FVPL. Debt and equity securities currently classified as available-for-sale are expected to be measured at FVOCI under IFRS 9 as the Bank expects not only to hold these assets to collect contractual cash flows, but also to sell a significant amount on a relatively
FINANCIAL STATEMENTS
frequent basis. HTM debt securities will be measured at amortized costs. All loans are expected to satisfy the SPPI criterion and will continue to be measured at amortised cost.
(b) Impairment
IFRS 9 requires the Bank to record an allowance for expected credit losses (ECL) on all of its debt financial assets at amortised cost or FVOCI, as well as loan commitments and financial guarantees. The allowance is based on the ECL associated with the probability of default in the next twelve months unless there has been a significant increase in credit risk since origination, in which case the allowance is based on the ECL over the life of the asset. If the financial asset meets the definition of purchased or originated credit impaired, the allowance is based on the change in the lifetime ECL. At this point Bank has finalized segmenting, according to which for ECL calculation loan portfolio will be divided into three groups: Loans to legal entities, Mortgage loans and Other retail/consumer loans. PD, EAD and LDG models are currently under finalization. Macro parameters to be used in PD model are also agreed, now final testing is underway. When estimating the ECLs, the
Bank will consider three scenarios: base, upside and downside scenarios.
IFRS 15 Revenue from Contracts with Customers
IFRS 15, issued in May 2014, and amended in April 2016, will supersede all current revenue recognition requirements under IFRS. Either a full retrospective application or a modified retrospective application is required for annual periods beginning on or after 1 January 2018. The Bank plans to adopt the new standard using the modified retrospective method by recognizing the cumulative transition effect in opening retained earnings on 1 January 2018, without restating comparative information.
IFRS 15 establishes a five-step model to account for revenue arising from contracts with customers. Under IFRS 15, revenue is recognised at an amount that reflects the consideration to which an entity expects to be entitled in exchange for transferring goods or services to a customer. However, interest and fee income integral to financial instruments and leases will fall outside the scope of IFRS 15 and will be regulated by the other applicable standards (IFRS 9 and IFRS 16 Leases). As a result, the majority of the
Bank’s income will not be impacted by the adoption of this standard.
The Bank currently does not expect a material effect from initial application of IFRS 15.
IFRS 2 Classification and Measurement of Share-based Payment Transactions – Amendments to IFRS 2
The IASB issued amendments to IFRS 2 Share-based Payment that address three main areas: the effects of vesting conditions on the measurement of a cash-settled share-based payment transaction; the classification of a share-based payment transaction with net settlement features for withholding tax obligations; and accounting where a modification to the terms and conditions of a share-based payment transaction changes its classification from cash settled to equity settled. On adoption, entities are required to apply the amendments without restating prior periods, but retrospective application is permitted if elected for all three amendments and other criteria are met. The amendments are effective for annual periods beginning on or after 1 January 2018, with early application permitted. The Bank does not expect a material effect from application of
FINANCIAL STATEMENTS
TOPTOPCONTENTS CONTENTS

138 139
these amendments.
IFRS 16 Leases
IFRS 16 was issued in January 2016 and it replaces IAS 17 Leases, IFRIC 4 Determining whether an Arrangement Contains a Lease, SIC-15 Operating Leases – Incentives and SIC-27 Evaluating the Substance of Transactions Involving the Legal Form of a Lease. IFRS 16 sets out the principles for the recognition, measurement, presentation and disclosure of leases and requires lessees to account for all leases under a single on-balance sheet model similar to the accounting for finance leases under IAS 17. The standard includes two recognition exemptions for lessees − leases of ‘low-value’ assets and short-term leases (i.e., leases with a lease term of 12 months or less). At the commencement date of a lease, a lessee will recognise a liability to make lease payments (i.e., the lease liability) and an asset representing the right to use the underlying asset during the lease term (i.e., the right-of-use asset). Lessees will be required to separately recognise the interest expense on the lease liability and the depreciation expense on the right-of-use asset.
Lessees will be also required to remeasure the lease liability upon the occurrence of certain events (e.g., a change in the lease term, a change in future lease payments resulting from a change in an index or rate used to determine those payments). The lessee will generally recognise the amount of the remeasurement of the lease liability as an adjustment to the right-of-use asset.
Lessor accounting under IFRS 16 is substantially unchanged from today’s accounting under IAS 17. Lessors will continue to classify all leases using the same classification principle as in IAS 17 and distinguish between two types of leases: operating and finance leases.
IFRS 16 also requires lessees and lessors to make more extensive disclosures than under IAS 17.
IFRS 16 is effective for annual periods beginning on or after 1 January 2019. Early application is permitted, but not before an entity applies IFRS 15. A lessee can choose to apply the standard using either a full retrospective or a modified retrospective approach. The standard’s transition provisions permit certain reliefs. In 2018, the Bank will continue to assess the
potential effect of IFRS 16 on its financial statements.
Annual improvements 2014-2016 cycle (issued in December 2016)
These improvements include:
IFRIC Interpretation 22 Foreign Currency Transactions and Advance Consideration
The Interpretation clarifies that, in determining the spot exchange rate to use on initial recognition of the related asset, expense or income (or part of it) on the derecognition of a non-monetary asset or non-monetary liability relating to advance consideration, the date of the transaction is the date on which an entity initially recognises the non-monetary asset or non-monetary liability arising from the advance consideration. The Interpretation is effective for annual periods beginning on or after 1 January 2018. Since the Bank’s current practice is in line with the Interpretation, the Bank does not expect any effect on its financial statements.
FINANCIAL STATEMENTS
IFRIC Interpretation 23 Uncertainty over Income Tax Treatment
The Interpretation addresses the accounting for income taxes when tax treatments involve uncertainty that affects the application of IAS 12 and does not apply to taxes or levies outside the scope of IAS 12, nor does it specifically include requirements relating to interest and penalties associated with uncertain tax treatments.
An entity must determine whether to consider each uncertain tax treatment separately or together with one or more other uncertain tax treatments. The approach that better predicts the resolution of the uncertainty should be followed. The Interpretation also addresses the assumptions an entity makes about the examination of tax treatments by taxation authorities, as well as how it considers changes in facts and circumstances.
The interpretation is effective for annual reporting periods beginning on or after 1 January 2019, but certain transition reliefs are available. The Bank will apply interpretation from its effective date. Since the Bank operates in a complex tax environment,
applying the Interpretation may affect its financial statements and the required disclosures. In addition, the Bank may need to establish processes and procedures to obtain information that is necessary to apply the Interpretation on a timely basis.
4. Segment information
For management purposes, the Bank is organised into three operating segments based on products and services as follows:
Retail banking
Principally handling individual and small and micro legal entity customers’ deposits, and providing consumer loans, overdrafts, credit cards facilities and small and micro loans.
Corporate banking
Principally handling loans and other credit facilities and deposit and current accounts for corporate and institutional customers.
Trading and Investment banking (IB)
Treasury and finance, investment banking and other central functions.
Management monitors the operating results of its business units separately for the purpose of making decisions about resource allocation and performance assessment. Income taxes is managed on a profit before income tax basis and is allocated to operating segments.
Transfer prices between operating segments are on an arm’s length basis in a manner similar to transactions with third parties.
No revenue from transactions with a single external customer or counterparty amounted to 10% or more of the Bank’s total revenue in 2017 or 2016.
The following tables present income and profit and certain asset and liability information regarding the Bank’s operating segments.
FINANCIAL STATEMENTS
TOPTOPCONTENTS CONTENTS

140 141
FINANCIAL STATEMENTS
2017Retail banking
AMD’000
(2,737,694)1,482,223
12,066,78410,811,313
(703,438)(647,915)
(5,941,305)3,518,655(696,119)
2,822,536
78,557,262248,023,707
16,375,4032,833,507
(8,034,602)11,174,308(5,108,206)(108,856)
(2,356,313)3,600,933(712,397)
2,888,536
412,689,748335,400,570
4,726,6003,000,275
(4,032,182)3,694,693
−(111,072)
(1,166,513)2,417,108(478,193)
1,938,915
74,240,37517,535,534
18,364,3097,316,005
−25,680,314(5,811,644)(867,843)
(9,464,131)9,536,696
(1,886,709)7,649,987
565,487,385600,959,811
Corporate bankingAMD’000
Trading and IBAMD’000
TotalAMD’000
Net interest income (expense)Net non-interest incomeInter-segment revenue (expense) Operating profitImpairment lossesDepreciation and amortizationPersonnel and other general administrative expensesProfit before income taxIncome tax expenseProfit for the year
Interest earning financial assets Interest bearing financial liabilities
2017Retail banking
AMD’000Corporate banking
AMD’000Trading and IB
AMD’000Total
AMD’000
FINANCIAL STATEMENTS
2016
2016
Retail bankingAMD’000
Retail bankingAMD’000
(2,052,253)1,470,5708,899,6368,317,953(749,239)(633,600)
(4,941,067)1,994,047(100,195)
1,893,852
60,254,233172,461,524
13,801,6793,058,723
(6,742,078)10,118,324(4,685,162)
(85,826)(2,427,731)2,919,605(867,756)
2,051,849
461,773,974472,310,438
3,125,6113,181,067
(2,157,558)4,149,120
−(59,068)
(1,274,408)2,815,644(554,659)
2,260,985
58,613,2793,108,720
14,875,0377,710,360
−22,585,397(5,434,401)(778,494)
(8,643,206)7,729,296
(1,522,610)6,206,686
580,641,486647,880,682
Corporate bankingAMD’000
Corporate bankingAMD’000
Trading and IBAMD’000
Trading and IBAMD’000
TotalAMD’000
TotalAMD’000
Net interest income (expense)Net non-interest incomeInter-segment revenue (expense) Operating profitImpairment lossesDepreciation and amortizationPersonnel and other general administrative expensesProfit before income taxIncome tax expenseProfit for the year
Interest earning financial assets Interest bearing financial liabilities
Interest earning assets include available-for-sale financial assets, debt instruments at fair value through profit or loss, interest bearing loans and advances to banks, amounts receivable under reverse repurchase agreements, gross loans and advances to customers and held-to-maturity investments.
Interest bearing financial liabilities include deposits
and balances from banks (excluding Vostro accounts), amounts payable under repurchase agreements, current accounts and deposits from customers, debt securities issued, other borrowed funds, subordinated borrowings.
In 2017 the Bank reviewed the methodology of Internal Funds transfer pricing policy (allocation of equity
among segments has been changed). This change had its effect on Intersegment revenue (expense) line in 2017. Comparative segment information for 2016 was represented accordingly to align with the updated methodology.
TOPTOPCONTENTS CONTENTS

142 143
FINANCIAL STATEMENTS
Interest earning assets include available-for-sale financial assets, interest bearing loans and advances to banks, amounts receivable under reverse repurchase agreements, gross loans and advances to customers, gross receivables from letters of credit, gross receivables from finance leases, gross receivables from factoring and held-to-maturity investments.
Interest bearing financial liabilities include deposits and balances from banks (excluding Vostro accounts), amounts payable under repurchase agreements, current accounts and deposits from customers, debt securities issued, other borrowed funds, subordinated borrowings.
Geographic information
The Bank’s operations are primarily concentrated in Armenia. The Bank has no non-current assets other than financial instruments outside Armenia.
FINANCIAL STATEMENTS
5. Net interest income
Interest incomeLoans to legal entities and individualsHeld-to-maturity investmentsAvailable-for-sale financial assetsAmounts receivable under reverse repurchase agreementsReceivables from factoringReceivables from letters of creditLoans and advances to banksDebt instruments at fair value through profit or lossOther
Receivables from finance leases
Interest expenseCurrent accounts and deposits from customers Other borrowed funds and subordinated borrowingsDeposits and balances from banksDebt securities issuedPayables under letters of creditAmounts payable under repurchase agreementsOther
Net interest income
2017AMD’000
43,010,0613,016,7211,059,197581,451538,402519,822308,43040,49676,079
49,150,659146,539
49,297,198
15,143,58810,045,3933,504,8481,770,695408,40630,18229,777
30,932,88918,364,309
36,883,0391,853,5371,228,587611,213768,153752,499265,806
−44,421
42,407,255217,010
42,624,265
15,765,8348,766,4711,672,840552,984445,940520,23624,923
27,749,22814,875,037
2016AMD’000
TOPTOPCONTENTS CONTENTS

144 145
FINANCIAL STATEMENTS6. Fee and commission income
7. Fee and commission expense
8. Gain from cession
During 2016, the Bank entered into loan cession agreements with four counterparties and transferred to them loans and other receivables (including fully written-off balances) due from ten borrowers in total gross nominal amount of AMD 2,130,029 thousand for consideration receivable in arrears with fair value of
Plastic card servicing feesMoney transfersCash withdrawal, account service and distance system servicesGuarantee and letter of credit issuance Brokerage servicesSettlement operationsOther
Plastic card maintenance Money transfersGuarantee and letter of credit issuance Other
2017AMD’000
2017AMD’000
1,618,717755,527687,960258,080132,35583,93740,449
3,577,025
592,739120,51348,20330,435
791,890
1,274,114519,754465,820319,171184,14254,78248,332
2,866,115
407,321104,68071,17627,152
610,329
2016AMD’000
2016AMD’000
AMD 1,801,635 thousand. The management concluded that the Bank had transferred all risks and regards from the transferred loans and receivables and recognized the difference between carrying amount of these loans and receivables (AMD 704,811 thousand) and total fair value of consideration receivable as of the cession
agreement dates as gain from cession in amount of AMD 1,096,824 thousand. As of the date of issue of these financial statements AMD 1,582,855 thousand from consideration receivable has been repaid.
FINANCIAL STATEMENTS
10. Net foreign exchange gain
11. Other operating income
9. Net (loss)/gain on financial instruments at fair value through profit or loss
Net loss on financial instruments at fair value through profit or loss in amount of AMD (1,976,234) thousand (2016: net gain in amount of AMD 1,055,909 thousand) includes revaluation of currency and interest rate derivative instruments, which are used for economic hedging of open currency and interest rate positions of the Bank.
Net gain on spot transactionsNet gain/(loss) from revaluation of financial assets and liabilities
Income from fines and penaltiesIncome from consulting servicesOther income
2017AMD’000
2017AMD’000
3,601,3742,213,9615,815,335
1,276,206511,270372,065
2,159,541
2,724,237(258,894)
2,465,343
1,337,30324,900199,437
1,561,640
2016AMD’000
2016AMD’000
TOPTOPCONTENTS CONTENTS

146 147
12. Other operating expenses
13. Impairment losses
Payment system expensesGuarantee payments to Armenian Deposit Guarantee FundSoftware maintenanceAgent feeFees for terminal usageFinancial system mediatorEncashmentMonitoring servicesOther expenses
Loans and advances to customersOther assets
2017AMD’000
2017AMD’000
487,142408,010288,189172,03094,38471,54552,31839,694279,168
1,892,480
5,688,706122,938
5,811,644
359,890311,351250,32372,267125,53351,38048,13447,800194,811
1,461,489
5,396,44837,953
5,434,401
2016AMD’000
2016AMD’000
FINANCIAL STATEMENTS
14. Other general administrative expenses
Operating lease expenseDepreciation and amortizationAdvertising and marketingRepairs and maintenanceOther personnel expensesProfessional servicesSecurityTravel expensesCommunications and information servicesElectricity and utilities Charity and sponsorshipTraining and educationOffice suppliesInsuranceTaxes other than on payroll and incomeRepresentation expensesOther
2017AMD’000
1,042,965867,843674,755316,976189,304157,877136,252117,628106,51394,49090,38439,04430,77030,10625,49716,902153,855
4,091,161
1,019,034778,494631,039258,883163,08698,849113,33187,173102,92587,427118,55033,37028,42129,50132,08120,532143,714
3,746,410
2016AMD’000
FINANCIAL STATEMENTS
TOPTOPCONTENTS CONTENTS

148 149
15. Income tax expense
Reconciliation of effective tax rate
(i) Deferred tax asset and liability
Temporary differences between the carrying amounts of assets and liabilities for financial reporting purposes and the amounts used for taxation purposes give rise to net deferred tax liabilities as at 31 December 2017 and 2016. The deductible temporary differences do not expire under current tax legislation.
Current tax expenseCurrent tax chargeAdjustments in respect of current income tax of previous year
Deferred tax expenseDeferred taxation movement due to origination and reversal of temporary differencesTotal income tax expense
Profit before tax
Income tax at the applicable tax ratePrior period income tax correctionNet gain from revaluation of financial assets and liabilities and net loss on financial instruments at fair value through profit or loss (non-taxable part)Non-deductible expensesTotal income tax expense
In 2017 the applicable tax rate for current and deferred tax is 20% (2016: 20%).
2017AMD’000
2017AMD’000 %
20%
%
20%
2,353,859(41,802)
(425,348)1,886,709
9,536,696
1,907,339(41,802)
10,33810,834
1,886,709
765,182(66,398)
823,8261,522,610
7,729,296
1,545,859(66,398)
(17,932)61,081
1,522,610
2016AMD’000
2016AMD’000
FINANCIAL STATEMENTS
Reconciliation of effective tax rate (continued)
Movements in temporary differences during the years ended 31 December 2017 and 2016 are presented as follows:
FINANCIAL STATEMENTS
2017AMD’000
2016AMD’000
Balance1 January 2017
Balance1 January 2016
(102,874)(76,977)(197,664)
(1,336,197)(45,152)10,500362,234(56,742)
(1,442,872)
20,69462,82565,746
(1,010,351)14,37913,104354,359
−(479,244)
72,593−
(91)260,909(23,182)14,74386,32414,052
425,348
(123,568)−
(263,410)(325,846)(59,531)(2,604)7,875
(56,742)(823,826)
−(7,579)
−−−−−−
(7,579)
−(139,802)
−−−−−−
(139,802)
(30,281)(84,556)(197,755)
(1,075,288)(68,334)25,243448,558(42,690)
(1,025,103)
(102,874)(76,977)(197,664)
(1,336,197)(45,152)10,500362,234(56,742)
(1,442,872)
Recognized in profit or loss
Recognized in profit or loss
Recognized in other comprehensive income
Recognized in other comprehensive income
Balance 31 December 2017
Balance 31 December 2016
Financial instruments at fair value through profit or lossAvailable-for-sale financial assetsAllowance for other receivables and other provisionsLoans and advances to customersProperty and equipmentOther assetsOther liabilitiesOther borrowed fundsTotal deferred tax liability
Financial instruments at fair value through profit or lossAvailable-for-sale financial assetsAllowance for other receivables and other provisionsLoans and advances to customersProperty and equipmentOther assetsOther liabilitiesOther borrowed fundsTotal deferred tax liability
TOPTOPCONTENTS CONTENTS

150 151
FINANCIAL STATEMENTS16. Cash and cash equivalents
Cash on handNostro accounts with the CBA, including obligatory reserves
Nostro accounts with other banks- rated AA- to AA+- rated A- to A+- rated from BB- to BBB+- not ratedTotal nostro accounts with other banksTotal cash and cash equivalents
2017AMD’000
18,139,76776,917,450
12,9227,406,7335,095,603
43,89312,559,151107,616,368
12,826,023104,878,940
17,76710,125,8487,210,640221,654
17,575,909135,280,872
2016AMD’000
Banks are required to maintain cash deposit (obligatory reserve) with the CBA, equal to 2% of the amounts attracted in Armenian drams and 18% of the amounts attracted in foreign currency. The Bank’s ability to withdraw such deposit is not restricted by the statutory legislation, however, if the Bank fails to comply with minimum average monthly amount of reserve for amounts attracted in Armenian drams, and minimum average amount of reserve for a two-week period for amounts attracted in foreign currency, the sanctions may apply.
As of 31 December 2017 included in Nostro accounts with the CBA is the amount of obligatory reserve of AMD 66,516,596 thousand (2016: AMD 48,969,250 thousand).The above ratings of correspondent Banks are per Fitch rating agency.
As at 31 December 2017 the Bank has placement with one bank (2016: one), whose balances exceed 10% of the Bank’s equity. The gross value of these balances as at 31 December 2017 is AMD 7,406,733 thousand (2016: AMD 7,041,151 thousand).
As at 31 December 2017 and 31 December 2016 the balances with the Central Bank of Armenia exceed 10% of the Bank’s equity.
FINANCIAL STATEMENTS17. Financial instruments at fair value through profit or loss
AssetsDebt and other fixed-income trading instrumentsGovernment securities of the Republic of ArmeniaGovernment Eurobonds of the Republic of ArmeniaCorporate bonds of the Armenian companiesDerivative financial instruments Interest rate swapsCurrency swaps
LiabilitiesDerivative financial instrumentsCurrency swaps
Pay fixed in USD, receive floating in USD
2017AMD’000
2017AMD’000
Fair value Notional amount2017
AMD’000
1,443,746521,780
1,049,673
62,835890,030
3,968,064
686,306686,306
62,835 6,931,432
−−−
40,5903,089,4813,130,071
2,535,2832,535,283
40,590 11,218,609
2016AMD’000
2016AMD’000
2016AMD’000
Interest rate swapsThe table below summarizes the contractual amounts of interest rate swap contracts outstanding as at 31 December 2017 and 2016 with details of the fair values and notional amounts. Foreign currency amounts presented below are translated at rates effective at the reporting date. The resultant unrealized gains and losses on these unmatured contracts are recognized in profit or loss, as appropriate.
As at 31 December 2017, the Bank has four interest rate swap contracts. Under these contracts the Bank pays 2.1350%, 1.3125%, 0.9450% and 1.5850% fixed rates, and receives 6-month USD-LIBOR-BBA (British Bankers’ Association) floating rates for each contract, respectively. The contractual maturity of outstanding interest rate swap contracts is 2018-2022.
Currency swaps
As at 31 December 2017 the Bank has 30 (2016: 19) currency swap agreements with nine (2016: eight) counterparties in AMD, USD, EUR and Russian Roubles. As at December 31 2017, AMD equivalent of total notional amount of these agreements comprises AMD 91,882,316 thousand (2016: AMD 161,717,608 thousand).
TOPTOPCONTENTS CONTENTS

152 153
FINANCIAL STATEMENTS
18. Available-for-sale financial assets
Held by the BankDebt and other fixed-income instruments - Government bondsGovernment securities of the Republic of ArmeniaGovernment Eurobonds of the Republic of ArmeniaGovernment Eurobonds of other countries- Corporate bondsCorporate bonds of foreign companiesCorporate bonds of Armenian companiesEquity investments- Unquoted equity securities
Artsakh bank CJSCArCaSWIFT
2017AMD’000
Country of incorporation Main activityName
% Controlled
4,712,5781,083,8302,942,639
−1,042,573
106,4589,888,078
Republic of ArmeniaRepublic of Armenia
Belgium
BankingPayment systemMoney transfer
7,174,650−
1,066,963
3,418,111642,110
106,45812,408,292
1.06%3.76%0.00%
1.06%3.76%0.00%
69,25036,429
779106,458
69,25036,429
779106,458
2016AMD’000
2017 20162017
AMD’0002016
AMD’000
Included in available-for-sale assets are non-quoted equity securities as follows:
Investments without a determinable fair value
Available-for-sale equity investments stated at cost comprise unquoted equity securities. There is no market for these investments and there have not been any recent transactions that provide evidence of the current fair value. In addition, discounted cash flow techniques yield a wide range of fair values due to the uncertainty regarding future cash flows in this industry.
FINANCIAL STATEMENTS
19. Loans and advances to banks
Due from the CBACredit card settlement deposit with the CBADebt instruments of Armenian banks and credit organizationsBonds of Armenian banks and credit organizations
Loans and deposits with other banksArmenian banks OECD banksForeign other banksTotal loans and deposits with other banksTotal loans and advances to banks
2017AMD’000
1,423,500
628,936
8,726,92363,531
−8,790,454
10,842,890
1,220,000
−
2,500,8391,078,322
54,1413,633,3024,853,302
2016AMD’000
No loans and advances to banks are impaired or past due.
Included in loans and deposits with OECD banks and other foreign banks AMD 62,933 thousand (2016: AMD 117,053 thousand) represents deposits pledged for letters of credit, guarantees and credit cards.
Concentration of loans and advances to banks
As at 31 December 2017 the Bank has one bank (2016: no bank), whose balances exceed 10% of equity. As at 31 December 2017 the balance amounted to AMD 8,726,923 thousand.
TOPTOPCONTENTS CONTENTS

154 155
FINANCIAL STATEMENTS
20. Amounts receivable under reverse repurchase agreements
Amounts receivable from Armenian banks and other financial institutions
2017AMD’000
8,675,3948,675,394
6,446,7976,446,797
2016AMD’000
Collateral
As at 31 December 2017 and 31 December 2016 amounts receivable under reverse repurchase agreements were collateralized by government securities with fair value of AMD 9,112,667 thousand (2016: 6,814,064 thousand).
21. Loans and advances to customers
Loans to legal entitiesLoans to individuals Receivables from letter of creditReceivables from finance leaseReceivables from factoringGross loans and advances to customers
Impairment allowanceNet loans and advances to customers
2017AMD’000
416,715,12561,889,8094,129,7481,759,4706,752,241
491,246,393
(11,605,412)479,640,981
461,278,11246,996,7827,722,7482,101,7164,191,244
522,290,602
(9,071,893)513,218,709
2016AMD’000
FINANCIAL STATEMENTS
(a) Loans to legal entities and individuals
In the table below loans to legal entities of high grade are those having a minimal level of credit risk, normally very well collateralized (cash collateral or state guarantee). Other borrowers with good financial position and good debt service are included in the standard grade. Sub-standard grade comprises loans below standard grade but not individually impaired.
Loans to legal entitiesLoans to large companiesLoans to small and medium size companies
Total loans to legal entities Loans to individualsMortgage loansCredit cardsConsumer loansAuto loansBusiness loans to individualsTotal loans to individualsGross loans to legal entities and individuals
Impairment allowanceNet loans to legal entities and individuals
2017AMD’000
333,102,16783,612,958
416,715,125
28,601,85519,024,78011,167,7042,040,6001,054,870
61,889,809478,604,934
(11,294,203)467,310,731
384,267,79677,010,316
461,278,112
20,051,10318,403,8465,454,8472,043,0681,043,918
46,996,782508,274,894
(8,986,372)499,288,522
2016AMD’000
TOPTOPCONTENTS CONTENTS

156 157
FINANCIAL STATEMENTS
Net loans to legal entities
High grade 2016
AMD’000
Neither past due nor impairedSub-standard
grade 2016
AMD’000
Individually impaired
2016AMD’000
145,465,085 2,052,570 10,591,029291,807,705 2,871,395 452,787,784
Standard grade 2016
AMD’000
Past due but not impaired
2016AMD’000
Total2016
AMD’000
Net loans to legal entities
High grade 2017
AMD’000
Neither past due nor impairedSub-standard
grade 2017
AMD’000
Individually impaired
2017AMD’000
34,145,112 579,047 9,298,154358,105,168 3,811,355 405,938,836
Standard grade 2017
AMD’000
Past due but not impaired
2017AMD’000
Total2017
AMD’000
FINANCIAL STATEMENTS
As at 31 December 2017 the loans to legal entities include loans provided to related parties amounting to AMD 32,150,069 thousand (2016: AMD 72,955,885 thousand) which has been collateralized with deposits amounting to AMD 32,204,509 thousand (2016: AMD 73,171,153 thousand).
Movements in the loan impairment allowance by classes of loans to legal entities and individuals for the year 2017 are as follows:
Movements in the loan impairment allowance by classes of loans to legal entities and individuals for the 2016 are as follows:
Balance at the beginning of the yearNet chargeRecovery of loans previously written offWrite-offsBalance at the end of the year
Balance at the beginning of the yearNet chargeRecovery of loans previously written offWrite-offsDisposal of loansBalance at the end of the year
Loans to legal entities
AMD’000
Loans to legal entities
AMD’000
TotalAMD’000
TotalAMD’000
8,490,3285,081,973161,236
(2,957,248)10,776,289
4,907,1734,505,096188,461
(894,856)(215,546)
8,490,328
8,986,3725,457,797349,719
(3,499,685)11,294,203
5,240,8835,084,493367,835
(1,491,293)(215,546)8,986,372
496,044375,824188,483
(542,437)517,914
333,710579,397179,374
(596,437)−
496,044
Loans to individualsAMD’000
Loans to individualsAMD’000
TOPTOPCONTENTS CONTENTS

158 159
FINANCIAL STATEMENTS
(i) Credit quality of loans to legal entities and individuals
The following table provides information on the credit quality of loans to legal entities and individuals as at 31 December 2017:
Loans to corporate customersLoans to large corporatesNot impaired loans- not overdue- overdue more than 90 daysTotal not impaired loans
Impaired loans- not overdue- overdue more than 90 daysTotal impaired loansTotal loans to large corporates
Loans to small and medium size companiesNot impaired loans- not overdue- overdue less than 30 days- 31-90 days overdue- overdue more than 90 daysTotal not impaired loans
Impaired loans- overdue more than 90 daysTotal impaired loansTotal loans to small and medium size companiesTotal loans to corporate customers
Impairment allowanceAMD’000
Gross loansAMD’000
Impairment allowance to gross loans %
2,951,0321,296
2,952,328
1,386,7253,171,0944,557,8197,510,147
1,280,62227,76410,73426,767
1,345,887
1,920,2551,920,2553,266,14210,776,289
321,466,902127,085
321,593,987
5,832,9375,675,243
11,508,180333,102,167
75,594,0811,595,583616,922
1,538,32579,344,911
4,268,0474,268,04783,612,958416,715,125
0.92%1.02%0.92%
23.77%55.88%39.61%2.25%
1.69%1.74%1.74%1.74%1.70%
44.99%44.99%3.91%2.59%
318,515,870125,789
318,641,659
4,446,2122,504,1496,950,361
325,592,020
74,313,4591,567,819606,188
1,511,55877,999,024
2,347,7922,347,792
80,346,816405,938,836
Net loansAMD’000
FINANCIAL STATEMENTS
Loans to retail customersMortgage loans- not overdue- overdue less than 30 days- 31-90 days overdue- overdue more than 90 daysTotal mortgage loans
Credit cards- not overdue- overdue less than 30 days- 31-90 days overdue- overdue more than 90 daysTotal credit cards
Business loans - not overdue- 31-90 days overdueTotal business loans
Auto loans- not overdue- overdue less than 30 days- 31-90 days overdue- overdue more than 90 daysTotal auto loans
Impairment allowanceAMD’000
Gross loansAMD’000
Impairment allowance to gross loans %
55,6461,71752,000139,441248,804
37,6116,03314,82236,72195,187
15,2221,550
16,772
4,02352317042
4,758
27,823,34421,143137,186620,182
28,601,855
17,531,42752,43645,328
1,395,58919,024,780
957,33397,537
1,054,870
2,011,3916,8472,21620,146
2,040,600
0.20%8.12%37.90%22.48%0.87%
0.21%11.51%32.70%2.63%0.50%
1.59%1.59%1.59%
0.20%7.64%7.67%0.21%0.23%
27,767,69819,42685,186480,741
28,353,051
17,493,81646,40330,506
1,358,86818,929,593
942,11195,987
1,038,098
2,007,3686,3242,04620,104
2,035,842
Net loansAMD’000
TOPTOPCONTENTS CONTENTS
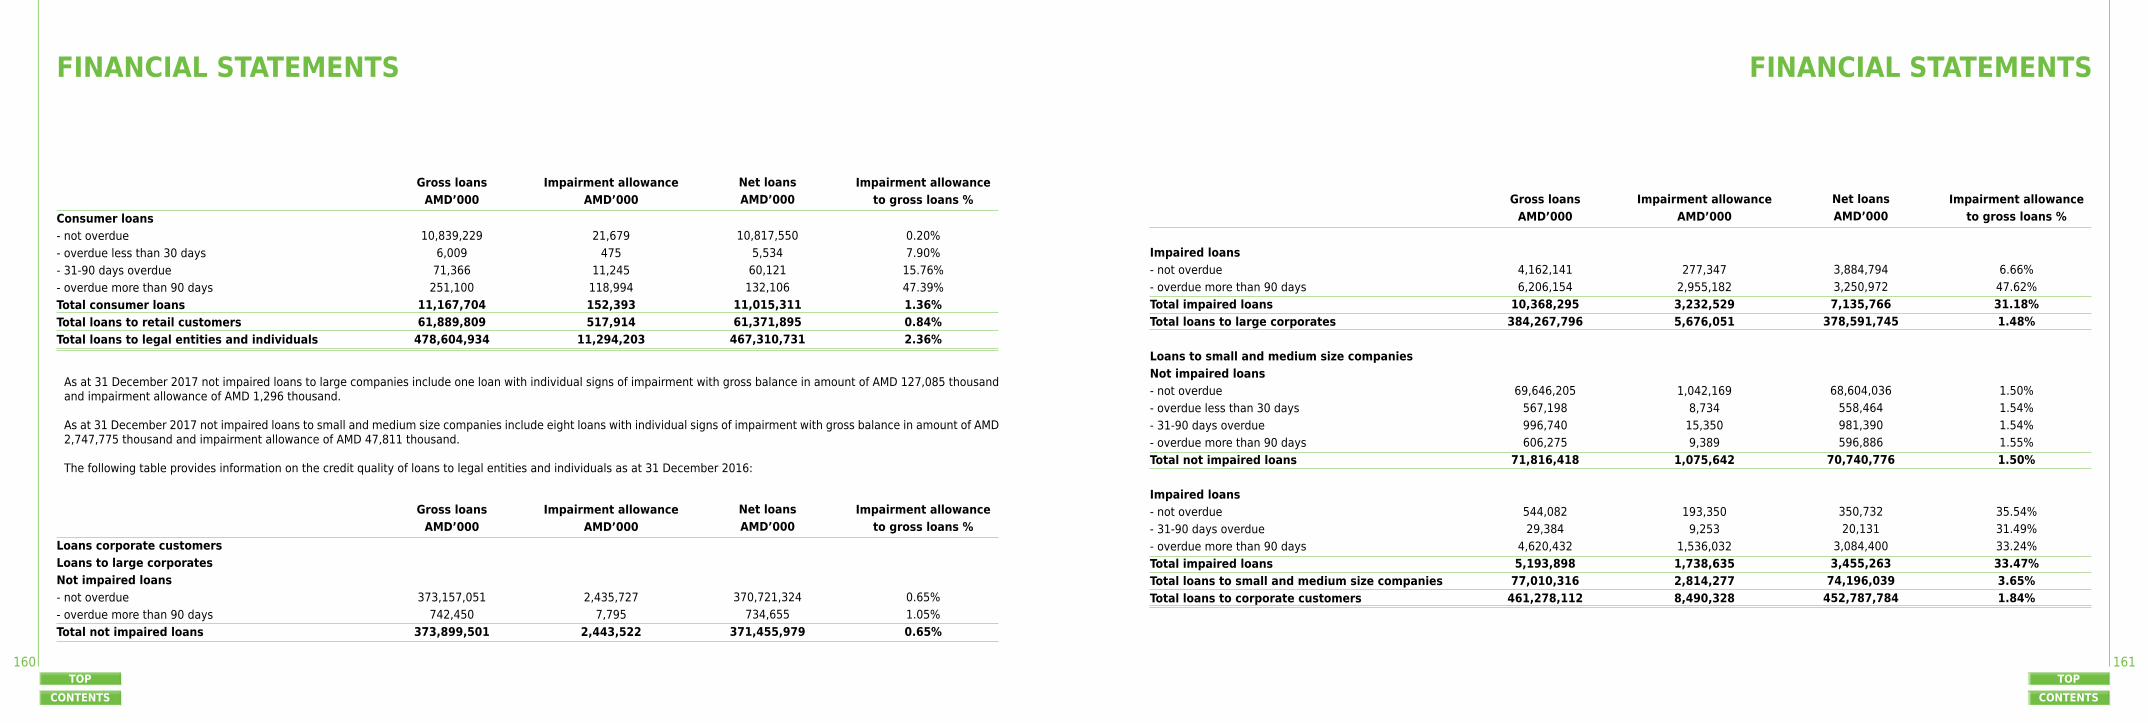
160 161
FINANCIAL STATEMENTS
Consumer loans - not overdue- overdue less than 30 days- 31-90 days overdue- overdue more than 90 daysTotal consumer loansTotal loans to retail customersTotal loans to legal entities and individuals
Loans corporate customersLoans to large corporatesNot impaired loans- not overdue- overdue more than 90 daysTotal not impaired loans
Impairment allowanceAMD’000
Impairment allowanceAMD’000
Gross loansAMD’000
Gross loansAMD’000
Impairment allowance to gross loans %
Impairment allowance to gross loans %
21,679
47511,245
118,994152,393517,914
11,294,203
2,435,7277,795
2,443,522
10,839,229
6,00971,366
251,10011,167,70461,889,809478,604,934
373,157,051742,450
373,899,501
0.20%7.90%15.76%47.39%1.36%0.84%2.36%
0.65%1.05%0.65%
10,817,550
5,53460,121132,106
11,015,31161,371,895
467,310,731
370,721,324734,655
371,455,979
Net loansAMD’000
Net loansAMD’000
As at 31 December 2017 not impaired loans to large companies include one loan with individual signs of impairment with gross balance in amount of AMD 127,085 thousand and impairment allowance of AMD 1,296 thousand.
As at 31 December 2017 not impaired loans to small and medium size companies include eight loans with individual signs of impairment with gross balance in amount of AMD 2,747,775 thousand and impairment allowance of AMD 47,811 thousand.
The following table provides information on the credit quality of loans to legal entities and individuals as at 31 December 2016:
FINANCIAL STATEMENTS
Impaired loans- not overdue- overdue more than 90 daysTotal impaired loansTotal loans to large corporates
Loans to small and medium size companiesNot impaired loans- not overdue- overdue less than 30 days- 31-90 days overdue- overdue more than 90 daysTotal not impaired loans
Impaired loans- not overdue- 31-90 days overdue- overdue more than 90 daysTotal impaired loansTotal loans to small and medium size companiesTotal loans to corporate customers
Impairment allowanceAMD’000
Gross loansAMD’000
Impairment allowance to gross loans %
277,3472,955,1823,232,5295,676,051
1,042,1698,73415,3509,389
1,075,642
193,3509,253
1,536,0321,738,6352,814,2778,490,328
4,162,1416,206,154
10,368,295384,267,796
69,646,205567,198996,740606,275
71,816,418
544,08229,384
4,620,4325,193,898
77,010,316461,278,112
6.66%47.62%31.18%1.48%
1.50%1.54%1.54%1.55%1.50%
35.54%31.49%33.24%33.47%3.65%1.84%
3,884,7943,250,9727,135,766
378,591,745
68,604,036558,464981,390596,886
70,740,776
350,73220,131
3,084,4003,455,263
74,196,039452,787,784
Net loansAMD’000
TOPTOPCONTENTS CONTENTS

162 163
FINANCIAL STATEMENTS
Loans to retail customersMortgage loans- not overdue- overdue less than 30 days- 31-90 days overdue- overdue more than 90 daysTotal mortgage loans
Credit cards- not overdue- overdue less than 30 days- 31-90 days overdue- overdue more than 90 daysTotal credit cards
Business loans - not overdue- overdue more than 90 daysTotal business loans
Auto loans- not overdue- overdue less than 30 days- 31-90 days overdue- overdue more than 90 daysTotal auto loans
Impairment allowanceAMD’000
Gross loansAMD’000
Impairment allowance to gross loans %
48,4457,045
15,462105,264176,216
35,7039,041
26,067131,825202,636
14,0507,968
22,018
3,9511,3701,1621,4227,905
19,186,16183,00280,329
701,61120,051,103
16,655,03059,964
102,4831,586,369
18,403,846
702,500341,418
1,043,918
1,975,60827,60023,41316,447
2,043,068
0.25%8.49%19.25%15.00%0.88%
0.21%15.08%25.44%8.31%1.10%
2.00%2.33%2.11%
0.20%4.96%4.96%8.65%0.39%
19,137,71675,95764,867596,347
19,874,887
16,619,32750,92376,416
1,454,54418,201,210
688,450333,450
1,021,900
1,971,65726,23022,25115,025
2,035,163
Net loansAMD’000
FINANCIAL STATEMENTS
Consumer loans - not overdue- overdue less than 30 days- 31-90 days overdue- overdue more than 90 daysTotal consumer loansTotal loans to retail customersTotal loans to legal entities and individuals
Impairment allowanceAMD’000
Gross loansAMD’000
Impairment allowance to gross loans %
16,3671,799159
68,94487,269
496,0448,986,372
5,191,37814,0581,240
248,1715,454,847
46,996,782508,274,894
0.32%12.80%12.82%27.78%1.60%1.06%1.77%
5,175,01112,2591,081
179,2275,367,578
46,500,738499,288,522
Net loansAMD’000
As at 31 December 2016 not impaired loans to large companies include four loans with individual signs of impairment with gross balance in amount of AMD 2,481,773 thousand and impairment allowance of AMD 26,059.
As at 31 December 2016 not impaired loans to small and medium size companies include nine loans with individual signs of impairment with gross balance in amount of AMD 1,166,677 thousand and impairment allowance of AMD 17,966 thousand.
(ii) Key assumptions and judgments for estimating the loan impairment
Loans to legal entities
Loan impairment results from one or more events that occurred after the initial recognition of the loan and that have an impact on the estimated future cash flows associated with the loan, and that can be reliably estimated. Loans without individual signs of impairment do not have objective evidence of impairment that can be directly attributed to them.
The objective indicators of loan impairment for loans to legal entities include the following:► Overdue payments under the loan agreement;► Significant difficulties in the financial conditions of the borrower;► Deterioration in business environment or negative changes in the borrower’s markets.
TOPTOPCONTENTS CONTENTS

164 165
FINANCIAL STATEMENTS
The Bank estimates loan impairment for loans to legal entities based on an analysis of the future cash flows for loans with individual signs of impairment and based on its past loss experience for portfolios of loans for which no individual signs of impairment have been identified.
In determining the impairment allowance for loans to legal entities, management makes the following key assumptions:► Historic annual loss rate is applied for performing
loans to legal entities and small and medium size companies. Historic annual loss rate is estimated based on average loan write-off statistics and economic coefficient and is applied in respect of performing loans to legal entities.
► Recoverable amount for loans with individual signs of impairment is calculated based on following assumptions:
1) A discount of between 20% and 30% to the collateral value;
2) A delay of 12 months in obtaining proceeds from the foreclosure of collateral;
3) Cash flows from renegotiated loans are assessed based on the rescheduled agreement terms.
Loans to individuals
The Bank estimates loan impairment for loans to individuals based on its past historical loss experience on each type of loan. The significant assumptions used by management in determining the impairment
losses for loans to individuals include: ► Loss migration rates are estimated based on the
historic loss migration pattern for the past 24 months. Loss migration rates are applied in respect of mortgage, credit card, auto and consumer loans;
► Historic annual loss rate is estimated based on average loan write-off statistics and economic coefficient and is applied in respect of performing business loans to individuals.
(iii) Individually impaired loans
Interest income accrued on individually impaired loans for the year ended 31 December 2017 comprised AMD 786,780 thousand (2016: AMD 740,969 thousand).
(iv) Analysis of collateral
Loans to legal entities
Loans to legal entities are subject to individual credit appraisal and impairment testing. The general creditworthiness of legal entities tends to be important indicator of credit quality of the loan extended to it. However, collateral provides additional security and the Bank generally requests legal entities to provide it.
The main types of collateral obtained are as follows:► For securities lending and reverse repurchase
transactions, cash or securities.► For commercial lending, charges over real estate
properties, inventory and trade receivables; cash collateral.
► For retail lending, mortgages over residential properties.
The Bank also obtains guarantees from parent companies for loans to their subsidiaries.
Management monitors the market value of collateral, requests additional collateral in accordance with the underlying agreement, and monitors the market value of collateral obtained during its review of the adequacy of the allowance for loan impairment.
The fair value of collateral that the Bank holds relating to loans with individual signs of impairment at 31 December 2017 amounts to AMD 12,576,099 thousand (2016: AMD 10,835,708 thousand).
The recoverability of loans which are neither past due nor impaired is primarily dependent on the creditworthiness of the borrowers rather than the value of collateral, and the Bank does not necessarily update the valuation of collateral as at each reporting date.
FINANCIAL STATEMENTS
Loans to individuals
Mortgage loans are secured by the underlying housing real estate. The Bank’s policy is to issue mortgage loans with a loan-to-value ratio of a maximum of 70%.
Secured credit card overdrafts are mainly secured by real estate and cars. Other credit card overdrafts are secured by salary. Business loans are secured by real estate and corporate shares. Auto loans are secured by the underlying cars. As of 31 December 2017 consumer loans are secured by real estate, movable property, salary, cash and guarantees. Other loans to individuals are mainly secured by gold.
Repossessed collateral
During the year 2017, the Bank obtained certain assets by taking possession of collateral for loans to legal entities with a net carrying amount of AMD 617,777 thousand (2016: AMD 244,754 thousand). As at 31 December 2017 the repossessed collateral comprise real estate and is classified as other assets.
The Bank’s intention is to sell these assets as soon as it is practicable.
(v) Industry and geographical analysis of the loans to legal entities and individuals
Loans were issued to finance the following economic sectors:
Wholesale tradeFinance and investmentMining/metallurgyHotel serviceConstructionAgriculture, forestry and timberFood and beverageRetail tradeEnergyReal estateCommunication servicesManufacturingTransportationMunicipal authoritiesOtherLoans to individuals
Impairment allowance
ArmeniaOECD and EUOther foreign countries
The geographical concentration of Bank’s loans to legal entities (net loans) is set out below:
2017AMD’000
2017AMD’000
76,026,83474,110,28851,048,12232,463,34330,072,85327,180,75021,641,39421,081,80517,184,85213,297,23613,161,8179,459,3817,827,878
−22,158,57261,889,809
478,604,934(11,294,203)467,310,731
312,607,97946,222,31947,108,538
405,938,836
47,417,21477,261,90628,408,36125,468,85184,189,99123,843,77720,163,24617,034,14625,620,35150,249,42922,310,9459,608,69810,171,744
160,37919,369,07446,996,782
508,274,894(8,986,372)
499,288,522
266,046,599141,973,02844,768,157
452,787,784
2016AMD’000
2016AMD’000
TOPTOPCONTENTS CONTENTS

166 167
FINANCIAL STATEMENTS
(vi) Significant credit exposures
As at 31 December 2017 the Bank has seventeen borrowers or groups of connected borrowers (2016: twelve), whose loan balances exceed 10% of the Bank’s equity. The exposure on these loans (net of cash collateral received) as at 31 December 2017 is AMD 163,847,088 thousand (2016: AMD 108,667,191 thousand).
(vii) Loan maturities
The maturity of the loan portfolio is presented in Note 32 (d), which shows the remaining period from the reporting date to the contractual maturity of the loans.
(b) Receivables from letters of credit
As at 31 December 2017 the Bank has no customers (2016: none), whose balances exceed 10% of the Bank’s equity. Movements in impairment allowance for the year 2017 and 2016 are as follows:
(i) Quality analysis of letters of credit
As at 31 December 2017 the Bank does not have any impaired or overdue amounts receivable from letters of credit.
Receivables from letters of credit, gross amountImpairment allowance
Balance at the beginning of the yearNet chargeWrite-offsBalance at the end of the year
2017AMD’000
2017AMD’000
4,129,748(8,259)
4,121,489
15,445(7,186)
−8,259
7,722,748(15,445)
7,707,303
1,246,423280,364
(1,511,342)15,445
2016AMD’000
2016AMD’000
(c) Receivables from finance leases
FINANCIAL STATEMENTS
Gross investment in finance leases receivableLess than one yearBetween one and five yearsMore than five years
Unearned finance incomeImpairment allowanceNet investment in finance leases The net investment in finance leases comprisesLess than one yearBetween one and five yearsMore than five years
2017AMD’000
491,429947,298908,848
2,347,575(588,105)(289,446)
1,470,024
423,387634,289412,348
1,470,024
533,8781,158,9941,144,6652,837,537(735,821)(61,694)
2,040,022
482,222900,996656,804
2,040,022
2016AMD’000
TOPTOPCONTENTS CONTENTS

168 169
FINANCIAL STATEMENTS
(i) Quality analysis of finance leases The following table provides information on the quality analysis of finance leases as at 31 December 2017:
The following table provides information on the quality analysis of finance leases as at 31 December 2016:
Movements in impairment allowance for the year 2017 and 2016 are as follows:
Finance leases- not overdue- overdue less than 30 days- 31-90 days overdue- more than 90 daysTotal finance leases
Finance leases- not overdue- 31-90 days overdue- more than 90 daysTotal finance leases
Balance at the beginning of the yearNet chargeWrite-offsBalance at the end of the year
Gross loansAMD’000
Gross loansAMD’000
2017AMD’000
1,194,99286,6016,374
471,5031,759,470
2,037,21124,88139,624
2,101,716
61,694232,973(5,221)
289,446
111,5831,507111
176,245289,446
30,128409
31,15761,694
42,00930,875
(11,190)61,694
1,083,40985,0946,263
295,2581,470,024
2,007,08324,4728,467
2,040,022
9.34%1.74%1.74%37.38%16.45%
1.48%1.64%78.63%2.94%
Impairment allowanceAMD’000
Impairment allowanceAMD’000
2016AMD’000
Net loansAMD’000
Net loansAMD’000
Impairment allowance to gross loans
%
Impairment allowance to gross loans
%
FINANCIAL STATEMENTS
(ii) Concentration of receivables from finance leases
As at 31 December 2017 the Bank has no customers whose balances exceed 10% of the Bank’s equity (2016: nil).
(iii) Finance lease maturitiesThe maturity of the Bank’s finance lease portfolio is presented in Note 32 (d), which shows the remaining period from the reporting date to the contractual maturity of the receivables from finance leases.
(iv) Geographical analysis of the finance lease portfolio
The majority of finance leases are with customers located within the Republic of Armenia.
(v) Analysis of collateralReceivables from finance lease are secured by real estate, equipment and vehicles.
(d) Receivables from factoring
As at 31 December 2017 the Bank has no customers whose balances exceed 10% of the Bank’s equity (2016: nil).
Movements in impairment allowance for the year 2017 and 2016 are as follows:
Receivables from factoringImpairment allowance
Balance at the beginning of the yearNet chargeWrite-offsBalance at the end of the year
2017AMD’000
2017AMD’000
6,752,241(13,504)
6,738,737
8,3825,122
−13,504
4,191,244(8,382)
4,182,862
10,918716
(3,252)8,382
2016AMD’000
2016AMD’000
TOPTOPCONTENTS CONTENTS

170 171
FINANCIAL STATEMENTS
(i) Quality analysis of factoring As at 31 December 2017 the Bank does not have any impaired or overdue amounts receivable from factoring.
(ii) Factoring maturitiesThe maturity of the factoring is presented in Note 32 (d), which shows the remaining period from the reporting date to the contractual maturity of the receivables from factoring.
(iii) Analysis of collateral Receivables from factoring are secured by real estate, equipment and vehicles.
22. Held-to-maturity investments
Held by the BankDebt and other fixed-income instruments - Government bondsGovernment bonds of the Republic of ArmeniaGovernment Eurobonds of the Republic of ArmeniaGovernment securities of other countries
- Corporate bondsCorporate bonds of foreign companiesCorporate bonds of Armenian companies
Pledged under sale and repurchase agreements- Government Eurobonds of the Republic of Armenia
2017AMD’000
30,734,6712,520,0283,881,887
−200,953
37,337,539
5,968,3055,968,305
28,194,9026,967,102
−
803,989289,649
36,255,642
−−
2016AMD’000
FINANCIAL STATEMENTS
23. Property, equipment and intangible assets
CostBalance at 1 January 2017AdditionsDisposals/write-offsBalance at 31 December 2017 Depreciation and amortization Balance at 1 January 2017Depreciation and amortization for the yearDisposals/write-offsBalance at 31 December 2017
Carrying amountAt 31 December 2017
Leasehold improvement
Fixtures and fittings
Intangible assetsAMD’000
1,676,9651,705,434
−3,382,399
917,206217,725
−1,134,931
2,247,468
609,279978,598(49,723)
1,538,154
404,94740,589
(48,241)397,295
1,140,859
2,068,706409,327
−2,478,033
761,254265,156
−1,026,410
1,451,623
3,300,1131,252,164(44,547)
4,507,730
2,076,344319,512(44,025)
2,351,831
2,155,899
256,02639
(50,554)205,511
100,10024,861
(50,517)74,444
131,067
7,911,0894,345,562(144,824)
12,111,827
4,259,851867,843
(142,783)4,984,911
7,126,916
Computers and communication
equipmentMotor
vehicles Total
TOPTOPCONTENTS CONTENTS

172 173
FINANCIAL STATEMENTS
CostBalance at 1 January 2016AdditionsDisposals/write-offsBalance at 31 December 2016 Depreciation and amortization Balance at 1 January 2016Depreciation and amortization for the yearDisposals/write-offsBalance at 31 December 2016
Carrying amountAt 31 December 2016
Leasehold improvement
Fixtures and fittings
Intangible assetsAMD’000
1,668,483142,492
(134,009)1,676,966
772,770173,058(28,622)917,206
759,760
578,90382,686
(52,310)609,279
382,17262,346
(39,570)404,948
204,331
1,568,589500,117
−2,068,706
527,461233,792
−761,253
1,307,453
2,962,100498,347
(160,334)3,300,113
1,920,098294,372
(138,126)2,076,344
1,223,769
180,789150,723(75,486)256,026
160,66014,926
(75,486)100,100
155,926
6,958,8641,374,365(422,139)
7,911,090
3,763,161778,494
(281,804)4,259,851
3,651,239
Computers and communication
equipmentMotor
vehicles Total
FINANCIAL STATEMENTS
24. Other assets
Movements in the impairment allowance for other non-financial assets for the years ended 31 December 2017 and 2016 are as follows:
Receivables from unsettled transactionsRestricted accounts with clearing housesBrokerage accountsTotal other financial assets
Prepayments to suppliers Repossessed assets Standard bullions of precious metalsOther tax assetsInventoriesOther Impairment allowanceTotal other non-financial assetsTotal other assets
Balance at the beginning of the yearNet chargeWrite-offsBalance at the end of the year
2017AMD’000
2017AMD’000
1,100,692351,16156,458
1,508,311
2,162,9581,479,534532,675448,724126,681524,894
(126,215)5,149,2516,657,562
89,162122,938(85,885)126,215
396,889345,624115,385857,898
479,6861,118,947351,233
‒55,05123,045
(89,162)1,938,8002,796,698
65,52237,953
(14,313)89,162
2016AMD’000
2016AMD’000
TOPTOPCONTENTS CONTENTS

174 175
FINANCIAL STATEMENTS25. Deposits and balances from banks
26. Amounts payable under repurchase agreements
Short term loans and term deposits Loans from CBA (through international programs)Liabilities for letters of creditLong term loans and term deposits from commercial banksVostro accounts
Amounts due to the banks
2017AMD’000
2017AMD’000
24,360,5937,389,3096,012,3071,924,673317,119
40,004,001
6,121,6936,121,693
1,637,3348,032,1918,664,32153,267,356
233,68071,834,882
−−
2016AMD’000
2016AMD’000
According to the agreement the CBA provides loans to the Bank, which in turn grants loans to qualifying borrowers. The monitoring and administration of the loans is performed by the “Directing Office of the “German Armenian Foundation” program”.
As at 31 December 2017 the Bank has no banks (2016: two banks), whose balances exceed 10% of equity.
The Bank has transactions to lend securities and to sell securities under agreements to repurchase and to purchase securities under agreements to resell. The securities lent or sold under agreements to repurchase are transferred to a third party and the Bank receives cash in exchange. These financial assets may be re-pledged or resold by counterparties in the absence of default by the Bank, but the counterparty has an obligation to return the securities at the maturity of the contract. The cash received is recognized as a financial asset and a financial liability is recognized for the obligation to repay the purchase price for this collateral.
These transactions are conducted under terms that are usual and customary to standard lending, and securities borrowing and lending activities.
Transferred financial assets and assets held or pledged as collateral
Transferred financial assets that are not derecognized in their entirety
As at 31 December 2017 transferred financial assets that are not derecognized in their entirety by the Bank (there are no such assets as at 31 December 2016) are represented by Eurobonds of the Government of Republic of Armenia with fair value of AMD 6,323,772 thousands which were pledged for the payables under repurchase agreements with carrying value AMD 6,121,693 thousands. This transfer does not qualify for derecognition criteria.
FINANCIAL STATEMENTS27. Current accounts and deposits from customers
28. Debt securities issued
Current accounts and demand deposits- Individuals- Legal entities
Term deposits- Individuals- Legal entities
Promissory NotesDomestic bonds issued
2017AMD’000
2017AMD’000
47,010,214113,246,453
133,849,82081,064,292
375,170,779
9,711,29531,221,30040,932,595
32,809,388155,773,778
121,592,267104,433,253414,608,686
9,703,1388,421,362
18,124,500
2016AMD’000
2016AMD’000
As at 31 December 2017, the Bank maintained customer current accounts and deposit balances of AMD 34,222,057 thousand (2016: AMD 145,465,084 thousand) that serve as collateral for loans and credit related commitments granted by the Bank.
As at 31 December 2017, the Bank has two customers (31 December 2016: eight customers) whose balances exceed 10% of equity. The gross value of these balances as 31 December 2017 is AMD 44,219,735 thousand (31 December 2016: AMD 127,255,616 thousand).
In 2016 Bank placed USD denominated promissory Notes with four Luxembourg-based funds via its investment manager ResponsAbility Investments AG in amount of USD 20,000,000 with maturity in 2021. As at 31 December 2017 carrying value of the promissory Notes is AMD 9,711,295 thousand.
As at December 2017 the Bank has issued and placed debt securities denominated in AMD, USD and EUR with nominal amount of AMD 2,500,000 thousand, USD 55 million and EUR 3 million respectively. As at December 2017 carrying value of the bonds is AMD 2,581,582 thousand, AMD 26,886,359 thousand and AMD 1,753,359 thousand accordingly.
Bonds issued by the Bank are listed in Nasdaq OMX Armenia stock exchange.
TOPTOPCONTENTS CONTENTS

176 177
FINANCIAL STATEMENTS
29. Other borrowed funds and subordinated borrowings
Borrowings from international and other financial institutionsBorrowings from the Government of Armenia
Subordinated borrowings
2017AMD’000
98,128,094‒
98,128,09440,919,768
102,303,900431,139
102,735,03940,811,255
2016AMD’000
(a) Concentration of borrowings from international financial institutions
As at 31 December 2017, the Bank has loans from six financial institutions (31 December 2016: six), whose balances exceed 10% of equity. These balances as at 31 December 2017 are AMD 66,673,975 thousand (31 December 2016: AMD 91,891,017 thousand).
(b) Borrowings from the Government of Armenia
The borrowings from the Government of Armenia include amounts lent from Government of Armenia (CBA is acting as the agent of the Government of Armenia). According to the agreement the borrowings are granted to the Bank, which in turn grants loans to qualifying borrowers. The monitoring and administration of the loans is performed by the “Directing Office of the “German Armenian Foundation” program”.
The borrowings were in AMD, bear interest rates of 7.3-7.8%, were granted for period of up to five years and are to be repaid at maturity. (c) Subordinated borrowing
As at 31 December 2017 subordinated borrowing represents:• Borrowing received from the ultimate controlling party (AMD 5,928,587 thousand) maturing on 11 January 2021.• Borrowing received from an international financial institution (AMD 25,079,819 thousand) maturing on 11 January 2022.• Borrowing received from other financial institution (AMD 9,911,362 thousand) maturing on 23 September 2020.
In case of bankruptcy, the repayment of the subordinated borrowing will be made after repayment in full of all other liabilities of the Bank.
(d) Covenants
The Bank is required to meet certain covenants in connection with borrowing agreements. The Bank was in compliance with all covenants as of 31 December 2017.
FINANCIAL STATEMENTS
30. Other liabilities
Payables to staff Other payablesOther financial liabilitiesTotal other financial liabilities
Deferred incomeOther taxes payableTotal other non-financial liabilities
Total other liabilities
2017AMD’000
2,173,129682,810974,958
3,830,897
10,470264
10,734
3,841,631
1,725,164505,115543,468
2,773,747
10,13689,25599,391
2,873,138
2016AMD’000
TOPTOPCONTENTS CONTENTS

178 179
FINANCIAL STATEMENTS
31. Share capital and treasury shares
(a) Issued capital and share premium
As at 31 December 2017 the authorized, issued and outstanding share capital comprises 100,273 ordinary shares (2016: 100,273). All shares have a nominal value of AMD 320 thousand and are fully paid.
The shareholders of the Bank as at 31 December 2017 are Ameria Group (CY) (65.8%), EBRD (20.7%) and ESPS Holding Limited (13.5%).
On 14 February 2018 Asian Development Bank purchased in full additionally issued 16,291 shares of the Bank for AMD 14,426,665 thousand.
The shareholders of the Bank as at the date of issue of these financial statements are Ameria Group (CY) (56.60%), EBRD (17.80%), ESPS Holding Limited (11.62%) and ADB (13.98%).
The holders of ordinary shares are entitled to receive dividends as declared from time to time and are entitled to one vote per share at annual and general meetings of the Bank.
(b) Nature and purpose of reserves
Revaluation reserve for available-for-sale financial assets
The revaluation reserve for available-for-sale financial assets comprises the cumulative net change in the fair value, until the assets are derecognized or impaired.
(c) Dividends
Dividends payable are restricted to the maximum retained earnings of the Bank, which are determined according to legislation of the Republic of Armenia.
Dividends declared and paid by the Bank in 2017 amounted to AMD 2,176,201 thousand (2016: AMD 1,685,286 thousand). As of the date of the declaration and payment of dividends, dividends per share amounted to AMD 21,703 (2016: AMD 16,807).
32. Risk management Management of risk is fundamental to the business of banking and is an essential element of the Bank’s operations. The major risks faced by the Bank are those related to market risk, credit risk and liquidity risk.
(a) Risk management policies and procedures
The risk management policies aim to identify, analyse and manage the risks faced by the Bank, to set appropriate risk limits and controls, and to continuously monitor risk levels and adherence to limits. Risk management policies and procedures are reviewed regularly to reflect changes in market conditions, products and services offered and emerging best practice.
The Management Board has overall responsibility for the oversight of the risk management framework, overseeing the management of key risks and reviewing its risk management policies and procedures as well as approving significantly large exposures.
The Risk Management Center is responsible for monitoring and implementation of risk mitigation measures and making sure that the Bank operates within the established risk parameters. The Head of the Risk Management Center is responsible for the overall risk management, ensuring the implementation of common principles and methods for identifying, measuring, managing and reporting both financial and non-financial risks. He reports directly to the Management Board and indirectly to
FINANCIAL STATEMENTS
the Board of Directors.
Credit, market and liquidity risks both at the portfolio and transactional levels are managed and controlled through a system of Credit Committees and an Asset and Liability Management Committee (ALCO). In order to facilitate efficient and effective decision-making, the Bank has established a hierarchy of credit committees depending on the type and amount of the exposure.
Both external and internal risk factors are identified and managed throughout the organisation. Particular attention is given to identifying the full range of risk factors and determination of the level of assurance over the current risk mitigation procedures. Apart from the standard credit and market risk analysis, the Risk Management Center monitors financial and non-financial risks by holding regular meetings with operational units in order to obtain expert judgments in their areas of expertise.
(b) Market risk
Market risk is the risk that the fair value or future cash flows of a financial instrument will fluctuate because of changes in market prices. Market risk comprises currency risk, interest rate risk and other price risks. Market risk arises from open positions in interest rate and equity financial instruments, which are exposed to general and specific market movements and changes in the level of volatility of market prices and foreign currency rates.
The objective of market risk management is to manage and control market risk exposures within acceptable parameters, whilst optimizing the return on risk.
Overall authority for market risk is vested in the ALCO, which is chaired by the General Director. Market risk limits are approved by the Management Board based on recommendations of the Risk Management Center.
The Bank manages its market risk by setting open position limits in relation to financial instruments, interest rate maturity and currency positions. These are monitored on a regular basis and reviewed and approved by the Management Board.
In addition, the Bank uses a wide range of stress tests to model the financial impact of a variety of exceptional market scenarios on individual trading portfolios and the Bank’s overall position. Stress tests provide an indication of the potential size of losses that could arise in extreme conditions.
(i) Interest rate risk
Interest rate risk is the risk that the fair value or future cash flows of a financial instrument will fluctuate because of changes in market interest rates. The Bank is exposed to the effects of fluctuations in the prevailing levels of market interest rates on its financial position and cash flows. Interest margins may increase as a result of such changes but may also reduce or create losses in the event that unexpected
movements occur.
Interest rate gap analysis
Interest rate risk is managed principally through monitoring interest rate gaps and by having pre-approved limits for repricing bands. ALCO is the monitoring body for compliance with these limits and is assisted by Asset and Liabilites Department in its day-to-day monitoring activities. A summary of the interest gap position for major financial instruments is set out below. Floating rate instruments are grouped in accordance with their repricing dates.
TOPTOPCONTENTS CONTENTS

180 181
FINANCIAL STATEMENTS
31 December 2017AssetsCash and cash equivalentsAvailable-for-sale financial assetsLoans and advances to banksAmounts receivable under reverse repurchase agreementsLoans to legal entities and individualsReceivables from letters of creditReceivables from finance leasesReceivables from factoringHeld-to-maturity investments LiabilitiesDeposits and balances from banksAmounts payable under repurchase agreementsCurrent accounts and deposits from customersDebt securities issuedSubordinated borrowings Other borrowed funds Effect of derivativesNet position
Less than3 months
6-12months
More than5 yearsAMD’000
−71,032
8,739,6988,675,394
45,210,195538,87780,569
5,112,3543,976,655
72,404,774
(11,315,455)(6,121,693)
(49,540,771)(10,044,318)(34,991,181)(51,515,318)
(163,528,736)4,565,943
(86,558,019)
−227,212194,200
−42,751,699
54,827148,088
−−
43,376,026
(9,743,119)−
(72,872,974)(9,768,608)
−(2,719)
(92,387,420)(1,045,216)
(50,056,610)
−3,918,271
−−
73,670,449−
499,991−
2,266,98280,355,693
(1,099,984)−
(73,308)−−
(31,069)(1,204,361)
−79,151,332
−11,1483,003
−26,637,8442,677,960
82,5471,626,3836,283,038
37,321,923
(10,279,331)−
(33,847,623)−−
(46,549,396)(90,676,350)
−(53,354,427)
−5,553,955419,556
−269,762,881
849,825363,572
−30,779,169
307,728,958
(7,566,112)−
(58,579,433)(21,119,669)(5,928,587)
(29,592)(93,223,393)
(3,520,727)210,984,838
107,616,368106,460
1,486,433−
9,277,663−
295,257−−
118,782,181
−−
(160,256,670)−−−
(160,256,670)−
(41,474,489)
107,616,3689,888,07810,842,8908,675,394
467,310,7314,121,4891,470,0246,738,73743,305,844
659,969,555
(40,004,001)(6,121,693)
(375,170,779)(40,932,595)(40,919,768)(98,128,094)
(601,276,930)−
58,692,625
3-6 months
1-5 years
Non-interest bearing or overdue
Carrying amount
FINANCIAL STATEMENTS
31 December 2016AssetsCash and cash equivalentsAvailable-for-sale financial assetsLoans and advances to banksAmounts receivable under reverse repurchase agreementsLoans to legal entities and individualsReceivables from letters of creditReceivables from finance leasesReceivables from factoringHeld-to-maturity investments LiabilitiesDeposits and balances from banksCurrent accounts and deposits from customersDebt securities issuedSubordinated borrowings Other borrowed funds Effect of derivativesNet position
Average effective interest rates
The table below displays average interest rates for interest earning assets and interest bearing liabilities as at 31 December 2017 and 31 December 2016.
Less than3 months
6-12months
More than5 yearsAMD’000
−3,418,1113,516,2496,446,79749,987,7192,591,904123,519
2,841,85513,258,09182,184,245
(3,724,091)(74,215,296)
(109,244)(35,010,155)(59,734,053)
(172,792,839)9,293,848
(81,314,746)
−49,967
−−
63,011,5501,640,657240,466
−675,060
65,617,700
(4,516,288)(67,043,411)
−−
(396,597)(71,956,296)
(2,364,707)(8,703,303)
−496,553
−−
65,826,585−
656,804−
142,59167,122,533
(1,830,659)(69,119)
−−
(46,146)(1,945,924)
(879,893)64,296,716
−1,542,423
−−
70,035,996749,057118,237
1,341,0078,148,865
81,935,585
(893,022)(31,244,657)
(24,650)−
(42,510,773)(74,673,102)
−7,262,483
−6,794,780
−−
239,247,1722,725,685900,996
−14,031,035
263,699,668
(60,870,822)(53,453,037)(17,990,606)(5,801,100)
(47,470)(138,163,035)
(6,049,248)119,487,385
135,280,872106,458
1,337,053−
11,179,500−−−−
147,903,883
−(188,583,166)
−−−
(188,583,166)−
(40,679,283)
135,280,87212,408,2924,853,3026,446,797
499,288,5227,707,3032,040,0224,182,86236,255,642
708,463,614
(71,834,882)(414,608,686)(18,124,500)(40,811,255)(102,735,039)
(648,114,362)−
60,349,252
3-6 months
1-5 years
Non-interest bearing or overdue
Carrying amount
TOPTOPCONTENTS CONTENTS

182 183
FINANCIAL STATEMENTS
Interest rate risk
Interest rate risk arises from the possibility that changes in interest rates will affect future cash flows or the fair values of financial instruments. The following table demonstrates the sensitivity to a reasonable possible change in interest rates, with all other variables held constant, of the Bank’s statement of profit or loss.
The sensitivity of the statement of profit or loss is the effect of the assumed changes in interest rates on the net interest income for one year, based on the floating rate non-trading financial assets and financial liabilities held at 31 December. The sensitivity of equity is calculated by revaluing fixed rate available-for-sale financial assets at 31 December for the effects of the assumed changes in interest rates based on the assumption that there are parallel shifts in the yield curve.
Interest earning assetsAvailable-for-sale financial assets Loans and advances to banksAmounts receivable under reverse repurchase agreementsLoans and advances to customersReceivables from finance leasesReceivables from factoringHeld-to-maturity investments Interest bearing liabilitiesDeposits and balances from banks Amounts payable under repurchase agreementsCurrent accounts and deposits from customers- Term depositsDebt securities issuedSubordinated borrowingsOther borrowed funds
USD AMDAMD’000
3.8%2.8%2.8%9.0%8.1%9.3%4.1%
2.4%1.5%
4.6%5.8%8.5%6.1%
13.27%6.15%6.88%12.14%14.74%15.55%8.63%
9.69%−
12.11%10.75%
−9.04%
11.7%12.1%6.4%
13.6%14.5%14.4%9.6%
6.2%−
11.3%10.0%
−8.9%
−−−
7.42%12.0%14.0%
−
1.0%−
3.1%3.3%
−−
1.86%−
3.50%8.19%8.80%10.80%5.04%
2.71%−
5.80%5.56%8.11%6.57%
−−−
9.95%12.00%
−−
0.89%−
5.89%−−−
AMD
2017Average interest rate, %
2016Average interest rate, %
Other currencies USD
Other currencies
FINANCIAL STATEMENTS
AMDUSD
AMDUSD
AMDUSD
AMDUSD
Sensitivity of net interest income
2017 AMD’000
Sensitivity of net interest income
2016 AMD’000
Sensitivity of net interest income
2017 AMD’000
Sensitivity of net interest income
2016 AMD’000
Currency
Currency
Currency
Currency
(27,133)(182,011)
(226,335)(135,074)
59,35492,938
226,335135,074
1.60%1.30%
3.70%1.00%
3.50%0.50%
3.70%1.00%
(352,276)(173,767)
(517,173)(34,336)
770,60466,833
517,17334,336
Increase in basis points
2017
Increase in basis points
2016
Decrease in basis points
2017
Decrease in basis points
2016
Sensitivity of equity and other comprehensive income
2017 AMD’000
Sensitivity of equity and other comprehensive income
2016 AMD’000
Sensitivity of equity and other comprehensive income
2017 AMD’000
Sensitivity of equity and other comprehensive income
2016 AMD’000
Currency risk
The Bank has assets and liabilities denominated in several foreign currencies.
Currency risk is the risk that the fair value or future cash flows of a financial instrument will fluctuate because of changes in foreign currency exchange rates.
TOPTOPCONTENTS CONTENTS

184 185
FINANCIAL STATEMENTS
The following table shows the foreign currency exposure structure of financial assets and liabilities as at 31 December 2017.
AssetsCash and cash equivalentsFinancial instruments at fair value through profit or lossAvailable-for-sale financial assetsLoans and advances to banksAmounts receivable under reverse repurchase agreementsLoans to legal entiites and individualsReceivables from letters of creditReceivables from finance leasesReceivables from factoringHeld-to-maturity investmentsOther assetsTotal assets LiabilitiesDeposits and balances from banks Amounts receivable under reverse repurchase agreementsCurrent accounts and deposits from customersDebt securities issuedSubordinated borrowingsOther borrowed fundsOther liabilitiesTotal liabilitiesNet positionEffect of derivativesNet position
EURAMD’000
TotalAMD’000AMD’000
5,331,961176,446
−174,030
−36,265,5421,003,297183,331
−−
198,30543,332,912
5,976,771−
26,725,0251,753,359
−−
145,80734,600,9628,731,950(8,701,500)
30,450
4,107,302−−
11,240−
3,921,191−−
707,154−
588,8289,335,715
53,642−
6,629,080−−−
76,9516,759,6732,576,042(2,043,075)532,967
25,075,5561,155,3344,525,7469,149,220852,065
350,982,3313,126,4511,366,9185,403,801
12,370,2201,530,736
415,538,378
24,179,4596,121,693
226,317,57736,597,65440,919,76888,171,140
573,228422,880,519(7,342,141)11,962,3844,620,243
34,514,8191,331,7804,525,7469,334,490852,065
391,169,0644,129,7481,550,2496,110,955
12,370,2202,317,869
468,207,005
30,209,8726,121,693
259,671,68238,351,01340,919,76888,171,140
795,986464,241,1543,965,8511,217,8095,183,660
USDAMD’000
Other currenciesAMD’000
FINANCIAL STATEMENTS
The following table shows the foreign currency exposure structure of financial assets and liabilities as at 31 December 2016:
AssetsCash and cash equivalentsAvailable-for-sale financial assetsLoans and advances to banksAmounts receivable under reverse repurchase agreementsLoans to legal entiites and individualsReceivables from letters of creditReceivables from finance leasesReceivables from factoringHeld-to-maturity investmentsOther assetsTotal assets LiabilitiesDeposits and balances from banks Current accounts and deposits from customersDebt securities issuedSubordinated borrowingsOther borrowed fundsOther liabilitiesTotal liabilitiesNet positionEffect of derivativesNet position
EURAMD’000
TotalAMD’000AMD’000
16,343,707−
2,197,338−
14,339,3512,711,546226,224
−−
26,64835,844,814
2,725,67833,005,620
−−−
113,42235,844,720
94−94
1,286,790−
62,810−
13,550−−−−
381,7701,744,920
174,6522,533,880
−−−
7,1922,715,724(970,804)1,377,911407,107
60,519,8675,046,032183,897
1,196,793360,368,5454,995,7591,585,3553,927,9657,771,091722,995
446,318,299
9,911,600278,789,51517,106,59640,811,25588,947,284
436,779436,003,02910,315,270
(404,937)9,910,333
78,150,3645,046,0322,444,0451,196,793
374,721,4467,707,3051,811,5793,927,9657,771,0911,131,413
483,908,033
12,811,930314,329,01517,106,59640,811,25588,947,284
557,393474,563,473
9,344,560972,974
10,317,534
USDAMD’000
Other currenciesAMD’000
TOPTOPCONTENTS CONTENTS

186 187
A strengthening of the AMD, as indicated below, against the following currencies at 31 December 2017 and 31 December 2016 would have increased/(decreased) equity and profit or loss by the amounts shown below (due to the fair value of currency sensitive monetary assets and liabilities). This
analysis is on net of tax basis and is based on foreign currency exchange rate variances that the Bank considered to be reasonably possible at the end of the reporting period. The analysis assumes that all
other variables, in particular interest rates, remain constant.
A weakening of the AMD against the above currencies at 31 December 2017 and 2016 would have had the equal but opposite effect on the above currencies to the amounts shown above, on the basis that all other variables remain constant.
(c) Credit risk
Credit risk is the risk of financial loss to the Bank if a customer or counterparty to a financial instrument fails to meet its contractual obligations. The Bank has policies and procedures for the management of credit exposures (both for recognised financial assets and
unrecognised contractual commitments), including guidelines to limit portfolio concentration and the establishment of a Credit Committee and Risk Management Center, which actively monitor credit risk. The credit policy is reviewed and approved by the Management Board.
The credit policy establishes:► Procedures for review and approval of loan credit
applications;► Methodology for the credit assessment of borrowers
(legal entities and in dividuals);► Methodology for the evaluation of collateral;
► Credit documentation requirements;► Procedures for the ongoing control and monitoring
of loans and other credit exposures.
Legal entity loan credit applications are originated by the relevant client managers and are then passed on to the Loan Department, which is responsible for the loan portfolio of legal entities. Analysis reports are based on a structured analysis focusing on the customer’s business and financial performance. The loan credit application and the report are then independently reviewed by the Risk Management Center and a second opinion is given accompanied
FINANCIAL STATEMENTS
AMD against USDAMD against EUR
AMD against USDAMD against EUR
Profit or lossAMD’000
Profit or lossAMD’000
2017
2016
2017
2016
(161,709)(4,172)
(594,620)(10)
3.50%13.70%
6.00%11.00%
3.50%6.30%
6.00%11.00%
161,7091,918
594,62010
Appreciation
Appreciation
Depreciation
Depreciation
Profit or lossAMD’000
Profit or lossAMD’000
by a verification that credit policy requirements are met. The Credit Committee reviews the loan credit application on the basis of submissions by the Loan Department. Individual transactions are also reviewed by the Legal department depending on the specific risks and pending final approval of the Credit Committee.
The Bank continuously monitors the performance of individual credit exposures and regularly reassesses the creditworthiness of its customers. The review is based on the customer’s most recent financial statements and other information submitted by the borrower, or otherwise obtained by the Bank. Loans to individuals credit applications are reviewed by the Retail Lending Subdivisions.
Apart from individual customer analysis, the credit portfolio is assessed by the Risk Management Center with regard to credit concentration and market risks.
The maximum exposure to credit risk is generally reflected in the carrying amounts of financial assets on the statement of financial position and unrecognised contractual commitment amounts. The impact of possible netting of assets and liabilities to reduce potential credit exposure is not significant.
Collateral generally is not held against claims under derivative financial instruments, investments in securities, and loans and advances to banks, except when securities are held as part of reverse repurchase and securities borrowing activities.
For the analysis of collateral held against loans and
advances to customers and concentration of credit risk in respect of loans and advances to customers refer to Note 21.
The maximum exposure to credit risk from unrecognised contractual commitments at the reporting date is presented in Note 34.
Offsetting financial assets and financial liabilities
The disclosures set out in the tables below include financial assets and financial liabilities that:► Are offset in the Bank’s statement of financial
position; or► Are subject to an enforceable master netting
arrangement or similar agreement that covers similar financial instruments, irrespective of whether they are offset in the statement of financial position.
The similar agreements include derivative clearing agreements, global master repurchase agreements, and global master securities lending agreements. Similar financial instruments include derivatives, sales and repurchase agreements, reverse sale and repurchase agreements and securities borrowing and lending agreements. Financial instruments such as loans and deposits are not disclosed in the table below unless they are offset in the statement of financial position.
The Bank receives and accepts collateral in the form of marketable securities in respect of sale and repurchase, and reverse sale and repurchase agreements.
Such collateral is subject to the standard industry terms. This means that securities received/given as collateral can be pledged or sold during the term of the transaction but must be returned on maturity of the transaction. The terms also give each counterparty the right to terminate the related transitions upon the counterparty’s failure to post collateral.
The above arrangements do not meet the criteria for offsetting in the statement of financial position. This is because they create a right of set-off of recognized amounts that is enforceable only following an event of default, insolvency or bankruptcy of the Bank or the counterparties. In addition the Bank and its counterparties do not intend to settle on a net basis or to realize the assets and settle the liabilities simultaneously.
FINANCIAL STATEMENTS
TOPTOPCONTENTS CONTENTS

188 189
FINANCIAL STATEMENTS
Amounts receivable under reverse repurchase agreementsTotal financial assets Amounts payable under repurchase agreementsTotal financial liabilities
Amounts receivable under reverse repurchase agreementsTotal financial assets Amounts payable under repurchase agreementsTotal financial liabilities
Gross amount of recognized
financial liability/asset offset in
the statement of financial position
Gross amount of recognized
financial liability/asset offset in
the statement of financial position
Financial instruments
Financial instruments
Related amounts not offset in the
statement of financial position
Related amounts not offset in the
statement of financial position
Net amount
Net amount
Types of financial assets/liabilities AMD’000
Types of financial assets/liabilities AMD’000
−−
−−
−−
−−
8,675,3948,675,394
(6,121,693)(6,121,693)
6,446,7976,446,797
−−
8,675,3948,675,394
(6,121,693)(6,121,693)
6,446,7976,446,797
−−
(8,675,394)(8,675,394)
5,968,3055,968,305
(6,446,797)(6,446,797)
5,968,3055,968,305
−−
(153,388)(153,388)
−−
−−
Gross amounts of recognized
financial asset/liability
Gross amounts of recognized
financial asset/liability
Net amount of financial
assets/liabilities presented in the
statement of financial position
Net amount of financial
assets/liabilities presented in the
statement of financial position
The table below shows financial assets and financial liabilities subject to offsetting, enforceable master netting arrangements and similar arrangements as at 31 December 2016:
The table below shows financial assets and financial liabilities subject to offsetting, enforceable master netting arrangements and similar arrangements as at 31 December 2017:
The gross amounts of financial assets and financial liabilities and their net amounts as presented in the statement of financial position that are disclosed in the above tables are measured in the statement of financial position on the amortized cost basis.
FINANCIAL STATEMENTS
(d) Liquidity risk
Liquidity risk is the risk that the Bank may encounter difficulty in meeting obligations associated with its financial liabilities that are settled by delivering cash or another financial asset. Liquidity risk exists when the maturities of assets and liabilities do not match. The matching and or controlled mismatching of the maturities and interest rates of assets and liabilities is fundamental to liquidity management. It is unusual for financial institutions ever to be completely matched since business transacted is often of an uncertain term and of different types. An unmatched position potentially enhances profitability, but can also increase the liquidty risk.
The Bank maintains liquidity management with the objective of ensuring that funds will be available at all times to honor all cash flow obligations as they become due. The liquidity policy is reviewed and approved by the Board of Directors. The Bank seeks to actively support a diversified and stable funding base comprising long-term and short-term loans from other banks and international financial organisations, core corporate and retail customer deposits, accompanied by diversified portfolios of highly liquid assets, in order to be able to respond quickly and smoothly to unforeseen liquidity requirements.
The liquidity management policy requires:► Projecting cash flows by major currencies and
considering the level of liquid assets necessary in relation thereto;
► Maintaining a diverse range of funding sources;► Managing the concentration and profile of debts;► Maintaining debt financing plans;
► Maintaining a portfolio of highly marketable assets that can easily be liquidated as protection against any interruption to cash flow;
► Maintaining liquidity and funding contingency plans;
► Monitoring liquidity ratios against regulatory requirements.
The Assets and Liabilities Department receives information from structural subdivisions regarding the liquidity profile of their financial assets and liabilities and details of other projected cash flows arising from projected future business. The Assets and Liabilities Department then provides for an adequate portfolio of short-term liquid assets to be maintained, largely made up of short-term liquid trading securities, loans and advances to banks and other inter-bank facilities, to ensure that sufficient liquidity is maintained.
The daily liquidity position is monitored and regular liquidity stress testing under a variety of scenarios covering both normal and more severe market conditions is performed by the Assets and Liabilities Department. Under the normal market conditions, liquidity reports covering the liquidity position are presented to senior management on a weekly basis. Decisions on liquidity management are made by ALCO and implemented by the Assets and Liabilities Department.
The tables below summarize the maturity profile of the Bank’s financial liabilities at 31 December based on contractual undiscounted repayment obligations except for gross settled derivatives which are shown by contractual maturity. Repayments which are
subject to notice are treated as if notice were to be given immediately, except current accounts and on demand deposits from customers which are stated at expected maturities. However, the Bank expects that many customers will not request repayment on the earliest date the Bank could be required to pay and the table does not reflect the expected cash flows indicated by the Bank’s deposit retention history.The maturity analysis for financial liabilities as at 31 December 2017 is as follows:
TOPTOPCONTENTS CONTENTS

190 191
FINANCIAL STATEMENTS
Non-derivative liabilitiesDeposits and balances from banks Amounts payable under repurchase agreementsCurrent accounts and deposits from customersDebt securities issuedSubordinated borrowingsOther borrowed fundsOther financial liabilitiesNet settled derivative liabilities Gross settled derivative financial instruments - Contractual amounts payable - Contractual amounts receivableTotal financial liabilities Credit related commitments
Demandand less than
1 monthFrom 3 to 6 months
From 1 to 5 yearsAMD’000
10,905,3606,121,693
76,528,416396,789
1,341,7591,696,247967,73974,877
−−
98,032,880
42,899,097
10,493,349−
69,099,404599,124839,812
3,953,7242,751,256
−
−−
87,736,669
−
677,271−
57,389,681557,928955,617
9,992,480111,902
−
(54,473,593)54,480,97069,692,256
−
10,083,331−
76,715,03710,660,8721,679,624
24,794,550−−
−−
123,933,414
−
9,401,436−
109,446,14432,697,23948,369,13570,892,191
−−
−−
270,806,145
−
1,515,481−
91,239−−
6,853,935−−
−−
8,460,655
−
43,076,2286,121,693
389,269,92144,911,95253,185,947
118,183,1273,830,897
74,877
(54,473,593)54,480,970
658,662,019
42,899,097
40,004,0016,121,693
375,170,77940,932,59540,919,76898,128,0943,830,897
74,877
(611,429)484,540
605,055,815
42,899,097
From 1 to 3 months
From 6 to 12 months
More than 5 years
Total grossamount(inflow) outflow
Carryingamount
FINANCIAL STATEMENTS
Non-derivative liabilitiesDeposits and balances from banks Current accounts and deposits from customersDebt securities issuedSubordinated borrowingsOther borrowed fundsOther financial liabilitiesNet settled derivative liabilities Gross settled derivative financial instruments - Contractual amounts payable - Contractual amounts receivableTotal financial liabilities Credit related commitments
Demandand less than
1 monthFrom 3 to 6 months
From 1 to 5 yearsAMD’000
2,100,331177,880,935
145,3371,287,2824,249,206545,4212,645
−−
186,211,157
43,908,219
2,407,41380,066,279
174,723804,708
5,206,3342,062,933
−
−−
90,722,390
−
3,138,97744,547,002
113,980922,310
13,524,822165,393
−
−−
62,412,484
−
7,544,03475,153,976
300,1461,609,41511,539,299
−−
(92,312,915)92,683,27596,517,230
−
73,997,83973,936,19518,698,25427,985,18191,124,295
−−
(72,559,894)72,781,457
285,963,327
−
3,755,885372,751
−28,181,38112,413,978
−−
−−
44,723,995
−
92,944,479451,957,13819,432,44060,790,277
138,057,9342,773,747
2,645
(164,872,809)165,464,732766,550,583
43,908,219
71,834,882414,608,68618,124,50040,811,255102,735,0392,773,747
2,645
(2,532,638)3,056,734
651,414,850
43,908,219
From 1 to 3 months
From 6 to 12 months
More than 5 years
Total grossamount(inflow) outflow
Carryingamount
The maturity analysis for financial liabilities as at 31 December 2016 is as follows:
Included in due to customers in the table above and in the table below are time deposits of individuals. In accordance with Armenia’s legislation, the Bank is obliged to repay time deposits of individuals upon demand of a depositor. These deposits are classified in the table above in accordance with their stated maturity dates.
TOPTOPCONTENTS CONTENTS

192 193
FINANCIAL STATEMENTS
AssetsCash and cash equivalentsFinancial instruments at fair value through profit or lossAvailable−for-sale financial assetsLoans and advances to banksAmounts receivable under reverse repurchase agreementsLoans to legal entities and individualsReceivables from letters of creditReceivables from finance leasesReceivables from factoringHeld-to-maturity investmentsProperty, equipment and intangible assets Other assets Total assets
Demandand less than
1 monthFrom 3 to12 months
More than 5 yearsAMD’000
107,616,368
116,09226,735
8,727,521
8,675,39416,472,285
63,93633,729
1,605,775250,184
−1,649,866
145,237,885
−
5,190229,570197,203
−61,554,6192,732,786230,635
1,626,3836,283,038
−3,442,533
76,301,957
−
836,77353,08712,177
−24,890,862
474,94146,840
3,506,5793,726,470
−677,400
34,225,129
−
2,598,2785,553,955419,555
−253,415,202
849,826363,572
−30,779,169
−−
293,979,557
−
411,7313,918,271
−
−101,700,101
−499,991
−2,266,983
−−
108,797,077
−
−106,460
1,486,434
−−−−−−
7,126,916887,763
9,607,573
−
−−−
−9,277,662
−295,257
−−−−
9,572,919
107,616,368
3,968,0649,888,078
10,842,890
8,675,394467,310,7314,121,4891,470,0246,738,737
43,305,8447,126,9166,657,562
677,722,097
From 1 to 3 months
From 1 to 5 years No maturity Overdue Total
The table below shows an analysis, by expected maturities, of the amounts recognised in the statement of financial position as at 31 December 2017:
FINANCIAL STATEMENTS
LiabilitiesFinancial instruments at fair value through profit or lossAmounts payable under repurchase agreementsDeposits and balances from banks Current accounts and deposits from customersDebt securities issuedSubordinated borrowingsOther borrowed fundsCurrent tax liabilityDeferred tax liabilityOther liabilitiesTotal liabilitiesNet positionCumulative net position
Demandand less than
1 monthFrom 3 to12 months
More than 5 yearsAMD’000
74,8776,121,69310,813,77375,395,507
197,0811,061,8221,176,595
−−
967,73995,809,08749,428,79849,428,798
−−
20,022,450139,347,562
9,768,530−
24,365,684990,256
−2,761,990
197,256,472 (120,954,515)(103,460,643)
611,429−
501,68255,390,566
158,512395,743
8,990,221−−
111,90266,160,055
(31,934,926)17,493,872
−−
7,566,112104,963,83730,808,47239,462,20357,684,363
−1,025,103
− 241,510,090 52,469,467
(50,991,176)
−−
1,099,98473,307
−−
5,911,231−−−
7,084,522 101,712,555 50,721,379
−−−−−−−−−− −
9,607,573
−−−−−−−−−− −
9,572,919
686,3066,121,693
40,004,001375,170,77940,932,59540,919,76898,128,094
990,2561,025,1033,841,631
607,820,22669,901,871
From 1 to 3 months
From 1 to 5 years No maturity Overdue Total
The maturity analysis in the table above does not reflect the historical stability of term deposits. Based on the analysis of past history, 45% of total time deposits maturing in 1 year or less, actually roll over at the maturity. Thereby, the real maturity of those deposits is more than 1 year. These balances are included in amounts due in the period less than 1 year in the table. Subsequent to the reporting date the Bank has attracted long-term borrowings from international financial organizations in the amount of USD 11,500 thousand (equivalent to AMD 5,567,150 thousand (converted by yearend USD/AMD rate)) and has received approval for credit facilities in the amount of USD 90,000 thousand (equivalent to AMD 43,569,000 thousand (converted by yearend USD/AMD rate)), which have not been used by the Bank yet at the date of these financial statements. In addition on 14 February 2018 the Bank attracted share caputal in the amount of AMD 14,426,665 thousand from Asian Development Bank (see note 40).
Included in due to customers in the table above and in the table below are time deposits of individuals. In accordance with Armenia’s legislation, the Bank is obliged to repay time deposits of individuals upon demand of a depositor. These deposits are classified in the table above in accordance with their stated maturity dates.
TOPTOPCONTENTS CONTENTS

194 195
FINANCIAL STATEMENTS
AssetsCash and cash equivalentsFinancial instruments at fair value through profit or lossAvailable-for-sale financial assetsLoans and advances to banksAmounts receivable under reverse repurchase agreementsLoans to legal entities and individualsReceivables from letters of creditReceivables from finance leasesReceivables from factoringHeld-to-maturity investmentsProperty, equipment and intangible assets Current tax assetOther assets Total assets
Demandand less than
1 monthFrom 3 to12 months
More than 5 yearsAMD’000
135,280,872
32,747235,398
3,516,249
6,446,79716,403,038
148,37645,415
2,244,277−−−
522,684164,875,853
−
1,635,1321,592,389
−
−125,809,682
2,389,714358,703
1,341,0078,823,925
−−
1,484,368143,434,920
−
−3,182,714
−
−28,527,0412,443,528
78,104597,578
13,258,090−−
88,85948,175,914
−
1,462,1926,794,780
−
−236,921,824
2,725,685900,996
−14,031,034
−1,321,801
−264,158,312
−
−496,553
−
−80,447,437
−656,804
−142,593
−−−
81,743,387
−
−106,458
1,337,053
−−−−−−
3,651,239−
700,7875,795,537
−
−−−
−11,179,500
−−−−−−−
11,179,500
135,280,872
3,130,07112,408,2924,853,302
6,446,797499,288,5227,707,3032,040,0224,182,862
36,255,6423,651,2391,321,8012,796,698
719,363,423
From 1 to 3 months
From 1 to 5 years No maturity Overdue Total
The table below shows an analysis, by expected maturities, of the amounts recognised in the statement of financial position as at 31 December 2016:
FINANCIAL STATEMENTS
LiabilitiesFinancial instruments at fair value through profit or lossDeposits and balances from banks Current accounts and deposits from customersDebt securities issuedSubordinated borrowingsOther borrowed fundsDeferred tax liabilityOther liabilitiesTotal liabilitiesNet positionCumulative net position
Demandand less than
1 monthFrom 3 to12 months
More than 5 yearsAMD’000
2,0811,595,259
176,449,95195,313
1,019,0463,619,303
−545,421
183,326,374(18,450,521)(18,450,521)
1,554,6435,409,310
142,918,48524,650
−11,198,771
−2,162,324
163,268,183(19,833,263)(46,797,134)
−2,128,83241,703,120
13,931385,838
12,292,150−
165,39356,689,264(8,513,350)
(26,963,871)
978,55960,870,82253,468,01117,990,60615,378,09669,423,6771,442,872
−219,552,64344,605,669(2,191,465)
−1,830,659
69,119−
24,028,2756,201,138
−−
32,129,19149,614,19647,422,731
−−−−−−−−−
5,795,537
−−−−−−−−−
11,179,500
2,535,28371,834,882
414,608,68618,124,50040,811,255
102,735,0391,442,8722,873,138
654,965,65564,397,768
From 1 to 3 months
From 1 to 5 years No maturity Overdue Total
The key measure used by the Bank for managing liquidity risk is the ratio of highly liquid assets to demand liabilities. For this purpose highly liquid assets include cash, nostro accounts, debt securities issued by the Government of Armenia, CBA and other corporate debt securities for which there is an active and liquid market, which are not pledged or the use of which is not restricted in any way. Demand liabilities include current accounts and demand deposits of customers, as well as any other liability that is payable on demand. The reported ratios of highly liquid assets to demand liabilities as at 31 December and during the reporting period are as follows:
The above ratio is also used to measure compliance with the liquidity limit established by the CBA which is set as not less than 60%.
At 31 December Average for December
101%93%
128%133%
2017AMD’000
2016AMD’000
TOPTOPCONTENTS CONTENTS

196 197
FINANCIAL STATEMENTS33. Capital management
The primary objectives of the Bank’s capital management are to ensure that the Bank complies with externally imposed capital requirements and that the Bank maintains strong credit ratings and healthy capital ratios in order to support its business and to maximize shareholders’ value.
The Bank manages its capital structure and makes adjustments to it in the light of changes in economic conditions and the risk characteristics of its activities. In order to maintain or adjust the capital structure, the Bank may adjust the amount of dividend payment to shareholders, return capital to shareholders or issue capital securities. No changes were made in the objectives, policies and processes from the previous years.
The Central Bank of Armenia sets and monitors capital requirements for the Bank.
The Bank defines as capital those items defined by statutory regulation as capital for credit institutions. Under the current capital requirements set by the Central Bank of Armenia, which are based on Basle Accord principles, banks have to maintain a ratio of capital to risk weighted assets (statutory capital ratio) above the prescribed minimum level. As at 31 December 2017 and 31 December 2016, this minimum level was 12%. The Bank is in compliance with the statutory capital ratio as at 31 December 2017 and 31 December 2016.
The following table shows the composition of the capital position calculated in accordance with the Basel Capital Accord 1988, with subsequent amendments including the amendment to incorporate market risks, as at 31 December:
Tier 1 capitalTier 2 capitalTotal capital Total risk weighted assets Total capital expressed as a percentage of risk-weighted assets (total capital ratio)
68,632,98026,738,05595,371,035
534,420,563
17.85%
63,227,71531,613,85894,841,573
463,628,657
20.46%
2017AMD’000
2016AMD’000
The risk-weighted assets are measured by means of a hierarchy of risk weights classified according to the nature and reflecting an estimate of credit, market and other risks associated with each asset and counterparty, taking into account any eligible collateral or guarantees. A similar treatment is adopted for unrecognised contractual commitments, with some adjustments to reflect the more contingent nature of the potential losses.
FINANCIAL STATEMENTS
Contracted amountLoan and credit line commitmentsCredit card commitmentsGuarantees and letters of creditUndrawn overdraft facilities
Less than 1 yearBetween 1 and 5 yearsMore than 5 years
19,807,8759,245,9798,183,6585,661,585
42,899,097
1,419,525 1,285,131361,451
3,066,107
21,416,0787,976,3149,740,1644,775,663
43,908,219
1,952,0909,490,8606,676,219
18,119,169
2017AMD’000
2017AMD’000
2016AMD’000
2016AMD’000
34. Commitments
The Bank has outstanding credit related commitments to extend loans. These credit realted commitments take the form of approved loans and credit card limits and overdraft facilities.
The Bank provides financial guarantees and letters of credit to guarantee the performance of customers to third parties. These agreements have fixed limits and generally extend for a period of up to five years. The Bank also provides guarantees by acting as settlement agent in securities borrowing and lending transactions.
The Bank applies the same credit risk management policies and procedures when granting credit commitments, financial guarantees and letters of credit as it does for granting loans to legal entities and individuals.
The contractual amounts of credit related commitments are set out in the following table by category. The amounts reflected in the table for credit related commitments assume that amounts are fully advanced. The amounts reflected in the table for guarantees and letters of credit represent the maximum accounting loss that would be recognised at the reporting date if counterparties failed completely to perform as contracted.
The total outstanding contractual credit related commitments above do not necessarily represent future cash requirements, as these credit related commitments may expire or terminate without being funded.
35. Operating leases
(a) Bank as lessee Non-cancelable operating lease rentals as at 31 December are payable as follows:
TOPTOPCONTENTS CONTENTS

198 199
FINANCIAL STATEMENTS36. Contingencies
(a) Insurance
The insurance industry in the Republic of Armenia is in a developing state and many forms of insurance protection common in other parts of the world are not yet generally available. As of 31 December 2017 the Bank has up to AMD 7,021,000 thousand coverage for each type of insurance including for its premises and equipment, business interruption, third party liability in respect of accidents on the Bank’s property or related to operations.
(b) Litigation
In the ordinary course of business, the Bank is subject to legal actions and complaints. Management believes that the ultimate liability, if any, arising from such actions or complaints will not have a material adverse effect on the financial condition or the results of future operations.
(c) Taxation contingencies
The taxation system in the Republic of Armenia is relatively new and is characterized by frequent changes in legislation, official pronouncements and court decisions, which are often unclear, contradictory and subject to varying interpretation by different tax authorities. Taxes are subject to review and investigation by a number of authorities, which have the authority to impose severe fines, penalties and interest charges. In the event of a breach of tax legislation, no liabilities for additional taxes, fines or penalties may be imposed by tax authorities once three years have elapsed from the date of the breach.
These circumstances may create tax risks in the Republic of Armenia that are substantially more significant than in other countries. Management believes that it has provided adequately for tax liabilities based on its interpretations of applicable Armenian tax legislation, official pronouncements and court decisions. However, the interpretations of the relevant authorities could differ and the effect on the financial position, if the authorities were successful in enforcing their interpretations, could be significant.
37. Related party transactions
(a) Control relationships
The Bank’s parent company is Ameria Group (CY) Limited, which owns 65.8% of the share capital as at 31 December 2017.
The ultimate controler and final beneficiary owner of the Bank is Mr. Ruben Vardanyan.
No publicly available financial statements are produced by the Bank’s parent company.
(b) Transactions with the members of the Board of Directors and the Management Board
Total remuneration included in personnel expenses for the year ended 31 December are as follows:
Short-term employee benefits 1,972,902 2,271,649
2017AMD’000
2016AMD’000
FINANCIAL STATEMENTS
The outstanding balances and average interest rates as at 31 December and 31 December for transactions with the members of the Board of Directors and the Management Board are as follows:
The loans and guarantees are in Armenian Drams and US Dollars and repayable by 2027.
Amounts included in profit or loss in relation to transactions with the members of the Board of Directors and the Management Board for the year ended 31 December are as follows:
Profit or lossInterest incomeInterest expense
66,568
(141,954)
62,275
(43,675)
2017AMD’000
2016AMD’000
Statement of financial positionLoans issued Other assetsDeposits receivedSubordinated debtOther liabilitiesGuarantees
1,253,917
1,893674,074
5,928,5871,077,633
16,944
956,0591,135
422,061‒
850,94533,876
8.02%0.00%5.70%6.00%0.00%0.00%
6.96%0.00%6.58%
‒0.00%0.00%
2017AMD’000
Average interest rate, %
Average interest rate, %
2016AMD’000
TOPTOPCONTENTS CONTENTS

200 201
FINANCIAL STATEMENTS
(c) Transactions with other related partiesThe outstanding balances and the related average effective interest rates as at 31 December 2017 and related profit or loss amounts of transactions for the year ended 31 December 2017 with other related parties are as follows:
Statement of financial positionAssetsFinancial instruments at fair value through profit or lossLoans and advances to customersOther assetLiabilitiesFinancial instruments at fair value through profit or lossCurrent accounts and deposits from customers- Current accounts and demand deposits- Term depositsOther borrowingsOther liabilitiesItems not recognised in the statement of financial positionGuarantees givenProfit (loss)Interest incomeInterest expenseOther expense
−−−
−
666,258−−−
−
−−−
−−
795,016
−
200,264513,431
−−
−
− (21,325)(17,055)
−−−
−
1,172,117−
9,890,487 10,316
−
1,371(1,135,191)
−
645,00134,916,760
3,596
611,430
1,980,57032,590,571
−−
20,304
4,360,124(3,864,603)
(98,978)
645,00134,916,760
798,612
611,430
4,019,20933,104,0029,890,487
10,316
20,304
4,361,495(5,021,119)(116,033)
−−−
−
0.00%−−−
−
−−−
−−−
−
0.00%4.66%
−−
−
−−−
−−−
−
0.00%−
8.90%0.00%
−
−−−
−13.27%
−
−
0.00%12.87%
−−
0.00%
−−−
AMD’000
Parent companyShareholder with
significant influence
Subsidiaries of the immediate parent
company
Other entities under common control and other
related parties
AMD’000AMD’000 AMD’000Total
AMD’000Average
interest rate, %Average
interest rate, %Average
interest rate, %Average
interest rate, %
FINANCIAL STATEMENTS
The outstanding balances and the related average effective interest rates as at 31 December 2016 and related profit or loss amounts of transactions for the year ended 31 December 2016 with other related parties are as follows:
Statement of financial positionAssetsFinancial instruments at fair value through profit or lossLoans and advances to banksLoans and advances customersOther assetLiabilitiesFinancial instruments at fair value through profit or lossCurrent accounts and deposits from customers- Current accounts and demand deposits- Term depositsSubordinated borrowingsOther borrowingsOther liabilitiesItems not recognised in the statement of financial positionGuarantees givenProfit (loss)Interest incomeInterest expenseOther expense
−−−−
−
70,859−−−−
−
−(28,196)
−
−−−−
−
964,5411,227,222
−−−
−
−(41,595)
−
−1,001,707
−−
−
326,386−−
14,103,30420,765
−
1,706(1,281,883)
(35,706)
1,633,886−
82,599,0503,596
1,554,397
32,025,13129,346,1345,920,428
−−
17,927
4,166,018(3,924,377)
−
1,633,8861,001,707
82,599,0503,596
1,554,397
33,386,91730,573,3565,920,428
14,103,30420,765
17,927
4,167,724(5,276,051)
(35,706)
−−−−
−
0.00%−−−−
−
−−−
−−−−
−
0.00%3.20%
−−−
−
−−−
−6.25%
−−
−
0.00%−−
9.08%0.00%
−
−−−
−−
6.25%−
−
0.00%12.82%6.00%
−−
0.00%
−−−
AMD’000
Parent companyShareholder with
significant influence
Subsidiaries of the immediate parent
company
Other entities under common control and other
related parties
AMD’000AMD’000 AMD’000Total
AMD’000Average
interest rate, %Average
interest rate, %Average
interest rate, %Average
interest rate, %
TOPTOPCONTENTS CONTENTS

202 203
FINANCIAL STATEMENTS38. Financial assets and liabilities: fair values and accounting classifications
(a) Accounting classifications and fair values
The estimates of fair value are intended to approximate the price that would be received to sell an asset or paid to transfer a liability in an orderly transaction between market participants at the measurement date. However given the uncertainties and the use of subjective judgment, the fair value should not be interpreted as being realizable in an immediate sale of the assets or transfer of liabilities.
Valuation techniques include net present value and discounted cash flow models, comparison to similar instruments for which market observable prices exist and other valuation models. Assumptions and inputs used in valuation techniques include risk-free and benchmark interest rates, credit spreads and other premia used in estimating discount rates, bond and equity prices, foreign currency exchange rates, equity and equity index prices. The objective of valuation techniques is to arrive at a fair value determination that reflects the price of the financial instrument at the reporting date that would have been determined by market participants acting at arm’s length.
The Bank uses widely recognised valuation models for determining the fair value of common and more simple financial instruments like interest rate and currency swaps that use only observable market data and require little management judgment and estimation. Observable prices and model inputs are usually available in the market for listed debt and equity securities, exchange traded derivatives and simple over the counter derivatives like interest rate swaps.
The estimated fair values of all financial instruments except for unquoted equity securities available-for-sale, loans and advances to customers, held-to-maturity investments and debt securities issued approximate their carrying values. As at 31 December 2017 fair value of unquoted equity securities available-for-sale with a carrying value of AMD 106,458 thousand (2016: AMD 106,458 thousand)
Loans and advances to customersHeld-to-maturity investmentsDomestic bonds issuedTotal
Loans and advances to customersHeld-to-maturity investmentsDomestic bonds issuedTotal
479,640,98143,305,84431,221,300
554,168,125
513,218,70936,255,6428,421,362
557,895,713
474,361,415 44,680,29931,493,983
550,535,697
506,319,98136,889,8898,623,327
551,833,197
Carrying amountAMD’000
Carrying amountAMD’000
Fair valueAMD’000
Fair valueAMD’000
cannot be determined.
The table below sets out the carrying amounts and fair values of loans and advances to customers, held-to-maturity investments and domestic bonds issued as at 31 December 2017:
The table below sets out the carrying amounts and fair values of loans and advances to customers, held-to-maturity investments and domestic bonds issued as at 31 December 2016:
The following assumptions are used by management to estimate the fair values of financial instruments: ► Discount rates of 3.5% and 11.6-16.4% are used for discounting future cash flows from loans and advances to
banks and loans and advances to customers, respectively;► Discount rates of 5.5-12% are used for discounting future cash flows for liabilities.
FINANCIAL STATEMENTS(b) Fair value hierarchy
The Bank measures fair values using the following fair value hierarchy that reflects the significance of the inputs used in making the measurements:► Level 1: quoted market price (unadjusted) in an
active market for an identical instrument;► Level 2: inputs other than quotes prices included
within Level 1 that are observable either directly (i.e. as prices) or indirectly (i.e. derived from prices). This category includes instruments valued using: quoted market prices in active markets for similar instruments; quoted prices for similar instruments in markets that are considered less than active; or other valuation techniques where all significant inputs are directly or indirectly observable from market data;
► Level 3: inputs that are unobservable. This category includes all instruments where the valuation technique includes inputs not based on observable data and the unobservable inputs have a significant effect on the instrument’s valuation. This category includes instruments that are valued based on quoted prices for similar instruments where significant unobservable adjustments or assumptions are required to reflect differences between the instruments.
The table below analyses financial instruments measured at fair value and financial instruments for which fair values are disclosed as at 31 December 2017, by the level in the fair value hierarchy into which the fair value measurement is categorised. The amounts are based on the values recognized in the statement of financial position:
Assets and liabilities measured at fair valueFinancial instruments at fair value through profit or loss- Debt and other fixed-income instruments- Derivative assets- Derivative liabilities Available-for-sale financial assets- Debt instruments Assets for which fair values are disclosedLoans to and advances customersHeld-to-maturity investmentsDomestic bonds issued
−−−
2,942,6392,942,639
−
3,881,042−
3,881,042
3,015,199952,865
(686,306)
6,838,98110,120,739
−
40,799,25731,493,98372,293,240
−−−
−−
474,361,415
−−
474,361,415
3,015,199952,865
(686,306)
9,781,62013,063,378
474,361,41544,680,29931,493,983
550,535,697
Level 1AMD’000
Level 2
Level 3 Total
TOPTOPCONTENTS CONTENTS

204 205
FINANCIAL STATEMENTSThe table below analyses financial instruments measured at fair value and financial instruments for which fair values are disclosed as at 31 December 2016, by the level in the fair value hierarchy into which the fair value measurement is categorised. The amounts are based on the values recognized in the statement of financial position:
Derivatives
Derivatives valued using a valuation technique with market observable inputs are mainly interest rate swaps, currency swaps and forward foreign exchange contracts. The most frequently applied valuation techniques include forward pricing and swap models, using present value calculations. The models incorporate various inputs including the credit quality of counterparties, foreign exchange spot and forward rates and interest rate curves.
Available-for-sale financial assets
Investment securities available-for-sale valued using a valuation technique or pricing models primarily consist of Armenian Government debt securities. These securities are valued using yield curves which incorporate data observable in the market and published by CBA.
Assets and liabilities measured at fair valueFinancial instruments at fair value through profit or loss- Derivative assets- Derivative liabilities Available-for-sale financial assets- Debt instruments Assets for which fair values are disclosedLoans to and advances customersHeld-to-maturity investmentsDomestic bonds issued
−−
3,418,1113,418,111
−804,054
−804,054
3,130,071(2,535,283)
8,883,7239,478,511
−36,085,8358,623,327
44,709,162
−−
−−
506,319,981−−
506,319,981
3,130,071(2,535,283)
12,301,83412,896,622
506,319,98136,889,8898,623,327
551,833,197
Level 1AMD’000
Level 2
Level 3 Total
FINANCIAL STATEMENTS39. Changes in liabilities arising from financing activities
The table below analyses financial instruments measured at fair value and financial instruments for which fair values are disclosed as at 31 December 2016, by the level in the fair value hierarchy into which the fair value measurement is categorised. The amounts are based on the values recognized in the statement of financial position:
The “Other” line includes the effect of accrued but not yet paid interest on debt securities issued, other borrowed funds and subordinated loans. The Bank classifies interest paid as cash flows from operating activities.
Carrying amount at 31 December 2015 Proceeds from issueRedemptionForeign currency translationOtherCarrying amount at 31 December 2016
Proceeds from issueRedemptionForeign currency translationOtherCarrying amount at 31 December 2017
−
17,815,044−
175,875133,581
18,124,500
22,504,610−
82,042221,443
40,932,595
78,383,861
77,618,450(53,479,054)
193,84317,939
102,735,039
67,496,831(72,097,598)
29,467(35,645)
98,128,094
39,721,324
−−
4,5181,085,413
40,811,255
−−
(4,111)112,624
40,919,768
118,105,185
95,433,494(53,479,054)
374,2361,236,933
161,670,794
90,001,441(72,097,598)
107,398298,422
179,980,457
Debt securitiesissuedAMD’000
Other borrowed funds
Subordinated loans
Total liabilities from financing activities
TOPTOPCONTENTS CONTENTS

206
FINANCIAL STATEMENTS
40. Events after reporting period
On 14 February 2018 Asian Development Bank purchased in full additionally issued 16,291 shares of the Bank for AMD 14,426,665 thousand. As the result of the transaction the shareholding structure of the Bank changed as follows: Ameria Group (CY) (56.60%), EBRD (17.80%), ESPS Holding Limited (11.62%) and ADB (13.98%).
TOPCONTENTS