AMD Second Quarter 2013 Earnings Results Summary
17
AMD Second Quarter 2013 Earnings Results Summary JULY 18, 2013
-
Upload
amd -
Category
Technology
-
view
706 -
download
3
Transcript of AMD Second Quarter 2013 Earnings Results Summary

AMD Second Quarter 2013
Earnings Results Summary JULY 18, 2013

2 AMD EARNINGS RESULTS SUMMARY | JULY 18, 2013
CAUTIONARY STATEMENT
This document contains forward-looking statements concerning AMD, our financial outlook for the third quarter of 2013
and fiscal 2013, including revenue, gross margin, operating expenses, cash balances, inventory, capital expenditures and
profitability; our ability to achieve positive free cash flow and operating profitability in the second half of 2013; our target
optimal cash balance and minimum target cash balance; our ability to build leadership IP; that revenue from embedded
and semi-custom products will comprise 20% of our revenue by the fourth quarter of 2013; our ability to transition 40-50%
of our business to high growth adjacent markets; and our ability to achieve target operating expenses by the third quarter
of 2013, which are made pursuant to the safe harbor provisions of the Private Securities Litigation Reform Act of
1995. Forward-looking statements are commonly identified by words such as “believes,” “expects,” “may,” “will,” “should,”
“seeks,” “intends,” “plans,” “estimates,” “anticipates,” “projects,” “would,” and other terms with similar meaning. Investors
are cautioned that the forward-looking statements in this document are based on current beliefs, assumptions and
expectations, speak only as of the date of this document and involve risks and uncertainties that could cause actual
results to differ materially from current expectations. Risks include the possibility that Intel Corporation's pricing,
marketing and rebating programs, product bundling, standard setting, new product introductions or other activities may
negatively impact the company's current plans; the company may be unable to develop, launch and ramp new products
and technologies in the volumes that are required by the market and at mature yields on a timely basis; that its third party
wafer foundry suppliers will be unable to transition the company’s products to advanced manufacturing process
technologies in a timely and effective way or to manufacture the company’s products on a timely basis in sufficient
quantities and using competitive technologies; the company will be unable to obtain sufficient manufacturing capacity or
components to meet demand for its products; the company’s requirements for wafers are less than the fixed number of
wafers that it agreed to purchase from GF or GF encounters problems that significantly reduce the number of functional
die the company receives from each wafer; that we are unable to successfully implement our long-term business
strategy; that customers stop buying the company's products or materially reduce their operations or demand for the
company’s products; that the company may be unable to maintain the level of investment in research and development
that is required to remain competitive; that there may be unexpected variations in market growth and demand for the
company's products and technologies in light of the product mix that it may have available at any particular time or a
decline in demand; the company will require additional funding and may be unable to raise sufficient capital on favorable
terms, or at all; that global business and economic conditions will not continue to improve or will worsen; that demand for
computers will be lower than currently expected; and the effect of political or economic instability, domestically or
internationally, on the company’s sales or supply chain. Investors are urged to review in detail the risks and uncertainties
in the company's Securities and Exchange Commission filings, including but not limited to the Quarterly Report on form
10-Q for the quarter ended March 30, 2013.

3 AMD EARNINGS RESULTS SUMMARY | JULY 18, 2013
THREE STEPS TO TRANSFORMATION
TRANSFORM AMD TO WIN
ACCELERATE & EXECUTE
PLAN 2013
RESET & RESTRUCTURE
Q3 2012 – Q1 2013
$450M OPEX by Q3’13
Reduce headcount by ~14%
Manage cash and inventory
Execute 2013 roadmap
Deliver 2013 financial commitments
Return to operating profitability in 2H 2013
Return to profitability at the net income level based
on Q3'13 mid-point revenue guidance
Achieve positive free cash flow in 2H 2013
Build leadership IP
Low power; x86; ARM; Graphics
Transition 40-50% of our business to high growth
adjacent markets
Ultra low power client; Embedded; Semi-custom; Professional
Graphics; Dense server
4 AMD EARNINGS RESULTS SUMMARY | JULY 18, 2013
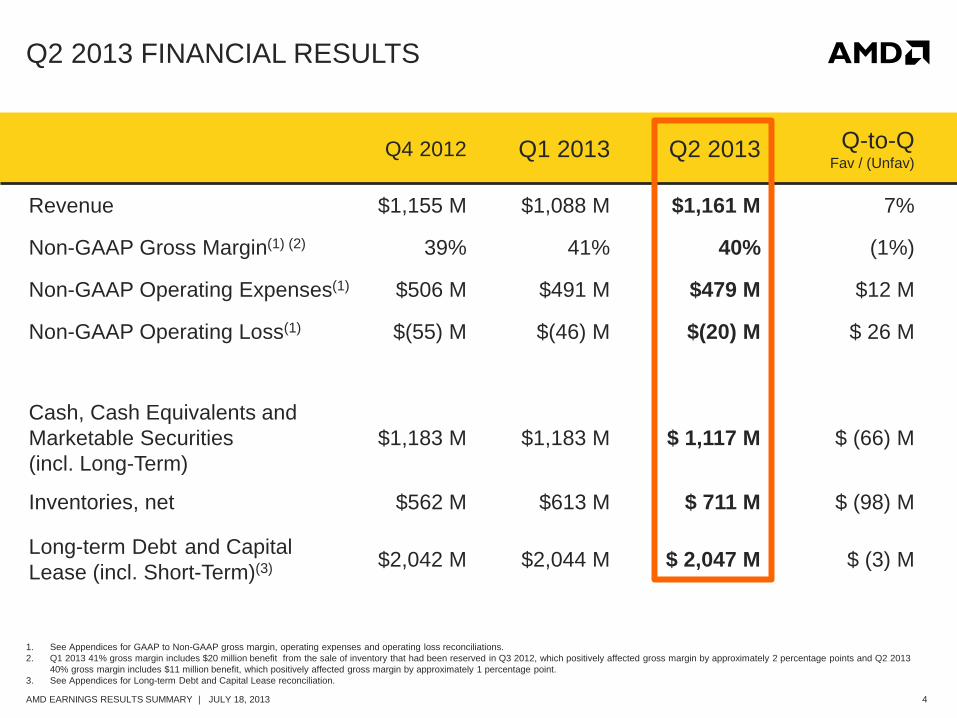
Q2 2013 FINANCIAL RESULTS
1. See Appendices for GAAP to Non-GAAP gross margin, operating expenses and operating loss reconciliations.
2. Q1 2013 41% gross margin includes $20 million benefit from the sale of inventory that had been reserved in Q3 2012, which positively affected gross margin by approximately 2 percentage points and Q2 2013
40% gross margin includes $11 million benefit, which positively affected gross margin by approximately 1 percentage point.
3. See Appendices for Long-term Debt and Capital Lease reconciliation.
Q4 2012 Q1 2013 Q2 2013 Q-to-Q Fav / (Unfav)
Revenue $1,155 M $1,088 M $1,161 M 7%
Non-GAAP Gross Margin(1) (2) 39% 41% 40% (1%)
Non-GAAP Operating Expenses(1) $506 M $491 M $479 M $12 M
Non-GAAP Operating Loss(1) $(55) M $(46) M $(20) M $ 26 M
Cash, Cash Equivalents and
Marketable Securities
(incl. Long-Term)
$1,183 M $1,183 M $ 1,117 M $ (66) M
Inventories, net $562 M $613 M $ 711 M $ (98) M
Long-term Debt and Capital
Lease (incl. Short-Term)(3) $2,042 M $2,044 M $ 2,047 M $ (3) M
5 AMD EARNINGS RESULTS SUMMARY | JULY 18, 2013
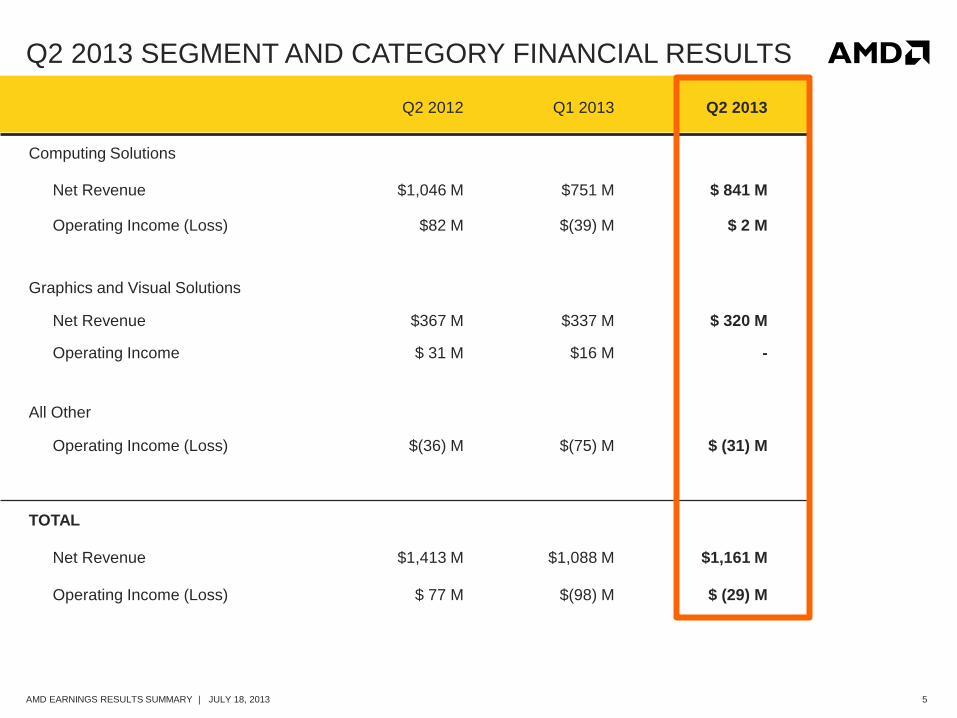
Q2 2013 SEGMENT AND CATEGORY FINANCIAL RESULTS
Q2 2012 Q1 2013 Q2 2013
Computing Solutions
Net Revenue $1,046 M $751 M $ 841 M
Operating Income (Loss) $82 M $(39) M $ 2 M
Graphics and Visual Solutions
Net Revenue $367 M $337 M $ 320 M
Operating Income $ 31 M $16 M -
All Other
Operating Income (Loss) $(36) M $(75) M $ (31) M
TOTAL
Net Revenue $1,413 M $1,088 M $1,161 M
Operating Income (Loss) $ 77 M $(98) M $ (29) M
6 AMD EARNINGS RESULTS SUMMARY | JULY 18, 2013
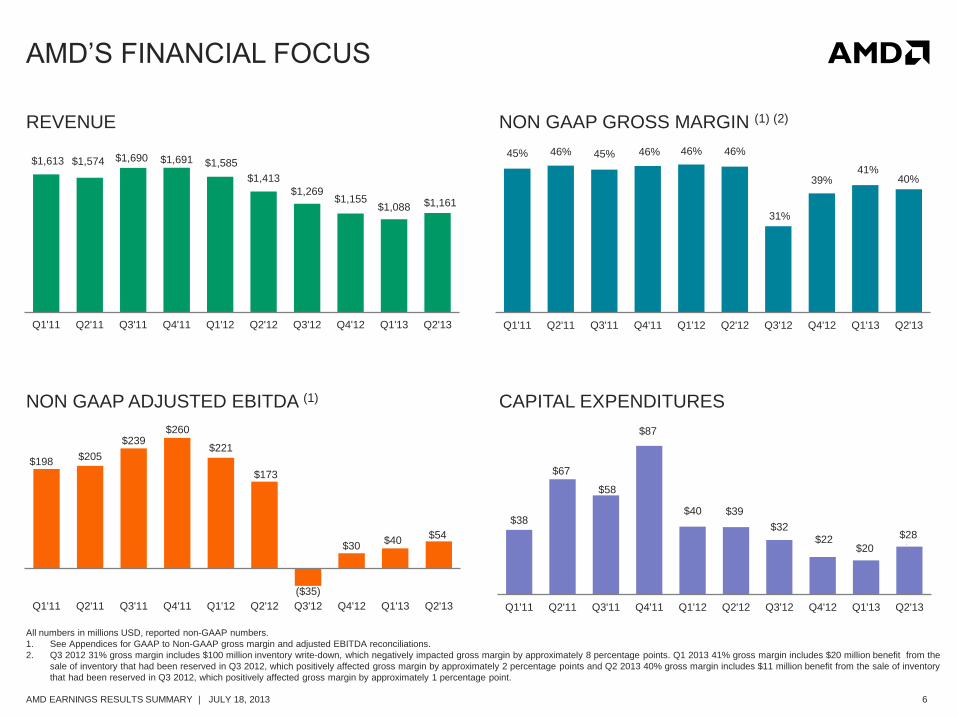
AMD’S FINANCIAL FOCUS
45% 46% 45% 46% 46% 46%
31%
39% 41%
40%
Q1'11 Q2'11 Q3'11 Q4'11 Q1'12 Q2'12 Q3'12 Q4'12 Q1'13 Q2'13
$38
$67
$58
$87
$40 $39
$32
$22 $20
$28
Q1'11 Q2'11 Q3'11 Q4'11 Q1'12 Q2'12 Q3'12 Q4'12 Q1'13 Q2'13
$1,613 $1,574 $1,690 $1,691 $1,585
$1,413
$1,269 $1,155
$1,088 $1,161
Q1'11 Q2'11 Q3'11 Q4'11 Q1'12 Q2'12 Q3'12 Q4'12 Q1'13 Q2'13
$198 $205
$239 $260
$221
$173
($35)
$30 $40
$54
Q1'11 Q2'11 Q3'11 Q4'11 Q1'12 Q2'12 Q3'12 Q4'12 Q1'13 Q2'13
All numbers in millions USD, reported non-GAAP numbers.
1. See Appendices for GAAP to Non-GAAP gross margin and adjusted EBITDA reconciliations.
2. Q3 2012 31% gross margin includes $100 million inventory write-down, which negatively impacted gross margin by approximately 8 percentage points. Q1 2013 41% gross margin includes $20 million benefit from the
sale of inventory that had been reserved in Q3 2012, which positively affected gross margin by approximately 2 percentage points and Q2 2013 40% gross margin includes $11 million benefit from the sale of inventory
that had been reserved in Q3 2012, which positively affected gross margin by approximately 1 percentage point.
REVENUE
NON GAAP ADJUSTED EBITDA (1)
NON GAAP GROSS MARGIN (1) (2)
CAPITAL EXPENDITURES
$28

7 AMD EARNINGS RESULTS SUMMARY | JULY 18, 2013
Q1'12 Q4'12 Q1'13 Q2'13 Q3'13 Target
~$450
$491 $506
$479
RESTRUCTURING TO RIGHT SIZE OPEX CONSISTENT
WITH STRATEGY
NON GAAP OPEX(1): TARGETED AND TODAY
($ IN MILLIONS)
KEY RESTRUCTURING
ACTIONS
~14% reduction of headcount
completed
Site consolidations
Reusable IP blocks
Organizational restructuring
Volume design win focus for
better backend economies of
scale
$592
Q1’12 Q4’12 Q1’13 Q3’13 Target
1. See Appendices for GAAP to Non-GAAP OPEX reconciliation.
Q2’13
8 AMD EARNINGS RESULTS SUMMARY | JULY 18, 2013
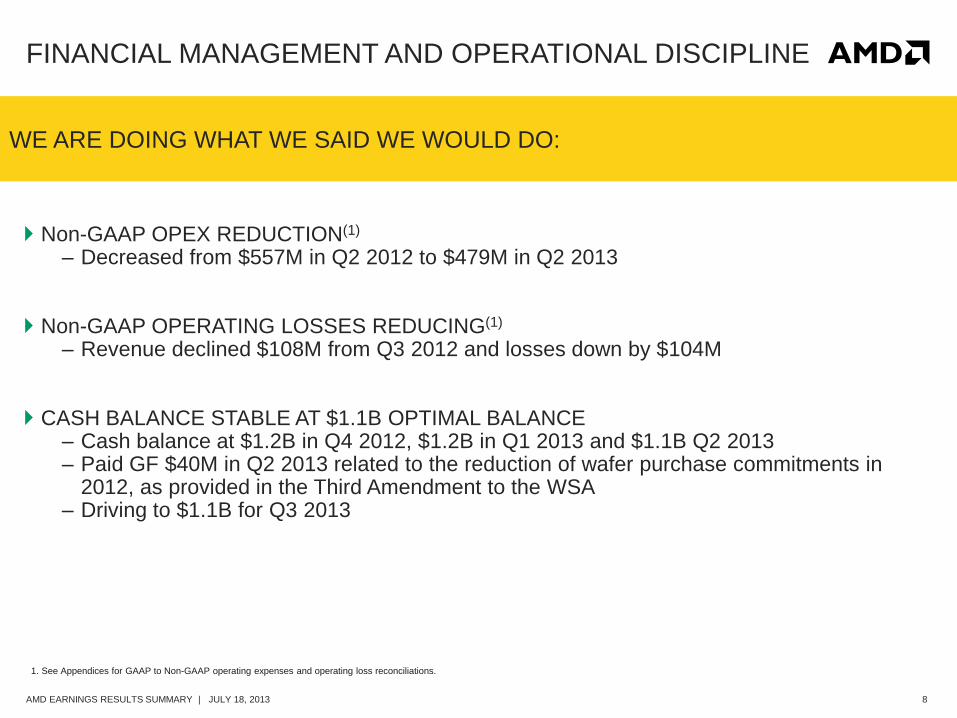
FINANCIAL MANAGEMENT AND OPERATIONAL DISCIPLINE
WE ARE DOING WHAT WE SAID WE WOULD DO:
Non-GAAP OPEX REDUCTION(1)
– Decreased from $557M in Q2 2012 to $479M in Q2 2013
Non-GAAP OPERATING LOSSES REDUCING(1)
– Revenue declined $108M from Q3 2012 and losses down by $104M
CASH BALANCE STABLE AT $1.1B OPTIMAL BALANCE
– Cash balance at $1.2B in Q4 2012, $1.2B in Q1 2013 and $1.1B Q2 2013 – Paid GF $40M in Q2 2013 related to the reduction of wafer purchase commitments in
2012, as provided in the Third Amendment to the WSA – Driving to $1.1B for Q3 2013
1. See Appendices for GAAP to Non-GAAP operating expenses and operating loss reconciliations.
9 AMD EARNINGS RESULTS SUMMARY | JULY 18, 2013
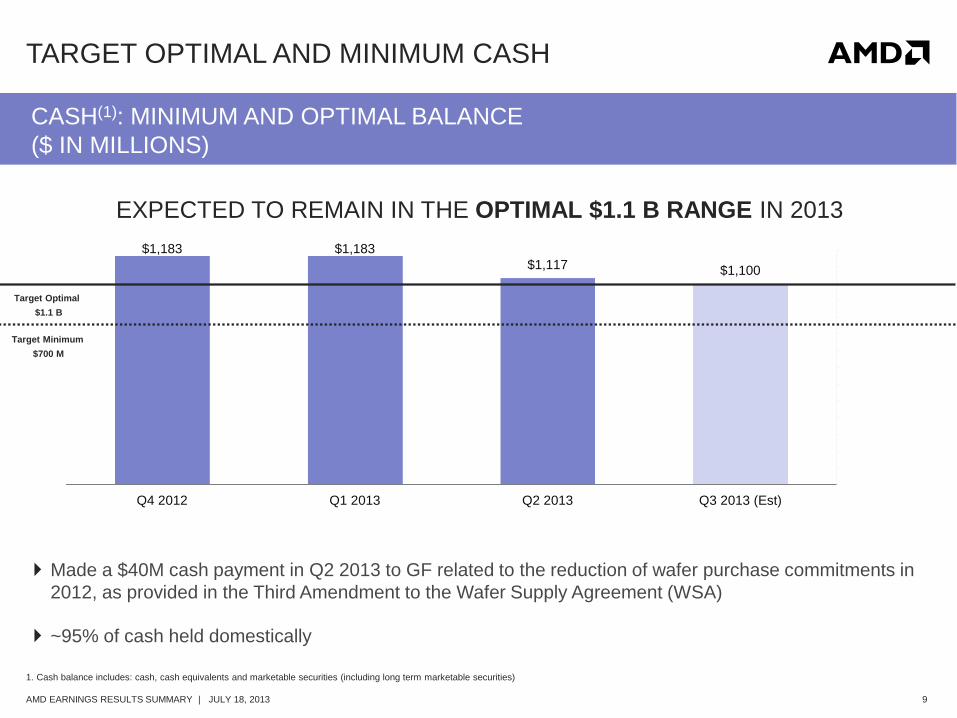
TARGET OPTIMAL AND MINIMUM CASH
1. Cash balance includes: cash, cash equivalents and marketable securities (including long term marketable securities)
CASH(1): MINIMUM AND OPTIMAL BALANCE
($ IN MILLIONS)
Made a $40M cash payment in Q2 2013 to GF related to the reduction of wafer purchase commitments in
2012, as provided in the Third Amendment to the Wafer Supply Agreement (WSA)
~95% of cash held domestically
$1,183 $1,183
$1,117 $1,100
$500
$550
$600
$650
$700
$750
$800
$850
$900
$950
$1,000
$1,050
$1,100
$1,150
$1,200
Q4 2012 Q1 2013 Q2 2013 Q3 2013 (Est)
Target Optimal
$1.1 B
Target Minimum
$700 M
EXPECTED TO REMAIN IN THE OPTIMAL $1.1 B RANGE IN 2013
10 AMD EARNINGS RESULTS SUMMARY | JULY 18, 2013
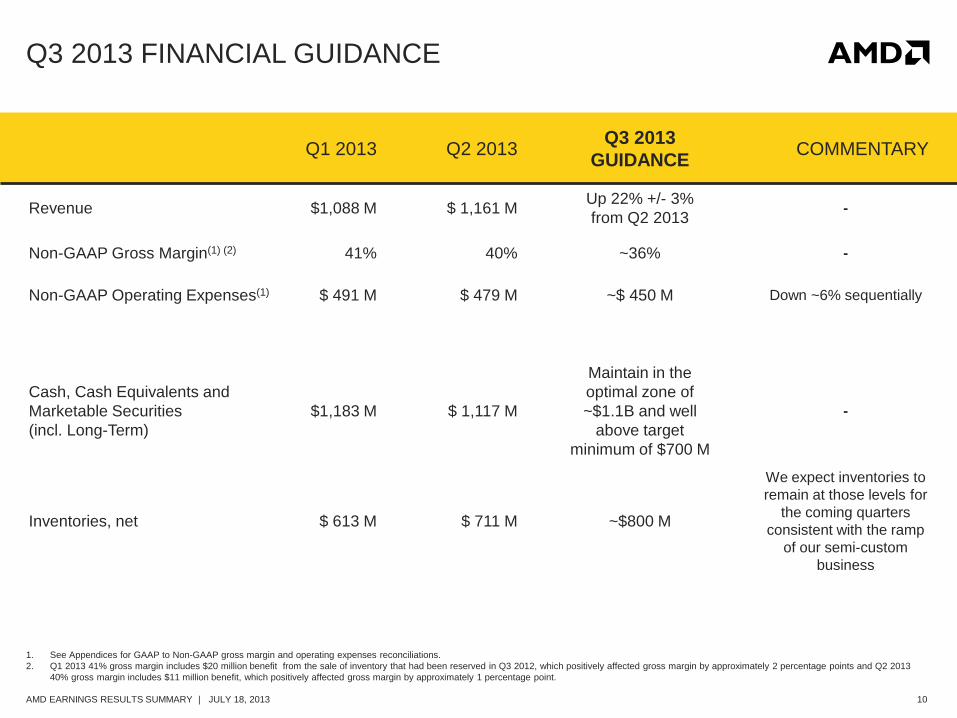
Q3 2013 FINANCIAL GUIDANCE
Q1 2013 Q2 2013 Q3 2013
GUIDANCE COMMENTARY
Revenue $1,088 M $ 1,161 M Up 22% +/- 3%
from Q2 2013 -
Non-GAAP Gross Margin(1) (2) 41% 40% ~36% -
Non-GAAP Operating Expenses(1) $ 491 M $ 479 M ~$ 450 M Down ~6% sequentially
Cash, Cash Equivalents and
Marketable Securities
(incl. Long-Term)
$1,183 M $ 1,117 M
Maintain in the
optimal zone of
~$1.1B and well
above target
minimum of $700 M
-
Inventories, net $ 613 M $ 711 M ~$800 M
We expect inventories to
remain at those levels for
the coming quarters
consistent with the ramp
of our semi-custom
business
1. See Appendices for GAAP to Non-GAAP gross margin and operating expenses reconciliations.
2. Q1 2013 41% gross margin includes $20 million benefit from the sale of inventory that had been reserved in Q3 2012, which positively affected gross margin by approximately 2 percentage points and Q2 2013
40% gross margin includes $11 million benefit, which positively affected gross margin by approximately 1 percentage point.
11 AMD EARNINGS RESULTS SUMMARY | JULY 18, 2013
1. Cash balance includes: cash, cash equivalents and marketable securities (including long term marketable securities)
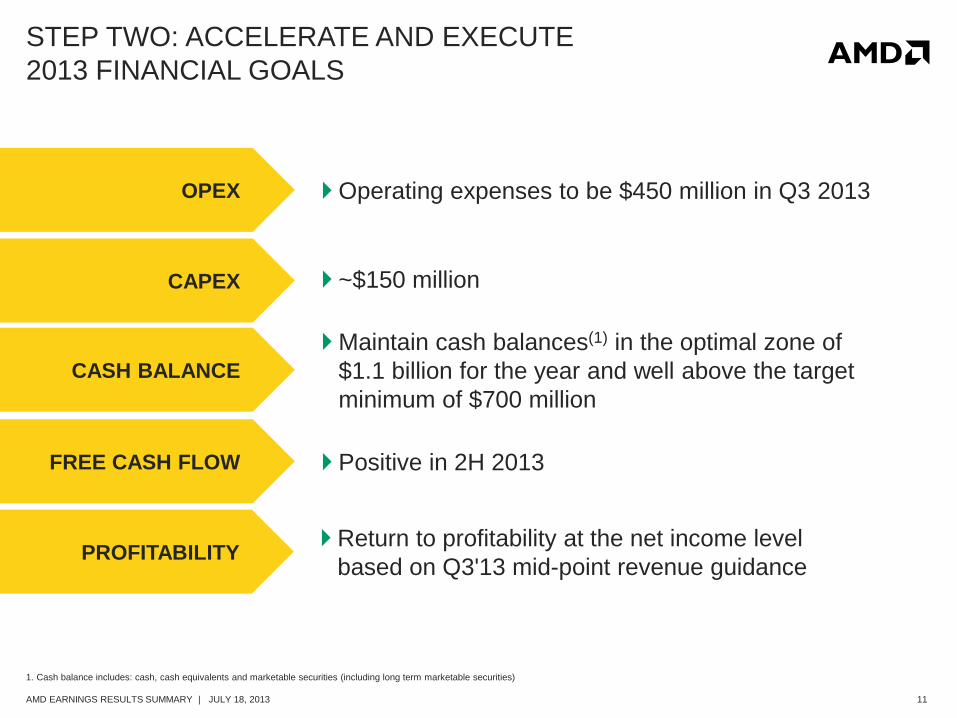
STEP TWO: ACCELERATE AND EXECUTE
2013 FINANCIAL GOALS
OPEX Operating expenses to be $450 million in Q3 2013
CAPEX ~$150 million
FREE CASH FLOW Positive in 2H 2013
CASH BALANCE
Maintain cash balances(1) in the optimal zone of
$1.1 billion for the year and well above the target
minimum of $700 million
PROFITABILITY Return to profitability at the net income level
based on Q3'13 mid-point revenue guidance

12 AMD EARNINGS RESULTS SUMMARY | JULY 18, 2013
AMD’S FINANCIAL FOCUS
RE-SET AND
REFOCUS
CORPORATION
$450M
OPEX target
in Q3 2013
TARGET GROWTH
MARKETS BEYOND
PCS WITH
DIFFERENTIATED IP
Embedded and Semi-
custom revenue 20%
by Q4 2013
FOCUS ON
LIQUIDITY
$1.1B optimal cash
balance
Linearity and inventory
management
EXECUTE NEW
OPERATING MODEL TO
ACHIEVE PROFITABLE
GROWTH
Profitable and Free
Cash Flow positive in
2H 2013
13 AMD EARNINGS RESULTS SUMMARY | JULY 18, 2013
FOOTNOTES
Non-GAAP Measures:
To supplement the Company’s financial results presented on a U.S. GAAP (“GAAP”) basis, this commentary contains non-GAAP financial measures, including non-GAAP gross margin, non-GAAP operating expenses, non-GAAP operating income (loss), non-GAAP net income (loss), non-GAAP earnings (loss) per share, adjusted EBITDA, and non-GAAP free cash flow. These non-GAAP financial measures reflect certain adjustments, and the Company has presented a reconciliation of GAAP to non-GAAP financial measures in the appendices below.
The Company presented “Adjusted EBITDA” in the commentary as a supplemental measure of its performance. Adjusted EBITDA for the Company is determined by adjusting operating income (loss) for depreciation and amortization, employee stock-based compensation expense and amortization of acquired intangible assets. In addition, the Company also included certain adjustments presented in the appendices for the applicable periods. The Company calculates and communicates Adjusted EBITDA because the Company’s management believes it is of importance to investors and lenders in relation to its overall capital structure and its ability to borrow additional funds. In addition, the Company presents Adjusted EBITDA because it believes this measure assists investors in comparing its performance across reporting periods on a consistent basis by excluding items that the Company does not believe are indicative of its core operating performance. The Company’s calculation of Adjusted EBITDA may or may not be consistent with the calculation of this measure by other companies in the same industry. Investors should not view Adjusted EBITDA as an alternative to the GAAP operating measure of operating income (loss) or GAAP liquidity measures of cash flows from operating, investing and financing activities. In addition, Adjusted EBITDA does not take into account changes in certain assets and liabilities as well as interest and income taxes that can affect cash flows.
The Company also presented non-GAAP free cash flow in this commentary as a supplemental measure of its performance. Non-GAAP free cash flow for the Company was determined by adjusting GAAP net cash provided by (used in) operating activities for capital expenditures. The Company calculates and communicates non-GAAP free cash flow because the Company’s management believes it is of importance to investors to understand the nature of this cash flow. The Company’s calculation of non-GAAP free cash flow may or may not be consistent with the calculation of this measure by other companies in the same industry. Investors should not view non-GAAP free cash flow as an alternative to GAAP liquidity measures of cash flows from operating activities. The Company has provided reconciliations of these non-GAAP financial measures to the most directly comparable GAAP financial measures.
The Company is providing these financial measures because it believes this non-GAAP presentation makes it easier for investors to compare its operating results for current and historical periods and also because the Company believes it assists investors in comparing the Company’s performance across reporting periods on a consistent basis by excluding items that it does not believe are indicative of its core operating performance.

14 AMD EARNINGS RESULTS SUMMARY | JULY 18, 2013
INVESTOR RELATIONS CONTACTS
Ruth Cotter
Phone: 408-749-3887
Email: [email protected]
Alina Ostrovsky
Phone: 408-749-6688
Email: [email protected]

15 AMD EARNINGS RESULTS SUMMARY | JULY 18, 2013
APPENDICES
Reconciliation of GAAP to Non-GAAP Gross Margin
Reconciliation of GAAP to Non-GAAP Operating Expenses*
Reconciliation of GAAP to Non-GAAP Operating Income (Loss)
(Millions except percentages) Q2-13 Q1-13 Q4-12 Q3-12 Q2-12 Q1-12 Q4-11 Q3-11 Q2-11 Q1-11
GAAP Gross Margin 459$ 445$ 178$ 392$ 638$ 27$ 773$ 756$ 720$ 691$
GAAP Gross Margin % 40% 41% 15% 31% 45% 2% 46% 45% 46% 43%
Lower of cost or market charge related to GF take-or-pay obligation - - (273) - - - - - - -
Limited waiver of exclusivity from GF - - - - - (703) - - - -
Payment to GF - - - - - - - - - (24)
Legal settlement - - - (5) - - - - (5)
Non-GAAP Gross Margin 459 445$ 451$ 392$ 643$ 730$ 773$ 756$ 720$ 720$
Non-GAAP Gross Margin % 40% 41% 39% 31% 46% 46% 46% 45% 46% 45%
(Millions) Q2-13 Q1-13 Q4-12 Q3-12 Q2-12 Q1-12
GAAP operating expenses 488$ 543$ 600$ 523$ 561$ 607$
Amortization of acquired intangible assets 4 5 4 4 4 1
Restructuring and other special charges, net 5 47 90 3 - 8
Non-GAAP operating expenses 479$ 491$ 506$ 516$ 557$ 592$
*Non-GAAP Operating Expenses were first disclosed in Q112
(Millions) Q2-13 Q1-13 Q4-12 Q3-12 Q2-12 Q1-12 Q4-11 Q3-11 Q2-11 Q1-11
GAAP operating income (loss) (29)$ (98)$ (422)$ (131)$ 77$ (580)$ 71$ 138$ 105$ 54$
Lower of cost or market charge related to GF take-or-pay obligation - - (273) - - - - - - -
Limited waiver of exclusivity from GF - - - - - (703) - - - -
Payment to GF - - - - - - - - (24)
Legal settlement - - - - (5) - - - - (5)
Amortization of acquired intangible assets (4) (5) (4) (4) (4) (1) (3) (8) (9) (9)
Restructuring and other special charges, net (5) (47) (90) (3) - (8) (98) - - -
SeaMicro acquisition costs - - - - (6) - - - -
Non-GAAP operating income (loss) (20)$ (46)$ (55)$ (124)$ 86$ 138$ 172$ 146$ 114$ 92$
16 AMD EARNINGS RESULTS SUMMARY | JULY 18, 2013
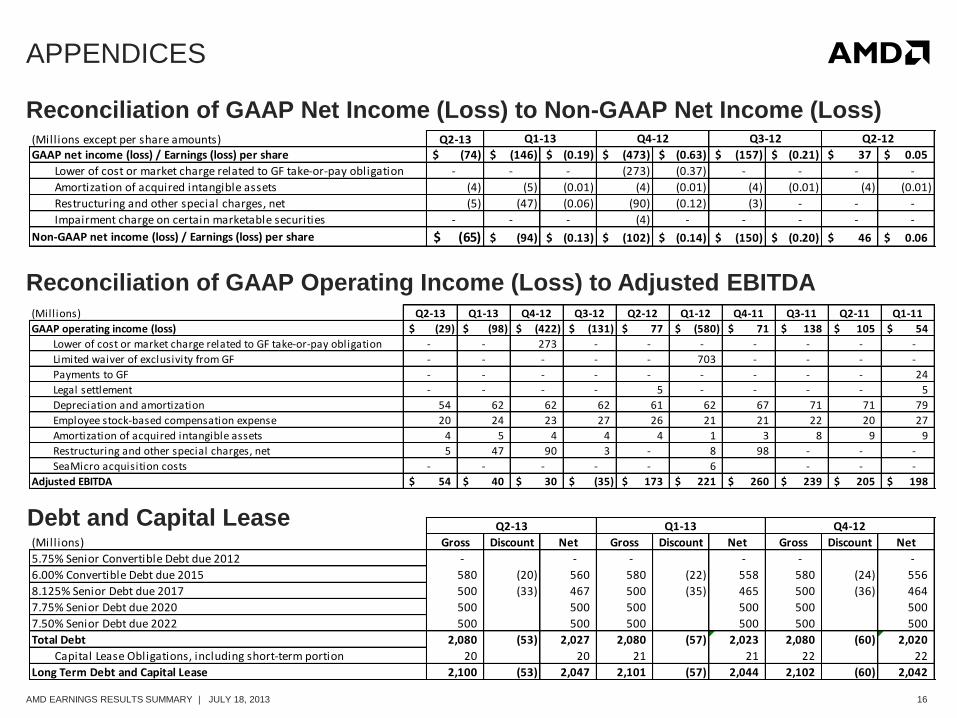
APPENDICES
Reconciliation of GAAP Operating Income (Loss) to Adjusted EBITDA
Debt and Capital Lease
Reconciliation of GAAP Net Income (Loss) to Non-GAAP Net Income (Loss) (Millions except per share amounts) Q2-13GAAP net income (loss) / Earnings (loss) per share (74)$ (146)$ (0.19)$ (473)$ (0.63)$ (157)$ (0.21)$ 37$ 0.05$
Lower of cost or market charge related to GF take-or-pay obligation - - - (273) (0.37) - - - -
Amortization of acquired intangible assets (4) (5) (0.01) (4) (0.01) (4) (0.01) (4) (0.01)
Restructuring and other special charges, net (5) (47) (0.06) (90) (0.12) (3) - - -
Impairment charge on certain marketable securities - - - (4) - - - - -
Non-GAAP net income (loss) / Earnings (loss) per share (65)$ (94)$ (0.13)$ (102)$ (0.14)$ (150)$ (0.20)$ 46$ 0.06$
Q1-13 Q4-12 Q3-12 Q2-12
(Millions) Q2-13 Q1-13 Q4-12 Q3-12 Q2-12 Q1-12 Q4-11 Q3-11 Q2-11 Q1-11
GAAP operating income (loss) (29)$ (98)$ (422)$ (131)$ 77$ (580)$ 71$ 138$ 105$ 54$
Lower of cost or market charge related to GF take-or-pay obligation - - 273 - - - - - - -
Limited waiver of exclusivity from GF - - - - - 703 - - - -
Payments to GF - - - - - - - - - 24
Legal settlement - - - - 5 - - - - 5
Depreciation and amortization 54 62 62 62 61 62 67 71 71 79
Employee stock-based compensation expense 20 24 23 27 26 21 21 22 20 27
Amortization of acquired intangible assets 4 5 4 4 4 1 3 8 9 9
Restructuring and other special charges, net 5 47 90 3 - 8 98 - - -
SeaMicro acquisition costs - - - - - 6 - - -
Adjusted EBITDA 54$ 40$ 30$ (35)$ 173$ 221$ 260$ 239$ 205$ 198$
(Millions) Gross Discount Net Gross Discount Net Gross Discount Net
5.75% Senior Convertible Debt due 2012 - - - - - -
6.00% Convertible Debt due 2015 580 (20) 560 580 (22) 558 580 (24) 556
8.125% Senior Debt due 2017 500 (33) 467 500 (35) 465 500 (36) 464
7.75% Senior Debt due 2020 500 500 500 500 500 500
7.50% Senior Debt due 2022 500 500 500 500 500 500
Total Debt 2,080 (53) 2,027 2,080 (57) 2,023 2,080 (60) 2,020
Capital Lease Obligations, including short-term portion 20 20 21 21 22 22
Long Term Debt and Capital Lease 2,100 (53) 2,047 2,101 (57) 2,044 2,102 (60) 2,042
Q2-13 Q1-13 Q4-12

17 AMD EARNINGS RESULTS SUMMARY | JULY 18, 2013
DISCLAIMER & ATTRIBUTION
The information presented in this document is for informational purposes only and may contain technical inaccuracies, omissions and
typographical errors.
The information contained herein is subject to change and may be rendered inaccurate for many reasons, including but not limited to
product and roadmap changes, component and motherboard version changes, new model and/or product releases, product differences
between differing manufacturers, software changes, BIOS flashes, firmware upgrades, or the like. AMD assumes no obligation to
update or otherwise correct or revise this information. However, AMD reserves the right to revise this information and to make changes
from time to time to the content hereof without obligation of AMD to notify any person of such revisions or changes.
AMD MAKES NO REPRESENTATIONS OR WARRANTIES WITH RESPECT TO THE CONTENTS HEREOF AND ASSUMES NO
RESPONSIBILITY FOR ANY INACCURACIES, ERRORS OR OMISSIONS THAT MAY APPEAR IN THIS INFORMATION.
AMD SPECIFICALLY DISCLAIMS ANY IMPLIED WARRANTIES OF MERCHANTABILITY OR FITNESS FOR ANY PARTICULAR
PURPOSE. IN NO EVENT WILL AMD BE LIABLE TO ANY PERSON FOR ANY DIRECT, INDIRECT, SPECIAL OR OTHER
CONSEQUENTIAL DAMAGES ARISING FROM THE USE OF ANY INFORMATION CONTAINED HEREIN, EVEN IF AMD IS
EXPRESSLY ADVISED OF THE POSSIBILITY OF SUCH DAMAGES.
ATTRIBUTION
© 2013 Advanced Micro Devices, Inc. All rights reserved. AMD, the AMD Arrow logo and combinations thereof are trademarks of
Advanced Micro Devices, Inc. in the United States and/or other jurisdictions. SPEC is a registered trademark of the Standard
Performance Evaluation Corporation (SPEC). Other names are for informational purposes only and may be trademarks of their
respective owners.