AMBIENT AIR POLLUTION, FETAL GROWTH AND PREMATURE BIRTHS IN POLISH URBAN POPULATION Bogdan Wojtyniak...
20
AMBIENT AIR POLLUTION, AMBIENT AIR POLLUTION, FETAL GROWTH AND PREMATURE FETAL GROWTH AND PREMATURE BIRTHS IN POLISH URBAN BIRTHS IN POLISH URBAN POPULATION POPULATION Bogdan Wojtyniak Bogdan Wojtyniak Jakub Stokwiszewski Jakub Stokwiszewski Daniel Rabczenko Daniel Rabczenko National Institute of Hygiene, National Institute of Hygiene, Warsaw Warsaw
-
Upload
thomasina-reeves -
Category
Documents
-
view
213 -
download
0
Transcript of AMBIENT AIR POLLUTION, FETAL GROWTH AND PREMATURE BIRTHS IN POLISH URBAN POPULATION Bogdan Wojtyniak...

AMBIENT AIR POLLUTION, FETAL AMBIENT AIR POLLUTION, FETAL GROWTH AND PREMATURE GROWTH AND PREMATURE BIRTHS IN POLISH URBAN BIRTHS IN POLISH URBAN
POPULATIONPOPULATION
Bogdan WojtyniakBogdan Wojtyniak
Jakub StokwiszewskiJakub Stokwiszewski
Daniel RabczenkoDaniel Rabczenko
National Institute of Hygiene, WarsawNational Institute of Hygiene, Warsaw

POZNAN
LODZ
WROCLAW
CRACOW
GERMANY
CZECH REPUBLIC
BELARUS
LITHUANIA
RUSSIA
SLOVAKIA
UKRAINEN
EW
S
Polish cities included in the analysis
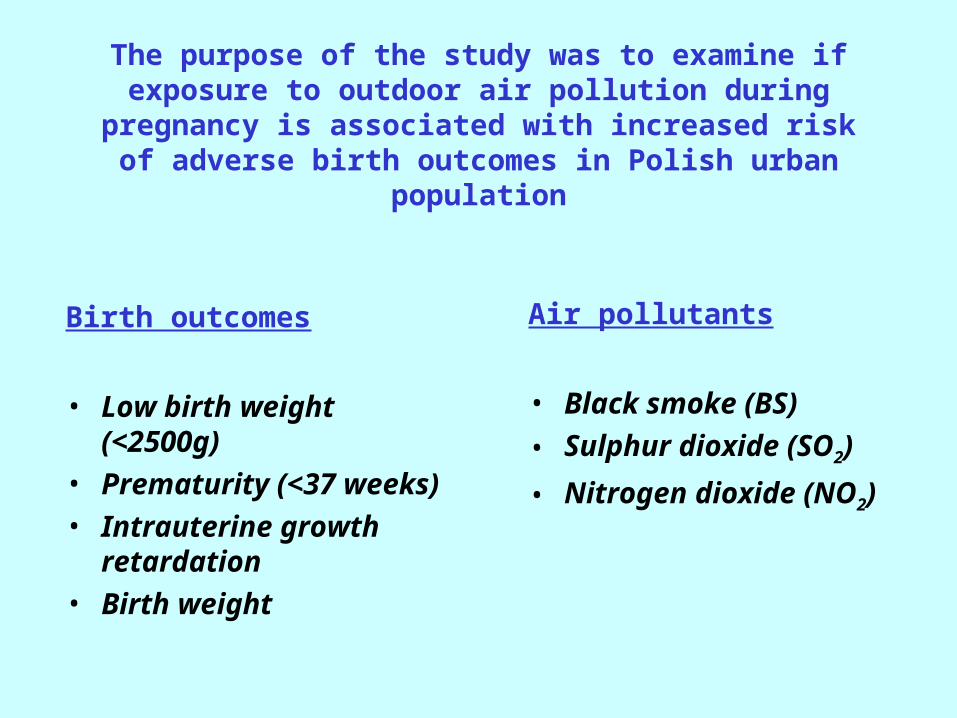
The purpose of the study was to examine if exposure to outdoor air pollution during pregnancy is associated
with increased risk of adverse birth outcomes in Polish urban population
Air pollutants
• Black smoke (BS)
• Sulphur dioxide (SO2)
• Nitrogen dioxide (NO2)
Birth outcomes
• Low birth weight (<2500g)
• Prematurity (<37 weeks)
• Intrauterine growth retardation
• Birth weight
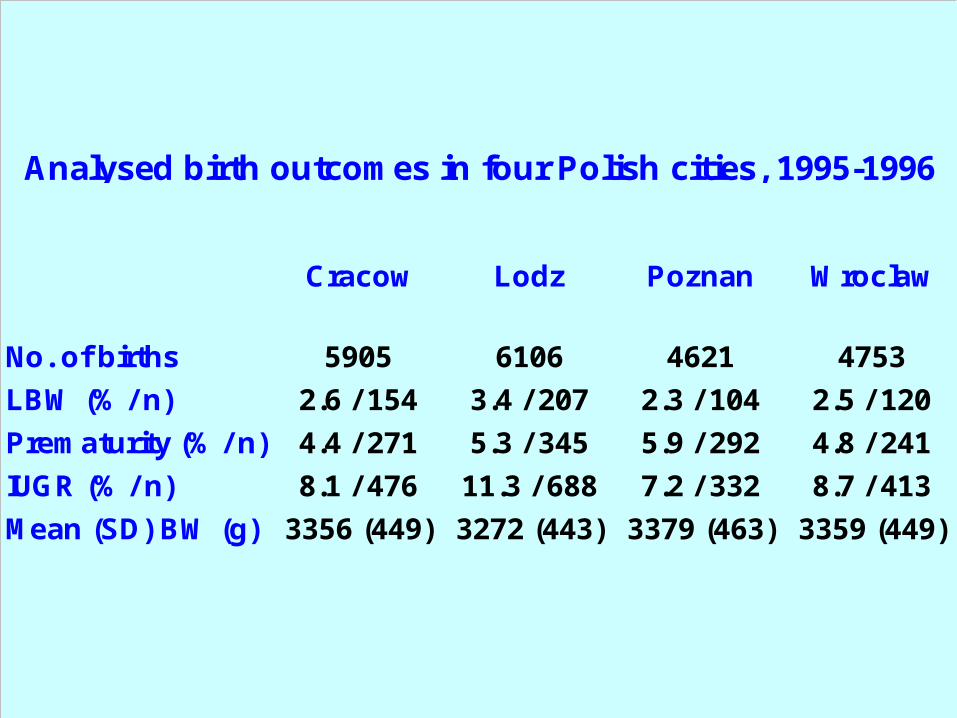
Cracow Lodz Poznan Wroclaw
No. of births 5905 6106 4621 4753
LBW (% / n) 2.6 / 154 3.4 / 207 2.3 / 104 2.5 / 120
Prematurity (% / n) 4.4 / 271 5.3 / 345 5.9 / 292 4.8 / 241
IUGR (% / n) 8.1 / 476 11.3 / 688 7.2 / 332 8.7 / 413
Mean (SD) BW (g) 3356 (449) 3272 (443) 3379 (463) 3359 (449)
Analysed birth outcomes in four Polish cities, 1995-1996

Cracow Lodz Poznan Wroclaw
Infants genderMale 51.8 52.1 50.6 51.6
Female 48.2 47.9 49.4 48.4
Maternal age (years)<20 12.5 14.2 13.0 15.4
20-24 45.9 47.3 46.4 45.625-29 29.2 27.8 29.6 28.1
30+ 12.4 10.7 11.0 10.9
Maternal educationprimary 9.4 14.5 10.6 13.0
vocational 24.3 23.6 25.8 21.4secondary 45.4 44.6 43.3 42.8
college+univ. 20.9 17.3 20.3 22.8
Single mother 17.4 18.0 16.6 19.0Conception season
spring 23.7 23.7 23.2 24.1summer 26.8 26.3 26.1 24.9autumn 27.2 26.7 27.4 26.6
winter 22.3 23.3 23.3 24.4
Characteristic of study groups (percentages)

Cracow Lodz Poznan Wroclaw
BS 44.5 30.2 24.5 26.7
SO2 41.5 21.3 23.0 20.1
NO2 57.7 36.6 52.5 26.7
Threemonths means of air pollution during study
period (μg/m3)

BS Cracow Lodz Poznan Wroclaw Mean weight Cracow Lodz Poznan WroclawCracow 1.00 Cracow 1.00
Lodz 0.90 1.00 Lodz -0.06 1.00Poznan 0.84 0.95 1.00 Poznan -0.03 -0.37 1.00Wroclaw 0.84 0.92 0.96 1.00 Wroclaw 0.21 0.09 0.14 1.00
SO2 Cracow Lodz Poznan Wroclaw IUGR Cracow Lodz Poznan WroclawCracow 1.00 Cracow 1.00
Lodz 0.96 1.00 Lodz -0.10 1.00Poznan 0.91 0.96 1.00 Poznan 0.10 0.18 1.00Wroclaw 0.93 0.95 0.93 1.00 Wroclaw 0.02 0.06 0.34 1.00
NO2 Cracow Lodz Poznan Wroclaw Prematurity Cracow Lodz Poznan WroclawCracow 1.00 Cracow 1.00
Lodz 0.01 1.00 Lodz 0.03 1.00Poznan 0.33 0.10 1.00 Poznan 0.21 0.03 1.00Wroclaw 0.33 0.04 0.62 1.00 Wroclaw -0.38 0.03 0.06 1.00
Correlation coefficients between the cities monthly values of a) air pollution b) birth outcomes
a) Air pollution b) Birth outcomes

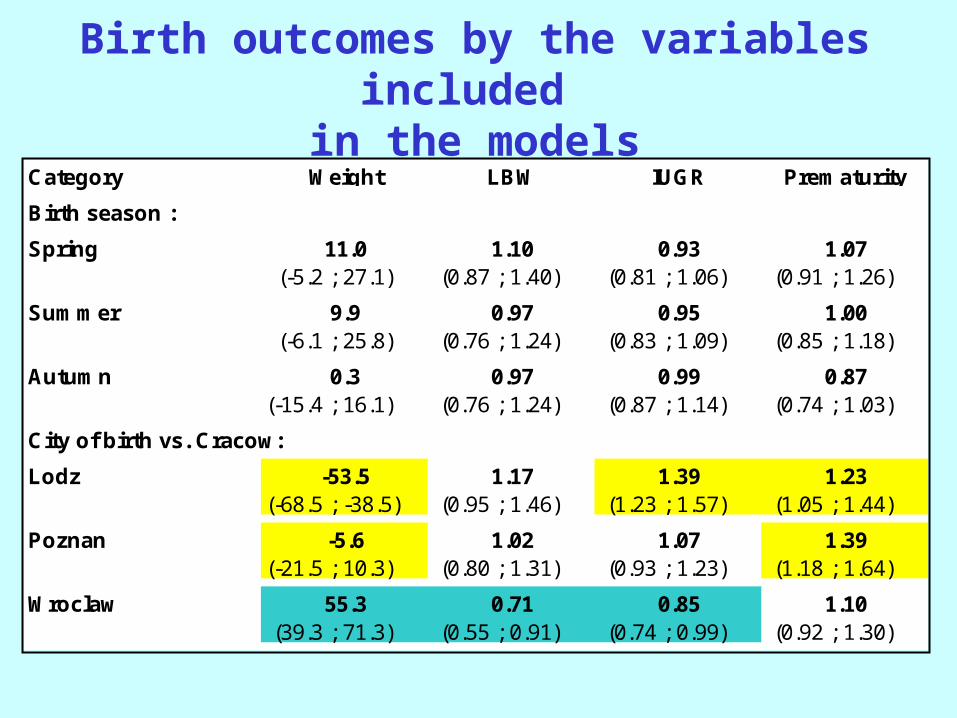
Birth outcomes by the variables included in the models
Category
Females(-160.4 ; -138.1) (1.50 ; 2.11) (0.95 ; 1.15) (0.77 ; 0.97)
Birth Year 1996(19.1 ; 41.4) (0.77 ; 1.08) (0.75 ; 0.90) (0.85 ; 1.07)
(-76.1 ; -49.6) (1.48 ; 2.18) (1.39 ; 1.72) (0.99 ; 1.31)
(-18.0 ; 19.7) (0.54 ; 0.91) (0.73 ; 0.98) (1.04 ; 1.49)
Maternal age 25 - 29(-2.9 ; 25.3) (0.91 ; 1.42) (0.84 ; 1.08) (1.06 ; 1.44)
(7.8 ; 45.8) (1.10 ; 1.86) (0.79 ; 1.10) (1.63 ; 2.32)
Not married(-77.4 ; -44.9) (1.33 ; 2.03) (1.27 ; 1.62) (1.62 ; 2.18)
(13.4 ; 40.0) (0.63 ; 0.97) (0.75 ; 0.95) (0.78 ; 1.05)
11.2 1.13 0.95
26.7 0.78 0.84
26.8 1.43 0.93
-61.2 1.64 1.43
1.55
0.9 0.70 0.85
1.24
-149.2 1.77 1.05 0.87
30.2 0.91 0.82
-62.9 1.80
1.94
1.88
0.90
Weight LBW IUGR Prematurity
0.96
1.14
1.24
Education below secondary
Maternal age 30 and more
Married above 10 years
Maternal age below 20
Category
Birth season :
Spring(-5.2 ; 27.1) (0.87 ; 1.40) (0.81 ; 1.06) (0.91 ; 1.26)
Summer(-6.1 ; 25.8) (0.76 ; 1.24) (0.83 ; 1.09) (0.85 ; 1.18)
Autumn(-15.4 ; 16.1) (0.76 ; 1.24) (0.87 ; 1.14) (0.74 ; 1.03)
City of birth vs. Cracow:
Lodz(-68.5 ; -38.5) (0.95 ; 1.46) (1.23 ; 1.57) (1.05 ; 1.44)
Poznan(-21.5 ; 10.3) (0.80 ; 1.31) (0.93 ; 1.23) (1.18 ; 1.64)
Wroclaw(39.3 ; 71.3) (0.55 ; 0.91) (0.74 ; 0.99) (0.92 ; 1.30)
Weight LBW IUGR Prematurity
11.0 1.10 0.93 1.07
9.9 0.97 0.95 1.00
0.3 0.97 0.99 0.87
-53.5 1.17 1.39 1.23
-5.6 1.02 1.07 1.39
55.3 0.71 0.85 1.10
Birth outcomes by the variables included in the models

Dose response curves for association between mean birth weight and BS during 1st trimester of pregnancy

Dose response curves for association between risk of low birth weight and SO2 and BS during 1st and 3rd trimester of
pregnancy in Lodz

Dose response curves for association between risk of IUGR and SO2 and BS during 1st and 3rd trimester of pregnancy in
Lodz

Dose response curves for association between mean birth weight and SO2 and BS during 1st and 3rd trimester of
pregnancy in Lodz

Dose response curves for association between risk of premature birth and SO2 during 1st trimester of pregnancy
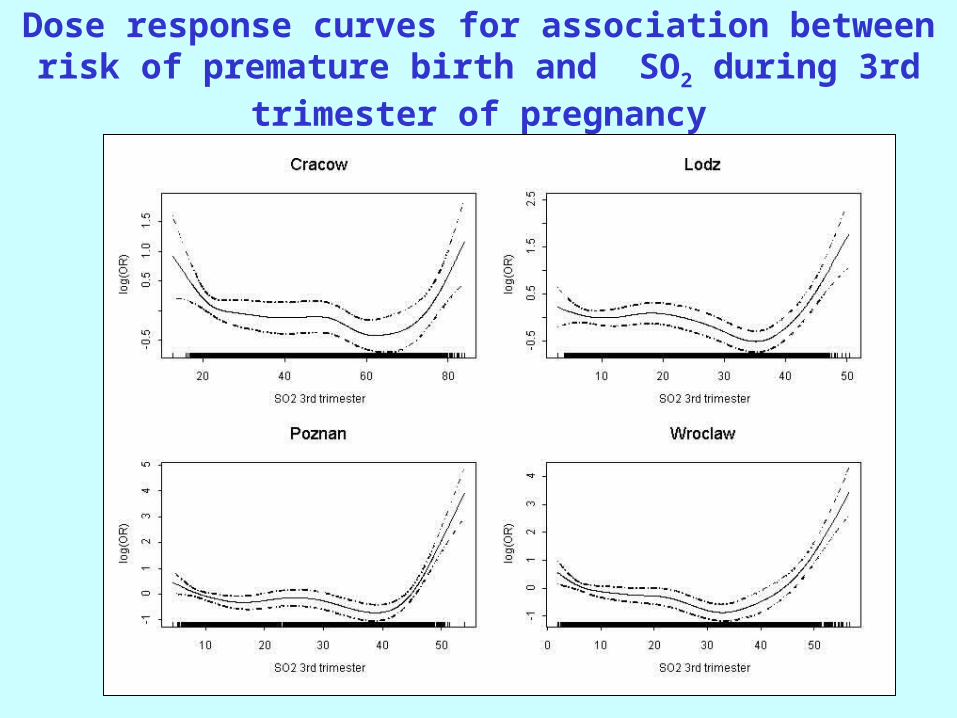
Dose response curves for association between risk of premature birth and SO2 during 3rd trimester of pregnancy

Risk of premature birth associated with 10mg/m3 increase in ambient SO2 concentration during 3rd trimester of
pregnancy
City
SO2
range
(g/m3)
OR
Cracow 0-40 0.904 0.717 1.13940+ 0.952 0.862 1.052
Lodz 0-40 0.867 0.763 0.98540+ 1.069 0.981 1.166
Poznan 0-40 0.924 0.802 1.06440+ 1.035 0.947 1.130
Wroclaw 0-40 0.819 0.703 0.95440+ 1.174 1.072 1.284
Meta 0-40 0.875 0.811 0.94440+ * 1.056 0.974 1.146
95% C.I.
* Random effect model
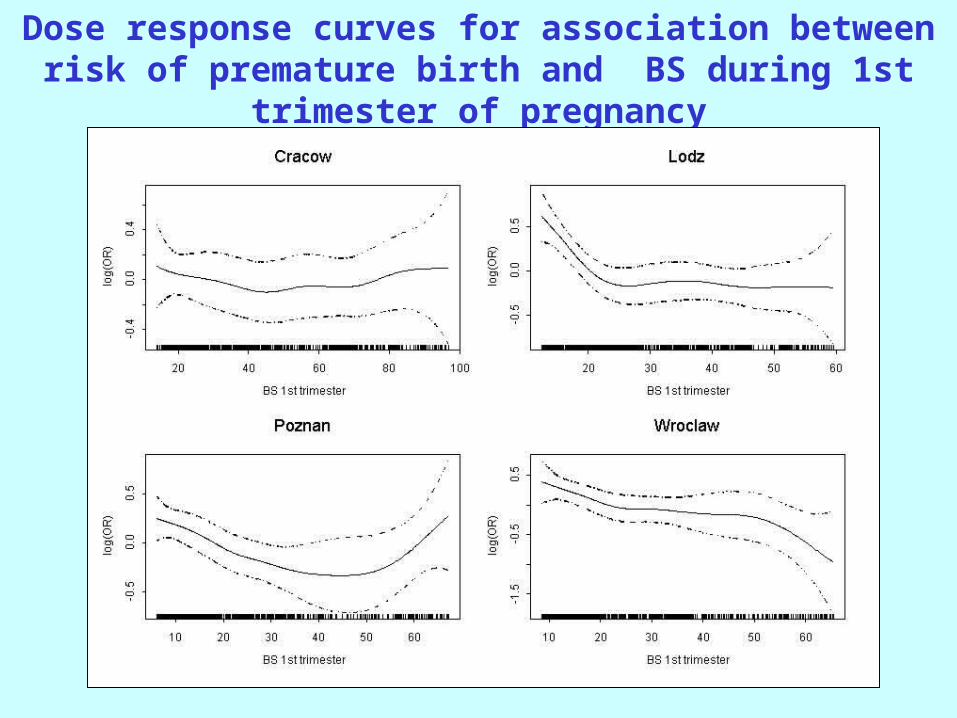
Dose response curves for association between risk of premature birth and BS during 1st trimester of pregnancy

Dose response curves for association between risk of premature birth and BS during 3rd trimester of pregnancy

Risk of premature birth associated with 10g/m3 increase in ambient BS concentration during 3rd
trimester of pregnancy
CityBS range
(g/m3)OR
Cracow 0-50 1.073 0.933 1.23350+ 1.022 0.960 1.088
Lodz 0-50 1.058 0.948 1.18050+ 1.104 1.021 1.194
Poznan 0-50 1.008 0.896 1.13350+ 1.074 1.007 1.146
Wroclaw 0-50 1.074 0.932 1.23650+ 1.148 1.055 1.249
Meta 0-50 1.049 0.986 1.11750+ 1.076 1.038 1.115
95% C.I.

CONCLUSIONSCONCLUSIONS
In Polish urban population:In Polish urban population:
• Ambient air pollution was not found Ambient air pollution was not found a a significant risk factor of fetal significant risk factor of fetal
growthgrowth
• Air pollution with black Air pollution with black smoke was smoke was found a significant risk found a significant risk factor of factor of
premature birthpremature birth