AMAP Assessment 2018: Arctic Ocean Acidification...AMAP Assessment 2018: Arctic Ocean Acidifi...
35
Arctic Monitoring and Assessment Programme (AMAP) AMAP Assessment 2018: Arctic Ocean Acidification
Transcript of AMAP Assessment 2018: Arctic Ocean Acidification...AMAP Assessment 2018: Arctic Ocean Acidifi...

AM
AP A
ssessment 2018: A
rctic Ocean A
cidifi cation
AMAP Secretariat
The Fram Centre,Box 6606 Langnes,9296 Tromsø, Norway
T +47 21 08 04 80F +47 21 08 04 85
www.amap.no
ISBN – 978-82-7971-107-0
Arctic Monitoring and Assessment Programme (AMAP)
AMAP Assessment 2018:Arctic Ocean Acidification
Educational use: � is report (in part or in its entirety) and other AMAP products available from www.amap.no can be used freely as teaching materials and for other educational purposes.
� e only condition of such use is acknowledgement of AMAP as the source of the material according to the recommended citation.
In case of questions regarding educational use, please contact the AMAP Secretariat ([email protected]).
Note: � is report may contain material (e.g. photographs) for which permission for use will need to be obtained fromoriginal copyright holders.
Disclaimer: � e views expressed in this peer-reviewed report are the responsibility of the authors of the report and do not necessarily refl ect the views of the Arctic Council, its members or its observers.

Arctic Monitoring and Assessment Programme (AMAP)Tromsø, 2018
AMAP Assessment 2018:Arctic Ocean Acidification

AMAP Assessment 2018: Arctic Ocean Acidification
ISBN – 978-82-7971-107-0
© Arctic Monitoring and Assessment Programme, 2018
Citing whole reportAMAP, 2018. AMAP Assessment 2018: Arctic Ocean Acidification. Arctic Monitoring and Assessment Programme (AMAP), Tromsø, Norway. vi+187pp
Citing individual chapters[Lead author list], 2018. [Chapter title]. In: AMAP Assessment 2018: Arctic Ocean Acidification. pp. [xx-yy] Arctic Monitoring and Assessment Programme (AMAP), Tromsø, Norway.
Published byArctic Monitoring and Assessment Programme (AMAP), Tromsø, Norway (www.amap.no)
OrderingThis report can be ordered from the AMAP Secretariat, The Fram Centre, P.O. Box 6606 Langnes, N-9296 Tromsø, NorwayThis report is also published as an electronic document, available from the AMAP website at www.amap.no
Production
Production managementJan René Larsen (AMAP Secretariat)
EditingCarolyn Symon ([email protected])
Layout and technical productionBurnthebook, United Kingdom (www.burnthebook.co.uk)
Design and production of computer graphicsJane White ([email protected])
Cover photographTrawler before an iceberg in Disko Bay, Ilulissat, Greenland. Agencja Fotograficzna Caro / Alamy Stock Photo
PrintingNarayana Press, Gylling, DK-8300 Odder, Denmark (www.narayanapress.dk)
AMAP Heads of Delegation (in the project period)Marianne Kroglund (Chair, Norway), Sarah Kalhok (Canada), Russell Shearer (Canada), Morten S. Olsen (Vice-chair [Chair 2013-2015], Kingdom of Denmark), Mikala Klint (Kingdom of Denmark), Maria Dam (Kingdom of Denmark), Nathia Hass Brandtberg (Kingdom of Denmark), Martin Forsius (Vice-chair [Chair 2015-2017], Finland), Outi Mähönen (Finland), Sigurrós Friðriksdóttir (Iceland), Helgi Jensson (Iceland), Ingunn Lindeman (Norway), Tove Lundeberg (Vice-chair, Sweden), Yuri Tsaturov (Vice-Chair, Russia), Alexander Klepikov (Russia), Vyacheslav Shpinkov (Russia), Tom Armstrong (United States), Benjamin DeAngelo (United States), Michael Kuperberg (United States), Jeremy Mathis (United States), Eva Kruemmel (Inuit Circumpolar Council), Jannie Staffansson (Saami Council), Bob van Dijken (Arctic Athabaskan Council)
AMAP SecretariatRolf Rødven, Jan René Larsen, Jon L. Fuglestad, Simon Wilson, Janet Pawlak, Inger Utne
Arctic Council Member States and Permanent Participants of the CouncilCanada, Kingdom of Denmark (Denmark/Greenland/Faroe Islands), Finland, Iceland, Norway, Russia, Sweden, United States, Aleut International Association (AIA), Arctic Athabaskan Council (AAC), Gwitch’in Council International (GCI), Inuit Circumpolar Council (ICC), Russian Association of Indigenous Peoples of the North (RAIPON), Saami Council
ii AMAP Assessment 2018: Arctic Ocean Acidification

Contents
Acknowledgments . . . . . . . . . . . . . . . . . . . . . . . . . . . . . . . . . . . . . . . . . . . . . . . . . . . . . . . . . . . . . . . . . . . . . . . . . . . . . . . . . . . . . . . . . . . . . . . . . . . . iv
Preface . . . . . . . . . . . . . . . . . . . . . . . . . . . . . . . . . . . . . . . . . . . . . . . . . . . . . . . . . . . . . . . . . . . . . . . . . . . . . . . . . . . . . . . . . . . . . . . . . . . . . . . . . . . . . . . . . . . v
1. Introduction . . . . . . . . . . . . . . . . . . . . . . . . . . . . . . . . . . . . . . . . . . . . . . . . . . . . . . . . . . . . . . . . . . . . . . . . . . . . . . . . . . . . . . . . . . . . . . . . . . . . . . . . . 1
2. Arctic Ocean acidification: an update . . . . . . . . . . . . . . . . . . . . . . . . . . . . . . . . . . . . . . . . . . . . . . . . . . . . . . . . . . . . . . . . . . . . . . . . . 32.1 Introduction . . . . . . . . . . . . . . . . . . . . . . . . . . . . . . . . . . . . . . . . . . . . . . . . . . . . . . . . . . . . . . . . . . . . . . . . . . . . . . . . . . . . . . . . . . . . . . . . . . . . . . . . . 32.2 Marine carbonate system and ocean acidification in the regional seas and basins . . . . . . . . . . . . . . . . . . . . . . . . . . . . . . . . . . . . . 5
2.2.1 The Western Eurasian Shelves . . . . . . . . . . . . . . . . . . . . . . . . . . . . . . . . . . . . . . . . . . . . . . . . . . . . . . . . . . . . . . . . . . . . . . . . . . . . . . . . . . . . . . 52.2.2 Alaska, Bering, and Chukchi sectors . . . . . . . . . . . . . . . . . . . . . . . . . . . . . . . . . . . . . . . . . . . . . . . . . . . . . . . . . . . . . . . . . . . . . . . . . . . . . . . . 72.2.3 Central Arctic Ocean . . . . . . . . . . . . . . . . . . . . . . . . . . . . . . . . . . . . . . . . . . . . . . . . . . . . . . . . . . . . . . . . . . . . . . . . . . . . . . . . . . . . . . . . . . . . . . 82.2.4 Canada Basin and Beaufort Shelf . . . . . . . . . . . . . . . . . . . . . . . . . . . . . . . . . . . . . . . . . . . . . . . . . . . . . . . . . . . . . . . . . . . . . . . . . . . . . . . . . . . . 82.2.5 Canadian Polar Shelf, Baffin Bay, Davis Strait and the West Greenland regions . . . . . . . . . . . . . . . . . . . . . . . . . . . . . . . . . . . . . . . . . . . . 82.2.6 Greenland, Iceland and Norwegian seas . . . . . . . . . . . . . . . . . . . . . . . . . . . . . . . . . . . . . . . . . . . . . . . . . . . . . . . . . . . . . . . . . . . . . . . . . . . . . 9
2.3 Projections of Arctic ocean acidification . . . . . . . . . . . . . . . . . . . . . . . . . . . . . . . . . . . . . . . . . . . . . . . . . . . . . . . . . . . . . . . . . . . . . . . . . . . . . 122.4 Conclusions and recommendations . . . . . . . . . . . . . . . . . . . . . . . . . . . . . . . . . . . . . . . . . . . . . . . . . . . . . . . . . . . . . . . . . . . . . . . . . . . . . . . . . 14
3. Biological responses to ocean acidification . . . . . . . . . . . . . . . . . . . . . . . . . . . . . . . . . . . . . . . . . . . . . . . . . . . . . . . . . . . . . . . . 153.1 Introduction . . . . . . . . . . . . . . . . . . . . . . . . . . . . . . . . . . . . . . . . . . . . . . . . . . . . . . . . . . . . . . . . . . . . . . . . . . . . . . . . . . . . . . . . . . . . . . . . . . . . . . . . 153.2 Responses of key organisms . . . . . . . . . . . . . . . . . . . . . . . . . . . . . . . . . . . . . . . . . . . . . . . . . . . . . . . . . . . . . . . . . . . . . . . . . . . . . . . . . . . . . . . . 15
3.2.1 Viruses . . . . . . . . . . . . . . . . . . . . . . . . . . . . . . . . . . . . . . . . . . . . . . . . . . . . . . . . . . . . . . . . . . . . . . . . . . . . . . . . . . . . . . . . . . . . . . . . . . . . . . . . . 153.2.2 Bacteria and archaea . . . . . . . . . . . . . . . . . . . . . . . . . . . . . . . . . . . . . . . . . . . . . . . . . . . . . . . . . . . . . . . . . . . . . . . . . . . . . . . . . . . . . . . . . . . . . 153.2.3 Phytoplankton . . . . . . . . . . . . . . . . . . . . . . . . . . . . . . . . . . . . . . . . . . . . . . . . . . . . . . . . . . . . . . . . . . . . . . . . . . . . . . . . . . . . . . . . . . . . . . . . . . . 173.2.4 Foraminifera . . . . . . . . . . . . . . . . . . . . . . . . . . . . . . . . . . . . . . . . . . . . . . . . . . . . . . . . . . . . . . . . . . . . . . . . . . . . . . . . . . . . . . . . . . . . . . . . . . . . 173.2.5 Macroalgae . . . . . . . . . . . . . . . . . . . . . . . . . . . . . . . . . . . . . . . . . . . . . . . . . . . . . . . . . . . . . . . . . . . . . . . . . . . . . . . . . . . . . . . . . . . . . . . . . . . . . 183.2.6 Corals . . . . . . . . . . . . . . . . . . . . . . . . . . . . . . . . . . . . . . . . . . . . . . . . . . . . . . . . . . . . . . . . . . . . . . . . . . . . . . . . . . . . . . . . . . . . . . . . . . . . . . . . . . 193.2.7 Mollusks . . . . . . . . . . . . . . . . . . . . . . . . . . . . . . . . . . . . . . . . . . . . . . . . . . . . . . . . . . . . . . . . . . . . . . . . . . . . . . . . . . . . . . . . . . . . . . . . . . . . . . . 203.2.8 Echinoderms . . . . . . . . . . . . . . . . . . . . . . . . . . . . . . . . . . . . . . . . . . . . . . . . . . . . . . . . . . . . . . . . . . . . . . . . . . . . . . . . . . . . . . . . . . . . . . . . . . . . 213.2.9 Crustaceans . . . . . . . . . . . . . . . . . . . . . . . . . . . . . . . . . . . . . . . . . . . . . . . . . . . . . . . . . . . . . . . . . . . . . . . . . . . . . . . . . . . . . . . . . . . . . . . . . . . . . 223.2.10 Other invertebrates . . . . . . . . . . . . . . . . . . . . . . . . . . . . . . . . . . . . . . . . . . . . . . . . . . . . . . . . . . . . . . . . . . . . . . . . . . . . . . . . . . . . . . . . . . . . . 233.2.11 Fishes . . . . . . . . . . . . . . . . . . . . . . . . . . . . . . . . . . . . . . . . . . . . . . . . . . . . . . . . . . . . . . . . . . . . . . . . . . . . . . . . . . . . . . . . . . . . . . . . . . . . . . . . . 243.2.12 Seabirds and mammals . . . . . . . . . . . . . . . . . . . . . . . . . . . . . . . . . . . . . . . . . . . . . . . . . . . . . . . . . . . . . . . . . . . . . . . . . . . . . . . . . . . . . . . . . . 25
3.3 Responses of ecosystems and habitats . . . . . . . . . . . . . . . . . . . . . . . . . . . . . . . . . . . . . . . . . . . . . . . . . . . . . . . . . . . . . . . . . . . . . . . . . . . . . . 253.4 Acclimation and adaptation . . . . . . . . . . . . . . . . . . . . . . . . . . . . . . . . . . . . . . . . . . . . . . . . . . . . . . . . . . . . . . . . . . . . . . . . . . . . . . . . . . . . . . . . . 263.5 Interactive effects in a multi-stressor environment . . . . . . . . . . . . . . . . . . . . . . . . . . . . . . . . . . . . . . . . . . . . . . . . . . . . . . . . . . . . . . . . . . 263.6 Conclusions . . . . . . . . . . . . . . . . . . . . . . . . . . . . . . . . . . . . . . . . . . . . . . . . . . . . . . . . . . . . . . . . . . . . . . . . . . . . . . . . . . . . . . . . . . . . . . . . . . . . . . . . 27Appendix: Manipulative experimental studies . . . . . . . . . . . . . . . . . . . . . . . . . . . . . . . . . . . . . . . . . . . . . . . . . . . . . . . . . . . . . . . . . . . . . . . . . . . 28
4. Socio-economic impacts of Arctic Ocean acidification on fisheries . . . . . . . . . . . . . . . . . . . . . . . . . . . . . . . . . . 434.1 Introduction . . . . . . . . . . . . . . . . . . . . . . . . . . . . . . . . . . . . . . . . . . . . . . . . . . . . . . . . . . . . . . . . . . . . . . . . . . . . . . . . . . . . . . . . . . . . . . . . . . . . . . . . 434.2 Expected effects of ocean acidification on selected Arctic fisheries . . . . . . . . . . . . . . . . . . . . . . . . . . . . . . . . . . . . . . . . . . . . . . . . . . . 43
4.2.1 Norwegian kelp and sea urchins . . . . . . . . . . . . . . . . . . . . . . . . . . . . . . . . . . . . . . . . . . . . . . . . . . . . . . . . . . . . . . . . . . . . . . . . . . . . . . . . . . . 434.2.2 Barents Sea cod . . . . . . . . . . . . . . . . . . . . . . . . . . . . . . . . . . . . . . . . . . . . . . . . . . . . . . . . . . . . . . . . . . . . . . . . . . . . . . . . . . . . . . . . . . . . . . . . . 444.2.3 The Greenland shrimp fishery . . . . . . . . . . . . . . . . . . . . . . . . . . . . . . . . . . . . . . . . . . . . . . . . . . . . . . . . . . . . . . . . . . . . . . . . . . . . . . . . . . . . . 444.2.4 Alaska’s fishery sector . . . . . . . . . . . . . . . . . . . . . . . . . . . . . . . . . . . . . . . . . . . . . . . . . . . . . . . . . . . . . . . . . . . . . . . . . . . . . . . . . . . . . . . . . . . . 464.2.5 The Western Canadian Arctic . . . . . . . . . . . . . . . . . . . . . . . . . . . . . . . . . . . . . . . . . . . . . . . . . . . . . . . . . . . . . . . . . . . . . . . . . . . . . . . . . . . . . . 46
4.3 Ocean acidification, Arctic fisheries, and other factors . . . . . . . . . . . . . . . . . . . . . . . . . . . . . . . . . . . . . . . . . . . . . . . . . . . . . . . . . . . . . . 474.4 Understanding and action under uncertainty . . . . . . . . . . . . . . . . . . . . . . . . . . . . . . . . . . . . . . . . . . . . . . . . . . . . . . . . . . . . . . . . . . . . . . . . 474.5 Mitigation and adaptation options . . . . . . . . . . . . . . . . . . . . . . . . . . . . . . . . . . . . . . . . . . . . . . . . . . . . . . . . . . . . . . . . . . . . . . . . . . . . . . . . . . 484.6 Summary . . . . . . . . . . . . . . . . . . . . . . . . . . . . . . . . . . . . . . . . . . . . . . . . . . . . . . . . . . . . . . . . . . . . . . . . . . . . . . . . . . . . . . . . . . . . . . . . . . . . . . . . . . . 48
5. Conclusions, knowledge gaps and recommendations . . . . . . . . . . . . . . . . . . . . . . . . . . . . . . . . . . . . . . . . . . . . . . . . . . . 495.1 Overview . . . . . . . . . . . . . . . . . . . . . . . . . . . . . . . . . . . . . . . . . . . . . . . . . . . . . . . . . . . . . . . . . . . . . . . . . . . . . . . . . . . . . . . . . . . . . . . . . . . . . . . . . . . 495.2 Knowledge gaps . . . . . . . . . . . . . . . . . . . . . . . . . . . . . . . . . . . . . . . . . . . . . . . . . . . . . . . . . . . . . . . . . . . . . . . . . . . . . . . . . . . . . . . . . . . . . . . . . . . . 505.3 Recommendations . . . . . . . . . . . . . . . . . . . . . . . . . . . . . . . . . . . . . . . . . . . . . . . . . . . . . . . . . . . . . . . . . . . . . . . . . . . . . . . . . . . . . . . . . . . . . . . . . 50
References . . . . . . . . . . . . . . . . . . . . . . . . . . . . . . . . . . . . . . . . . . . . . . . . . . . . . . . . . . . . . . . . . . . . . . . . . . . . . . . . . . . . . . . . . . . . . . . . . . . . . . . . . . . . . 51
iii

Annex 1 Export of calcium carbonate under-saturated waters from the Arctic Ocean to the North Atlantic . . . . . . . . . . . . . . . . . . . . . . . . . . . . . . . . . . . . . . . . . . . . . . . . . . . . . . . 67
Annex 2 Urchin harvesting and kelp regrowth in northern Norway under ocean acidification and warming . . . . . . . . . . . . . . . . . . . . . . . . . . . . . . . . . . . . . . . . . . . . . . . . . . . . . . . . . . . . . 79
Annex 3 Ocean services for the Barents Sea – socio-economic effects of ocean warming and acidification on the Northeast Arctic cod fishery . . . . . . . . . . . . . . . . . . . . . . . . . . . . . . . . . . . . . . . . . . . 91
Annex 4 The Greenland shrimp (Pandalus borealis) fishery . . . . . . . . . . . . . . . . . . . . . . . . . . . . . . . . . . . . . . . . . . . . . . . 101
Annex 5 Ocean acidification risk assessment for Alaska’s fishery sector . . . . . . . . . . . . . . . . . . . . . . . . . . . . . 129
Annex 6 Changing ocean impacts on the key forage fish species Arctic cod in the Western Canadian Arctic - Linking climate model projections to subsistence fisheries . . . . . . . . . . . 151
Acronyms and abbreviations . . . . . . . . . . . . . . . . . . . . . . . . . . . . . . . . . . . . . . . . . . . . . . . . . . . . . . . . . . . . . . . . . . . . . . . . . . . . . . . . . . . . . 187
Acknowledgments
Leif G. Anderson, Kumiko Azetsu-Scott, Richard Bellerby, AnnDorte Burmeister, Wenting Chen, William W.L. Cheung, Melissa Chierici, Hartvig Christie, Jessica Cross, Andres Cisneros-Montemayor, Trine Dale, Helen Drost, Sam Dupont, Camilla Fagerli, Laura J. Falkenberg, Agneta Fransson, Kasper Hancke, Martin C. Hänsel, Carie Hoover, Henry P. Huntington, Anders Jelmert, Brooks A. Kaiser, Jennifer Lam, Jan René Larsen, Felix C. Mark, Jeremy Mathis, Lorenz Meire, Lisa Miller, Mark Nicholls, Magnus Norling, Jón Ólafsson, Emily B. Osborne, Irina Pipko, Martin F. Quaas, Lars Ravn-Jonsen, Bjoern Rost, Jörn O. Schmidt, Kai G. Schulz, Tessa Sou, Nadja S. Steiner, Martina H. Stiasny, Max T. Stöven, U. Rashid Sumaila, Paul Suprenand, Travis Tai, Peter Thor, David L. VanderZwaag, Rudi Voss, Phil Wallhead
Bold text denotes lead authors
iv AMAP Assessment 2018: Arctic Ocean Acidification

3. Biological responses to ocean acidification
Authors: Laura J. Falkenberg, Anders Jelmert, Felix C. Mark, Bjoern Rost, Kai G. Schulz, Peter Thor
3.1 Introduction
This chapter presents an overview of the current state of understanding regarding potential responses of Arctic species and ecosystems to ocean acidification. The focus of this qualitative literature review is on research conducted within the Arctic region that has been published within the past five years (i.e., since the first AMAP assessment on ocean acidification; see AMAP, 2013). However, for some ecosystem components there is still little information and so these sections have been supplemented by earlier studies and work from other geographical regions (details summarized in the Appendix to this chapter). The key taxonomic groups (viruses, bacteria and archaea, phytoplankton, foraminifera, macroalgae, corals, mollusks, echinoderms, crustaceans, other invertebrates, fishes, and seabirds and mammals), and communities they form, are considered in terms of their responses to ocean acidification, with potential implications for ecosystem-wide and longer-term acclimation and adaptation responses highlighted. It is also identified how ocean acidification may be modified by human activities driving changes in other abiotic characteristics such as temperature, light, nutrient availability, and the biota present. Together, the research reviewed in this chapter highlights the potential complexity of the biological effects of ocean acidification. Despite these varied responses, it does appear that ocean acidification is likely to be sufficient to drive changes in Arctic organisms and ecosystems to an extent that will impact the associated human societies.
3.2 Responses of key organisms
3.2.1 Viruses
Ocean acidification has the potential to affect viruses both directly via effects on the organism, and indirectly via effects on the host or species affecting the host. In the context of direct effects, the impact of ocean acidification has been found to be limited for many aquatic viruses; marine virus isolates have been quite stable in terms of particle decay and loss of infectivity over the range of pH associated with near-future ocean acidification (Crawfurd et al., 2017). Moreover, ocean acidification has had no direct effect on viral replication cycles (Tsiola et al., 2017), growth cycles (Maat et al., 2014), abundances (Rochelle-Newall et al., 2004; Celussi et al., 2017), lysis (Carreira et al., 2013; Maat et al., 2014), or burst size (a term describing lytic infections, number of phages per cell; Carreira et al., 2013). It is worth noting, however, that there have been some instances of ocean acidification affecting viruses. The diverse responses could reflect differences between the organisms or populations considered in the experimental protocols used, or other environmental conditions modified in combination with ocean acidification (discussed further in Section 3.5). An example of a virus responding to acidification was identified where burst size
decreased with decreasing pH (although this was likely to be an indirect result of reduced host growth rate with decreasing pH; Traving et al., 2013). In contrast, increasing burst size has also been linked with decreasing pH (along with slightly delayed lysis) (Carreira et al., 2013). In addition, there has been a report of reduced viral abundances under elevated partial pressure of carbon dioxide (pCO2) (350 v 700 v 1050 µatm) in a mesocosm experiment conducted in Raunefjorden outside Bergen, Norway (Larsen et al., 2008).
Ocean acidification may have indirect effects by modifying interactions between viruses and the organisms they infect. In non-Arctic environments, decreasing pH has been found to influence the infection capacity of a cyanobacterial virus and its infection cycle (e.g., eclipse period, latent period), potentially modifying the effect of viruses on their hosts (Traving et al., 2013; Chen et al., 2015). Moreover, where viral population sizes or abundances are modified (either due to direct effects on the viruses, or indirect effects mediated by the hosts) (e.g., Larsen et al., 2008), this could affect Arctic ecosystems by modifying the marine pelagic food web.
3.2.2 Bacteria and archaea
Many of the studies highlighting potential responses of Arctic bacteria to ocean acidification come from the EPOCA (European Project on Ocean Acidification) 2010 Arctic campaign. This campaign included a large-scale in situ pelagic mesocosm study of nine experimental units within which a complex array of organisms were held and a range of pCO2
treatments were applied. The mesocosms were deployed in Kongsfjorden whose waters are Atlantic dominated (detail in Riebesell et al., 2013). In terms of bacterial functioning, here increased pCO2 was found to have no effect on processes related to bacterial carbon metabolism such as respiration, carbon demand, and growth efficiency (Motegi et al., 2013). Experiments subsequently conducted during June 2012 in the Arctic, specifically in the Baltic Sea at Tvärminne Storfjärden on the southwestern coast of Finland, have indicated no consistent pCO2 effect on bacterial protein production, cell-specific bacterial protein production, or biovolumes of either free-living or particle-associated heterotrophic bacteria when considered as individual components in univariate analyses (Hornick et al., 2017). In the EPOCA experiments, increased pCO2 did, however, lead to an increase in the extracellular enzyme activity of β-glucosidase (which catalyzes hydrolysis of glycosidic bonds) and leucine-aminopeptidase (which catalyzes hydrolysis of leucine residues at the N-terminus of peptides and proteins) (Piontek et al., 2013). A later study revealed an optimal pH of below 6 for β-glucosidase and of between 6.7 and 7.6 for leucine-aminopeptidase. That these optima are below current seawater pH of the study region indicates that there may be modified hydrolytic activity within bacteria under future ocean acidification (Piontek et al., 2015).
15

Communities of pelagic bacteria have been considered in the context of ocean acidification. In the EPOCA experiments, the bacterial community attached to particles was found to be more diverse at higher pCO2 conditions (Sperling et al., 2013). In contrast, where bacterioplankton characteristics such as diversity, taxonomic richness and community structure were considered in these experiments, they were found to be influenced principally by variation in primary production under ocean acidification rather than direct effects of pCO2 (Zhang et al., 2013). An additional study recently conducted in the Arctic Ocean (Svalbard) supports this finding; the application of phylogenetic molecular ecological networks identified that elevated pCO2 did not affect microbial community structure or succession (Wang et al., 2016) (but see Hornick et al., 2017 for results suggesting microbial community composition and complex trophic interactions may be altered under a future acidified ocean). Within the EPOCA results there was, however, a negative correlation between abundance of the phylum Bacteroidetes and pCO2 by the end of the experiment (Zhang et al., 2013). Where lower bacterial abundances were identified at increased pCO2, this was suggested to be an effect of higher rates of viral lysis (Brussaard et al., 2013). Analysis of rare bacterial taxa identified 15 taxa correlated with pCO2 treatment and, in contrast to the result noted above, most of these increased in abundance with higher pCO2 (i.e., a positive correlation) (Roy et al., 2013). Together, the results of these different studies indicate the potentially varied responses that may be observed in Arctic pelagic bacterial communities experiencing ocean acidification.
Arctic marine surface sediments contain active bacterial communities that can respond to surrounding environmental conditions. In terms of their diversity/similarity, it has been found that these communities may show very little difference
between pCO2 treatments – it was only when the highest and lowest treatments were considered (380 v 3000 µatm) that significant differences were evident. Specifically, there were increases in the abundances of operational taxonomic units most closely related to Halobacteria and differences in the presence/absence structure of the Planctomycetes. In addition, the relative abundance of members of the classes Planctomycetacia and Nitrospira increased with increasing pCO2 concentration (Tait et al., 2013). A subsequent study showed similar patterns; following exposure of sediment cores to experimental pCO2 conditions, increased pCO2 led to an increase in the abundance of Planctomycete-specific 16S rRNA (the vast majority of which grouped with known ammamox bacteria). There was, however, no change to the abundance of bacterial amoA genes (which encode the active site of the enzyme ammonia monooxygenase), but the abundance of archaeal amoA transcripts was reduced accompanied by a shift in the composition of the active community which could have broader ecosystem-level consequences. These results suggest bacteria and archaea have different pH optima, potentially meaning that their activities and role in the nitrogen cycle may be differentially affected by ocean acidification (Tait et al., 2014).
When the effects of ocean acidification on under-ice bacteria in the Arctic have been investigated results indicated that increased pCO2 may have little effect on dominant taxa, although diversity may be reduced in some orders (Monier et al., 2014).
There have been relatively few studies considering the responses of archaea to ocean acidification, yet they represent 10–40% of picoplankton in the Arctic (Kirchman et al., 2007). The few studies that do exist indicate that archaea may be relatively unaffected by ocean acidification (Hassenrück et al., 2016; Currie et al., 2017). As noted above, however, the abundance
Scientists sampling mesocosms during an outdoor experiment investigating the reactions of marine organisms to ocean acidification at Kongsfjord, Ny-Alesund, Svalbard.
Maike Nicolai
16 AMAP Assessment 2018: Arctic Ocean Acidification

of archaeal amoA transcripts may be reduced under ocean acidification, a change accompanied by a shift in the composition of the active community (Tait et al., 2014).
3.2.3 Phytoplankton
The effects of ocean acidification on phytoplankton have mostly been studied in single species laboratory experiments covering major functional groups including silicifying diatoms (Pancic et al., 2015; Heiden et al., 2016; Wolf et al., 2018), calcium carbonate-producing coccolithophores (Sett et al., 2014; Kottmeier et al., 2016), nitrogen-fixing cyanobacteria (Fu et al., 2007), and chlorophytes (Maat et al., 2014; García-Gómez et al., 2016). The focus of these experiments is typically on key physiological aspects such as carbon fixation, calcification, growth or nitrogen fixation rates, but also extends to trace gas production or modes of inorganic carbon acquisition (e.g., Fu et al., 2007; Sett et al., 2014; Pancic et al., 2015; García-Gómez et al., 2016; Heiden et al., 2016; Kottmeier et al., 2016; Webb et al., 2016; Wolf et al., 2018). Overall, Arctic and subarctic phytoplankton communities seem to be comparatively resilient to ocean acidification with no significant change in net primary production and little change in species composition under enriched scenarios up to 1000 µatm pCO2 (Hoppe et al., 2017, 2018). When effects of ocean acidification are found small picoeukaryotes seem to benefit (Davidson et al., 2016; Hussherr et al., 2017), whereas haptophytes (including coccolithophores) are typically negatively impacted (Yoshimura et al., 2013; Thoisen et al., 2015), and varying responses are observed in diatoms (Coello-Camba et al., 2014; Hoppe et al., 2017, 2018) and the cyanobacterium Synechococcus (e.g., Schulz et al., 2017 and references therein; Segovia et al., 2017). This general pattern was also reported in a recent review with global coverage and, given the multitude of experimental approaches and designs incorporated, appears to be a robust finding (Schulz et al., 2017).
Where species-specific responses to ocean acidification are observed, the composition of phytoplankton communities are expected to shift significantly, potentially modifying interactions with other ecosystem components (further details on species interactions can be found in Section 3.3). Interactions that can be modified include those associated with trophic links. That is, where phytoplankton biochemical composition is modified this may alter the quality of food through which energy is transferred to higher trophic levels. There have been reports that ocean acidification decreased polyunsaturated fatty acid (PUFA) concentrations in phytoplankton which resulted in a reduction of these essential components in copepods, negatively impacting somatic growth (e.g., Bermudez et al., 2016a) and egg production (e.g., Rossoll et al., 2012). However, no effect on phytoplankton (Bermudez et al., 2016b), and positive effects on mesozooplankton PUFA content have also been found (Wang et al., 2017), as have increases in zooplankton biomass; these changes were most likely to have been driven by ocean acidification induced changes in phytoplankton community structure (e.g., Taucher et al., 2017). As none of these experiments were conducted in high latitude waters, and given the range of responses (also compare, for example, Cripps et al., 2016 and Garzke et al., 2016), the impacts of ocean acidification on phytoplankton-zooplankton interactions in the Arctic remain poorly understood.
3.2.4 Foraminifera
Assemblages of planktonic foraminifera in the Arctic are typically dominated by the species Neogloboquadrina pachyderma. When experimentally exposed to increased pCO2, this species has been found to show no response in terms of survival, but individuals have smaller shell diameters (Manno et al., 2012). Several Globigerina species are also found in these Arctic phytoplankton assemblages. One of them, G. bulloides, was experimentally exposed to lower seawater pH which was associated with decreased shell calcification and repair of spines (along with oxygen consumption) (Davis et al., 2017).
Benthic foraminifera in a range of environments, from fjords to coral reefs, have shown diverse responses to ocean acidification. For example, in terms of survival, while some studies have found acidification is likely to have no effect (McIntyre-Wressnig et al., 2013, 2014), reduced survival has also been identified in another study (Marques et al., 2017). The reason for these differences can reflect either physiological differences or differences in experimental design (e.g., scale of experiments, season conducted, study location). Other processes considered for benthic foraminifera under ocean acidification include growth, which has sometimes been found to be decreased (Sinutok et al., 2011), but may also remain unchanged (McIntyre-Wressnig et al., 2013; Prazeres et al., 2015). Where changes are observed, these are likely to be influenced by modifications in other physiological processes, as can be indicated by increased net oxygen production (Uthicke and Fabricius, 2012), the reduced rate of oxygen production (Sinutok et al., 2011), increased respiration (Uthicke and Fabricius, 2012), reduced Ca2+-ATPase activity (Marques et al., 2017), inhibition of Mg-ATPase (Prazeres et al., 2015), increases of both Ca-ATPase and Mg-ATPase activities (Prazeres et al., 2015), or declines in photosynthetic processes (Sinutok et al., 2011).
A range of organism characteristics has been considered in connection with the shells of benthic foraminifera under ocean acidification. Calcification has been found to be reduced (Fujita et al., 2011; Sinutok et al., 2011; Uthicke and Fabricius, 2012; Reymond et al., 2013), remain unchanged (Vogel and Uthicke, 2012), and even increase (Vogel and Uthicke, 2012) where pCO2 is manipulated. The shells that exist under ocean
The planktonic foraminifera Neogloboquadrina pachyderma.
Han
nes G
robe
/AW
I
17Chapter 3 · Biological responses to ocean acidification
acidification may have reduced weight (Dissard et al., 2010), smaller diameter (Haynert and Schönfeld, 2014; Marques et al., 2017), modified chemical composition (Dissard et al., 2010; Robbins et al., 2017), reduced density of inner chambers (Prazeres et al., 2015) (but see Prazeres et al., 2015 for an example of no change in a second species), reduction and deformation of ornamentation (Khanna et al., 2013), and increased pseudopore area (Knorr et al., 2015). That foraminifera can form under acidified conditions is no assurance of their persistence, with some studies indicating that dissolution can increase under acidification (Khanna et al., 2013; McIntyre-Wressnig et al., 2013), potentially reducing the number of tests (Haynert and Schönfeld, 2014).
Effects of ocean acidification on particular foraminifera have the potential to combine to modify overall communities. Such potential has been illustrated in a study of a volcanic vent system in Italy where pCO2 is enriched near the vents, and which has revealed marked foraminiferal distribution and diversity change along a gradient of pH (Dias et al., 2010). Arctic communities may shift in similar ways under ocean acidification (see further detail on species interactions in Section 3.3).
3.2.5 Macroalgae
3.2.5.1 Calcifying macroalgae
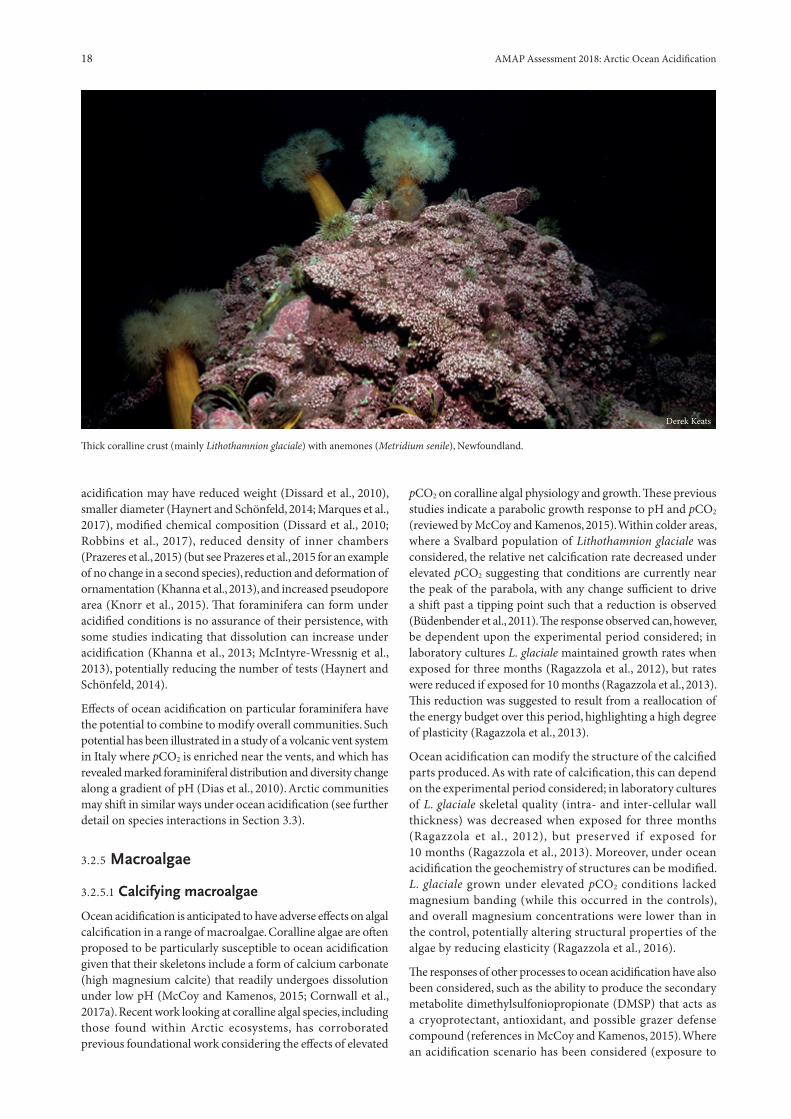
Ocean acidification is anticipated to have adverse effects on algal calcification in a range of macroalgae. Coralline algae are often proposed to be particularly susceptible to ocean acidification given that their skeletons include a form of calcium carbonate (high magnesium calcite) that readily undergoes dissolution under low pH (McCoy and Kamenos, 2015; Cornwall et al., 2017a). Recent work looking at coralline algal species, including those found within Arctic ecosystems, has corroborated previous foundational work considering the effects of elevated
pCO2 on coralline algal physiology and growth. These previous studies indicate a parabolic growth response to pH and pCO2 (reviewed by McCoy and Kamenos, 2015). Within colder areas, where a Svalbard population of Lithothamnion glaciale was considered, the relative net calcification rate decreased under elevated pCO2 suggesting that conditions are currently near the peak of the parabola, with any change sufficient to drive a shift past a tipping point such that a reduction is observed (Büdenbender et al., 2011). The response observed can, however, be dependent upon the experimental period considered; in laboratory cultures L. glaciale maintained growth rates when exposed for three months (Ragazzola et al., 2012), but rates were reduced if exposed for 10 months (Ragazzola et al., 2013). This reduction was suggested to result from a reallocation of the energy budget over this period, highlighting a high degree of plasticity (Ragazzola et al., 2013).
Ocean acidification can modify the structure of the calcified parts produced. As with rate of calcification, this can depend on the experimental period considered; in laboratory cultures of L. glaciale skeletal quality (intra- and inter-cellular wall thickness) was decreased when exposed for three months (Ragazzola et al., 2012), but preserved if exposed for 10 months (Ragazzola et al., 2013). Moreover, under ocean acidification the geochemistry of structures can be modified. L. glaciale grown under elevated pCO2 conditions lacked magnesium banding (while this occurred in the controls), and overall magnesium concentrations were lower than in the control, potentially altering structural properties of the algae by reducing elasticity (Ragazzola et al., 2016).
The responses of other processes to ocean acidification have also been considered, such as the ability to produce the secondary metabolite dimethylsulfoniopropionate (DMSP) that acts as a cryoprotectant, antioxidant, and possible grazer defense compound (references in McCoy and Kamenos, 2015). Where an acidification scenario has been considered (exposure to
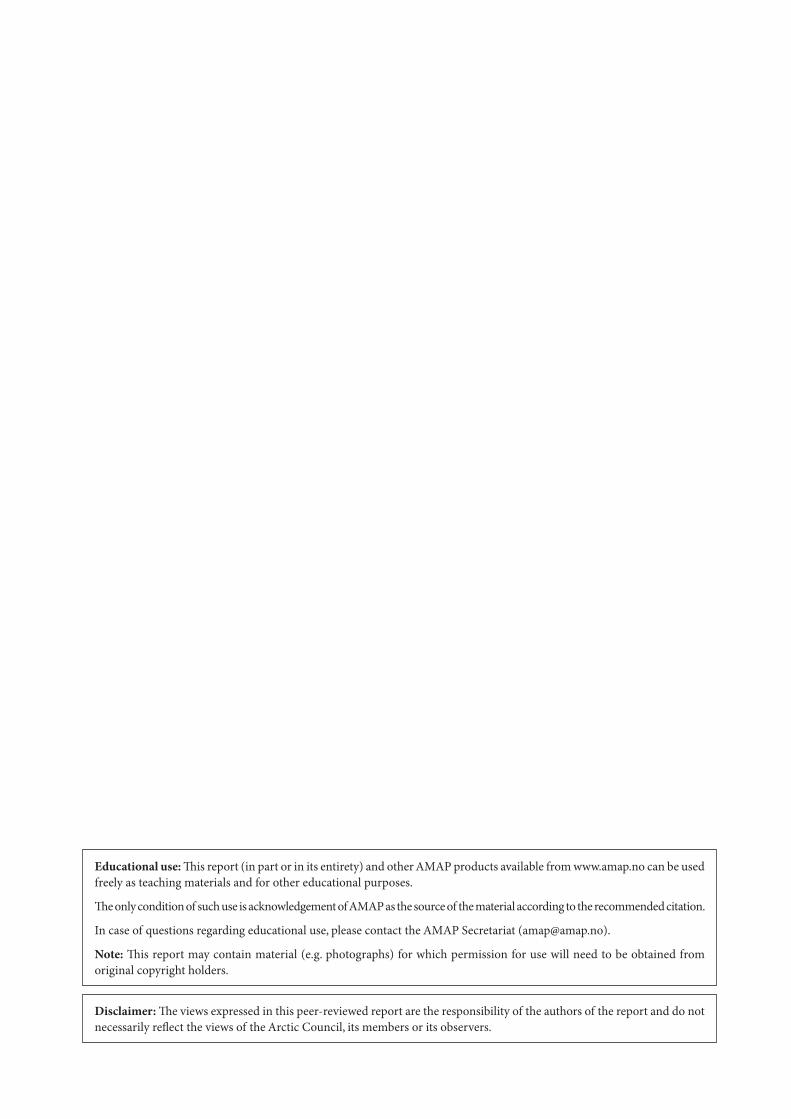
Thick coralline crust (mainly Lithothamnion glaciale) with anemones (Metridium senile), Newfoundland.
Derek Keats
18 AMAP Assessment 2018: Arctic Ocean Acidification

~1080 µatm pCO2), the Arctic algae L. glaciale has shown no change in the production of DMSP (Burdett et al., 2012).
Calcification of brown and green algae has been considered in response to ocean acidification, albeit not in the Arctic. Although brown algae are not obligate calcifiers, they do produce calcium carbonate. A study of temperate and tropical brown algae identified that they showed reductions in calcium carbonate content with CO2 enrichment, yet the algae did increase in abundance (Johnson et al., 2012). Studies on temperate green algae have identified that at high CO2 they are less calcified, less stiff, and droopier; indicating changes in skeletal performance (Newcomb et al., 2015).
3.2.5.2 Non-calcifying macroalgae
Several non-calcifying macroalgae have been shown to benefit from ocean acidification (Hall-Spencer et al., 2008; Koch et al., 2013; Cornwall et al., 2017b). Experimental evidence from geographically diverse studies shows species- and location-specificity in responses (e.g., Hepburn et al., 2011; Falkenberg et al., 2013; Celis-Plá et al., 2015). This variability is likely to be reflected in the responses of species found in the Arctic.
Ocean acidification may modify photosynthesis in macroalgae. Given that most macroalgae use carbon concentrating mechanisms (CCMs) to increase CO2 concentration at the site of photosynthesis, they are unlikely to be carbon-limited under current conditions (Raven et al., 2008; Koch et al., 2013; Cornwall et al., 2017b). The use of CCMs is, however, energetically costly (Raven et al., 2014). An Arctic population of the kelp Saccharina latissima exposed to high pCO2 deactivated CCMs while the Rubisco content remained unaltered, a change associated with an increased growth rate (Olischläger et al., 2017). In this study, algae from a cold-temperate area were also considered; this ecotype showed different responses compared to the Arctic ecotype, indicating that the Arctic population is more likely to benefit under ocean acidification and highlighting that responses may be location-specific and not easily transferrable. Elsewhere in the Arctic, high pCO2 has been found to increase the growth rates of S. latissima and Alaria esculenta (Gordillo et al., 2015; Iñiguez et al., 2016). It has, however, been found that both S. latissima and Laminaria solidungula may be largely unaffected by increased pCO2; photosynthesis was indicated to be carbon saturated at current levels as enriched pCO2 did not influence carbon fixation, and no deactivation of CCMs was suggested by the 13C isotopic discrimination values. Moreover, there was no change in algal growth rate associated with the manipulated pCO2 conditions (Iñiguez et al., 2016). This species-specificity is highlighted in a single study where six common species of Arctic macroalgae were considered; one species responded positively (Saccorhiza dermatodea), no change was observed in four species (Monostroma arcticum, Phycodrys rubens, Ptilota plumosa, Alaria esulenta), and one species responded negatively (Desmarestia aculeata) (Gordillo et al., 2016) (see also Iñiguez et al., 2016).
The biochemical composition of macroalgae may be modified under ocean acidification. In considering six species of macroalgae found in the Arctic, Gordillo et al. (2016) identified
that pCO2 mainly modified the internal accumulation of carbohydrates and lipids, while the C:N balance was largely unaffected. In terms of carbohydrates, elevated pCO2 led to an increase in Monostroma arcticum, Phycodrys rubens, Desmarestia aculeata, and Saccorhiza dermatodea, a decrease in Ptilota plumosa, and no change in Alaria esculenta. Elevated pCO2 increased lipid content in M. arcticum and D. aculeata, decreased it in P. rubens, and led to no change in S. dermatodea, P. plumose, or A. esculenta.
The species-specific responses are of significance given that those species which best tolerate or benefit from ocean acidification are likely to become dominant, potentially leading to major shifts in macroalgal composition in marine systems, including those of the Arctic (Porzio et al., 2011; Connell et al., 2013). Moreover, changes in algal traits can influence their interactions with the organisms that consume them, such as sea urchins (discussed further in Annex 2).
3.2.6 Corals
Coral reefs can form complex structures in the Arctic, with the largest known deep- and cold-water coral reef composed of Lophelia pertusa and Madrepora oculata and located north of the Arctic Circle off Norway at a depth of 300–400 m (Sabatier et al., 2012). Under short-term ocean acidification, L. pertusa from southern Norway showed only slight reductions in net calcification rates, while significantly elevating respiration and capture rates of prey (specifically Artemia salina) (Georgian et al., 2016). Although there can be a negative shock response in the short term, under longer-term exposures of weeks to months L. pertusa from a range of locations have been found to maintain calcification rates (e.g., Form and Riebesell 2012; Maier et al., 2013a,b; Hennige et al., 2014, 2015; Movilla et al., 2014), suggesting that Arctic L. pertusa may also be able to calcify under persistent ocean acidification if they have enough food to meet their metabolic costs (Rodolfo-Metalpa et al., 2015). The cold-water coral M. oculata has also been found to be able to maintain calcification rates under ocean acidification scenarios in a range of locations (e.g., Movilla et al., 2014). It is worth noting, however, that negative responses have been found in some conditions (Maier et al., 2016). The generally continued ability of these cold-water corals to calcify under different conditions is likely to be due to the strong upregulation of pH and consequent elevation of the internal carbonate saturation state. This modulation of the proton gradient between seawater and the site of calcification is attributed to the action of Ca2+-ATPase (McCulloch et al., 2012). The acclimation of coral species to longer-term increased pCO2 (i.e., over 12 months) such that net calcification is maintained is, however, associated with other physiological consequences. For example, the process of internal pH upregulation has an energetic cost, and can therefore affect growth rates (McCulloch et al., 2012). In addition, under elevated pCO2 the skeletal structure may be changed such that it exhibits decreased crystallographic and molecular-scale bonding organization, affecting breaking strength (Hennige et al., 2015). Some corals have, however, shown no distinctive differences between natural and low pH conditions in terms of skeletal morphology, macro-morphological skeletal arrangement, or secondary thickening (Wall et al., 2015). Understanding
19Chapter 3 · Biological responses to ocean acidification

whether structural changes will occur under acidification is important as it influences the weakness of the corals, potentially making them more susceptible to bioerosion and mechanical damage (Hennige et al., 2015).
While the text has focused here on living corals, it is worth noting that much of these habitats comprises dead coral skeletons that are vulnerable to dissolution as a consequence of ocean acidification. For example, where the coral colonies of reefs located off the coast of Scotland were examined in terms of dead/living tissue, it was revealed that at least 73% of the Lophelia pertusa colonies were composed of exposed dead coral skeleton (Vad et al., 2017). Concern exists, therefore, that ocean acidification may cause dissolution and collapse of deep water reefs as shoaling of the aragonite saturation horizon exposes them to corrosive waters (Jackson et al., 2014). It is possible that if the dead zone at the bottom of the coral disintegrates under ocean acidification, then the entire structure would be in danger of collapse.
3.2.7 Mollusks
3.2.7.1 Gastropods
Of the gastropods, pteropods have been suggested to be particularly sensitive to forecasted ocean acidification as their shells are made of aragonite, a relatively soluble form of biogenic calcium carbonate (Manno et al., 2017). Many of the studies considering the response of the Arctic members of this group have focused on Limacina helicina. Under ocean acidification, these pteropods have demonstrated reduced shell size (Lischka et al., 2011), reduced shell extension (Comeau et al., 2012), decreased precipitation of calcium carbonate (correlated to the aragonite saturation state) (Comeau et al., 2010), and increased shell degradation (Lischka et al., 2011; Lischka and Riebesell, 2012). The species L. retroversa has shown similar patterns of increased shell degradation under ocean acidification (Lischka and Riebesell, 2012). Unrelated to calcification or shells, under acidification L. helicina has also shown increased mortality (Lischka et al., 2011, but no effect according to Comeau et al., 2012), and lower egg organogenesis (Manno et al., 2016), but unchanged
respiration rates (Comeau et al., 2010), and unchanged gut clearance rates (Comeau et al., 2010). A molecular approach has been applied to L. helicina and identified that genes were both upregulated and downregulated in response to ocean acidification (Koh et al., 2015). Consideration of another polar pteropod, Clinoe limacina, revealed that of 300,994 transcripts, 41 were differentially expressed following an ocean acidification treatment with 28 upregulated and 13 downregulated. The authors suggested that this may correspond with limited physiological responses of the species to short-term exposure (three days) (Thabet et al., 2017).
An array of marine gastropods found in the Arctic have been considered in the context of ocean acidification – including limpets, abalone, and littorinids. While limpets are unstudied in the Arctic, they have been considered in other regions. These studies include measurements along natural gradients of increasing pCO2, where they have been found to be severely impacted by the modified environment (Rodolfo-Metalpa et al., 2011; Garilli et al., 2015). For some limpets, reduced pH has had no effect on mortality (Maboloc and Chan 2017). However, as for other groups, traits associated with calcification have been significantly affected, including negative effects on the process of calcification (Noisette et al., 2016) (but see Schram et al., 2016 for an example of no effect), reduced growth rates (Maboloc and Chan, 2017), smaller shell sizes (Maboloc and Chan, 2017), and increased porosity (Maboloc and Chan, 2017). Experimental results have suggested that some limpets that experience increased dissolution under acidification may be able to counter this through shell repair which must have a metabolic cost (Langer et al., 2014). In contrast, other physiological patterns and processes appear unaffected by acidification, such as respiration, ammonia excretion, and filtration (Noisette et al., 2016) and lipid allocation in reproductive organs (Schram et al., 2016). The behavior of these organisms under ocean acidification has also been considered, with their capacity to right (when overturned) and mean maximal escape speed found to be unchanged (Schram et al., 2014).
Abalone responses to ocean acidification have often been studied in their larval and juvenile stages. Processes in young abalone seem to be particularly susceptible to acidification, with negative effects
In laboratory experiments, this pterapod shell dissolved over the course of 45 days in seawater adjusted to an ocean chemistry projected for the year 2100.
NOAA Environmental Visualization Laboratory
20 AMAP Assessment 2018: Arctic Ocean Acidification

on fertilization rate (Guo et al., 2015), hatching rate (Guo et al., 2015), trochophore development (Guo et al., 2015), veliger survival (Guo et al., 2015), metamorphosis (Guo et al., 2015, but see Crim et al., 2011), larval survival (Crim et al., 2011), shell development (i.e., abnormalities/lacking shell) (Byrne et al., 2011; Crim et al., 2011), shell size (Crim et al., 2011; Cunningham et al., 2016), wet weight (Cunningham et al., 2016), and shell weight (Cunningham et al., 2016) (but expression of shell formation genes was found to be unchanged by Zippay and Hofmann 2010). It is worth noting that effects of ocean acidification have also been identified in other gastropod groups not detailed here such as littorinids (Ellis et al., 2009). That many processes in larval and juvenile gastropods, including abalone, have been negatively affected provides support for the common suggestion that these stages may be particularly susceptible to ocean acidification (e.g., Byrne, 2011).
3.2.7.2 Bivalves
A key group of mollusks are bivalves, which include clams, oysters, and scallops. The responses of the clams Macoma calcarea, Astarte montagui, and A. borealis from the Pacific Arctic have been experimentally investigated in the context of ocean acidification. At the completion of the experiment, it was found that the shells of A. borealis showed a decrease in length, while those of the other species were unaffected. In addition, wet weight and oxygen consumption were not significantly different for any of the species, although there was a trend for these features to be negatively affected (Goethel et al., 2017). Other Arctic bivalves, Chlamys islandica and Ciliatocardium ciliatum, have also been investigated in a field study where there was a subtle difference in the aragonitic content of shells linked to depth and, consequently, also with water ion concentration, pH and pCO2 (Iglikowska et al., 2017). An Antarctic bivalve, Laternula elliptica, has been found to have slowed development of calcifying stages (Bylenga et al., 2015), and modified ultrastructure of the larvae (e.g., shape, edges, hinges, surfaces) under acidification (Bylenga et al., 2017).
Extensive research considering mollusk responses to ocean acidification has been conducted in non-Arctic areas, facilitating the production of review papers for some groups. In terms of oysters, for example, a review of existing literature revealed that under ocean acidification adult oysters typically have reduced growth and calcification rates, while larval oysters display stunted growth, developmental abnormalities, and increased mortality (Lemasson et al., 2017). A review of scallop literature highlighted that although this group may be adversely affected under ocean acidification, the tolerance of particular species will be determined by their structure, life history, environmental preferences, behavior, physiology, and sources of nutrition (Richards et al., 2015).
3.2.7.3 Cephalopods
The response of cephalopods to ocean acidification has been considered in a range of geographical areas, with potential that similar responses may be observed in the Arctic. As with other mollusks, there has been focus placed on identifying effects of ocean acidification on cephalopod features and processes such as metabolic rates (unchanged, Rosa et al., 2013;
reduced, Rosa and Seibel, 2008; Hu et al., 2014b), hatching (increased hatching time, Kaplan et al., 2013; Sigwart et al., 2016; increased premature hatching, Rosa et al., 2013), growth (unaffected, Dorey et al., 2013; reduced, Sigwart et al., 2016), size (reduced, Kaplan et al., 2013; Sigwart et al., 2016), and survival (unchanged, Rosa et al., 2013). In contrast to many other species with calcified structures, the internal shell of the cuttlefish (or the cuttlebone) has displayed features indicative of hyper-calcification under ocean acidification (Dorey et al., 2013), enabling juveniles to maintain this process (Gutowska et al., 2008). This calcified structure can, however, have modified morphology under acidification (i.e., altered spacing of laminae, pillar thickness) (Gutowska et al., 2010). Cephalopod activity and behavior has been found to be modified under acidification, with altered defensive behaviors (toward jet escapes and use of ink, reduction in use of defensive arm postures). Such changes would affect the energy budget of individual organisms, and modify interactions with predators (Spady et al., 2014).
3.2.8 Echinoderms
The echinoderms investigated in the context of ocean acidification include sea urchins, brittlestars, sea stars, and sea cucumbers. In the Arctic, the response of the green sea urchin, Strongylocentrotus droebachiensis has been studied (discussed further in Annex 2). Exposure of reproductive stages to acidified conditions identified that acidification can increase the proportion of eggs that fail fertilization, increase the risk of polyspermy (due to failures in fertilization envelope formation), and increase irregular formation of the embryo (due to impaired formation of the hyaline layer) (Bögner et al., 2014). Other studies considering urchins at polar locations, specifically in the Antarctic, have found that fertilization and early cell division may be largely resilient to acidification (Ericson et al., 2010, 2012; Yu et al., 2013; Kapsenberg and Hofmann 2014), although there is potential for slightly greater sensitivity of later development through to gastrula (Ericson et al., 2010), reduction in the percentage of normal embryos (Ericson et al., 2012), or a slight delay in hatching (Yu et al., 2013). The larvae produced under acidification may grow more slowly (Byrne et al., 2013), develop shorter arms (a highly plastic morphological aspect) (Byrne et al., 2013; Yu et al., 2013), have disrupted developmental patterning as indicated by increased left-right asymmetry and altered body allometry (Byrne et al., 2013), or be smaller in terms of body component (Clark et al., 2009).
The Arctic brittlestar, Ophiocten sericeum, has been investigated in the context of ocean acidification, with metabolism upregulated, an unchanged number of muscle nuclei and no change in arm regeneration (Wood et al., 2011). Other brittlestars have shown little change in terms of oxygen consumption (Wood et al., 2010), metabolism (Wood et al., 2008), mobility (Wood et al., 2010), and the percentage of calcium and magnesium in arm (Wood et al., 2010). It is worth noting, however, that ocean acidification has been linked to increased larval mortality (Dupont et al., 2008; Chan et al., 2015), reduced larval swimming speeds (Chan et al., 2015), abnormal development (Dupont et al., 2008), skeletogenesis (Dupont et al., 2008), reduced arm regeneration (Hu et al., 2014a), considerable muscle wastage (Wood et al., 2008), reduced metabolic rates (potentially reflecting uncompensated
21Chapter 3 · Biological responses to ocean acidification

acidosis) (Hu et al., 2014a), and increased ammonium excretion rates (Hu et al., 2014a). A gene-expression analysis of brittlestars revealed that there may also be reduced expression of acid–base and metabolic genes (Hu et al., 2014a).
Sea stars from polar environments have largely been found to respond negatively to ocean acidification. That is, while reduced pH may have little effect on fertilization (Gonzalez-Bernat et al., 2013), it can affect larval survival (i.e., reduced), development, and morphology (i.e., shape and size) (Gonzalez-Bernat et al., 2013). When exposed to acidified conditions, adult sea stars from polar regions experienced extracellular acidosis, which remained uncompensated within a period of seven days. The coelomic fluid acidosis was associated with an increase in total coelomocyte number (Dupont and Thorndyke, 2012).
When exposed to forecasted acidification, the cold-water sea cucumber Cucumaria frondosa has shown impaired gamete synthesis, which has led to discrepancies in oocyte/embryo buoyancy, morphology, and developmental tempo, translating to increased mortality before the blastula stage. There were also differences in the microstructural appearance of ossicles and lipid contents of muscles, gonads, and spawned oocytes (Verkaik et al., 2016). Under acidification other sea cucumbers have demonstrated reduced specific growth rates, reduced energy consumption and defecation rates, and shifted energy budgets (resulting in a lowered allocation to somatic growth) (Yuan et al., 2016). In terms of reproduction, sperm flagellar motility was significantly reduced under acidification scenarios (Morita et al., 2010). Reduced pH did, however, have relatively small effects on the sea cucumber relative to other echinoderms, despite this change leading to a decrease in post-fertilization success and subtle differences in growth and development (specifically stage duration) (Yuan et al., 2015).
3.2.9 Crustaceans
Of the Arctic crustaceans, copepods are perhaps the most ecologically important and well-studied in the context of ocean acidification. A particular focus has been placed on Calanus spp., specifically the Arctic copepod Calanus glacialis. In this species, ocean acidification effects vary with life stage. The developmental rate of nauplius larvae appears largely unaffected by acidification, probably as a result of physiological buffering by changes to the universal stress response (including DNA repair, redox regulation, protein folding, proteolysis) and upregulation of cellular ion transport, particularly sodium/proton antiporters (Bailey et al., 2016, 2017). In contrast, the copepodite stages seem more sensitive. In the early copepodite stages (CII-CIII), ocean acidification seems to induce increased costs of biosynthesis (Thor et al., 2016). In copepodites from Kongsfjord, West Svalbard, Thor et al. (2016) found a 2.5 times greater increase in metabolic rates due to feeding at elevated pCO2. Further studies have shown that the relationship between metabolic rate and ingestion rate is similarly affected in the later CIV stage; in C. glacialis from two fjords on the Svalbard west coast scope for growth (a measure of the energy available for growth calculated as ingestion rate times gut absorption efficiency minus metabolic rate) decreased by up to 50% under increased pCO2 (Thor et al., 2018a). Such changes to both early and late copepodite stages would have serious implications for C. glacialis populations. Specifically, reductions in scope
for growth would prolong stage development time and reduce the individual body size of developing copepodites and ultimately also reduce adult body size. In contrast to the effects on earlier copepodite stages, the last copepodite stage (CV) seems unresponsive to increased pCO2. Several studies have shown no effects on rates of ingestion and metabolism in this stage (Hildebrandt et al., 2014, 2016; Thor et al., 2016). This non-response probably occurs as CV copepodites are metabolically different compared to the earlier stages. That is, while somatic growth is the main response in the preceding stages, metabolism is largely reconfigured to accommodate overwintering diapause in CVs. During diapause, C. glacialis CVs experience extracellular pH as low as 5.5 (possibly due to metabolic depression during hibernation) (Freese et al., 2015). In adult C. glacialis, fecundity also seems unaffected by high pCO2 both in terms of egg production and egg hatching success and timing (Weydmann et al., 2012; Thor et al., 2018b).
Assessing the effects of ocean acidification in the context of the populations and communities that occur will be important in predicting the effects of ocean acidification. In terms of copepods, despite clear effects of ocean acidification on Calanus glacialis in laboratory studies, in more complex mesocosm-based communities deployed in Kongsfjord, West Svalbard, no differences have been found in stage development during the summer growth season (Niehoff et al., 2013). This mesocosm study also showed that copepod species composition did not change under acidification treatments. Thus, other effects may have countered the direct effects of increased pCO2. For instance, acidification effects may have been mitigated by elevated food intake as primary production, and hence the availability of phytoplankton prey, increased with pCO2 (Engel et al., 2013) (the potential role of these trophic links is further discussed in Section 3.3).
Arctic crabs appear sensitive to ocean acidification. In the spider crab (Hyas araneus) greatly increased pCO2 (3000 ppm; in contrast to the current 380 ppm) caused increased development time and reduced survival of zoea I larvae in Kongsfjord (Walther et al., 2011; see also Schiffer et al., 2014). Similarly, even at a more moderate pCO2 (710 ppm) effects were observed, although they were less pronounced (Walther et al., 2011). Larval physiological processes may be impaired in H. araneus exposed to acidification. Larvae from Kongsfjord showed lower capacity for calcium incorporation at high pCO2 than those from other regions, suggesting that crab larvae developing at the cold end of the species distribution range may be more sensitive to ocean acidification than those in temperate regions (Walther et al., 2011). Adults have shown uncompensated extracellular acidosis at elevated pCO2 potentially reducing muscular function, but there was no effect of ocean acidification on movement (Zittier et al., 2013). In the red king crab (Paralithodes camtschaticus) the survival of larvae has been shown to be compromised by elevated pCO2, with 100% mortality occurring after 95 days in ~1600 µatm CO2 water (Long et al., 2013). These detrimental effects also seem to extend to juveniles, with juveniles of both red king crab and tanner crab (Chionoecetes bairdi) from the Bering Sea experiencing decreased growth and condition index (also known as body mass index, which is dry mass in grams divided by the carapace length3 for red king crab or carapace width3 for tanner crab, in millimeters) and increased mortality under elevated pCO2 (Long et al., 2013).
22 AMAP Assessment 2018: Arctic Ocean Acidification

The crab species Carcinus maenas is ecologically important in a range of regions, including the boreo-Arctic. Studies across the geographical range of this crab have indicated that acidification can affect it as detailed below. Acidification has, for example, been found to reduce feeding rates, and to prompt active extracellular pH compensation via bicarbonate accumulation (Appelhans et al., 2012). Quantification of acid–base regulation in the gills of this crab has shown that hemolymph K+ concentrations, ammonia concentrations, and ammonia excretion rate were increased under elevated pCO2. Quantitative gene expression analysis revealed that under elevated pCO2 mRNA levels of transcripts hypothesized to be involved in ammonia and acid–base regulation showed varied responses, being upregulated in some individuals and downregulated in others (Fehsenfeld and Weihrauch, 2013). Another study identified that most of the genes known to code for proteins involved in osmo– and acid–base regulation and the cellular stress response were not impacted by elevated pCO2. In contrast, changes were observed in a calcium-activated chloride channel, a potassium channel, a tetraspanin, an integrin, a putative syntaxin-binding protein, and a Cl-/HCO3
- exchanger (Fehsenfeld et al., 2011). Another study considering the gills, along with hemolymph and leg muscle, found that exposure to increased pCO2 led to changes in the metabolic profile, mainly due to a reduced level of intracellular osmolytes such as amino acids, potentially reflecting increased catabolism of amino acids to supply body fluids with proton-buffering ammonia (Hammer et al., 2012). Together these results suggest that some processes may be robust to ocean acidification, while others are likely to be more sensitive.
Decapods of importance in the Arctic include lobsters and shrimp. Studies of the lobster species Homarus gammarus from a range of regions often focus on early life history stages. In larvae, acidification was found not to affect survival, carapace length or zoeal progression, but did disrupt exoskeleton mineral content of the carapace (i.e., calcium and magnesium) and carapace mass (Arnold et al., 2009). In juveniles, acidification has been found to lead to increased mortality, typically due to molt death syndrome, as well as to reduced metabolism, food acquisition, and carapace mineral content (Small et al., 2016). A longer-term study considering both larval and juvenile exposure identified that while there was no clear effect of pCO2
on carapace length or dry weight, it did increase the deformities observed (e.g., curled carapace, damage in tail fan, bent rostrum, deformed claws, stiff/twisted walking legs, and puffy carapace). These morphological changes may then, in turn, influence a range of activities including respiration, ability to find food or sexual partners, and motility (Agnalt et al., 2013).
In northern shrimp (Pandalus borealis) larval development has typically been found to be negatively affected by increased pCO2. Studies on P. borealis from the Norwegian coast showed that while egg hatching is unaffected, all tested zoea larval stages (II, III, IV) developed significantly slower at ~1200 µatm CO2
(Bechmann et al., 2011; Arnberg et al., 2013). These effects may be alleviated at higher temperature (increase from 6.7 to 9.5°C), so direct pCO2 effects may be masked by future climate change (Arnberg et al., 2013) (see Section 3.5 for further discussion of interactive effects of environmental changes). Adult shrimp may also be affected by elevated pCO2; one study found a 63% increase in adult mortality in P. borealis from the Swedish west coast (Dupont et al., 2014). Should this change in mortality also apply to Arctic P. borealis populations, then the consequences will be detrimental to the Arctic benthic community. (The effects of ocean acidification on P. borealis are explored further in a case study on the Greenland shrimp fishery; Annex 4.)
Arctic barnacles, although less studied than some other crustaceans, may be affected by acidification. For example, Semibalanus balanoides barnacles from the northern edge of the species’ range in Svalbard were found to respond to lower pH; the growth and development of metamorphosing post-larvae were negatively impacted. It is important to note, however, that mineral composition was unaltered. This combination of responses indicates that there may have been a change in the energetic balance of the organisms with energy allocated to maintaining mineral integrity rather than growth (Findlay et al., 2010).
3.2.10 Other invertebrates
While the majority of research considering effects of ocean acidification on invertebrates has focused on the groups outlined in previous sections, representatives of other groups have also been studied. This section highlights some of these of relevance to the Arctic, selected using the qualitative review approach, specifically cnidarian, bryozoan, brachiopod, polychaete, and nematode. While few of the studies detailed below are from the Arctic, the responses observed elsewhere may inform predictions for this region.
A cnidarian found within the Arctic is the lion’s mane jellyfish (Cyanea capillata). The effect of ocean acidification on scyphozoan polyps was investigated in a study where biological material was collected from Helgoland. Both polyp growth and carbon content were unaffected by the pCO2 treatments, indicating that this environmental change is unlikely to have direct effects on the growth of scyphisotomae (Lesniowski et al., 2015). Resilience of jellyfish to ocean acidification may have harmful outcomes such as increased blooms that can, in turn, have negative interactions with aquaculture (Hall-Spencer and Allen, 2015).
Reviews of bryozoan responses to ocean acidification have indicated that this group is likely to reduce calcification, change mineralogy, reduce growth, decrease survival, and lower
Zoea larva of Homarus gammarus.
Hans Hillewaert
23Chapter 3 · Biological responses to ocean acidification

production of polymorphic zooids for defense and reproduction (Smith, 2014; Taylor et al., 2015). However, Borszcz et al. (2013) found no evidence that increasing water depth (with assumed pH decrease) affected exoskeleton magnesium content for Arctic bryozoans, as might be expected on the basis that high-magnesium calcite is especially prone to dissolution.
While the response of Arctic brachiopods to ocean acidification has not been investigated, that of Antarctic brachiopods has been. The Antarctic brachiopod Liothyrella uva was found to have consistent rates of shell repair (with over 80% of all damaged individuals at the start of the experiment completing shell repair after 12 weeks) and growth under acidified scenarios (Cross et al., 2015). Another study of this brachiopod found that it suffered post-mortem shell dissolution under acidification (McClintock et al., 2009). In contrast, where live individuals of a New Zealand brachiopod Calloria inconspicua were investigated, they also showed a persistent capacity to repair shells under acidification, and were able to maintain (or even increase) their growth rate (Cross et al., 2016).
Within the annelids polychaete worms, including the ~200 Arctic species, have the potential to be impacted by ocean acidification. Experimental manipulation of pCO2 has indicated that in the short term these worms can survive, increase their energy metabolism, and decrease carbonic anhydrase concentration; these homeostatic changes are, however, suggested to be unsustainable over the longer term (Turner et al., 2015). The activity of these organisms may be modified under acidification, as altered carbonate chemistry has been correlated with enhanced macroboring (Enochs et al., 2016). Reproduction may also be disrupted in polychaetes under ocean acidification with specific changes anticipated including larger and more abundant oocytes, fewer spermatozoa, lower effective fecundity (number of eggs laid), slower development of embryos and
larvae (although the microstructure of the body wall, and chaeta appearance and elemental composition may be unaffected) (Verkaik et al., 2017). These effects may lead to the reduction of polychaete species richness and abundance under extreme low pH conditions, as has been observed in a volcanic vent system near Italy (Gambi et al., 2016).
Nematodes have been investigated in terms of their response to ocean acidification. Within meiofaunal assemblages, elevated pCO2 can reduce nematode abundance and nematode species richness (Lee et al., 2017). Elevated pCO2 has also been found to modify nematode abundance (decreased in Barry et al., 2004; Dashfield et al., 2008; increased in Hale et al., 2011; Meadows et al., 2015), with potential that nematode community structure and diversity will also be modified under acidified scenarios (Widdicombe et al., 2009; Meadows et al., 2015) (but see Dashfield et al., 2008).
3.2.11 Fishes
Ocean acidification has the potential to influence a range of physiological processes in fishes from Arctic waters, specifically polar cod (Boreogadus saida) and Atlantic cod (Gadus morhua) (Kunz et al., 2016). (Effects on Gadus morhua are discussed further in Annex 3). In general, adult marine teleosts are predicted to have low vulnerability to moderate acidification due to the capacities for acid–base regulation in their gills, intestine, and liver (Stapp et al., 2015; Hu et al., 2016; Kunz et al., 2016; Michael et al., 2016). Moreover, traits associated with mitochondrial acclimation potential (i.e., OXPHOS, proton leak, ATP production) have been found to be similar in groups acclimated to different pCO2 conditions in both B. saida and G. morhua (Leo et al., 2017). It is worth noting, however, that these responses were modified under elevated temperature (Leo et al., 2017), an idea discussed further in Section 3.5.
A polar cod (Boreogadus saida) rests in an ice-covered space. Alaska, Beaufort Sea, North of Point Barrow.
Shawn Harper: NOAA Office of Ocean Exploration
24 AMAP Assessment 2018: Arctic Ocean Acidification

Focus is increasingly being placed on reproductive stages and juvenile fish, given that they are potentially more susceptible than adults to the effects of ocean acidification. Experiments conducted on Gadus morhua have identified that while sperm swimming (which plays a central role in determining fertilization success) may be unchanged under acidification (Frommel et al., 2010), embryos experienced reduced hatching success, stimulated oxygen consumption, and reduced larval size at hatch, but no change in mitochondrial function or ionocyte abundance (Dahlke et al., 2017). Under ocean acidification, larval G. morhua exhibited higher mortality rates during the first 25 days following hatching, a critical phase for population recruitment (Stiasny et al., 2016). The otoliths (ear bones) of larval G. morhua have been found to show increased growth, with larger sagittae and lapilli (in terms of surface area normalized to fish length), although there was no significant difference in otolith shape or fluctuating asymmetry (difference between right and left sides) (Maneja et al., 2013b). Such changes in fish otoliths are important given that their role in neural and acoustic functions mean any change could represent an added mortality risk. Other tissues of the larvae, specifically those associated with internal organs, have been shown to be damaged under elevated pCO2, with the degree of damage increasing with pCO2 concentration (Frommel et al., 2012). Frommel et al. (2014) conducted a similar study on Atlantic herring (Clupea harengus) larvae exposed to pCO2, finding that exposure to elevated pCO2 resulted in stunted growth and development, decreased condition, and severe tissue damage in several organs. There have, however, also been reports of no effect of pCO2 on a range of measures for G. morhua including hatching, survival, development, and otolith size (although it is worth noting this study was done using individuals from an environment already experiencing high ambient pCO2) (Frommel et al., 2013).
Fish behavior may be modified under acidification. The behaviors displayed by tropical and temperate fish exposed to high pCO2 include altered auditory performances, loss of lateralization (i.e., the preference for turning left or right), and changes in reproduction (Milazzo et al., 2016). In the context of the Arctic specifically, the behavior of Boreogadus saida and Gadus morhua have been investigated. While the activity of neither species was modified by ocean acidification, the behavioral laterality of B. saida was modified (i.e., the preference for one side over the other was reduced, and paralleled by a shift from right to left lateralization), while that of G. morhua remained unaltered (Schmidt et al., 2017a). The authors were prompted to conclude that fish in polar systems may undergo some, albeit less intense, behavioral disturbances under ocean acidification (Schmidt et al., 2017a). These changes may reflect that some brain metabolites in B. saida were modified by enhanced pCO2 in isolation, while those of G. morhua remained unchanged (Schmidt et al., 2017b). The critical swimming speeds of G. morhua have also remained unchanged following acclimation to elevated pCO2 (Melzner et al., 2009). The behavior of swimming larvae has been found to be consistent under ocean acidification; of the measured traits of swim duration, distance and speed, stop duration, and horizontal and vertical turn direction, it was identified that the only effects of high pCO2 were restricted vertical turn angles, and reduced stop duration. These differences were subtle, with unclear functional and ecological significance (Maneja et al., 2013a). Similarly, in other regions, juvenile behaviors (including
activity, emergence from shelter, relative lateralization, absolute lateralization, predator cue avoidance) appear robust under near future pCO2 levels (Jutfelt and Hedgärde, 2013, 2015).
3.2.12 Seabirds and mammals
There is little evidence as to the direct effects of ocean acidification on seabirds and mammals in the Arctic. It has been suggested that any responses may be driven by indirect effects resulting from changes in quality of habitats or food resources (discussed further in Section 3.3), which can influence the movement, space use, energy budgets, and population abundance of seabirds and mammals (Jay et al., 2011; MacCracken 2012; Galbraith et al., 2014; Beatty et al., 2016; Thomas et al., 2016). In terms of change in habitat, the sensitivity of organisms to ocean acidification can be influenced by their distribution; the current patterns of occurrence may, for example, increase the susceptibility of certain whale populations to forecasted acidification (Thomas et al., 2016). As for the availability of food resources, species such as Pacific walrus (Odobenus rosmarus divergens) that feed on organisms potentially affected by ocean acidification (e.g., bivalves, gastropods, polychaetes), could be vulnerable to indirect effects driven by either food availability or food quality (Jay et al., 2011; Beatty et al., 2016).
3.3 Responses of ecosystems and habitats
In natural systems organisms interact with others in a range of ways. Ocean acidification has the potential to impact these interacting organisms differently, potentially shifting the ecosystem balance away from that which is currently observed (Hall-Spencer et al., 2008; Gaylord et al., 2015). Consequently, there is a growing body of research considering the responses of species assemblages and the habitats they form to ocean acidification.
Competitive interactions between different taxa may be affected by ocean acidification. For example, any change to calcifying algae could affect its competitive interactions with other space-occupying organisms (McCoy and Kamenos, 2015). That is, ocean acidification is likely to favor recruitment of fleshy, non-calcifying algae over calcified algae, potentially driving a shift from coralline algae (and the kelp they facilitate) to simple mat-algal dominated habitats (Porzio et al., 2011; Brodie et al., 2014). Similarly, ocean acidification may also cause loss of biogenic habitat complexity and a decline in species biodiversity and ecosystem function in other benthic habitats such as maerl beds, cold-water coral, and mussel reefs (Sunday et al., 2017).
Ocean acidification can have contrasting effects on organisms at different trophic levels, potentially modifying their interactions (i.e., that between prey and predator). For example, an experiment investigated the responses of pelagic communities including grazing copepods. It was identified that the interaction between copepods and dinoflagellate cell abundance was altered under acidification; copepods showed a stronger preference for dinoflagellates under elevated pCO2 conditions, indicating changes in food quality and grazing selectivity (Tarling et al., 2016). Moreover, these interactions could be altered where the susceptibility of organisms to predation under ocean acidification modifies their ability to
25Chapter 3 · Biological responses to ocean acidification

produce defensive structures, such as shells of gastropods (Bibby et al., 2007). Changes in trophic interactions can then influence the consuming organism – for example, in jellyfish food availability can modify the formation of polyps, if this food source is modified by pCO2 the effect could then move further through the food chain (Lesniowski et al., 2015). Specifically, changes to lower-level organisms such as bivalves or mollusks driven by ocean acidification could affect larger, benthivorous predators such as Pacific walrus (Odobenus rosmarus divergens), bearded seal (Erignathus barbatus), and diving seaducks, such as spectacled eider (Somateria fischeri) (Goethel et al., 2017).
The host-parasite relationship can regulate individuals, populations, and communities, and is sensitive to changes in conditions of the surrounding environment. Relative to other interactions, such as the trophic interactions discussed above, parasitism has received little attention in the context of ocean acidification (MacLeod and Poulin, 2012). It has been suggested that as water chemistry changes, sympatric marine species will exhibit differential tolerances which could unbalance otherwise stable community dynamics (MacLeod, 2017). To date, research on the potential effects of ocean acidification has largely centered on gastropod hosts and trematode parasites in New Zealand (MacLeod, 2017), with future research needing to consider a wider range of species over larger geographical areas, including the Arctic.
Ocean acidification-driven changes to marine organisms and ecosystems can affect human societies. This is because humans rely on marine species and ecosystems for a range of services including provisioning (e.g., nutrition, materials, energy), regulation and maintenance (mediation of waste, toxics, and other nuisances; mediation of flows; mediation of physical, chemical, and biological conditions), and cultural (physical, experiential, spiritual and symbolic interactions). Ocean acidification has the potential to modify the availability of these resources which would, in turn, affect socio-economic systems (reviewed by Falkenberg and Tubb, 2017; examples provided in Annexes 5 and 6). While such reliance is widespread, these changes are likely to be felt particularly by Indigenous populations that are heavily dependent upon marine-derived resources. For example, the Pikialasorsuaq ecosystem is the most biologically productive region north of the Arctic Circle, and has supported Inuit for millennia; it is a region whose biota is critical for food, cultural, and spiritual resources (Eegeesiak et al., 2017). If ocean acidification does modify the productivity of these ecosystems, it could affect the health of the dependent regional Inuit community. Indigenous knowledge suggests that the recent, and possibly also future, environmental change and challenges to their resilience are greater than have been faced in the past (Turner and Clifton, 2009). Such susceptibility is likely to be widespread given that similar connections occur in other Arctic regions and communities.
In addition to modifying interactions with other species, changes in biota can feed back to modify the abiotic system within which the ecosystem occurs. When investigated in the context of phytoplankton, for example, increasing picoeukaryote abundance under ocean acidification could result in shallower organic matter remineralization in the future Arctic Ocean (De La Rocha and Passow, 2014). Similarly, declining coccolithophore abundances could provide less
calcium carbonate for organic matter ballasting, which again should tend to shift remineralization depths towards the surface (De La Rocha and Passow, 2014). More generally, increased primary production and respiration in the oceans could increase pCO2 and decrease their ability to act as a sink for atmospheric pCO2 (Mostofa, 2016). These processes would constitute a feedback mechanism to increasing atmospheric CO2 levels.
3.4 Acclimation and adaptation
The acclimation (short-term phenotypic plasticity, physiological changes in individuals) and adaptation (longer-term genotypic change, at population scale) potential of the different groups considered can influence their response to modified environmental conditions. In terms of acclimation, there have been studies considering organisms from corals (Form and Riebesell, 2012) to fish (Leo et al., 2017). Indeed, the majority of studies included here consider the response of individual organisms to changes in their environment over time-scales from days (e.g., Dupont and Thorndyke, 2012; Monier et al., 2014; Thabet et al., 2017) to months (e.g., Ragazzola et al., 2013). Less well-investigated, however, is the potential for adaptation. The adaptive potential of the different groups will be proportional to the population size and generation time, with groups that have large population sizes (conferring greater genetic variation) and short generation times having the highest adaptation rates (Riebesell and Gattuso, 2015). Indeed, it has been identified that adaptation under ocean acidification can be observed in plankton after a few hundred generations (Lohbeck et al., 2012; Schaum et al., 2013). Similarly, in copepods natural selection has been shown to alleviate severe ocean acidification effects after just two generations in Pseudocalanus acuspes. That is, while enhanced pCO2 reduced egg production by nearly 70% in a naïve population, this reduction was diminished to 30% after exposure to high pCO2 during two generations due to selection in genes related to RNA transcription control (Thor and Dupont, 2015; De Wit et al., 2016). It does, however, remain unclear whether the process can occur rapidly enough to keep ecosystem functions and services unchanged in the face of the forecasted rapid ocean acidification (Riebesell et al., 2013; Sunday et al., 2014). Trans-generational responses to modified conditions may also occur as a result of epigenetic effects, whereby phenotypic variations are inherited across generations without any variations in DNA (Chakravarti et al., 2016). For example, epigenetic effects have been proposed as the mechanism by which a clownfish (Amphiprion melanopus) exposed to ocean acidification improved offspring performance, probably through the activation of more efficient physiological pathways (Miller et al., 2012).
3.5 Interactive effects in a multi-stressor environment
Human activities are having a range of impacts on natural systems that extend beyond ocean acidification. Thus, it is necessary to consider their potential combined impacts. A condition being modified simultaneously with carbonate chemistry is temperature; future warming is anticipated in the Arctic (Stocker, 2014). A meta-analysis of global trends has identified that there is a trend toward
26 AMAP Assessment 2018: Arctic Ocean Acidification

enhanced sensitivity to ocean acidification where taxa are also exposed to warming (Kroeker et al., 2013). Where the responses of Arctic phytoplankton to acidification and warming have been investigated, the effect of increased pCO2 has been found to be modified by elevated temperature (Coello-Camba et al., 2014; Holding et al., 2015). Studies considering Arctic macroalgae typically highlight that there will be species-specific responses to ocean warming and acidification, with some species affected by one stressor and not the other, while others show a synergistic response (moreover, these responses can be process-specific) (Gordillo et al., 2016; Iñiguez et al., 2016; Olischläger et al., 2017). That a synergistic response was identified fits with expectations derived from other systems; a meta-analysis identified that synergistic interactions between environmental conditions are more common than additive or antagonistic interactions (Przeslawski et al., 2015).
The species-specific nature of responses to ocean acidification and warming could increase the probability of community change as a consequence of differential change to the performance of species (Gordillo et al., 2016; Iñiguez et al., 2016). Consideration of Arctic pteropod responses to acidification and warming revealed that they too are likely to be species-specific; for example in the study by Lischka and Riebesell (2012) while there was a significant pCO2 effect on shell degradation in two species investigated (the polar Limacina helicina and the boreal L. retroversa), synergistic effects between temperature and pCO2 were identified for L. helicina, indicating that polar species may, indeed, be particularly sensitive to warming and acidification. Where investigated for fish, acidification and warming tend to combine to have synergistic effects, resulting in more pronounced acidification effects at higher temperatures (e.g., Dahlke et al., 2017; Leo et al., 2017). Modelling approaches have indicated that under future climate conditions (i.e., acidification and warming) there may, indeed, be reduced future recruitment success for Atlantic cod (Koenigstein et al., 2018). Such interactions should be investigated in future experiments on species composition, especially in the Arctic where warming is projected to be relatively large (Stocker, 2014). These experiments and models need to consider species’ mobility and current distributions as they can modify the importance of the interaction between warming and ocean acidification. Specifically, populations may be able to relocate latitudinally to maintain current temperature ranges, but then other environmental constraints may apply.
Alterations in underwater light regimes associated with climate change (Stocker, 2014) can modify the response of species to ocean acidification. Increased irradiance may result from sea-ice retreat associated with climate change. Experimental manipulations have shown that phytoplankton may be resistant to modified light and acidification when manipulated both in isolation and combination, challenging the common prediction of stimulatory effects on primary production (Hoppe et al., 2018). Macroalgae, however, have been found to respond in the widely anticipated manner, with two kelps synergistically benefiting from light enrichment and acidification. The highest growth rates were recorded under modification of both conditions in both species, although one did benefit more strongly than the other, highlighting that even where positive effects are observed species interactions can be modified by environmental change (Gordillo et al., 2015).
A broad range of environmental conditions can combine with acidification to modify organism response; these include copper exposure (Marques et al., 2017), phosphate limitation (Maat et al., 2014), and eutrophication (Reymond et al., 2013). Moreover, although experimental designs commonly consider two factors in a crossed design, more than two are being altered in Arctic environments. Consequently, experiments are also moving to consider more complex interactions, such as ocean acidification, temperature, and salinity (Haynert and Schönfeld, 2014), or ocean acidification, nutrients and light (Celis-Plá et al., 2015). Consideration of these complex interactions will require careful selection of an appropriate experimental strategy (Boyd et al., 2018).
Human activities are modifying the biotic environment, with these alterations set to combine with future global change in abiotic conditions. For example, humans are extracting key organisms, potentially restricting their range, while simultaneously facilitating the expansion of invasive species as new routes are opened for shipping and fishing, a change which is exacerbated as sea ice melts and allows ships through areas that were previously inaccessible (Brodie et al., 2014; Hall-Spencer and Allen, 2015). Where organism occurrence is modified, this can combine with ocean acidification to alter the occurrence of dependent higher-level trophic organisms (Lesniowski et al., 2015; Maier et al., 2016), or modify community composition (Dashfield et al., 2008). It will, therefore, be important to understand, and potentially manage, the biota that can modify (mediate or exacerbate) the effect of ocean acidification on other organisms (Falkenberg et al., 2012, 2014).
3.6 Conclusions
Ocean acidification has the potential to drive changes in Arctic marine systems. These changes can reflect direct impacts on the different groups considered, as well as the indirect effects that are mediated both within and between groups. There is likely to be great heterogeneity in the responses of organisms – with some positively influenced, others unaffected, and still more adversely impacted. Drawing generalized predictions of effects remains difficult given the species-, life stage-, location-, season-, etc. specificity of responses. Further complicating responses are changes humans are concomitantly driving in the abiotic environment (e.g., warming, altered light availability) and species assemblages (e.g., removal or introduction of key species). Where researchers begin to understand the mechanisms driving similarities and differences in responses, the capacity to draw more confident predictions and forecasts may develop. The results currently available do, however, indicate that forecasted ocean acidification is likely to be sufficient to drive changes in Arctic organisms and ecosystems to a magnitude that will affect the associated human societies.
27Chapter 3 · Biological responses to ocean acidification

Appendix: Manipulative experimental studies
Table A3.1 The manipulative experimental studies (i.e., excluding measures of natural systems, synthesis studies, modelling approaches etc.). Reported for each paper are the study species/community/assemblage, location from which the study species/community/assemblage was isolated or collected, and ocean acidification treatment (reported in either CO2 as µatm or ppm, or pH) in terms of the ambient or control treatment (-) and modified treatments (reduced or increased ). Where possible, the treatment is reported as CO2 (µatm or ppm), however, for some papers these conditions have been reported in terms of pH. If a single reference includes more than one study species/location/set of acidification treatments, this is indicated in the table (/).
Section / Source Study species / community / assemblage Location
Ocean acidification treatment
CO2, µatm CO2, ppm pH
- - -
3.2.1 / Viruses
Crawfurd et al. 2017 Microbial community Baltic Sea 365, 368 497, 821, 1007, 1231
Tsiola et al. 2017 Plankton community Mediterranean Sea 356±14 450, 550, 750, 840, 1000, 1250
Maat et al. 2014 Picoeukaryote Micromonas pusilla North Sea 370 750
Rochelle-Newall et al. 2004 Coccolithophore Emiliania huxleyi Norway 414 190, 714
Celussi et al. 2017 Prokaryotic communities Mediterranean Sea 450 / 350 550, 650, 750, 850, 1000, 1250 / 450, 550, 750, 850, 1000, 1250
Carreira et al. 2013 Coccolithophores (virus and host)
Emiliania huxleyi, Phaeocystis poucheti
Norway 350 280, 700
Traving et al. 2013 Virus, cyanobacteria Cyanophage S-PM2, Syechonococcus sp WH7803
English Channel, Sargasso Sea 8 7.6, 7
Larsen et al. 2008 Virioplankton community Norway 350 700, 1050
Chen et al. 2015 Virus, Algae Viruses, Phaeocystis globose China 390 1000
3.2.2 / Bacteria and archaea
Motegi et al. 2013 Bacterial community Svalbard 185 270, 375, 480, 685, 820, 1050, 1420
Hornick et al. 2017 Bacteria-Phytoplankton community Baltic Sea 365, 368 497, 821, 1007, 1231
Piontek et al. 2013 Bacterioplankton community Svalbard 175, 180 250, 340, 425, 600, 675, 860, 1085
Piontek et al. 2015 Bacterioplankton community Fram Strait ~8.0 5 to 9
Sperling et al. 2013 Bacterioplankton community 185 270, 375, 480, 685, 820, 1050, 1420
Zhang et al. 2013 Bacterioplankton community Svalbard 175, 180 250, 340, 425, 600, 675, 860, 1085
Wang et al. 2016 Bacterioplankton community Svalbard 175, 180 250, 340, 450, 600, 675, 860, 1085
Brussaard et al. 2013 Microbial community Svalbard 185 270, 375, 480, 685, 820, 1050, 1420
Roy et al. 2013 Bacterial community Svalbard 185 ~ 270, 685, 820, 1050
Tait et al. 2013 Microbial community Arctic 380 540, 750, 1120, 3000
Tait et al. 2014 Microbial community Svalbard 380 540, 760, 1120, 3000
Monier et al. 2014 Microbial community Ellef Ringnes Island 400 880, 1800
Currie et al. 2017 Microbial community UK 380 750
Hassenrück et al. 2016 Microbial community Papua New Guinea 8.24±0.02 / 8.33±0.00 7.83±0.08, 7.53±0.13 / 7.56±0.05, 6.78±0.02
3.2.3 / Phytoplankton
Pancic et al. 2015 Diatom Fragilariopsis cylindrus Greenland 8 7.7, 7.4, 7.1
Heiden et al. 2016 Diatom Fragilariopsis curta, Odontella weisflogii Antarctica 380 180, 1000
Wolf et al. 2018 Diatom Thalassiosira hyalina Norway 370 180, 1000, 1400
28 AMAP Assessment 2018: Arctic Ocean Acidification
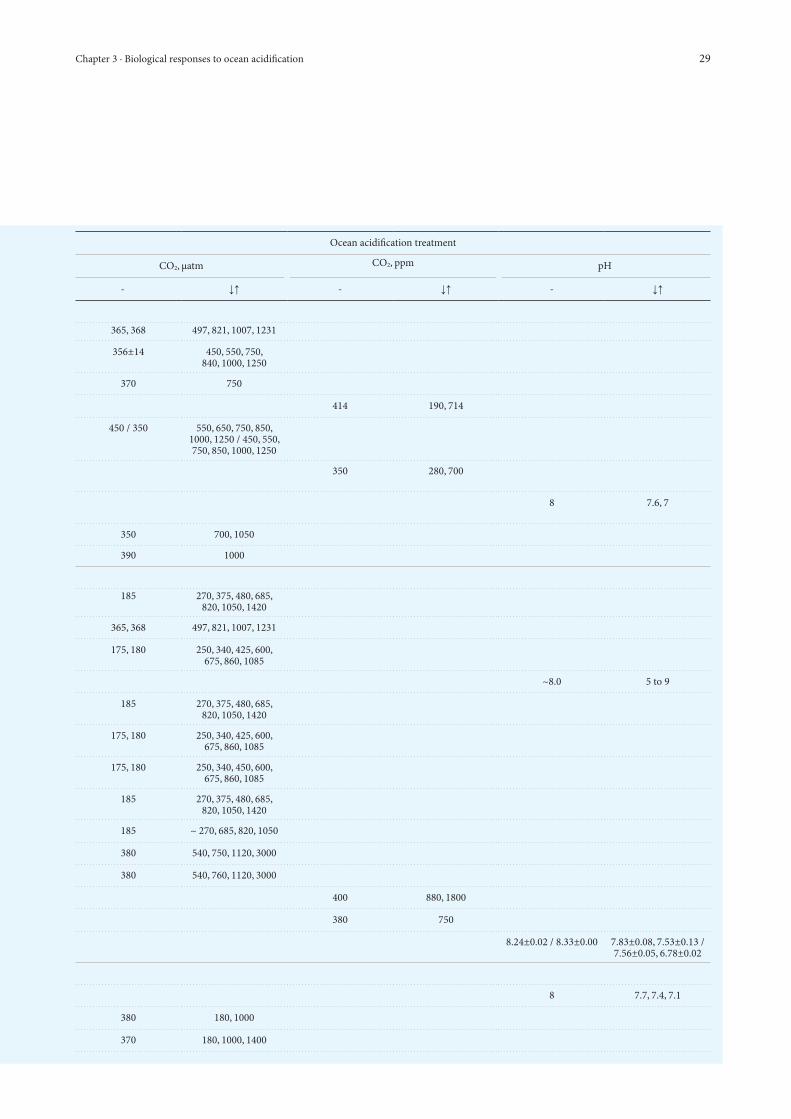
Table A3.1 The manipulative experimental studies (i.e., excluding measures of natural systems, synthesis studies, modelling approaches etc.). Reported for each paper are the study species/community/assemblage, location from which the study species/community/assemblage was isolated or collected, and ocean acidification treatment (reported in either CO2 as µatm or ppm, or pH) in terms of the ambient or control treatment (-) and modified treatments (reduced or increased ). Where possible, the treatment is reported as CO2 (µatm or ppm), however, for some papers these conditions have been reported in terms of pH. If a single reference includes more than one study species/location/set of acidification treatments, this is indicated in the table (/).
Section / Source Study species / community / assemblage Location
Ocean acidification treatment
CO2, µatm CO2, ppm pH
- - -
3.2.1 / Viruses
Crawfurd et al. 2017 Microbial community Baltic Sea 365, 368 497, 821, 1007, 1231
Tsiola et al. 2017 Plankton community Mediterranean Sea 356±14 450, 550, 750, 840, 1000, 1250
Maat et al. 2014 Picoeukaryote Micromonas pusilla North Sea 370 750
Rochelle-Newall et al. 2004 Coccolithophore Emiliania huxleyi Norway 414 190, 714
Celussi et al. 2017 Prokaryotic communities Mediterranean Sea 450 / 350 550, 650, 750, 850, 1000, 1250 / 450, 550, 750, 850, 1000, 1250
Carreira et al. 2013 Coccolithophores (virus and host)
Emiliania huxleyi, Phaeocystis poucheti
Norway 350 280, 700
Traving et al. 2013 Virus, cyanobacteria Cyanophage S-PM2, Syechonococcus sp WH7803
English Channel, Sargasso Sea 8 7.6, 7
Larsen et al. 2008 Virioplankton community Norway 350 700, 1050
Chen et al. 2015 Virus, Algae Viruses, Phaeocystis globose China 390 1000
3.2.2 / Bacteria and archaea
Motegi et al. 2013 Bacterial community Svalbard 185 270, 375, 480, 685, 820, 1050, 1420
Hornick et al. 2017 Bacteria-Phytoplankton community Baltic Sea 365, 368 497, 821, 1007, 1231
Piontek et al. 2013 Bacterioplankton community Svalbard 175, 180 250, 340, 425, 600, 675, 860, 1085
Piontek et al. 2015 Bacterioplankton community Fram Strait ~8.0 5 to 9
Sperling et al. 2013 Bacterioplankton community 185 270, 375, 480, 685, 820, 1050, 1420
Zhang et al. 2013 Bacterioplankton community Svalbard 175, 180 250, 340, 425, 600, 675, 860, 1085
Wang et al. 2016 Bacterioplankton community Svalbard 175, 180 250, 340, 450, 600, 675, 860, 1085
Brussaard et al. 2013 Microbial community Svalbard 185 270, 375, 480, 685, 820, 1050, 1420
Roy et al. 2013 Bacterial community Svalbard 185 ~ 270, 685, 820, 1050
Tait et al. 2013 Microbial community Arctic 380 540, 750, 1120, 3000
Tait et al. 2014 Microbial community Svalbard 380 540, 760, 1120, 3000
Monier et al. 2014 Microbial community Ellef Ringnes Island 400 880, 1800
Currie et al. 2017 Microbial community UK 380 750
Hassenrück et al. 2016 Microbial community Papua New Guinea 8.24±0.02 / 8.33±0.00 7.83±0.08, 7.53±0.13 / 7.56±0.05, 6.78±0.02
3.2.3 / Phytoplankton
Pancic et al. 2015 Diatom Fragilariopsis cylindrus Greenland 8 7.7, 7.4, 7.1
Heiden et al. 2016 Diatom Fragilariopsis curta, Odontella weisflogii Antarctica 380 180, 1000
Wolf et al. 2018 Diatom Thalassiosira hyalina Norway 370 180, 1000, 1400
29Chapter 3 · Biological responses to ocean acidification

Section / Source Study species / community / assemblage Location
Ocean acidification treatment
CO2, µatm CO2, ppm pH
- - -
Sett et al. 2014 Coccolithophore Emiliania huxleyi, Gephyrocapsa oceanica
Norway, France N/A ~20-6000
Kottmeier et al. 2016 Coccolithophore Emiliania huxleyi Pacific Ocean 403±4 998±15
Fu et al. 2007 Cyanobacteria Synechococcus, Prochlorococcus Sargasso and Mediterranean Seas 380 750
Maat et al. 2014 Picoeukaryote Micromonas pusilla North Sea 370 750
García-Gómez et al. 2016 Green algae Dunaliella tertiolecta Norway 390 900
Webb et al. 2016 Phytoplankton community Baltic Sea 350 390, 840, 1120, 1400
Hoppe et al. 2018 Phytoplankton community Baffin Bay 380 1000
Hoppe et al. 2017 Phytoplankton community Davis Strait 380 1000
Davidson et al. 2016 Microbial communities Antarctica 84 643, 1281, 1848, 1942, 2423
Hussherr et al. 2017 Phytoplankton community Arctic Ocean N/A ~ 250-3300
Yoshimura et al. 2013 Plankton community Bering Sea / Pacific 600 / 450 300, 960, 1190 / 230, 880, 1110
Thoisen et al. 2015 Phytoplankton community West Greenland 8 7.7, 7.4, 7.1
Coello-Camba et al. 2014 Phytoplankton community Arctic Ocean 380 1000
Segovia et al. 2017 Plankton community Norway 390 900
Schulz et al. 2017 Phytoplankton community Norway ~ 300 395, 590, 890, 1165, 1425, 2060, 3045
Bermudez et al. 2016a Plankton community Norway 280 380, 560, 840, 1120, 1400, 2000, 3000
Rossoll et al. 2012 Diatom, Copepod Thalassiosira pseudonana, Acartia tonsa Baltic Sea 380 740
Bermudez et al. 2016b Plankton community Baltic Sea ~347 up to ~1333
Wang et al. 2017 Plankton community China 400 1000
Taucher et al. 2017 Plankton community Sweden N/A ~760
Garzke et al. 2016 Plankton community (copepods) Baltic Sea 560 1400
Cripps et al. 2016 Copepod Acartia tonsa UK 400 1000
3.2.4 / Foraminifera
Manno et al. 2012 Foraminifera Neogloboquadrina pachyderma Fram Strait 380 700
Davis et al. 2017 Foraminifera Globigerina bulloides USA 8.3 8.0, 7.7, 7.5
McIntyre-Wressnig et al. 2013 Foraminifera Amphistegina gibbosa USA 410±30 1000, 2000
McIntyre-Wressnig et al. 2014 Foraminifera Bolivina argentea, Bulimina marginata USA ~420 1000, 2000
Marques et al. 2017 Foraminifera Amphistegina gibbosa Brazil 8.1 7.8, 7.5, 7.2
Sinutok et al. 2011 Algae, Foraminifera Halimeda macroloba, Halimeda cylindracea,
Marginopora vertebralis
Australia 8.1 7.9, 7.7, 7.4
Prazeres et al. 2015 Foraminifera Amphistegina lessonii, Marginopora vertebralis
Australia 430±23 855±30, 1168±36, 2015±20
Fujita et al. 2011 Foraminifera Baculogypsina sphaerulata, Calcarina gaudichaudii, Amphisorus hemprichii
Japan 360 260, 580, 770, 970
Reymond et al. 2013 Foraminifera Marginopora rossi Australia 380 700, 1000
Vogel and Uthicke 2012 Foraminifera Amphistegina radiata, Heterostegina depressa, Marginopora vertebralis
467±16 / 496±26 784±47, 1169±143, 1662±275 / 878±106, 1307±118, 1925±157
Dissard et al. 2010 Foraminifera Ammonia tepida Wadden Sea 230 1900
Table A3.1 cont.
30 AMAP Assessment 2018: Arctic Ocean Acidification

Section / Source Study species / community / assemblage Location
Ocean acidification treatment
CO2, µatm CO2, ppm pH
- - -
Sett et al. 2014 Coccolithophore Emiliania huxleyi, Gephyrocapsa oceanica
Norway, France N/A ~20-6000
Kottmeier et al. 2016 Coccolithophore Emiliania huxleyi Pacific Ocean 403±4 998±15
Fu et al. 2007 Cyanobacteria Synechococcus, Prochlorococcus Sargasso and Mediterranean Seas 380 750
Maat et al. 2014 Picoeukaryote Micromonas pusilla North Sea 370 750
García-Gómez et al. 2016 Green algae Dunaliella tertiolecta Norway 390 900
Webb et al. 2016 Phytoplankton community Baltic Sea 350 390, 840, 1120, 1400
Hoppe et al. 2018 Phytoplankton community Baffin Bay 380 1000
Hoppe et al. 2017 Phytoplankton community Davis Strait 380 1000
Davidson et al. 2016 Microbial communities Antarctica 84 643, 1281, 1848, 1942, 2423
Hussherr et al. 2017 Phytoplankton community Arctic Ocean N/A ~ 250-3300
Yoshimura et al. 2013 Plankton community Bering Sea / Pacific 600 / 450 300, 960, 1190 / 230, 880, 1110
Thoisen et al. 2015 Phytoplankton community West Greenland 8 7.7, 7.4, 7.1
Coello-Camba et al. 2014 Phytoplankton community Arctic Ocean 380 1000
Segovia et al. 2017 Plankton community Norway 390 900
Schulz et al. 2017 Phytoplankton community Norway ~ 300 395, 590, 890, 1165, 1425, 2060, 3045
Bermudez et al. 2016a Plankton community Norway 280 380, 560, 840, 1120, 1400, 2000, 3000
Rossoll et al. 2012 Diatom, Copepod Thalassiosira pseudonana, Acartia tonsa Baltic Sea 380 740
Bermudez et al. 2016b Plankton community Baltic Sea ~347 up to ~1333
Wang et al. 2017 Plankton community China 400 1000
Taucher et al. 2017 Plankton community Sweden N/A ~760
Garzke et al. 2016 Plankton community (copepods) Baltic Sea 560 1400
Cripps et al. 2016 Copepod Acartia tonsa UK 400 1000
3.2.4 / Foraminifera
Manno et al. 2012 Foraminifera Neogloboquadrina pachyderma Fram Strait 380 700
Davis et al. 2017 Foraminifera Globigerina bulloides USA 8.3 8.0, 7.7, 7.5
McIntyre-Wressnig et al. 2013 Foraminifera Amphistegina gibbosa USA 410±30 1000, 2000
McIntyre-Wressnig et al. 2014 Foraminifera Bolivina argentea, Bulimina marginata USA ~420 1000, 2000
Marques et al. 2017 Foraminifera Amphistegina gibbosa Brazil 8.1 7.8, 7.5, 7.2
Sinutok et al. 2011 Algae, Foraminifera Halimeda macroloba, Halimeda cylindracea,
Marginopora vertebralis
Australia 8.1 7.9, 7.7, 7.4
Prazeres et al. 2015 Foraminifera Amphistegina lessonii, Marginopora vertebralis
Australia 430±23 855±30, 1168±36, 2015±20
Fujita et al. 2011 Foraminifera Baculogypsina sphaerulata, Calcarina gaudichaudii, Amphisorus hemprichii
Japan 360 260, 580, 770, 970
Reymond et al. 2013 Foraminifera Marginopora rossi Australia 380 700, 1000
Vogel and Uthicke 2012 Foraminifera Amphistegina radiata, Heterostegina depressa, Marginopora vertebralis
467±16 / 496±26 784±47, 1169±143, 1662±275 / 878±106, 1307±118, 1925±157
Dissard et al. 2010 Foraminifera Ammonia tepida Wadden Sea 230 1900
31Chapter 3 · Biological responses to ocean acidification

Section / Source Study species / community / assemblage Location
Ocean acidification treatment
CO2, µatm CO2, ppm pH
- - -
Haynert and Schönfeld 2014 Foraminifera Ammonia aomoriensis Baltic Sea 566 1195, 2108, 3843
Robbins et al. 2017 Foraminifera Amphistegina gibbosa, Archaias angulatus
USA 8 7.6
Khanna et al. 2013 Foraminifera Haynesina germanica Scotland 380 750, 1000
Knorr et al. 2015 Foraminifera Archaias angulatus USA 480 1328
3.2.5 / Macroalgae
3.2.5.1 / Calcifying macrolgae
Büdenbender et al. 2011 Coralline red algae Lithothamnion glaciale Svalbard 385±26 / 388±45 883±49, 989±57, 1573±89 / 754±80, 958±117, 1563±187
Ragazzola et al. 2012 Coralline red algae Lithothamnion glaciale Kattegat 422 589, 755, 1018
Ragazzola et al. 2013 Coralline red algae Lithothamnion glaciale Kattegat 408 566, 770, 1024
Ragazzola et al. 2016 Coralline red algae Lithothamnion glaciale Kattegat 422 589
Burdett et al. 2012 Coralline red algae Lithothamnion glaciale Scotland 498±161 1081±488, 2778±4047
3.2.5.2 / Non-calcifying macroalgae
Falkenberg et al. 2013 Turf algae, Kelp Feldmannia spp., Ecklonia radiata Australia 280-380 550-650
Celis-Plá et al. 2015 Macroalgal assemblage Italy 500 700-800, 1200
Olischläger et al. 2017 Kelp Saccharina latissima Spitsbergen, North Sea 380 800, 1500
Gordillo et al. 2015 Kelp Alaria esculenta, Saccharina latissima Svalbard 380 1000
Iñiguez et al. 2016 Kelp Saccharina latissima, Laminaria solidungula
Svalbard 390 1200
Gordillo et al. 2016 Chlorophyte, Rhodophytes, Phaeophytes
Monostroma arcticum, Phycodrys rubens, Ptilota plumosa,
Alaria esculenta, Desmarestia aculeata, Saccorhiza dermatodea
Svalbard 390 1100
3.2.6 / Corals
Georgian et al. 2016 Coral Lophelia pertusa USA / Mexico / Cuba, Norway 552±42 / 579±41 831±54, 1165±76 / 845±61, 1208±132
Form and Riebesell 2012 Coral Lophelia pertusa Norway ~509 ~605, 856, 981
Maier et al. 2013a Coral Madrepora oculata, Lophelia pertusa Mediterranean 400 280, 700, 1000
Maier et al. 2013b Coral Lophelia pertusa, Madrepora oculata Mediterranean 400 280, 700, 1000
Hennige et al. 2014 Coral Lophelia pertusa Scotland 380 750
Movilla et al. 2014 Coral Lophelia pertusa, Madrepora oculata Mediterranean 384±23 809±61
Hennige et al. 2015 Coral Lophelia pertusa Scotland 380 750, 1000
Rodolfo-Metalpa et al. 2015 Coral Caryophyllia smithii, Dendrophyllia cornigera, Desmophyllum dianthus
South Adriatic Sea, Malta, Ionian Sea
319 1058
Maier et al. 2016 Coral Madrepora oculata Adriatic Sea 400 800, 1600, 2000
Wall et al. 2015 Coral Lophelia pertusa Norway 405 982±146
3.2.7 / Mollusks
3.2.7.1 / Gastropods
Lischka et al. 2011 Pteropod Limacina helicina Svalbard 380 180, 750, 1150
Comeau et al. 2012 Pteropod Limacina helicina Canada Basin, Arctic Ocean ~380 ~550, 760
Comeau et al. 2010 Pteropod Limacina helicina Svalbard 380 280, 550, 760, 1020
Lischka and Riebesell 2012 Pteropod Limacina helicinaia, Limacina retroversa Svalbard 350 650, 880
Manno et al. 2016 Pteropod Limacina helicina antarctica Southern Ocean 386 750, 1100
Table A3.1 cont.
32 AMAP Assessment 2018: Arctic Ocean Acidification

Section / Source Study species / community / assemblage Location
Ocean acidification treatment
CO2, µatm CO2, ppm pH
- - -
Haynert and Schönfeld 2014 Foraminifera Ammonia aomoriensis Baltic Sea 566 1195, 2108, 3843
Robbins et al. 2017 Foraminifera Amphistegina gibbosa, Archaias angulatus
USA 8 7.6
Khanna et al. 2013 Foraminifera Haynesina germanica Scotland 380 750, 1000
Knorr et al. 2015 Foraminifera Archaias angulatus USA 480 1328
3.2.5 / Macroalgae
3.2.5.1 / Calcifying macrolgae
Büdenbender et al. 2011 Coralline red algae Lithothamnion glaciale Svalbard 385±26 / 388±45 883±49, 989±57, 1573±89 / 754±80, 958±117, 1563±187
Ragazzola et al. 2012 Coralline red algae Lithothamnion glaciale Kattegat 422 589, 755, 1018
Ragazzola et al. 2013 Coralline red algae Lithothamnion glaciale Kattegat 408 566, 770, 1024
Ragazzola et al. 2016 Coralline red algae Lithothamnion glaciale Kattegat 422 589
Burdett et al. 2012 Coralline red algae Lithothamnion glaciale Scotland 498±161 1081±488, 2778±4047
3.2.5.2 / Non-calcifying macroalgae
Falkenberg et al. 2013 Turf algae, Kelp Feldmannia spp., Ecklonia radiata Australia 280-380 550-650
Celis-Plá et al. 2015 Macroalgal assemblage Italy 500 700-800, 1200
Olischläger et al. 2017 Kelp Saccharina latissima Spitsbergen, North Sea 380 800, 1500
Gordillo et al. 2015 Kelp Alaria esculenta, Saccharina latissima Svalbard 380 1000
Iñiguez et al. 2016 Kelp Saccharina latissima, Laminaria solidungula
Svalbard 390 1200
Gordillo et al. 2016 Chlorophyte, Rhodophytes, Phaeophytes
Monostroma arcticum, Phycodrys rubens, Ptilota plumosa,
Alaria esculenta, Desmarestia aculeata, Saccorhiza dermatodea
Svalbard 390 1100
3.2.6 / Corals
Georgian et al. 2016 Coral Lophelia pertusa USA / Mexico / Cuba, Norway 552±42 / 579±41 831±54, 1165±76 / 845±61, 1208±132
Form and Riebesell 2012 Coral Lophelia pertusa Norway ~509 ~605, 856, 981
Maier et al. 2013a Coral Madrepora oculata, Lophelia pertusa Mediterranean 400 280, 700, 1000
Maier et al. 2013b Coral Lophelia pertusa, Madrepora oculata Mediterranean 400 280, 700, 1000
Hennige et al. 2014 Coral Lophelia pertusa Scotland 380 750
Movilla et al. 2014 Coral Lophelia pertusa, Madrepora oculata Mediterranean 384±23 809±61
Hennige et al. 2015 Coral Lophelia pertusa Scotland 380 750, 1000
Rodolfo-Metalpa et al. 2015 Coral Caryophyllia smithii, Dendrophyllia cornigera, Desmophyllum dianthus
South Adriatic Sea, Malta, Ionian Sea
319 1058
Maier et al. 2016 Coral Madrepora oculata Adriatic Sea 400 800, 1600, 2000
Wall et al. 2015 Coral Lophelia pertusa Norway 405 982±146
3.2.7 / Mollusks
3.2.7.1 / Gastropods
Lischka et al. 2011 Pteropod Limacina helicina Svalbard 380 180, 750, 1150
Comeau et al. 2012 Pteropod Limacina helicina Canada Basin, Arctic Ocean ~380 ~550, 760
Comeau et al. 2010 Pteropod Limacina helicina Svalbard 380 280, 550, 760, 1020
Lischka and Riebesell 2012 Pteropod Limacina helicinaia, Limacina retroversa Svalbard 350 650, 880
Manno et al. 2016 Pteropod Limacina helicina antarctica Southern Ocean 386 750, 1100
33Chapter 3 · Biological responses to ocean acidification

Section / Source Study species / community / assemblage Location
Ocean acidification treatment
CO2, µatm CO2, ppm pH
- - -
Koh et al. 2015 Pteropod Limacina helicina Svalbard 8.23 7.5, 6.5
Thabet et al. 2017 Pteropod Clione limacina USA ~440 ~1000-1080
Maboloc and Chan 2017 Limpet Crepidula onyx Hong Kong ~400-450 ~960-970, 1800-2000
Noisette et al. 2016 Limpet Crepidula fornicata France 390 750, 1400
Schram et al. 2016 Limpet, Snail Nacella concinna, Margarella antarctica Antarctica 371±160 944±888
Schram et al. 2014 Limpet, Mesograstropod snail
Nacella concinna, Margarella antarctica Antarctic 371±13 994±70
Guo et al. 2015 Abalone, Oyster Haliotis diversicolor, Haliotis discus hannai, Crassostrea angulata
China 400 800, 1500, 2000, 3000
Crim et al. 2011 Abalone Haliotis kamtschatkana Canada 400 800, 1800
Byrne et al. 2011 Abalone, Sea urchin Haliotis coccoradiata, Heliocidaris erythrogramma
Australia 380 700-1000, >2000
Cunningham et al. 2016 Abalone Haliotis iris New Zealand ~450 ~1000, 1600
Zippay and Hofmann 2010 Abalone Haliotis rufescens USA 380 570, 990
Ellis et al. 2009 Periwinkle Littorina obtusata UK 8.1 7.6
3.2.7.2 / Bivalves
Goethel et al. 2017 Clams Macoma calcarea, Astarte montagui, Astarte borealis
Chukchi Sea 637 1267
Bylenga et al. 2015 Clam Laternula elliptica Antarctica ~350 ~560, 825
Bylenga et al. 2017 Clam Laternula elliptica Antarctica ~460 ~710, 1040
3.2.7.3 / Cephalopods
Rosa et al. 2013 Cuttlefish Sepia officinalis Portugal 8 7.5
Rosa and Seibel 2008 Jumbo squid Dosidicus gigas USA 7.93±0.05 7.62±0.08
Hu et al. 2014b Squid Sepioteuhis lessoniana Taiwan 625±12 1286±253, 4134±169
Kaplan et al. 2013 Squid Doryteuthis pealeii USA 390 2200
Sigwart et al. 2016 Cuttlefish Sepia officinalis France ~8 ~7.8, 7.3
Dorey et al. 2013 Cuttlefish Sepia officinalis Monaco ~390 ~800, 1400
Gutowska et al. 2008 Cuttlefish Sepia officinalis France ~650 ~4000, 6000
Gutowska et al. 2010 Cuttlefish Sepia officinalis France 8.01±0.04 7.10±0.03
Spady et al. 2014 Squid Idiosepius pygmaeus Australia 447 626, 956
3.2.8 / Echinoderms
Bögner et al. 2014 Sea urchin Strongylocentrotus droebachiensis Svalbard ~380 ~180, 550-800, 1300, 2000
Ericson et al. 2010 Sea urchin, Nemertean worm
Sterechinus neumayeri, Parborlasia corrugatus
Antarctica 528 1122, 2886, 5806
Ericson et al. 2012 Sea urchin Sterechinus neumayeri Antarctica 450 850, 1370
Yu et al. 2013 Sea urchin Sterechinus neumayeri Antarctica 410 510, 730
Kapsenberg and Hofmann 2014 Sea urchin Sterechinus neumayeri Antarctica 400 650, 1000
Byrne et al. 2013 Sea urchin Sterechinus neumayeri Antarctica 433 927, 1417
Clark et al. 2009 Sea urchin Tripneustes gratilla, Pseudechinus huttoni, Evechinus chloroticus,
Sterechinus neumayeri
Antarctica, New Zealand, Cook Islands
395-521 1119-1380
Wood et al. 2011 Brittlestar Ophiocten sericeum Svalbard 259±23 774±96, 1788±306
Wood et al. 2010 Brittlestar Ophura ophiura UK 553±54 1400±75, 2546±205
Table A3.1 cont.
34 AMAP Assessment 2018: Arctic Ocean Acidification

Section / Source Study species / community / assemblage Location
Ocean acidification treatment
CO2, µatm CO2, ppm pH
- - -
Koh et al. 2015 Pteropod Limacina helicina Svalbard 8.23 7.5, 6.5
Thabet et al. 2017 Pteropod Clione limacina USA ~440 ~1000-1080
Maboloc and Chan 2017 Limpet Crepidula onyx Hong Kong ~400-450 ~960-970, 1800-2000
Noisette et al. 2016 Limpet Crepidula fornicata France 390 750, 1400
Schram et al. 2016 Limpet, Snail Nacella concinna, Margarella antarctica Antarctica 371±160 944±888
Schram et al. 2014 Limpet, Mesograstropod snail
Nacella concinna, Margarella antarctica Antarctic 371±13 994±70
Guo et al. 2015 Abalone, Oyster Haliotis diversicolor, Haliotis discus hannai, Crassostrea angulata
China 400 800, 1500, 2000, 3000
Crim et al. 2011 Abalone Haliotis kamtschatkana Canada 400 800, 1800
Byrne et al. 2011 Abalone, Sea urchin Haliotis coccoradiata, Heliocidaris erythrogramma
Australia 380 700-1000, >2000
Cunningham et al. 2016 Abalone Haliotis iris New Zealand ~450 ~1000, 1600
Zippay and Hofmann 2010 Abalone Haliotis rufescens USA 380 570, 990
Ellis et al. 2009 Periwinkle Littorina obtusata UK 8.1 7.6
3.2.7.2 / Bivalves
Goethel et al. 2017 Clams Macoma calcarea, Astarte montagui, Astarte borealis
Chukchi Sea 637 1267
Bylenga et al. 2015 Clam Laternula elliptica Antarctica ~350 ~560, 825
Bylenga et al. 2017 Clam Laternula elliptica Antarctica ~460 ~710, 1040
3.2.7.3 / Cephalopods
Rosa et al. 2013 Cuttlefish Sepia officinalis Portugal 8 7.5
Rosa and Seibel 2008 Jumbo squid Dosidicus gigas USA 7.93±0.05 7.62±0.08
Hu et al. 2014b Squid Sepioteuhis lessoniana Taiwan 625±12 1286±253, 4134±169
Kaplan et al. 2013 Squid Doryteuthis pealeii USA 390 2200
Sigwart et al. 2016 Cuttlefish Sepia officinalis France ~8 ~7.8, 7.3
Dorey et al. 2013 Cuttlefish Sepia officinalis Monaco ~390 ~800, 1400
Gutowska et al. 2008 Cuttlefish Sepia officinalis France ~650 ~4000, 6000
Gutowska et al. 2010 Cuttlefish Sepia officinalis France 8.01±0.04 7.10±0.03
Spady et al. 2014 Squid Idiosepius pygmaeus Australia 447 626, 956
3.2.8 / Echinoderms
Bögner et al. 2014 Sea urchin Strongylocentrotus droebachiensis Svalbard ~380 ~180, 550-800, 1300, 2000
Ericson et al. 2010 Sea urchin, Nemertean worm
Sterechinus neumayeri, Parborlasia corrugatus
Antarctica 528 1122, 2886, 5806
Ericson et al. 2012 Sea urchin Sterechinus neumayeri Antarctica 450 850, 1370
Yu et al. 2013 Sea urchin Sterechinus neumayeri Antarctica 410 510, 730
Kapsenberg and Hofmann 2014 Sea urchin Sterechinus neumayeri Antarctica 400 650, 1000
Byrne et al. 2013 Sea urchin Sterechinus neumayeri Antarctica 433 927, 1417
Clark et al. 2009 Sea urchin Tripneustes gratilla, Pseudechinus huttoni, Evechinus chloroticus,
Sterechinus neumayeri
Antarctica, New Zealand, Cook Islands
395-521 1119-1380
Wood et al. 2011 Brittlestar Ophiocten sericeum Svalbard 259±23 774±96, 1788±306
Wood et al. 2010 Brittlestar Ophura ophiura UK 553±54 1400±75, 2546±205
35Chapter 3 · Biological responses to ocean acidification

Section / Source Study species / community / assemblage Location
Ocean acidification treatment
CO2, µatm CO2, ppm pH
- - -
Wood et al. 2008 Brittlestar Amphiura filiformis UK 8 7.7, 7.3, 6.8
Dupont et al. 2008 Brittlestar Ophiothrix fragilis Sweden 8.1 7.9, 7.7
Chan et al. 2015 Sea urchin / Brittlestar Strongylocentrotus purpuratus / Amphiurafiliformis
USA / Sweden 458±32 / 425±13 1078±48, 2993±188 / 1126±83
Hu et al. 2014a Brittlestar Amphiura filiformis Sweden 8.1 7.6, 7.3, 7.0
Gonzalez-Bernat et al. 2013 Seastar Odontaster validus Antarctica 327 691, 1130, 4604
Dupont and Thorndyke 2012 Sea urchin, Seastar Strongylocentrotus droebachiensis, Leptasterias polaris
Arctic 350 1275
Verkaik et al. 2016 Sea cucumber Cucumaria frondosa Newfoundland 446±22 1427±100
Yuan et al. 2016 Sea cucumber Apostichopus japonicus China ~380 ~750, 1900
Morita et al. 2010 Coral, Sea cucumber Acropora digitifera, Holothuria spp. Japan 400-475 775-1005, 930-1260, 905-1660, 2115-3585,
12600-21100
Yuan et al. 2015 Sea cucumber Apostichopus japonicus China 601±10 962±15, 1441±21, 2801±25
3.2.9 / Crustaceans
Bailey et al. 2016 Copepod Calanus glacialis Svalbard 530 320, 800, 1700
Bailey et al. 2017 Copepod Calanus glacialis Svalbard 530 320, 800, 1700
Thor et al. 2016 Copepod Calanus glacialis Svalbard 335-361 871-1060
Thor et al. 2018a Copepod Calanus glacialis Svalbard (Kongsfjord / Billefjord) / West Greenland
450±95 / 446±93 / 436±64
712±134 to 18567±2163 (8 treatments) /
638±49 to 4526±499 (6 treatments) /
721±91 to 19456±3521 (8 treatments)
Hildebrandt et al. 2014 Copepod Calanus glacialis, Calanus hyperboreus Fram Strait 390 3000
Hildebrandt et al. 2016 Copepod Calanus finmarchicus, Calanus glacialis Fram Strait 390 1120, 3000
Weydmann et al. 2012 Copepod Calanus glacialis Svalbard 8.2 7.6, 6.9
Thor et al. 2018b Copepod Calanus glacialis Svalbard ~8.0 ~7.5
Niehoff et al. 2013 Mesozooplankton community Svalbard 185 270, 375, 480, 685, 820, 1050, 1420
Engel et al. 2013 Plankton community Svalbard 178 180, 255, 345, 435, 611, 701, 892, 1136
Walther et al. 2011 Spider crab Hyas araneus Germany, Svalbard 380 710, 3000
Schiffer et al. 2014 Spider crab Hyas araneus Sweden 450 3300
Zittier et al. 2013 Spider crab Hyas araneus Svalbard 380 750, 1120, 3000
Long et al. 2013 Red king crab, Tanner crab Paralithodes camtschaticus, Chionoecetes bairdi
Alaska 438±9 792±7, 1638±14
Appelhans et al. 2012 Seastar, Green crab Asterias rubens, Carcinus maenas Baltic Sea 650 1250, 3500
Fehsenfeld and Weihrauch 2013 Green crab Carcinus maenas Canada 7.7 7
Fehsenfeld et al. 2011 Green crab Carcinus maenas Baltic Sea 8.00-8.12 7.24-7.36
Hammer et al. 2012 Green crab Carcinus maenas Norway ~490 ~ 2600, 7600, 16000, 30000
Arnold et al. 2009 European lobster Homarus gammarus UK 380 1200
Small et al. 2016 European lobster Homarus gammarus UK 450 1100, 9000
Agnalt et al. 2013 European lobster Homarus gammarus Norway ~690 750, 1200
Bechmann et al. 2011 Shrimp / Mussel Pandalus borealis / Mytilus edulis Norway 368-361 / 419-469 1291-1332 / 1388-1493
Table A3.1 cont.
36 AMAP Assessment 2018: Arctic Ocean Acidification

Section / Source Study species / community / assemblage Location
Ocean acidification treatment
CO2, µatm CO2, ppm pH
- - -
Wood et al. 2008 Brittlestar Amphiura filiformis UK 8 7.7, 7.3, 6.8
Dupont et al. 2008 Brittlestar Ophiothrix fragilis Sweden 8.1 7.9, 7.7
Chan et al. 2015 Sea urchin / Brittlestar Strongylocentrotus purpuratus / Amphiurafiliformis
USA / Sweden 458±32 / 425±13 1078±48, 2993±188 / 1126±83
Hu et al. 2014a Brittlestar Amphiura filiformis Sweden 8.1 7.6, 7.3, 7.0
Gonzalez-Bernat et al. 2013 Seastar Odontaster validus Antarctica 327 691, 1130, 4604
Dupont and Thorndyke 2012 Sea urchin, Seastar Strongylocentrotus droebachiensis, Leptasterias polaris
Arctic 350 1275
Verkaik et al. 2016 Sea cucumber Cucumaria frondosa Newfoundland 446±22 1427±100
Yuan et al. 2016 Sea cucumber Apostichopus japonicus China ~380 ~750, 1900
Morita et al. 2010 Coral, Sea cucumber Acropora digitifera, Holothuria spp. Japan 400-475 775-1005, 930-1260, 905-1660, 2115-3585,
12600-21100
Yuan et al. 2015 Sea cucumber Apostichopus japonicus China 601±10 962±15, 1441±21, 2801±25
3.2.9 / Crustaceans
Bailey et al. 2016 Copepod Calanus glacialis Svalbard 530 320, 800, 1700
Bailey et al. 2017 Copepod Calanus glacialis Svalbard 530 320, 800, 1700
Thor et al. 2016 Copepod Calanus glacialis Svalbard 335-361 871-1060
Thor et al. 2018a Copepod Calanus glacialis Svalbard (Kongsfjord / Billefjord) / West Greenland
450±95 / 446±93 / 436±64
712±134 to 18567±2163 (8 treatments) /
638±49 to 4526±499 (6 treatments) /
721±91 to 19456±3521 (8 treatments)
Hildebrandt et al. 2014 Copepod Calanus glacialis, Calanus hyperboreus Fram Strait 390 3000
Hildebrandt et al. 2016 Copepod Calanus finmarchicus, Calanus glacialis Fram Strait 390 1120, 3000
Weydmann et al. 2012 Copepod Calanus glacialis Svalbard 8.2 7.6, 6.9
Thor et al. 2018b Copepod Calanus glacialis Svalbard ~8.0 ~7.5
Niehoff et al. 2013 Mesozooplankton community Svalbard 185 270, 375, 480, 685, 820, 1050, 1420
Engel et al. 2013 Plankton community Svalbard 178 180, 255, 345, 435, 611, 701, 892, 1136
Walther et al. 2011 Spider crab Hyas araneus Germany, Svalbard 380 710, 3000
Schiffer et al. 2014 Spider crab Hyas araneus Sweden 450 3300
Zittier et al. 2013 Spider crab Hyas araneus Svalbard 380 750, 1120, 3000
Long et al. 2013 Red king crab, Tanner crab Paralithodes camtschaticus, Chionoecetes bairdi
Alaska 438±9 792±7, 1638±14
Appelhans et al. 2012 Seastar, Green crab Asterias rubens, Carcinus maenas Baltic Sea 650 1250, 3500
Fehsenfeld and Weihrauch 2013 Green crab Carcinus maenas Canada 7.7 7
Fehsenfeld et al. 2011 Green crab Carcinus maenas Baltic Sea 8.00-8.12 7.24-7.36
Hammer et al. 2012 Green crab Carcinus maenas Norway ~490 ~ 2600, 7600, 16000, 30000
Arnold et al. 2009 European lobster Homarus gammarus UK 380 1200
Small et al. 2016 European lobster Homarus gammarus UK 450 1100, 9000
Agnalt et al. 2013 European lobster Homarus gammarus Norway ~690 750, 1200
Bechmann et al. 2011 Shrimp / Mussel Pandalus borealis / Mytilus edulis Norway 368-361 / 419-469 1291-1332 / 1388-1493
37Chapter 3 · Biological responses to ocean acidification

Section / Source Study species / community / assemblage Location
Ocean acidification treatment
CO2, µatm CO2, ppm pH
- - -
Arnberg et al. 2013 Shrimp Pandalus borealis Norway 337-474 1038-1437
Dupont et al. 2014 Shrimp Pandalus borealis Sweden 459±5 1368±7
Findlay et al. 2010 Barnacle Semibalanus balanoides Svalbard 352±28 1086±95, 2429±335
3.2.10 / Other invertebrates
Lesniowski et al. 2015 Scyphozoan jellyfish Cyanea capillata, Chrysaora hysoscella Germany 200 800
Cross et al. 2015 Brachiopod Liothyrella uva Antarctica 365±67 725±133, 1221±179
McClintock et al. 2009 Bivalves, Limpet, Brachiopod
Laternula elliptica, Yoldia eightsi, Nacella concinna, Liothyrella uva
Antarctica 8.2 7.4
Cross et al. 2016 Brachiopod Calloria inconspicua New Zealand 465±83 1130±12, 1536±235
Turner et al. 2015 Polychaete Sabella spallanzanii Mediterranean 502±10 6144±553
Verkaik et al. 2017 Polychaete Ophryotrocha sp. Canada 475±68 1508±216
Lee et al. 2017 Meiofaunal assemblage Chile 400 1000
Dashfield et al. 2008 Nematode community Norway 8 7.5
Hale et al. 2011 Benthic community UK 8 7.7, 7.3, 6.7,
Meadows et al. 2015 Meiobenthic community UK 8 7.7, 7.3, 6.7
Widdicombe et al. 2009 Macrofaunal and nematode assemblage Norway 8 7.3, 6.5, 5.6
3.2.11 / Fishes
Kunz et al. 2016 Polar cod / Atlantic cod Boreogadus saida / Gadus morhua Norway 390 1170
Stapp et al. 2015 Atlantic cod Gadus morhua Germany 7.9 7
Hu et al. 2016 Atlantic cod Gadus morhua Sweden 8.1 7.8, 7.6
Michael et al. 2016 Atlantic cod Gadus morhua Sweden 550 1200, 2200
Leo et al. 2017 Polar cod, Atlantic cod Boreogadus saida, Gadus morhua Svalbard 400 1170
Frommel et al. 2010 Baltic cod Gadus morhua Baltic Sea ~8.1 ~ 7.6
Dahlke et al. 2017 Atlantic cod Gadus morhua Sweden 400 1100
Stiasny et al. 2016 Atlantic cod Gadus morhua Western Baltic Sea / Barents Sea ~400 ~1100
Maneja et al. 2013b Atlantic cod Gadus morhua Norway 370 1800, 4200
Frommel et al. 2012 Atlantic cod Gadus morhua Norway 380 1800, 4200
Frommel et al. 2014 Atlantic herring Clupea harengus Norway 8.08 7.45, 7.07
Frommel et al. 2013 Baltic cod Gadus morhua Baltic Sea 380 560, 860, 1120, 1400, 4000
Schmidt et al. 2017a Polar cod, Atlantic cod Boreogadus saida, Gadus morhua Svalbard 374-515 852-1416
Schmidt et al. 2017b Polar cod, Atlantic cod Boreogadus saida, Gadus morhua Norway 396-548 915-1272
Melzner et al. 2009 Atlantic cod Gadus morhua Norway / Germany 8.01±0.08 / 8.02±0.06 7.01±0.03 / 7.30±0.03
Maneja et al. 2013a Atlantic cod Gadus morhua Norway 370 1800, 4200
Jutfelt and Hedgärde 2013 Atlantic cod Gadus morhua Sweden 550 1170
Jutfelt and Hedgärde 2015 Atlantic cod Gadus morhua Sweden 500 1000
3.2.12 / Seabirds and mammals
3.3 / Ecosystems, habitats
Tarling et al. 2016 Pelagic community Nordic, Scotia, Weddell Seas 300 750, 1000
Bibby et al. 2007 Gastropod Littorina littorea UK 7.97-8.02 6.56-6.73
Table A3.1 cont.
38 AMAP Assessment 2018: Arctic Ocean Acidification

Section / Source Study species / community / assemblage Location
Ocean acidification treatment
CO2, µatm CO2, ppm pH
- - -
Arnberg et al. 2013 Shrimp Pandalus borealis Norway 337-474 1038-1437
Dupont et al. 2014 Shrimp Pandalus borealis Sweden 459±5 1368±7
Findlay et al. 2010 Barnacle Semibalanus balanoides Svalbard 352±28 1086±95, 2429±335
3.2.10 / Other invertebrates
Lesniowski et al. 2015 Scyphozoan jellyfish Cyanea capillata, Chrysaora hysoscella Germany 200 800
Cross et al. 2015 Brachiopod Liothyrella uva Antarctica 365±67 725±133, 1221±179
McClintock et al. 2009 Bivalves, Limpet, Brachiopod
Laternula elliptica, Yoldia eightsi, Nacella concinna, Liothyrella uva
Antarctica 8.2 7.4
Cross et al. 2016 Brachiopod Calloria inconspicua New Zealand 465±83 1130±12, 1536±235
Turner et al. 2015 Polychaete Sabella spallanzanii Mediterranean 502±10 6144±553
Verkaik et al. 2017 Polychaete Ophryotrocha sp. Canada 475±68 1508±216
Lee et al. 2017 Meiofaunal assemblage Chile 400 1000
Dashfield et al. 2008 Nematode community Norway 8 7.5
Hale et al. 2011 Benthic community UK 8 7.7, 7.3, 6.7,
Meadows et al. 2015 Meiobenthic community UK 8 7.7, 7.3, 6.7
Widdicombe et al. 2009 Macrofaunal and nematode assemblage Norway 8 7.3, 6.5, 5.6
3.2.11 / Fishes
Kunz et al. 2016 Polar cod / Atlantic cod Boreogadus saida / Gadus morhua Norway 390 1170
Stapp et al. 2015 Atlantic cod Gadus morhua Germany 7.9 7
Hu et al. 2016 Atlantic cod Gadus morhua Sweden 8.1 7.8, 7.6
Michael et al. 2016 Atlantic cod Gadus morhua Sweden 550 1200, 2200
Leo et al. 2017 Polar cod, Atlantic cod Boreogadus saida, Gadus morhua Svalbard 400 1170
Frommel et al. 2010 Baltic cod Gadus morhua Baltic Sea ~8.1 ~ 7.6
Dahlke et al. 2017 Atlantic cod Gadus morhua Sweden 400 1100
Stiasny et al. 2016 Atlantic cod Gadus morhua Western Baltic Sea / Barents Sea ~400 ~1100
Maneja et al. 2013b Atlantic cod Gadus morhua Norway 370 1800, 4200
Frommel et al. 2012 Atlantic cod Gadus morhua Norway 380 1800, 4200
Frommel et al. 2014 Atlantic herring Clupea harengus Norway 8.08 7.45, 7.07
Frommel et al. 2013 Baltic cod Gadus morhua Baltic Sea 380 560, 860, 1120, 1400, 4000
Schmidt et al. 2017a Polar cod, Atlantic cod Boreogadus saida, Gadus morhua Svalbard 374-515 852-1416
Schmidt et al. 2017b Polar cod, Atlantic cod Boreogadus saida, Gadus morhua Norway 396-548 915-1272
Melzner et al. 2009 Atlantic cod Gadus morhua Norway / Germany 8.01±0.08 / 8.02±0.06 7.01±0.03 / 7.30±0.03
Maneja et al. 2013a Atlantic cod Gadus morhua Norway 370 1800, 4200
Jutfelt and Hedgärde 2013 Atlantic cod Gadus morhua Sweden 550 1170
Jutfelt and Hedgärde 2015 Atlantic cod Gadus morhua Sweden 500 1000
3.2.12 / Seabirds and mammals
3.3 / Ecosystems, habitats
Tarling et al. 2016 Pelagic community Nordic, Scotia, Weddell Seas 300 750, 1000
Bibby et al. 2007 Gastropod Littorina littorea UK 7.97-8.02 6.56-6.73
39Chapter 3 · Biological responses to ocean acidification

Section / Source Study species / community / assemblage Location
Ocean acidification treatment
CO2, µatm CO2, ppm pH
- - -
Lesniowski et al. 2015 Scyphozoan jellyfish Cyanea capillata, Chrysaora hysoscella German Bight 200 800
Goethel et al. 2017 Bivalves Macoma calcarea, Astarte montagui, Astarte borealis
Chukchi Sea 637 1267
3.4 / Acclimation and adaptation
Form and Riebesell 2012 Coral Lophelia pertusa Norway ~509 ~605, 856, 981
Leo et al. 2017 Polar cod, Atlantic cod Boreogadus saida, Gadus morhua Svalbard 400 1170
Dupont and Thorndyke 2012 Sea urchin, Seastar Strongylocentrotus droebachiensis, Leptasterias polaris
Arctic 350 1275
Monier et al. 2014 Microbial community Ellef Ringnes Island 400 880, 1800
Thabet et al. 2017 Pteropod Clione limacina USA ~440 ~1000-1080
Ragazzola et al. 2013 Coralline red algae Lithothamnion glaciale Kattegat 408 566, 770, 1024
Lohbeck et al. 2012 Coccolithophore Emiliania huxleyi Norway 400 1100, 2200
Schaum et al. 2013 Picoplankton Ostreococcus Thau lagoon, Mediterranean, North Sea, Atlantic Ocean, Red Sea, English Channel, North Sea, Spanish coast,
West Mediterranean
380 1000
Thor and Dupont 2015 Copepod Pseudocalanus acuspes Sweden 400 900, 1550
De Wit et al. 2016 Copepod Pseudocalanus acuspes Sweden 400 900, 1550
Miller et al. 2012 Anemonefish Amphiprion melanopus Australia 430 581, 1032
3.5 / Interactive effects, multistressor environment
Coello-Camba et al. 2014 Phytoplankton community Arctic Ocean 380 1000
Gordillo et al. 2016 Chlorophyte, Rhodophytes, Phaeophytes
Monostroma arcticum, Phycodrys rubens, Ptilota plumosa,
Alaria esculenta, Desmarestia aculeata, Saccorhiza dermatodea
Svalbard 390 1100
Iñiguez et al. 2016 Kelp Saccharina latissima, Laminaria solidungula
Svalbard 390 1200
Olischläger et al. 2017 Kelp Saccharina latissima Spitsbergen, North Sea 380 800, 1500
Lischka and Riebesell 2012 Pteropod Limacina helicinaia, Limacina retroversa Svalbard 350 650, 880
Dahlke et al. 2017 Atlantic cod Gadus morhua Sweden 400 1100
Leo et al. 2017 Polar cod, Atlantic cod Boreogadus saida, Gadus morhua Svalbard 400 1170
Hoppe et al. 2018 Phytoplankton community Baffin Bay 380 1000
Gordillo et al. 2015 Kelp Alaria esculenta, Saccharina latissima Svalbard 380 1000
Marques et al. 2017 Foraminifera Amphistegina gibbosa Brazil 8.1 7.8, 7.5, 7.2
Maat et al. 2014 Picoeukaryote Micromonas pusilla North Sea 370 750
Reymond et al. 2013 Foraminifera Marginopora rossi Australia 380 700, 1000
Haynert and Schönfeld 2014 Foraminifera Ammonia aomoriensis Baltic Sea 566 1195, 2108, 3843
Celis-Plá et al. 2015 Macroalgal assemblage Italy 500 700-800, 1200
Lesniowski et al. 2015 Scyphozoan jellyfish Cyanea capillata, Chrysaora hysoscella German Bight 200 800
Maier et al. 2016 Coral Madrepora oculata Adriatic Sea 400 800, 1600, 2000
Dashfield et al. 2008 Nematode community Norway 8 7.5
Falkenberg et al. 2012 Kelp, Turf Ecklonia radiata, Feldmannia spp. Australia 280-380 550-650
Falkenberg et al. 2014 Turf, Gastropod Feldmannia spp., Austrocochlea concamerata, Austrocochlea odontis
Australia ~380 ~580
Table A3.1 cont.
40 AMAP Assessment 2018: Arctic Ocean Acidification

Section / Source Study species / community / assemblage Location
Ocean acidification treatment
CO2, µatm CO2, ppm pH
- - -
Lesniowski et al. 2015 Scyphozoan jellyfish Cyanea capillata, Chrysaora hysoscella German Bight 200 800
Goethel et al. 2017 Bivalves Macoma calcarea, Astarte montagui, Astarte borealis
Chukchi Sea 637 1267
3.4 / Acclimation and adaptation
Form and Riebesell 2012 Coral Lophelia pertusa Norway ~509 ~605, 856, 981
Leo et al. 2017 Polar cod, Atlantic cod Boreogadus saida, Gadus morhua Svalbard 400 1170
Dupont and Thorndyke 2012 Sea urchin, Seastar Strongylocentrotus droebachiensis, Leptasterias polaris
Arctic 350 1275
Monier et al. 2014 Microbial community Ellef Ringnes Island 400 880, 1800
Thabet et al. 2017 Pteropod Clione limacina USA ~440 ~1000-1080
Ragazzola et al. 2013 Coralline red algae Lithothamnion glaciale Kattegat 408 566, 770, 1024
Lohbeck et al. 2012 Coccolithophore Emiliania huxleyi Norway 400 1100, 2200
Schaum et al. 2013 Picoplankton Ostreococcus Thau lagoon, Mediterranean, North Sea, Atlantic Ocean, Red Sea, English Channel, North Sea, Spanish coast,
West Mediterranean
380 1000
Thor and Dupont 2015 Copepod Pseudocalanus acuspes Sweden 400 900, 1550
De Wit et al. 2016 Copepod Pseudocalanus acuspes Sweden 400 900, 1550
Miller et al. 2012 Anemonefish Amphiprion melanopus Australia 430 581, 1032
3.5 / Interactive effects, multistressor environment
Coello-Camba et al. 2014 Phytoplankton community Arctic Ocean 380 1000
Gordillo et al. 2016 Chlorophyte, Rhodophytes, Phaeophytes
Monostroma arcticum, Phycodrys rubens, Ptilota plumosa,
Alaria esculenta, Desmarestia aculeata, Saccorhiza dermatodea
Svalbard 390 1100
Iñiguez et al. 2016 Kelp Saccharina latissima, Laminaria solidungula
Svalbard 390 1200
Olischläger et al. 2017 Kelp Saccharina latissima Spitsbergen, North Sea 380 800, 1500
Lischka and Riebesell 2012 Pteropod Limacina helicinaia, Limacina retroversa Svalbard 350 650, 880
Dahlke et al. 2017 Atlantic cod Gadus morhua Sweden 400 1100
Leo et al. 2017 Polar cod, Atlantic cod Boreogadus saida, Gadus morhua Svalbard 400 1170
Hoppe et al. 2018 Phytoplankton community Baffin Bay 380 1000
Gordillo et al. 2015 Kelp Alaria esculenta, Saccharina latissima Svalbard 380 1000
Marques et al. 2017 Foraminifera Amphistegina gibbosa Brazil 8.1 7.8, 7.5, 7.2
Maat et al. 2014 Picoeukaryote Micromonas pusilla North Sea 370 750
Reymond et al. 2013 Foraminifera Marginopora rossi Australia 380 700, 1000
Haynert and Schönfeld 2014 Foraminifera Ammonia aomoriensis Baltic Sea 566 1195, 2108, 3843
Celis-Plá et al. 2015 Macroalgal assemblage Italy 500 700-800, 1200
Lesniowski et al. 2015 Scyphozoan jellyfish Cyanea capillata, Chrysaora hysoscella German Bight 200 800
Maier et al. 2016 Coral Madrepora oculata Adriatic Sea 400 800, 1600, 2000
Dashfield et al. 2008 Nematode community Norway 8 7.5
Falkenberg et al. 2012 Kelp, Turf Ecklonia radiata, Feldmannia spp. Australia 280-380 550-650
Falkenberg et al. 2014 Turf, Gastropod Feldmannia spp., Austrocochlea concamerata, Austrocochlea odontis
Australia ~380 ~580
41Chapter 3 · Biological responses to ocean acidification

Arctic Monitoring and Assessment Programme
� e Arctic Monitoring and Assessment Programme (AMAP) was established in June 1991 by the eight Arctic countries (Canada, Denmark, Finland, Iceland, Norway, Russia, Sweden and the United States) to implement parts of the Arctic Environmental Protection Strategy (AEPS). AMAP is now one of six working groups of the Arctic Council, members of which include the eight Arctic countries, the six Arctic Council Permanent Participants (indigenous peoples’ organizations), together with observing countries and organizations.
AMAP’s objective is to provide ‘reliable and suffi cient information on the status of, and threats to, the Arctic environment, and to provide scientifi c advice on actions to be taken in order to support Arctic governments in their eff orts to take remedial and preventive actions to reduce adverse eff ects of contaminants and climate change’.
AMAP produces, at regular intervals, assessment reports that address a range of Arctic pollution and climate change issues, including eff ects on health of Arctic human populations. � ese are presented to Arctic Council Ministers in ‘State of the Arctic Environment’ reports that form a basis for necessary steps to be taken to protect the Arctic and its inhabitants.
� is report has been subject to a formal and comprehensive peer review process. � e results and any views expressed in this series are the responsibility of those scientists and experts engaged in the preparation of the reports.
� e AMAP Secretariat is located in Tromsø, Norway. For further information regarding AMAP or ordering of reports, please contact the AMAP Secretariat (� e Fram Centre, Box 6606 Langnes, 9296 Tromsø, Norway) or visit the AMAP website at www.amap.no.
Educational use: � is report (in part or in its entirety) and other AMAP products available from www.amap.no can be used freely as teaching materials and for other educational purposes.
� e only condition of such use is acknowledgement of AMAP as the source of the material according to the recommended citation.
In case of questions regarding educational use, please contact the AMAP Secretariat ([email protected]).
Note: � is report may contain material (e.g. photographs) for which permission for use will need to be obtained from original copyright holders.
Disclaimer: � e views expressed in this peer-reviewed report are the responsibility of the authors of the report and do not necessarily refl ect the views of the Arctic Council, its members or its observers.

AM
AP A
ssessment 2018: A
rctic Ocean A
cidifi cation
AMAP Secretariat
The Fram Centre,Box 6606 Langnes,9296 Tromsø, Norway
T +47 21 08 04 80F +47 21 08 04 85
www.amap.no
ISBN – 978-82-7971-107-0
Arctic Monitoring and Assessment Programme (AMAP)
AMAP Assessment 2018:Arctic Ocean Acidification

![Ecuador Nature Oriented Tourism FRAME AMAP Assessment[1]](https://static.fdocuments.us/doc/165x107/577d2fcb1a28ab4e1eb2b4f0/ecuador-nature-oriented-tourism-frame-amap-assessment1.jpg)