Amanda Neil Vera Morgan Final 13 March 2015
36
Amanda Neil Vera Morgan Final 13 March 2015
Transcript of Amanda Neil Vera Morgan Final 13 March 2015
Amanda Neil Vera Morgan
Final 13 March 2015

North Metropolitan Health Service Survey of High Impact Psychosis (NM-SHIP): Costs
Authors and affiliations Dr Amanda Neil Consultant Health Economist Prof. Vera A. Morgan Neuropsychiatric Epidemiology Research Unit, School of Psychiatry and Clinical Neurosciences, The University of Western Australia
We thank the many participants who took part for their time and invaluable contribution to this survey.
We also acknowledge with thanks all service and executive staff in North Metropolitan Health Service Mental Health
who fully supported the research team and gave considerable time and effort to ensure the survey’s success.
Their support has been much appreciated.
Cost analysis funded by North Metropolitan Health Service Mental Health
1 | P a g e

Key concepts employed in the Costs Analysis Catchment: This denotes the North Metro catchment in which a person lived, based on postcode, at the time at which they were screened for North Metro SHIP. It does not identify the catchment in which they necessarily received these services. The service recorded may have been provided in another catchment up to 12 months prior to interview. As such, the report documents costs of service use by people living in a specific catchment, rather than the services within an individual catchment that have been accessed by survey participants. Costs: the value of resources used to treat or support an individual or population with a specified illness, or are otherwise incurred in consequence of that illness (traditionally called direct costs), and the value of the production forgone (not produced/lost) by either individuals with an illness or their informal carers because of morbidity and/or early mortality arising from the illness (traditionally called indirect costs).
Health sector costs: costs of primary, secondary, and tertiary care services (e.g. medical and allied professional services, outpatient, community mental health services, emergency and inpatient services) and pharmaceutical and supplement use
Other sector costs: costs of resources used from outside the formal health sector, e.g. accommodation, employment and other non-health support services (NGOs and other voluntary agencies), legal costs etc.
Time loss costs: costs arising from the impact of psychosis on an individual and their informal carer’s ability to use time for productive purposes (i.e. work), e.g. expected earnings forgone by affected people and their carers, tax forgone due to lost productivity, cost of transfer payments (pensions and other income support etc.
Perspective: The viewpoint from which an analysis is undertaken. Determines what resources are included and how they are costed.
Societal perspective: the broadest perspective encompassing all significant economic costs arising regardless of who bears them including patients’ out-of-pocket expenses. Time-loss costs comprise the value of production forgone because of an individual’s inability to work because of psychosis (limited to morbidity-related impacts only in the current analysis), and absenteeism and presenteeism whilst ill. It does not include transfer payments such as the disability pension.
Governmental perspective: captures the financial costs to governments (e.g. State and Commonwealth). This perspective will therefore omit costs that are not borne by government such as the out-of-pocket expenses of patients and include the value of transfer payments made by government. Time-loss costs comprise the estimated value of tax forgone due to lost productivity because of psychosis and the value of transfer payments made for income support (i.e. disability pension) because of an individual’s and their informal carer’s inability to work because of the individual’s psychosis.
2 | P a g e

Overview This Report presents the results of a cost-of-illness analysis for the North Metro Study of High Impact Psychosis (North Metro SHIP) (Morgan et al 2013). The analysis has been undertaken with the explicit intention of maximising comparability with the published results for average costs per patient obtained in the costing analysis of the second national survey of psychosis (Neil et al 2014). To this end the cost calculations for North Metro SHIP are based on the methodology, assumptions and unit costs as detailed in Neil et al. (2014) with the exception of modifications necessitated by deviations from the National SHIP questionnaire (Appendix 1) and the process for calculating confidence intervals. Confidence intervals for the North Metro SHIP analysis have been calculated through the process of BCa Bootstrapping (1000 Bootstrap Samples). This methodology could not be employed for the national SHIP cost analysis given the complex sampling frame and analysis procedures required. The impact of the changes to the costing process are anticipated to have minimal if any impact on the comparative results for North Metro SHIP and national SHIP. A series of 12 Tables is presented. Tables 1 to 4 present comparisons of the North Metro SHIP and the national SHIP annual average cost data (Neil et al. 2014) for both societal and government perspectives. Table 1 presents data on the average annual cost by major cost categories (Health Sector, Other Sectors and Time-Loss). Tables 2 through 4 provide detailed line-item data for the Health Sector, Other Sectors and Time-Loss respectively. Tables 5 to 8 provide annual average cost breakdowns of the North Metro SHIP data by the participant’s catchment at recruitment by the major cost categories, and detailed line-item data for each category from the societal perspective. Tables 9 to 12 provide the same breakdowns from the government perspective. All costs are expressed in 2010 Australian dollars. Additional tables (Tables A2-1 and A2-2) are presented in Appendix 2. These provide annual average NM-SHIP costs by workforce categories. As the costs presented are not comprehensive of the care provided across or by individual workforce types, with the exception of general practitioners, no reliance can be placed on them in the broader context and utmost caution and diligence should be employed at all times in their consideration.
3 | P a g e

North Metro SHIP catchment coverage The survey took place in the whole of City and Stirling catchment areas, and in Joondalup Community Mental Health Services within the Joondalup catchment area as illustrated in Figure 1. Catchment selection for screening and interviewing of participants was strategically determined to ensure coverage of different populations within the catchment while minimising screening and interviewing costs. Consequently, Swan catchment area and the Clarkson Community Mental Health Services within Joondalup catchment area were not included in the survey. Note: Catchment denotes the North Metro catchment in which a person lived, based on postcode, at the time at which they were screened for North Metro SHIP. It does not identify the catchment in which they necessarily received these services. The service recorded may have been provided in another catchment up to 12 months prior to interview. As such, the report documents costs of service use by people living in a specific catchment, rather than the services within an individual catchment that have been accessed by survey participants.
Figure 1. Map of North Metro SHIP Catchment
4 | P a g e

Results Table 1 presents the annual average costs per patient from government and societal perspectives for North Metro SHIP and national SHIP. For North Metro SHIP Time-loss costs and in turn Total costs are statistically significantly higher from the societal perspective given that their confidence intervals do not overlap (this is a conservative comparison (Julious, 2004)). These results reflect the marked differences in methodology for Time-loss costs from government and societal perspectives. Compared with the national SHIP results, the costs for North Metro SHIP are statistically significantly higher overall from both government and societal perspectives, driven by higher Health Sector costs in North Metro SHIP. Table 2 details Health Sector costs by line item from government and societal perspectives and provides the minimum and maximum values in addition to the 95% confidence interval for North Metro SHIP and national SHIP. There are no statistically significant differences in any North Metro SHIP Health Sector item cost from government and societal perspectives; with many items having the same cost from both perspectives. This is because these items are not privately reimbursed in part of in full. Between studies (North Metro SHIP and national SHIP) the primary difference in Health Sector costs is observed for Mental Health Inpatient costs, which are statistically significantly higher in North Metro SHIP. Also higher are Alternative Therapists and Supplements; while Professional costs, particularly General Practitioners and Psychiatrists; Physical Inpatient and Drug & Alcohol Unit costs are lower. At least tending lower are Other Medical Doctors, Early Episode Community Mental Health whilst Pharmaceutical costs are at least tending higher. Other Psychotropic medication costs are almost 75% higher on average within North Metro SHIP. These data indicate that the patient profile and/or treatment profile is different between the North Metro SHIP and national SHIP studies. Table 3 details Other Sector costs by line item from government and societal perspectives for North Metro and national SHIP studies. Based on non-overlapping confidence intervals significant differences are observed in a limited number of items between government and societal perspectives for North Metro SHIP (e.g. NGO Other Assistance). Between studies no significant differences were observed based on the simple but conservative comparison of confidence intervals. However there was a general tendency for lower costs within North Metro SHIP with the exception of Non-Government Organisation (NGO) Case Manager and Personal Helpers and Mentors Scheme (PHaMs) items. In relation to Time-Loss costs (Table 4) as noted above there were significant differences between perspectives for North Metro SHIP (as is also the case for national SHIP). However, it is not possible to make direct comparisons between the individual line items from each perspective reflecting the different methodologies employed.
5 | P a g e

Between studies there were no overt statistically significant differences based on a comparison of confidence intervals for each line item. However, Absenteeism related costs were at least tending higher; and Carer costs lower from government and societal perspectives. These findings beg the question whether the NM SHIP sample includes more individuals during the initial stages of illness, needing to absent themselves from work and as yet not having a formal carer? Additional insights are provided in Tables 5 through 12 which present North Metro SHIP results by Catchment from a societal perspective. Table 5 presents Total costs and the major cost categories: Health Sector; Other Sectors and Time-Loss. Tables 6 to 8 provide the line item breakdowns for each of these categories respectively. Tables 9 through 12 present the equivalent data from a government perspective. From Table 5 differences in Health Sector costs are evident between Joondalup for which total costs are more reflective of the national study results (cf. Table 1) and the other catchments Stirling and City. A comparison of the Line Item Health Sector costs (Table 6) indicates that Joondalup’s lower Health Sector costs are primarily being driven by lower Mental Health Inpatient costs which are near the national average annual costs (cf. Table 2). However, costs are also lower compared to the other catchments for other inpatient admissions; Professionals, particularly as compared with Stirling and Rehabilitation, particularly compared with City. Notably, costs are high for Early Episode costs with the other Catchments in fact having no such costs; Early Episode costs in Joondalup are also at least tending higher than for the national study. Costs of mental health inpatient admissions are at least tending higher in Stirling, with costs for physical health problems and substance misuse also tending higher in this catchment. The City catchment has the highest Mental Health/Ambulatory Community Care costs. Other sector costs (Table 7) shows some variation between the catchments particularly in regard to Housing between Stirling and the other catchments, particularly in regard to 24 Hour supported housing; and with more support sought from Voluntary Organisations also. Joondalup has at least a tendency for higher costs on average for PHaMs support, and also has the highest average annual costs for NGO provided Rehabilitation in contrast to having the lowest average annual costs for Rehabilitation provided by specialised public sector mental health services. In relation to Time-Loss costs there is a tendency at least to higher absenteeism costs and particularly presenteeism costs, and lower reduced participation costs on average in Joondalup. The City catchment is the only catchment to give rise to carer-related Time Loss costs from a societal perspective. From Table 9 it is observed that there are no transfer payments for Carers of participants from Joondalup, but there are in Stirling and the City. Secondly, there is tax forgone for Carers in the City but not Stirling. These results reflect the facts that Carers in the City would include individuals on the Carer Payment (an income replacement payment), while Carers in Stirling are receiving the Carer Allowance only (a supplementary payment). In turn, there
6 | P a g e

are no Carers of participants from Joondalup reported to be receiving either Carer Allowance or Carer Payment. Within the costing methodology individuals on the Carer Allowance are assumed to remain in the workforce at a level unaffected by their responsibilities as a Carer.
7 | P a g e
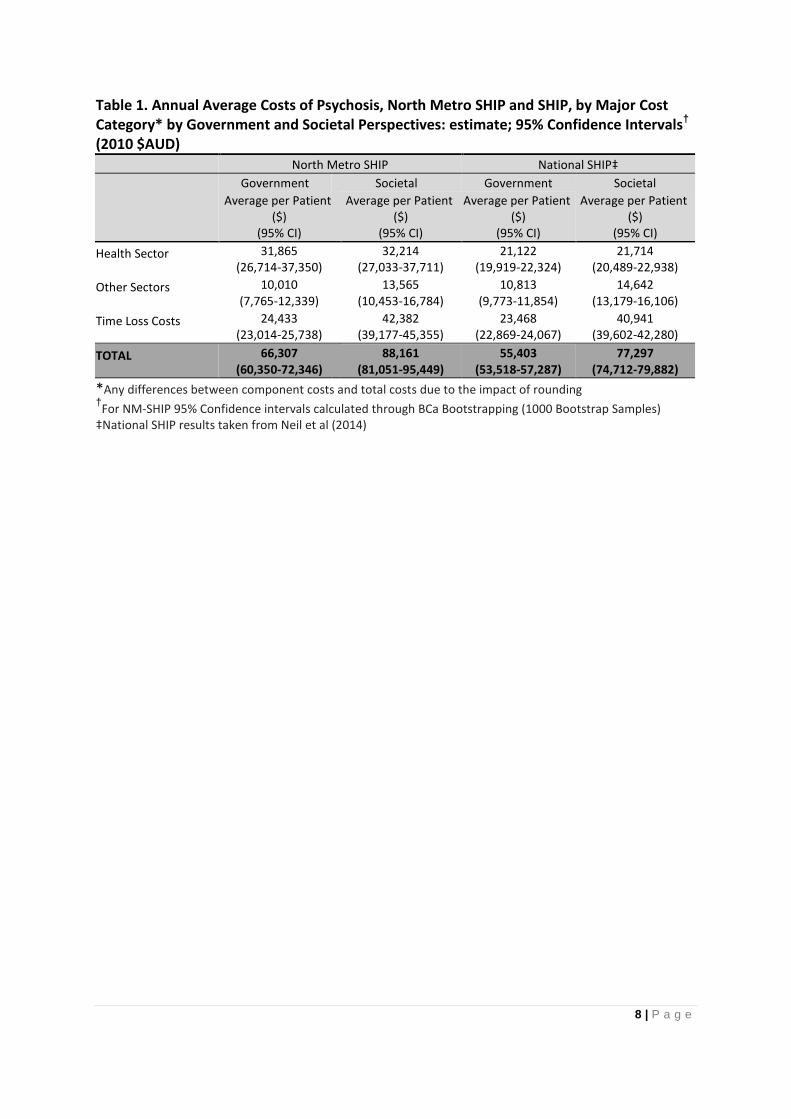
Table 1. Annual Average Costs of Psychosis, North Metro SHIP and SHIP, by Major Cost Category* by Government and Societal Perspectives: estimate; 95% Confidence Intervals† (2010 $AUD) North Metro SHIP National SHIP‡ Government Societal Government Societal Average per Patient
($) (95% CI)
Average per Patient ($)
(95% CI)
Average per Patient ($)
(95% CI)
Average per Patient ($)
(95% CI) Health Sector 31,865
(26,714-37,350) 32,214
(27,033-37,711) 21,122
(19,919-22,324) 21,714
(20,489-22,938) Other Sectors 10,010
(7,765-12,339) 13,565
(10,453-16,784) 10,813
(9,773-11,854) 14,642
(13,179-16,106) Time Loss Costs 24,433
(23,014-25,738) 42,382
(39,177-45,355) 23,468
(22,869-24,067) 40,941
(39,602-42,280) TOTAL 66,307
(60,350-72,346) 88,161
(81,051-95,449) 55,403
(53,518-57,287) 77,297
(74,712-79,882) *Any differences between component costs and total costs due to the impact of rounding †For NM-SHIP 95% Confidence intervals calculated through BCa Bootstrapping (1000 Bootstrap Samples) ‡National SHIP results taken from Neil et al (2014)
8 | P a g e
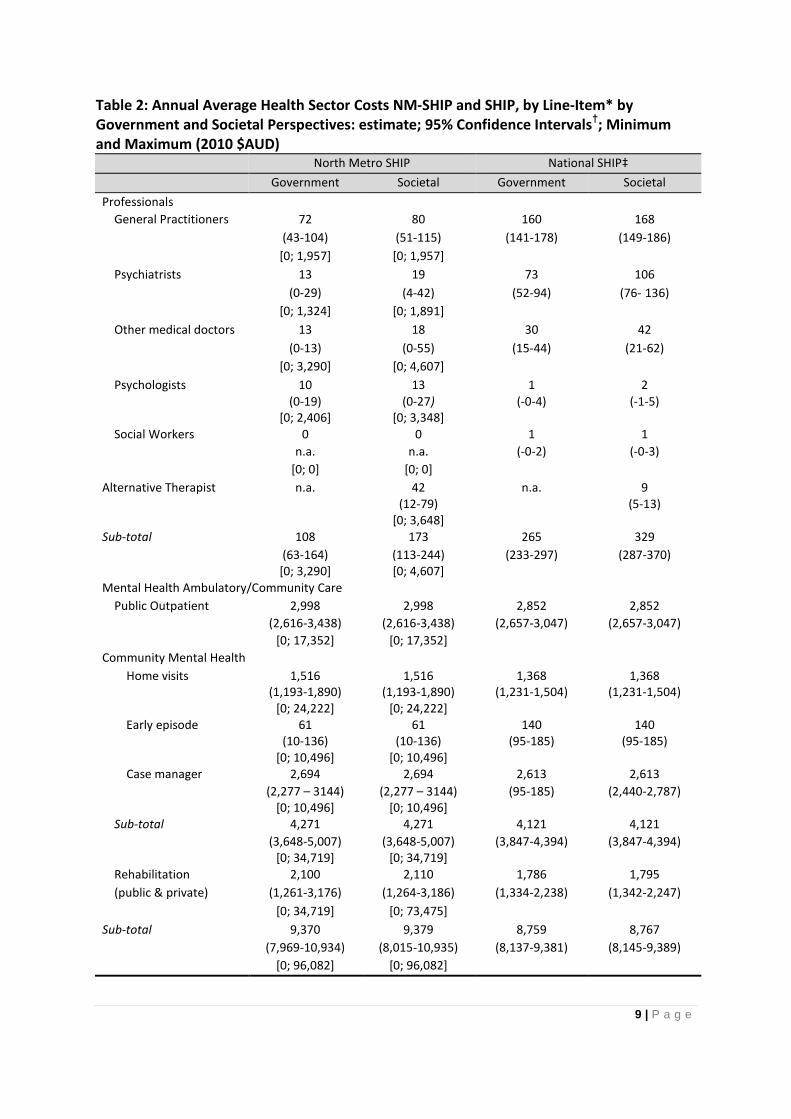
Table 2: Annual Average Health Sector Costs NM-SHIP and SHIP, by Line-Item* by Government and Societal Perspectives: estimate; 95% Confidence Intervals†; Minimum and Maximum (2010 $AUD)
North Metro SHIP National SHIP‡ Government Societal Government Societal Professionals General Practitioners 72 80 160 168 (43-104)
[0; 1,957] (51-115)
[0; 1,957] (141-178) (149-186)
Psychiatrists 13 19 73 106 (0-29)
[0; 1,324] (4-42)
[0; 1,891] (52-94) (76- 136)
Other medical doctors 13 18 30 42 (0-13)
[0; 3,290] (0-55)
[0; 4,607] (15-44) (21-62)
Psychologists 10 13 1 2 (0-19)
[0; 2,406] (0-27)
[0; 3,348] (-0-4) (-1-5)
Social Workers 0 0 1 1 n.a.
[0; 0] n.a.
[0; 0] (-0-2) (-0-3)
Alternative Therapist n.a. 42 n.a. 9 (12-79)
[0; 3,648] (5-13)
Sub-total 108 173 265 329 (63-164)
[0; 3,290] (113-244) [0; 4,607]
(233-297) (287-370)
Mental Health Ambulatory/Community Care Public Outpatient 2,998 2,998 2,852 2,852 (2,616-3,438) (2,616-3,438) (2,657-3,047) (2,657-3,047)
[0; 17,352] [0; 17,352] Community Mental Health Home visits 1,516
(1,193-1,890) [0; 24,222]
1,516 (1,193-1,890)
[0; 24,222]
1,368 (1,231-1,504)
1,368 (1,231-1,504)
Early episode 61 (10-136)
[0; 10,496]
61 (10-136)
[0; 10,496]
140 (95-185)
140 (95-185)
Case manager 2,694 2,694 2,613 2,613 (2,277 – 3144)
[0; 10,496] (2,277 – 3144)
[0; 10,496] (95-185) (2,440-2,787)
Sub-total 4,271 4,271 4,121 4,121 (3,648-5,007)
[0; 34,719] (3,648-5,007)
[0; 34,719] (3,847-4,394) (3,847-4,394)
Rehabilitation (public & private)
2,100 (1,261-3,176)
2,110 (1,264-3,186)
1,786 (1,334-2,238)
1,795 (1,342-2,247)
[0; 34,719] [0; 73,475] Sub-total 9,370
(7,969-10,934) [0; 96,082]
9,379 (8,015-10,935)
[0; 96,082]
8,759 (8,137-9,381)
8,767 (8,145-9,389)
9 | P a g e
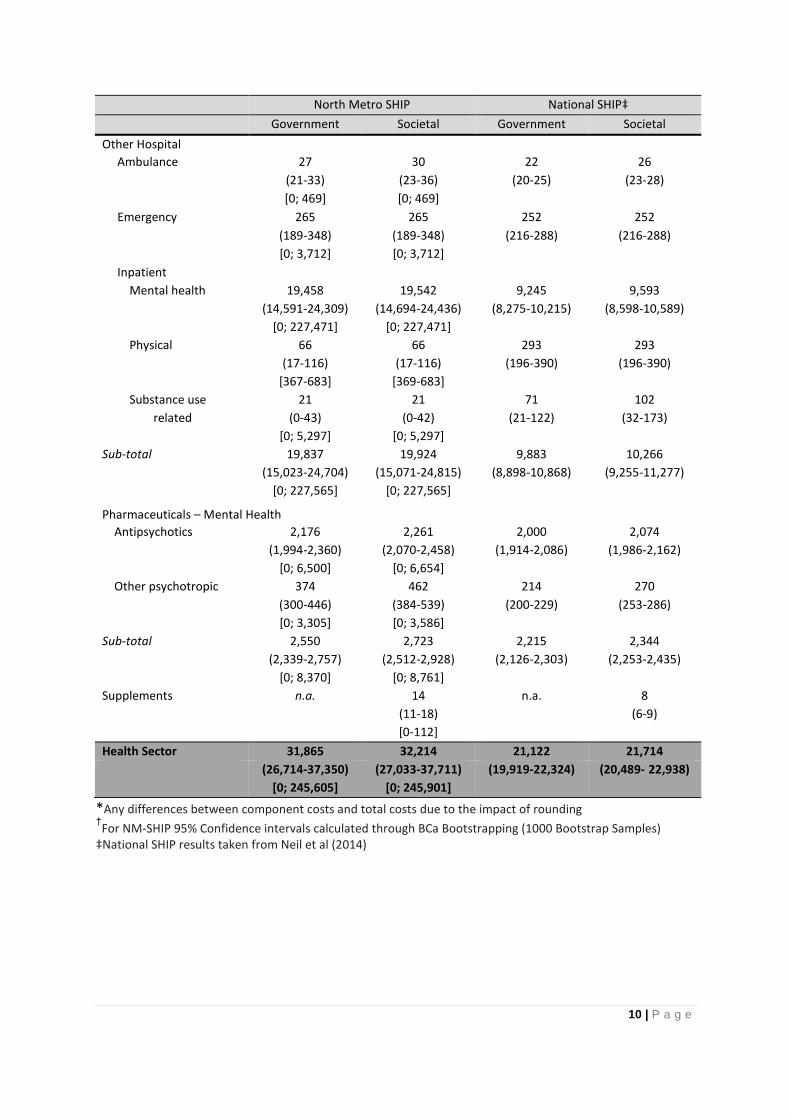
North Metro SHIP National SHIP‡ Government Societal Government Societal Other Hospital Ambulance 27 30 22 26 (21-33)
[0; 469] (23-36) [0; 469]
(20-25) (23-28)
Emergency 265 265 252 252 (189-348)
[0; 3,712] (189-348) [0; 3,712]
(216-288) (216-288)
Inpatient Mental health 19,458 19,542 9,245 9,593 (14,591-24,309)
[0; 227,471] (14,694-24,436)
[0; 227,471] (8,275-10,215) (8,598-10,589)
Physical 66 (17-116)
66 (17-116)
293 (196-390)
293 (196-390)
[367-683] [369-683] Substance use related
21 (0-43)
21 (0-42)
71 (21-122)
102 (32-173)
[0; 5,297] [0; 5,297] Sub-total 19,837 19,924 9,883 10,266 (15,023-24,704)
[0; 227,565] (15,071-24,815)
[0; 227,565] (8,898-10,868) (9,255-11,277)
Pharmaceuticals – Mental Health Antipsychotics 2,176 2,261 2,000 2,074 (1,994-2,360)
[0; 6,500] (2,070-2,458)
[0; 6,654] (1,914-2,086) (1,986-2,162)
Other psychotropic 374 462 214 270 (300-446)
[0; 3,305] (384-539) [0; 3,586]
(200-229) (253-286)
Sub-total 2,550 (2,339-2,757)
[0; 8,370]
2,723 (2,512-2,928)
[0; 8,761]
2,215 (2,126-2,303)
2,344 (2,253-2,435)
Supplements n.a. 14 (11-18) [0-112]
n.a. 8 (6-9)
Health Sector 31,865 32,214 21,122 21,714 (26,714-37,350)
[0; 245,605] (27,033-37,711)
[0; 245,901] (19,919-22,324) (20,489- 22,938)
*Any differences between component costs and total costs due to the impact of rounding †For NM-SHIP 95% Confidence intervals calculated through BCa Bootstrapping (1000 Bootstrap Samples) ‡National SHIP results taken from Neil et al (2014)
10 | P a g e

Table 3: Annual Average Other Sector Costs NM-SHIP and SHIP, by Line-Item* by Government and Societal Perspectives: estimate; 95% Confidence Intervals†; Minimum and Maximum (2010 $AUD)
North Metro SHIP National SHIP‡ Government Societal Government Societal
NGO Rehabilitation 1,360 2,307 1,404 2,382
(918-1,845) [0; 26,121]
(1,559-3,131) [0; 44,318]
(1,197-1,612) (2,030-2,734)
Other assistance 47 80 52 88
(37-58) [0; 470]
(62-99) [0; 798]
(47-57) (79-97)
Case manager 470 797 362 613
(350-600) [0; 2,492]
(596-1,016) [0; 4,229]
(321-402) (544-683)
Sub-total 1,877 3,185 1,818 3,084
(1,359-2,409)
[0; 29,084] (2,306-4,088)
[0; 49,345] (1,584-2,051) (2,688-3,479)
Accommodation Crisis care 140 197 162 229
(13-300)
[0; 19,949] (9-438)
[0; 28,109] (76-249) (107-350)
24 hr supported care 2,867 4,039 3,168 4,463
(1,359-4,608) [0; 101,265]
(1,910-6,497) [0; 142,686]
(2,342-3,993) (3,300-5,627)
Other supported care 2,224 3,133 2,443 3,443
(1,296-3,350) [0; 33,574.36]
(1,827-4,721) [0; 47,308]
(2,034-2,853) (2,866-4,019)
Institutional care 0 n.a.
[0; 0]
0 n.a.
[0; 0]
85 (1-170)
128 (1-255)
Sub-total 5,230 7,369 5,859 8,262
(3,369-7,320) [0; 101,265]
(4,747-10,315) [0; 142,686]
(4,943-6,774) (6,971-9,554)
Voluntary organisations 156 265 228 387
(102-219) [0; 3,653]
(174-372) [0; 6,197]
(194-263) (329-446)
Personal Helpers/Mentors 389 389 293 293
(164-687)
[0; 10,500] (164-687)
[0; 10,500] (212-374) (212-374)
Employment Support Services
1,322 1,322 1,251 1,251 (1,007-1,650)
[0; 9,352] (1,007-1,650)
[0; 9,352] (1,114-1,388) (1,114-1,388)
Supported Employment 462 462 648 648
(201-765)
[0; 14,399] (201-765)
[0; 14,399] (501-796) (501-796)
Administration 347 347 356 356
(325-369) [0; 842]
(325-369) [0; 842]
(345-367) (345-367)
11 | P a g e
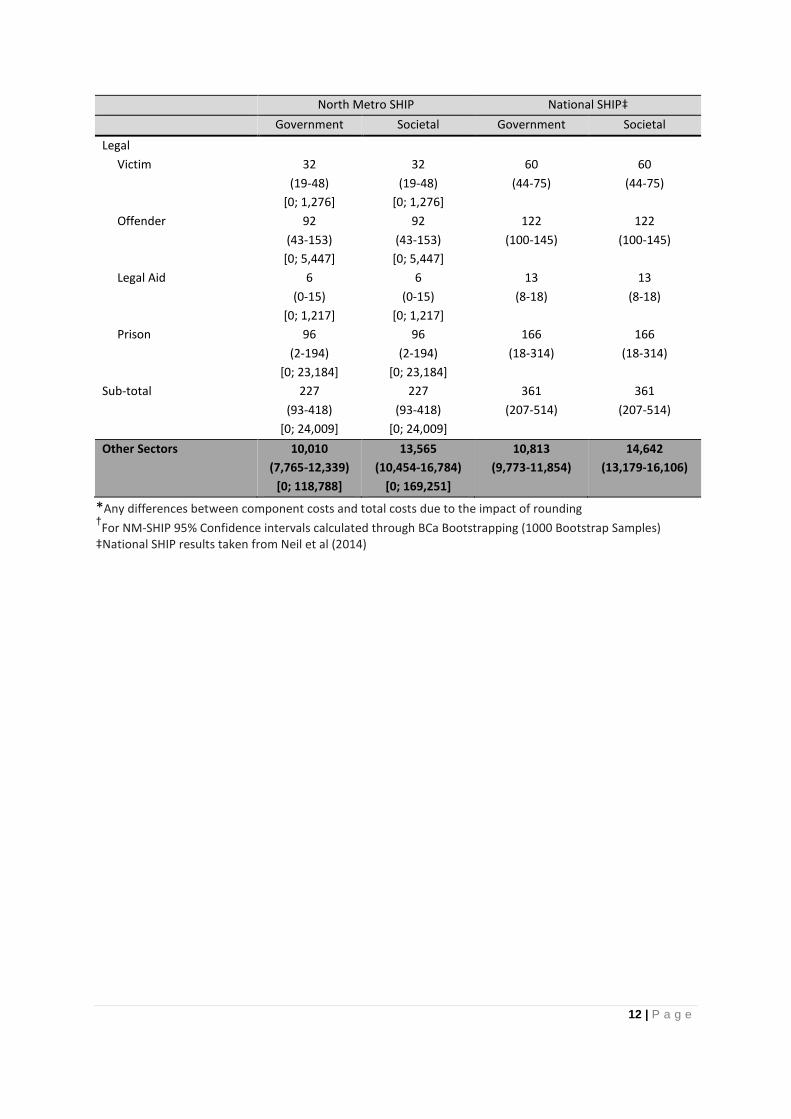
North Metro SHIP National SHIP‡ Government Societal Government Societal Legal Victim 32 32 60 60
(19-48)
[0; 1,276] (19-48)
[0; 1,276] (44-75) (44-75)
Offender 92 92 122 122
(43-153)
[0; 5,447] (43-153)
[0; 5,447] (100-145) (100-145)
Legal Aid 6 6 13 13
(0-15)
[0; 1,217] (0-15)
[0; 1,217] (8-18) (8-18)
Prison 96 96 166 166
(2-194)
[0; 23,184] (2-194)
[0; 23,184] (18-314) (18-314)
Sub-total 227 227 361 361
(93-418)
[0; 24,009] (93-418)
[0; 24,009] (207-514) (207-514)
Other Sectors 10,010 (7,765-12,339)
[0; 118,788]
13,565 (10,454-16,784)
[0; 169,251]
10,813 (9,773-11,854)
14,642 (13,179-16,106)
*Any differences between component costs and total costs due to the impact of rounding †For NM-SHIP 95% Confidence intervals calculated through BCa Bootstrapping (1000 Bootstrap Samples) ‡National SHIP results taken from Neil et al (2014)
12 | P a g e

Table 4: Annual Average Time Loss Costs NM-SHIP and SHIP, by Line-Item* by Government and Societal Perspectives: estimate; 95% Confidence Intervals†; Minimum and Maximum (2010 $AUD)
North Metro SHIP National SHIP‡ Government Societal Government Societal
Transfer Payments
Disability Related 15,041 (14,085-15,908)
[0; 33,366]
n.a. 14,057 (13,663-14,451)
n.a.
Carer 399 (159-692)
[0; 18,829]
n.a. 742 (599-884)
n.a.
Tax foregone
Absenteeism 122 (17-246)
[0; 10,526]
n.a. 47 (25-69)
n.a.
Reduced participation 8,732 (7,967-9,407)
[0; 17,310]
n.a. 8,397 (8,099-8,696)
n.a.
Carer 139 (56-250)
[0; 6,937]
n.a. 225 (165-285)
n.a.
Productivity Losses Absenteeism n.a. 1,169 n.a. 447 (301-2,221)
[0; 72,000] (272-621)
Presenteeism n.a. 136 n.a. 95 (72-215)
[0; 8,431] (58-131)
Reduced participation n.a. 40,636 n.a. 39,490 (37,348-43,679)
[0; 75,430] (38,159-40,820)
Carer n.a. 440 (88-969)
[0; 22,023]
n.a. 910 (652-1,168)
Time Loss Costs 24,433 42,382 23,468 40,941 (23,014-25,738)
[0; 56,242] (39,177-45,355)
[0; 97,453] (22,869-24,067) (39,602-42,280)
*Any differences between component costs and total costs due to the impact of rounding †For NM-SHIP 95% Confidence intervals calculated through BCa Bootstrapping (1000 Bootstrap Samples) ‡National SHIP results taken from Neil et al (2014)

Table 5: Annual Average Societal Costs of Psychosis, NM-SHIP, by Major Cost Category* by Location of Residence at Interview: estimate; 95% Confidence Intervals†; Minimum and Maximum (2010 AUD$) City Stirling Joondalup Total n=98 n=115 n=37 N=250 Health Sector 33,381 34,670 21,488 32,214 (25,922-42,449) (26,472-43,247) (14,084-30,291) (27,033-37,711)
[1,407; 245,901] [0; 243,271] [603; 123,067] [0; 245,901] Other Sectors 10,100 16,878 12,446 13,565
(6,584-14,252) (11,634-22,670) (7,671-18,036) (10,454-16,784)
[0; 115,972] [0; 169,251] [0; 76,166] [0; 169,251] Time Loss Costs 41,548 44,878 36,836 42,382
(36,410-46,568) (40,208-49,158) (28,420-44,852) (39,177-45,355) [0; 97,453] [0; 95,209] [0; 75,430] [0; 97,453]
TOTAL 85,029 96,426 70,770 88,161
(75,558-96,062) (84,807-108,318) (55,800-85,663) (81,051-95,449) [3,461; 334,503] [846; 346,240] [1,401-201,193] [846; 346,240] *Any differences between component costs and total costs due to the impact of rounding †For NM-SHIP 95% Confidence intervals calculated through BCa Bootstrapping (1000 Bootstrap Samples)
14 | P a g e

Table 6: Annual Average NM-SHIP Health Sector Costs by Line-Item* by Location of Residence at Interview, Societal Perspective: estimate, 95% Confidence Intervals†; Minimum and Maximum (2010 $AUD)
City Stirling Joondalup Total n=98 n=115 n=37 N=250
Professionals General Practitioners 73 98 44 80 (18-144) (55-146) (7-97) (51-115) [0; 1,957] [0; 1,957] [0; 910] [0; 1,957] Psychiatrists 29 16 0 19 (0-70) (0-51) n.a. (4-42) [0; 1,891] [0; 1,891] [0; 0] [0; 1,891] Other doctors 47 0 0 18 (0-138) n.a. n.a. (0-55) [0; 4, 607] [0; 0] [0; 0] [0; 4,607] Psychologists 0 29 0 13 n.a. (0-87) n.a. (0-27) [0; 0] [0; 3,348] [0; 0] [0; 3,348] Social Workers 0 0 0 0 n.a. n.a. n.a. n.a. [0; 0] [0; 0] [0; 0] [0; 0] Complimentary/ 22 71 5 42 Alternative Therapist (1-51) (7-151) (0-15) (12-79) [0; 1,216] [0; 3,648] [0; 182] [0; 3,648] Sub-total 171 214 49 173 (63-312) (118-324) (8-111) (113-244) [0; 4,607] [0; 3,967] [0; 1,093] [0; 4,607] Mental Health Ambulatory/Community Care Public Outpatient 3,954 2,429 2,237 2,998 (3,154-4,844) (2,039-2,865) (1,689-2,973) (2,616-3,438) [0; 17,352] [0; 10,496] [0; 10,698] [0; 17,352]
Public Community Mental Health Home visits 1,887 1,165 1,626 1,516 (1,264-2,636) (813-1,563) (956-2,390) (1,193-1,890) [0; 24,222] [0; 10,496] [0; 10,496] [0; 24,222] Early episode 0 0 415 61 n.a. n.a. (56-923) (10-136) [0; 0] [0; 0] [0; 10,496] [0; 10,496] Case manager 2,791 2,661 2,537 2,694 (2,127-3,532) (2,053-3,330) (1,682-3,425) (2,277 – 3144) [0; 10,496] [0; 10,496] [0; 10,496] [0; 10,496] Sub-total 4,678 3,826 4,577 4,271 (3,543-5,970) (3,003-4,678) (3,067-6,127) (3,648-5,007) [0; 34,719] [0; 20,993] [0; 20,993] [0; 34,719] Rehabilitation 3,145 1,710 611 2,110 (public & private) (1,450-5,653) (744-2,889) (0-1,506) (1,264-3,186) [0; 73,475] [0; 73,475] [0; 10,496] [0; 73,475] Sub-total 11,777 7,965 7,425 9,379 (9,200-15,030) (6,616-9,612) (5,406-9,566) (8,015-10,935)
[0; 96,082] [0; 84,375] [0; 23,415] [0; 96,082]
15 | P a g e

City Stirling Joondalup Total n=98 n=115 n=37 N=250
Other Hospital Ambulance 28 37 13 30
(19-38) (24-49) (3-25) (23-36)
[0; 188] [0; 469] [0; 188] [0; 469] Emergency 275 268 230 265
(178-385) (148-401) (71-436) (189-348)
[0; 2,227] [0; 3,712] [0; 3,712] [0; 3,712] Inpatient Mental health 18,143 23,482 11,004 19,542
(11,554-25,804) (15,555-31,742) (3,785-19,413) (14,694-24,436)
[0; 227,471] [0; 227,471] [0; 104,591] [0; 227,471] Physical 42 108 0 66
(0-124) (0-216) n.a. (17-116)
[0; 4,133] [0; 4,133] [0; 0] [0; 4,133] Substance use related 0 46 0 21
n.a. (0-130) n.a. (0-42)
[0; 0] [0; 5,297] [0; 0] [0; 5,297] Sub-total 18,488 23,940 11,246 19,924
(11,876-26,083) (15,972-32,256) (3,893-19,728) (15,071-24,815)
[0; 227,471] [0; 227,565] [0; 104,591] [0; 227,565] Pharmaceuticals Antipsychotics 2,431 2,093 2,335 2,261
(2,062-2,797) (1,835-2,374) (1,781-2,870) (2,070-2,458)
[0-6,654] [0; 6,620] [0; 5,760] [0-6,654] Non-antipsychotics 504 440 421 462
(393-628) (323-571) (291-561) (384-539)
[0; 2,828] [0; 3,586] [0; 1,913] [0; 3,586] Sub-total 2,934 2,533 2,756 2,723
(2,508-3,398) (2,239-2,830) (2,197-3,300) (2,512-2,928)
[0; 8,351] [0; 8,761] [119; 6,350] [0; 8,761] Supplements 12 17 13 14
(7-17) (12-23) (6-21) (11-18)
[0-112] [0-112] [0; 66] [0-112]
33,381 34,670 21,488 32,214 Health Sector (25,922-42,449) (26,472-43,247) (14,084-30,291) (27,033-37,711)
[1,407; 245,901] [0; 243,271] [603; 123,067] [0; 245,901] *Any differences between component costs and total costs due to the impact of rounding †For NM-SHIP 95% Confidence intervals calculated through BCa Bootstrapping (1000 Bootstrap Samples)
16 | P a g e

Table 7: Annual Average NM-SHIP Other Sector Costs by Line-Item* by Location of Residence at Interview, Societal Perspective: estimate, 95% Confidence Intervals†; Minimum and Maximum (2010 $AUD)
City Stirling Joondalup Total n=98 n=115 n=37 N=250 NGO Rehabilitation 1,902 2,398 3,098 2,307
(946; 3,021) (1,295-3,709) (910-5,652) (1,559-3,131)
[0; 25,255] [0; 44,318] [0; 44,197] [0; 44,318] Other assistance 59 91 104 80
(38-82) (57-128) (58-156) (62-99)
[0; 675] [0; 798] [0; 614] [0; 798] Case manager 744 861 738 797
(451-1,039) (584-1,162) (317-1,196) (596-1,016)
[0; 4,229] [0; 4,229] [0; 4,229] [0; 4,229] Sub-total 2,706 3,350 3,941 3,185
(1,520-4,013) (2,075-4,723) (1,538-6,717) (2,306-4,088)
[0; 26,415] [0; 49,345] [0; 45,418] [0; 49,345] Supported Housing
Crisis care 48 143 760 197
(0-138) (0-390) (0-2,414) (9-438)
[0; 4,685] [0; 15,226] [0; 28,109] [0; 28,109] 24 hr supported care 868 7,301 2,299 4,039
(53-2,221) (2,832-12,439) (292-4,584) (1,910-6,497)
[0; 68,599] [0; 142,686] [0; 32,928] [0; 142,686] Supported group housing 3,667 3,069 1,918 3,133
(1,602-6,183) (1,157-5,210) (0-4,731) (1,827-4,721)
[0; 47,308] [0; 47,308] [0; 47,308] [0; 47,308] Institutional care 0 0 0 0
(0-0) (0-0) (0-0) (0-0)
[0; 0] [0; 0] [0; 0] [0; 0] Sub-total 4,583 10,513 4,977 7,369
(2,033-7,758) (5,795-15,973) (1,742-8,843) (4,747-10,315)
[0; 93,163] [0; 142,686] [0; 47,308] [0; 142,686] Voluntary organisations 161 380 180 265
(75-267) (212-565) (54-339) (174-372)
[0; 3,190] [0; 6,197] [0; 2,465] [0; 6,197] Personal Helpers/Mentors 391 147 1,135 389
(79-829) (0-355) (269-2,255) (164-687)
[0; 10,500] [0; 10,500] [0; 10,500] [0; 10,500] Employment Support 1,358 1,436 867 1,322
(864,1,909) (1,002-1,917) (325-1,483) (1,007-1,650)
[0; 9,352] [0; 9,352] [0; 9,352] [0; 9,352] Supported Employment 452 494 389 462
(71-937) (122-955) (0-1,067) (201-765)
[0; 14,399] [0; 14,399] [0; 14,399] [0; 14,399] Administration 374 344 284 347
(333-412) (307-379) (215-343) (325-369)
[0; 842] [0; 842] [0; 421] [0; 842]
17 | P a g e

City Stirling Joondalup Total n=98 n=115 n=37 N=250 Legal
Victim 40 36 2 32
(16-67) (17-62) (0-4) (19-48)
[0; 1,145] [0; 1,276] [0; 33] [0-1,276] Offender 31 160 45 92
(7-68) (54-296) (0-111) (43-153)
[0; 1,432] [0; 5,447] [0; 825] [0; 5,447] Legal Aid 0 13 0 6
(0-0) (0-33) (0-0) (0-15)
[0; 0] [0; 1,217] [0; 0] [0; 1,217] Prison 4 4 627 96
(0-12) (0-11) (0-1,783) (2-194)
[0; 414] [0; 414] [0; 23,184] [0; 23,184] Sub-total 75 213 673 227
(37-121) (87-375) (1-1,988) (93-418)
[0; 1,432] [0; 7,719] [0; 24,009] [0; 24,009] Other Sectors 10,100 16,878 12,446 13,565
(6,584-14,252) (11,634-22,670) (7,671-18,036) (10,454-16,784)
[0; 115,972] [0; 169,251] [0; 76,166] [0; 169,251] *Any differences between component costs and total costs due to the impact of rounding †For NM-SHIP 95% Confidence intervals calculated through BCa Bootstrapping (1000 Bootstrap Samples)
18 | P a g e

Table 8: Annual Average NM-SHIP Time Loss Costs by Line-Item*, by Location of Residence at Interview, Societal Perspective: estimate, 95% Confidence Intervals†; Minimum and Maximum (2010 $AUD) City Stirling Joondalup Total n=98 n=115 n=37 N=250 Productivity Losses
Absentism 645 1,313 2,109 1,169
(75-1,724) (39-3,014) (71-4,877) (301-2,221)
[0; 45,669] [0; 72,000] [0; 56,208] [0; 72,000] Presentism 102 61 462 136
(46-170) (15-124) (96-958) (72-215)
[0; 1,642] [0; 3,283] [0; 8,431] [0; 8,431] Reduced participation 39,677 43,504 34,264 40,636
(34,314-44,452) (39,103-47,780) (25,813-42,630) (37,348-43,679)
[0; 75,430] [0; 75,430] [0; 75,430] [0; 75,430] Carer 1,124 0 0 440
(242-2,118) (0-0) (0-0) (88-969)
[0; 22,023] [0; 0] [0; 0] [0; 22,023] Time Loss Costs 41,548 44,878 36,836 42,382
(36,410-46,568) (40,208-49,158) (28,420-44,852) (39,177-45,355)
[0; 97,453] [0; 95,209] [0; 75,430] [0; 97,453] *Any differences between component costs and total costs due to the impact of rounding †For NM-SHIP 95% Confidence intervals calculated through BCa Bootstrapping (1000 Bootstrap Samples)
19 | P a g e
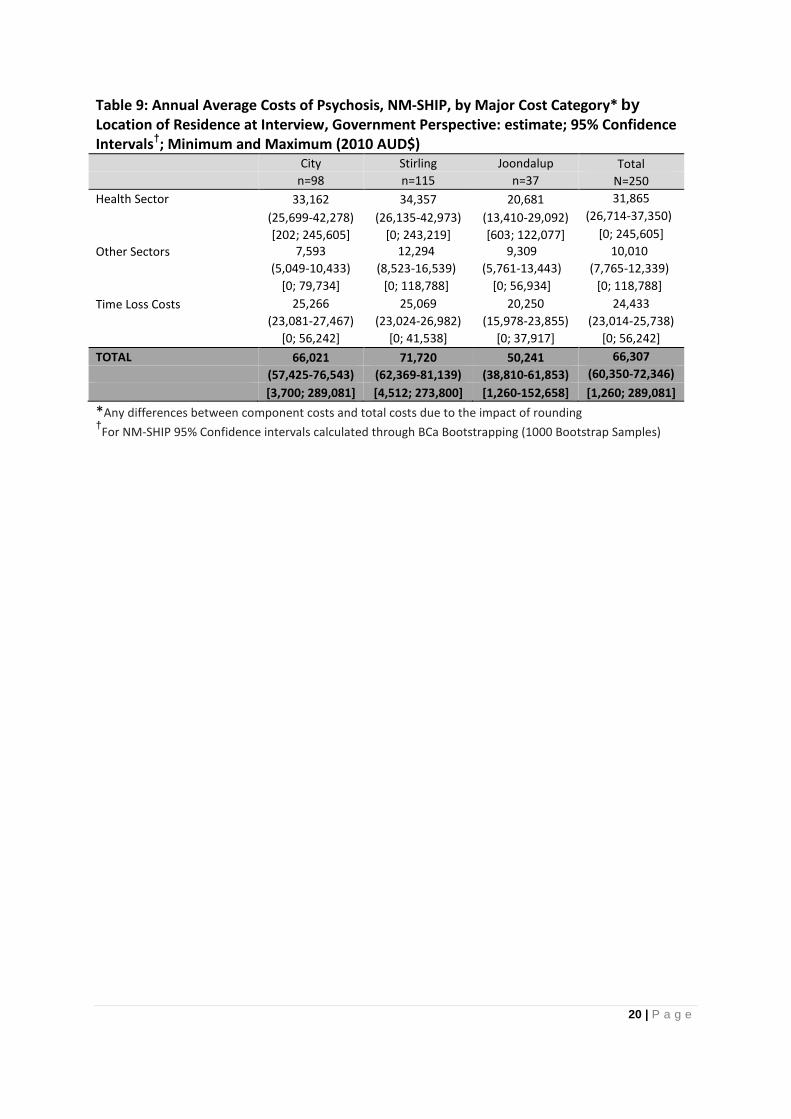
Table 9: Annual Average Costs of Psychosis, NM-SHIP, by Major Cost Category* by Location of Residence at Interview, Government Perspective: estimate; 95% Confidence Intervals†; Minimum and Maximum (2010 AUD$) City Stirling Joondalup Total n=98 n=115 n=37 N=250 Health Sector 33,162 34,357 20,681 31,865 (25,699-42,278) (26,135-42,973) (13,410-29,092) (26,714-37,350)
[202; 245,605] [0; 243,219] [603; 122,077] [0; 245,605] Other Sectors 7,593 12,294 9,309 10,010
(5,049-10,433) (8,523-16,539) (5,761-13,443) (7,765-12,339)
[0; 79,734] [0; 118,788] [0; 56,934] [0; 118,788]
Time Loss Costs 25,266 25,069 20,250 24,433 (23,081-27,467) (23,024-26,982) (15,978-23,855) (23,014-25,738) [0; 56,242] [0; 41,538] [0; 37,917] [0; 56,242]
TOTAL 66,021 71,720 50,241 66,307
(57,425-76,543) (62,369-81,139) (38,810-61,853) (60,350-72,346) [3,700; 289,081] [4,512; 273,800] [1,260-152,658] [1,260; 289,081] *Any differences between component costs and total costs due to the impact of rounding †For NM-SHIP 95% Confidence intervals calculated through BCa Bootstrapping (1000 Bootstrap Samples)
20 | P a g e
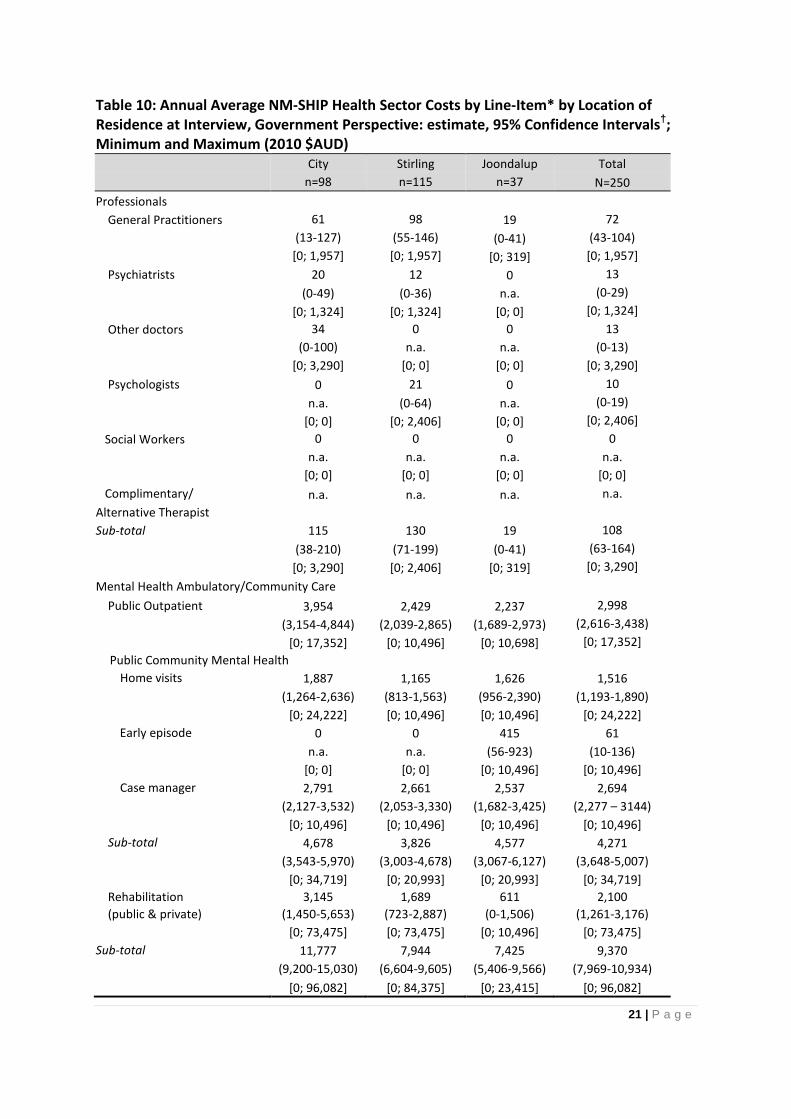
Table 10: Annual Average NM-SHIP Health Sector Costs by Line-Item* by Location of Residence at Interview, Government Perspective: estimate, 95% Confidence Intervals†; Minimum and Maximum (2010 $AUD) City Stirling Joondalup Total n=98 n=115 n=37 N=250 Professionals General Practitioners 61 98 19 72
(13-127) (55-146) (0-41) (43-104)
[0; 1,957] [0; 1,957] [0; 319] [0; 1,957] Psychiatrists 20 12 0 13 (0-49) (0-36) n.a. (0-29) [0; 1,324] [0; 1,324] [0; 0] [0; 1,324] Other doctors 34 0 0 13
(0-100) n.a. n.a. (0-13)
[0; 3,290] [0; 0] [0; 0] [0; 3,290] Psychologists 0 21 0 10 n.a. (0-64) n.a. (0-19) [0; 0] [0; 2,406] [0; 0] [0; 2,406] Social Workers 0 0 0 0 n.a. n.a. n.a. n.a. [0; 0] [0; 0] [0; 0] [0; 0] Complimentary/ n.a. n.a. n.a. n.a. Alternative Therapist Sub-total 115 130 19 108 (38-210) (71-199) (0-41) (63-164) [0; 3,290] [0; 2,406] [0; 319] [0; 3,290] Mental Health Ambulatory/Community Care Public Outpatient 3,954 2,429 2,237 2,998
(3,154-4,844) (2,039-2,865) (1,689-2,973) (2,616-3,438)
[0; 17,352] [0; 10,496] [0; 10,698] [0; 17,352] Public Community Mental Health
Home visits 1,887 1,165 1,626 1,516
(1,264-2,636) (813-1,563) (956-2,390) (1,193-1,890)
[0; 24,222] [0; 10,496] [0; 10,496] [0; 24,222] Early episode 0 0 415 61
n.a. n.a. (56-923) (10-136)
[0; 0] [0; 0] [0; 10,496] [0; 10,496] Case manager 2,791 2,661 2,537 2,694
(2,127-3,532) (2,053-3,330) (1,682-3,425) (2,277 – 3144)
[0; 10,496] [0; 10,496] [0; 10,496] [0; 10,496] Sub-total 4,678 3,826 4,577 4,271
(3,543-5,970) (3,003-4,678) (3,067-6,127) (3,648-5,007)
[0; 34,719] [0; 20,993] [0; 20,993] [0; 34,719] Rehabilitation 3,145 1,689 611 2,100 (public & private) (1,450-5,653) (723-2,887) (0-1,506) (1,261-3,176)
[0; 73,475] [0; 73,475] [0; 10,496] [0; 73,475] Sub-total 11,777 7,944 7,425 9,370
(9,200-15,030) (6,604-9,605) (5,406-9,566) (7,969-10,934)
[0; 96,082] [0; 84,375] [0; 23,415] [0; 96,082]
21 | P a g e

City Stirling Joondalup Total n=98 n=115 n=37 N=250 Other Hospital Ambulance 28 33 5 27
(19-38) (22-46) (0-13) (21-33)
[0; 188] [0; 469] [0; 94] [0; 469] Emergency 275 268 230 265
(178-385) (148-401) (71-436) (189-348)
[0; 2,227] [0; 3,712] [0; 3,712] [0; 3,712] Inpatient Mental health 18,143 23,429 10,596 19,458
(11,554-25,804) (15,512-31,664) (3,618-18,929) (14,591-24,309)
[0; 227,471] [0; 227,471] [0; 104,591] [0; 227,471] Physical 42 108 0 66
(0-124) (0-216) n.a. (17-116)
[0; 4,133] [0; 4,133] [0; 0] [0; 4,133] Substance use related 0 46 0 21
n.a. (0-130) n.a. (0-42)
[0; 0] [0; 5,297] [0; 0] [0; 5,297] Sub-total 18,488 23,884 10,831 19,837
(11,876-26,083) (15,862-32,200) (3,747-19,302) (15,023-24,704)
[0; 227,471] [0; 227,565] [0; 104,591] [0; 227,565] Pharmaceuticals Antipsychotics 2,366 2,035 2,111 2,176
(2,007-2,726) (1,783-2,305) (1,578-2,681) (1,994-2,360)
[0-6,500] [0; 6,479] [0; 5,589] [0; 6,500] Non-antipsychotics 417 363 295 374
(313-536) (258-488) (195-411) (300-446)
[0; 2,617] [0; 3,305] [0; 1,913] [0; 3,305] Sub-total 2,783 2,398 2,406 2,550
(2,376-3,215) (2,111-2,690) (1,868-2,987) (2,339-2,757)
[0; 8.069] [0; 8,370] [20; 6,003] [0; 8,370] Supplements n.a. n.a. n.a. n.a.
33,162 34,357 20,681 31,865 Health Sector (25,699-42,278) (26,135-42,973) (13,410-29,092) (26,714-37,350)
[202; 245,605] [0; 243,219] [603; 122,077] [0; 245,605] *Any differences between component costs and total costs due to the impact of rounding †For NM-SHIP 95% Confidence intervals calculated through BCa Bootstrapping (1000 Bootstrap Samples)
22 | P a g e
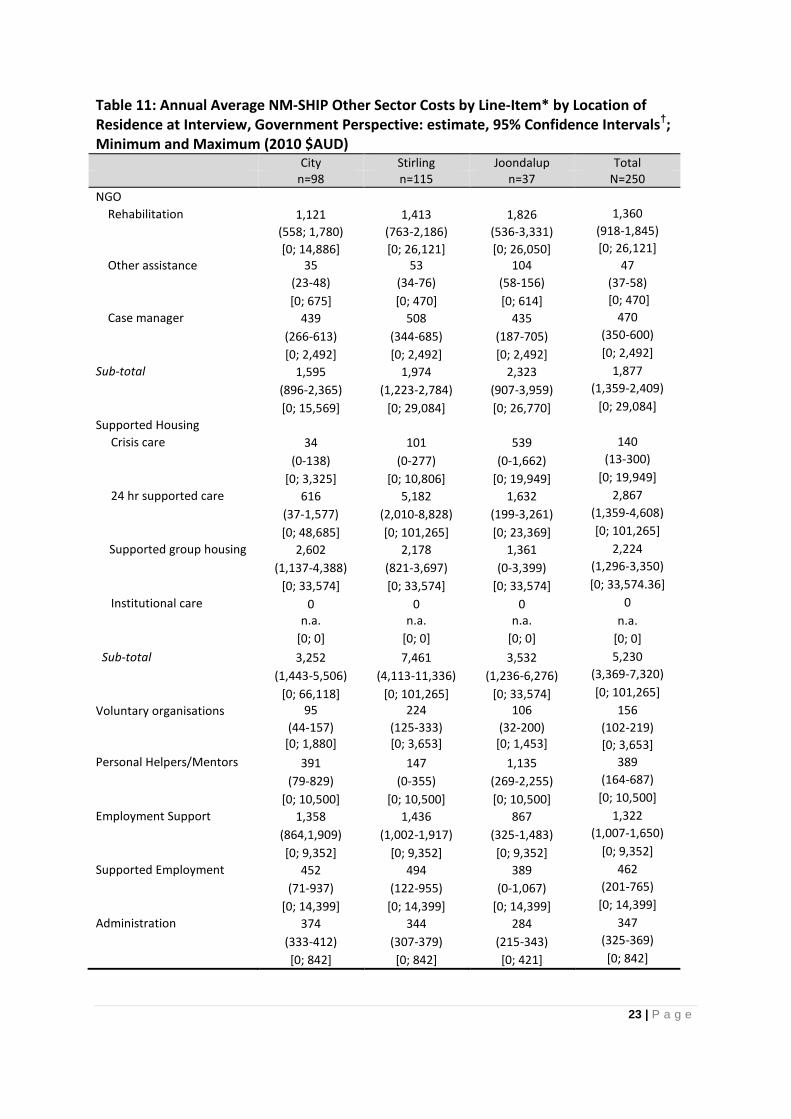
Table 11: Annual Average NM-SHIP Other Sector Costs by Line-Item* by Location of Residence at Interview, Government Perspective: estimate, 95% Confidence Intervals†; Minimum and Maximum (2010 $AUD)
City Stirling Joondalup Total n=98 n=115 n=37 N=250 NGO Rehabilitation 1,121 1,413 1,826 1,360 (558; 1,780) (763-2,186) (536-3,331) (918-1,845)
[0; 14,886] [0; 26,121] [0; 26,050] [0; 26,121] Other assistance 35 53 104 47 (23-48) (34-76) (58-156) (37-58) [0; 675] [0; 470] [0; 614] [0; 470] Case manager 439 508 435 470
(266-613) (344-685) (187-705) (350-600) [0; 2,492] [0; 2,492] [0; 2,492] [0; 2,492]
Sub-total 1,595 1,974 2,323 1,877 (896-2,365) (1,223-2,784) (907-3,959) (1,359-2,409) [0; 15,569] [0; 29,084] [0; 26,770] [0; 29,084]
Supported Housing Crisis care 34 101 539 140
(0-138) (0-277) (0-1,662) (13-300) [0; 3,325] [0; 10,806] [0; 19,949] [0; 19,949]
24 hr supported care 616 5,182 1,632 2,867 (37-1,577) (2,010-8,828) (199-3,261) (1,359-4,608) [0; 48,685] [0; 101,265] [0; 23,369] [0; 101,265] Supported group housing 2,602 2,178 1,361 2,224
(1,137-4,388) (821-3,697) (0-3,399) (1,296-3,350) [0; 33,574] [0; 33,574] [0; 33,574] [0; 33,574.36]
Institutional care 0 0 0 0 n.a. n.a. n.a. n.a. [0; 0] [0; 0] [0; 0] [0; 0] Sub-total 3,252 7,461 3,532 5,230
(1,443-5,506) (4,113-11,336) (1,236-6,276) (3,369-7,320) [0; 66,118] [0; 101,265] [0; 33,574] [0; 101,265]
Voluntary organisations 95 224 106 156
(44-157)
[0; 1,880] (125-333) [0; 3,653]
(32-200) [0; 1,453]
(102-219) [0; 3,653]
Personal Helpers/Mentors 391 147 1,135 389 (79-829) (0-355) (269-2,255) (164-687) [0; 10,500] [0; 10,500] [0; 10,500] [0; 10,500] Employment Support 1,358 1,436 867 1,322
(864,1,909) (1,002-1,917) (325-1,483) (1,007-1,650) [0; 9,352] [0; 9,352] [0; 9,352] [0; 9,352]
Supported Employment 452 494 389 462
(71-937) (122-955) (0-1,067) (201-765) [0; 14,399] [0; 14,399] [0; 14,399] [0; 14,399]
Administration 374 344 284 347 (333-412) (307-379) (215-343) (325-369) [0; 842] [0; 842] [0; 421] [0; 842]
23 | P a g e
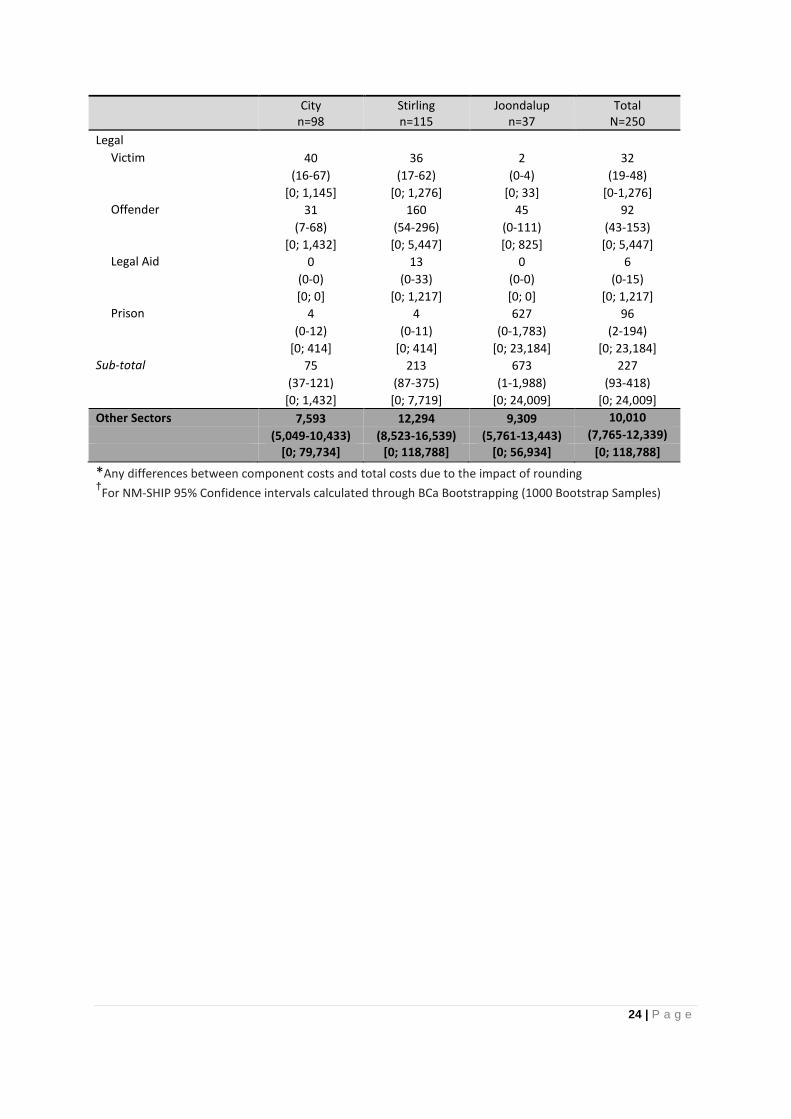
City Stirling Joondalup Total n=98 n=115 n=37 N=250 Legal
Victim 40 36 2 32
(16-67) (17-62) (0-4) (19-48)
[0; 1,145] [0; 1,276] [0; 33] [0-1,276] Offender 31 160 45 92
(7-68) (54-296) (0-111) (43-153)
[0; 1,432] [0; 5,447] [0; 825] [0; 5,447] Legal Aid 0 13 0 6
(0-0) (0-33) (0-0) (0-15)
[0; 0] [0; 1,217] [0; 0] [0; 1,217] Prison 4 4 627 96
(0-12) (0-11) (0-1,783) (2-194)
[0; 414] [0; 414] [0; 23,184] [0; 23,184] Sub-total 75 213 673 227
(37-121) (87-375) (1-1,988) (93-418)
[0; 1,432] [0; 7,719] [0; 24,009] [0; 24,009] Other Sectors 7,593 12,294 9,309 10,010
(5,049-10,433) (8,523-16,539) (5,761-13,443) (7,765-12,339)
[0; 79,734] [0; 118,788] [0; 56,934] [0; 118,788]
*Any differences between component costs and total costs due to the impact of rounding †For NM-SHIP 95% Confidence intervals calculated through BCa Bootstrapping (1000 Bootstrap Samples)
24 | P a g e
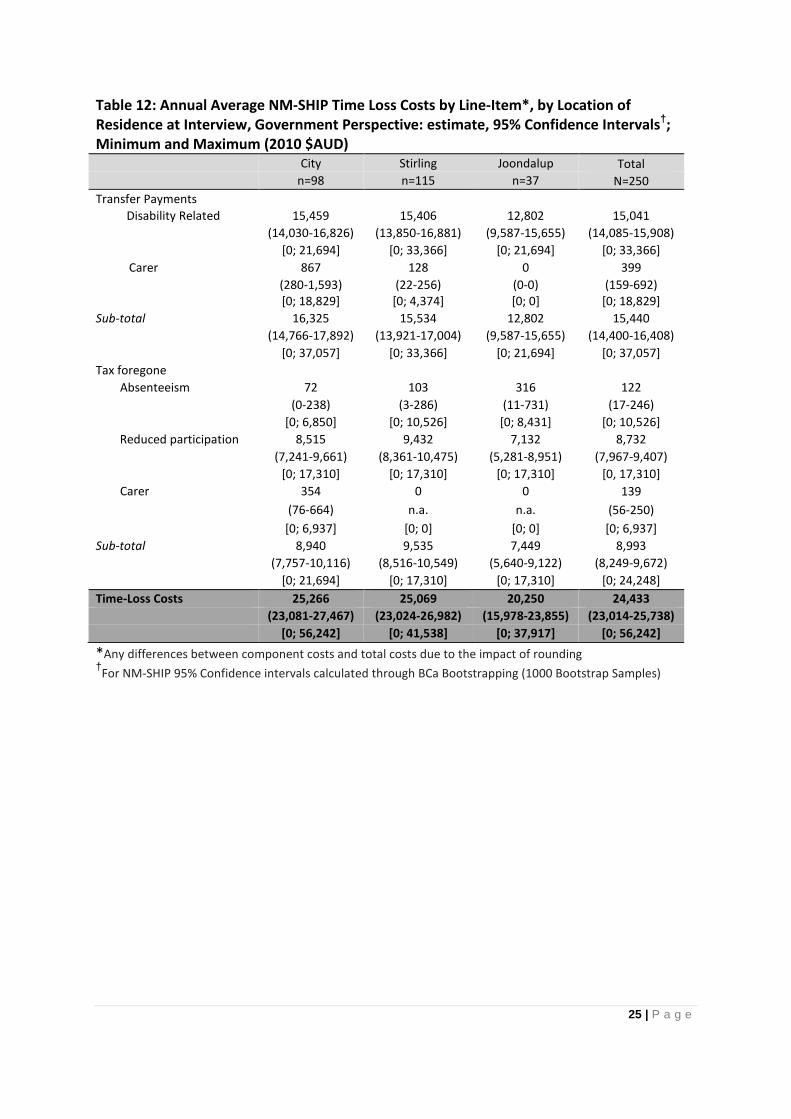
Table 12: Annual Average NM-SHIP Time Loss Costs by Line-Item*, by Location of Residence at Interview, Government Perspective: estimate, 95% Confidence Intervals†; Minimum and Maximum (2010 $AUD) City Stirling Joondalup Total n=98 n=115 n=37 N=250 Transfer Payments
Disability Related 15,459 15,406 12,802 15,041 (14,030-16,826) (13,850-16,881) (9,587-15,655) (14,085-15,908) [0; 21,694] [0; 33,366] [0; 21,694] [0; 33,366]
Carer 867 128 0 399 (280-1,593) (22-256) (0-0) (159-692) [0; 18,829] [0; 4,374] [0; 0] [0; 18,829]
Sub-total 16,325 15,534 12,802 15,440 (14,766-17,892) (13,921-17,004) (9,587-15,655) (14,400-16,408) [0; 37,057] [0; 33,366] [0; 21,694] [0; 37,057] Tax foregone Absenteeism 72 103 316 122
(0-238) (3-286) (11-731) (17-246) [0; 6,850] [0; 10,526] [0; 8,431] [0; 10,526]
Reduced participation 8,515 9,432 7,132 8,732 (7,241-9,661) (8,361-10,475) (5,281-8,951) (7,967-9,407) [0; 17,310] [0; 17,310] [0; 17,310] [0, 17,310]
Carer 354 0 0 139 (76-664) n.a. n.a. (56-250) [0; 6,937] [0; 0] [0; 0] [0; 6,937]
Sub-total 8,940 9,535 7,449 8,993 (7,757-10,116) (8,516-10,549) (5,640-9,122) (8,249-9,672) [0; 21,694] [0; 17,310] [0; 17,310] [0; 24,248] Time-Loss Costs 25,266 25,069 20,250 24,433 (23,081-27,467) (23,024-26,982) (15,978-23,855) (23,014-25,738) [0; 56,242] [0; 41,538] [0; 37,917] [0; 56,242] *Any differences between component costs and total costs due to the impact of rounding †For NM-SHIP 95% Confidence intervals calculated through BCa Bootstrapping (1000 Bootstrap Samples)
25 | P a g e

Appendix 1: Changes in questionnaire design between the Survey of High Impact Psychosis and the North Metro Survey of High Impact Psychosis necessitating changes to the costing analysis. Item Change Impact Q3_01 All sources of housing
now coded and weeks spent in each; rather than the three longest lived in housing types.
Could lead to increased housing costs, as not limited to three primary housing types. Not reflected in the overall results if this is the case.
Q5_08 Service providers – ‘name change’
No effective impact on costing analysis.
Q11 Pensions and allowances No effective impact on costing analysis as didn’t affect what was included as psychosis related costs.
Q26_06_08 Inclusion of a new item Other psychiatric clinic
Coding revisions required to incorporate change, but no such clinic visits were recorded, thus no effective impact.
26 | P a g e

Appendix 2: Cost Breakdowns by the National Mental Health Service Planning Framework Workforce Categories/Types There are five workforce categories specified under the National Mental Health Service Planning Framework:
• Peer workers • Vocationally qualified workers • Tertiary qualified workers • Medical • Other
Peer Workers comprise both consumer and carer peer workers; Tertiary Qualified Workers encompass nurses, social workers, psychologists, occupational therapists, and others; and Medical encompasses general practitioners, psychiatrists, other specialists and junior medical officers. Specification of tertiary qualified and medical workforce categories at the aggregate level is considered preferable (National Mental Health Service Element and Activity Descriptions Version 4.10 7 April 2013, p. 10). Under the Framework, the Mental Health workforce provides care and support across two Service Groups, each with three Service Streams:
1. Population based universal services 1.1. Mental Health Promotion 1.2. Mental Health Prevention 1.3. Community development
2. Services tailored to individual needs 2.1. Primary and specialised clinical and ambulatory mental health care services 2.2. Specialised mental health community support services 2.3. Specialised bed-based mental health services
Within each Service Stream there are in turn, multiple Service Categories, and within each Service Category, multiple Service Elements. Information captured within NM-SHIP primarily pertains to Service Group 2, the main exception being Service Element 1.2.1.7 Crisis Intervention (Phone & Internet Help Lines). Service Group 2 covers care and support provided within both Health sector (2.1, 2.2 and 2.3) and Other sectors (2.2). Under the Framework, Other sector service provision within Service Stream 2.2 encompasses support services ranging from Group Support and Rehabilitation for the individual (including employment) (Service Category 2.2.1) to Family and Carer Support (Service Category 2.2.6) and Residential Services (Service Category 2.2.5). Within NM-SHIP, the focus was on capturing information on ‘Episodes of Care’ rather than on the workforce providing that care. There were however a few exceptions: provision of care by General Practitioners in the community (Module 29); the three primary Health Professionals seen for Outpatient care (Item 26.07); the Case manager for persons being
27 | P a g e

seen within Public Community Mental Health (Item 27.09); and utilisation of Peer Lead Support Groups (Item 31.16). The costs associated with this limited array of services by individual and aggregate Workforce categories are detailed below from Societal and Government perspectives in Tables A2-1 and A2-2 respectively. Costs are also provided by Catchment. No comparison is provided against the national SHIP study, as these data were generated and compiled for the North Metro SHIP cost analysis. As the costs presented are not comprehensive of the care provided across or by individual workforce types, with the exception of general practitioners, no reliance can be placed on them in the broader context and utmost caution and diligence should be employed at all times in their consideration.
28 | P a g e
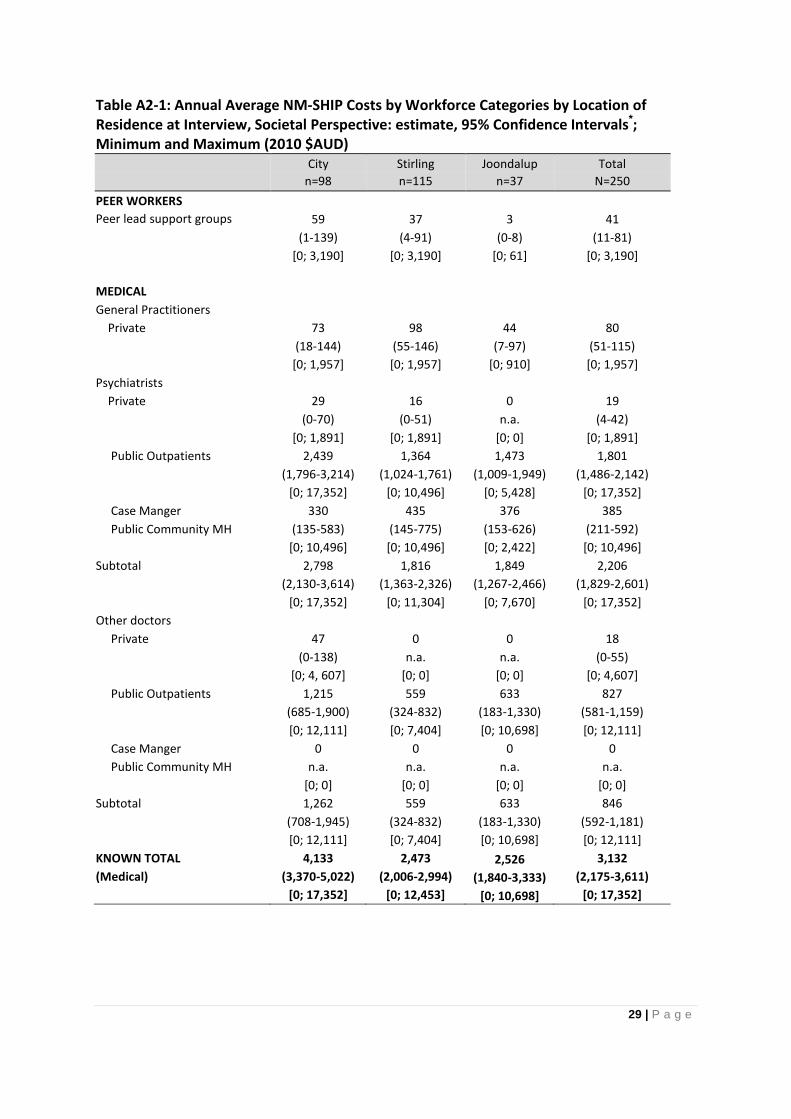
Table A2-1: Annual Average NM-SHIP Costs by Workforce Categories by Location of Residence at Interview, Societal Perspective: estimate, 95% Confidence Intervals*; Minimum and Maximum (2010 $AUD)
City Stirling Joondalup Total n=98 n=115 n=37 N=250
PEER WORKERS Peer lead support groups 59 37 3 41 (1-139) (4-91) (0-8) (11-81) [0; 3,190] [0; 3,190] [0; 61] [0; 3,190] MEDICAL General Practitioners Private 73 98 44 80 (18-144) (55-146) (7-97) (51-115) [0; 1,957] [0; 1,957] [0; 910] [0; 1,957] Psychiatrists Private 29 16 0 19 (0-70) (0-51) n.a. (4-42) [0; 1,891] [0; 1,891] [0; 0] [0; 1,891] Public Outpatients 2,439 1,364 1,473 1,801 (1,796-3,214) (1,024-1,761) (1,009-1,949) (1,486-2,142) [0; 17,352] [0; 10,496] [0; 5,428] [0; 17,352] Case Manger 330 435 376 385 Public Community MH (135-583) (145-775) (153-626) (211-592) [0; 10,496] [0; 10,496] [0; 2,422] [0; 10,496] Subtotal 2,798 1,816 1,849 2,206 (2,130-3,614) (1,363-2,326) (1,267-2,466) (1,829-2,601) [0; 17,352] [0; 11,304] [0; 7,670] [0; 17,352] Other doctors Private 47 0 0 18 (0-138) n.a. n.a. (0-55) [0; 4, 607] [0; 0] [0; 0] [0; 4,607] Public Outpatients 1,215 559 633 827 (685-1,900) (324-832) (183-1,330) (581-1,159) [0; 12,111] [0; 7,404] [0; 10,698] [0; 12,111] Case Manger 0 0 0 0 Public Community MH n.a. n.a. n.a. n.a. [0; 0] [0; 0] [0; 0] [0; 0] Subtotal 1,262 559 633 846 (708-1,945) (324-832) (183-1,330) (592-1,181) [0; 12,111] [0; 7,404] [0; 10,698] [0; 12,111] KNOWN TOTAL 4,133 2,473 2,526 3,132 (Medical) (3,370-5,022) (2,006-2,994) (1,840-3,333) (2,175-3,611) [0; 17,352] [0; 12,453] [0; 10,698] [0; 17,352]
29 | P a g e

City Stirling Joondalup Total n=98 n=115 n=37 N=250
TERTIARY QUALIFIED Nurses Private* 0 0 0 0 (incl. under psychiatrist) n.a. n.a. n.a. n.a. [0; 0] [0; 0] [0; 0] [0; 0] Public Outpatients 115 218 131 165 (22-246) (45-426) (0-327) (71-270) [0; 5,248] [0; 8,478] [0; 2,422] [0; 8,478] Case Manger 1,434 1,343 1,418 1,390 Public Community MH (916-1,989) (898-1,809) (610-2,294) (1,077-1,720) [0; 10,496] [0; 10,496] [0; 10,496] [0; 10,496] Subtotal 1,549 1,560 1,549 1,554 (1,037-2,102) (1,085-2,070) (742-2,484) (1,234-1,870) [0; 10,496] [0; 10,496] [0; 12,919] [0; 12,919] Psychologists Private 0 29 0 13 n.a. (0-87) n.a. (0-27) [0; 0] [0; 3,348] [0; 0] [0; 3,348] Public Outpatients 107 190 0 129 (0-259) (36-420) n.a. (39-250) [0; 5,428] [0; 9,689] [0; 0] [0; 9,689] Case Manger 157 133 0 123 Public Community MH (0-418) (20-306) n.a. (29-247) [0; 10,496] [0; 10,496] [0; 0] [0; 10,496] Subtotal 264 352 0 265 (49-559) (134-628) n.a. (123-443) [0; 10,496] [0; 10,496] [0; 0] [0; 10,496] Social Workers Private 0 0 0 0 n.a. n.a. n.a. n.a. [0; 0] [0; 0] [0; 0] [0; 0] Public Outpatients 66 63 0 55 (0-153) (7-143) n.a. (16-107) [0; 4,037] [0; 2,422] [0; 0] [0; 4,037] Case Manger 408 407 262 386 Public Community MH (91-863) (132-744) (64-531) (196-634) [0; 10,496] [0; 10,496] [0; 2,422] [0; 10,496] Subtotal 474 470 262 441 (140-941) (187-810) (64-531) (247-698) [0; 10,496] [0; 10,496] [0; 2,422] [0; 10,496] CONTD. OVER
30 | P a g e
City Stirling Joondalup Total n=98 n=115 n=37 N=250
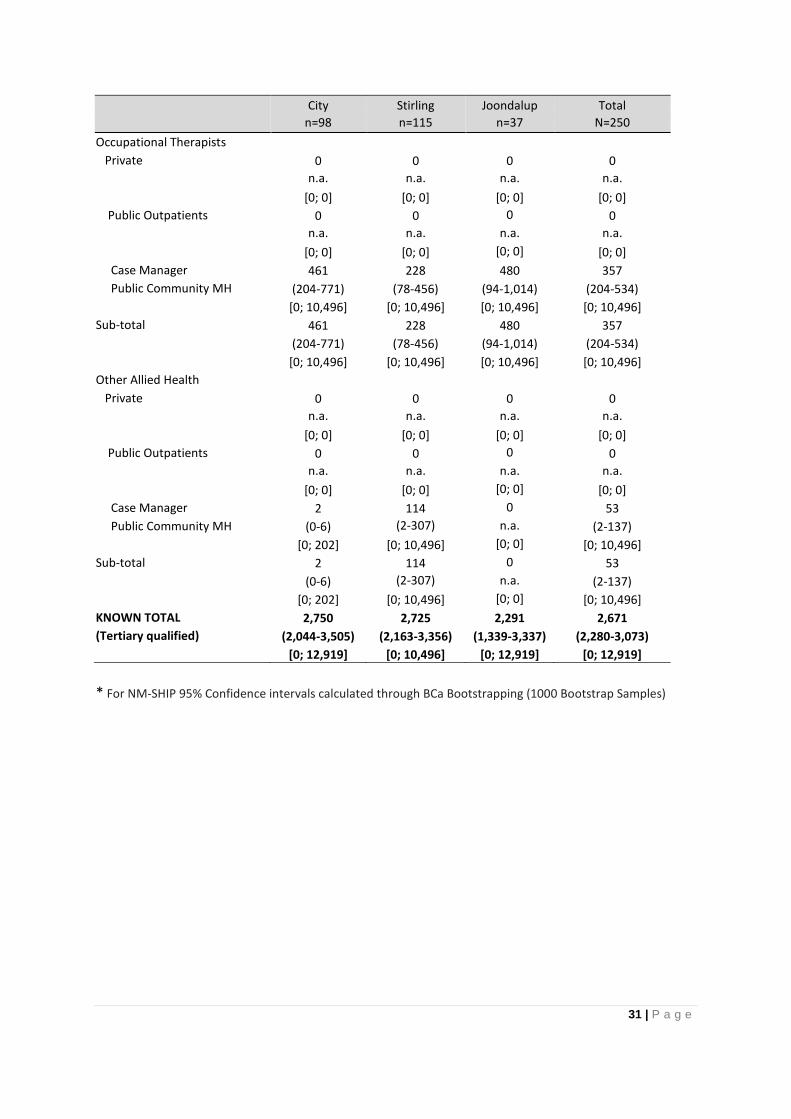
Occupational Therapists Private 0 0 0 0 n.a. n.a. n.a. n.a. [0; 0] [0; 0] [0; 0] [0; 0] Public Outpatients 0 0 0 0 n.a. n.a. n.a. n.a. [0; 0] [0; 0] [0; 0] [0; 0] Case Manager 461 228 480 357 Public Community MH (204-771) (78-456) (94-1,014) (204-534) [0; 10,496] [0; 10,496] [0; 10,496] [0; 10,496] Sub-total 461 228 480 357 (204-771) (78-456) (94-1,014) (204-534) [0; 10,496] [0; 10,496] [0; 10,496] [0; 10,496] Other Allied Health Private 0 0 0 0 n.a. n.a. n.a. n.a. [0; 0] [0; 0] [0; 0] [0; 0] Public Outpatients 0 0 0 0 n.a. n.a. n.a. n.a. [0; 0] [0; 0] [0; 0] [0; 0] Case Manager 2 114 0 53 Public Community MH (0-6) (2-307) n.a. (2-137) [0; 202] [0; 10,496] [0; 0] [0; 10,496] Sub-total 2 114 0 53 (0-6) (2-307) n.a. (2-137) [0; 202] [0; 10,496] [0; 0] [0; 10,496] KNOWN TOTAL 2,750 2,725 2,291 2,671 (Tertiary qualified) (2,044-3,505) (2,163-3,356) (1,339-3,337) (2,280-3,073) [0; 12,919] [0; 10,496] [0; 12,919] [0; 12,919] * For NM-SHIP 95% Confidence intervals calculated through BCa Bootstrapping (1000 Bootstrap Samples)
31 | P a g e
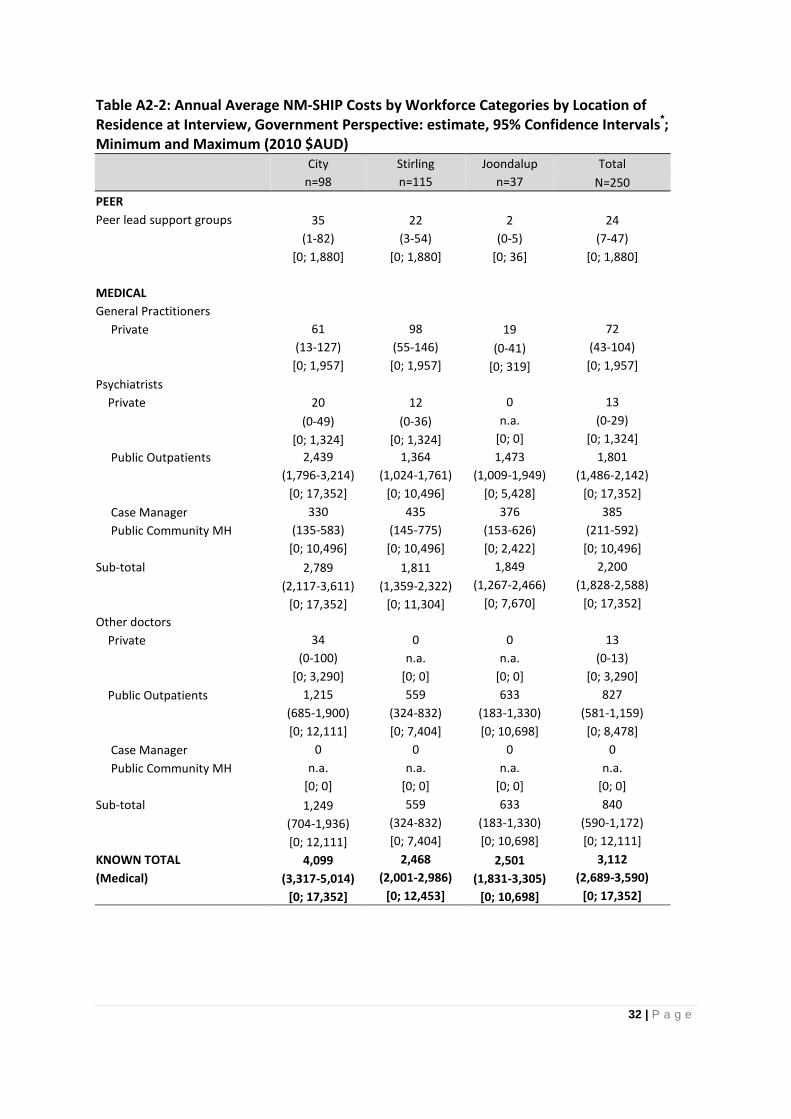
Table A2-2: Annual Average NM-SHIP Costs by Workforce Categories by Location of Residence at Interview, Government Perspective: estimate, 95% Confidence Intervals*; Minimum and Maximum (2010 $AUD) City Stirling Joondalup Total n=98 n=115 n=37 N=250 PEER Peer lead support groups 35 22 2 24 (1-82) (3-54) (0-5) (7-47) [0; 1,880] [0; 1,880] [0; 36] [0; 1,880] MEDICAL General Practitioners Private 61 98 19 72
(13-127) (55-146) (0-41) (43-104)
[0; 1,957] [0; 1,957] [0; 319] [0; 1,957] Psychiatrists Private 20 12 0 13 (0-49) (0-36) n.a. (0-29) [0; 1,324] [0; 1,324] [0; 0] [0; 1,324] Public Outpatients 2,439 1,364 1,473 1,801 (1,796-3,214) (1,024-1,761) (1,009-1,949) (1,486-2,142) [0; 17,352] [0; 10,496] [0; 5,428] [0; 17,352] Case Manager 330 435 376 385 Public Community MH (135-583) (145-775) (153-626) (211-592) [0; 10,496] [0; 10,496] [0; 2,422] [0; 10,496] Sub-total 2,789 1,811 1,849 2,200 (2,117-3,611) (1,359-2,322) (1,267-2,466) (1,828-2,588) [0; 17,352] [0; 11,304] [0; 7,670] [0; 17,352] Other doctors Private 34 0 0 13
(0-100) n.a. n.a. (0-13)
[0; 3,290] [0; 0] [0; 0] [0; 3,290] Public Outpatients 1,215 559 633 827 (685-1,900) (324-832) (183-1,330) (581-1,159) [0; 12,111] [0; 7,404] [0; 10,698] [0; 8,478] Case Manager 0 0 0 0 Public Community MH n.a. n.a. n.a. n.a. [0; 0] [0; 0] [0; 0] [0; 0] Sub-total 1,249 559 633 840 (704-1,936) (324-832) (183-1,330) (590-1,172) [0; 12,111] [0; 7,404] [0; 10,698] [0; 12,111] KNOWN TOTAL 4,099 2,468 2,501 3,112 (Medical) (3,317-5,014) (2,001-2,986) (1,831-3,305) (2,689-3,590) [0; 17,352] [0; 12,453] [0; 10,698] [0; 17,352]
32 | P a g e
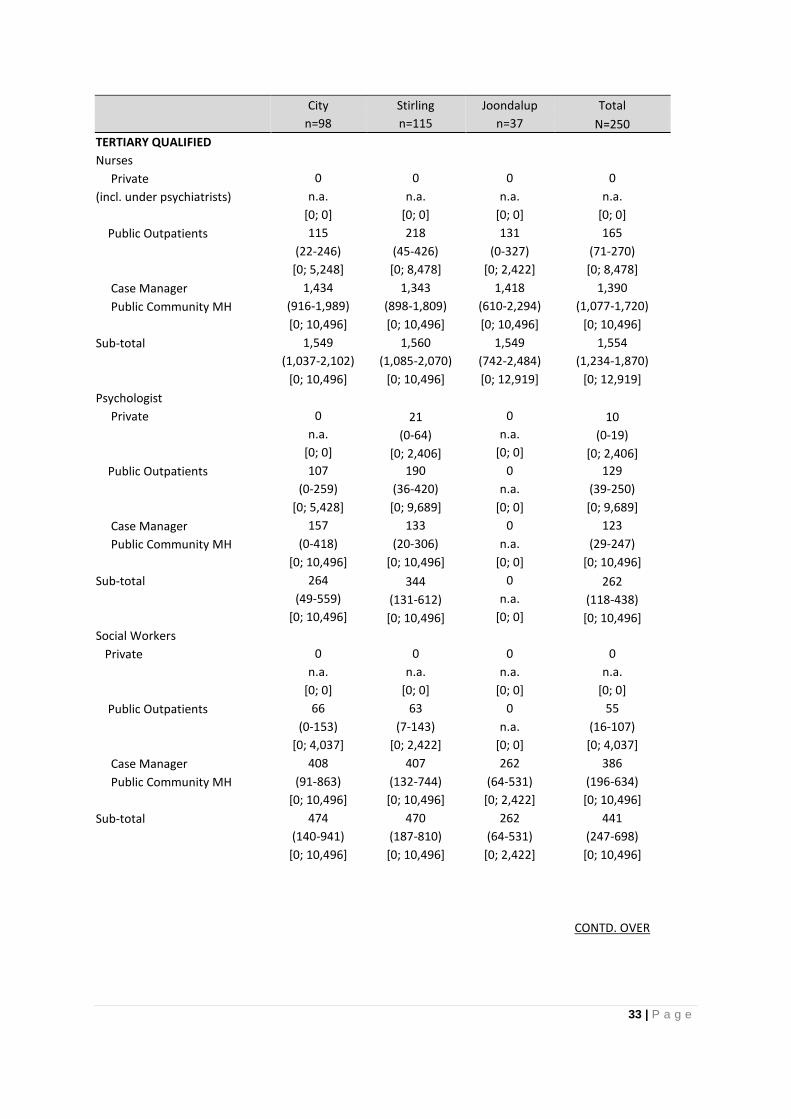
City Stirling Joondalup Total n=98 n=115 n=37 N=250 TERTIARY QUALIFIED Nurses Private 0 0 0 0 (incl. under psychiatrists) n.a. n.a. n.a. n.a. [0; 0] [0; 0] [0; 0] [0; 0] Public Outpatients 115 218 131 165 (22-246) (45-426) (0-327) (71-270) [0; 5,248] [0; 8,478] [0; 2,422] [0; 8,478] Case Manager 1,434 1,343 1,418 1,390 Public Community MH (916-1,989) (898-1,809) (610-2,294) (1,077-1,720) [0; 10,496] [0; 10,496] [0; 10,496] [0; 10,496] Sub-total 1,549 1,560 1,549 1,554 (1,037-2,102) (1,085-2,070) (742-2,484) (1,234-1,870) [0; 10,496] [0; 10,496] [0; 12,919] [0; 12,919] Psychologist Private 0 21 0 10 n.a. (0-64) n.a. (0-19) [0; 0] [0; 2,406] [0; 0] [0; 2,406] Public Outpatients 107 190 0 129 (0-259) (36-420) n.a. (39-250) [0; 5,428] [0; 9,689] [0; 0] [0; 9,689] Case Manager 157 133 0 123 Public Community MH (0-418) (20-306) n.a. (29-247) [0; 10,496] [0; 10,496] [0; 0] [0; 10,496] Sub-total 264 344 0 262 (49-559) (131-612) n.a. (118-438) [0; 10,496] [0; 10,496] [0; 0] [0; 10,496] Social Workers Private 0 0 0 0 n.a. n.a. n.a. n.a. [0; 0] [0; 0] [0; 0] [0; 0] Public Outpatients 66 63 0 55 (0-153) (7-143) n.a. (16-107) [0; 4,037] [0; 2,422] [0; 0] [0; 4,037] Case Manager 408 407 262 386 Public Community MH (91-863) (132-744) (64-531) (196-634) [0; 10,496] [0; 10,496] [0; 2,422] [0; 10,496] Sub-total 474 470 262 441 (140-941) (187-810) (64-531) (247-698) [0; 10,496] [0; 10,496] [0; 2,422] [0; 10,496] CONTD. OVER
33 | P a g e

City Stirling Joondalup Total n=98 n=115 n=37 N=250 Occupational Therapists Private 0 0 0 0 n.a. n.a. n.a. n.a. [0; 0] [0; 0] [0; 0] [0; 0] Public Outpatients 0 0 0 0 n.a. n.a. n.a. n.a. [0; 0] [0; 0] [0; 0] [0; 0] Case Manager 461 228 480 357 Public Community MH (204-771) (78-456) (94-1,014) (204-534) [0; 10,496] [0; 10,496] [0; 10,496] [0; 10,496] Sub-total 461 228 480 357 (204-771) (78-456) (94-1,014) (204-534) [0; 10,496] [0; 10,496] [0; 10,496] [0; 10,496] Other Allied Health Private 0 0 0 0 n.a. n.a. n.a. n.a. [0; 0] [0; 0] [0; 0] [0; 0] Public Outpatients 0 0 0 0
n.a. n.a. n.a. n.a.
[0; 0] [0; 0] [0; 0] [0; 0] Case Manager 2 114 0 53 Public Community MH (0-6) (2-307) n.a. (2-137) [0; 202] [0; 10,496] [0; 0] [0; 10,496] Sub-total 2 114 0 53 (0-6) (2-307) n.a. (2-137)
[0; 202] [0; 10,496] [0; 0] [0; 10,496] KNOWN TOTAL 2,750 2,717 2,291 2,667 (Tertiary qualified) (2,044-3,505) (2,152-3,346) (1,339-3,337) (2,280-3,073) [0; 12,919] [0; 10,496] [0; 12,919] [0; 12,919] * For NM-SHIP 95% Confidence intervals calculated through BCa Bootstrapping (1000 Bootstrap Samples)
34 | P a g e

Appendix 3: References Julious SA. 2004 “Using confidence intervals around individual means to assess statistical significance between two means.” Pharmaceutical Statistics 3: 217–222 Morgan V, Marwick P, Waterreus A, Jablensky A, Rock D, Gibson N, Stefanis N, Sultan L, Sha S, Prinzio PD. North Metropolitan Health Service Survey of High Impact Psychosis (North Metro SHIP). Report to North Metropolitan Health Service Mental Health and Mental Health Commission. November 2013. University of WA: Perth. Neil A.L., Carr V.J, Mihalopoulos C, Mackinnon A, Morgan V. 2014 “The costs of psychosis, Australia, 2010: findings from the second Australian survey of psychosis.” Australian and New Zealand Journal of Psychiatry 48(2): 169-82 National Mental Health Service Element and Activity Descriptions Version 4.10 7 April 2013
35 | P a g e