
AMA2008_2
97
VOL.39, No.2, SPRING 2008 ISSN 0084-5841
-
Upload
associate-professor-dr-said-elshahat-abdallah -
Category
Documents
-
view
141 -
download
7
Transcript of AMA2008_2

VO
L.39, NO
.2, Spring 2008
VOL.39, No.2, SPRING 2008
ISSN 0084-5841

VOL.39, No.2, SPRING 2008

Yoshisuke Kishida, Publisher & Chief EditorContributing Editors and Cooperators
- AFRICA -Kayombo, Benedict (Botswana)Fonteh, Fru Mathias (Cameroon)
El Behery, A.A.K. (Egypt)El Hossary, A.M. (Egypt)
Pathak, B.S. (Ethiopia)Bani, Richard Jinks (Ghana)Djokoto, Israel Kofi (Ghana)
Some, D. Kimutaiarap (Kenya)Houmy, Karim (Morocco)Igbeka, Joseph C. (Nigeria)
Odigboh, E.U. (Nigeria)Oni, Kayode C. (Nigeria)
Kuyembeh, N.G. (Sierra Leone)Abdoun, Abdien Hassan (Sudan)
Saeed, Amir Bakheit (Sudan)Khatibu, Abdisalam I. (Tanzania)Baryeh, Edward A. (Zimbabwe)Tembo, Solomon (Zimbabwe)
- AMERICAS -Cetrangolo, Hugo Alfredo (Argentina)
Naas, Irenilza de Alencar (Brazil)Ghaly, Abdelkader E. (Canada)
Hetz, Edmundo J. (Chile)Valenzuela, A.A. (Chile)
Aguirre, Robert (Colombia)Ulloa-Torres, Omar (Costa Rica)Magana, S.G. Campos (Mexico)
Ortiz-Laurel, H. (Mexico)Chancellor, William J. (U.S.A.)
Goyal, Megh Raj (U.S.A.)Mahapatra, Ajit K. (U.S.A.)Philips, Allan L. (U.S.A.)
- ASIA and OCEANIA -Quick, G.R. (Australia)
Farouk, Shah M. (Bangladesh)Hussain, Daulat (Bangladesh)
Mazed, M.A. (Bangladesh)Wangchen, Chetem (Bhutan)
Wang, Wanjun (China)Illangantileke, S. (India)
Ilyas, S. M. (India)Michael, A.M. (India)
Ojha, T.P. (India)
Verma, S.R. (India)Soedjatmiko (Indonesia)
Behroozi-Lar, Mansoor (Iran)Minaei, Saeid (Iran)Sakai, Jun (Japan)
Snobar, Bassam A. (Jordan)Chung, Chang Joo (Korea)
Lee, Chul Choo (Korea)Bardaie, Muhamad Zohadie (Malaysia)
Pariyar, Madan (Nepal)Ampratwum, David Boakye (Oman)
Eldin, Eltag Seif (Oman)Chaudhry, Allah Ditta (Pakistan)
Mughal, A.Q. (Pakistan)Rehman, Rafiq ur (Pakistan)
Devrajani, Bherular T. (Pakistan)Abu-Khalaf, Nawaf A. (Palestine)Nath, Surya (Papua New Guinea)Lantin, Reynaldo M. (Philippines)Venturina, Ricardo P. (Philippines)
Al-suhaibani, Saleh Abdulrahman (Saudi Arabia)Al-Amri, Ali Mufarreh Saleh (Saudi Arabia)
Chang, Sen-Fuh (Taiwan)Peng, Tieng-song (Taiwan)
Krishnasreni, Suraweth (Thailand)Phongsupasamit, Surin (Thailand)
Rojanasaroj. C. (Thailand)Salokhe, Vilas M. (Thailand)Singh, Gajendra (Thailand)
Pinar, Yunus (Turkey)Haffar, Imad (United Arab Emirates)
Lang, Pham Van (Viet Nam)Nguyen Hay (Viet Nam)
Hazza’a, Abdulsamad Abdulmalik (Yemen)
- EUROPE -Kaloyanov, Anastas P. (Bulgaria)
Kic, Pavel (Czech)Have, Henrik (Denmark)
Müller, Joachim (Germany)Pellizzi, Giuseppe (Italy)
Hoogmoed, W.B. (Netherlands)Pawlak, Jan (Poland)
Marchenko, Oleg S. (Russia)Kilgour, John (U.K.)
Martinov, Milan (Yugoslavia)
EDITORIAL STAFF(Tel.+81-(0)3-3291-5718)
Yoshisuke Kishida, Chief EditorShinjiro Tetsuka, Managing Editor
Zachary A. Henry, Editorial Consultant
ADVERTISING(Tel.+81-(0)3-3291-3672)
Yoshito Nakajima, Manager (Head Office)Advertising Rate: 300 thousand yen per page
CIRCULATION(Tel.+81-(0)3-3291-5718)(Fax.+81-(0)3-3291-5717)
Editorial, Advertising and Circulation Headquarters7, 2-chome, Kanda Nishikicho, Chiyoda-ku, Tokyo 101-0054, Japan
URL: http://www.shin-norin.co.jpE-Mail: [email protected]
Copylight © 2008 byFARM MACHINERY INDUSTRIAL RESEACH CORP.
SHIN-NORIN Building7, 2-chome, Kanda Nishikicho, Chiyoda-ku, Tokyo 101-0054, Japan
Printed in Japan
This is the 135th issue since its maiden isue in the Spring of 1971
EDITORIAL
The record-breaking rise in food prices is driving us into a crisis of food shortage throughout the world. Particularly it has a serious effect on the poor in developing nations. Rural areas in African countries, where they have constantly suffered from food shortage due to the drought and other reasons, are now in this dreadful condition. Increasing num-bers of people are starving to death there.
The United Nations urgently called the agricultural ministers and related government leaders of worldwide nations to organize the World Food Summit in Rome early in June this year. The food problem was also taken up at the G8 Summit held in Japan this month. The members of the G8 Summit agreed to support the measures to increase food production in Africa by two or three times.
In a granary in the Middle West of the U.S. damaged by the flood, the harvest area of soy beans is estimated to be reduced by 15 %. The continuing drought in Australia is creating serious concerns about food and meat production. Meanwhile, new rising countries with enormous population like China and India are importing great amounts of food, primarily feed grains, in the midst of prominent economic growth and the demand for better food.
The grain prices, which have risen by three times in the past three years, are not likely to drop. Last year grain pro-ducing farmers in the U.S. and Canada earned as much as their total income for the past four years.
The rise in food prices gives various negative impacts on our living. However, at the same time, there is indica-tion that agriculture revives again as a new attractive industry. Agriculture is being recognized as a big political issue around the world. It is expected that the investment in agriculture will be rapidly expanding.
We see the historical change in the global food condition, from an excessive supply for a long time to a short supply in developed countries. In order to get over this crisis, we have to make the best use of all available science technolo-gies related to agriculture. In particular agricultural engineering technologies will play a key role.
Timely and appropriate farm work is needed to raise agricultural productivity, especially in the current environment that is easily affected by abnormal weather or global warming. Thus, the demand for agricultural mechanization has been greatly mounting. In this historical restoration of agriculture, it is time for us involved in agricultural mechaniza-tion to work together to promote new mechanization everywhere in the world.
AMA will work harder than ever to link the people engaged in that historical task.
Yoshisuke KishidaChief Editor
Tokyo, JapanJuly, 2008

Yoshisuke Kishida
Elsamawal Khalil MakkiAbdelmoniem El-amin Mohamed
P. K. Gupta, Rakesh KumarB. S. Panesar
Syedul Islam, Abul QuasemAbdur Rahman, Mohammad Nasim
Abdul Baqui, Farah Naz Khan R. S. Devnani
L. P. Singh, V. R. VagadiaK. K. Jain, A. H. Memon
V. P. Chaudhary, S. K. SharmaD. K. Pandey
S. K. Satpathy, I. K. Garg
T. B. Adhikarinayake, J. MüllerJ. Oostdam
V. Rasooli Sharabiani
S. C. Sharma, T. P. Singh
B. Sanjeeva Reddy, V. Maruthi
He Yong, Chen YongjunWu Yanping
Ambrish Ganachari, K. ThangavelD. Manohar Jesudas, R. Viswanathan
K. C. Roy, Gajendra Singh
Abstracts
7
9
14
19
23
34
39
47
52
57
64
71
76
80
83
94
Editorial
Tillage Implements Performance and Effect on Some Soil Physical Properties
Studies on Characterization of Selected Plant Oils and Their Bio-Diesels
Efficient Utilization of Conventional Fuel Through the Improvement of Traditional Stove
Development and Evaluation of Anaerobic Type Sprouted Rice Drum Seeder and to Ascertain the Physiological Load on the Operator
Evaluation and Improvement in Design of Self Propelled Vertical Conveyer Reaper
Energy Requirement of Different Weed Management Practices for Aerobic Rice in India
Effect of Selected Parameters on the Performance of a Semi-auto-matic Vegetable Transplanter
Design and Construction of the Airtight Ferrocement Bin for On-farm Storage of Paddy
The Situation of Agricultural Mechanization in Sarab City - Iran
Development and Performance Evaluation of a Mat Type Nursery Raising Device
Development of a Prototype Dehuller for Pretreated Chickpea
Study on Intelligent Measurement and Analysis System of Soil Elec-tric Conductivity
Design and Development of a Machine for Aonla Seed Removal
Agricultural Mechanization in Bangladesh
CONTENTS
AGRICULTURAL MECHANIZATION IN ASIA, AFRICA AND LATIN AMERICAVol.39, No.2, July 2008
Instructions to AMA Contributors .......................4Co-operating Editor ............................................96
Back Issues ..........................................................99★ ★ ★

VOL.39 NO.2 2008 AGRICULTURAL MECHANIZATION IN ASIA, AFRICA, AND LATIN AMERICA 9
Tillage Implements Performance and Effect onSome Soil Physical Properties
byElsamawal Khalil MakkiSchool of Rural Extension Educationand Development,Ahfad University for Women,OmdurmanSUDAN
Abdelmoniem El-amin MohamedDept. of Agricultural Engineering,Faculty of Agriculture,University of Khartoum,ShambatSUDAN
AbstractA chisel plough, disk plough and
ridger were tested to evaluate their effect on selected soil physical prop-erties along with their performance and power requirements. Implement type had a consistent significant effect (P ≤ 0.01) on soil moisture content (%), whereas, bulk density (g/cm3) and porosity (%) showed inconsistent response. However, the chisel plough recorded the highest moisture content and basic infiltra-tion rate values as compared to the ridger and disk plough. The chisel plough had the highest power re-quirement and fuel consumption. The ridger had the lowest power requirement and fuel consumption, but recorded the highest field capac-ity and efficiency.
IntroductionSuccess or failure of any crop
production system largely depends on seedbed environment, amongst other factors. A harsh seedbed en-vironment may kill the seedling or stress it severely enough to limit the crop’s productive potential. Gener-ally, tillage positively affects soil bulk density, porosity, water stor-age capacity, infiltration, penetra-tion resistance and compaction. A
thorough understanding of tillage effect on soil physical properties is essential for wise application of tillage for crop production (Erbach, 1987). The effectiveness of any till-age practice should be evaluated depending on the change it brings about in soil physical properties, rather than depending on crop yield only. Economic considerat ions should be added to tillage evaluation parameters especially field capac-ity and energy utilization efficiency particularly when comparing two implements. Implement type, tillage depth and speed affect the draft and the unit draft power in a particular soil as well as the tractor’s driving wheel slippage, draw bar power, fuel consumption, and field capac-ity and efficiency (Belel and Dahab, 1997 and Ahmed, 2000).
The objectives of this study were:1. To study the effect of tillage
implement and sampling depth on some soil physical proper-ties.
2. To evaluate the power perfor-mance parameters of primary tillage implements.
Material and MethodsThe experiments were conducted
in the Demonstration Farm of the Faculty of Agriculture, University
of Khartoum in Shambat (longitude 32º 32′ E, latitude 15º 40′ N and alti-tude of 380 m asl). The soil is classi-fied as clay soil. The effect of tillage treatment and sampling depth on soil physical properties was studied for two consecutive winter seasons, namely 2000/01 and 2001/02, using the split plot design. Power perfor-mance parameters of tillage imple-ments under investigation were evaluated using the randomized complete block design. The experi-mental area (0.42 ha) was divided into 3 blocks, each of which was divided into 4 main plots. The main plot dimensions were 24 × 14.5 m.
Tillage practices included:· Disk ploughing to a depth of 20
cm (conventional tillage).· Chisel ploughing to a depth of
30 cm (conservation tillage).· Ridger ploughing to a depth of
15 cm (reduced tillage).· No tillage (control).The specifications of the applied
tillage equipments were as follows:1. A standard disk plough, with
three disk bottoms each 64 cm in diameter.
2. Chisel plough, with five shanks, 150 cm wide (0.30 cm) shank spacing.
3. Ridger plough with a tool bar and three ridger bottoms, 80 cm apart.
Soil moisture content (%), bulk

AGRICULTURAL MECHANIZATION IN ASIA, AFRICA, AND LATIN AMERICA 2008 VOL.39 NO.210
density (g/cm3) and porosity (%) were determined for each tillage treatment from the soil surface down to 60 cm at 15 cm increments. Soil moisture content was deter-mined gravimetrically before each tillage treatment and after the sec-ond irrigation. Soil bulk density was determined using the clod (paraffin wax) method. Soil total porosity was calculated using the formula pro-posed by Vomocil (1965). Infiltra-tion rate measurements were carried out using a double ring infiltrometer described by Michael (1978). This was replicated three times for each tillage treatment and the mean was calculated. The materials used to test the performance of the imple-
ments under study were a measuring tape, two stopwatches, two marking flags, two tractors (Ford 6600, 75 hp and Case International 975, 75 hp), a hydraulic dynamometer PIAB, NS 2650 (100 KN capacity) and a chain. The different parameters were tested following the methods recommended by RNAM (1983).
Results and DiscussionTable 1 shows the effect of till-
age and sampling depths on soil bulk density, porosity and moisture content. The analysis of variance indicated a significant difference between the means in 2001/02 (P ≤
0.05). The highest mean density in 2000/01 (1.57 g/cm3) was recorded under no-tillage, while the lowest mean (1.51 g/cm3) was recorded under ridging. The mean bulk den-sity values under disk and chisel ploughing were 1.53 and 1.52 g/cm3, respectively. In 2001/02, no-tillage recorded (significantly) the highest mean bulk density of 1.68 g/cm3, while ridging recorded the lowest value of 1.47 g/cm3. Both disk and chisel ploughs recorded the same mean bulk density (1.53 g/cm3), which was not significantly differ-ent from that of ridging and no-tillage. However, the results were in accordance with those reported by Hammad and Dawelbeit (2001).
Season Parameters Samplingdepth
Tillage system MeanChiseling Discing No-tillage Ridging
2000/01
Soil bulk density, g/cm3
0-15 cm 1.54 1.42 1.46 1.39 1.45*a15-30 cm 1.50 1.48 1.59 1.53 1.53 ab30-45 cm 1.60 1.69 1.73 1.50 1.63 b45-60 cm 1.46 1.54 1.51 1.61 1.53 ab
Mean 1.52 1.53 1.57 1.51
Soil porosity, %
0-15 cm 42.32 46.82 45.32 47.94 45.60*a15-30 cm 43.82 44.57 40.45 42.70 42.88 ab30-45 cm 40.07 36.70 35.21 43.82 38.95 b45-60 cm 45.32 42.32 43.45 39.70 42.70 ab
Mean 42.88 42.60 41.10 43.54
Soil moisture content, %
0-15 cm 10.50 9.86 10.17 13.80 11.10**a15-30 cm 16.33 9.73 13.20 13.13 13.11 b30-45 cm 18.07 13.40 17.87 16.50 16.48 c45-60 cm 17.20 14.60 16.80 18.73 16.83 c
Mean 15.53**a 11.90 b 14.51 a 15.53 a
2001/02
Soil bulk density, g/cm3
0-15 cm 1.45 1.60 1.69 1.36 1.5315-30 cm 1.56 1.65 1.59 1.39 1.5530-45 cm 1.61 1.50 1.72 1.43 1.5745-60 cm 1.49 1.37 1.72 1.69 1.57
Mean 1.53*ab 1.53 ab 1.68 a 1.47 b
Soil porosity, %
0-15 cm 45.69 40.07 36.70 49.06 42.9015-30 cm 41.57 38.20 40.45 47.94 42.0930-45 cm 39.70 43.82 35.58 46.44 41.3945-60 cm 44.19 48.69 35.58 36.70 41.29
Mean 42.79*a 42.79 a 37.07 b 45.03 a
Soil moisture content, %
0-15 cm 9.90 10.30 11.68 13.60 11.37*a15-30 cm 17.03 10.53 11.40 13.03 13.00 b30-45 cm 18.47 12.67 16.17 16.57 15.97 c45-60 cm 17.93 13.80 16.80 17.97 16.63 c
Mean 15.83**a 11.83 b 14.00 a 15.29 a
Table 1 The effect of tillage and sampling depth on soil bulk density (g/cm3), porosity (%) and moisture content (%)
Means followed by different letters within a row or a column are significantly different.*, ** = Means are significantly different at (P ≤ 0.05) and (P ≤ 0.01), respectively.

VOL.39 NO.2 2008 AGRICULTURAL MECHANIZATION IN ASIA, AFRICA, AND LATIN AMERICA 11
Sampling depth (cm) had a sig-nificant effect (P ≤ 0.05) on the mean bulk density only in 2000/01. The lowest mean bulk densities (1.45 and 1.53 g/cm3) were recorded at 0-15 cm depth range in 2000/01 and 2001/02, respectively, while the highest value of 1.63 g/cm3 was recorded at 30-45 cm in 2000/01. In 2001/02 the highest bulk density of 1.57 g/cm3 was recorded at 30-45 and 45-60 cm depth ranges. How-ever, in 2001/02 bulk density in-creased with sampling depth down to 30-45 cm, then decreased at the 45-60 cm depth range. The same trend was observed in 2001/02 ex-cept that bulk densities were similar at 30-45 and 45-60 cm depth range. Al-Tahan et al. (1992) reported the same trend.
The mean soil porosity was sig-nificantly affected by tillage system only in 2001/02 (P ≤ 0.05). It was observed that tillage effect on po-rosity followed the same trend as its effect on bulk density. The highest mean porosity was recorded under ridging in both seasons, while the lowest mean porosity was recorded under no-tillage. Chiseling recorded higher porosity values in 2000/01 as compared to disking while both tillage systems produced the same effect on soil porosity in 2001/02. However, these results are in ac-cordance with those reported by
Erbach (1987).Sampling depth had a significant
effect on the mean soil porosity (%) only in 2000/01. The depth range of 0-15 cm recorded the highest poros-ity percentages. The same trend of bulk density response to tillage was noticed when porosity response to tillage was examined. However, in 2000/01, the mean soil porosity decreased with depth down to the 30-45 cm range, then increased to 45-60 cm. This trend was well ob-served in 2001/02 where the depth ranges of 30-45 and 45-60 recorded the same mean value.
Tillage significantly affected the mean soil moisture content after the second irrigation during both seasons (P ≤ 0.01). In 2000/01, dis-king resulted in the lowest mean moisture content (11.9 %), which was significantly different from the other tillage systems. Chiseling and ridging recorded the same mean moisture content (15.53 %), which was higher than that recorded under no-tillage (14.51 %). However, mois-ture content under chiseling, ridging and no-tillage was statistically not different (P > 0.05). A slight differ-ence was observed in 2001/02, as chiseling recorded a higher mois-ture content of 15.83 % compared to ridging, which recorded 15.29 %, while under disking and no-tillage it was 11.83 and 14.00 %, respectively.
However, only disking was statisti-cally different from the other tillage systems (P ≤ 0.01), which were all statistically not different from each other (P > 0.05).
The effect of tillage on soil mois-ture content cannot be viewed sepa-rately from its effect on bulk density and infiltration. In both seasons moisture content (%) under chisel-ing was higher than under no-tillage and ridging, except in 2000/01 when ridging recorded the same value. Ridging, as well, resulted in higher moisture content when compared with no-t il lage in 2000/01 and 2001/02. The high moisture content under no-tillage was attributed to the presence of cracks and large fis-sures, which facilitated water move-ment into the soil after irrigation. The high moisture content under no-tillage as compared to plough-ing, was attributed to the decrease in evapotranspiration of unploughed soil. Sheikh et al. (1978) reported comparable results. The high mois-ture content under chiseling as com-pared to disking was also reported by Abuzaid (1999).
Sampling depth significantly af-fected the mean soil moisture con-tent (%) in 2000/01 and 2001/02 at P ≤ 0.01 and P ≤ 0.05, respectively. A depth range of 0-15 cm recorded the lowest mean values of 11.1 and 11.37 % in both seasons, respectively,
Infiltration rate, cm/h
0
5
10
15
20
25
30
605040302010Time, min
Chisel ploughDisc ploughRidgerNo-tillage
Infiltration rate, cm/h
0
5
10
15
20
25
30
605040302010Time, min
Chisel ploughDisc ploughRidgerNo-tillage
Fig. 1 Effect of tillage on average infiltrationrate (cm/h) for the 2000/01 season
Fig. 2 Effect of tillage on average infiltrationrate (cm/h) for the 2001/02 season

AGRICULTURAL MECHANIZATION IN ASIA, AFRICA, AND LATIN AMERICA 2008 VOL.39 NO.212
while the depth range of 45-60 cm recorded the highest mean values of 16.83 and 16.63 % in the same seasons, respectively. However, moisture content increased with sampling depth from the surface down to 45-60 cm depth range in both seasons. Depth ranges of 30-45 and 45-60 cm were statistically not different (P > 0.05) and were both different than 0-15 and 15-30 cm, which were statistically different from each other. This was attributed to the high rate of water evaporation from the surface layer, which was exposed to evaporation factors rath-er than deeper ones. Al-Tahan et al. (1992) reported comparable results.
The effect of tillage on soil infil-tration rate (cm/h) for 2000/01 and 2001/02 is shown in Figs. 1 and 2. In 2000/01 the initial infiltration rate ranked in the following order: ridging > disking > no-tillage > chiseling. The basic infiltration rate rank varied a little and was in the following order: chiseling > ridging > disking > no-tillage.
In 2001/02 the initial infiltration rate ranks were: ridging > no-tillage > chiseling > disking. However, the basic infiltration rate was in the fol-lowing order: chiseling > ridging > disking > no-tillage. The high initial infiltration rate under no-tillage over disking and chiseling in 2001/02 could possibly be attributed to the presence of large cracks and fissures and previous crop’s root channels in the soil, while under disking and chiseling, the cracks were destroyed as the whole surface was ploughed,
leaving no room for high infiltra-tion rate due to their presence. However, the effect of these cracks and fissures diminished when the soil swelled after saturation. The superiority of chiseling over the other tillage systems was reported by Maurya (1993) and Abdalla and Mohamed (1998). Results of the ef-fect of tillage implement on work-ing width and depth (cm), tractor’s wheel slippage (%), field capacity (ha/h), field efficiency (%), working speed (km/h), fuel consumption (l/h), draught (KN), unit draught (N/cm2) and drawbar power (KW) are presented in Table 2.
Implement type had a highly sig-nificant effect on forward speed (P ≤ 0.01). Disk plough recorded the highest speed of 3.1 km/h followed by the ridger and chisel plough, which recorded 2.8 and 2.2 km/h, respectively. However, the analysis of variance showed no significant difference between the disk and chisel ploughs. Apparently, forward speed was greatly influenced by the width of implement tines. However, the results show that ploughing depth was more influential than tine dimensions, which ranked second in determining forward speed. Imple-ment type significantly affected the actual field capacity AFC (P ≤ 0.01), with the highest value of 0.34 ha/h recorded under ridger, while chisel plough ranked second (0.26 ha/h), and disk plough ranked last (0.16 ha/h). The effect of implement width on AFC is quite evident. Moreover, the negative effect of wheel slippage
can be compensated for by the im-plement width, as the case of chisel plough and ridger. Abuzaid (1999) and Farah (1999) reported similar ranks for the same implements.
Field efficiency (FE) was signifi-cantly affected by implement type (P ≤ 0.05). The ridger recorded the highest FE (67.4 %). Chisel and disk ploughs recorded efficiencies of 60.0 and 58.3 %, respectively. However, the analysis showed a significant difference in FE values between chisel and disk ploughs. In comparison, Farah (1999) reported the highest FE for the ridger fol-lowed by disk and chisel ploughs, respectively.
Drive wheel slippage was not significantly affected by implement type (P > 0.05). The highest slip-page (14.3 %) was recorded under disk plough followed by ridger (11.1 %), while chisel plough ranked last (7.7 %). Width of the tines was the main attribute of wheel slippage in-crease as soil resistance increased as a result of any increase in the width of the cutting edge.
Fuel consumption was not signifi-cantly affected by implement type (P > 0.05). However, the highest fuel consumption of 2.10 l/h was re-corded under chisel plough followed by disk plough and ridger (2.02 and 1.38 l/h), respectively. Ploughing depth along with draft contributes well to any increase in fuel con-sumption as mentioned by Bowers (1989).
Implement type had a significant effect on draft power (P ≤ 0.05).
Tillage implement
Machine parametersWorking
depth, cm**
Working width, cm*
Wheel slippage,
%
Field capacity,
ha/h*
Field efficiency,
%*
Speed, km/h**
Fuel consum-ption, l/h
Draught, KN*
Unit draught, N/cm2**
Draw bar power, KW*
Disc plough 21.00 a 60.0 a 14.34 0.16 a 58.3 a 3.10 a 2.02 5.00 ab 3.96 a 4.3 aChisel plough 29.66 b 121.3 b 7.71 0.26 b 60.0 b 2.23 b 2.10 6.33 b 1.76 b 5.0 aRidger 15.43 c 211.67 c 11.11 0.34 c 67.3 c 2.83 a 1.38 3.33 a 1.02 b 2.1 bLSD 3.19 3.40 NS 0.049 0.037 0.26 NS 2.21 1.08 1.75Means followed by the same letter(s) within a column are not significantly different.*, ** = Means are significantly different at (P ≤ 0.05) and (P ≤ 0.01), respectively. NS = Means are not significantly different.LSD = Least significantly difference.
Table 2 Machine parameters as affected by implement type

VOL.39 NO.2 2008 AGRICULTURAL MECHANIZATION IN ASIA, AFRICA, AND LATIN AMERICA 13
The highest draft (6.33 KN) was recorded under chisel plough, which was statistically not different from the draft recorded under disk plough (5.00 KN). However, draft power under chisel plough was also signifi-cantly different from that recorded under ridger (3.33 KN). The effect of ploughing depth on draft power seems to be the main attribute to the high draft under chisel and disk ploughs when compared with ridger. The lower draft obtained under disk plough, compared to chisel plough, can be ascribed to the rotating disk element. Farah (1999) obtained the same draft ranks for the chisel plough, disk plough and ridger in the same location of this study.
Implement type had a highly significant effect on unit draft (P ≤ 0.01). Disk plough recorded 3.96 N/cm2, which was significantly higher than both chisel plough and ridger. Chisel plough and ridger recorded no statistical difference in unit draft values of 1.76 and 1.02 N/cm2, respectively. The variation in unit draft values of the different imple-ments were attributed to the varia-tion in cutting edge shapes between the t i l lage implements and the ploughing depth.
Draw bar power was significantly affected by implement type (P ≤ 0.05). The chisel plough recorded 5.0 Kw followed by disk plough and ridger, which recorded 4.3 and 2.1 Kw, respectively. The statistical analysis, however, showed a signifi-cant difference between the values obtained under both chisel and disk ploughs compared to ridger. It can also be seen that drawbar power values ranked in the same manner as did draft and ploughing depth. This indicated that drawbar power was dependent on ploughing depth and draft rather than on ploughing speed and implement type. These results are in accordance with those
reported by Belel and Dahab (1997).
ConclusionThe following conclusions were
drawn from the results of this study:· Tillage implements and sampling
depth significantly affected soil moisture content (%), with the highest mean values recorded under chiseling.
· Amongst the tested tillage im-plements, the chisel plough had the highest power requirements and fuel consumption. This re-sulted in relatively higher basic infiltration rate and soil mois-ture content.
· The ridger had the lowest power requirement and fuel consump-tion, but recorded the highest field capacity and efficiency.
REFERENCES
Abdalla, M. A. and A. E. Mohamed. 1998. Effect of conservation till-age on infiltration. U. K. J. Agric. Sci. 6(2): 74-86.
Abuzaid, K. A. 1999. Soil tillage management for fodder sorghum production. Unpublished M. Sc. Thesis, Faculty of Agriculture, University of Khartoum.
Ahmed, B. M. 2000. Performance of disk and chisel and disk imple-ments and their effect on sorghum and maize in Gezira vertisols. Unpublished M. Sc. Thesis, Fac-ulty of Agriculture, University of Khartoum.
Al-Tahan, Y. H., H. M. Hassan, and I. A. Hammadi. 1992. Effect of ploughing depth using different plow types on some physical prop-erties of soil. AMA. 23(4): 21-24.
Belel, M. M. and A. H. Dahab. 1997. Effect of soil condition on a two-wheel drive tractor performance
using three types of implements. U.K. J. Agric. Sci. 5(2): 1-12.
Bowers, C. G. 1989. Tillage draught and energy requirement for twelve southern soil series. Transac-tions of the American Society of Agricultural Engineers 32(5): 1492-1502.
Erbach, D. C. 1987. Measurement of soil bulk density and moisture. Transactions of the American So-ciety of Agricultural Engineers. 30(4): 922-930.
Farah, I. A. 1999. Response of wheat to varying irrigation levels (Etc %) under varying tillage sys-tems. Unpublished M.Sc. thesis Faculty of Agriculture, University of Khartoum.
Hammad, E. A. and M. I. Dawelbe-it. 2001. Effect of tillage and field condition on soil physical proper-ties, cane and sugar yields in ver-tisols of Kenana sugar estate, Su-dan. Soil and Tillage Res.62(3-4): 101-109.
Michael, A. M. 1978. Irrigation Theory and Practice. 1st edition. VIKAS Puplishing house LTD. New Delhi, Bombay, Bangalore, Calcutta, Kanpur.
Sheikh, G. S., S. I. Ahmed, and A. D. Chaudhary. 1978. Comparative performance of tillage imple-ments. Agricultural mechaniza-tion in Asia, Africa and Latin America.vol. IX, No.3: 57-60.
Vomocil, J. A. 1965. Porosity. In: Black, C. A. (ed). Methods of soil analysis, Part 1. Agronomy. Am. Soc. Agron. Madison, WI: 229-314.
Maurya, P. R. 1993. Tillage prac-tices under irrigated agriculture in the semi-arid region of Nigeria. AMA. 24(3):14-18.
RNAM. 1983. Regional Network for Agricultural Machinery. Tests, codes and procedures for farm machinery. Los Bonos, Philp-pines.
■■

AGRICULTURAL MECHANIZATION IN ASIA, AFRICA, AND LATIN AMERICA 2008 VOL.39 NO.214
Studies on Characterization of Selected Plant Oilsand Their Bio-Diesels
byP. K. GuptaDirectorSchool of Energy Studies for Agriculture,College of Agricultural Engineering,Punjab Agricultural University,Ludhiana - 141 004, PunjabINDIA
B. S. PanesarProfessorSchool of Energy Studies for Agriculture,College of Agricultural Engineering,Punjab Agricultural University,Ludhiana - 141 004, PunjabINDIA
Rakesh KumarResearch FellowSchool of Energy Studies for Agriculture,College of Agricultural Engineering,Punjab Agricultural University,Ludhiana - 141 004, PunjabINDIA
AbstractBio-diesel is a renewable alternate
fuel for diesel engines. Studies were conducted on bio-diesels prepared from three plant oils, namely, rice bran oil, jatropha curcas oil, and karanji oil. Bio-diesel was prepared from plant oils using the esterifica-tion process. Fuel characteristics of these bio-diesels (washed and un-washed) were determined for their suitability as alternate fuel for diesel engines. Most of the fuel character-istics of these bio-diesels were quite close to those of diesel. However, heat values of bio-diesels, except that of rice bran, were lower than that of diesel.
IntroductionPetroleum oil reserves are limited
but the oil consumption rate is in-creasing at an alarming rate. Diesel fuel is heavily used in agriculture but the supply is under threat of dis-
ruptions, quality deterioration and cost escalations. Scientists are in search of some biomass-based fuel that can be used as alternate fuel for diesel engines. Among the vari-ous biomass-based fuels, plant oils seem to be the most promising as a substitute for fossil-derived diesel fuel. These oils have the potential to make farming communities self-sufficient in case of any severe scar-city of diesel. Short-term tests have indicated that plant oils, neat or in blends with diesel fuel, can be used to run diesel engines. However, during extended operation on neat plant oils, serious problems such as injector choking, ring sticking, dilution of engine oil, gum forma-tion and deposits in various engine parts have been reported by Ryan et al. (1984). High viscosity of the plant oils is considered to be the major problem causing inadequate fuel atomization and incomplete combustion. Several methods have been investigated for reducing the viscosity. But, the most promising
method seems to be the esterifica-tion. This paper deals with the study of fuel characteristics of bio-diesels prepared from selected plant oils.
Materials and MethodsPlant oils selected for the study
were physically refined rice bran oil, crude jatropha curcas oil, and crude karanji oil. These oils were converted to bio-diesels. Fuel char-acteristics of both washed and un-washed bio-diesels were determined to check their suitability as an alter-nate fuel for diesel engines.
Preparation of Bio-DieselThe bio-diesel was prepared us-
ing the method standardized by Gupta (1994). Each oil sample was heated to below 60 ºC. The required volume of alkali-methanol mix (ho-mogeneous solution of about 200 ml methanol and 5-10 g NaOH for each litre of oil) was added with the heat-ed oil and the mixture was stirred
VOL.39 NO.2 2008 AGRICULTURAL MECHANIZATION IN ASIA, AFRICA, AND LATIN AMERICA 15
for 5-7 minutes. It was, then, kept undisturbed for 4 hours to allow the glycerol to settle at the bottom. The bio-diesel thus formed was decanted from top leaving glycerol at the bot-tom. The bio-diesel was given 2-3 washings with water to remove any dissolved glycerol, left over sodium hydroxide, excess (unused) metha-nol, and other impurities present in it.
Determination of Fuel Character-istics
The following methods were used to determine the characteristics of oils and their bio-diesels.
DensityCapillary-stopper relative den-
sity bottles of 50-ml capacity were used to determine density of plant oils and their bio-diesels. The rela-tive density bottle was dried and weighed. Then a sample was filled in the bottle and a capillary stopper was placed gently on the neck of the bottle, taking care that no air bubble was left inside the bottle. The bottle was cleaned from outside with filter paper and then it was placed in an oven at 21 ºC. After few minutes, the bottle was taken out and cleaned from outside. The bottle was again kept in the oven to regain the tem-perature. Then it was taken out and weighed. Density was calculated us-ing the following equation (Anony-mous, 1972):
d = (M2 − M1) / 50where,
d = density of sample, g/mlM2 = Mass of relative density
bottle plus sample, gM1 = Mass of empty relative den-
sity bottle, g
Kinematic ViscosityKinematic viscosity of samples
was measured by using Red Wood Viscometer No. 1 (Toshniwal make). Time of gravity flow of a fixed vol-ume (50 ml) of fluid was measured. The experiment was performed at 38 ºC. Kinematic viscosity was cal-culated using the following formu-lae (Anonymous, 1976):
c = 0.26t − 179 / tfor 34 < t > 100
and v = 0.24t − 50 / tfor t > 100
where,ν = Kinematic viscosity in cen-
tiStokest = time of flow in seconds
Flash PointPensk y-Mar tens f la sh point
(closed) apparatus was used to mea-sure the flash point of samples. The sample was filled in the test cup and was heated at a slow and constant rate. At the same time, a small test flame was diverted to the top of the cup at regular intervals. The flash point was taken as the lowest tem-perature at which the flame caused the vapour above the sample to
ignite momentarily (Anonymous, 1970).
Cloud and Pour PointA plastic container filled with an
ice and sodium chloride mixture was insulated using glass wool in order to achieve low temperatures below the freezing point of water. Holes were provided in the top cov-er in order to insert the test tubes containing samples. A thermometer was placed in the tube coaxially. At every 1 ºC fall in temperature, tubes were taken out for observing the cloud/pour point condition (Anony-mous, 1970).
Gross Heat ValueGross heat value of samples was
measured using a bomb calorimeter. The sample was placed in a gelatin capsule and then burnt in oxygen in the bomb calorimeter (model 1252 of Parr make, USA). The total weight of sample and the capsule was fed to the controller and the results, includ-ing the gross heating value, were taken on a printout. Knowing the weight and heat value of capsules, the heat value of the sample was cal-culated (Anonymous, 1984).
Free Fatty Acid (FFA)A known amount of sample was
titrated with aqueous solution of NaOH of known normality. Per-cent FFA was calculated as follows (McKillican, 1966):
Viscocity, cS
0
10
20
30
40
50
60
Conservation tillage
Conventional tillage
No-tillKaranjiJatropha curcasRice branDiesel
Main oilWashed Bio-dieselUnwashed Bio-diesel
Pour point, ºC
-8
-6
-4
-2
0
2
4
6
Conservation tillage
Conventional tillage
No-tillKaranjiJatropha curcasRice branDiesel
Main oilWashed Bio-dieselUnwashed Bio-diesel
Fig. 1 Viscocity of oils and their bio-diesels Fig. 2 Pour point of oils and their bio-diesel

AGRICULTURAL MECHANIZATION IN ASIA, AFRICA, AND LATIN AMERICA 2008 VOL.39 NO.216
% FFA = (V × N × M) / 10wwhere,
V = Volume of NaOH used (ml)N = Normality of NaOH M = Molecular weight of fatty
acidw = weight of sample (g)
Results and DiscussionFuel characteristics of all the
three oils and their bio-diesels (both washed and unwashed) were deter-mined and are presented in Table 1 and in Figs. 1 to 7.
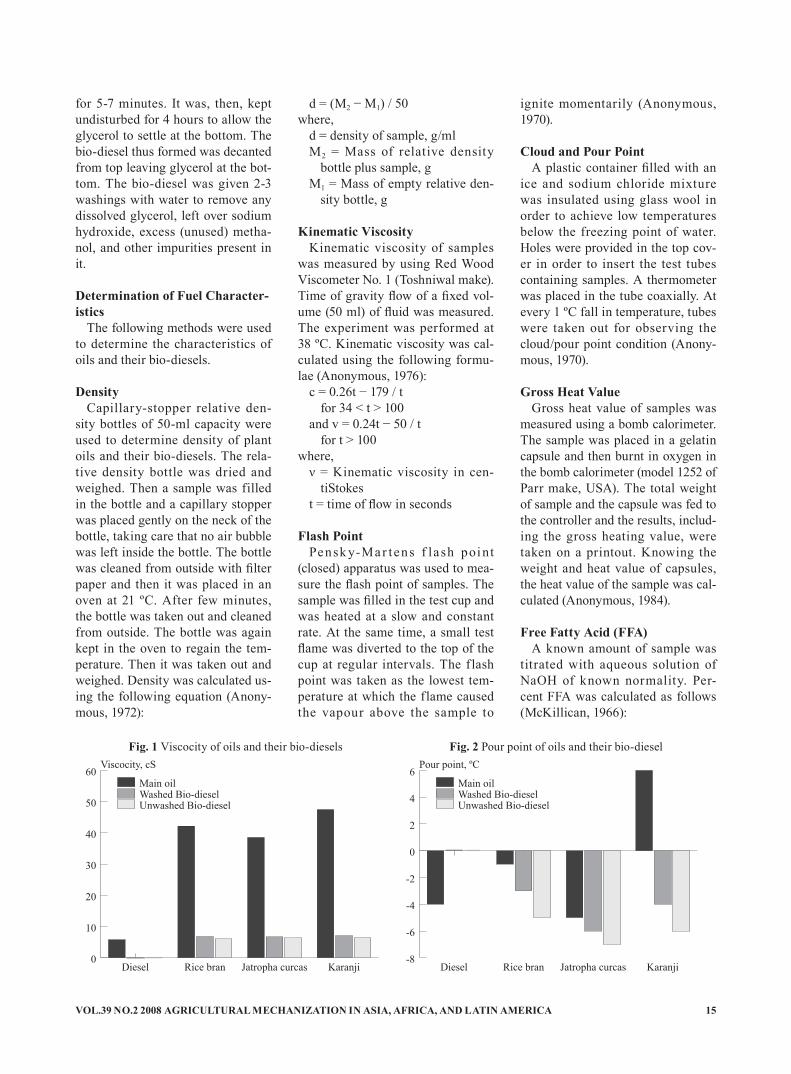
ViscosityFig. 1 shows that the viscosity of
plant oils was quite high. It was in the range of 38.6-47.5 cS and was 6.5-7.5 times than that of the diesel (5.8 cS). Karanji oil had maximum viscosity followed by rice bran oil and jatropha curcas oil. Pischinger
et al. (1982) reported high viscos-ity values of oils in the range of 30.3-41.2 cS. Esterification of these oils reduced the viscosity to a great extent. Viscosity of washed and the unwashed bio-diesels was reduced to almost 1/7th to 1/5th of that of their respective oils. As such, viscosity of the bio-diesels was quite compa-rable to that of diesel. It was 6.1 to 7.1 cS, i.e. only 1.1 to 1.2 times that of diesel. Verma et al. (1998) have reported viscosity of various bio-diesels to be in the range of 8.16 to 9.75 cS at 38 ºC. This clearly showed that most of the problems faced with plant oils as fuel for diesel engines (because of high viscosity of the oils) will be taken care of by the use of bio-diesels.
Pour Point Pour points of oils, their bio-
diesels, and the diesel fuel are given in Fig. 2. It is clear from the figure
that the pour point of karanji oil was very high (6.0 ºC) followed by rice bran oil (-1.0 ºC) and jatropha curcas oil (-5.0 ºC). The pour point for each bio-diesel was lower than that of its parent oil. Also each unwashed bio-diesel was found to have lower pour point than that of its respective washed bio-diesel. Pour points ob-tained were -3.0 ºC and -5.0 ºC for washed and unwashed rice bran bio-diesels respectively, -6.0 ºC and -7.0 ºC for washed and unwashed jatro-pha curcas bio-diesels respectively, and -4.0 ºC and -6.0 ºC for washed and unwashed karanji bio-diesels, respectively. These values differed little from that of diesel (-4.0 ºC). Therefore, like diesel, these bio-diesels will also not create a prob-lem in engine operation at very low temperature.
Flash PointIn case of unwashed bio-diesels,
Pour point, ºC
0
50
100
150
200
250
300
350
Conservation tillage
Conventional tillage
No-tillKaranjiJatropha curcasRice branDiesel
Main oilWashed Bio-dieselUnwashed Bio-diesel
Heat value, MJ/kg
0
10
20
30
40
50
Conservation tillage
Conventional tillage
No-tillKaranjiJatropha curcasRice branDiesel
Main oilWashed Bio-dieselUnwashed Bio-diesel
Fig. 3 Flash point of oils and their bio-diesels Fig. 4 Heat value of oils and their bio-diesels
Oils/bio-diesels Density at 21 ºC, g/ml
Viscocity at 38 ºC, cS
Cloud point, ºC
Pour point, ºC
Flash point, ºC
Gross heat value, MJ/kg
Free fatty acid, %
Rice bran oil 0.923 42.2 11 -1 258 42.3 0.15Rice bran bio-diesel (washed) 0.861 6.8 9 -3 164 42.6 0.08Rice bran bio-diesel (unwashed) 0.854 6.1 4 -5 40, 152 41.2 0.00Jatropha c. oil 0.902 38.6 16 -5 245 36.4 1.87Jatropha c. oil (washed) 0.867 6.7 13 -6 175 34.5 0.16Jatropha c. oil (unwashed) 0.848 6.4 11 -7 35, 144 34.8 0.08Karanji oil 0.911 47.5 15 6 226 33.7 1.50Karanji oil (washed) 0.864 7.1 12 -4 162 33.9 0.30Karanji oil (unwashed) 0.872 6.5 10 -6 35, 146 34.2 0.30Diesel 0.849 5.8 9 -4 74 47.4 0.00
Table 1 Fuel characteristics of plant oils and their bio-diesels
VOL.39 NO.2 2008 AGRICULTURAL MECHANIZATION IN ASIA, AFRICA, AND LATIN AMERICA 17
two f lash points were observed (Table 1). The lower one was ob-served at about 35 ºC and may be because of the presence of methanol in the unwashed bio-diesels. How-ever, only the higher f lash point has been given in Fig. 3. It is obvi-ous from the figure that the f lash point of each bio-diesels was lower than that of its respective oil. But the bio-diesels had much higher flash point (144-175 ºC) than that of diesel (74 ºC) thus ensuring more safety during their transportation and handling. High flash points of bio-diesels were also reported by Pischinger et al. (1982) in the range of 127-183 ºC. Flash point of each unwashed bio-diesel was somewhat lower than its respective washed bio-diesel. The higher flash point of bio-diesel than diesel was attributed to their longer carbon chain (Tahir et al., 1982).
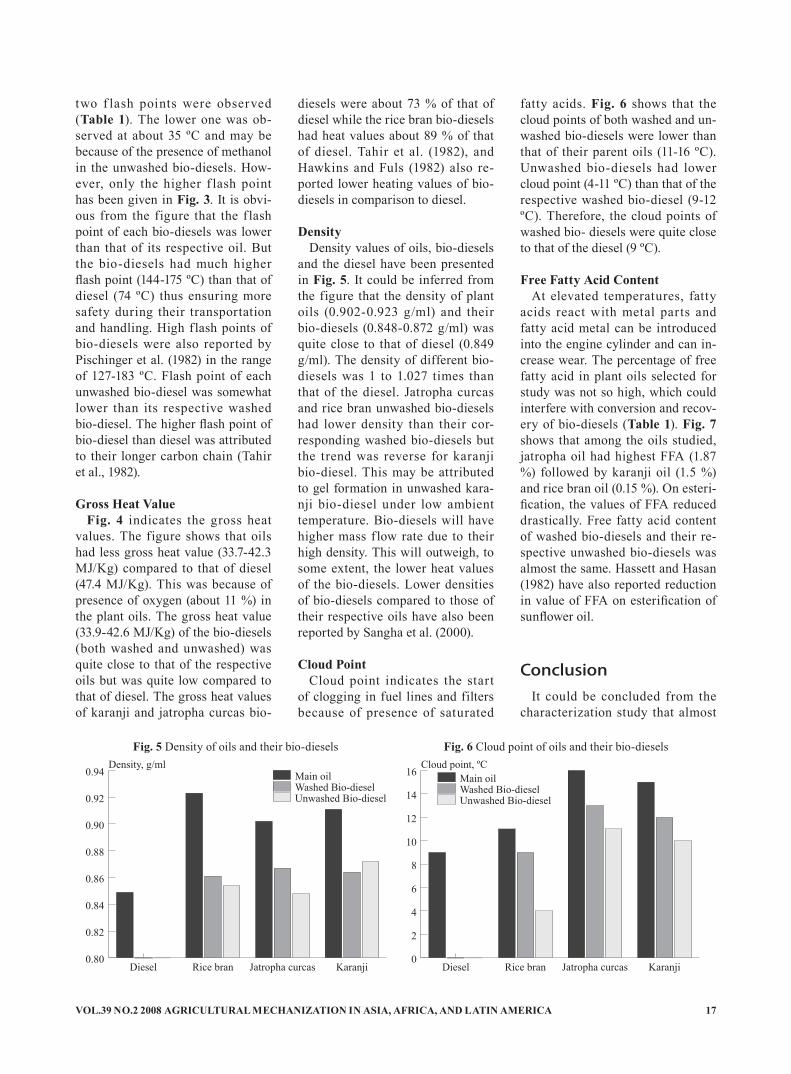
Gross Heat ValueFig. 4 indicates the gross heat
values. The figure shows that oils had less gross heat value (33.7-42.3 MJ/Kg) compared to that of diesel (47.4 MJ/Kg). This was because of presence of oxygen (about 11 %) in the plant oils. The gross heat value (33.9-42.6 MJ/Kg) of the bio-diesels (both washed and unwashed) was quite close to that of the respective oils but was quite low compared to that of diesel. The gross heat values of karanji and jatropha curcas bio-
diesels were about 73 % of that of diesel while the rice bran bio-diesels had heat values about 89 % of that of diesel. Tahir et al. (1982), and Hawkins and Fuls (1982) also re-ported lower heating values of bio-diesels in comparison to diesel.
DensityDensity values of oils, bio-diesels
and the diesel have been presented in Fig. 5. It could be inferred from the figure that the density of plant oils (0.902-0.923 g/ml) and their bio-diesels (0.848-0.872 g/ml) was quite close to that of diesel (0.849 g/ml). The density of different bio-diesels was 1 to 1.027 times than that of the diesel. Jatropha curcas and rice bran unwashed bio-diesels had lower density than their cor-responding washed bio-diesels but the trend was reverse for karanji bio-diesel. This may be attributed to gel formation in unwashed kara-nji bio-diesel under low ambient temperature. Bio-diesels will have higher mass f low rate due to their high density. This will outweigh, to some extent, the lower heat values of the bio-diesels. Lower densities of bio-diesels compared to those of their respective oils have also been reported by Sangha et al. (2000).
Cloud PointCloud point indicates the start
of clogging in fuel lines and filters because of presence of saturated
fatty acids. Fig. 6 shows that the cloud points of both washed and un-washed bio-diesels were lower than that of their parent oils (11-16 ºC). Unwashed bio-diesels had lower cloud point (4-11 ºC) than that of the respective washed bio-diesel (9-12 ºC). Therefore, the cloud points of washed bio- diesels were quite close to that of the diesel (9 ºC).
Free Fatty Acid ContentAt elevated temperatures, fatty
acids react with metal parts and fatty acid metal can be introduced into the engine cylinder and can in-crease wear. The percentage of free fatty acid in plant oils selected for study was not so high, which could interfere with conversion and recov-ery of bio-diesels (Table 1). Fig. 7 shows that among the oils studied, jatropha oil had highest FFA (1.87 %) followed by karanji oil (1.5 %) and rice bran oil (0.15 %). On esteri-fication, the values of FFA reduced drastically. Free fatty acid content of washed bio-diesels and their re-spective unwashed bio-diesels was almost the same. Hassett and Hasan (1982) have also reported reduction in value of FFA on esterification of sunflower oil.
ConclusionIt could be concluded from the
characterization study that almost
Density, g/ml
0.80
0.82
0.84
0.86
0.88
0.90
0.92
0.94
Conservation tillage
Conventional tillage
No-tillKaranjiJatropha curcasRice branDiesel
Main oilWashed Bio-dieselUnwashed Bio-diesel
Cloud point, ºC
0
2
4
6
8
10
12
14
16
Conservation tillage
Conventional tillage
No-tillKaranjiJatropha curcasRice branDiesel
Main oilWashed Bio-dieselUnwashed Bio-diesel
Fig. 5 Density of oils and their bio-diesels Fig. 6 Cloud point of oils and their bio-diesels

AGRICULTURAL MECHANIZATION IN ASIA, AFRICA, AND LATIN AMERICA 2008 VOL.39 NO.218
Free fatty acid, %
0.0
0.5
1.0
1.5
2.0
Conservation tillage
Conventional tillage
No-tillKaranjiJatropha curcasRice branDiesel
Main oilWashed Bio-dieselUnwashed Bio-diesel
Fig. 7 Free fatty acid of oils and their bio-diesels
all the characteristics of bio-diesels, prepared from different oils, are similar to those of diesel. Therefore, it can be used as an alternate fuel in diesel engines without making modifications in the existing diesel engines.
REFERENCES
Anonymous. 1970. Indian Standard Methods of Test for Petroleum and its products: Cloud and Pour Point. IS 1448 (P: 10), Bureau of Indian Standards, New Delhi.
Anonymous. 1970. Indian Standard Methods of Test for Petroleum and its products: Flash Point by Pensky-Martens Apparatus (First Revision) IS: 1448 (P: 21), Indian Standards Institution, New Delhi.
Anonymous. 1972. Indian Standard Methods of Test for Petroleum and its products: Density and Relative Density (First Revision) IS: 1448 (P: 32), Indian Standards Institu-tion, New Delhi.
Anonymous. 1976. Indian Standard Methods of Test for Petroleum and its products: Determination of Kinematic and Dynamic Viscos-ity. IS: 1448 (P: 25), Bureau of Indian Standards, New Delhi.
Anonymous. 1984. Indian Standard Methods of Test for Petroleum and its products: Calorific Value by bomb calorimeter methods IS: 1448 (P: 6), Indian Standards In-
stitution, New Delhi.Gupta, P. K. 1994. Investigations
on methyl esters of plant oils as alternate renewable fuel for com-pression ignition engines. Ph.D. thesis. Dept. of Farm Power and Machinery, PAU, Ludhiana, India.
Hasset, D. J. and R. A. Hasan. 1982. Sunf lower oil methyl ester as a diesel fuel. Proc. International Conference on Plant and Vegeta-ble Oils as fuels. ASAE Publica-tion 4-82: 123-126.
Hawkins, C. S. and J. Fuls. 1982. Comparative combustion studies on various plant oil esters and the long term effects of an ethyl ester on compression-ignition engine. Proc. International Conference on plant and vegetable oils as fuels. ASAE Publication 4-82: 184-187.
Mc Killican, M. E. 1966. Lipid changes in oil bearing plants. Journal of American Oil Chemists Society 43:461.
Pischinger, G. H., A. M. Falcon, R. W. Siakmann, and F. R. Fer-nandes. 1982. Methyl esters of plant oils as diesel fuels, either straight or in blends. Proc. Inter-national Conference on plant and vegetable oils as fuels. ASAE Publication 4-82: 198-208.
Ryan, T. W., L. G. Dodge, and T. J. Callahan. 1984. The effects of vegetable oil properties on injec-tion and combustion in two dif-ferent diesel engines. Journal of American Oil Chemists Society
61(10): 1610-1619.Sangha, M. K., P. .K. Gupta, S. R.
Verma, V. K. Thapar, A. S. Bal, and A. Dixit. 2000. Characteris-tics of selected plant oils and their methyl esters. AMA. 31(1): 50-53.
Tahir, A. R., H. M. Lapp, and L. C. Buchanan. 1982. Sunflower oil as a fuel for compression ignition en-gines. Proc. International Confer-ence on plant and vegetables oils as fuels. ASAE Publication 4-82: 82-91.
Verma, S. R., P. K. Gupta, V. K. Thapar, and A. S. Bal. 1998. Studies on bulk production and use of selected plant oil esters as alternate renewable fuel for diesel engines. Final report of ICAR Ad-hoc scheme. Dept. of Farm Power and Machinery, PAU, Ludhiana.
■■

VOL.39 NO.2 2008 AGRICULTURAL MECHANIZATION IN ASIA, AFRICA, AND LATIN AMERICA 19
Efficient Utilization of Conventional Fuel Through the Improvement of Traditional Stove
AbstractThe fuel efficiency of a traditional
stove is very low. Therefore, an im-proved version of was developed by incorporating a perforated screen in the stove cavity, an ash port by the side of the stove and reducing pot rest height from 8 to 2 cm of the ground traditional stove. In the im-proved stove, the fuel efficiency was increased by 40 % compared to the traditional ground stove. The cost of the stove was very low, which included only the cost of an earthen screen and labour. The BRRI cost of the developed earthen screen was 75 % less than the similar sized metal screen.
IntroductionEvery year in Bangladesh more
than 38 million tones of traditional fuel such as wood, straw, leaves and dried cow dung are being used for cooking and other purposes (BC-SIR, 1990). Use of these traditional fuels is increasing day by day with
the population growth. A country should have 25 % of its area covered with forest for sound environment but Bangladesh has only 9 % (BBS, 2002). For this reason, Bangladesh is loosing its natural balance. De-sertification started at its northern part and salinity is threatening to its south. The incidences of drought, excessive rainfall and f lood are regular occurrences in Bangladesh.
Once, it was our practice that farmers left straw in the field as an organic fertilizer at the time of har-vest. Cow dung usually was applied to the field but now these valuable fertilizers are being burnt to meet the scarcity of fuel. As a result, fertility of our agricultural fields is declining. We must be very careful in the efficient use of fuel, otherwise we must accept further declining of the forest area, deterioration of the natural environmental harmony and decreased agricultural production.
The local term in Bangladesh for the widely used cooking device is Chula that is nothing but a stove. Most of the traditional stoves are installed in a corner of the kitchen
or sometimes in one corner of the home yard in open sky. The farm families adopt the latter option usu-ally in the dry season. The tradi-tional stove is a very inefficient de-vice for use of our valuable fuel. It was reported that these stoves could utilize only 5-15 percent of the total heat energy during burning of the fuel depending on the depth of the stove and size of the flue gas exists (Hasan et al.). The remaining 85-95 percent of the heat energy is lost to the environment. Furthermore, poisonous hot gases emitted by these stoves create health hazards and pollute the environment. Efforts are being made for the develop-ment, promotion and trade of a fuel-efficient stove. There was a feature on the preparation and trade of an earthen stove in The Daily Ittefaq. The report said that Maleka Begum, a woman of the Patuakhali district has taken stove making and selling as a profession. The cost of each stove was Tk 25-35 and she earns Tk 700-800 per month from this trade (Begum, 2005).
The Bangladesh Counci l for
bySyedul IslamPrincipal Scientific OfficerBangladesh Rice Research Institute,Gazipur - 1701BANGLADESH
Mohammad NasimSenior Scientific OfficerBangladesh Rice Research Institute,Gazipur - 1701BANGLADESH
Abul QuasemSenior Scientific OfficerBangladesh Rice Research Institute,Gazipur - 1701BANGLADESH
Abdul BaquiDirector (Administration)Bangladesh Rice Research Institute,Gazipur - 1701BANGLADESH
Abdur RahmanSenior Scientific OfficerBangladesh Rice Research Institute,Gazipur - 1701BANGLADESH
Farah Naz KhanStudentBangabandhu Sheikh Mujibur Rahman Agricultural University, Salna, Gazipur - 1703BANGLADESH

AGRICULTURAL MECHANIZATION IN ASIA, AFRICA, AND LATIN AMERICA 2008 VOL.39 NO.220
Science and Industrial Research (BCSIR) has developed some ver-sions of a portable type stove, which consumes 40-50 % less fuel than the traditional stove. The adoption rate of these stoves among the end users is very slow, because one must stop using their existing ground stove and then build a new stove.
Therefore, research was under-taken to modify/improve the exist-ing ground stove for increased fuel efficiency.
Materials and MethodsA t rad it ional version of the
ground stove was constructed in the in the laboratory of Farm Machin-ery and Post Harvest Technology Division, BRRI (Plate 1). It was made in the corner of a kitchen and was more than 0.5 m deep. The height of the pot rest ranged from 6-8 cm. As a result there was a very wide gap between the stove body and cooking pot. The improved ver-sion of ground stove was construct-ed adjacent to the traditional stove (Plate 2). The improved stove was
made with the following modifica-tions: (a) the height of the pot rest was reduced from 8 cm to 2 cm; (b) a screen was incorporated at a depth of about 25 cm from the top to hold the fuel during burning; and (c) an opening was provided by the side of the stove to supply oxygen from the bottom of the fuel and to remove ash.
Major Parts of Improved StoveThe improved stove was com-
prised of the following parts pre-sented in Fig. 1.
1. Pot rest2. Fuel mouth3. Ash port4. Screen support5. Fuel screen6. Ash remover1. Pot rest: The pot rest is a raised
lump of clay which is used to hold the cooking pot on the stove. Usually they are three in number equally spaced on
Ground traditional stove Ground improved stoveHeight of pot test more (6-8 cm) Height of pot test more (1.5-2.0 cm)More heat loss through radiation Less heat loss through radiationDepth of stove more (45-60 cm) Depth of stove more (35-40 cm)Fuel burns at the bottom of the stove Fuel burns on screenWide gap between heat source and sink Gap between heat source and sink is lessInsufficient supply of oxygen to the fuel Sufficient supply of oxygen to the fuel
Table 1 Features of traditional and improved ground stovePlate 2 Ground improved stove
Plate 1 Ground traditional stove
Fig. 1 Schematic diagram of improved stove

VOL.39 NO.2 2008 AGRICULTURAL MECHANIZATION IN ASIA, AFRICA, AND LATIN AMERICA 21
the circumference of the stove hole. In the traditional stove the height of stove ranges from 7-10 cm through which most of the heat energy emitted from the fuel is radiated to the atmo-sphere rather being consumed by the cooking pot.
2. Fuel mouth: The fuel mouth is the opening through which traditional fuel is fed into the stove. In the traditional stove it is round and approximately 120-130 cm in diameter. In the improved stove it is oval with a long axis of 125 cm and a short axis of 110 cm.
3. Ash port: In the improved stove an opening was made at an an-gle of 90º from the fuel mouth and 15 cm away from the stove
body. This port is nothing but an oblique hole extended from the earth surface to the bottom of the stove. It has a dual func-tion i.e. to remove ash from the bottom of the stove and to sup-ply air to the fuel from the bot-tom of the screen.
4. Screen support: These are met-al rods placed on the inner sur-face of the stove to hold the fuel screen. These supports may be made of broken parts of earthen pots in order to reduce cost as well as to make good use of old and broken pots.
5. Fuel screen: This a screen on which the fuel burns. It is a round earthen plate of 19 cm diameter and 1.5 cm thickness. These dimensions should ex-
ist after drying and burning. It has a total of 16 openings in two rows. The rows are 3.5 cm apart. The length of the opening varies from 5.2-2.0 cm. It has three functions: to hold the fuel for burning near to the pot; to release white ash from the bot-tom of the stove; and allow air from the bottom for effective burning of fuel.
6. Ash remover: This is a 10 cm diameter metal cup made of 1.5 mm thick M S sheet. The cup is welded to a metal rod of 1 cm diameter and 58.5 cm long. The other end of the rod is pushed into a 10.5 cm long tapered wooden handle whose one end has a diameter of 2.2 cm, how-ever, the other end is 2 cm di-ameter. This is used to remove ash from the stove.
Construction of Improved Ground Stove
The following steps were followed to construct the stove as per design mentioned in Fig. 1:
1. A hole of 20 cm diameter and 37 cm depth was made in the ground.
2. The screen suppor ts were placed at about 10 cm up from the bottom of the stove.
3. A fuel mouth was made 125 cm long and 110 cm wide.
Fig. 3 Ash remover of improved stove
Fig. 2 Screen of improved stove
AGRICULTURAL MECHANIZATION IN ASIA, AFRICA, AND LATIN AMERICA 2008 VOL.39 NO.222
Ground traditional stove (GTS) Ground improved stove (GIS) Fuel saving overtraditional stove,
%Time, min
Temp., ºC
Fuel, gm
Time, min
Temp., ºC
Fuel, gm
0 29 05 37 5 2910 52 10 4015 70 15 5220 93 20 7025 98 25 9828 100 849.20 26 100 554.80 34.74
Table 2 Comparative fuel consumption in traditional and improved ground stove
4. An ash/air supplying port was made at an angle of 90º from the fuel mouth and 15 cm away from the stove body. This port was only an oblique hole that extended from the earth surface to the bottom of the stove.
5. An earthen band of clay 5 cm wide and 9 cm high was put on the circumference of the stove.
6. The wet earthen band was dried in the sun for 3-5 days. The du-ration of drying will be varied in different seasons. The band should be smeared by water-mixed clay as and when neces-sary to prevent it from cracking.
7. At the proper degree of drying the pot rest should be made by cutting the earthen band with a sickle. Three pot rests, each 1.5- 2.0 cm high, were made at equal intervals from each other.
8. When the stove was well dried the earthen screen was placed on the screen support and the stove was ready for use.
Test of Traditional and Improved Stove
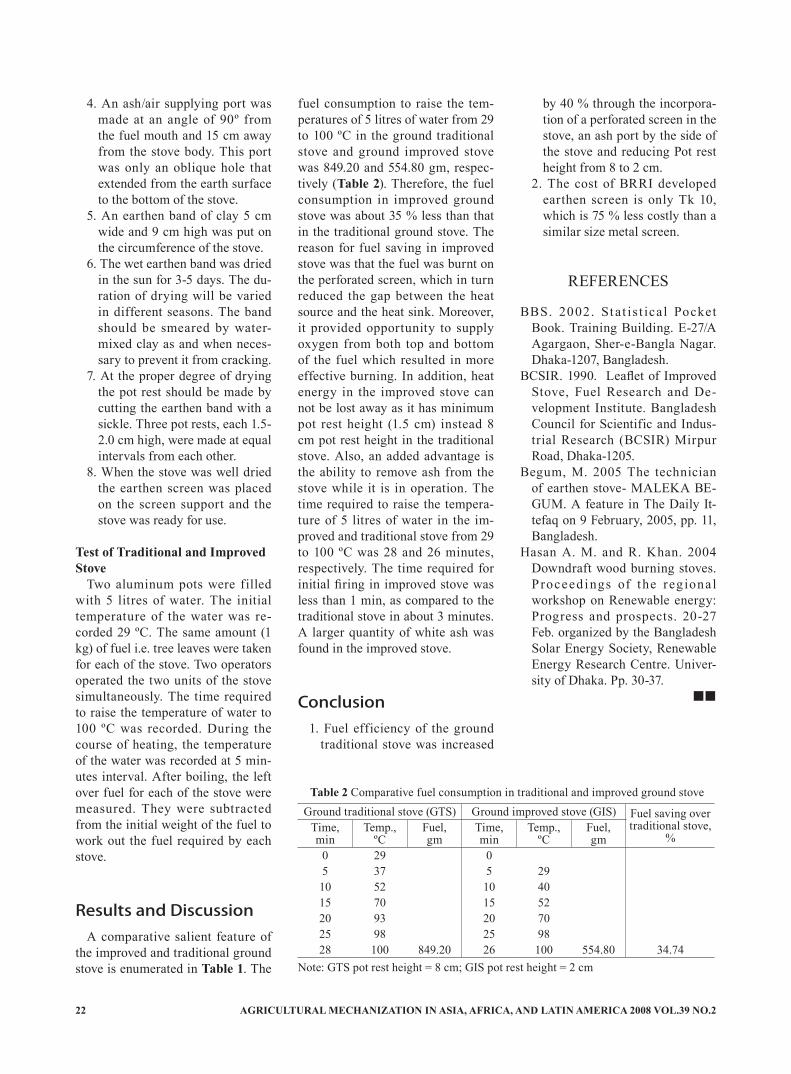
Two aluminum pots were filled with 5 litres of water. The initial temperature of the water was re-corded 29 ºC. The same amount (1 kg) of fuel i.e. tree leaves were taken for each of the stove. Two operators operated the two units of the stove simultaneously. The time required to raise the temperature of water to 100 ºC was recorded. During the course of heating, the temperature of the water was recorded at 5 min-utes interval. After boiling, the left over fuel for each of the stove were measured. They were subtracted from the initial weight of the fuel to work out the fuel required by each stove.
Results and DiscussionA comparative salient feature of
the improved and traditional ground stove is enumerated in Table 1. The
fuel consumption to raise the tem-peratures of 5 litres of water from 29 to 100 ºC in the ground traditional stove and ground improved stove was 849.20 and 554.80 gm, respec-tively (Table 2). Therefore, the fuel consumption in improved ground stove was about 35 % less than that in the traditional ground stove. The reason for fuel saving in improved stove was that the fuel was burnt on the perforated screen, which in turn reduced the gap between the heat source and the heat sink. Moreover, it provided opportunity to supply oxygen from both top and bottom of the fuel which resulted in more effective burning. In addition, heat energy in the improved stove can not be lost away as it has minimum pot rest height (1.5 cm) instead 8 cm pot rest height in the traditional stove. Also, an added advantage is the ability to remove ash from the stove while it is in operation. The time required to raise the tempera-ture of 5 litres of water in the im-proved and traditional stove from 29 to 100 ºC was 28 and 26 minutes, respectively. The time required for initial firing in improved stove was less than 1 min, as compared to the traditional stove in about 3 minutes. A larger quantity of white ash was found in the improved stove.
Conclusion1. Fuel efficiency of the ground
traditional stove was increased
by 40 % through the incorpora-tion of a perforated screen in the stove, an ash port by the side of the stove and reducing Pot rest height from 8 to 2 cm.
2. The cost of BRRI developed earthen screen is only Tk 10, which is 75 % less costly than a similar size metal screen.
REFERENCES
BBS. 2002. Stat is t ical Pocket Book. Training Building. E-27/A Agargaon, Sher-e-Bangla Nagar. Dhaka-1207, Bangladesh.
BCSIR. 1990. Leaflet of Improved Stove, Fuel Research and De-velopment Institute. Bangladesh Council for Scientific and Indus-trial Research (BCSIR) Mirpur Road, Dhaka-1205.
Begum, M. 2005 The technician of earthen stove- MALEKA BE-GUM. A feature in The Daily It-tefaq on 9 February, 2005, pp. 11, Bangladesh.
Hasan A. M. and R. Khan. 2004 Downdraft wood burning stoves. Proceed ings of the reg ional workshop on Renewable energy: Progress and prospects. 20-27 Feb. organized by the Bangladesh Solar Energy Society, Renewable Energy Research Centre. Univer-sity of Dhaka. Pp. 30-37.
■■
Note: GTS pot rest height = 8 cm; GIS pot rest height = 2 cm

VOL.39 NO.2 2008 AGRICULTURAL MECHANIZATION IN ASIA, AFRICA, AND LATIN AMERICA 23
Development and Evaluation of Anaerobic TypeSprouted Rice Drum Seeder and to Ascertain thePhysiological Load on the Operator
byR. S. DevnaniEx-Emeritus Scientist and Ex. DirectorCentral Institute of Agricultural Engineering,Nabi Bagh, Berasia Road, Bhopal - 462 038INDIA
AbstractA number of pre-germinated rice
seeders have been developed and recommended as an alternative tech-nology to the rice farmers who are practicing manual transplanting of rice seedlings. The studies conduct-ed on drum seeders have proven that there is no difference in the yield levels as compared to transplanted rice. The wet seeding technology re-duced the labor, water and the crop maturity period. The cost of drum seeders reported in India were in the range of Rs.2500-3000 during 2001.The physiological load on the opera-tor for wet seeding operation with eight, six and four row drum seed-ers was reported as extremely heavy field work. These units required two workers to operate in fields. Therefore, the project to refine the design of pregerminated rice seeder of anaerobic type by making it light weight and easy to manouevre in small plots was taken. Based on the-oretical analysis of two row drum seeders with 20 cm row spacing, the drum seeder was designed for seed-ing rates varying from 60-200 kg/ha. The cost of drum seeder was es-timated as Rs.750/-. The developed
seeder was evaluated for field per-formance on four varieties namely IR-36, Vandna, Krishna Hamsa and Kalinga-III. The seeding rates var-ied from 125-215 kg/ha and the high plant stand was achieved. The crop yield levels reported were for IR-36 4.07 tons/ha, Vandana 2.82 tons/ha, Krishna Hamsa 3.73 tons/ha and Kalinga-III 4.06 tons/ha. The oper-ating load on the worker was mea-sured in terms of increase in heart beat rate. The operator was allowed to work at different speeds and his heart beat rate was monitored. The operator covered the maximum area of 352 sqm/h by seeder but at the end of 30 minutes of operation his heart beat rate reached to 155-165 beats/min. The allowable heart beat rate increase of 40 beats/min was achieved with a field coverage of 198.9 sqm/hour. Thus, the devel-oped two-row drum seeder was eas-ily operated for anaerobic sowing of small plots at a field capacity of 199 sqm/h in backward walking mode of operation.
IntroductionThe manual method of transplant-
ing rice seedlings is very labor intensive and even the small rice farmers require hired farm labor during transplanting season. Re-cent studies using manually oper-ated drum seeders at the various locations in India have shown the viability of the wet seeding technol-ogy, under the Crop and Resources Management Net work Project financed by International Rice Re-search Institute, Phillippines. The wet seeding of pregerminated seeds helped the farmers to reduce the peak labor requirements as well as the crop growth period by at
Acknowledgement: I sincerely express my thanks to the ICAR authorities for sanctioning of the above project and providing funds for conduct of this study. I express my sincere thanks to the Director, CIAE-Bhopal for providing facili-ties at Institute in conduct of field experiments and fabrication of drum seeder. Thanks are due to Prof. N.Sawamura of Japan for sending the project report on Development of Mechanical Paddy Seeder which helped in preparation of the project, and clarified the problem of wet seeding of rice.

AGRICULTURAL MECHANIZATION IN ASIA, AFRICA, AND LATIN AMERICA 2008 VOL.39 NO.224
least 10 days due to early maturity. Thus, wet seeding helped in reduc-ing the total water requirements. Therefore, technique of wet seed-ing of pregerminated rice seeds is now recommended to the farmers. A number of designs of drum seed-ers such as eight, six and four row type have been developed, evalu-ated and recommended to the rice farmers. However, it is reported that two to three workers are required to operate these units in the field. Therefore, a project on refinement of design of a manual pull type seeder of small size, low cost and easy to operate and maneuver by a single operator was initiated to meet the needs of small rice farmers of eastern region of India. Thus, the adoption of wet seeding technology can help in mitigating the problems of small farmers in production of rice crop.
Review of LiteratureIn developed countries, the rice
crop is established by wet seeding method. It is followed by use of se-lective herbicide for weed control and effective water management. The rice varieties grown are devel-oped for local conditions and are of dwarf type. The wet seeding results in uniform crop establishment, saving in cost of production, labor and helps in increasing cropping intensity. In the developed coun-tries, heavy machines are used for seed bed preparation and leveling of fields. Even the pregerminated seeds are broadcasted by aeroplanes. However, in many Asian countries, the wet seeding of aerobic type is practiced using small equipment and drum seeders. Thus, wet seed-ing technology can be made useful for the small rice farmers in India, where rice crop is raised along with efficient control on weeds, use of fertilizer and management of water.
The wet seeding of rice crop is done in three ways (i) aerobic (ii)
anaerobic and (iii) water seeding. When seeds are sown on the sur-face of wet soils but the seeds are exposed to air, it is called aerobic seeding. In anaerobic seeding the seeds are placed in a small narrow rut (furrow) and are covered with moist soil. In water seeding the seeds are dropped on the seed bed which is covered with 1 to 2 cm depth of water. The seed rates are in the range of 60 to 100 kg/ha and in some cases the farmers even go for 150 kg/ha to guard against poor
germination or other biotic fac-tors. Among the wet seeding, the anaerobic wet seeding has resulted in better establishment of crop. The seeds used here refer to the sprouted seeds. The sprouted seeds are pro-duced by soaking the clean sound seeds of paddy in water for 24 hours, followed by incubating them for 16 to 20 hours to have sprouts length of 1 mm size. The sprouted seeds are normally prepared for wet sowing on the same day in the field. The light immature seeds are
Name Two row manual pull type sprouted seed drum seeder for anaerobic wet seeding
Function For anaerobic sowing of sprouted seeds in wet puddles seed bed along rows
Make CIAE, BhopalModel ExperimentalCost Rs.750/-Weight, kg 11.0Dimension
Length, mm 1,780Width, mm 480Height, mm 840 in working position, 1,530 when handle is up right
positionSeed drum
Length, mm 250Diameter, mm 205Material AluminumNo. of rows of slots TwoRow distance 20 cm nominalSpeed capacity 2 kg of sprouted seeds
Handle T-shaped of M.S. conduit pipeLength, mm 1,500Width, mm 480
Gound wheel Rigid steel wheelsNo. of wheels TwoNominal diameter, mm 500No. of spokes 8Lugs 16Material Mild steel rod and flat
No. of furrow openers TwoType Inverted shoe typeLength of opener, mm 40Location Based angle of the frame in the front
Flame 30 × 30 × 3 mm angle ironNo. of skids 3Size of skids 50 mm wide at two ends 100 mm wide in the centre with
50 mm gap in between filled to seed drum frameMaterial Hard plastic, 6 mm thickNo. of openers required OneTheoretical field capacity 500 sqm/h
Table 1 Specifications of the manual pull two row drum seeder for anaerobic seeding

VOL.39 NO.2 2008 AGRICULTURAL MECHANIZATION IN ASIA, AFRICA, AND LATIN AMERICA 25
removed from the seed lot by first soaking the seed lot in salt solution, thus only the bold heavy seeds are taken for soaking and incubation to ensure proper germination.
Requirements of Wet SeedbedThe rice fields should be properly
puddled and leveled. This is essen-tial to reduce the water infiltration rate in soil, control the weed growth and manage the thin layer of water for anaerobic seeding. The puddling depth of 15-20 cm is recommended for effective control on weed growth and for reduction of water infiltra-tion. The top layer of soil should be well dispersed in water. This en-sures that soil does not stick to the wheels and skids of seeder or op-erators feet and helps in achieving good contact between the sprouted seeds and the surrounding soil. The puddled soil is allowed a settlement period of 12 to 16 hours so that after the draining of excess water, the operation of the seeder would not cause the soil overflow at the end of seeder skids, which in some condi-tion can cause soil overburden on the sprouted seeds sown in the rut. The field should be free of excess water at the ends so that turning of seeder is easy. The mobility of op-erator depends upon the uniformity of the puddling operation and the soil bearing capacity of the soil be-low the feet of operator. The settle-ment period of 12 hours is mostly required for the soil to decrease the sinkage of the operator. Sinkage of the operator should be limited to 10-12 cm (i.e. ankle deep) for the
drum seeder. This requires a soil bearing capacity of 0.1 Mpa at 10-12 cm depth. The efficient management of water in the rice field means that the field be irrigated and drained of excess water as required, for per-forming the seeding operation. In case of sandy soils, the mobility of operator is not a problem and settle-ment period is less as sand particles settle in a short period.
Manually Operated Seeders Eval-uated
The drum seeder developed at In-ternational Rice Research Institute, Phillippines was eight row type. Seeders were used to spread the seeds along the rows over the well puddled and leveled fields (aerobic type). These seeders were used for sowing of dry and sprouted seeds. Pradhan (1968) reported the devel-opment of a paddy planter at Central Rice Research institute, Cuttack. The studies were conducted to es-tablish the crop with the seeder to achieve the crop yield levels equal to manually transplanted rice. It was reported that the yield levels of transplanted rice were high. There-fore, wet seeding technology was not recommended. But, with the development of new rice varieties, availability of chemicals for better weed control, integrated nutrient management and the need for ef-ficient utilization of water, wet seed-ing technology once again attracted the attention of rice scientists in India. Under the Directorate of Rice Research, Hyderabad (ICAR) and Crop and Resources Management
Network (CREMNET Project of IRRI), the evaluation of an8-row drum seeder was taken up for its evaluation at all India level during 1996-97. The recommended tech-nique of preparation of seedbed and sowing of sprouted seeds with drum seeder were followed.
The field performance results of wet seeding experiments with the IRRI drum seeder at all the loca-tions in India reported yield lev-els of 7 to 8 tons/ha with the wet seeding technology. This helped in planning a large scale trial by Di rectorate of R ice Research, Hyderabad with the drum seeder for wet seeding on local farmers fields (1999-2000). These trials resulted in the development of an 8-row modified drum seeder (Fig. 2). Its design was released and produced by local industry in Hyderabad to meet the demands of the farmers. The drum seeder (Fig. 2) developed at Hyderabad was provided with wheels on both sides. It was able to sow seeds at the rate of 50-75 kg/ha. The sprouted seeds were prepared by soaking the seeds for 24 hours in water followed by incubation of 24 hours before sowing with seeder (Krishnaiah, 1999).
The College of Agricultural Engi-neering of Tamil Nadu Agriculture University, Coimbatore reported the development of a successful eight row unit of light weight type fitted with a single wheel at the centre and two drums covering 8-rows with row spacing of 15 cm to suit the needs of local rice farmers. The cost of an 8-row seeder unit was
Fig. 1 IRRI eight row drum seeder Fig. 2 DDR Hyderabad drum seeder Fig. 3 TNAU eight row wet paddy seeder

AGRICULTURAL MECHANIZATION IN ASIA, AFRICA, AND LATIN AMERICA 2008 VOL.39 NO.226
reported as Rs.3000/- (Fig. 3). The performance of seeder was reported as 0.12 ha/h field capacity and oper-ating field efficiency of 65 %. Labor requirement for wet seeding was 15-20 man-h/ha. The cost of opera-tion was Rs.600-700 per hectare (US $1 = Rs 43.50).
The six row germinated r ice seeder was developed at CRRI-Cuttack. It was used for frontline demonstrations of equipment during 1999-2001. The performance of the seeder was reported to be satisfac-tory on the farmers fields. The crop yield levels of 3.5 tons/ha were re-ported and design was released for local production. (Fig. 4).
The development of the four row drum seeder for sprouted seeds was reported in the Annual Report of CIAE-Bhopal for 2000. The unit had a field capacity of 0.08 ha/h with pull requirements of 20 kgf (Fig. 5).
A team of Scientists under JICA Japan and Phillippines Rice Re-search Institute, Phillippines worked from 1994-98 on a project to devel-op a power tiller operated anaerobic type paddy seeder. (Sawamura, 1995). A 12-row unit was developed. It was able to sow the seeds at 40-120 kg/h with a field capacity of 3 to 5 hectares/day. The successful design of the seeder was developed and reported (Ryuji Otani, 1998).
Ergonomic StudiesThe pregerminated seeders devel-
oped are manual pull type, there-fore, attention was paid to the study of the physiological load on the op-erator. The earlier work conducted at CRRI-Cuttack by Nag and Dutt (1980) have reported that seeding with the four row type wet seeder, when operated at field capacity of 0.1 ha/h, resulted in the heart beat rate of 154 beats/min and oxygen uptake of 1.638 lit/min. It was re-ported as an extremely heavy type of job. The values of physiological responses of Indian farm workers for different agricultural operation,
including operations in a wet pud-dled field, were compiled by Gite (1997). It was noted that even walk-ing in a wet puddled field consumed about 70 % of workers’ energy. The maximum aerobic capacity of In-dian male agricultural worker was listed as 2.0 to 2.24 lit of oxygen per minute (Gite and Singh).
The physiological load on the operator while working with the manually pull type drum seeder was studied by Karthivel and Sivakumar (2002) for eight, six and four row type seeders with furrow openers and having one or two wheels. The energy expenditure for the opera-tion of these units varied from 24.8 kJ/min to 31.74 kg/min. It was re-ported as an extremely heavy task for the operator. The heart beat rate increased from a minimum of 128 to maximum of 150 beats per min-ute. It was recommended that two operators be employed the drum seeders for 15 minutes followed by a rest of 8 minutes. After working in paddy field, the operators reported body discomfort in shoulders legs
and knees. Small farmers in the traditional
rice region raise the rice crop by dry seeding or by broadcasting seed on a prepared field. Row sowing is practiced by country plough, sow-ing device or a seed drill. They do wet seeding: broadcasting of dry or sprouted seeds on wet field (beush-ening) or by dibbling of seeds on wet seed bed. The main problem of rice farmers is to establish the crop and manage the water. The suit-able design of a drum seeder can help farmers adopt the wet seeding technology to overcome shortage of labor during transplanting season. A need for refinement of seeder design for the small farmers was consid-ered to mitigate the problems and encourage spread of the wet seeding technique. The following objectives were established for this project.
1. To refine the design of the man-ual pull type pregerminated rice seeder for anaerobic wet seed-ing,
2. To evaluate its f ield perfor-mance and
Slot opening Weight of seeds collected in 20 revolution Total Average/
revolution Seed rate
5 10.78 13.15 23.93 2.393 38.596 19.71 21.29 41.00 4.100 66.127 31.64 30.83 62.47 6.270 101.138 36.36 38.69 75.05 7.550 121.789 52.89 49.20 102.09 10.209 164.6610 75.94 68.36 144.30 14.430 232.7411 95.08 93.78 188.96 18.886 304.6012 110.94 109.74 220.68 22.068 356.00
Table 2 Calibration of drum seeder with dry seeds of IR-36 variety.
No. of slots/row: 17, width of slot: 10 mm, Weight of seeds in drum: 2.0 kg 1000 seed weight = 18.4 gThe slot setting of 7 mm provided the desired seed rate of 100 kg/ha
Fig. 4 IRRI eight row drum seeder Fig. 5 CIAE four row pre-germinatedrice seeder

VOL.39 NO.2 2008 AGRICULTURAL MECHANIZATION IN ASIA, AFRICA, AND LATIN AMERICA 27
3. To determine work capacity within allowable physiological load on the operator.
Development of Drum Seeder
The review of literature indicated that eight, six and four row type drum seeders of aerobic and an-aerobic type have been developed and found useful for rice farmers. But working in wet fields with even a four row unit was reported as ex-tremely heavy work. For example, it required more than one operator to work it in the field while making the turn. Thus, the aim of this de-sign was to make a seeder of small size, light weight and easy to pull and turn in the field. It was to be an anaerobic type. The design was prepared and unit fabricated during 2002. Preliminary field trials and improvements were made during
2002-2003. A brief description of the developed unit is given below.
The unit consisted of (i) seed drum (ii) frame (iii) pulling handle (iv) furrow markers (v) wheel (vi) skids (vii) front end float and level-ing skid (Fig. 6).
An eight liter aluminum container was used as the seed drum. The open end of container was closed with the end cover fitted with nylon bushes to support the axle made of 19 mm di-ameter conduit pipe. The two 50 cm diameter wheels were fitted at the two sides of the seeder. The wheels were made from m.s. rod fitted with eight spokes and 16 lugs. The seeder drum was fitted on a 30 × 30 × 3 mm angle iron frame. The height of the frame was 8.0 cm. The furrow markers were of inverted shoe type 40 mm size and mounted at the base angle in the front of frame. At the front end, a leveling float and skid were provided. The hinged bracket for the handle was fixed at the end of the front f loat. The seed drum had three skids for the two rows. The width of the skids were 5, 10, 5 cm, respectively, with 5 cm gap in between so that the seeds drop in the small rut made by the furrow open-ers.
The row skids were made from a 21 × 40 cm plastic board. This hard plastic board was available in the market as a kitcken chopping board. The seeder was fitted with a 1.5 m
long handle hinged at the base of the front skid and given a T shape for pulling with the both hands of the operator (Fig. 6). The hinged handle helped to easy the pulling of the seeder up to the end of field close to the bund and helped in turning of the unit without lifting at the cor-ners.
The seed drum was provided with two rows of slots of 10 × 20 mm size. There were 17 slots for each row that were spaced 40 m apart along the circumference of drum. A square slot with cover was provided on the seed drum for filling and emptying of seeds. The slots were covered with a 20 mm wide m.s. strip for adjusting the seed rate. The sliding of this strip over the slots changed the length of slot opening. The slot opening regulated the seed rate and provided for seeds of dif-ferent length. The slot provided for seed rates from 40 kg/ha to 200 kg/ha. The two row developed drum seeder is shown in Fig. 6.
Calibration of Drum SeederThe seed rates recommended for
wet seeding of paddy were 60-90 kg/ha. The high seed rates recom-mended were 400 seeds/sqm for highest yields. The thumb rule for calculation of seed rate was 40 seeds/sqm equal to 10 kg/ha. The 60 kg/ha seed rate was close to 240 seeds/sqm. In order to overcome
Fig. 6 Two row drum type manuallyoperated seeder with pivoted handlefor close operation near bunds
Slot opening setting,
mm
Weight of seed collected in 20 revolution Total, g
Av. wt. of seeds per
revolution, g
Seed rate, kg/ha
Seeds dropped per sqm.,
noRow-I Row-II
8 15.94 18.04 83.98 3.487 56.2 2.0917.66 18.10 35.76
10 23.86 24.00 47.86 4.869 78.6 29325.50 26.02 49.52
12 33.16 40.54 73.70 7.169 115.5 4.3131.20 38.48 69.68
13 49.10 51.60 100.72 10.017 161.0 60046.14 63.48 99.62
Table 3 Calibration of drum seeder with pregerminatedseeds of IR-36 variety: June 2003
No. of slots/row: 17, width of slot: 10 mm, Weight of seeds in drum: 2.0 kg 1000 seed weight = 26.8 g10 mm slot opening gave the desired seed rate of 75 kg/ha

AGRICULTURAL MECHANIZATION IN ASIA, AFRICA, AND LATIN AMERICA 2008 VOL.39 NO.228
the various constraints the farmer broadcast seeds at the rate of 100 to 150 kg/ha. The aim of calibra-tion was to determine the slot size opening to achieve the desired seed rate. It was done for dry and with sprouted seeds.
Dry seeds of IR-36 variety were taken for calibration of seeder. The drum was set on blocks. The slot opening for each row was set from 5 mm to 12 mm. The amount of seed dropped from the slots was collect-ed in trays for 20 revolution of the ground wheel. The seed collected in the trays were weighed and the seed rate reported in Table 2. A seed rate of 100 kg was achieved with a slot opening of 7 mm. The variation in seed rate between two rows for low seed rate was high but decreeased as the seed rate increased to 100 kg and above.
Calibration for sprouted seeds was also conducted for IR-36 variety. The sprouted seeds were produced by soaking the seeds in plain water for 24 hours followed by 16-18 hours of incubation at room temperature (Fig. 7). Calibration was done with sprouted seeds with slot openings of 8, 10, 12 and 13 mm. The seed col-lected for each row were weighed and are reported in Table 3. The seed rates were calculated by taking the average values of seeds dropped per revolution of seed drum. The seed rate at 13 mm slot opening was 161 kg/ha. Hence, readings were recorded up to a slot opening of 13 mm.
In order to avoid seed damage, it was necessary to keep the slot open-ing equal to or more than the length of sprouted seeds. The walking speed for the manual pull type seed-er was very low but the seed flow was due to forces of gravity and the level of seeds in the drum. The best method of calibration would be to count the number of seeds dropped per unit revolution of drum or unit area covered. The dropping of 240 seeds/sqm or 48 seeds/metre row length would be equal to 60 kg/ha seed rate. The recommendation for seed rates were based on dry weight basis. The sprouted seed calcula-tion was made on dry weight basis. Therefore, when dropping seeds per unit area, farmers could easily count and set the drum properly. It was suggested that the seed rates for wet seeding be reported on wet weight basis. The dropping of seeds for the seeder along the row are shown in Fig. 8.
Measurement of Wheel Slippage of Seeder in Wet Field.
A field trial was conducted to measure the distance covered by the developed seeder in one revolu-tion of the wheel as it was required in calculation of the seed rate sown in the field. The wheels used on the drum seeder were rigid type and the outer diameter of wheel was 50 cm. The theoretical distance covered by a 50 cm diameter wheel was equal to 1.570 m.
The observation of wheel diam-
eter of the seeder was recorded and the average value was 49.86 cm. Therefore, theoretical distance cov-ered would be 1.566 m by the wheel in one revolution.
The distance covered by a wheel in a wet field was measured. The distance covered in three trials was recorded. The overall average was determined. The average distance covered in one revolution of the wheel was 1.537 m. Thus, slippage of the wheel was 2 % in the wet field.
Measurement of Walking Speed of the Operator
The walking speed of the opera-tor was measured by operating the seeder in walk backward mode. For convenience of the operator, walk-ing in the forward direction was more appropriate. The backward movement of operator was studied. It helped in operation, in drop-ping of seeds and when f low was blocked, with attention given to ac-cumulation of soils on wheels and in front of the seeder. Therefore, the operational problems were easily attended. Thus, the excessive burial of seeds were avoided with wet soil. During the operation the sinkage of the operator was 8-10 cm. The sinkage of the drum seeder was 2-3 cm as it was supported on the skids. The top soil moisture level was 35.3 % of on wet weight basis. The walking speed was measured by stop watch for straight movement of the seeder for the distance of 11.4
Fig. 7 Pregerminated rice seed for seeder Fig. 8 Seed dropping along with rows with drum seeder model-II
Note: the seeds deposited along rows in squire meter frame
Fig. 9 View of plot seeded withdeveloped rice seeder
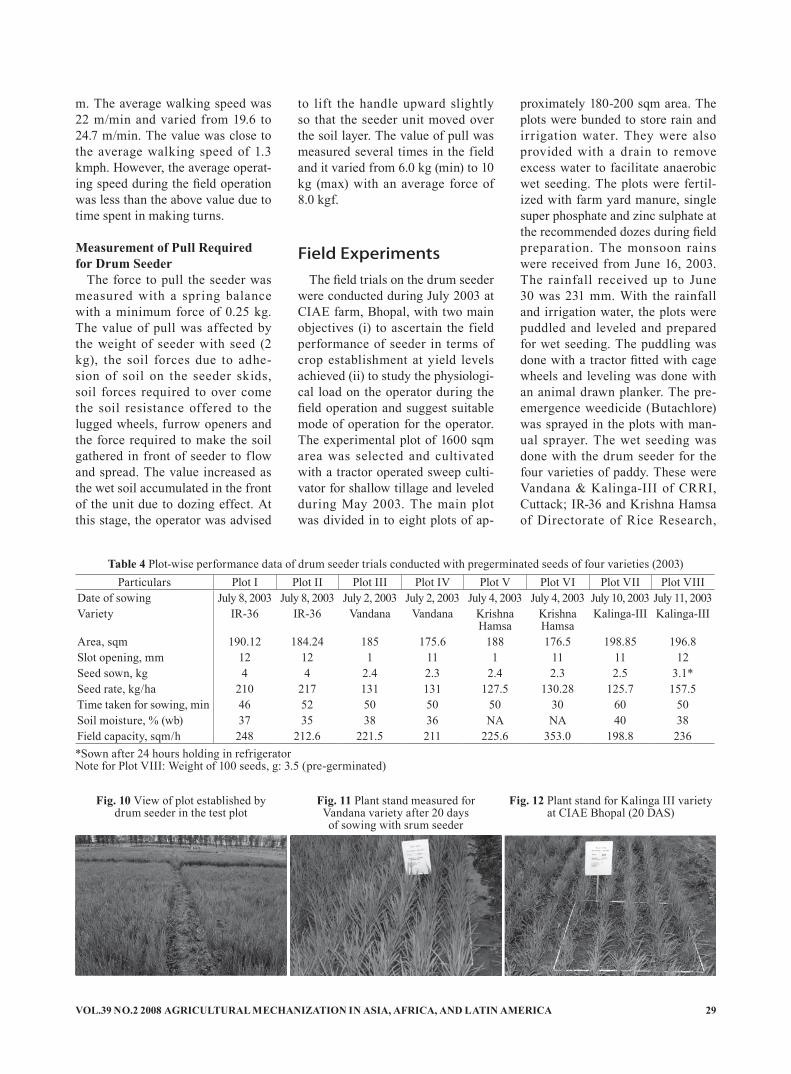
VOL.39 NO.2 2008 AGRICULTURAL MECHANIZATION IN ASIA, AFRICA, AND LATIN AMERICA 29
m. The average walking speed was 22 m/min and varied from 19.6 to 24.7 m/min. The value was close to the average walking speed of 1.3 kmph. However, the average operat-ing speed during the field operation was less than the above value due to time spent in making turns.
Measurement of Pull Required for Drum Seeder
The force to pull the seeder was measured with a spring balance with a minimum force of 0.25 kg. The value of pull was affected by the weight of seeder with seed (2 kg), the soil forces due to adhe-sion of soil on the seeder skids, soil forces required to over come the soil resistance offered to the lugged wheels, furrow openers and the force required to make the soil gathered in front of seeder to flow and spread. The value increased as the wet soil accumulated in the front of the unit due to dozing effect. At this stage, the operator was advised
to lift the handle upward slightly so that the seeder unit moved over the soil layer. The value of pull was measured several times in the field and it varied from 6.0 kg (min) to 10 kg (max) with an average force of 8.0 kgf.
Field ExperimentsThe field trials on the drum seeder
were conducted during July 2003 at CIAE farm, Bhopal, with two main objectives (i) to ascertain the field performance of seeder in terms of crop establishment at yield levels achieved (ii) to study the physiologi-cal load on the operator during the field operation and suggest suitable mode of operation for the operator. The experimental plot of 1600 sqm area was selected and cultivated with a tractor operated sweep culti-vator for shallow tillage and leveled during May 2003. The main plot was divided in to eight plots of ap-
proximately 180-200 sqm area. The plots were bunded to store rain and irrigation water. They were also provided with a drain to remove excess water to facilitate anaerobic wet seeding. The plots were fertil-ized with farm yard manure, single super phosphate and zinc sulphate at the recommended dozes during field preparation. The monsoon rains were received from June 16, 2003. The rainfall received up to June 30 was 231 mm. With the rainfall and irrigation water, the plots were puddled and leveled and prepared for wet seeding. The puddling was done with a tractor fitted with cage wheels and leveling was done with an animal drawn planker. The pre-emergence weedicide (Butachlore) was sprayed in the plots with man-ual sprayer. The wet seeding was done with the drum seeder for the four varieties of paddy. These were Vandana & Kalinga-III of CRRI, Cuttack; IR-36 and Krishna Hamsa of Directorate of Rice Research,
Fig. 10 View of plot established bydrum seeder in the test plot
Fig. 11 Plant stand measured forVandana variety after 20 daysof sowing with srum seeder
Fig. 12 Plant stand for Kalinga III variety at CIAE Bhopal (20 DAS)
Particulars Plot I Plot II Plot III Plot IV Plot V Plot VI Plot VII Plot VIIIDate of sowing July 8, 2003 July 8, 2003 July 2, 2003 July 2, 2003 July 4, 2003 July 4, 2003 July 10, 2003 July 11, 2003Variety IR-36 IR-36 Vandana Vandana Krishna
HamsaKrishna Hamsa
Kalinga-III Kalinga-III
Area, sqm 190.12 184.24 185 175.6 188 176.5 198.85 196.8Slot opening, mm 12 12 1 11 1 11 11 12Seed sown, kg 4 4 2.4 2.3 2.4 2.3 2.5 3.1*Seed rate, kg/ha 210 217 131 131 127.5 130.28 125.7 157.5Time taken for sowing, min 46 52 50 50 50 30 60 50Soil moisture, % (wb) 37 35 38 36 NA NA 40 38Field capacity, sqm/h 248 212.6 221.5 211 225.6 353.0 198.8 236*Sown after 24 hours holding in refrigeratorNote for Plot VIII: Weight of 100 seeds, g: 3.5 (pre-germinated)
Table 4 Plot-wise performance data of drum seeder trials conducted with pregerminated seeds of four varieties (2003)

AGRICULTURAL MECHANIZATION IN ASIA, AFRICA, AND LATIN AMERICA 2008 VOL.39 NO.230
Hyderabad. These varieties were considered suitable for the local conditions. The sprouted seeds were prepared by soaking the clean seed for 24 hours in water, it was fol-lowed by an incubation of 16-20 h. Therefore, plots were prepared, lev-eled during the soaking of seeds and were allowed settlement period of overnight. They were finally leveled manually and excess water removed for anaerobic seeding. The wet seed-ing on eight plots was performed on July 3, 4, 8, 10 and 11, 2003 for the four varieties (Figs. 9 and 10).
The field observations such as date of sowing, area of plot, slot size opening, slot of the seeder drum, seed rate sown, time to cover the plot and soil moisture level were recorded. The heart beat rate of the operator was recorded at the begin-ning and end of the field operation. The plot wise performance date are given in Table 4. The plant stand values were collected from the dif-ferent experimental plots after 14 to 20 days when the seedlings had at-tained the height of 15-20 cm. The sample plant stand in test plot is shown in Figs. 11 and 12. A square frame of 1 m size was used to count the plants along the row Table 3.
The four varieties planted with the developed drum seeder were harvested October 10 to October 20, 2003 at the time of their maturity. The variety Vandana and Kalinga-III were harvested October 10 and the varieties IR-36 and Krishna Hamsa were harvested October 20, 2004. The crop condition after 60 days of growth are shown in Figs. 12, 13 and 14. The crop yield levels achieved are reported in Table 6. Only the crop Vandana which grew very well had lodging effect due to winds close to harvest time.
Physiological Load StudiesDuring the wet anaerobic seed-
ing in the experimental plots, the physiological load on the operator was studied. For this, the walking speed of the operator in the wet field
was measured. The force required to operate the seeder was 8 kgf. The average walking speed was 20 to 22 mpm. Thus, the operator with a two-row seeder, walking at speed of 20 mpm, would cover an area of 8 sqm/min at 100 % field ef-ficiency. Normally time was lost in turning at the ends of fields due to minor adjustments, clearing of soil, etc. With a theoretical capacity of 8 sqm/min or 480 sqm/h the opera-tor will be working at the rate of 8 kgf × 20 m/min = 160 kgf m/min or 2.67 kgf-m/sec. The plot of 200 sqm area could be covered in a period of 25 minutes at 100 % efficiency. It was decided to monitor the heart beat rate of operator as the measure of physiological load. Thus, at the start of operation and after he had covered the test plot the readings were taken. The Insta Pulse Monitor used for the trials is shown in Fig. 15. The operator was allowed to take different time intervals vary-ing from 30 to 60 minutes to cover the plots. The values recorded for heart beat rates with Insta Pulse are reported in Table 7. From this the work rates performed by the opera-tor were calculated. The actual work rate values waere maximum at 5.88 sqm/min and minimum at 3.31 sqm/min. Based on work data and the heart beat rates recorded, the rec-ommended work rate for the opera-tor was determined.
Based on the values of heart rate reading recorded for the opera-tor, the safe working capacity was 3.31 sqm/min (198.6 sqm/h). The maximum working capacity was
5.88 sqm/min (352.8 sqm/h) and the allowable work capacity was 3.96 sqm/min (225.6 sqm/h). The safe working capacity was equal to 40 % theoretical maximum value.
Results and DiscussionsThe two row drum seeder design
was refined to make it suitable for anaerobic seeding in the wet seed bed. The seed drum was provided with 17 slots of 10 × 20 mm size for each row. The slot openings were adjustable for controlling the seed rate. The seeder was able to drop the pregerminated seeds in a continu-ous row formed by the small furrow openers at the shallow depth like a wet seed drill. The sowing of seeds varied from 125 to 217 kg/ha. These high seed rates were achieved for a slot setting varying from 11 to 12 mm. To achieve the high plant stand in the field, the farmer normally sows the seed at high rates. The field observations on the plant stand measured after 20 days of sowing indicated that for IR-36 the plant stand was 500 plants/sqm at the seed rate of 215 kg/ha. Taking into ac-count the 1000 pregerminated seed weight for IR-36 of 26.8 g, 62 % of the seeds sown were established. For the lower seed rate of 127 kg/ha the plant stand of 240 plants/sqm was achieved for the Krishna Hamsa variety. The high plant stand achieved in the test plots indicted the proper placement of seeds in the small ruts made by the furrow openers and proper coverage of seed
Fig. 13 Crop of Krishna Hamsa 56 days after sowing with drum seeder
Fig. 14 Kalinga-III crop after 53 days of sowing with drum seeder at CIAE Bhopal

VOL.39 NO.2 2008 AGRICULTURAL MECHANIZATION IN ASIA, AFRICA, AND LATIN AMERICA 31
with soft soil layer. The slot opening of 10 mm reduced the seed rate be-low 100 kg/ha rates. The seed rates increased rapidly as the slot open-ing was increased beyond 11 mm. This was because of fall of seeds from the number of slots. Thus, for sowing low seed rate, the setting of slot should be set at 10 mm opening. Thus, the pregerminated seeds at the desired depth and seed rate for proper establishment of crop were achieved.
The four varieties of paddy raised by the drum seeder were harvested on October 10 to October 20, 2004. The varieties Vandana and Kalinga-III were harvested on October 10 as they were ready for the harvest. The varieties Krishna Hamsa and IR-36 were harvested on October 20, 2004. The crop yield data are reported in Table 6. The moisture content at harvest was high and, therefore, the yield of crop was cal-culated in kg/ha on 10 % moisture content on dry basis for comparison purpose. Yields of Vandana was 2.822 tons/ha, Kalinga-III 4.064
tons/ha, Krishna Hamsa 3.73 tons/ha and IR-36 4.076 tons/ha. The grain yield of IR-36 and Kalainga were close to 4 tons/ha. The low yield of Vandana was due to lodg-ing of crop. The crop growth for all the varieties was good. The rainfall received during the rain season was well distributed.
Based upon the plant stand and the crop yield obtained from the four varieties, the performance of the developed seeder was excellent from crop considerations.
Physiological Load Studies on Operator
In the wet puddled field, the de-veloped drum seeder required an average pull of 8 kgf for its opera-tion. The observation of speed of walking of operator in puddled field was 20 m/min. Thus, the operator had to work at the rate of 160 kgf-m/min or 2.66 kgf/sec for seeder operation. Working at this rate, the maximum field area covered with the two row drum seeder with 20 cm row spacing calculated was 8
sqm/min. The aim of designing the two row unit was to make it easy to operate in the field. The studies at Tamil Nadu agriculture University and other places indicated that 70 % of energy of worker was consumed in only walking in the puddled field. Hence, only a small portion of energy was left for performing the seeder pulling operation. With the limited instruments available, it was decided to monitor the heart beat rate of the operator to keep the work rate within the allowable lim-its. Normally, heart beat rates and oxygen consumption rates are moni-tored in physiological studies.
In field trials, the heart beat rate of the operator was measured with Insta Pulse Monitor. The heart beat rate was measured at the beginning of trial and at the end of trial. In the first trial operator was directed to cover the test plot with minimum inoperative time. Thus, he was able to cover the plot of area 176.5 sqm in the duration of 30 minutes. At the end of operation his heart bear rate was 155/160 beats/min and he was completely exhausted. Afterwards, he was allowed to operate the unit at slow walking speed. Thus time taken for four test plots were 50 minutes. The heart beat rate values of operator at the completion of these plots were close to 138-142 beats/min. In plot number VII, the time taken to cover an area of 198.8 sqm was 60 minutes. The heart beat rate value for operator was close to 108. The safe value of heart beat rate for operator to do physical work was considered as 112 beats/min. The allowable heart beat rate for a working operator is 140 for the physical activity. At the lowest value of heart beat rate of 108 beat/min, the work capacity was 3.31 sqm/min and at 140 beat/min the field cover-age was 3.76 sq/min. The maximum work output of operator was 5.88 sqm/min. The theoretical maximum capacity calculated was 8 sqm/min. Therefore, the two row drum seeder, when operated at 3.31 sqm/min, was
Plot Variety Average plot yield g/sqm(at moisture content in %)
Yield calculated in kg/ha(@10 % m.c. (dry basis))
I IR-36 508 (29) 4330II IR-36 438 (26) 3823III Vandana 262 (12) 2537IV Vandana 324 (16) 3072V Krishna Hamsa (25) 3700VI Krishna Hamsa 432 (26) 3770VII Kalinga-III 480 (28) 4125VIII Kalinga-III 440 (22) 4003
Table 6 Crop yield data obtained from test plots sownby drum seeder (2003) at CIAE, Bhopal
Plot Variety Average plant stand,plant/m row length
Seed rate sown, r/m row length (calculated)
I IR-36 105 4.2II IR-36 96 4.4III Vandana 57 2.6IV Vandana 61 2.6V Krishna Hamsa 48 2.55VI Krishna Hamsa 61 2.60VII Kalinga-III 76 2.51VIII Kalinga-III 84 3.15
Table 5 The plant stand observed in plots sown with two row drumseeder after 14 to 20 days of sowing (2003, CIAE-Bhopal)
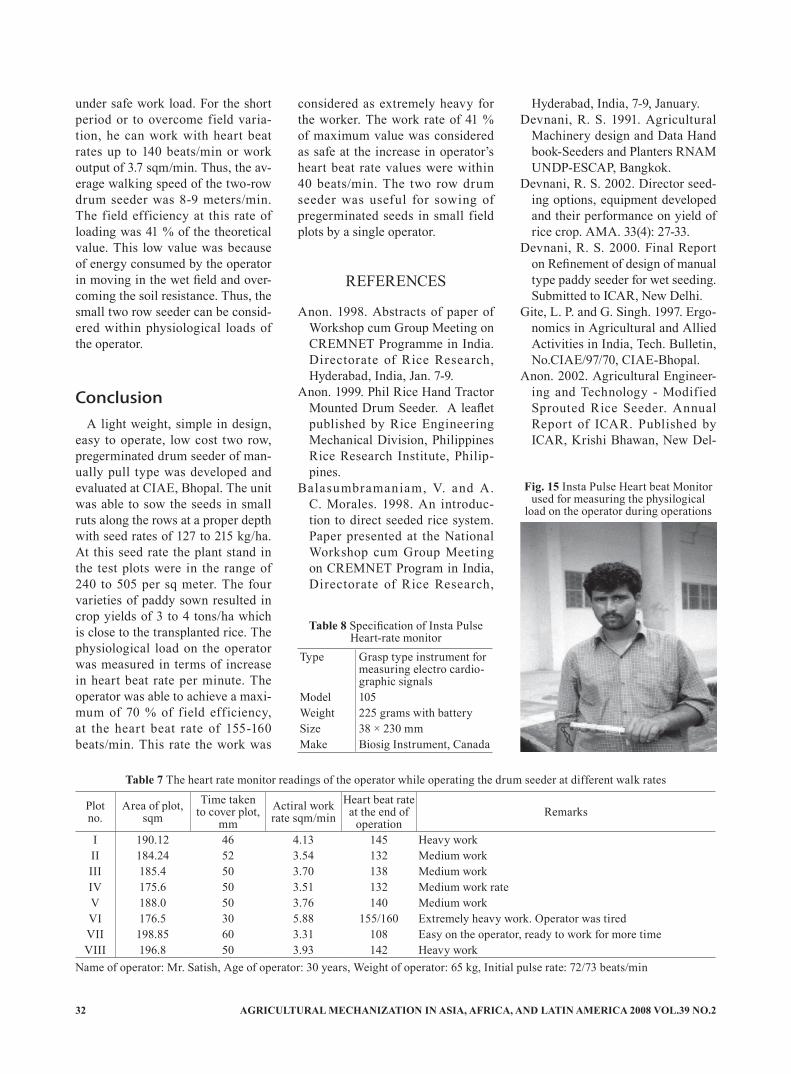
AGRICULTURAL MECHANIZATION IN ASIA, AFRICA, AND LATIN AMERICA 2008 VOL.39 NO.232
under safe work load. For the short period or to overcome field varia-tion, he can work with heart beat rates up to 140 beats/min or work output of 3.7 sqm/min. Thus, the av-erage walking speed of the two-row drum seeder was 8-9 meters/min. The field efficiency at this rate of loading was 41 % of the theoretical value. This low value was because of energy consumed by the operator in moving in the wet field and over-coming the soil resistance. Thus, the small two row seeder can be consid-ered within physiological loads of the operator.
ConclusionA light weight, simple in design,
easy to operate, low cost two row, pregerminated drum seeder of man-ually pull type was developed and evaluated at CIAE, Bhopal. The unit was able to sow the seeds in small ruts along the rows at a proper depth with seed rates of 127 to 215 kg/ha. At this seed rate the plant stand in the test plots were in the range of 240 to 505 per sq meter. The four varieties of paddy sown resulted in crop yields of 3 to 4 tons/ha which is close to the transplanted rice. The physiological load on the operator was measured in terms of increase in heart beat rate per minute. The operator was able to achieve a maxi-mum of 70 % of field efficiency, at the heart beat rate of 155-160 beats/min. This rate the work was
considered as extremely heavy for the worker. The work rate of 41 % of maximum value was considered as safe at the increase in operator’s heart beat rate values were within 40 beats/min. The two row drum seeder was useful for sowing of pregerminated seeds in small field plots by a single operator.
REFERENCES
Anon. 1998. Abstracts of paper of Workshop cum Group Meeting on CREMNET Programme in India. Directorate of Rice Research, Hyderabad, India, Jan. 7-9.
Anon. 1999. Phil Rice Hand Tractor Mounted Drum Seeder. A leaflet published by Rice Engineering Mechanical Division, Philippines Rice Research Institute, Philip-pines.
Balasumbramaniam, V. and A. C. Morales. 1998. An introduc-tion to direct seeded rice system. Paper presented at the National Workshop cum Group Meeting on CREMNET Program in India, Directorate of Rice Research,
Hyderabad, India, 7-9, January.Devnani, R. S. 1991. Agricultural
Machinery design and Data Hand book-Seeders and Planters RNAM UNDP-ESCAP, Bangkok.
Devnani, R. S. 2002. Director seed-ing options, equipment developed and their performance on yield of rice crop. AMA. 33(4): 27-33.
Devnani, R. S. 2000. Final Report on Refinement of design of manual type paddy seeder for wet seeding. Submitted to ICAR, New Delhi.
Gite, L. P. and G. Singh. 1997. Ergo-nomics in Agricultural and Allied Activities in India, Tech. Bulletin, No.CIAE/97/70, CIAE-Bhopal.
Anon. 2002. Agricultural Engineer-ing and Technology - Modified Sprouted Rice Seeder. Annual Report of ICAR. Published by ICAR, Krishi Bhawan, New Del-
Plot no.
Area of plot, sqm
Time taken to cover plot,
mmActiral work rate sqm/min
Heart beat rate at the end of
operationRemarks
I 190.12 46 4.13 145 Heavy workII 184.24 52 3.54 132 Medium workIII 185.4 50 3.70 138 Medium workIV 175.6 50 3.51 132 Medium work rateV 188.0 50 3.76 140 Medium workVI 176.5 30 5.88 155/160 Extremely heavy work. Operator was tiredVII 198.85 60 3.31 108 Easy on the operator, ready to work for more timeVIII 196.8 50 3.93 142 Heavy work
Name of operator: Mr. Satish, Age of operator: 30 years, Weight of operator: 65 kg, Initial pulse rate: 72/73 beats/min
Table 7 The heart rate monitor readings of the operator while operating the drum seeder at different walk rates
Fig. 15 Insta Pulse Heart beat Monitor used for measuring the physilogical
load on the operator during operations
Type Grasp type instrument for measuring electro cardio-graphic signals
Model 105Weight 225 grams with batterySize 38 × 230 mmMake Biosig Instrument, Canada
Table 8 Specification of Insta Pulse Heart-rate monitor

VOL.39 NO.2 2008 AGRICULTURAL MECHANIZATION IN ASIA, AFRICA, AND LATIN AMERICA 33
hi, p 138.Anon. 2002. Agricultural Engi-
neering and Technology-Success Story-, Manually Operated - Low Land Rice Seeder. Annual Report of ICAR. Published by ICAR Kri-shi Bhawan, New Delhi.
Nag, P. K. and P. Dutt. 1980. Circulo respiratory eff iciency in some agricultural work. Applied Ergo-nomics 11: 81-84.
Krishnan, K. 1999. Row seeder for sowing rice in puddled soil. ICAR News, ICAR, Krishi Bhawan, New Delhi, India, Vo. 5, No.1, pp 12.
Nishida, H. 1996. The outline of activities conducted by Labora-tory of Agricultural Machinery.
Kyushu National Agricultural Experiment Station, AMA. 27(1): 44-47.
Pradhan, S. N. 1968. Single row paddy planter. Indian Farming, ICAR, New Delhi, 17(11): 44-47.
Sawamura, Nobuyuki. 1995. De-velopment of mechanical paddy seeder. Report of work at Phil Rice Research Institute, Maligaya Manos, Nueva Ecija, Philippines.
Di rectorate of R ice Research. 1997-98. DRR Annual Report. Hyderabad, India, Page 47.
Rautaray, S. K. and S. K. Mathank-er. 1998. Annual Report of CIAE Bhopal 91998). Annual Report of CIAE, Bhopal 1998, CIAE, Bho-pal, pp 18, 19.
Ryuji, Otani. 1998. Performance evaluation and improvement of technical paddy seeder. Report of work at Phil Rice Research In-stitute, Maligaya Manos, Nueva Ecija, Philippines.
Anon. 2000-2002. TNAU Coim-batore Centre on AICRP on Hu-man Engineering and Safety in Agriculture. Progress Report. Pre-sented during Second Workshop held t PAU, Ludhiana. October 4-5, 2002. Published by Depart-ment of farm Power and Machin-ery, College of Agricultural Engi-neering, TNAU, Coimbatore - 641 003.
■■
(Continued from page56)
Design and Construction of the Airtight FerrocementBin for On-farm Storage at Paddy
Society of Structural Engineers, Sri Lanka, Colombo.
Kroonenberg, v. d. H. H. and F.J. Siers. 1998. Methodisch ontwer-pen. EPN, Houten, The Nether-lands.
Nimityongskul, P. and H. Koentjoro. 1985. Application of ferrocement linings for ir r igation, Second International Symposium on fer-rocement, AIT, Bangkok.
Oostdam, J. W. M. 2000. Methodi-cal Engineering Design. Wagenin-gen University, The Netherlands.
Palipane, K. B. 1978. Evaluation of the bissa. An indigenous storage bin. RPRDC report 5/7, Rice Pro-
cessing Research and Develop-ment Centre, Anuradhapura, Sri Lanka.
Proctor, D. L. 1994. Grain storage techniques. Bulletin No.109, FAO Agricultural Services, Rome.
Reynolds, C. E. and J. C. Steedman. 1981. Rainforced concrete design-er’s handbook. Garden City Press Limited, Herts, 167-170 pp.
Sartaj, I. Z. and S. Ekanayake. 1991. Post harvest losses. Tropical Agri-cultural Research, 3: 115 -132.
Tricka, D. N., S. K. Kaushik, and R. R. Kotdawala. 1985. Mesh-motar ratio as design parameter for fer-rocement flexural elements, Sec-
ond International Symposium on ferrocement, AIT, Bangkok.
Vazirani, V. N. and S. P. Chandola. 1975. Civil Engineering Hand Book. Kanna Publishers, Delhi, 23.66-23.71, 23.279-23.291 pp.
Wright, I. C. 1998. Design methods in engineering and product de-sign. McGraw Hill, London.
■■
AGRICULTURAL MECHANIZATION IN ASIA, AFRICA, AND LATIN AMERICA 2008 VOL.39 NO.234
Evaluation and Improvement in Design of Self Propelled Vertical Conveyer Reaper
byL. P. SinghEx.-Professor and HeadFarm Engineering Department,College of Agriculture,Junagadh Agricultural University,Junagadh - 362 001, GujaratINDIA
K. K. JainAssociate ProfessorFarm Engineering Department,College of Agriculture,Junagadh Agricultural University,Junagadh - 362 001, GujaratINDIA
V. R. VagadiaSenior Research AssistantFarm Engineering Department,College of Agriculture,Junagadh Agricultural University,Junagadh - 362 001, GujaratINDIA
A. H. MemonProfessor and HeadFarm Engineering Department,College of Agriculture,Junagadh Agricultural University,Junagadh - 362 001, GujaratINDIA
AbstractHarvesting is one of the important
operations of farming. As a step towards mechanization of harvest-ing operation for cereals, many alternatives are available to day. The self propelled vertical conveyor reaper is the best alternate in India because of crop straw requirement for animal feed and size of fields. The original IRRI design of self propelled vertical conveyer reaper was introduced in India for harvest-ing of cereal crops. However, due to inherent short comings like drudg-ery of operation and non suitability to handle/harvest taller fodder crops that increase the utility of reaper, the machine has not become popular among the Indian farmers.
In the year 1994 the original IRRI design reaper machine was tested on wheat, paddy and safflower crops. The following necessary scope of design improvements have been ob-served & suggested in order to make it more functional and cost effective: (i) Providing a power cut off mecha-nism for the harvesting unit. (ii)
Providing a reversing mechanism. (iii) Providing a lower horse power engine and (iv) Providing reduced width steel wheels and provision of attaching rubber tyre wheels when required. The improved reaper de-sign was tested on cereal and fodder crops to increase utility. An adjust-able third belt attachment has been fabricated for the reaper to improve conveying effectiveness for tall fod-der crops (1.0 to 1.7 m). The shape of the un-cut crop divider, star wheels and row crop dividers (cover plates) was modified. The modified reaper was tested in crops like jowar, ba-jara, maize, safflower and wheat.
The modified machine worked very well for harvesting fodder crops like bajara & jowar of about 1.2 to 1.7 m, height. For the windrowing quality, it was observed that for fod-der crops more then 80 % of the cut crop was laid satisfactorily. Thus, the improved machine can be used con-veniently and effectively for harvest-ing of both fodder and cereal crops.
The cost of harvesting including the heap and bundle making reaper machine was Rs.590/-($13.11) per
hectare where as the cost of har-vesting manually with a sickle was Rs.840/-($18.67) per hectare. There-fore, harvesting with the help of the vertical conveyer reaper resulted in an average savings of 30 %, which was Rs.250/($5.56) per hectare.
IntroductionHarvesting is one of the impor-
tant operations of farming. This is a labour intensive seasonal operation consuming about 18-20 % of the labour required for growing cereal crops. The traditional method of har-vesting with sickle is both labour as well as time consuming, where both are scarce during the peak harvesting season. As a step towards mechani-zation of the harvesting operation for cereal crops, the alternatives available were considered such as (1) Self pro-pelled combine harvesters, (2) Trac-tor mounted combine harvesters, (3) Tractor front mounted vertical con-veyer reaper, (4) Power tiller mounted vertical conveyer reaper and (5) Self propelled vertical conveyer reaper.

VOL.39 NO.2 2008 AGRICULTURAL MECHANIZATION IN ASIA, AFRICA, AND LATIN AMERICA 35
The use of combine harvesters mentioned above at No. (1) and (2) have their limitations. The farmers want to recover both grains as well as the straw from wheat and paddy crops, because the cost of straw is about 15-20 % of the grain from the
same area. Moreover, the use of a big machine like tractor front mounted reapers are not preferred due to (i) large cutting width which required more labourers (ii) normally paddy field plots are smaller in size (iii) traction and compaction problems
and (iv) poor visibility from op-erator’s seat. Moreover, power tiller mounted reapers have not found wide applicability as the use of power til-ler itself is limited in India.
The original IRRI design reaper was adopted to some extent in India, particularly for harvesting of cereal crops. Due to its inherent short com-ings like drudgery of operation and non-suitability to handle/harvest tall-er (fodder) crops, the machine does not become more popular among the farmers of India. It was required to modify the IRRI design reaper machine to increase the applicability and utility among the farmers.
Materials and MethodsThe study Included evaluation of
existing original IRRI design of self propelled vertical conveyer reaper for harvesting cereals as well as tall fodder crops. Further improvements and evaluation were required in the existing IRRI design reaper. The existing IRRI design reaper was purchased in March-1993, from M/S Fine fabrication, Bhopal (India). The same machine was tried on paddy, wheat and safflower crops at different locations and crops grown areas of Gujarat State. The field performance and cost analysis data of original IRRI design reaper are given in Table 1.
The working of the above ma-chine was unsatisfactory and full of drudgery. In spite of favorable economic feasibility of introducing such a reaper machine in India, the following necessary scope of design improvements have been suggested by the department of farm engi-neering, GAU, Junagadh, during the year 1994-95, in order to make it more functional and cost effec-tive: (i) Providing a power cut-off mechanism to harvesting unit; (ii) Providing a reverse gear facility; (iii) Matching of size of prime mov-er and the size of machine and (iv) Providing a reduced width of steel
Particular, unitHarvested crops
Paddy, Avg. Wheat, Avg. Safflower, Avg.
Condition of the cropCrop variety Guj-17 GW-49/
R-1553Bhima
Width of row, m 0.15 0.15 0.10Row spacing, m 0.45 0.45 0.60Plant height (Avg.), m 1.00 0.77 0.81
Condition of the fieldsLocation (Place) Ahmedabad Jetpur/Arnej ArnejLength, m 47.00 68.92 100.00Width, m 16.50 39.18 25.00Area, m2 775.5 2,700 2,500
Labour costNo. of operator, M.D./ha 0.80 1.00 0.70No. of helper, M.D./ha 0.80 1.00 0.70No. of labourers (Reaper), M.D./ha 1.60 1.00 1.40No. of labourers (Manually), M.D./ha 26 15 10Labour cost of harvesting (Reaper), Rs./ha
152($3.38)
151($3.36)
133($2.96)
Labour cost of harvesting (Manual), Rs./ha
1,040($23.11)
600($13.33)
400($8.89)
Cost of harvesting (Reaper)Fixed cost, Rs./ha 5.81 ($0.13) 5.81 ($0.13) 5.81 ($0.13)Variable cost, Rs./ha 32.79 ($0.73) 26.36 ($0.59) 31.89 ($30.71)Net cost of harvesting (Reaper), Rs./ha 401 ($8.91) 411 ($9.13) 342 ($7.6)Benefit, Rs./ha 639 ($14.2) 189 ($4.2) 58 ($1.29)
Field performaceDate of test Nov.-94 March-95 March-95Actual operation, min 30 138 83Time lost
Turning, sec 280 645 388Clogging etc., sec 60 96 478
Effective working width, m 0.80 0.80 1.20/0.90E.F.C., ha/hr 0.155 0.130 0.180Speed of machine, kmph 2.27 1.86 1.80T.F.C., ha/hr 0.21 0.17 0.16/0.22Field efficiency, % 76 75 111/83Fuel consumption, lit/hr 0.510 0.320 0.350Lubricant consumption, ml/hr 20 20 20Estimated B.H.P. 2.40 1.26 1.40Height of cut, m 0.15 0.15 0.13
Table 1 Field performance and cost analysis data of reaper (original IRRI design)
Assumptions: (i) Cost of machine (Rs.): 36,000/-($800); (ii) Salvage value: 10 % of (i); (iii) Depreciation: 10 %; (iv) Interest (Avg.): 15.5 %; (v) Life of machine (Yrs.): 15; (vi) Repair and maintenance: 10 %; (vii) Annual use (hr): 900; (viii) Rte of fuel (Rs./lit.): 8.00 ($0.18); (a) Operator (Rs./day): 60.00 ($1.33); (b) Helper (Rs. /day): 50.00 ($1.11); (c) Labour (Rs./day): 40.00 ($0.89)
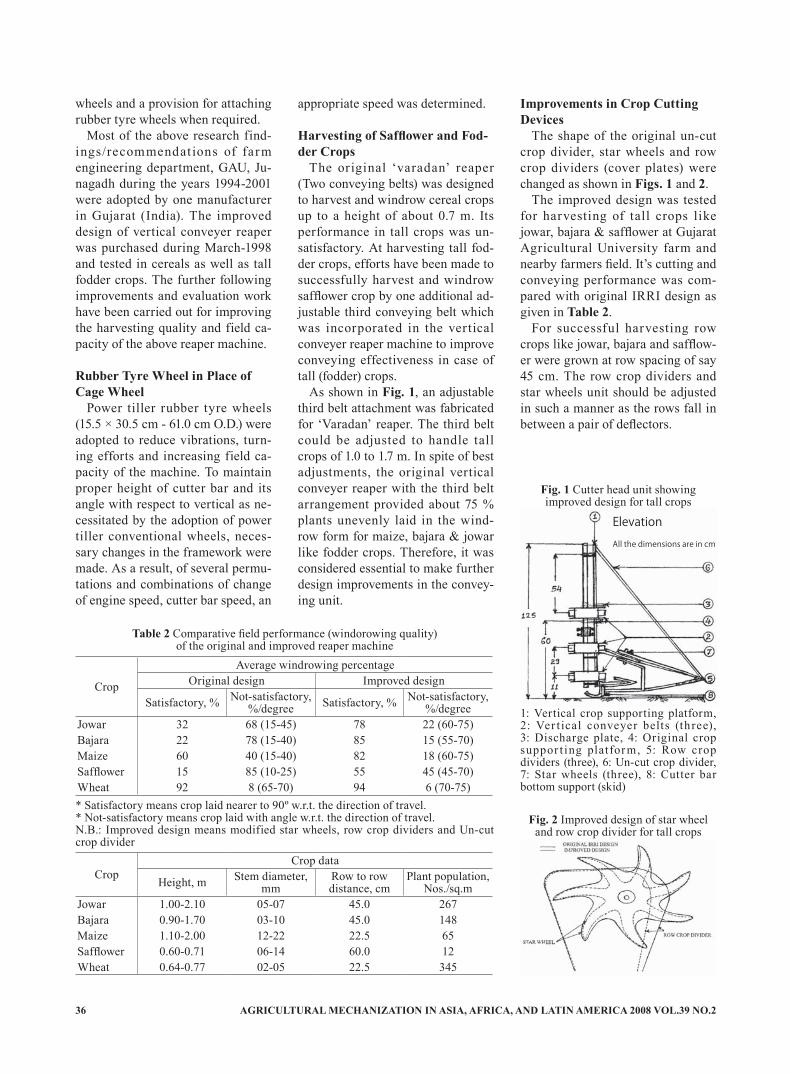
AGRICULTURAL MECHANIZATION IN ASIA, AFRICA, AND LATIN AMERICA 2008 VOL.39 NO.236
wheels and a provision for attaching rubber tyre wheels when required.
Most of the above research find-ings/recommendat ions of farm engineering department, GAU, Ju-nagadh during the years 1994-2001 were adopted by one manufacturer in Gujarat (India). The improved design of vertical conveyer reaper was purchased during March-1998 and tested in cereals as well as tall fodder crops. The further following improvements and evaluation work have been carried out for improving the harvesting quality and field ca-pacity of the above reaper machine.
Rubber Tyre Wheel in Place of Cage Wheel
Power tiller rubber tyre wheels (15.5 × 30.5 cm - 61.0 cm O.D.) were adopted to reduce vibrations, turn-ing efforts and increasing field ca-pacity of the machine. To maintain proper height of cutter bar and its angle with respect to vertical as ne-cessitated by the adoption of power tiller conventional wheels, neces-sary changes in the framework were made. As a result, of several permu-tations and combinations of change of engine speed, cutter bar speed, an
appropriate speed was determined.
Harvesting of Safflower and Fod-der Crops
The original ‘varadan’ reaper (Two conveying belts) was designed to harvest and windrow cereal crops up to a height of about 0.7 m. Its performance in tall crops was un-satisfactory. At harvesting tall fod-der crops, efforts have been made to successfully harvest and windrow safflower crop by one additional ad-justable third conveying belt which was incorporated in the vertical conveyer reaper machine to improve conveying effectiveness in case of tall (fodder) crops.
As shown in Fig. 1, an adjustable third belt attachment was fabricated for ‘Varadan’ reaper. The third belt could be adjusted to handle tall crops of 1.0 to 1.7 m. In spite of best adjustments, the original vertical conveyer reaper with the third belt arrangement provided about 75 % plants unevenly laid in the wind-row form for maize, bajara & jowar like fodder crops. Therefore, it was considered essential to make further design improvements in the convey-ing unit.
Improvements in Crop Cutting Devices
The shape of the original un-cut crop divider, star wheels and row crop dividers (cover plates) were changed as shown in Figs. 1 and 2.
The improved design was tested for harvesting of tall crops like jowar, bajara & safflower at Gujarat Agricultural University farm and nearby farmers field. It’s cutting and conveying performance was com-pared with original IRRI design as given in Table 2.
For successful harvesting row crops like jowar, bajara and safflow-er were grown at row spacing of say 45 cm. The row crop dividers and star wheels unit should be adjusted in such a manner as the rows fall in between a pair of deflectors.
Crop
Average windrowing percentageOriginal design Improved design
Satisfactory, % Not-satisfactory, %/degree Satisfactory, % Not-satisfactory,
%/degreeJowar 32 68 (15-45) 78 22 (60-75)Bajara 22 78 (15-40) 85 15 (55-70)Maize 60 40 (15-40) 82 18 (60-75)Safflower 15 85 (10-25) 55 45 (45-70)Wheat 92 8 (65-70) 94 6 (70-75)
CropCrop data
Height, m Stem diameter, mm
Row to row distance, cm
Plant population, Nos./sq.m
Jowar 1.00-2.10 05-07 45.0 267Bajara 0.90-1.70 03-10 45.0 148Maize 1.10-2.00 12-22 22.5 65Safflower 0.60-0.71 06-14 60.0 12Wheat 0.64-0.77 02-05 22.5 345
* Satisfactory means crop laid nearer to 90º w.r.t. the direction of travel.* Not-satisfactory means crop laid with angle w.r.t. the direction of travel.N.B.: Improved design means modified star wheels, row crop dividers and Un-cut crop divider
Table 2 Comparative field performance (windorowing quality)of the original and improved reaper machine
Fig. 1 Cutter head unit showing improved design for tall crops
1: Vertical crop supporting platform, 2: Ver t ical conveyer belts (th ree), 3: Discharge plate, 4: Original crop suppor t ing platform, 5: Row crop dividers (three), 6: Un-cut crop divider, 7: Star wheels (three), 8: Cutter bar bottom support (skid)
Elevation
All the dimensions are in cm
Fig. 2 Improved design of star wheel and row crop divider for tall crops

VOL.39 NO.2 2008 AGRICULTURAL MECHANIZATION IN ASIA, AFRICA, AND LATIN AMERICA 37
Windrowing QualityThe performance of the completely
improved reaper machine (Fig. 3) has been tested in bajara, jowar, maize and wheat crops harvesting, the re-quired data presented in Table 3.
Harvesting Cost Calculation: The cost of the improved ma-
chine (Plate 1) was worked out as Rs.55,000/($1,222.22) (year-2001) including the original designed ma-chine and improved attachments. The cost of operation was computed by the straight-line method.
Results and DiscussionPerformance of Original IRRI Design Reaper
As seen from the Table 1 the effec-
tive field capacity worked out for har-vesting of paddy, wheat and safflower is 0.155, 0.130 and 0.180 hectare per hour, respectively. The maximum benefit of Rs.639/($14.2) per hect-are has been found in paddy crop. While that of wheat and safflower it is Rs.189/($4.20) and 58/($1.29) per hectare respectively, significantly higher benefit was found in paddy particularly due to need of more manual labourers during manual har-vesting of paddy and comparatively higher effective field capacity.
Benefit being in favour of harvest-ing with the reaper in view of non-availability of labourers during the harvesting seasons, there appears to be good scope of improvements in cutting and conveying units of ver-tical conveyer reaper for harvesting of cereals as well as fodder crops also, which increase the utility of above reaper machine.
Providing a Lower Horse Power Engine
The main expensive components of this machine was a 5.0 hp diesel engine. As seen from the Table 1, the average horsepower requirement from the reaper engine was found to be 2.40, 1.26 and 1.40 hp, for paddy wheat and safflower crops, respec-tively. This led to an important design
improvement in the reaper machine i.e. the size of engine would reduced, thus, reducing the cost of operation, because the cost of engine amounts to be nearly about 50 % of the total cost of complete reaper machine.
Reduced Width of Steel Wheels and Provision of Rubber Tyre Wheels on Harvesting
The results indicate that lower conveying speed of 0.73 m/sec is satisfactory for low-density crops. But same conveying speeds are not found suitable for high-density crops, as it resulted in chocking of crop at the cutting platform of the machine. At higher conveying speed, i.e. 1.57 to 1.95 m/sec. (50 to 70 % increase), there was unsatis-factory windrowing. Use of rubber tyre wheels not only resulted in re-duction of vibration but it also made turning easy. It was also observed that the reduced width of steel wheels made turning easy, particu-larly in paddy field.
Effects of Cutting Unit Improve-ments:
As seen from the Table 2 the mod-ified designed resulted in less side-ways def lection of the crop while approaching the cutter unit and, as such, the plants while being cut re-
Crop
Average windrowing percentageOriginal design Improved design
Satisfactory, % Not-satisfactory, %/degree Satisfactory, % Not-satisfactory,
%/degreeJowar 53 47 (15-30) 84 16 (30-35)Bajara 22 78 (60-70) 85 15 (20-25)Maize 58 42 (25-40) 80 20 (45-50)Wheat 92 8 (70-75) 94 6 (65-70)
CropCrop data
Height, m Stem diameter, mm
Row to row distance, cm
Plant population, Nos./sq.m
Jowar 1.05-1.37 3-8 36.6 385Bajara 0.94-1.60 3-10 40.5 165Maize 1.00-1.50 10-25 36.6 225Wheat 0.64-0.77 2-6 22.5 345
* Satisfactory means crop laid nearer to 90º w.r.t. the direction of travel.* Not-satisfactory means crop laid with angle w.r.t. the direction of travel.
Table 3 Comparative field performance (windorowing quality) of the improvedreaper machine with original machine for fodder and cereal crops
Fig. 3 Improved self propelledvertical conveyer reaper machinefor cereals and tall fodder crops
1: Petrol/Kerosene engine (3.1 hp), 2: Pneumatic tyre, 3: Power cut-off clutch, 4: Lever for reversing, 5: Gear box, 6: Vertical crop supporting platform, 7: Vertical conveyer belt (three), 8: Original crop supporting platform height, 9: Star wheels (three), 10. Row crop dividers (three), 11. Speed control lever
Plate 1 Improved self propelledvertical conveyer reaper machinefor cereals and tall fodder crops
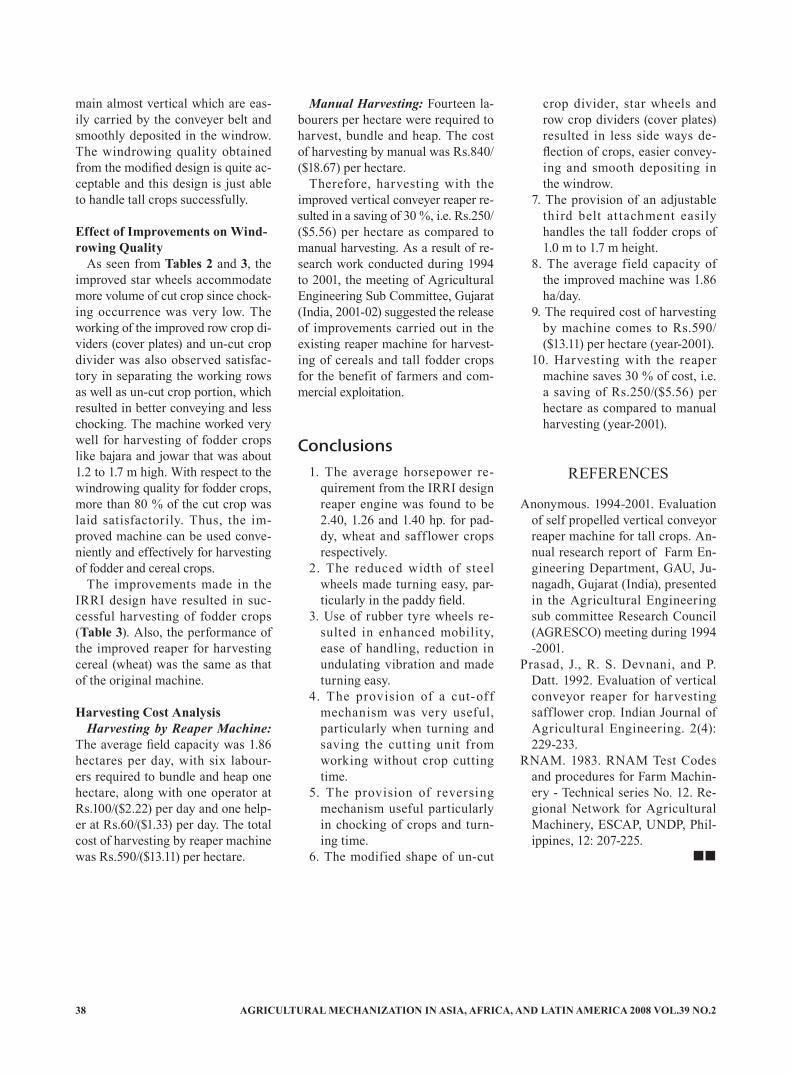
AGRICULTURAL MECHANIZATION IN ASIA, AFRICA, AND LATIN AMERICA 2008 VOL.39 NO.238
main almost vertical which are eas-ily carried by the conveyer belt and smoothly deposited in the windrow. The windrowing quality obtained from the modified design is quite ac-ceptable and this design is just able to handle tall crops successfully.
Effect of Improvements on Wind-rowing Quality
As seen from Tables 2 and 3, the improved star wheels accommodate more volume of cut crop since chock-ing occurrence was very low. The working of the improved row crop di-viders (cover plates) and un-cut crop divider was also observed satisfac-tory in separating the working rows as well as un-cut crop portion, which resulted in better conveying and less chocking. The machine worked very well for harvesting of fodder crops like bajara and jowar that was about 1.2 to 1.7 m high. With respect to the windrowing quality for fodder crops, more than 80 % of the cut crop was laid satisfactorily. Thus, the im-proved machine can be used conve-niently and effectively for harvesting of fodder and cereal crops.
The improvements made in the IRRI design have resulted in suc-cessful harvesting of fodder crops (Table 3). Also, the performance of the improved reaper for harvesting cereal (wheat) was the same as that of the original machine.
Harvesting Cost AnalysisHarvesting by Reaper Machine:
The average field capacity was 1.86 hectares per day, with six labour-ers required to bundle and heap one hectare, along with one operator at Rs.100/($2.22) per day and one help-er at Rs.60/($1.33) per day. The total cost of harvesting by reaper machine was Rs.590/($13.11) per hectare.
Manual Harvesting: Fourteen la-bourers per hectare were required to harvest, bundle and heap. The cost of harvesting by manual was Rs.840/($18.67) per hectare.
Therefore, harvesting with the improved vertical conveyer reaper re-sulted in a saving of 30 %, i.e. Rs.250/($5.56) per hectare as compared to manual harvesting. As a result of re-search work conducted during 1994 to 2001, the meeting of Agricultural Engineering Sub Committee, Gujarat (India, 2001-02) suggested the release of improvements carried out in the existing reaper machine for harvest-ing of cereals and tall fodder crops for the benefit of farmers and com-mercial exploitation.
Conclusions1. The average horsepower re-
quirement from the IRRI design reaper engine was found to be 2.40, 1.26 and 1.40 hp. for pad-dy, wheat and saff lower crops respectively.
2. The reduced width of steel wheels made turning easy, par-ticularly in the paddy field.
3. Use of rubber tyre wheels re-sulted in enhanced mobility, ease of handling, reduction in undulating vibration and made turning easy.
4. The provision of a cut-off mechanism was very useful, particularly when turning and saving the cutting unit from working without crop cutting time.
5. The provision of reversing mechanism useful particularly in chocking of crops and turn-ing time.
6. The modified shape of un-cut
crop divider, star wheels and row crop dividers (cover plates) resulted in less side ways de-flection of crops, easier convey-ing and smooth depositing in the windrow.
7. The provision of an adjustable third belt at tachment easily handles the tall fodder crops of 1.0 m to 1.7 m height.
8. The average field capacity of the improved machine was 1.86 ha/day.
9. The required cost of harvesting by machine comes to Rs.590/($13.11) per hectare (year-2001).
10. Harvesting with the reaper machine saves 30 % of cost, i.e. a saving of Rs.250/($5.56) per hectare as compared to manual harvesting (year-2001).
REFERENCES
Anonymous. 1994-2001. Evaluation of self propelled vertical conveyor reaper machine for tall crops. An-nual research report of Farm En-gineering Department, GAU, Ju-nagadh, Gujarat (India), presented in the Agricultural Engineering sub committee Research Council (AGRESCO) meeting during 1994 -2001.
Prasad, J., R. S. Devnani, and P. Datt. 1992. Evaluation of vertical conveyor reaper for harvesting safflower crop. Indian Journal of Agricultural Engineering. 2(4): 229-233.
RNAM. 1983. RNAM Test Codes and procedures for Farm Machin-ery - Technical series No. 12. Re-gional Network for Agricultural Machinery, ESCAP, UNDP, Phil-ippines, 12: 207-225.
■■
VOL.39 NO.2 2008 AGRICULTURAL MECHANIZATION IN ASIA, AFRICA, AND LATIN AMERICA 39
Energy Requirement of Different Weed Management Practices for Aerobic Rice in India
byV. P. ChaudharyScientist (Farm Machinery and Power)Project Directorate for CroppingSystems Research,Modipuram, Meerut - 250 110INDIA
D. K. PandeyTech. OfficerProject Directorate for CroppingSystems Research,Modipuram, Meerut - 250 110INDIA
S. K. SharmaPrincipal Scientist (Agronomy)Project Directorate for CroppingSystems Research,Modipuram, Meerut - 250 110INDIA
AbstractAn analysis of the energy require-
ments for the rice (Oryza sativa L.) was conducted at the Research farm of Project Directorate for Cropping Systems research, Mo-dipuram, Meerut during the year of 2000-01 to 2003-04. Selected weed management practices: hand weed-ing twice, herbicides + one hand weeding, criss-cross sowing + one hand weeding, criss-cross sowing + herbicides + one hand weeding, unweeded check were subjected to aerobic rice crop to assess the en-ergy use, out put energy obtained and net return of energy. Results revealed that the total input en-ergy utilization in rice varied from 31,230.6 MJ/ha to 32,252.3 MJ/ha in unweeded check and criss-cross + herbicides + hand weeding, respec-tively. The energy use by irrigation represented the major part of total energy use, accounting about 47.6 percent followed by fertilizers about 32 percent in all treatments, where-
as, machinery consumed from 11.5 to 12.5 percent of total input energy. Total amount of energy use in weed management varied from 1.18 to 2.88 percent of the total input en-ergy. Hand weeding twice was more energy consuming than other treat-ments. This was followed by herbi-cides + hand weeding once as well as criss-cross sowing + herbicides + hand weeding once. The energy uti-lization for weed management was slightly higher in traditional seed-bed as compared with stale seedbed.
The output energy in criss-cross sowing + herbicides + hand weed-ing once was from 83 to 89 percent higher than unweeded, 55 percent higher than criss-cross sowing + hand weeding once, from 9 to 13 percent higher than hand weeding twice and 4 percent higher than herbicides + hand weeding once. The net return energy, among five treatments, was found to be signifi-cantly high in criss-cross sowing + herbicides + hand weeding once (i.e. 51,043.5 MJ/ha in stale seedbed
and 44,363.7 MJ/ha in traditional seedbed) than other treatments, which was statistically at par with treatment herbicides + hand weed-ing once (i.e. 47,789.6 MJ/ha in stale seedbed and 44,847.2 MJ/ha in traditional seedbed). This was fol-lowed by hand weeding twice (i.e. 40,806.6 MJ/ha in stale seedbed and 37,591.5 MJ/ha in traditional seedbed) and criss-cross sowing + hand weeding once (i.e. 6,214.9 MJ/ha in stale seedbed and 1,534.2 MJ/ha in traditional seedbed) which had significant difference in the same seedbed preparation. However, the unweeded treatment gave negative net return energy. So, without weed management, practices adopted will not able to get output energy.
IntroductionEnergy consumption in Indian
agriculture has been steadily in-creasing from 1953-54 onwards, recording a quantum jump between

AGRICULTURAL MECHANIZATION IN ASIA, AFRICA, AND LATIN AMERICA 2008 VOL.39 NO.240
1965-66 and 1975-76. In fact, mod-ernization of agriculture has en-hanced the energy consumption in different inputs used. It is invested in various forms such as mechani-cal (from machines, human labour, animal draft), chemical fertiliser, pesticides, herbicides), electrical, etc. It was realized that crop yields and food supplies are directly linked to energy (Stout, 1990). Bridges and Smith (1979) developed a method for determining the total energy input for agricultural practices. Numerous studies have been made to quantify energy consumption in agricultural production (Heslop and Bilanski, 1989; Ouellette-Babin, 1982; Swanton et al., 1996; Vinten- Johansen et al., 1990; Zentner et al., 1984, 1989; Zucchetto and Bickle, 1984).
The primary objectives of mecha-nizing crop production are to reduce human drudgery and to raise the output of farm by either increasing the yield per unit area or increasing the area under cultivation. These can only be done by supplement-ing the traditional energy input, i.e. human labour with substantial investments in farm machinery, ir-rigation equipment, fertilizers, soil and water conservation practices, weed management practices. These inputs and methods represent vari-ous energies that need to be evalu-ated so as ascertain their effective-ness and to know how to conserve them. Energy analysis, therefore, is necessary for efficient management of scarce resources for improved agricultural production. It would identify production practices that are economical and effective. Other benefits of energy analysis are to determine the energy invested in every step of the production process (hence identifying the steps that require least energy inputs), to pro-vide a basis for conservation and to aid in making sound management and policy decisions. For example, proper management of weeds and operation of machinery or irrigation
pumps reduce input energy.The rice is grown in a variety
of practices such as transplanting, direct seeding in wet and dry bed. But in India, it is mainly grown by transplanting of seedlings under puddled field conditions which re-quires a huge amount of the input energy for the growing the seed-lings, puddling, transplanting, weed management, irrigations, etc. Rice is the most staple food of millions of people throughout the world, more particularly in Asia. It is the major crop in India which covers about 40.5 M ha with production about 85 M tonnes. With the advancement in technology and general agricultural developments, the use of the energy resources has increased markedly. Under direct seeding in dry bed conditions, weeds are a major con-straint to rice productivity because rice germinates almost simultane-ously. Uncontrolled weeds reduce the rice yield up to 97 percent in the direct sown rice (Saxena and Vaishya, 1993). Direct seeded rice covers 26 and 28 percent of the total rice area in South Asia and India, respectively (Panday and Velasco, 1999). Thus, the energy aspects need to be analyzed for an appropriate weed control measures for controlling the weeds will be of
immense importance to the farming community.
The weed management in the rice crop is one of the major targets to get higher production to feed the increasing population. It is also dif-ficult with aerobic rice. The infor-mation on energies of comparative use of different weed management practices is lacking. It is required, in order, to make deductions on the efficiencies of the energies and sug-gestions on which energy sources or their combinations need to be used and at what levels. In the present study, it is proposed to analyze agri-cultural energy utilization patterns and net return energy of rice from farm studies. The present study has been undertaken in order to com-pare different weed management practices adopted in aerobic rice production, using the satisfactory energy inputs and output.
MethodologySite and Climate
The experiment was carried out at the Research farm of the Project Directorate for Cropping Systems Research, Modipuram, Meerut from
Souce: Binning, A. S., B. S. Pathak,and Panesar (1983).
Table 1 Energy conversion factors used
Power source, units Equivalent energy, MJ Treat. Rice
Herbicides Manual TotalHuman labour (adult), man-hour 1.96 a. Stale seedbedDiesel, L 56.31 T1 0.0 689.9 689.9Chemical fertilizers T2 480.0 125.4 605.4Nitrogen (N), kg 60.60 T3 0.0 376.3 376.3Phosphorus (P), kg 11.10 T4 480.0 125.4 605.4Potash (K), kg 6.70 T5 0.0 0.0 0.0
Plant protection (superior) b. Traditional seedbedGranular chemical, kg 120 T1 0.0 925.1 925.1Liquid chemical, mL 0.102 T2 480.0 203.8 683.8
Crop produce (grain) T3 0.0 439.0 439.0Rice, kg 14.70 T4 480.0 203.8 683.8Wheat, kg 15.70 T5 0.0 0.0 0.0
Table 2 Energy used in different weed management practice in rice-
wheat cropping system, MJ/ha
T1: Hand weeding twice, T2: Herbicides + hand weeding once, T3: Criss cross sowing + hand weeding once, T4: Criss cross sowing + herbicides + hand weeding once, T5: Unweeded check

VOL.39 NO.2 2008 AGRICULTURAL MECHANIZATION IN ASIA, AFRICA, AND LATIN AMERICA 41
2000-01 to 2003-04. The site is located at 29.40º N latitude, 77.4º E longitude and at 237 m above mean sea level, and categorized as a hot-dry semi-arid subtropical climate with summers and severe cold win-ters. The mean annual rainfall of the site is about 837 mm and evapo-transpiration of 1,540 mm. The chemical and physical properties of soil are given as sandy loam con-sisting of 63.7, 19.1 and 17.2 percent sand, silt and clay, respectively. The soil pH, electrical conductivity, organic carbon, available P, avail-able K, were 8.20, 0.47 dS/m, 0.37 percent 3.4 mg/kg and 35 mg/kg of soil.
Experimental DetailsThe experiment was designed
to assess the energy use, out put energy and net return energy of different weed management prac-tices adopted for rice crop. The rice (Oryza sativa L. cv. Pant-12) was grown in two seedbed preparation practices (i.e. stale seedbed and traditional seedbed) in main plot. Each main plot was divided into five
sub-plots according weed manage-ment practices treatments, viz. hand weeding twice, herbicides + one hand weeding, criss-cross sowing + one hand weeding, criss-cross sowing + herbicides + one hand weeding, unweeded check. The crop was sown in line with 20 cm spac-ing at a seed rate of 60 kg/ha. In case of criss-cross sowing, the seed rate and line spacing in each side was the same. The treatments were replicated thrice in split-plot design. Each main plot was 12.5 m long by 6 m wide, and equally divided into 5 sub-plots using 6 m long by 2.5 m wide. The net area under experi-ment was 0.045 ha (consisting of 30 plots having 6 × 2.5 m size each). The data were analyzed in split-plot design as suggested by Panse and Sukhatme (1967).
The stale seedbed preparation for rice crop, after harvesting wheat in April, was irrigated once, two cross harrowing + one cultivator + one planking were performed, thereaf-ter, the field was left for germination of weed seeds for about 15 days. After germination of weed seeds,
the field was finally prepared by re-sorting by one shallow plowing with cultivator followed by planking. Whereas, in a traditional seed bed, at sowing time two harrowing + two cultivator + one planking were done to prepare a well pulverized seedbed. A uniform dose of fertil-izer was applied at 37 kg N, 60 kg P and 60 kg K plus 20 kg Zn per ha as a basal dose and rest nitrogen in two spilts of 56.5 kg N doses at 25 days after sowing (DAS) and at 55-60 DAS was top dressed uniformly.
Weed management pract ices. Weeds were controlled with appro-priate herbicides as required in rice crop and hand weeding according the treatments. Herbicide for pre-emergence weeds control included: (per ha) 4 L pendimethalin (Pen-dimethalin 35 % EC) was sprayed after 1-2 days after sowing (DAS) for rice. The first and second hand weeding was done at 25-30 DAS and 50-55 DAS crops according treatment.
Method of Energy CalculationEvaluation of manual energy in-
put: Manual energy was estimated based on conversion coeff icient given in Table 1. The total manual labour was recorded in each opera-tion with working hours which were converted into man-hours. All other factors affecting manual energy were neglected. Thus for a worker, the manual energy expended was determined by:
Em = 1.96 Nm Tm MJWhere, Nm = Number of labour
spent on a farm activityTm = Useful time spent by a la-
bour on a farm activity, hEvaluation of mechanical en-
ergy use: Mechanical energy input was evaluated by quantifying the amount of diesel fuel consumed during the tillage, sowing, threshing and winnowing, etc. The total time spent was also recorded. Diesel con-sumption was also recorded during irrigation for the irrigation pump. Hence, for every farm operation, the
Energy source T1 T2 T3 T4 T5 Meana. Stale seedbedSeed 882.0 882.0 882.0 882.0 882.0 882.0Herbicides 0.0 480.0 0.0 480.0 0.0 192.0Fertilizers 10,158.0 10,158.0 10,158.0 10,158.0 10,158.0 10,158.0Insecticides & pesticides 511.4 511.4 511.4 511.4 511.4 511.4Diesel (Irrigation) 15,203.7 15,203.7 15,203.7 15,203.7 15,203.7 15,203.7Diesel (Machinery) 3,660.2 3,660.2 3,998.0 3,998.0 3,660.2 3,795.3Human labour 1,505.3 940.8 1,191.7 940.8 815.4 1,078.8
Total energy 31,920.5 31,836.0 31,944.8 32,173.9 31,230.6 31,821.2b. Traditional seedbedSeed 882.0 882.0 882.0 882.0 882.0 882.0Herbicides 0.0 480.0 0.0 480.0 0.0 192.0Fertilizers 10,158.0 10,158.0 10,158.0 10,158.0 10,158.0 10,158.0Insecticides & pesticides 511.4 511.4 511.4 511.4 511.4 511.4Diesel (Irrigation) 15,203.7 15,203.7 15,203.7 15,203.7 15,203.7 15,203.7Diesel (Machinery) 3,660.2 3,660.2 3,998.0 3,998.0 3,660.2 3,795.3Human labour 1,740.5 1,019.2 1,254.4 1,019.2 815.4 1,169.7
Total energy 32,155.7 31,914.4 32,007.5 32,252.3 31,230.6 31,912.1
Table 3 Level and pattern of energy use in different weedmanagement practices adopted in rice crop, MJ/ha
T1: Hand weeding twice, T2: Herbicides + hand weeding once, T3: Criss cross sowing + hand weeding once, T4: Criss cross sowing + herbicides + hand weeding once, T5: Unweeded check

AGRICULTURAL MECHANIZATION IN ASIA, AFRICA, AND LATIN AMERICA 2008 VOL.39 NO.242
diesel fuel energy input was deter-mined by:
Ef = 56.31 D MJWhere, 56.31 = unit energy value
of diesel, MJL-1
D = amount of diesel consumed, L
Other inputs: The inputs used for different operations under rice crop sequences were used for calculating energetics of systems. The energy use inputs were also calculated based on input-wise given source during crop period, namely, (i) seed, (ii) chemical fertilizers, (iii) herbi-cides, (iv) plant protection (insecti-cides/pesticides), (v) diesel (pump), (vi) diesel (machinery), (vii) human labour etc. The different field opera-tions performed for completion of each activity in the experiment were measured in terms of time taken for human/machinery, fuel consump-tion and expressed as energy input in megajoules (MJ) using corre-sponding constants as detailed in Table 1. The farm production (i.e. grain yield) was also converted in terms of energy output (MJ) using four years average yield under rice-wheat crops and units of energy as available (Gopalan et al., 1978).
ResultsEnergy Utilization Pattern in Weed Management Practices
Total amount of energy use in weed management was varied from 1.18 to 2.88 percent of the total input energy. The traditional seed-bed used higher energy for weed management, which varied from 11.55 to 25.41 percent as compared to stale seedbed in all treatments. It was due to the effect of tillage on weed germination. Among the five weed treatments, the hand weed-ing twice was found to be more energy consuming (i.e. 689.9MJ/ha in stale seed bed and 925.1 MJ/ha in traditional seedbed) than other treatments because it required a higher number of labours for twice
weeding. This was followed by her-bicides + hand weeding once as well as criss-cross sowing + herbicides + hand weeding once which was 605.4 MJ/ha in stale seedbed and 683.8 MJ/ha in traditional seedbed. The least energy was consumed by criss-cross sowing + hand weeding once which was 376.3 MJ/ha in stale seedbed whereas 439.0 in traditional seedbed. For unweeded treatment, there was no weed management practices adopted with view of com-parison of other treatments (Table 2).
For comparison of different weed management practices adopted, the manual labour for one hand weed-ing consumed 376.3 MJ/ha in stale seedbed and 439.0 MJ/ha in tradi-tional seedbed, whereas, after herbi-cides were used, one hand weeding expended only 125.4 MJ/ha energy. This was due to higher weed density in the case of no use of herbicides plots and it was also higher in tra-ditional seedbed. In stale seedbed, the seedbed was prepared in such way to maximize germinated weeds were destroyed before sowing of rice. This was one of the reasons for lower energy consumption for weed management in stale bed sowing rice than traditional bed. The herbi-cides consumed 480.0 MJ/ha energy for one spraying for controlling weeds. No weed management prac-tices were adopted in the unweeded check treatment.
Input-Wise Energy Utilization Pattern
Energy inputs expressed in abso-lute terms (MJ/ha) for seed, fertil-izer, insecticides and pesticides, irrigation were the same for both methods of seedbed preparations. This was because of the same seed rate, fertilizer, insecticides and pes-ticides and number of irrigations for all thirty plots. However, when ex-pressed as total input energy used in rice, this varied from 31,230.6 MJ/ha to 32,252.3 MJ/ha in for treat-ments unweeded check and criss-cross + herbicides + hand weeding, respectively (Table 3). The variation in total input energy was due to dif-ferent weed management practices adopted, machinery and herbicides and human labour.
For energy use in human labour, the maximum energy use was in hand weeding twice (i.e. 1,505.3 MJ/ha in stale seedbed and 1,740.5 MJ/ha in traditional seedbed) fol-lowed by criss-cross sowing + hand weeding once (i.e. 1,191.7 MJ/ha stale seedbed and 1,254.4 MJ/ha in traditional), criss-cross sowing + herbicides +hand weeding once (i.e. 940.8 MJ/ha in stale seedbed and 1,019.2 MJ/ha traditional seedbed) and herbicides +hand weeding once (i.e. 940.8 MJ/ha in stale seedbed and 1,019.2 MJ/ha traditional seed-bed). The human labour energy shown was consumed not only in weeding but also other operations performed in the system. The un-
T1 T2 T3 T4 T5
a. Stale seedbedInput energy, MJ/ha 31,920.5 31,836.0 31,944.8 32,173.9 31,230.6Output energy, MJ/ha 72,727.1 79,625.0 38,159.7 83,217.4 14,340.3Output-input ration 2.3 2.5 1.2 2.6 0.5
b. Traditional seedbedInput energy, MJ/ha 32,155.7 31,914.4 32,007.5 32,252.3 31,230.6Output energy, MJ/ha 69,747.2 76,761.8 33,541.7 76,616.0 82,63.9Output-input ratio 2.2 2.4 1.0 2.4 0.3
Table 4 Input and output energy of different weedmanagement practice in aerobic rice
T1: Hand weeding twice, T2: Herbicides + hand weeding once, T3: Criss cross sowing + hand weeding once, T4: Criss cross sowing + herbicides + hand weeding once, T5: Unweeded check

VOL.39 NO.2 2008 AGRICULTURAL MECHANIZATION IN ASIA, AFRICA, AND LATIN AMERICA 43
weeded check consumed 815.4 MJ/ha as human labour energy in the both seedbed preparation which was used in different operations except weeding. The herbicides consumed about 480.0 MJ/ha energy in all treatments in both seedbeds. The energy used in machinery was found higher in criss-cross sowing (i.e. 3,998.0 MJ/ha) than normal sowing (i.e. 3,660.2 MJ/ha). It was because of higher machinery use during criss-cross sowing methods.
All other inputs used in the crop are the same in all treatments. The input energy in ir r igation con-sumed was highest at 15,203.7 MJ/ha followed by 10,158.0 MJ/ha for chemical fertilizer, from 3,660.2 to 3,998.0 MJ/ha for machinery and 511.4 MJ/ha for insecticides and pesticides. The energy use by irriga-tion represented the major part of total energy use, accounting about 47.6 per cent followed by fertilizers, about 32 percent in all treatments (Fig. 1). Machinery consumed from 11.5 to 12.5 percent of total input energy of the system (Chaudhary et al., 2004 a and b).
Output Energy PatternThe maximum output energy
was obtained in treatment criss-cross sowing + herbicides + hand weeding once (i.e. 83,217.4 MJ/ha in stale seedbed and 76,616.0 MJ/ha in traditional seedbed) and almost equal output energy was obtained by herbicides + hand weeding once (i.e. 79,625.0 MJ/ha in stale seedbed and 76,761.8 MJ/ha in traditional seedbed) as detailed in Table 4. Hand weeding twice ranked third in obtaining output energy as 72,727.1 MJ/ha in stale seedbed and 69,747.2 MJ/ha in traditional seedbed. This was followed by criss-cross sowing + hand weeding once, which varied from 38,159.7 MJ/ha in stale seed-bed to 33,541.7 MJ/ha in traditional seedbed. The unweeded check treat-ment produced the least amount of output energy which was 14,340.3 MJ/ha in stale seedbed and 8,263.9 MJ/ha in traditional seedbed (Table 4 and Fig. 2). The criss-cross sow-ing + herbicides + hand weeding once gave from 83 to 89, 55, from 9 to 13 and 4 percent higher output energy as compared with unweeded, criss-cross sowing + hand weed-ing once, hand weeding twice and herbicides + hand weeding once, respectively.
The output-input ratio in the both
cases of treatments as criss-cross sowing + herbicides + hand weeding once and herbicides + hand weeding once shown almost equal as 2.6 and 2.5, respectively. Whereas, the least output-input ratio was obtained by unweeded plot (i.e. 0.5). The criss-cross sowing + herbicides + hand weeding once was the most efficient weed management t reatment in terms of energy output. The more efficient treatment was due to con-suming low input energy and giving higher output energy.
Net Return Energy PatternThe net return energy was signifi-
cant with respect to weed manage-ment practices whereas seedbed preparation was non significant. The treatment criss-cross sowing + herbicides + hand weeding once (i.e. 47,703.6 MJ/ha) was the statisti-cally at par with herbicides + hand weeding once (i.e. 46,318.2 MJ/ha) which were significantly higher than other treatments (Table 5). This was followed by hand weeding twice (i.e. 39,199.1 MJ/ha), which was significantly higher than criss-cross sowing + hand weeding once (i.e. 3,874.6 MJ/ha).
When comparison was made be-tween weed management practices in each seedbed preparation of in-put and output energy, among five treatments, the net energy return of the system was found to be signifi-cantly high in criss-cross sowing + herbicides + hand weeding once (i.e. 51,043.5 MJ/ha in stale seedbed and 44,363.7 MJ/ha in traditional seedbed) than other treatments and which was statistically at par with treatment herbicides + hand weed-ing once (i.e. 47,789.0 MJ/ha in stale seedbed and 44,847.4 MJ/ha in tra-ditional seedbed) as given in Table 5. This was followed by hand weed-ing twice (i.e. 40,806.6 MJ/ha in stale seedbed and 37,591.5 MJ/ha in traditional seedbed) and criss-cross sowing + hand weeding once (i.e. 6,214.9 MJ/ha in stale seedbed and 1,534.2 MJ/ha in traditional seed-
Fig. 1 Average input energy consumed in different inputsin aerobic rice crop in different seedbed
(b) Traditional seedbed(a) Stale seedbed

AGRICULTURAL MECHANIZATION IN ASIA, AFRICA, AND LATIN AMERICA 2008 VOL.39 NO.244
bed) which had significant differ-ence in same seedbed preparation.
The net return energy in criss-cross sowing + herbicides + hand weeding once was from 86 to 95 percent higher than cr iss-cross sowing + hand weeding once, from 15 to 20 percent higher than hand weeding twice and 6 percent higher than herbicides + hand weeding once. However, the unweeded treat-ment gave negative net return ener-gy, which means the output energy was less than input energy (Fig. 2). So, without weed management, practices adopted will not able to get output energy.
DiscussionsIt is seen from data (Table 2) that
the hand weeding expended more energy than herbicides manage-ments. Herbicides plus one hand weeding management spent some-what less energy than hand weed-ing twice and it was the best weed management practice for aerobic rice crop. Hand weeding twice and herbicides plus one hand weeding expended almost same amount of input energy. Weeding by manual labour was a very tedious and dif-ficult job and due to shortage of labour at weeding time because of
industrial employment. This was one reason for selecting chemical for weeds control. Pendimethalin was used as pre-emergence herbi-cide to reduce the germination of weeds and resulted in less energy (i.e. 125.4 in stale seedbed and 203.8 MJ/ha in traditional seedbed) consumed in one hand weeding as compared to hand weeding twice. For criss-cross sowing of rice plus one hand weeding the energy was halved as compared to other treat-ments (Table 2). In this method, the rice was sown in criss-cross man-ner, which resulted in less density of weeds and caused lower energy to be used in one hand weeding (i.e. 376.3 in stale seedbed and 439.0 MJ/ha in traditional seedbed). After herbicide use, weed population was reduced and resulted in less energy spent for one hand weeding (i.e. 125.4 MJ/ha as compared to 376.3 MJ/ha which is almost three time higher). The criss-cross sowing + herbicides + one hand weeding was the best treatment for complete weed management.
In unweeded check, where there were no weed management practic-es, the weeds grew more vigorously and rapidly than rice growth, which caused suppressed rice growth. At the time of the second hand weed-ing, the whole rice crop was cov-
ered and ultimately resulted in only weeds being seen in the field. It is worthy to say that both herbicides plus one manual weeding is advis-able for both methods of sowing rice as stale and traditional seedbed.
The highest energy input for rice crop, with irrigation was from the diesel used in the irrigation pump (about 47.6 percent) (Table 3), and second highest energy input was from inorganic fertilizers, which had consumed about 32 percent. This was also found by Chaudhary et al. (2004 a and b). Energy use is the conversion of fossil fuels into diesel and fer tilizers which has higher conversion coefficient and was supported by Stout (1984). En-ergy inputs expressed in absolute terms (MJ/ha) for seed, fertilizer, insecticides and pesticides, irriga-tion were the same for both methods of seedbed preparations in all treat-ments except labour, machinery and herbicides.
Maximum output energy was found to be in criss-cross + herbi-cides + hand weeding once as well as herbicides + hand weeding once (Table 4). This was because of bet-ter management of weeds by both herbicides and manual labour. How-ever, hand weeding twice also gave good weed management but it was done by only two manual weeding.
Energy, thousand
-30-20-10
0102030405060708090
Conservation tillage
Conventional tillage
No-tillT5T4T3T2T1
Input energy (MJ/ha)Output energy (MJ/ha)Net return energy (MJ/ha)
Energy, thousand
-30-20-10
0102030405060708090
Conservation tillage
Conventional tillage
No-tillT5T4T3T2T1
Input energy (MJ/ha)Output energy (MJ/ha)Net return energy (MJ/ha)
(a) Stale seedbed (b) Traditional seedbed
Fig. 2 Input, output and net return energy pattern of different weed management practices in different seedbed
T1: Hand weeding twice, T2: Herbicides + hand weeding once, T3: Criss cross sowing + hand weeding once, T4: Criss cross sowing + herbicides + hand weeding once, T5: Unweeded check

VOL.39 NO.2 2008 AGRICULTURAL MECHANIZATION IN ASIA, AFRICA, AND LATIN AMERICA 45
It gave 9 to 13 percent lower output energy than the maximum gained energy because weeds were left dur-ing hand weeding. The criss-cross + hand weeding once gave 55 percent less output energy than the maxi-mum, i.e. criss-cross + herbicides + hand weeding once (Table 4). Hand weeding once was not sufficient to complete weed management for aer-obic rice. The unweeded treatment gave 83 to 89 percent less output en-ergy than the maximum. So, output results were totally dependent on weed management practices, which consumed only 1.38 percent of total input energy for the best weed man-agement treatment in the aerobic rice crop (Abu-Hamdes, 2003).
The net return energy obtained was statistically the same for criss-cross sowing + herbicides + hand weeding once and herbicides + hand weeding once in both seedbed prep-arations (Table 5). This was because of weed management was done by both as herbicide and manual labour which resulted higher yield and because there was little difference in input energy among different treatments. It is clear (Table 5) that criss-cross sowing + herbicides + hand weeding once produced about 95 percent higher net return energy than criss-cross sowing + hand weeding once. This was because of less weed management in case of one hand weeding. Also, output energy was about 55 percent higher in criss-cross sowing + herbicides + hand weeding than criss-cross sow-
ing + hand weeding once (Table 4).
ConclusionsIt may be concluded that the net
energy return of different weed management practices in aerobic rice can be quantified and stratified for sound planning of increasing productivity. In the present inves-tigation, among five weed manage-ment treatments, the criss-cross sowing + herbicides + hand weed-ing once as well as herbicides + hand weeding once gave the highest energy gained as compared to other treatments. Unweeded treatment cannot be used without weed man-agement.
REFERENCES
Abu-Hamdesh, N. H. 2003. Effect of weed control and tillage system on net returns from been and bar-ley production in Jordan. Cana-dian Biosystems Engineering, 45: 23-28.
Alam, A. 1986. Energy requirement of food production and utilization in the rural sector, Satus paper presented at second international symposium on food energy nexus. New Delhi Feb: 12-14.
Bhatnagar, D. K. and S. N. Sharma. 1975. Comparative study of dif-ferent methods of seeding on the yield of rice with and without weeding. Indian J. Agronomy, 20
(1): 58-59.Binning, A. S., B. S. Pathak, and
Panesar. 1983. The energy audit of crop production system research report, School of energy studies for agriculture, Panjab Agricul-tural University, Ludhiana, Panjab (India).
Bridges, T. C. and E. M. Smith. 1979. A method of determining the total energy input for agricul-tural practices. Transactions of the ASAE: 781-784.
Chaudhary, V. P., R. P. Mishra, and S. K. Sharma. 2004a. Energy Use and output assessment of differ-ent method of rice establishment. In Proc., National Seminar on Resource Management for Sus-tainable Agriculture (The Andhra Agricultural Journal), Bapatla (A.P.), 28-30 January, pp 571.
Chaudhary, V. P., R. P. Mishra, B. Gangwar, and S. K. Sharma. 2004b. Studies on energy input and output under rice-wheat and rice-potato-wheat cropping sys-tem. In Proc., XXXVIII Annual Convention of Indian Society of Agricultural Engineers (ISAE), Dapoli (Maharatra), India, 16-18 January, pp 132.
Chaudhary, V. P. and B. Gangwar. 2004. Energy use and output pat-tern under different cropping system. In Proc., National Sym-posium on Resource Conservation and Agricultural Productivity, PAU(Ludhiana), India, 22-25 No-vember, pp 489-490.
Chaudhary, V. P., K. S. Gangwar,
Hand weeding twice
Herbicides + hand weeding
once
Criss-cross sowing + hand weeding once
Criss-cross sowing +
herbicedes + hand weeding once
Unweeded Mean
Stale seedbed 40,806.6 47,789.0 6,214.9 51,043.5 -16,890.3 25,792.7Traditional seedbed 37,591.5 44,847.4 1,534.2 44,363.7 -22,966.7 21,074.0Mean 39,199.1 46,318.2 3,874.6 47,703.6 -19,928.5 23,433.4Main plot (Seedbed) 7,872.4Sub-plot (Weed management) 2,942.3Intreaction (1) 4,161.0Intreaction (2) 8,257.2
Table 5 Net return energy of different weed management practices in aerobic rice
Intraction (1): For comparing two weed management practice for same main plot, Intraction (2): For comparing two main plots at same or different weed management

AGRICULTURAL MECHANIZATION IN ASIA, AFRICA, AND LATIN AMERICA 2008 VOL.39 NO.246
and Sharma. 2004. Study on dynamics and comparision of different rice crop establishment S. K. methods. In Proc., Second National Symposium on Alterna-tive Farming Systems: Enhanced Income and Employment Genera-tion Options for Small and Mar-ginal Farmer, Meerut (U.P.), India, 16-18 September, pp 180-181.
Clark, S. J. and W. H. Johnson. 1975. Energy-cost budgets for grain sorghum tillage systems. Trans. of ASAE 18(6): 1057-1060.
Dhawan, K. C., V. K. Mittal, and J. P. Mittan. 1985. A survey analy-sis energy requirements for crop production in India. Proceedings of ISAE silver Jubilee celebration, Bhopal 1: 59-66.
Fluck, R. C. 1979. Energy produc-tivity: a measure of energy uti-lization in agricultural systems. Agricultural systems, 4(3): 29-37.
Gopalan, C., B. V. R. Sastri, and S. C. Balasubramaniam. 1978. Nutritive Value of Indian Foods, National Institute of Nutrition, ICMR, Hyderabad.
Heslop, L. C. and W. K. Bilanski. 1989. Productive worth of differ-ent tillage machinery across soil types. ASAE Paper No. 89-1615. St. Joseph, MI: ASAE.
Jayasuriya, S. and E. C. Pr ice. 1979. Economic evaluation of dry seeded rice: some thought on risk aspect. Paper Presented at Agric. Econ. Cropping System Seminar, IRRI, Philippines.
Lal, B., D. S. Rajput, M. B. Tam-hankar, I. Agarwal, and M. S.
Sharma. 2003. Energy use and output assessment of food-forage production systems. J. Agronomy & Crop Science, 189: 57-62.
Mittal, V. K., R. S. Prihar, and K. S. Sodhi. 1984. Energy research in agriculture in India. Proceedings of the XXI Annual Convention of Indian Society of Agricultural Engineers (ISAE: 5-7).
Ouellette-Babin, D. 1982. Energy input and output of grain corn and soybean production. Factsheet, Agdex 100/708. Toronto, ON: On-tario Ministry of Agriculture and Food.
Pandey, S. and L. Velasco. 1999. Economic of direct seeding in Asia: Patterns of adoption and research priporities. Inst. Rice Reasearch Note, 24 (2): 6-11.
Panse and Sukhatme. 1967. Statis-tical Methods for Agricultural Research Workers, 2nd Edition. ICAR, New Delhi.
Pimentel, D. 1980. Energy inputs in production agriculture. In: R.C. Fluck (Ed), Energy in Farm Pro-duction, Elsevier, Amsterdam, pp. 13-29.
Saini, A. S., K. O. Bhrona, K. P. Pant, and D. R. Thakur. 1998. En-ergy management for sustainabil-ity of hill agriculture: a case study of Himachal Pradesh. Indian J. Agric. Econ 53: 223-239.
Saxena, Amal and R. D. Vaishya. 1993. Effect of methods of weed control on the yield of up land drilled rice and associated weeds. Proc. International symposium. Indian Society of Weed sciences.
Hissar, November 18-20. vol. III Singh, L. R. and B. Singh. 1976.
Level and pattern of the energy consumption in an agriculturally advanced area of Uttar Pradesh. Indian J. Agric. Econ 32: 157-165.
Stout, B. A. 1990. Handbook of Energy for World Agriculture. El-sevier Applied Science, London.
Swanton, C. J., S. D. Murphy, D. J. Hume, and D. R. Clements. 1996. Recent improvements in the ener-gy efficiency of agriculture: Case studies from Ontario, Canada. Agricultural Systems 52: 399-418.
Umar, B. 2003. Comparison of Man-ual and Manual-cum-Mechanical Energy Uses in Groundnut Pro-duction in a Semi-arid Environ-ment. Agricultural Engineering International: The CIGR Journal of Scientific Research and Devel-opment, (V): 1-11.
Vinten-Johansen, C., L. E. Lanyon, and K. Q. Stephenson. 1990. Re-ducing energy inputs to a simu-lated dairy farm. Agriculture, Ecosystems and Environment, 31: 225-242.
Zentner, R. P., D. W. Campbell, C. A. Campbell, and D. W. Read. 1984. Energy considerations of crop rotations in southwestern Saskatchewan. Canadian Agricul-tural Engineering 26(1): 25-29.
Zucchetto, J. and G. Bickle. 1984. Energy and nutrient analyses of a dairy farm in Central Pennsylva-nia. Energy in Agriculture, 3(1): 29-47.
■■
VOL.39 NO.2 2008 AGRICULTURAL MECHANIZATION IN ASIA, AFRICA, AND LATIN AMERICA 47
Effect of Selected Parameters on the Performance of a Semi-automatic Vegetable Transplanter
byS. K. SatpathyLecture of Agricultural Engineering,SCR Institute of Engg. and Technology,Chaudhary Charan Singh University,Meerut - 250 [email protected]
I. K. GargSr. Res. Engineer and Head (Retd.)Dept. of Farm Power and Machinery,Panjab Agricultural University,Ludhiana - 141 [email protected]
AbstractStudies were conducted on a two-
row semi-automatic vegetable trans-planter to assess its performance at different speeds, soil moistures and seedlings ages with respect to plants missing, planting angle, planting depth, plants in lying down position and plant mortality for two vegetable crops viz. tomato and chilli. Best transplanting results were obtained at 10 percent soil moisture content with 5-week seedlings in tomato and 17 to 19 weeks seedlings in chilli crop. The machine could be operated at 1.0 km/h and 1.2 km/h speed with missing of 3 to 4 percent. Labour and time sav-ing of about 70 to 75 percent and 75 to 78 percent was obtained with the machine over manual transplanting.
IntroductionIndia is the second largest pro-
ducer of vegetables in the world next to China with a production of 90.8 million tones from an area of 6.0 million hectares. However, in India, transplanting of vegetable seedlings is done manually allover the coun-try, as no machine is yet available for this work. Transplanting of seed-lings manually is very tiresome and labour consuming as the operation is done in a bending posture. High
labour requirement and shortage of labour during peak transplanting season causes delay in transplanting and affects timely operation.
In developed countries like USA, China, Holland, Japan and Canada, transplanting of vegetable seedlings is done with mechanical transplant-ers. Transplanters used for bare root seedlings mostly have finger type metering mechanism. Many research workers have reported the develop-ment of semiautomatic transplanters with multiple loading stations fea-tures, which significantly increased the operator’s plant loading capacity and reduced plants missing at higher speeds (Suggs, 1979; Dooley, 1983; Hsieh 1989; Way et al., 1987). How-ever, no such commercial transplant-er is available in the market (Anony-mous b 2002). The tendency of op-erators to commit errors in feeding the seedlings in a repetitive loading operation increased in an exponential manner with the increase in speed and the operators tend to commit er-rors even at very slow feeding rate of 45 plant/min (Splinter, W. E. et al., 1968). With two operators feeding seedlings per row missing reduced from 10.6 to 3.1 percent at a feeding rate of 68 plant/min; however, inter-ference between the operators while feeding reduced the potential feeding rate (Suggs, 1979). Hernandez et al. (1996) evaluated a mechanical trans-
planter in loam soil at moisture con-tent of 18-30 percent with cabbage seedlings. Results showed that out of the total seedlings transplanted, 18.4 percent remained well placed, 37.1 percent remained inclined, and 44 percent remained unplanted. The low transplanting quality was attributed to the high soil moisture content.
In India, some attempts have been made in the recent years to develop semi-automatic vegetable transplant-ers for adoption under our conditions. Chaudhari et al. (2001) evaluated two imported models of vegetable trans-planters and reported that the import-ed machines were very costly, had high power requirements and during transplanting plants were found in lying down positions where soil was moist or seedlings were small. Garg et al. (2002) reported the development and evaluation of a single row semi-automatic transplanter with cone type metering mechanism. The cost of transplanting with the machine was higher than manual transplanting due to low capacity of the machine. It also required a special type of seedlings with soil on roots. Therefore, a two-row semi-automatic transplanter was developed with finger type metering and planting mechanism to suit tradi-tional bare root seedlings. However, optimum soil moisture, seedling age and speed at which transplanting should be done to have better ma-

AGRICULTURAL MECHANIZATION IN ASIA, AFRICA, AND LATIN AMERICA 2008 VOL.39 NO.248
chine performance was not known. Therefore, research studies were conducted to study the effect of these parameters on the performance of the semi-automatic vegetable transplant-er and compare with the traditional system of manual transplanting.
Materials and MethodsBrief Description of the Machine
The two row vegetable transplant-er used in the study consisted of a frame, two lugged wheels, seedling trays, seat for the operators, furrow openers, compaction wheels, finger guide tunnel, f inger type meter-ing mechanism and a water tank. Picking fingers had spring mounted rubber flappers, which opened be-fore passing through the tunnel and closed during its passage. Again the flappers opened at the bottom end of the tunnel to release the seedlings in a furrow. The inclined wheels com-pacted the soil around the seedlings. Power from the ground wheel shaft was supplied to the planting mecha-nism through chain and sprockets. The plant spacing obtained with the machine was 30 cm but provi-sion was there to change the plant spacing by changing the sprockets or number of fingers. Provision was made to apply a small quantity of water to the plants soon after trans-planting by the watering system. A furrow shaper was provided to maintain the shape of the channel between the two transplanting beds, which facilitates uniform f low of water during subsequent irrigation. Stationary view of the machine is shown in Fig. 1 showing different components and a brief specification of the machine is given in Table 1.
Evaluation ProcedureInitially the machine was calibrated
in the laboratory for plants missing at different machine travel speed with both one and two operators feed-ing seedlings and the proper speed of operation was selected. Then the
machine was evaluated in the field at three levels of soil moisture content of 14 percent, 10 percent and 6 per-cent and three levels of seedling age of 4, 5 and 6 weeks for tomato crop and 15, 17, and 19 weeks for chilli crop as per recommended agronomic practice [2]. The field experiments were planned with a split-plot design with soil moisture content as the main factor and seedling age as the sub-main factor with three replications of each factor combination.
Calibration of the Machine in Laboratory
The laboratory calibration set up consisted of a 5 hp electric motor, a speed reduction gearbox and a belt and pulley type variable speed drive (Fig. 2). The machine travel speed was varied by varying the rpm of the of the ground wheel shaft by changing pulleys or adjustments in the variable speed drive. The op-erator was given fifty seedlings of 15-20 cm length for feeding in to the picking forks. For chilli crop, alternate fingers were removed so as to double the plant spacing as chilly seedlings are transplanted at plant spacing double that of the tomato seedlings. The operators were given
fifty seedlings to feed in to the fin-gers in each experiment and miss-ing was noted. Doubles were almost negligible. Therefore, percentage plant missing was then calculated by using the following formula.
Plant missing (percent) = M / (50 + M) × 100
Where,M = Number of missing50 + M = Total number of fingers
that passed before the operator while feeding the 50 seedlings
Field EvaluationNursery of tomato and chilli crops
was grown on raised beds in the tra-ditional method as per recommend-ed agronomic practice (Anonymous a, 2002). Seedling age was varied by sowing in nursery at nine differ-ent dates. The detail of the general seedling characteristics is presented in Table 2. The field was irrigated and prepared at 16-18 percent soil moisture content and then periodical checking of soil samples was done to attain the desired level of soil moisture. Transplanting was first done at 14 percent moisture content. The field was prepared by two tiller operations followed by two plank-ing. Transplanting beds were made
Particulars SpecificationsGeneralNo. of rows TwoRow spacing, cm 67Plant spacing, cm 30, can be adjested by changing sprockets or no. of fingersPower source 35 hp tractorOver all dimensions, cm 185 × 170 × 120 (L × W × H)
Metering mechanismType Finger typePower transmission From lugged ground wheel by chain and sprocket driveNo. of fingers/row 10
Furrow opener Runner type with depth adjustmentsSoil compacting unit at 15º with verticalWatering systemsTank capacity, liters 140Water flow regulation Guide valve providedWatering arrangement Two showers fitted on a iron pipe
Furrow shaperDimensions, cm 38 × 38 × 17 (L × W × H)Furrow cross-section Trapezoidal
Table 1 Brief specifications of the vegetable transplanter
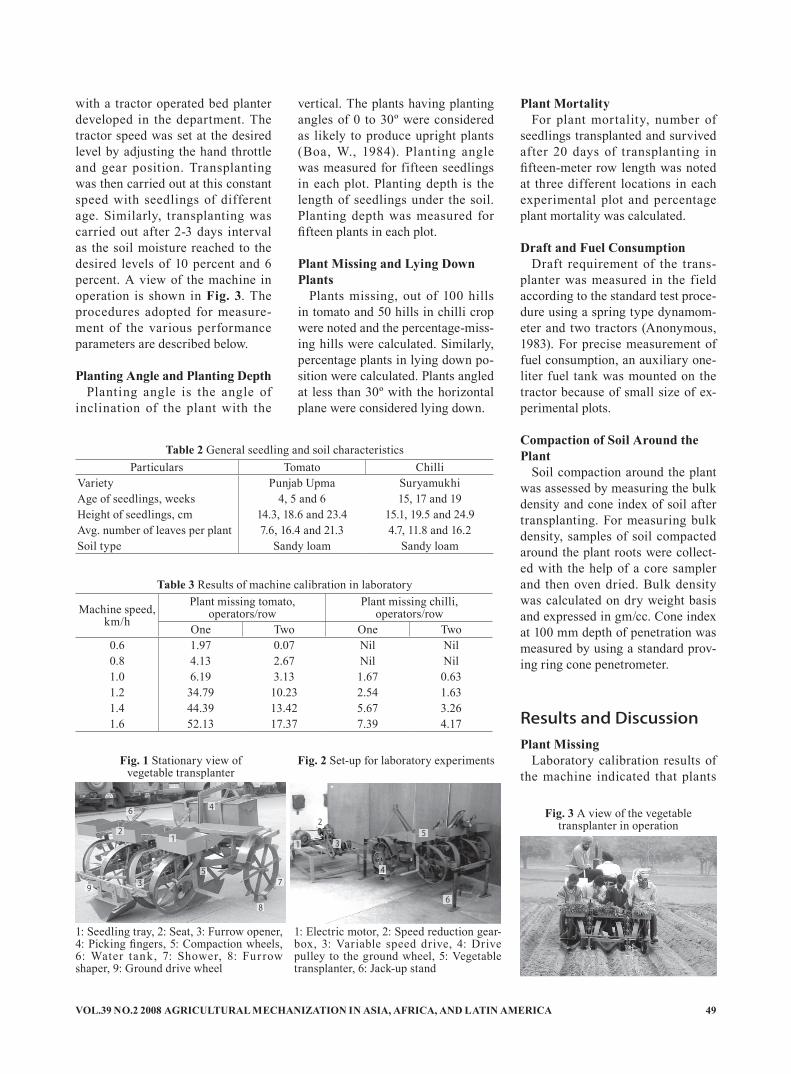
VOL.39 NO.2 2008 AGRICULTURAL MECHANIZATION IN ASIA, AFRICA, AND LATIN AMERICA 49
with a tractor operated bed planter developed in the department. The tractor speed was set at the desired level by adjusting the hand throttle and gear position. Transplanting was then carried out at this constant speed with seedlings of different age. Similarly, transplanting was carried out after 2-3 days interval as the soil moisture reached to the desired levels of 10 percent and 6 percent. A view of the machine in operation is shown in Fig. 3. The procedures adopted for measure-ment of the various performance parameters are described below.
Planting Angle and Planting DepthPlanting angle is the angle of
inclination of the plant with the
vertical. The plants having planting angles of 0 to 30º were considered as likely to produce upright plants (Boa, W., 1984). Planting angle was measured for fifteen seedlings in each plot. Planting depth is the length of seedlings under the soil. Planting depth was measured for fi fteen plants in each plot.
Plant Missing and Lying Down Plants
Plants missing, out of 100 hills in tomato and 50 hills in chilli crop were noted and the percentage-miss-ing hills were calculated. Similarly, percentage plants in lying down po-sition were calculated. Plants angled at less than 30º with the horizontal plane were considered lying down.
Plant MortalityFor plant mortality, number of
seedlings transplanted and survived after 20 days of transplanting in fi fteen-meter row length was noted at three different locations in each experimental plot and percentage plant mortality was calculated.
Draft and Fuel ConsumptionDraft requirement of the trans-
planter was measured in the field according to the standard test proce-dure using a spring type dynamom-eter and two tractors (Anonymous, 1983). For precise measurement of fuel consumption, an auxiliary one-liter fuel tank was mounted on the tractor because of small size of ex-perimental plots.
Compaction of Soil Around the Plant
Soil compaction around the plant was assessed by measuring the bulk density and cone index of soil after transplanting. For measuring bulk density, samples of soil compacted around the plant roots were collect-ed with the help of a core sampler and then oven dried. Bulk density was calculated on dry weight basis and expressed in gm/cc. Cone index at 100 mm depth of penetration was measured by using a standard prov-ing ring cone penetrometer.
Results and DiscussionPlant Missing
Laboratory calibration results of the machine indicated that plants
Particulars Tomato ChilliVariety Punjab Upma SuryamukhiAge of seedlings, weeks 4, 5 and 6 15, 17 and 19Height of seedlings, cm 14.3, 18.6 and 23.4 15.1, 19.5 and 24.9Avg. number of leaves per plant 7.6, 16.4 and 21.3 4.7, 11.8 and 16.2Soil type Sandy loam Sandy loam
Table 2 General seedling and soil characteristics
Machine speed, km/h
Plant missing tomato,operators/row
Plant missing chilli,operators/row
One Two One Two0.6 1.97 0.07 Nil Nil0.8 4.13 2.67 Nil Nil1.0 6.19 3.13 1.67 0.631.2 34.79 10.23 2.54 1.631.4 44.39 13.42 5.67 3.261.6 52.13 17.37 7.39 4.17
Table 3 Results of machine calibration in laboratory
Fig. 1 Stationary view ofvegetable transplanter
Fig. 2 Set-up for laboratory experiments
Fig. 3 A view of the vegetabletransplanter in operation
1: Seedling tray, 2: Seat, 3: Furrow opener, 4: Picking fi ngers, 5: Compaction wheels, 6: Water tank, 7: Shower, 8: Fur row shaper, 9: Ground drive wheel
1: Electric motor, 2: Speed reduction gear-box, 3: Variable speed drive, 4: Drive pulley to the ground wheel, 5: Vegetable transplanter, 6: Jack-up stand
12
3
4
57
8
9
6
1
2
3
4
5
6
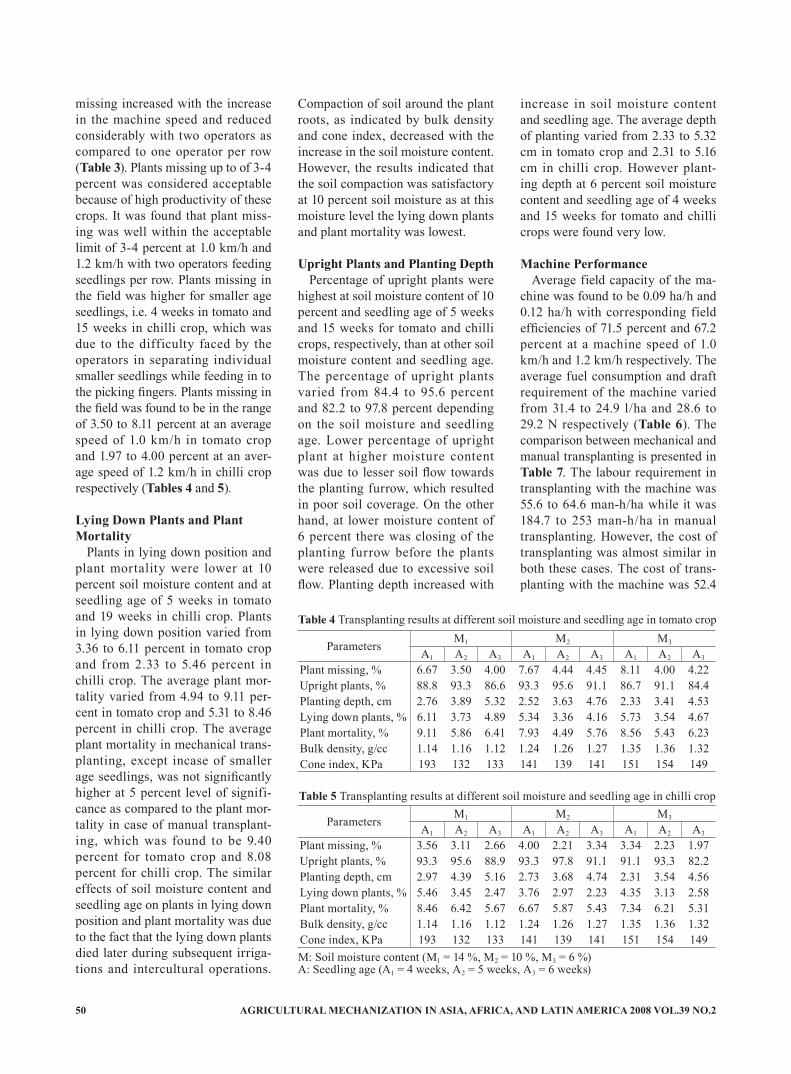
AGRICULTURAL MECHANIZATION IN ASIA, AFRICA, AND LATIN AMERICA 2008 VOL.39 NO.250
missing increased with the increase in the machine speed and reduced considerably with two operators as compared to one operator per row (Table 3). Plants missing up to of 3-4 percent was considered acceptable because of high productivity of these crops. It was found that plant miss-ing was well within the acceptable limit of 3-4 percent at 1.0 km/h and 1.2 km/h with two operators feeding seedlings per row. Plants missing in the field was higher for smaller age seedlings, i.e. 4 weeks in tomato and 15 weeks in chilli crop, which was due to the difficulty faced by the operators in separating individual smaller seedlings while feeding in to the picking fingers. Plants missing in the field was found to be in the range of 3.50 to 8.11 percent at an average speed of 1.0 km/h in tomato crop and 1.97 to 4.00 percent at an aver-age speed of 1.2 km/h in chilli crop respectively (Tables 4 and 5).
Lying Down Plants and Plant Mortality
Plants in lying down position and plant mortality were lower at 10 percent soil moisture content and at seedling age of 5 weeks in tomato and 19 weeks in chilli crop. Plants in lying down position varied from 3.36 to 6.11 percent in tomato crop and from 2.33 to 5.46 percent in chilli crop. The average plant mor-tality varied from 4.94 to 9.11 per-cent in tomato crop and 5.31 to 8.46 percent in chilli crop. The average plant mortality in mechanical trans-planting, except incase of smaller age seedlings, was not significantly higher at 5 percent level of signifi-cance as compared to the plant mor-tality in case of manual transplant-ing, which was found to be 9.40 percent for tomato crop and 8.08 percent for chilli crop. The similar effects of soil moisture content and seedling age on plants in lying down position and plant mortality was due to the fact that the lying down plants died later during subsequent irriga-tions and intercultural operations.
Compaction of soil around the plant roots, as indicated by bulk density and cone index, decreased with the increase in the soil moisture content. However, the results indicated that the soil compaction was satisfactory at 10 percent soil moisture as at this moisture level the lying down plants and plant mortality was lowest.
Upright Plants and Planting DepthPercentage of upright plants were
highest at soil moisture content of 10 percent and seedling age of 5 weeks and 15 weeks for tomato and chilli crops, respectively, than at other soil moisture content and seedling age. The percentage of upright plants varied from 84.4 to 95.6 percent and 82.2 to 97.8 percent depending on the soil moisture and seedling age. Lower percentage of upright plant at higher moisture content was due to lesser soil flow towards the planting furrow, which resulted in poor soil coverage. On the other hand, at lower moisture content of 6 percent there was closing of the planting furrow before the plants were released due to excessive soil flow. Planting depth increased with
increase in soil moisture content and seedling age. The average depth of planting varied from 2.33 to 5.32 cm in tomato crop and 2.31 to 5.16 cm in chilli crop. However plant-ing depth at 6 percent soil moisture content and seedling age of 4 weeks and 15 weeks for tomato and chilli crops were found very low.
Machine Performance Average field capacity of the ma-
chine was found to be 0.09 ha/h and 0.12 ha/h with corresponding field efficiencies of 71.5 percent and 67.2 percent at a machine speed of 1.0 km/h and 1.2 km/h respectively. The average fuel consumption and draft requirement of the machine varied from 31.4 to 24.9 l/ha and 28.6 to 29.2 N respectively (Table 6). The comparison between mechanical and manual transplanting is presented in Table 7. The labour requirement in transplanting with the machine was 55.6 to 64.6 man-h/ha while it was 184.7 to 253 man-h/ha in manual transplanting. However, the cost of transplanting was almost similar in both these cases. The cost of trans-planting with the machine was 52.4
Parameters M1 M2 M3
A1 A2 A3 A1 A2 A3 A1 A2 A3
Plant missing, % 6.67 3.50 4.00 7.67 4.44 4.45 8.11 4.00 4.22Upright plants, % 88.8 93.3 86.6 93.3 95.6 91.1 86.7 91.1 84.4Planting depth, cm 2.76 3.89 5.32 2.52 3.63 4.76 2.33 3.41 4.53Lying down plants, % 6.11 3.73 4.89 5.34 3.36 4.16 5.73 3.54 4.67Plant mortality, % 9.11 5.86 6.41 7.93 4.49 5.76 8.56 5.43 6.23Bulk density, g/cc 1.14 1.16 1.12 1.24 1.26 1.27 1.35 1.36 1.32Cone index, KPa 193 132 133 141 139 141 151 154 149
Table 4 Transplanting results at different soil moisture and seedling age in tomato crop
Parameters M1 M2 M3
A1 A2 A3 A1 A2 A3 A1 A2 A3
Plant missing, % 3.56 3.11 2.66 4.00 2.21 3.34 3.34 2.23 1.97Upright plants, % 93.3 95.6 88.9 93.3 97.8 91.1 91.1 93.3 82.2Planting depth, cm 2.97 4.39 5.16 2.73 3.68 4.74 2.31 3.54 4.56Lying down plants, % 5.46 3.45 2.47 3.76 2.97 2.23 4.35 3.13 2.58Plant mortality, % 8.46 6.42 5.67 6.67 5.87 5.43 7.34 6.21 5.31Bulk density, g/cc 1.14 1.16 1.12 1.24 1.26 1.27 1.35 1.36 1.32Cone index, KPa 193 132 133 141 139 141 151 154 149
Table 5 Transplanting results at different soil moisture and seedling age in chilli crop
M: Soil moisture content (M1 = 14 %, M2 = 10 %, M3 = 6 %)A: Seedling age (A1 = 4 weeks, A2 = 5 weeks, A3 = 6 weeks)
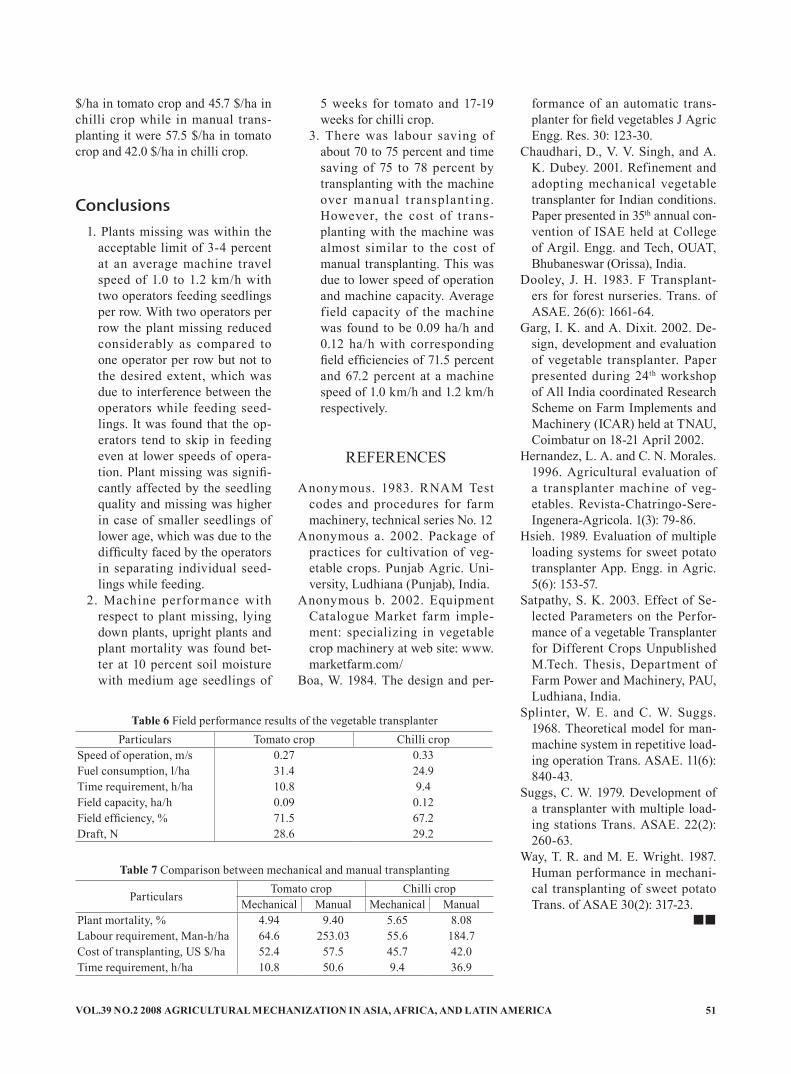
VOL.39 NO.2 2008 AGRICULTURAL MECHANIZATION IN ASIA, AFRICA, AND LATIN AMERICA 51
Particulars Tomato crop Chilli cropSpeed of operation, m/s 0.27 0.33Fuel consumption, l/ha 31.4 24.9Time requirement, h/ha 10.8 9.4Field capacity, ha/h 0.09 0.12Field efficiency, % 71.5 67.2Draft, N 28.6 29.2
Table 6 Field performance results of the vegetable transplanter
Particulars Tomato crop Chilli cropMechanical Manual Mechanical Manual
Plant mortality, % 4.94 9.40 5.65 8.08Labour requirement, Man-h/ha 64.6 253.03 55.6 184.7Cost of transplanting, US $/ha 52.4 57.5 45.7 42.0Time requirement, h/ha 10.8 50.6 9.4 36.9
Table 7 Comparison between mechanical and manual transplanting
$/ha in tomato crop and 45.7 $/ha in chilli crop while in manual trans-planting it were 57.5 $/ha in tomato crop and 42.0 $/ha in chilli crop.
Conclusions1. Plants missing was within the
acceptable limit of 3-4 percent at an average machine travel speed of 1.0 to 1.2 km/h with two operators feeding seedlings per row. With two operators per row the plant missing reduced considerably as compared to one operator per row but not to the desired extent, which was due to interference between the operators while feeding seed-lings. It was found that the op-erators tend to skip in feeding even at lower speeds of opera-tion. Plant missing was signifi-cantly affected by the seedling quality and missing was higher in case of smaller seedlings of lower age, which was due to the difficulty faced by the operators in separating individual seed-lings while feeding.
2. Machine performance with respect to plant missing, lying down plants, upright plants and plant mortality was found bet-ter at 10 percent soil moisture with medium age seedlings of
5 weeks for tomato and 17-19 weeks for chilli crop.
3. There was labour saving of about 70 to 75 percent and time saving of 75 to 78 percent by transplanting with the machine over manual t ransplant ing. However, the cost of t rans-planting with the machine was almost similar to the cost of manual transplanting. This was due to lower speed of operation and machine capacity. Average field capacity of the machine was found to be 0.09 ha/h and 0.12 ha/h with corresponding field efficiencies of 71.5 percent and 67.2 percent at a machine speed of 1.0 km/h and 1.2 km/h respectively.
REFERENCES
Anonymous. 1983. RNAM Test codes and procedures for farm machinery, technical series No. 12
Anonymous a. 2002. Package of practices for cultivation of veg-etable crops. Punjab Agric. Uni-versity, Ludhiana (Punjab), India.
Anonymous b. 2002. Equipment Catalogue Market farm imple-ment: specializing in vegetable crop machinery at web site: www. marketfarm.com/
Boa, W. 1984. The design and per-
formance of an automatic trans-planter for field vegetables J Agric Engg. Res. 30: 123-30.
Chaudhari, D., V. V. Singh, and A. K. Dubey. 2001. Refinement and adopting mechanical vegetable transplanter for Indian conditions. Paper presented in 35th annual con-vention of ISAE held at College of Argil. Engg. and Tech, OUAT, Bhubaneswar (Orissa), India.
Dooley, J. H. 1983. F Transplant-ers for forest nurseries. Trans. of ASAE. 26(6): 1661-64.
Garg, I. K. and A. Dixit. 2002. De-sign, development and evaluation of vegetable transplanter. Paper presented during 24th workshop of All India coordinated Research Scheme on Farm Implements and Machinery (ICAR) held at TNAU, Coimbatur on 18-21 April 2002.
Hernandez, L. A. and C. N. Morales. 1996. Agricultural evaluation of a transplanter machine of veg-etables. Revista-Chatringo-Sere-Ingenera-Agricola. 1(3): 79-86.
Hsieh. 1989. Evaluation of multiple loading systems for sweet potato transplanter App. Engg. in Agric. 5(6): 153-57.
Satpathy, S. K. 2003. Effect of Se-lected Parameters on the Perfor-mance of a vegetable Transplanter for Different Crops Unpublished M.Tech. Thesis, Department of Farm Power and Machinery, PAU, Ludhiana, India.
Splinter, W. E. and C. W. Suggs. 1968. Theoretical model for man-machine system in repetitive load-ing operation Trans. ASAE. 11(6): 840-43.
Suggs, C. W. 1979. Development of a transplanter with multiple load-ing stations Trans. ASAE. 22(2): 260-63.
Way, T. R. and M. E. Wright. 1987. Human performance in mechani-cal transplanting of sweet potato Trans. of ASAE 30(2): 317-23.
■■

AGRICULTURAL MECHANIZATION IN ASIA, AFRICA, AND LATIN AMERICA 2008 VOL.39 NO.252
Design and Construction of the Airtight FerrocementBin for On-farm Storage of Paddy
byT. B. AdhikarinayakeHead/Agriculture and Post Harvest Technology Depertment,National Engineering Research and Development Centre,Ekala, Ja-Ela, SRI LANKA
J. MüllerProfessor and HeadFarm Technology Group,Wageningen University,6708 PD, WargeningenTHE NETHERLANDS
J. OostdamSenior Research EngineerFarm Technology Group,Wageningen University,6708 PD, WargeningenTHE NETHERLANDS
AbstractA hermetically sealed ferroce-
ment bin was conceived by applica-tion of a systematic design process. It consisted of a frustum of a cone with a conical bottom supported by three vertical columns with V-shaped cross-section. A labour and material saving model was devel-oped to contain 2.5 tons of paddy. After detailed designing of the bin, it was constructed and the actual cost incurred was investigated be-fore introducing to the farmer who requires this type of bin for on-farm storage of paddy.
IntroductionProduction of paddy is highly
seasonal and consumption of rice is almost uniform throughout the year. Therefore, the excess paddy has to be preserved for use in the off-season. At present, paddy is stored either in bags or in bulk. The ‘Bissa’, an indigenous storage bin, made of clay and reinforced with wooden sticks was the typical outdoor stor-age method used in the past (Pali-pane, 1978), but these bins are not in use at present due to shortage of raw material as well as difficulties in handling of paddy. Storing in jute bags, woven polypropylene sacks
and wooden boxes are the most pop-ular methods to store paddy at farm level. Since the grain is exposed to insects, pests, rodents, birds and highly moist environment, damage to paddy during storage is unavoid-able.
Past studies showed that insects causes the major loss to the grain during storage, amounting up to over 6 % as storage loss (Sartaj and Ekanayake, 1991). Under tropical climatic conditions, where high temperature with high humidity is prevailing throughout the year, hermetically sealed storage has proven to be one of the most effec-tive storage systems for our country as reported by De Lima, 1990. Al-though modern and efficient storage systems are available at the com-mercial level, there is a necessity to have cost effective efficient storage system for on-farm storage in order to enable the farmers to keep their paddy and sell it in the off-season at a higher price.
Considering various storage sys-tems, an airtight ferrocement bin was conceptualised adopting a sys-tematic design process (Adhikari-nayake, 2005). The components of the paddy storage system are shown in Fig. 1. The storage bin is a frus-tum of a cone, joined to a conical hopper bottom and supported by three V-shaped vertical columns.
The conical bottom is provided with an outlet, having a threaded socket to enable complete discharge of the bin. A lid with a threaded socket is provided on the top to close the bin after filling in order to achieve complete air tightness. The upper cone is covered with a straw layer to protect the content from excessive heating over daytime and cooling during the night to prevent mois-ture migration and condensation of moisture. A metal cone is placed on the top of the bin with husk bags or straw to protect from rain.
Detailed designing of the storage bin is presented in the following sections.
Detailed Design ofthe Ferrocement BinCapacity and Basic Dimensions of the Bin
The average land area possessed by the farmer is one hectare (2.5 acres) and the average crop yield in paddy cultivation is 4.5 to 5 tons per hectare. In a season, a farmer gets 5 tons (250 bushels) of paddy under a favourable weather condition. Usu-ally, half of the harvested paddy is available for sale and the rest is stored for home consumption as well as to meet future needs by sell-ing some portion of it. Therefore, it is advisable to construct one stor-
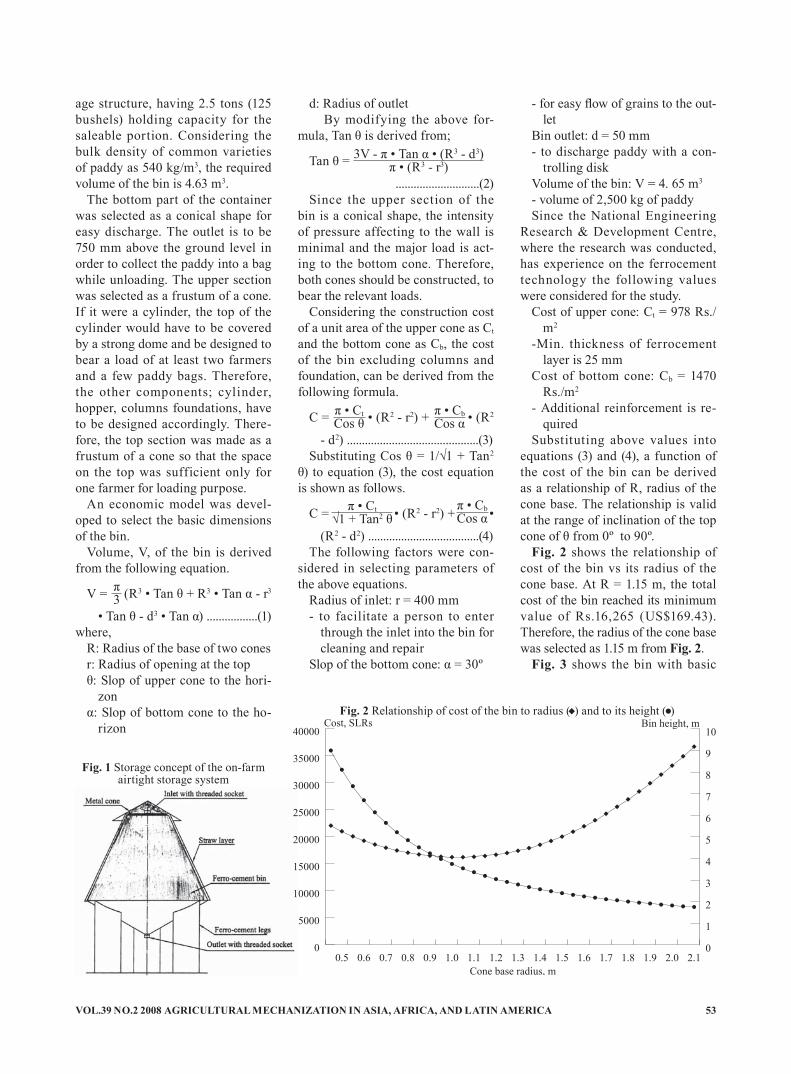
VOL.39 NO.2 2008 AGRICULTURAL MECHANIZATION IN ASIA, AFRICA, AND LATIN AMERICA 53
age structure, having 2.5 tons (125 bushels) holding capacity for the saleable portion. Considering the bulk density of common varieties of paddy as 540 kg/m3, the required volume of the bin is 4.63 m3.
The bottom part of the container was selected as a conical shape for easy discharge. The outlet is to be 750 mm above the ground level in order to collect the paddy into a bag while unloading. The upper section was selected as a frustum of a cone. If it were a cylinder, the top of the cylinder would have to be covered by a strong dome and be designed to bear a load of at least two farmers and a few paddy bags. Therefore, the other components; cylinder, hopper, columns foundations, have to be designed accordingly. There-fore, the top section was made as a frustum of a cone so that the space on the top was sufficient only for one farmer for loading purpose.
An economic model was devel-oped to select the basic dimensions of the bin.
Volume, V, of the bin is derived from the following equation.
V = (R3 • Tan θ + R3 • Tan α - r3
• Tan θ - d3 • Tan α) .................(1)where,
R: Radius of the base of two conesr: Radius of opening at the topθ: Slop of upper cone to the hori-
zonα: Slop of bottom cone to the ho-
rizon
d: Radius of outlet By modifying the above for-
mula, Tan θ is derived from;
Tan θ = ............................(2)Since the upper section of the
bin is a conical shape, the intensity of pressure affecting to the wall is minimal and the major load is act-ing to the bottom cone. Therefore, both cones should be constructed, to bear the relevant loads.
Considering the construction cost of a unit area of the upper cone as Ct and the bottom cone as Cb, the cost of the bin excluding columns and foundation, can be derived from the following formula.
C = • (R2 - r2) + • (R2
- d2) ............................................(3)Substituting Cos θ = 1/√1 + Tan2
θ) to equation (3), the cost equation is shown as follows.
C = • (R2 - r2) + •
(R2 - d2) .....................................(4)The following factors were con-
sidered in selecting parameters of the above equations.
Radius of inlet: r = 400 mm- to facilitate a person to enter
through the inlet into the bin for cleaning and repair
Slop of the bottom cone: α = 30º
- for easy flow of grains to the out-let
Bin outlet: d = 50 mm- to discharge paddy with a con-
trolling diskVolume of the bin: V = 4. 65 m3 - volume of 2,500 kg of paddySince the National Engineering
Research & Development Centre, where the research was conducted, has experience on the ferrocement technology the following values were considered for the study.
Cost of upper cone: Ct = 978 Rs./m2
-Min. thickness of ferrocement layer is 25 mm
Cost of bottom cone: Cb = 1470 Rs./m2
- Additional reinforcement is re-quired
Substituting above values into equations (3) and (4), a function of the cost of the bin can be derived as a relationship of R, radius of the cone base. The relationship is valid at the range of inclination of the top cone of θ from 0º to 90º.
Fig. 2 shows the relationship of cost of the bin vs its radius of the cone base. At R = 1.15 m, the total cost of the bin reached its minimum value of Rs.16,265 (US$169.43). Therefore, the radius of the cone base was selected as 1.15 m from Fig. 2.
Fig. 3 shows the bin with basic
Cost, SLRs
Input energy (MJ/ha)Output energy (MJ/ha)Net return energy (MJ/ha)
0
5000
10000
15000
20000
25000
30000
35000
40000
2.12.01.91.81.71.61.51.41.31.21.11.00.90.80.70.60.50
1
2
3
4
5
6
7
8
9
10Bin height, m
Cone base radius, m
Fig. 1 Storage concept of the on-farm airtight storage system
Fig. 2 Relationship of cost of the bin to radius (◆) and to its height (●)
π3
π • CtCos θ
3V - π • Tan α • (R3 - d3)π • (R3 - r3)
π • CbCos α
π • Ct√1 + Tan2 θ
π • CbCos α

AGRICULTURAL MECHANIZATION IN ASIA, AFRICA, AND LATIN AMERICA 2008 VOL.39 NO.254
dimensions.
Intensity of pressure to the in-clined wall
The pressure normal to the retain-ing surface wall can be expressed conveniently as a fraction of the equivalent fluid pressure (Reynolds and Steedman, 1981) which is ex-pressed as;
q = k • D • h • Sin2 β + gs • Cos β ............................(5)
where, D: the weight per unit volume of
the grain, kN/m3
h: the depth below the free sur-face, m
β: inclination of the wallgs: weight per unit area of the con-
tainer, kN/m2
k: measure of f luidity of the re-tained material and determined by;
k = [ ]2
•
a = √where,
γ: Angle of internal friction of material
β: Inclination of the wallϕ: Angle of slop of retained mate-
rialμ: Angle of friction between ma-
terial and wallRankin reported that the friction
between the wall and the material is usually neglected, resulting in a higher calculated normal pressure, which is safe.
If friction is neglected and level filling of the paddy in the bin is as-sumed, the factors k and a are sim-plified to following.
k = [ ]2
• Sec2β .....(6)
a = .....................................(7)
Intensity of Pressure to the Upper Cone: Considering D as 5.29 kN/m3, β as 65º, γ as 34º, h as 1.61 m and gs
as 0.89 N/m2, and substituting into the formulae (6) and (7), the values for a is 0.6170 and k is 0.1504. Then the intensity of pressure acting on the upper wall qu according to the equation (5) is 1.94 kN/m2.
Intensity of Pressure to the Bot-tom Cone: Similarly, considering the values for γ as 34º, β as 150º , h as 2.245 m and gs as 0.89 kN/m2, the values for factors a is 1.118 and k is 2.881. Substituting into equation (5), the intensity of pressure acting on the bottom cone is 9.33 kN/m2.
Selection of Mesh - Mortar RatioAccording to the studies of Tricka
et al., 1985, two layers of hexago-nal galvanized woven wire mesh of 0.48 mm diameter reinforced with 5 mm diameter mild steel bars is able to absorb up to 12 kN/m2 of live and dead load. The recom-mended cement-sand ratio is 1: 3 with a water-cement ratio of 0.45 at a thickness of 25 mm. Nimityong-skul and Koentjoro, 1985, reported
Fig. 4 Skeleton of upper cone and completed lower section of the bin
Fig. 3 Basic dimensions of the bin
Sin (β - γ)(α + 1) • Sin β
Cos μSin(μ + β) • Sin β
Sin(γ + μ) • Sin(γ - ϕ)Sin(μ + β) • Sin(β - ϕ)
Sin(β - γ)(α + 1) • Sin β
Sin γSin β

VOL.39 NO.2 2008 AGRICULTURAL MECHANIZATION IN ASIA, AFRICA, AND LATIN AMERICA 55
that the coefficient of permeability becomes higher when the thickness of the plastering mortar is increased. This phenomenon is contrary to that observed in concrete and is mainly caused by the manual plastering ap-plied in the construction of ferroce-ment. It is more difficult to obtain a proper compaction of thicker section than a thinner section during its ap-plication through the wire mesh. The coefficient of permeability of a wall with two layers of wire mesh is 0.701 × 10⁻⁹ mm/sec. For that reason, a sealant has to be applied to make the surface airtight to prevent gas exchange through the wall.
Design of ColumnsThe total dead load and imposed
load on the columns are as follows.
· Surface area of the upper cone is 8.3 m2 and bottom cone is 4.8 m2. Considering the thickness of cones as 25 mm and the den-sity of ferrocement with double hexagonal wire mesh and 5 mm MS rod skeleton structure as 35.11 kN/m3, the total weight of the both cones is 11.50 kN.
· Weight of the lid having diam-eter of 750 mm and thickness of 25 mm is 0.78 kN.
· Imposed load due to weight of paddy is 24.79 kN.
· Imposed load due to weight of a worker in feeding the bin is 0.64 kN.
The total designed load acting to the columns is 37.71 kN. Since there are three columns to support the structure, each column has to bear 12.57 kN.
Total stress of Δ enforced to one column is defined by:
Δ = +
where,P: axial load,A: Cross section,M: Momentum around the com-
mon axis,Z: Sectional module of the column.Substituting A as 50 mm • 500 mm
• 2 slabs, M as 12570N • 1130 mm and Z as 50 • 5003 mm3 / (12 • 250) mm:
Δ = +
= 7.07
Total stress is lower than the al-lowable stress, Δallowable of 11.25 N/mm2 which is defined by;
Δallowable = 0.45 • fcu
where fcu, - compressive strength of concrete is 25 N/mm2.
Design of the Base
The total weight of the three columns is 4.248 kN considering volume of each column as 0.177 m3 and density of concrete as 24 kN/m3.
The total service load including the bin, material, farmer and the three columns is 41.96 kN. Then, the expected load to the base is 45.32 kN; (41.96 kN • 1.08). Consid-ering the allowable bearing pressure of the soil as 50 kN/m2; the required area for the base is 0.9 m2.
Inputs Quantity Cost (in SLRs)Material10 mm dia. MS rod 33.54 m 900.005 mm dia. MS rod 109.75 m 675.0010 mm dia. for steel 36.60 m 855.00Chicken wire mesh 0.75 roll 1,950.0050 mm × 50 mm GI wire mesh 78 m2 1,350.00100 mm GI pipe 0.15 m 260.00100 mm GI socket 2 Nos. 600.00Gauge 26 binding wire 0.5 kg 40.00Welding rods 0.5 kg 75.00Gauge 22 aluminium sheet 9.75 m2 750.00Cement 600 kg 4,800.00Sand 0.85 m3 1,050.00Aggregate 0.27 m3 380.00Sealant 1 kg 400.00 14,472.00Weather shield paint 1 lit 380.00
LabourWelder @ Rs.400.00 4 man-days 1,600.00 10,100.00Mason @ Rs.400.00 10 man-days 4,000.00Helper @ Rs.400.00 15 man-days 4,500.00
Total SLRs 24,575.00US $ 253.35
Fig. 5 Pictorial view of the bin after construction at the NERD Centre
Table 1 Cost of production of a ferrocement bin in SLRs (1 US$ = SLRs 97)
PA
MZ
1257050 • 500 • 212570 • 1130
(50 • 5003) / (12 • 250)kN
mm2

AGRICULTURAL MECHANIZATION IN ASIA, AFRICA, AND LATIN AMERICA 2008 VOL.39 NO.256
The three columns were placed together by a 100 mm thick concrete plinth leaving a gap of 500 mm be-tween each column for convenient discharge of paddy into sacks. The total area of the plinth is selected as 1.465 m2.Preliminary Check of the Effective Depth of the Concrete
Considering the density of con-crete as 24 kN/m3, the weight of the entire structure including the base is 46.2 kN. The overall depth of the concrete plinth is checked by:
d > 10 • (N)0.5 where, d is the ef-fective depth and N is the ultimate load which is considered as 1.4 times the service load.
Then d = 10 • (1.4 • 46.2)0.5 = 80.42 mm which is less than the selected thickness of the base of 100 mm. Therefore, the design calculations conformed to the safety standards.
Construction of the BinPictorial views of the construc-
tion of the bin at different stages are shown in Figs. 4 and 5.
The structure of the upper cone was made of two rings of 800 mm and 2,300 mm diameter using 10 mm dia mild steel iron rods, con-nected by welding 24-5 mm dia mild steel iron rods. Height of the cone frustum was 1,610 mm. The bottom cone was fabricated similar to the upper cone, but the height was 635 mm. Additional two rings made of 10 mm dia mild steel iron rods were attached to the bottom cone between the base and the outlet of the cone to bear the imposed load. Two layers of chicken wire mesh were attached to each cone exter-nally and internally using binding wires.
The V-shaped column was cast in two stages. Reinforced steel frame was prepared for the both sides. One side was cast using a mould to a thickness of 50 mm keeping it on a flat floor. After curing, the other side was cast keeping an angle of
60º in between the two slabs. The top of the column provided a curva-ture to fit to the bottom cone. Simi-larly, three columns were cast.
After aligning the three vertical columns in an equal triangle, the base was made with concrete to a thickness of 150 mm leaving about 50 mm above the ground level. For aligning of the three columns, an equal triangle frame, made from 50 × 50 × 5 mm angle iron was used. The top outer tips of the columns were tighten to the bottom cone skeleton maintaining the base of the cone horizontally to the water-sprit level. The cone was plastered with a sand-cement mortar mixture prepared to the ratio of 1:3. After two days, the top cone skeleton was placed over the bottom cone and tighten using binding wires. Simi-larly, the top cone also was plastered as the bottom cone. An L-shaped grove of 25 × 25 mm was provided at the rim of the top cone for the lid. The lid was made with ferroce-ment to a thickness of 25 mm and a steel tube of 100 mm diameter was embedded at the center to close the bin using a treaded socket. A sealant material based on the rub-ber latex dissolved in cement slurry was applied to the wall of the bin on both sides to make the wall airtight. After drying the plaster, wall was painted with white weather shield paint.
Production Cost of a Fer-rocement Paddy Bin
Table 1 shows the expenditure incurred in construction of the fer-rocement paddy bin.
The cost of material to construct a bin was US $149 (SLRs.14472.00) and the labour cost was US $104 (SLRs.10,100.00). The total cost was US $253.35 (SLRs.24,575.00). However, the total cost can be re-duced by making appropriate jigs and fixtures and also constructing the bin in large scale, thereby, some
materials can be saved. Since the technology was new to the welder and the mason, the cost of labour can be reduced further once they have become acquainted with the technology.
ConclusionsThe economic model developed
can be used to design a ferrocement bin of different capacities required by the farmer.
The basic structure, which con-sists of welded or bound mild steel iron rods and chicken mesh to form the shape, can be fabricated in a small workshop or at the site where the bin is constructed. Therefore, the paddy bin can be constructed by the village artisans and skill ma-sons using materials available in the vicinity. Since theses bins are re-quired for the farmers in the paddy growing regions, construction of the bin will be a new self-employment opportunity for the rural sector.
REFERENCES
Adhikarinayake, T. B. 2005. Me-thodical design process to improve income paddy farmers in Sr i Lanka. Ph. D. Thesis, Wageningen University, The Netherlands.
Anonymous. 1973. Ferrocement: Application in developing coun-tries, National Academy of Sci-ence, Washington.
Anonymous. 1985. Structural use of concrete. British standard, Part 1. British Standards Institution, London.
Anonymous. 2003. Annual Report, Central Bank of Sri Lanka.
De Lima, C. P. F. 1990. Airtight storage: Principle and Practice, Food preservation by modified at-mospheres. CRC Press Inc, Boca Raton (USA), pp. 9-19.
Dias, W. P. S. 1995. Graded exam-ples in reinforced concrete design.
(continued on page33)

VOL.39 NO.2 2008 AGRICULTURAL MECHANIZATION IN ASIA, AFRICA, AND LATIN AMERICA 57
The Situation of Agricultural Mechanization inSarab City - Iran
byV. Rasooli SharabianiDept. of Agricultural Machinery,Faculty of Agriculture,The University of Mohaghegh Ardebili,Ardabil, [email protected]
AbstractIn order to evaluate the existing
situation of agricultural mechaniza-tion and to recommend some guide-lines for its development, this study was conducted in Sarab County with 66,674 hectares of farming land. In this study, number of trac-tors, types of machines, mechaniza-tion level, degree, and capacity were calculated. Management of ma-chines, operators’ skills and degree of depreciation were also evaluated and the results were analyzed. The study showed that 33 % of universal tractors (Romania) were obsolete. The mean mechanization level was 0.85 hp/ha; although this number was higher than the national level (of Iran), mechanization degree was very low in most farming opera-tions. Management of machines and operators’ skills were also very low. It was estimated that, to reach the mechanization level of 1.5 hp/ha, 771 tractors are required. Productiv-ity coefficient of machinery is 62 %, which shows that the machinery is not used ideally. In this study some overall guidelines for improving mechanization and increasing farm production were also presented.
IntroductionTo make a reliable plan to develop
the agriculture of a region, it is important to gain a precise knowl-edge of the existing situation and problems facing the development of agriculture. Otherwise all long-, middle-, and short-term plans will be ineffective and finally problematic and they will lead to waste of capital and time. This is of crucial impor-tance in developing and undeveloped countries because of limited capital and economic depression. However there are many fields with potential for development in these countries.
One of the main reasons, and probably the most important one, for this kind of social structure is the dependence of these countries on traditional agricultural systems with low efficiency. Therefore, at-tempts to find a rudimentary solu-tion to enhance the effectiveness of agriculture in the economy of these countries as one of the main goals must be taken into consideration. In this light, “the mechanization of agriculture to enhance per capita production of workers, to reduce production costs, to increase the profitability of products, and to extend the agricultural area” and “utilization of scientific resources and researches in the field of appro-priate application of potential facili-ties of water and soil and increase in production per unit area” are two main ways to evolve the traditional agriculture systems. In most cases,
these two ways are used simultane-ously (Ranjbar, 1989).
By definition, the mechanization of agriculture is “application of me-chanical implements or as a whole, the application of the state-of-the-art technologies in agriculture to increase productivity and to reach sustainable agriculture”. There are three specif ic indices including mechanization degree, level, and ca-pacity for the study and evaluation of mechanization in different regions.
Although the developmental pat-terns for a region can be provided after investigation into the facilities and limitations of that region, it must be noted that we can never of-fer a certain pattern of agricultural development alike for all regions, since they are different culturally, geographically, economically and socially. So, each part of the world has its own character istics and needs a specific pattern of develop-ment (Shahbazi, 1989).
This investigation was carried out in Sarab City in the province of East Azarbayjan in Iran in 2003-04 to study the situation of mechaniza-tion in the region and to analyze the relevant qualitative and quantitative issues.
MethodologySarab City in the east of East

AGRICULTURAL MECHANIZATION IN ASIA, AFRICA, AND LATIN AMERICA 2008 VOL.39 NO.258
Azarbayjan Province stands be-tween the latitudes of 37º 45′ and 38º 00′ N. and longitudes of 47º 30′ and 47º 45′ E. According to the census of 2001, the population of the city was about 161,741 and the population of working men of this city in the agriculture sector was about 24,911 (Anonymous, 2001). The total area of the city was more than 3,560 km2 of which 100,740 hectares are arable, 66,674 hectares for irrigated and non-irrigated and the rest for fallow.
In terms of Emberget classifica-tion, the climate of the region is semiarid and cold. The mean annual temperature is 0-10 ºC and mean annual precipitation of low and high lands is 300 and 600 mm, respec-tively. The city whose altitude is 1900-m is under the aquifer realm of Oroumiyeh Lake and Adji-Chai River (Anonymous, 2001).
Methods of StudyIn this research, we used a field
study as the cornerstone of review-ing the gathered data and, besides, extensive and intensive methods were used. Inquiry and observation constituted the tools of the research. Field observation (which is done in the heart of the society unlike the in vitro observation) is the base of this method, which is used for studying different social, human, vegetative and animal-related phenomena (Sa-rokhani, 1994).
The extensive method is an im-portant method in large-scale social and regional investigations. In this objective method, questions with low depth are considered (Louimi, 2000). This method is required be-cause it enables generalizability of results and finally unmasks the gen-eral properties and existing norms (Sarokhani, 1994).
The aim of the intensive method is to the analyze phenomena and account for. This method includes a wide spectrum and is considered more rigorous for the extensive method (Sarokhani, 1994).
In view of the definition of field study and the description of the intensive and extensive methods as subsets of the field study, it was at-tempted to use both methods in this experiment. A region was selected as a sample and this sample was studied intensively and thoroughly, for the following reasons:
1. inaccessibility to all villages around the city;
2. infeasibility of studying such factors as degree of mechaniza-tion in every village;
3. this region being roughly agro-zone as regards the elevation temperature and general cli-matic condition;
4. farmers being of similar social and cultural conditions and fac-ing similar constraints.
In statistical analyses, random samples were selected from the vil-lages under the service of public agencies and questionnaires were filled in these sample villages and eventually the results of this survey were generalized to the whole re-gion.
Methods of Data GatheringIn this study, methods that are
used for gathering data were ques-tionnaire, interview, observation, gathering formal statistics, and fi-nally library study.
Evaluation IndicesThe indices and qualitative and
quantitative criteria by which the status of mechanization were evalu-ated were as follows:
The mechanization degree is one of the quantitative indices (Almasi et al., 2000) by which the mecha-nization degree of different opera-tions in a limit can be assessed. In other words, mechanization degree is used for determining the extent of different operations done by ma-chinery (versus operation done by human, animal or noncompliance of them). In this study, wheat, barley and potato were selected as domi-nant and strategic crops (in terms
of their productivity to farmers) for extensive investigation. Then the mechanization degree of differ-ent operations on these crops was intensively examined in the sample region (Sharabian Region) and the ratio of accomplished mechaniza-tion operation to the required one was determined.
The level of mechanization which was calculated by the following for-mula (Almasi et al., 2000):
Total powers of existing tractors (hp) = Average nominal power of one tractor × Number of working tractors
Total real power of tractors = To-tal power of existing tractors × Conversion coefficient .............(1)
According to the recommenda-tions of the reference (Almasi et al., 2000), the conversion coefficient is 0.75, so
Mechanization level (hp/ha) = To-tal power / Cultivated area ....(2)
The executive power of the region: to calculate this capacity, it was es-sential to calculate the real period of time which experiences the high-est operational density in terms of agricultural calendar of the region and the table of time limitations of the application of the machinery as well as the required period of time to carry out the desired operations per hectare (Louimi, 2000).
Existing executive power = (Exist-ing period of time × Existing number of tractor) / Required time period for preparing of field per hectare ........................(3)
Productivity coefficient: this is calculated by the executive power (Louimi, 2000).
Productivity coeff icient (%) = (Necessary executive capacity / Existing executive capacity) × 100 ..............................................(4)
In fact, the necessary executive power is the area that may be com-pleted in the real period of time.
The mechanizat ion capacit y or consumed horse power - hour through energy resources (including animal, human and mechanical).

VOL.39 NO.2 2008 AGRICULTURAL MECHANIZATION IN ASIA, AFRICA, AND LATIN AMERICA 59
Type of operation MD for concerned operation areally, % Comments
Initial soil tillageMouldboard plow 97 and more Nowadays all cultivated fields are usually plowed at least once.Heavy disk negligible It is not prevalent in the region and farmers do not know this kind of operation.Chisel plough 14 and less Some farmers use it for gathering vegetative remnants after harvesting potato.
Secondary soil tillageDisking 35 It is used for breaking the clods.Harrow 23 It is used for collecting the vegetative remnants and simple furrow-making.
PlantingPotato planter 12 Its application has not extended because of ignorance of ramers and the problems
facing fields leveling.Furrower 78 In recent years, the application of this method has increased because it is simple and
time saving.Protection
Sprinkler 6 and less This method is not used widely because of restricted spread of that.Tractor sprayer 57 In the protection stage, this is used widely for fighting against weeds and pests.Knapstack sprayer 55 Farmers who do not have access to tractor spray use this implement eigher manually
or mechanically.Harvesting and postharvesting
Potato digger 20 Fields cultivated by potato planters are usually harvested by potato diggers.Transportation 100 Potato is transported to dtorehouses or market by vehicles.
Table 1 Mechanization degree (MD) of prevalent mechanical operations of potato
Animal energy: to calculate the animal power, the energy produced by an animal during a working day* is equal to (Iran Consulting, 2000):
Annual functional hours = Num-ber of functional days × Mean functional hours during a day
Total existing animal power (hp) = Produced power of animal × Number of animals
Animal energy (hp-hr) = Total ex-isting animal power × Annual functional hours
Human energy: the procedure for calculating human energy is similar to the previous one, but it should be taken into consideration that firstly to calculate the number of working population in agriculture sector, all people of the region including farm-ers and supporting people who play a role in crop production should be involved; secondly a normal person can meanly produce on average about 0.12 hp during a working day (Iran Consulting, 2000).
Mechanical energy: to calculate the mechanical energy, the f irst instruction has to be followed, the number of days machinery is used during a year should be noted ac-cording to the calendar, as well as
the limitations of using machinery on some days. And the mean daily functional hours of machines are separately calculated according to existing resources and field stud-ies. Besides calculating the energy of machines, all existing machines should be considered, whether sta-tionary or mobile, which are pro-ducing power for cropping work.
Calculation of number of tractors, combines and required implements:
To calculate the number of re-quired tractors we follow the inverse procedure as that for calculating mechanization level. Therefore hav-ing a certain mechanization level, the required number of tractors can be calculated as following: ............(5)
Necessary tractor power = Deter-mined mechanization level** × Cultivated area (ha) / Conver-sion coefficient (0.75)
Required tractor power = Neces-sary tractor power − Existing tractor power
Required number of tractors = Re-quired tractor power / Nominal power of an appropriate tractor
To calculate the required number of combines, the steps must be fol-lowed:
Performance of each combine in workable period = Number of workable days × Feasible ca-pacity of combine (ha/day)
Necessary number of combines = Existing harvestable area / Performance of each combine in workable period
Required number of combines = Necessary number of combines − Existing active combines
To predict the required imple-ments for cropping operations, we take the following steps:
Effective area capacity (ha/hr) = (Working width (m) × Speed (km/hr) × Efficiency (%)) / 10
Working area of implement = Area capacity of implement × Number of working days × Mean daily working hours
Necessary number of implements = Total working area of re-quired operation / Working sur-
*The power corresponding to each one (hp): Horse = 1, Donkey = 0.5, Mule = 0.8, Working cow = 0.8, Bull = 0.8.
**The mechanization level which is predicted in Third Develop-ment Program of the country.
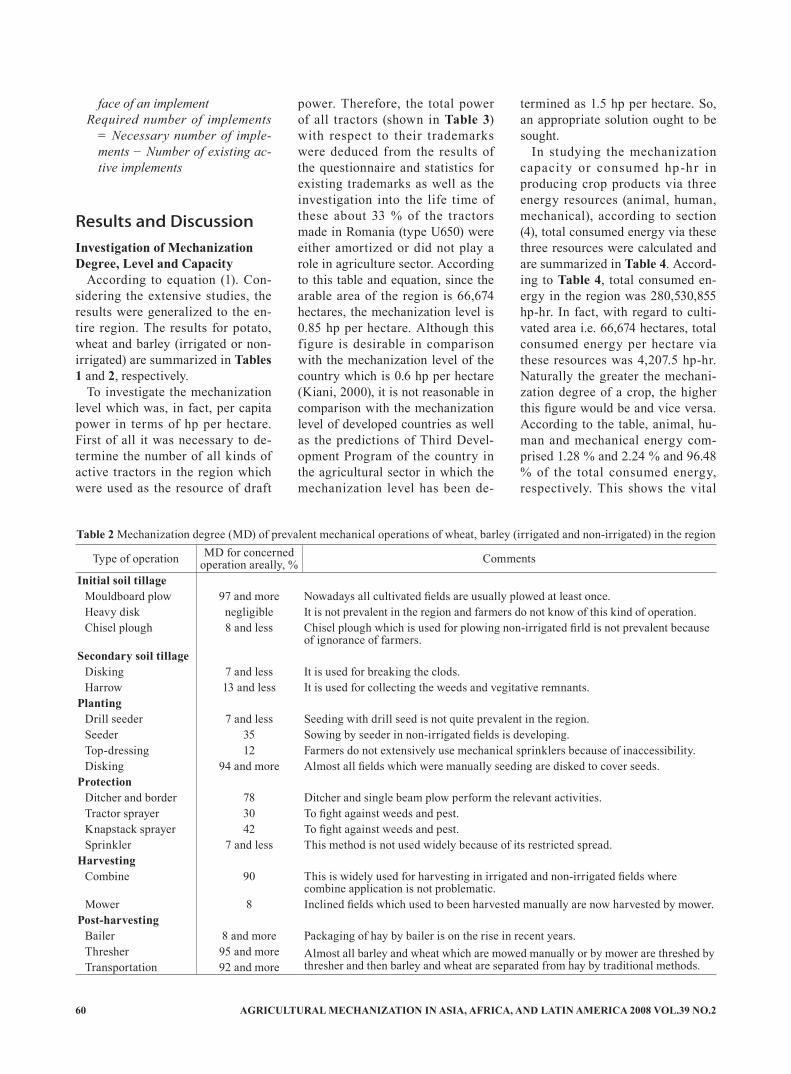
AGRICULTURAL MECHANIZATION IN ASIA, AFRICA, AND LATIN AMERICA 2008 VOL.39 NO.260
face of an implementRequired number of implements
= Necessary number of imple-ments − Number of existing ac-tive implements
Results and DiscussionInvestigation of Mechanization Degree, Level and Capacity
According to equation (1). Con-sidering the extensive studies, the results were generalized to the en-tire region. The results for potato, wheat and barley (irrigated or non-irrigated) are summarized in Tables 1 and 2, respectively.
To investigate the mechanization level which was, in fact, per capita power in terms of hp per hectare. First of all it was necessary to de-termine the number of all kinds of active tractors in the region which were used as the resource of draft
power. Therefore, the total power of all tractors (shown in Table 3) with respect to their trademarks were deduced from the results of the questionnaire and statistics for existing trademarks as well as the investigation into the life time of these about 33 % of the tractors made in Romania (type U650) were either amortized or did not play a role in agriculture sector. According to this table and equation, since the arable area of the region is 66,674 hectares, the mechanization level is 0.85 hp per hectare. Although this figure is desirable in comparison with the mechanization level of the country which is 0.6 hp per hectare (Kiani, 2000), it is not reasonable in comparison with the mechanization level of developed countries as well as the predictions of Third Devel-opment Program of the country in the agricultural sector in which the mechanization level has been de-
termined as 1.5 hp per hectare. So, an appropriate solution ought to be sought.
In studying the mechanization capacity or consumed hp-hr in producing crop products via three energy resources (animal, human, mechanical), according to section (4), total consumed energy via these three resources were calculated and are summarized in Table 4. Accord-ing to Table 4, total consumed en-ergy in the region was 280,530,855 hp-hr. In fact, with regard to culti-vated area i.e. 66,674 hectares, total consumed energy per hectare via these resources was 4,207.5 hp-hr. Naturally the greater the mechani-zation degree of a crop, the higher this figure would be and vice versa. According to the table, animal, hu-man and mechanical energy com-prised 1.28 % and 2.24 % and 96.48 % of the total consumed energy, respectively. This shows the vital
Type of operation MD for concerned operation areally, % Comments
Initial soil tillageMouldboard plow 97 and more Nowadays all cultivated fields are usually plowed at least once.Heavy disk negligible It is not prevalent in the region and farmers do not know of this kind of operation.Chisel plough 8 and less Chisel plough which is used for plowing non-irrigated firld is not prevalent because
of ignorance of farmers.Secondary soil tillage
Disking 7 and less It is used for breaking the clods.Harrow 13 and less It is used for collecting the weeds and vegitative remnants.
PlantingDrill seeder 7 and less Seeding with drill seed is not quite prevalent in the region.Seeder 35 Sowing by seeder in non-irrigated fields is developing.Top-dressing 12 Farmers do not extensively use mechanical sprinklers because of inaccessibility.Disking 94 and more Almost all fields which were manually seeding are disked to cover seeds.
ProtectionDitcher and border 78 Ditcher and single beam plow perform the relevant activities.Tractor sprayer 30 To fight against weeds and pest.Knapstack sprayer 42 To fight against weeds and pest.Sprinkler 7 and less This method is not used widely because of its restricted spread.
HarvestingCombine 90 This is widely used for harvesting in irrigated and non-irrigated fields where
combine application is not problematic.Mower 8 Inclined fields which used to been harvested manually are now harvested by mower.
Post-harvestingBailer 8 and more Packaging of hay by bailer is on the rise in recent years.Thresher 95 and more Almost all barley and wheat which are mowed manually or by mower are threshed by
thresher and then barley and wheat are separated from hay by traditional methods.Transportation 92 and more
Table 2 Mechanization degree (MD) of prevalent mechanical operations of wheat, barley (irrigated and non-irrigated) in the region

VOL.39 NO.2 2008 AGRICULTURAL MECHANIZATION IN ASIA, AFRICA, AND LATIN AMERICA 61
Type Mean nominal power, hp
No. of active tractors
Conversion coefficient
Total power,hp
Romania (30-60) 40 6 0.75 180Romania (60-80) 65 664 0.75 32,370MF (30-60) 45 7 0.75 236MF (60-80) 75 380 0.75 21,375MF (80-110) 110 10 0.75 825John Deer (80-110) 105 18 0.75 1,417Others (30-60) 40 9 0.75 270
Total - 1,094 - 56,673
Table 3 The total power and number of all kinds of active tractors in the region
importance of mechanical resources in crop production.
Required Number of Tractors, Combines and Other Implements
To calculate the required number of tractors, the instructions given in section (5) must be followed. In this study, the certain mechanization level was determined with respect to the predicted mechanization level in the Third Development Program, which proposes an average of 1.5 hp per hectare. The calculation showed that the necessary tractor power was 133,348 hp of which 75,564 hp ex-ists and so 57,784 hp was required. According to the studies and refer-ring to the resources and researches, the appropriate tractors for the re-gion are commonly middle-power ones (Iran Consulting, 2000). In this study, the MF285 with nominal power of 75 hp that is both middle-power and made-in Iran and easy-to-access were the basis of research. Finally 771 tractors of the same brand were estimated to meet the requirements of the region.
To calculate the number of com-bines required, considering equation (5) and the results shown in Table 1, which indicate that the mecha-nization degree for harvesting by
combine is 90 % and total area of wheat and barley is 35,294 hectares in the region, altogether a 31,765 hectare area will be harvestable by combine. According to the agri-cultural schedule of the region and limitation in using machinery from July 10 through August 20, which are forming the harvest season, al-lotted time (or workable days) for to harvest is 32 days in the region. Extensive studies show that mean performance of combines is 10 hect-are per day. So, 100 combines are needed of which just 35 combines exist. Now it may be asked whether the remaining 65 combines are nec-essary to procure. If necessary, how have farmers met their needs as yet? The answer is that Azarbayjan is a region with various climates, there-fore harvest of wheat starts from the northern part, i.e. Moghan Plateau, and with increase in temperature in the first months of summer it ex-tends to western and southern parts of the region. So annually, combine owners in Ardebil and Moghan Regions are dispatched to this city after completion of harvesting the wheat of their own regions and, thus, the need for combins in Sarab is met. On the other hand, since the purchase and maintenance costs
of combins are high and it is annu-ally applied just in a short period of time, it seems that the procurement of this number of combines is not economical. However, it must be noted that the lack of service and maintenance centers for combins in the region is a severe problem that prevents owners from repairing their combines that leads to a waste of harvest time (due to protracting of repairing and replacing accesso-ries). Furthermore, since drivers are not skillful and do not know how to adjust their combines, seeds break and are scattered in different parts. All of these problems incur a high costs for farmers.
To predict the required number of implements, the instructions given in section should be followed. The results of this prediction have been summarized in Table 5. Allotted time has been calculated according to the agricultural calendar of the region. Besides, the real period of time for using these tools has been calculated according to the limita-tions of applying the implements (Iran Consulting, 2000). As shown in the table, the number of existing implements such as mouldboard plow, disk and chisel plough are excessive and superabundant. Al-though this is a positive point, with respect to the mechanization degree, it is clear that these implements are being misused. Conversely there is a severe shortage of some other implements such as seeder, potato planter and potato digger which needs to be resolved and calls for investments.
Situation of Productivity of Agri-culture Machinery
To study the conditions of pro-ductivity of agricultural machinery various factors can be used such as the ratio of final yield of crops to their final (potential) efficiency or qualitative factors such as the status of training and skills of users of machinery. In this study accord-ing to the agricultural calendar of
Type Consumed hp-hr Consumed hp-hrper hectare
Share of each resouce, %
Animal energy 3,600,192 54 1.28Human energy 6,283,140 94 2.24Mechanical energy 270,647,253 4,059.5 96.48
Total 280,530,855 4,207.5 100.0
Table 4 Consumed energy in terms of energy resources(including animal, human and mechanical)
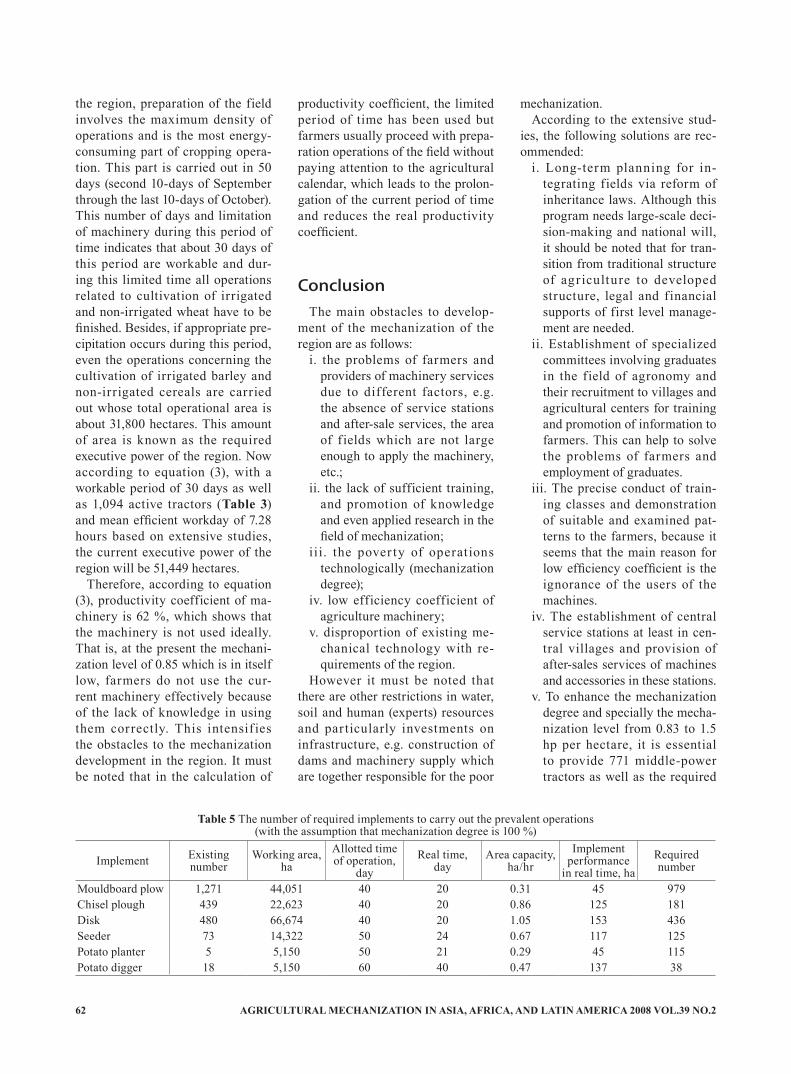
AGRICULTURAL MECHANIZATION IN ASIA, AFRICA, AND LATIN AMERICA 2008 VOL.39 NO.262
the region, preparation of the field involves the maximum density of operations and is the most energy-consuming part of cropping opera-tion. This part is carried out in 50 days (second 10-days of September through the last 10-days of October). This number of days and limitation of machinery during this period of time indicates that about 30 days of this period are workable and dur-ing this limited time all operations related to cultivation of irrigated and non-irrigated wheat have to be finished. Besides, if appropriate pre-cipitation occurs during this period, even the operations concerning the cultivation of irrigated barley and non-irrigated cereals are carried out whose total operational area is about 31,800 hectares. This amount of area is known as the required executive power of the region. Now according to equation (3), with a workable period of 30 days as well as 1,094 active tractors (Table 3) and mean efficient workday of 7.28 hours based on extensive studies, the current executive power of the region will be 51,449 hectares.
Therefore, according to equation (3), productivity coefficient of ma-chinery is 62 %, which shows that the machinery is not used ideally. That is, at the present the mechani-zation level of 0.85 which is in itself low, farmers do not use the cur-rent machinery effectively because of the lack of knowledge in using them correctly. This intensif ies the obstacles to the mechanization development in the region. It must be noted that in the calculation of
productivity coefficient, the limited period of time has been used but farmers usually proceed with prepa-ration operations of the field without paying attention to the agricultural calendar, which leads to the prolon-gation of the current period of time and reduces the real productivity coefficient.
ConclusionThe main obstacles to develop-
ment of the mechanization of the region are as follows:
i. the problems of farmers and providers of machinery services due to different factors, e.g. the absence of service stations and after-sale services, the area of fields which are not large enough to apply the machinery, etc.;
ii. the lack of sufficient training, and promotion of knowledge and even applied research in the field of mechanization;
iii. the pover ty of operations technologically (mechanization degree);
iv. low efficiency coefficient of agriculture machinery;
v. disproportion of existing me-chanical technology with re-quirements of the region.
However it must be noted that there are other restrictions in water, soil and human (experts) resources and particularly investments on infrastructure, e.g. construction of dams and machinery supply which are together responsible for the poor
mechanization.According to the extensive stud-
ies, the following solutions are rec-ommended:
i. Long-term planning for in-tegrating fields via reform of inheritance laws. Although this program needs large-scale deci-sion-making and national will, it should be noted that for tran-sition from traditional structure of agr iculture to developed structure, legal and financial supports of first level manage-ment are needed.
ii. Establishment of specialized committees involving graduates in the field of agronomy and their recruitment to villages and agricultural centers for training and promotion of information to farmers. This can help to solve the problems of farmers and employment of graduates.
iii. The precise conduct of train-ing classes and demonstration of suitable and examined pat-terns to the farmers, because it seems that the main reason for low efficiency coefficient is the ignorance of the users of the machines.
iv. The establishment of central service stations at least in cen-tral villages and provision of after-sales services of machines and accessories in these stations.
v. To enhance the mechanization degree and specially the mecha-nization level from 0.83 to 1.5 hp per hectare, it is essential to provide 771 middle-power tractors as well as the required
Implement Existing number
Working area, ha
Allotted time of operation,
dayReal time,
dayArea capacity,
ha/hrImplement
performance in real time, ha
Required number
Mouldboard plow 1,271 44,051 40 20 0.31 45 979Chisel plough 439 22,623 40 20 0.86 125 181Disk 480 66,674 40 20 1.05 153 436Seeder 73 14,322 50 24 0.67 117 125Potato planter 5 5,150 50 21 0.29 45 115Potato digger 18 5,150 60 40 0.47 137 38
Table 5 The number of required implements to carry out the prevalent operations(with the assumption that mechanization degree is 100 %)

VOL.39 NO.2 2008 AGRICULTURAL MECHANIZATION IN ASIA, AFRICA, AND LATIN AMERICA 63
implements, e.g. 52 seeders, 110 potato planters, and 20 potato diggers.
REFERENCES
Almasi, M., S. Kiani, and N. Loui-mi. 2000. Principles of Agricul-tural Mechanization. Ma’soumeh (peace be upon her) Publication.Gom-Iran. Pp 19-40.
Anonymous. 1999. The Statistics of East Azarbayjan Province. Tabriz. Management and Planning Orga-nization of East Azarbayjan Prov-ince.Tabriz-Iran.
Anonymous. 2001. The Maps and Geographical Information of Sarab City. Map Dep. Tabriz. Management and Planning Orga-nization of East Azarbayjan Prov-ince. Tabriz-Iran.
Clark, L. and J. Chief. 2000. Strate-gies for Agricultural Mechaniza-tion Development. FAO. Rome. Italy.
Gaolianxing, L. and Z. Ionghu. 1999. Development Situation and Tendency on Rice Production
Mechanization in Northeast of China. Proceedings of 99 Interna-tional Conference on Agricultural Engineering. Beijing, China.
Iran Consulting. 2000. The Plan of Studying Mechanization in Aras and Oroumiyeh Aquifer realm. The agriculture organization of East Azarbayjan Province. Tabriz-Iran.
Kiani, S. 2000. Evaluating Present Agricultural Mechanization Situ-ation and Presenting Development Guidelines for Izeh City - Iran. MS thesis. Shahid-Chamran Uni-versity of Ahwaz-Iran.
Louimi, N. 2000. Evaluating Present Agricultural Mechanization Situ-ation and Presenting Development Guidelines for Northern Ahwaz City - Iran. MS Thesis. Shahid-Chamran University of Ahwaz-Iran.
N. U. Ndaeyo, Gabriel S. Umoh, and E. O. Ekpe. 2001. Farming Systems in Southeastern Nige-ria: Implications for Sustainable Agricultural Production. Journal of Sustainable Agriculture, Vol. 17(4), 75-89.
Ranjbar, I. 1989. Mechanization and its Implications on the Develop-ment of Agriculture. The Seminal of Probing the Agricultural Prob-lems of Iran. 19 and 20 December. Tabriz-Iran.
Salokhe, V. M. and N. Ramalingam. 1998. Agricultural Mechanization in the South and Southeast Asia. International Conference of the Philippines. Society of Agricul-tural Engineers, Las Banos, Phil-ippines, 21-24 April: pp 1-23.
Sarokhani, B. 1994. Research Meth-ods in Social Sciences (I). Liberal Arts and Cultural Studies Cen-ter Publication. Tehran-Iran: pp 45-78.
Shahbazi, I. 1989. Agriculture Ad-vancement: the Requirements of Change and Renewal of Agricul-ture. Translation. The Publication of Agriculture Dissemination Or-ganization. Tehran-Iran: pp 22-35.
Witney, B. 1988. Choosing and Us-ing Farm Machinery. Logman Scientific & Technical. New York. US.
■■
the manual method. Thus, there was a saving of Rs.1,009/- over the manual method of raising mat type nursery for one hectare.
REFERENCES
Anonymous. 1999. Paddy trans-planter Bulletin. Directorate of rice research. ICAR. Rajendra Nagar, Hyderabad - 500 030.
Anonymous, 2002. The Hindu Sur-vey of Indian Agriculture. Pp. 23-25.
Anonymous. RNAM test codes and
procedures for farm machinery. Series-12. p. 93-113.
Chiu, Y. C., D. S. Fon, and L. H. Chin. 1998. A simulation model of a seeding system for rice nurs-eries. Agricultural Engineering Research. 69, 239-248.
Garg, I. K. and Anoop Dixit. 2003. Design, development and evalu-ation of mat type nursery sowing seeder. Paper presented at 37th Annual Convention of Indian So-ciety of Agricultural Engineers, held at Maharana Pratap Universi-ty of Agriculture and Technology, Udaipur Rajasthan. January 29-31,
2003. Souvanier. P-1-5.Jayasuriya, S. and E. C. Pr ice.
1979. Economic evaluation of dry seeded rice: some thought on risk aspect. Paper presented at Agric. Econ. Cropping System Seminar, IRRI, Philippines.
Sharma, S. C. 2003. Development and performance evaluation of a mat type nursery raising device for rice. M. Tech. Thesis G. B. Pant University of Agriculture & Technology, Pantnagar. Pp. 99.
■■
(Continued from page70)
Development and Performance Evaluation of a Mat Type Nursery Raising Device
AGRICULTURAL MECHANIZATION IN ASIA, AFRICA, AND LATIN AMERICA 2008 VOL.39 NO.264
Development and Performance Evaluation of a Mat Type Nursery Raising Device
byS. C. SharmaEx-PG ScholarDept. of Farm Machinery and Power Engineering,College of Technology,G.B. Pant University of Agriculture and Technology,Pantnagar - 263 145, U.S. Nagar, UttaranchalINDIA
T. P. SinghAssociate ProfessorDept. of Farm Machinery and Power Engineering,College of Technology,G.B. Pant University of Agriculture and Technology,Pantnagar - 263 145, U.S. Nagar, UttaranchalINDIA
AbstractIn the Tarai region the rice trans-
planting is accomplished mainly by the manual method. Manual transplanting is a labour intensive operation comprising of nursery raising, uprooting of the seedlings, transporting and transplanting them in the main field, with a total labour requirement of about 280-350 man-h/ha. High labour demand during peak transplanting period adversely affects the timeliness of this opera-tion, thereby reducing the crop yield. To correct the problem, mechanical transplanting could be considered as the most promising option. The major constraint in the adoption of mechanical transplanters is the complex and labour intensive tech-nique of raising mat type nursery in frames on perforated plastic sheets. Another constraint is unevenness of plant population in the mats. With a view to reduce the drudgery in raising mat-type nursery, a mat-type nursery raising device was de-veloped and tested. The developed device performed satisfactorily and gave the desired density of 80-100 g seed per mat with three passes of the device at 1.03 mm sprout length. The thickness of the soil layer could be also maintained to 20 mm, as required in a single pass, through
out the length of the mat. It saved both time and labour of 72.02 and 33.33 percent, respectively, over the manual method. The cost of raising mat type nursery for one hectare (400 mats) was Rs.299.5, compared to Rs.1,608.75 with manual method.
IntroductionRice and wheat are the two major
crops grown in the country and con-stitute as a major share of the Indian diet. The food grain production of 209.2 million tonnes was shared by 89.4 million tonnes production of rice from an area of 43.6 million ha during the year 2002. The efforts are required to extend the quantum of rice production to 120 million tonnes by 2020 AD from its present value for sharing the national food grain production basket to meet out the requirement of the burgeoning population of the country (Anony-mous, 2002). Looking at the total scenario of rice crop production during the current and last year, the situation has been backward this year rather than forward to achieve the target, as nature has not favoured the rice growers through desired fall of precipitation and tem-perature.
Therefore, sharpening of our
technological tools, or fine tuning of technology, is required so that the trend of increasing productivity may be achieved. The various meth-ods being practiced to grow rice are direct drilling/broadcasting of dry rice in a well prepared seed bed, broadcasting/line sowing of pre-germinated seeds in puddled bed and the widely adopted method of rice transplanting either manually or by using a manual/mechanical rice transplanter. The problem associated with direct seeding is that of weed control (Jayasuriya and Price, 1979), whereas uniformity of plant popula-tion is sacrificed in the broadcast-ing method. The rice transplanting method gives the desired result but the labour requirement is very high. It involves labour intensive opera-tions like nursery raising, uprooting of the seedlings, transporting and transplanting them in the main field requiring about 280-350 man-h/ha (Anonymous, 1999). High labour demand during the peak t rans-planting period adversely affects the timeliness of this operation, thereby, reducing the crop yield. In the Tarai region of Uttaranchal rice transplanting is mostly done through manual labour on a con-tractual basis. These labourers do not transplant the required number of hills per square meter for want of

VOL.39 NO.2 2008 AGRICULTURAL MECHANIZATION IN ASIA, AFRICA, AND LATIN AMERICA 65
covering more area within the short period contributing to lower yield.
Mechan ical t ransplant ing is considered as the most promising option as it reduces labour require-ment by 90 percent, minimizes stress and drudgery, ensures timely r ice t ransplanting and provides optimum plant population contrib-uting to higher productivity. The major constraint encountered in the adoption of mechanical transplant-ing is complex and labour intensive technique of raising mat type nurs-ery in frames on perforated plastic sheet. Unevenness of plant popula-tion in the mat is another problem. To eleviate the associated problem with the manual method of raising mat type nursery, Chiu et al. (1998) conducted study on a simulation
model for the seeding operation of rice nursery in Taiwan. The devel-oped model could be used as a tool to help managers of rice seedling centers optimize their seedling op-erations in terms of worker alloca-tion, speed of seedling line and size of hoppers. Also, the potential delay in the seeding system could clearly be detected through the result of simulation. Garg and Dixit (2003) studied the design, development and evaluation of a mat type nursery sowing seeder. The nursery seeder was calibrated in the laboratory using pre-germinated paddy seeds having different sprout lengths, viz 1-2 mm, 3-5 mm and 6-10 mm. The manual dropping of seeds took about 10 minutes but the seeder saved 70-80 % of the time over the
manual method. Keeping the above points in view
and with limited work in Indian conditions, a mat type nursery-raising device was developed and tested in the department of Farm Machinery and Power Engineering, College of Technology at G. B. Pant University of Agriculture & Tech-nology, Pantnagar. The performance of the developed device was also compared with the manual method of raising mat-type nursery with its economics.
Materials and MethodsDevelopment of a Nursery Raising Device
The nursery raising device de-veloped in the department of Farm Machinery and Power Engg, Col-lege of Technology of this university consists of two major units, first a soil spreading device and second a seed spreading device. The detailed description of both the devices is given below:
Details of seed and soil spreading device
A seed-spreading device was de-veloped to drop the pre-germinated sprouted rice seeds evenly on the soil-filled frames of size 220 × 500 mm. The various components of the device are frame, handle, ground wheel, hopper with adjustable con-trol plate, sieve and power transmis-sion unit (Fig. 1).
Frame: The frame of the seeding device was made of 40 × 40 mm mild steel angle iron. The overall length and width of the frame were 615 and 530 mm, respectively. The seed hopper, along with agitating unit was mounted on the frame. Four mild steel ground wheels 215 mm in diameter were provided to support the weight of various components of the device and also to keep the device in a level and stable position. The power from the ground wheel was transmitted to the
Fig. 1 Schematics of seed spreading device
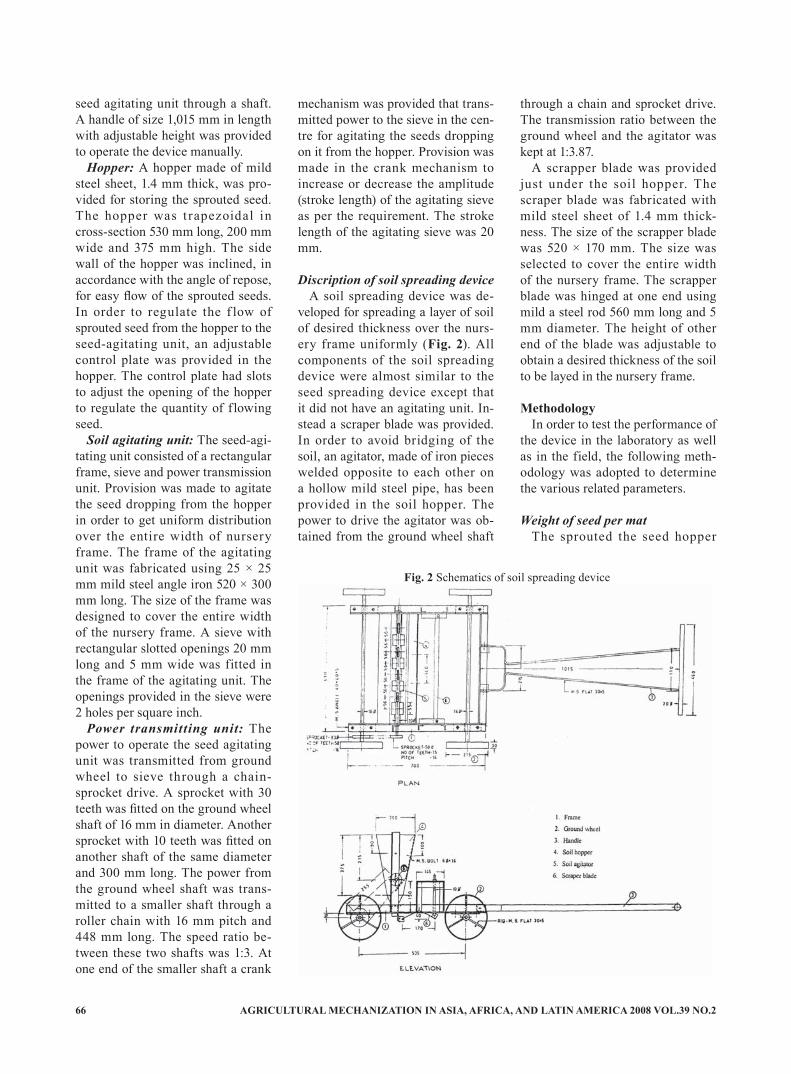
AGRICULTURAL MECHANIZATION IN ASIA, AFRICA, AND LATIN AMERICA 2008 VOL.39 NO.266
seed agitating unit through a shaft. A handle of size 1,015 mm in length with adjustable height was provided to operate the device manually.
Hopper: A hopper made of mild steel sheet, 1.4 mm thick, was pro-vided for storing the sprouted seed. The hopper was t rapezoidal in cross-section 530 mm long, 200 mm wide and 375 mm high. The side wall of the hopper was inclined, in accordance with the angle of repose, for easy flow of the sprouted seeds. In order to regulate the f low of sprouted seed from the hopper to the seed-agitating unit, an adjustable control plate was provided in the hopper. The control plate had slots to adjust the opening of the hopper to regulate the quantity of flowing seed.
Soil agitating unit: The seed-agi-tating unit consisted of a rectangular frame, sieve and power transmission unit. Provision was made to agitate the seed dropping from the hopper in order to get uniform distribution over the entire width of nursery frame. The frame of the agitating unit was fabricated using 25 × 25 mm mild steel angle iron 520 × 300 mm long. The size of the frame was designed to cover the entire width of the nursery frame. A sieve with rectangular slotted openings 20 mm long and 5 mm wide was fitted in the frame of the agitating unit. The openings provided in the sieve were 2 holes per square inch.
Power transmitting unit: The power to operate the seed agitating unit was transmitted from ground wheel to sieve through a chain-sprocket drive. A sprocket with 30 teeth was fitted on the ground wheel shaft of 16 mm in diameter. Another sprocket with 10 teeth was fitted on another shaft of the same diameter and 300 mm long. The power from the ground wheel shaft was trans-mitted to a smaller shaft through a roller chain with 16 mm pitch and 448 mm long. The speed ratio be-tween these two shafts was 1:3. At one end of the smaller shaft a crank
mechanism was provided that trans-mitted power to the sieve in the cen-tre for agitating the seeds dropping on it from the hopper. Provision was made in the crank mechanism to increase or decrease the amplitude (stroke length) of the agitating sieve as per the requirement. The stroke length of the agitating sieve was 20 mm.
Discription of soil spreading deviceA soil spreading device was de-
veloped for spreading a layer of soil of desired thickness over the nurs-ery frame uniformly (Fig. 2). All components of the soil spreading device were almost similar to the seed spreading device except that it did not have an agitating unit. In-stead a scraper blade was provided. In order to avoid bridging of the soil, an agitator, made of iron pieces welded opposite to each other on a hollow mild steel pipe, has been provided in the soil hopper. The power to drive the agitator was ob-tained from the ground wheel shaft
through a chain and sprocket drive. The transmission ratio between the ground wheel and the agitator was kept at 1:3.87.
A scrapper blade was provided just under the soil hopper. The scraper blade was fabricated with mild steel sheet of 1.4 mm thick-ness. The size of the scrapper blade was 520 × 170 mm. The size was selected to cover the entire width of the nursery frame. The scrapper blade was hinged at one end using mild a steel rod 560 mm long and 5 mm diameter. The height of other end of the blade was adjustable to obtain a desired thickness of the soil to be layed in the nursery frame.
MethodologyIn order to test the performance of
the device in the laboratory as well as in the field, the following meth-odology was adopted to determine the various related parameters.
Weight of seed per matThe sprouted the seed hopper
Fig. 2 Schematics of soil spreading device

VOL.39 NO.2 2008 AGRICULTURAL MECHANIZATION IN ASIA, AFRICA, AND LATIN AMERICA 67
Number of passes Replications
Amount of seed dropped per mat length, gSprout length, mm
1.03 3.48 4.64 9.47
1 Pass
1 25.9 19.3 15.9 19.02 26.3 20.5 16.3 23.03 24.9 21.3 14.7 18.0
Average 25.7 20.3 15.63 20.00
2 Passes
1 53.0 39.5 28.9 28.02 50.0 38.9 29.7 31.03 49.5 39.0 31.5 32.0
Average 50.83 39.13 20.03 30.33
3 Passes
1 77.0 57.5 44.9 64.02 78.0 59.3 45.8 58.03 82.0 59.7 46.3 59.0
Average 79.0 58.83 45.67 60.33
4 Passes
1 101.5 78.0 61.0 68.02 105.0 83.0 63.5 84.03 99.3 81.0 62.9 68.0
Average 101.83 80.67 62.47 73.33
5 Passes
1 128.5 104.0 79.5 90.02 131.5 100.0 77.5 88.03 128.5 107.67 81.5 83.0
Average 129.00 103.67 79.63 87.00
Table 1 Amount of seed dropped per mat in differentpasses of the machine at different sprout length
was filled and the seed spreading device was moved over the nursery frame that had sections of size 220 × 500 mm in order to determine the amount of seed dropped per mat. Thereafter, the seed dropped in each section of the nursery frame were collected and weighed. This was done to calibrate the device for proper seed rate. The same proce-dure was adopted for determination of weight of seed dropped per mat for different passes of the device, viz 1, 2, 3, 4 and 5 passes. For each pass the procedure was repeated thrice.
Uniformity of seed and soilTo determine uniformity in seed
distribution per mat the device was operated over a test run of 1.0 meter length. The test run was divided in to three equal segments along the width. Three square containers of size 50 × 50 mm were placed ran-domly in each segment along the length of the test run. The device filled with sprouted seed was moved over the test run. The seed dropped in each container were collected, averaged out for each segment, counted and weighed. In a similar way, the uniformity of soil place-ment was determined.
Mechanical seed damageThe mechanical seed damage of
sprouted seed was determined by
taking a known quantity of sample from the seeds received from the seed spreading device and the dam-aged seeds were separated manually from the sample and weighed. The percentage of mechanical seed dam-age was calculated using the follow-ing equation:
Mechanical seed damage (%) = (Weight of damaged seed in the sample / Total weight of the sample) × 100 ...........................(1)
Thickness of soil layerThe soil spreading device was
moved over a test run of 1.0 in length after filing the hopper with soil. The soil from the hopper was allowed to flow under gravity. When the soil dropped from the hopper the excess soil was scraped off by the scraper blade to get the desired thickness of soil layer. Thereafter, water was applied through a water sprinkler for settlement of the soil. The thickness of the soil dropped on to the nursery frame was measured at different locations from the test run with a vernier caliper.
Experimental variablesThe following parameters were
considered for the performance evaluation of the seed spreading de-vice in the laboratory.
Sprout length of rice seed: 4 levels (1.03, 3.48, 4.64, 9.47 mm)
Number of pass of device: 5 levels (1, 2, 3, 4 and 5 pass)
Comparative performance evalua-tion in actual field condition
The performance of the developed device was compared with manual method of raising mat type nursery
Replications Weight of seed sample, g
Weight of da-maged seed, g
Average seed damage, % Replications Thickness
required, mmThickness
obtained, mm Variation
1 50 0.00 0.00 1 20 20 0.002 50 0.00 0.00 2 20 20 0.003 50 0.00 0.00 3 20 20 0.004 50 0.00 0.00 4 20 20 0.005 50 0.00 0.00 5 20 20 0.00
Average 50 0.00 0.00 Average 20 20 0.00
Table 2 Visible mechanical seed damage of sprouted rice seed Table 3 Thickness of soil layer obtained by soil spreading device

AGRICULTURAL MECHANIZATION IN ASIA, AFRICA, AND LATIN AMERICA 2008 VOL.39 NO.268
in actual field conditions. The time and labour required in unit opera-tions of raising mat type nursery in both the systems were recorded. After 8 days of raising the nursery, the mat thickness and other seed-ling characteristics like mat density, plant height, leaf stage and stem thickness were determined. Later on, economic analysis was also per-formed for both the methods of rais-ing mat type nursery.
Results and DiscussionPerformance Evaluation of the Device in the Laboratory
The performance of the seed and soil-spreading device was evaluated in the laboratory. The results are discussed below:
Weight of seed per matThe weight of seed dropped per
mat have been presented in Table 1 for different passes of the device and different sprout length of the seed. At 1.03 mm sprout length, the average weight of seed dropped per mat was 25.70, 50.83, 79.00, 101.83 and 129.00 g for 1, 2, 3, 4 and 5 passes of the device, respectively. When the device was tested for in-creased sprout length of 3.48 mm, the average weight of seed dropped decreased to 20.30 g for 1 pass, 39.13 g for 2 passes, 58.83 g for 3 passes, 80.67 g for 4 passes and 103.67 g for 5 passes of the device. When the sprout length increased further to 4.64 mm the average seed dropped per mat was 15.63 g, 20.03 g, 45.67 g, 62.47 g and 79.63 g for 1, 2, 3, 4 and 5 passes, respectively. At the highest sprout length of 9.47 mm, the average weight of the seed dropped per mat increased from 20.00 g for 1 pass to 30.33 g for 2 passes, 60.33 g for 3 passes, 73.33 g for 4 passes and 87.00 g for 5 passes of the device. The relation-ship between sprout length and seed dropped per mat in different passes has been presented in Fig. 1, which
shows an increase in weight of seed dropped per mat with the increase in number of passes of the device for all the sprout lengths of the seed. This was because, in every pass, some quantity of seed was being added to the seed dropped in the previous pass.
The weight of seed dropped for smaller lengths of sprout for a given pass was more than the weight of seed dropped at higher sprout length. This was because with the increase in sprout length the free flowing and sliding characteristics of the germinated seed upon itself decreases.
Fig. 3 shows that there was an in-crease in weight of seed dropped per mat beyond 4.64 mm sprout length from its previous values for all the
passes. This was because the hopper opening was increased from 12.5 to 18.0 mm in order to make the seeds f low from the seed hopper after a sprout length of 4.64 mm. The theoretical requirement of the seed per mat was determined as 80.00 g. From the Table 1 it is clear that this requirement could be achieved in 3 passes, 4 passes, 5 passes and 3 passes of the seed spreading device for a sprout length of 1.03, 3.48, 4.64 and 9.47 mm at 12.5 and 18.0 mm hopper opening.
Uniformity of seed The uniformity of seed place-
ment in one-meter length of test run was determined and the results have been presented in Fig. 4. For one pass of the device, at 1.03 mm
Replications Weight of soil required, g
Weight of soil dropped, g Variation, g
1 58.93 62.36 3.432 58.93 68.26 9.333 58.93 67.40 8.474 58.93 62.10 3.175 58.93 75.20 16.276 58.93 64.26 5.337 58.93 61.06 2.138 58.93 65.13 6.209 58.93 60.06 1.1310 58.93 61.17 2.24
Average 58.93 64.70 5.77
Table 4 Weight of soil obtained by soil spreading device in 50 × 50 mm
Amount of seed dropped, g
Input energy (MJ/ha)Output energy (MJ/ha)Net return energy (MJ/ha)
1 2 3 4 5 6 7 8 9 100
20
40
60
80
100
120
140
Sprout length, mm
1 Pass2 Passes3 Passes4 Passes5 Passes
Hopper opening = 12.5 mm Hopper opening = 18 mm
Fig. 3 Effect of sprout length and number of passes on amount of seed dropped per mat

VOL.39 NO.2 2008 AGRICULTURAL MECHANIZATION IN ASIA, AFRICA, AND LATIN AMERICA 69
sprout length, the average number of seed dropped in each segment was 16 seeds. When the number of pass-es was increased from 1 to 2, the average number of seeds dropped in each segment was 35 seeds, which shows that the machine is able to drop the seeds uniformly over the entire test run. The number of seeds dropped in each segment in all the passes and sprout lengths was almost same with very small varia-tion.
Mechanical seed damageA sample size of 50 g was taken
from the sample received after pass-ing through the machine in order to determine visible mechanical damage. The broken seeds were separated from this sample and the result has been presented in Table 2. There was not any visible damage either to the seed or to the sprout of
the rice seed. Thus, it can be said that the machine spread the seeds uniformly over the nursery frame without any visible mechanical damage to seed or its sprout.
Thickness of soil layerThe thickness of soil layer after
spreading it by the soil spreading device and watering was measured with a steel scale. The thickness of soil dropped has been presented in Table 3. The thickness of the soil layer measured at different locations was 2 cm. This indicated that uni-form thickness of soil layer could be obtained with the help of the soil spreading device.
Uniformity of soil placement The uniformity of soil placement
in a one meter length of test run was determined and the results have been presented in Table 4. The aver-
age amount of soil dropped in each segment of size 50 × 50 mm varied between 61.06 and 75.20 g with an average of 64.70 g which quite close to the theoretical value of about 59 g. The average variation was 5.77 percent. Thus, the results indicated that the device gave uniform thick-ness of soil layer through out the test run.
Comparative Performance and Economic Assessment
Comparative performance evalu-ation of the developed device with conventional (manual) method of raising mat type nursery was done in actual field conditions at the uni-versity farm. The time and labour requirement was noted for each unit operation involved in raising mat type nursery and the data have been presented in Table 5. The total time required to raise 24 mats of nursery
Number of seed dropped
0
20
40
60
80
100
Conservation tillage
Conventional tillage
No-till5 Passes4 Passes3 Passes2 Passes1 Pass
Segment 1Segment 2Segment 3
Number of seed pass
Sprout length 1.03 mm
Number of seed dropped
0
20
40
60
80
100
Conservation tillage
Conventional tillage
No-till5 Passes4 Passes3 Passes2 Passes1 Pass
Segment 1Segment 2Segment 3
Number of seed pass
Sprout length 3.48 mm
Fig. 4 Effect of number of passes on number of seed dropped in 50 × 50 mm at different sprout length
Number of seed dropped
0
20
40
60
80
100
Conservation tillage
Conventional tillage
No-till5 Passes4 Passes3 Passes2 Passes1 Pass
Segment 1Segment 2Segment 3
Number of seed pass
Sprout length 4.64 mm
Number of seed dropped
0
20
40
60
80
100
Conservation tillage
Conventional tillage
No-till5 Passes4 Passes3 Passes2 Passes1 Pass
Segment 1Segment 2Segment 3
Number of seed pass
Sprout length 9.47 mm

AGRICULTURAL MECHANIZATION IN ASIA, AFRICA, AND LATIN AMERICA 2008 VOL.39 NO.270
Parameter Nursery raising methodManual Mechanical
Variety Pusa Basmati Pusa BasmatiSeed rate, kg/ha 32-36 32-36Number of seedling/cm2 3-5 2-5Height of seedling, mm 56.67 65Stem thickness, mm 1.00 1.00Leaf stage 2 2Mat thickness, cm 1.50 2.00
Table 6 Seedling characteristics of mat type nursery raised by both the techniques
Name of the unit operations
Method of nursery raisingManual Mechanical
Time required,
min(s)
Labour require-ment, no.
Time required,
min(s)
Labour require-ment, no.
Spreading of polythene sheet over the ground surface
60 2 60 2
Laying of frame over the polythene sheet 120 1 120 1Making perforation in plastic sheet 78 2 78 2Filling of soil in nursey frame/filling of soil
in hopper and operating of the machine687 2
48 2Levelling of soil in nursery frame 420 2Compaction of soil in nursery frame 84 2Sprinkling of water over the soil in nursery
frame300 1 300 1
Spreading of pre-germinated seeds over the soil in nursery frame/filling of seed in the seed hopper and operating the machine
441 2 16.8 1
Spreading of soil layer (2-3 mm) over the pre-germinated seed in nursery frame
315 2 15 1
Covering of the mat with residue/straw 69 2 69 2Time loss - - 12 0.00Total 2,574 18 718.8 12
Table 5 Time taken in different unit operations of mat type nurseryraising with manual and developed device for 24 mats
Net saving in time requirement = 72.07 %; Net saving in labour requirement = 33.33 %; Labour charge @ Rs.60 per day; Net labour charge in manual method for raising 400 mats = Rs.1,609.20; Labour charge in mechanical method for raising 400 mats = Rs.299.50; Operational cost of the developed device for raising 400 mats = Rs.300.97; Net cost involved in raising mat type nursery by device, Rs./ha = 600.47; Net saving = Rs.1,009/-
of size 220 × 500 mm was 2,574 seconds in manual method whereas it was only 718.8 seconds with the developed device. The total time saving in comparison to the manual method was 1,855.2 seconds. The time required in filling, levelling and compaction of soil in the nurs-ery frame was 687, 420 and 84 sec-onds, respectively, whereas all these unit operations could be done with the device in 48 seconds only. The total time required in seed spread-ing with manual technique was 441 seconds whereas it was only 16.8 seconds with seed spreading de-vice. Thus, the time saved with the developed device over the manual method was 72.07 percent. The la-bour requirement for various unit operations in raising 24 mat type nursery is also presented in Table 5. Eighteen labours were required for the manual method of raising mat type nursery whereas only 12 persons were required, along with the developed device, for raising the same quantity of mats. Thus, the labour saved with the developed device over the manual method was 33.33 percent. The saving in cost of raising mat type nursery for one hectare (about 400 mats) was Rs. 1,009/- over the manual method.
The characteristics of mat type nursery were also noted on 8th day in both the methods and the data have been presented in Table 6. The number of seedlings per cm2 varied between 3 and 5 for manually raised nursery, whereas it was 2 to 5 for the developed device with almost the same number of seedlings per cm 2 in both methods. The stem thickness and leaf stage was 1.0 and 2.0 mm for the seedlings raised by both methods. The seedling height was a little less, 56.67 mm, for man-ually raised seedlings as compared to 65.0 mm for mechanically raised nursery. The average mat thickness was 20.0 mm, which is as per the requirement for mechanically raised nursery, whereas for manually raised nursery it was only 15.0 mm,
which is less than the required mat thickness. Thus, the results of seed-ling characteristics raised by the de-veloped device were at par with the manually raised mat type nursery.
ConclusionsBased on the experimental results
it could be concluded that the devel-oped device can be used success-fully for raising mat type nursery provided the length of the sprout is at the initiation stage. At this
stage of sprout length the device gave good results especially with respect to uniformity of seed place-ment over the nursery frames. The recommended quantity of seed per mat (80-100 g) could be achieved in 3 passes of the device when sprout length was 1.03 mm. At 3.48 and 4.64 mm sprout length, the recom-mended quantity of seed per mat could be achieved in 4 and 5 passes of the device, respectively. The de-vice saved time and labour of 72.02 and 33.33 percent respectively over
(continued on page63)

VOL.39 NO.2 2008 AGRICULTURAL MECHANIZATION IN ASIA, AFRICA, AND LATIN AMERICA 71
Development of a Prototype Dehuller for Pretreated Chickpea
byB. Sanjeeva ReddyScientistCentral Research Institute for Dryland Agriculture,Hyderabad,[email protected]
V. MaruthiScientistCentral Research Institute for Dryland Agriculture,Hyderabad,INDIA
AbstractA prototype machine was devel-
oped for dehulling of pretreated pulse grain. The dehulling unit con-sists of an abrasive roller and a sta-tionery concentric perforated mesh drum over it. The separation of hull and splitting of chickpea grain was effected by abrasive action and shear forces caused on the grain when the roller rotates in the drum. The machine was tested using conventional and improved grain pretreatment methods. A dehulling index of 0.93 and dhal recovery of 78 percent were obtained with im-proved pretreatment method.
IntroductionPulses are among the ancient food
crops with evidence of their cultiva-tion for over 8000 years. Besides being a rich and the cheapest source of dietary protein and a valuable an-imal feed, they also play a key role in improving and sustaining soil productivity. About 15 percent of the dietary protein is met from puls-es in India as compared to 9 percent in Asia, and 7 percent in the world. They not only add to the quantity of protein in the diet but also im-prove its quality by balancing the essential amino acid pattern in the
mixed diets. Chickpea is the most important pulse crop of the Indian subcontinent, accounting 47 percent of the total pulse production from 33 percent of the total pulse area. Generally, chickpea is consumed in the form of dehusked splits (dhal) or besan obtained from the dhal. Removal of the seed coat reduces roughage, improves storability and palatability for consumption in vari-ous forms. It also improves soaking, cooking quality and digestibility.
The dehulling of chickpea has emerged as a large scale value ad-dition commercial operation, from a small scale traditional process. It is estimated that about 50 percent of the chickpea dehulling is still carried out on a cottage industry level by the farmers and small re-tailers either traditionally using stone chakki or mechanically using dehullers. Several small millers pro-cess 100 to 500 kg of grain per day either for trade purpose or custom hiring basis as a home scale opera-tion.
The t radit ional stone chakki method is a slow and very laborious process. The dehulling technology of chickpea, at the small scale com-mercial level involves two basic op-erations, i.e. loosening of the husk by soaking the grain 5-6 hours fol-lowed by sun drying that splits the grain into cotyledons using emery
coated disks and rollers. Abrasive dehulling is much faster and less te-dious, but it causes excessive break-age losses of cotyledons in the hull fraction, yielding a low quality end product with more losses. Prolonged soaking of the chickpea grain in water also causes cup formation in cotyledons resulting in poor qual-ity dhal. Hence, there is a great demand from the traditional pulse processors to upgrade their existing milling machinery and improve pre-treatment procedures.
Chickpea can be dehulled with less loss and higher quality dhal than is possible with current me-chanical dehullers if proper pre-treatment methods and dehulling equipment could be developed. Pre-treatment such as wet or dry condi-tioning have been used for centuries in pigeonpea dehulling with great success in the traditional dehulling system to facilitate the removal of seed coat and splitting of cotyle-dons. The pretreatments followed in pigeonpea should not be followed as it is, because, it is considered hard to mill grain compared with chick-pea. Hence, incorporation of some of the underlying principles com-monly used in traditional dehulling system using mechanical dehulling machinery could lead to less break-age of chickpea during the dehull-ing process due to loosening of seed

AGRICULTURAL MECHANIZATION IN ASIA, AFRICA, AND LATIN AMERICA 2008 VOL.39 NO.272
coat from the cotyledons. Attempts have been made to
develop small scale dehullers (ca-pacity ranging 100-150 kg/hour) for pretreated pulse grain but with little success so far. Lal et al. (2004) developed a small capacity dhal chakki for pretreated pulses. Their mill consisted of two 15 cm diame-ter cast steel disks. One is stationery and the other is rotates within an 18 cm diameter housing. The grain was passed in between the plates by adjusting the gap between them. Dehulling and splitting was accom-plished by the shear and frictional action on the grain, which took place between the stationery and rotating disks. The hull and the fine powdery materials were separated from the dhal by a cyclone separa-tor. Anonymous (2003) described a method for dehulling chickpea grain for dhal making use of a roller type dehuller. The process improved the recovery and quality of dhal. In order to substitute the traditional village level processing, CFTRI has developed an integrated small scale pulse processing unit- mini dhal mill. This consisted of a dehusking unit, aspirator and a reciprocating sieve, all run by a one horse power motor (Annual report, 1990, CF-TRI).
Materials and MethodsConstruction of the Dehuller
An abrasive roller type small ca-pacity chickpea dehuller was devel-oped at CRIDA. The main part of the dehuller consisted of an abrasive coated truncated cone roller (30 to 25 cm diameter, 60 cm length) and a concentric mesh drum, which was made from 1.5 mm thick, 2 mm di-ameter mesh holes mild steel sheet rolled into a cylinder. To develop the roller, two 2.5 cm thick, 27.5 and 22.5 cm diameter cast iron plates were selected and joined together using 1 cm uniform thickness and 60 cm length, good quality wooden
flats to form a cylinder structure. To ensue a proper rough surface over the cylinder, medium grit size B- type carborundum abrasive mate-rial was plastered uniformly over the wooden surface to a thickness of 1.5 cm (Fig. 2). This abrasive surface was durable and easy to repair in case of wear during opera-tion. The annular space between the mild steel drum and abrasive roller was kept at 1.5 cm. In operation, the abrasive surface inter-locked with the grain mass forcing grain to move along the peripheral surface of the roller; but the movement was restricted by the surrounding grain layer, which was confined by the stationery drum surface. As a result, the abrasive action; grain against grain, grain against abrasive roller surface and grain against drum sur-face was created, thus, increasing the dehulling efficiency.
The drum was fixed to a 95 × 64 cm rectangular frame made of 75 mm angle iron. A drive shaft 50 mm in diameter ran through the axis of the drum carrying the abra-sive roller bolted on each side of the shaft (Fig. 1). The drive shaft was mounted on pedestal bearings and
fitted to a pulley driven through a V-belt by a 3-horsepower electric motor. For loading and unloading of the grain in the machine, an inlet hopper was provided on upper top-side of the drum and an outlet at the lower end of the drum cover plate. The dhal delivered at the outlet by the dehuller contained considerable amount of husk. To separate these hulls, an aspirator containing four numbers of 75 × 62 mm size blades inside, was fitted to the machine. The product outlet duct of the de-huller was connected to the aspira-tor through a 5.5 cm diameter flex-ible hose pipe. The fan was driven from an auxiliary 2.5 cm diameter shaft, which was driven by the mo-tor through a V-belt and pulley.
Grain Pretreatment Procedure As shown in Fig. 2 in the present
study the cleaned grain was passed through the roller machine with lighter force, which caused a mild abrasion (tempering operation). This tempering caused slight scratches on the seeds and enhances their wa-ter absorbing efficiency, leading to the loosening of the seed coat. The grain material was then treated with
Fig. 1 Chickpea dehuller
1
2 3 4
5
6
78
Front viewSide view
Roller10 12
24
1: Motor with plat form, 2: Main frame, 3: Abrasive roller, 4: Enclosed mesh drum, 5: Pedestal with bearing, 6: Grain hopper, 7: Suction fan, 8: Outlet
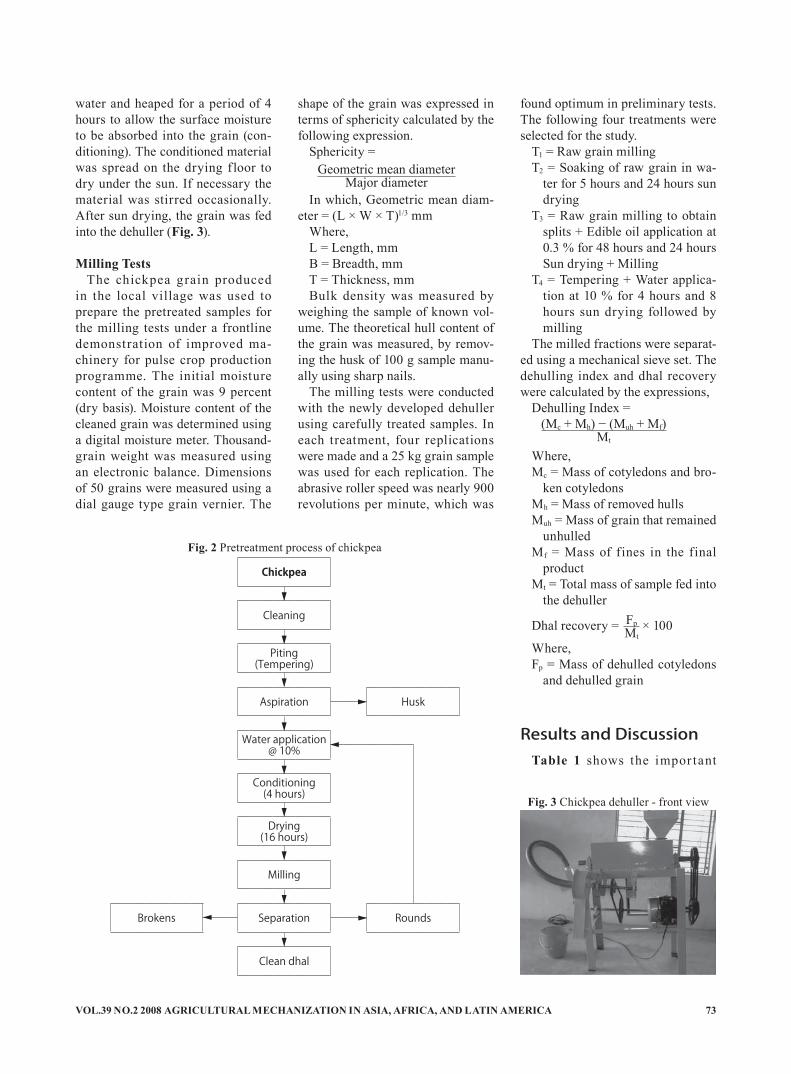
VOL.39 NO.2 2008 AGRICULTURAL MECHANIZATION IN ASIA, AFRICA, AND LATIN AMERICA 73
Geometric mean diameterMajor diameter
water and heaped for a period of 4 hours to allow the surface moisture to be absorbed into the grain (con-ditioning). The conditioned material was spread on the drying f loor to dry under the sun. If necessary the material was stirred occasionally. After sun drying, the grain was fed into the dehuller (Fig. 3).
Milling Tests The chickpea grain produced
in the local village was used to prepare the pretreated samples for the milling tests under a frontline demonstration of improved ma-chinery for pulse crop production programme. The initial moisture content of the grain was 9 percent (dry basis). Moisture content of the cleaned grain was determined using a digital moisture meter. Thousand-grain weight was measured using an electronic balance. Dimensions of 50 grains were measured using a dial gauge type grain vernier. The
shape of the grain was expressed in terms of sphericity calculated by the following expression.
Sphericity =
In which, Geometric mean diam-eter = (L × W × T)1/3 mm
Where,L = Length, mmB = Breadth, mmT = Thickness, mmBulk density was measured by
weighing the sample of known vol-ume. The theoretical hull content of the grain was measured, by remov-ing the husk of 100 g sample manu-ally using sharp nails.
The milling tests were conducted with the newly developed dehuller using carefully treated samples. In each treatment, four replications were made and a 25 kg grain sample was used for each replication. The abrasive roller speed was nearly 900 revolutions per minute, which was
found optimum in preliminary tests. The following four treatments were selected for the study.
T1 = Raw grain millingT2 = Soaking of raw grain in wa-
ter for 5 hours and 24 hours sun drying
T3 = Raw grain milling to obtain splits + Edible oil application at 0.3 % for 48 hours and 24 hours Sun drying + Milling
T4 = Tempering + Water applica-tion at 10 % for 4 hours and 8 hours sun drying followed by milling
The milled fractions were separat-ed using a mechanical sieve set. The dehulling index and dhal recovery were calculated by the expressions,
Dehulling Index =
Where,Mc = Mass of cotyledons and bro-
ken cotyledons Mh = Mass of removed hulls Muh = Mass of grain that remained
unhulled Mf = Mass of fines in the final
productMt = Total mass of sample fed into
the dehuller
Dhal recovery = × 100
Where, Fp = Mass of dehulled cotyledons
and dehulled grain
Results and Discussion Table 1 shows the impor tant
(Mc + Mh) − (Muh + Mf)Mt
FpMt
Chickpea
Cleaning
Piting(Tempering)
Aspiration Husk
Water application @ 10%
Conditioning(4 hours)
Drying(16 hours)
Milling
Brokens Separation Rounds
Clean dhal
▼
▼
▼
▼
▼
▼▼▼
▼
▼
▼
▼
▼
Fig. 2 Pretreatment process of chickpea
Fig. 3 Chickpea dehuller - front view
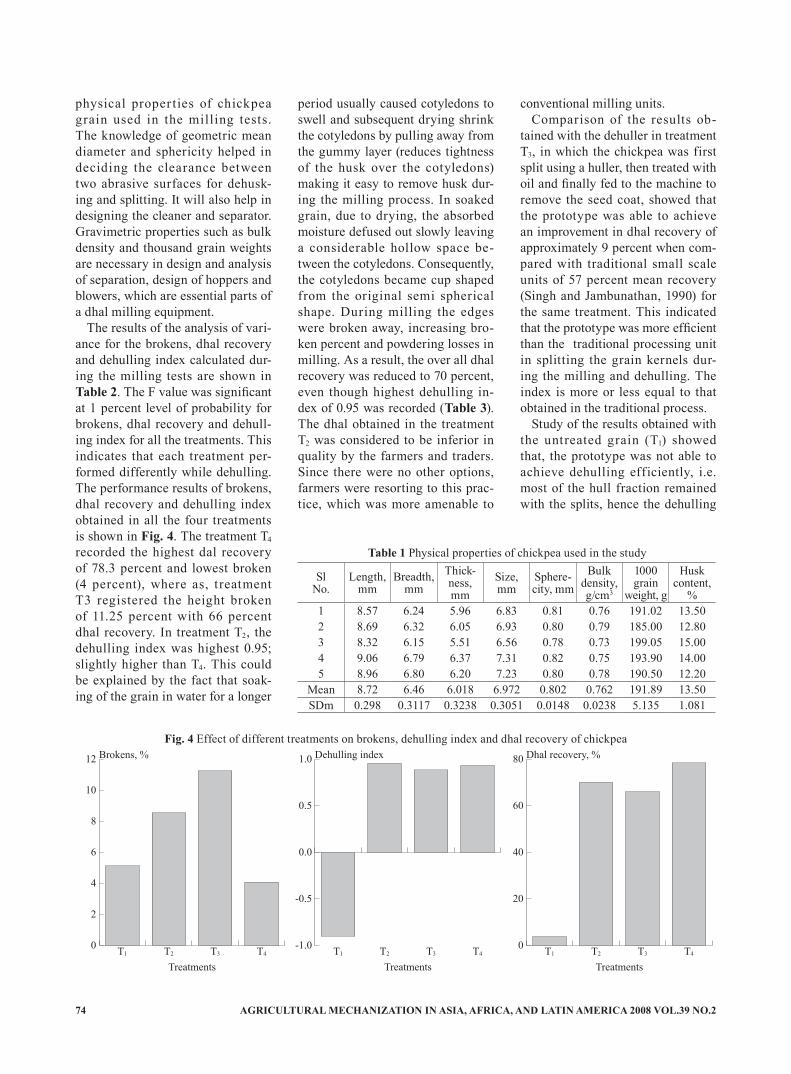
AGRICULTURAL MECHANIZATION IN ASIA, AFRICA, AND LATIN AMERICA 2008 VOL.39 NO.274
physical proper ties of chickpea grain used in the milling tests. The knowledge of geometric mean diameter and sphericity helped in deciding the clearance between two abrasive surfaces for dehusk-ing and splitting. It will also help in designing the cleaner and separator. Gravimetric properties such as bulk density and thousand grain weights are necessary in design and analysis of separation, design of hoppers and blowers, which are essential parts of a dhal milling equipment.
The results of the analysis of vari-ance for the brokens, dhal recovery and dehulling index calculated dur-ing the milling tests are shown in Table 2. The F value was significant at 1 percent level of probability for brokens, dhal recovery and dehull-ing index for all the treatments. This indicates that each treatment per-formed differently while dehulling. The performance results of brokens, dhal recovery and dehulling index obtained in all the four treatments is shown in Fig. 4. The treatment T4 recorded the highest dal recovery of 78.3 percent and lowest broken (4 percent), where as, treatment T3 registered the height broken of 11.25 percent with 66 percent dhal recovery. In treatment T2, the dehulling index was highest 0.95; slightly higher than T4. This could be explained by the fact that soak-ing of the grain in water for a longer
SlNo.
Length, mm
Breadth, mm
Thick-ness, mm
Size, mm
Sphere-city, mm
Bulk density, g/cm3
1000 grain
weight, g
Husk content,
%1 8.57 6.24 5.96 6.83 0.81 0.76 191.02 13.502 8.69 6.32 6.05 6.93 0.80 0.79 185.00 12.803 8.32 6.15 5.51 6.56 0.78 0.73 199.05 15.004 9.06 6.79 6.37 7.31 0.82 0.75 193.90 14.005 8.96 6.80 6.20 7.23 0.80 0.78 190.50 12.20
Mean 8.72 6.46 6.018 6.972 0.802 0.762 191.89 13.50SDm 0.298 0.3117 0.3238 0.3051 0.0148 0.0238 5.135 1.081
Table 1 Physical properties of chickpea used in the study
period usually caused cotyledons to swell and subsequent drying shrink the cotyledons by pulling away from the gummy layer (reduces tightness of the husk over the cotyledons) making it easy to remove husk dur-ing the milling process. In soaked grain, due to drying, the absorbed moisture defused out slowly leaving a considerable hollow space be-tween the cotyledons. Consequently, the cotyledons became cup shaped from the original semi spherical shape. During milling the edges were broken away, increasing bro-ken percent and powdering losses in milling. As a result, the over all dhal recovery was reduced to 70 percent, even though highest dehulling in-dex of 0.95 was recorded (Table 3). The dhal obtained in the treatment T2 was considered to be inferior in quality by the farmers and traders. Since there were no other options, farmers were resorting to this prac-tice, which was more amenable to
conventional milling units.Comparison of the results ob-
tained with the dehuller in treatment T3, in which the chickpea was first split using a huller, then treated with oil and finally fed to the machine to remove the seed coat, showed that the prototype was able to achieve an improvement in dhal recovery of approximately 9 percent when com-pared with traditional small scale units of 57 percent mean recovery (Singh and Jambunathan, 1990) for the same treatment. This indicated that the prototype was more efficient than the traditional processing unit in splitting the grain kernels dur-ing the milling and dehulling. The index is more or less equal to that obtained in the traditional process.
Study of the results obtained with the untreated grain (T1) showed that, the prototype was not able to achieve dehulling efficiently, i.e. most of the hull fraction remained with the splits, hence the dehulling
Brokens, %
0
2
4
6
8
10
12
T4T3T2T1
Treatments
Dehulling index
-1.0
-0.5
0.0
0.5
1.0
T4T3T2T1
Treatments
Dhal recovery, %
0
20
40
60
80
T4T3T2T1
Treatments
Fig. 4 Effect of different treatments on brokens, dehulling index and dhal recovery of chickpea

VOL.39 NO.2 2008 AGRICULTURAL MECHANIZATION IN ASIA, AFRICA, AND LATIN AMERICA 75
Source df SS MS FBrokens
Replications 3 7.755 2.585Treatments 3 129.145 43.048 7.03**Error 9 55.140 6.127Total 15 192.040
Dehulling indexReplications 3 0.008 0.003Treatments 3 10.012 3.337 2,280.68**Error 9 0.013 0.001Total 15 10.033
Dhal recoveryReplications 3 75.563 25.188Treatments 3 14,087.810 4,695.938 270.81**Error 9 156.063 17.340Total 15 14,319.440
Table 2 Analysis of variance for brokens, dehulling index and dhal recovery
** = Significant at 1 % level
Sl. No. Item T1 T2 T3 T4 Mean
1 Rank 3 2 1 4Brokens, % 5.125 8.550 11.250 4.075 7.250
2 Rank 1 4 2 3Dehulling index -0.903 0.955 0.883 0.933 0.467
3 Rank 1 3 2 4Dhal recovery, % 3.75 70.125 66.00 78.375 54.562
Table 3 Table of means for brokens, dehulling index and dhal recovery
index was found to be negative. The over all results obtained in these experiment indicated that there was a substantial improvement of the de-hulling index by milling tempered and conditioned grain (T4) using the prototype compared to dehull-ing of T2 and T3 treatments which were conventionally used. The dhal recovery levels from the prototype dehuller were also substantially higher compared to conventional milling units. In addition, the yields obtained were comparable with large scale commercial milling units where the yields varies between 70-80 percent (Singh and Jambuna-than, 1990).
ConclusionsA small capacity prototype de-
huller for pretreated chickpea in-corporating basic principles from both traditional and mechanical
dehulling systems was developed. The performance of the prototype was evaluated using four treatments consisting of both traditional and improved pretreatment methods. The grain scratched and moistened to 18 percent moisture content for 4 hours followed by sun drying16 hours yielded a dehulling index of 0.93. This indicated that most of the grain was fractionated into hulls and cotyledons. The dehulling index of the unconditioned control sample was -0.90 indicating that most of the grain sample was either broken or remained unhulled.
Comparison of the results ob-tained from the conventional treat-ments revealed that an average of 9 and 13 percent improvement in dhal recovery was achieved using the abrasive dehuller. The over all results indicated that it was possible to obtain higher recovery levels and higher dehulling index with the newly developed prototype dehuller
than conventional milling units.
REFERENCES
Annual Repor t . 1990. CFTRI, Mysore, India.
Anonymous. 2003. NATP Project Report on Upgradation and Evalu-ation of Mini dhal mills (RPPS-4), CRIDA Centre, Hyderabad, India.
Lal, R. R., Prasoon Verma, and B. Sanjeeva Reddy. 2004. Develop-ment and Evaluation of a low ca-pacity Dhal chakki for pretreated Pigeonpea (Cajanus cajan L). In-dian Journal of Dryland Agricul-tural Research and Development, 19(2): 138-142.
Singh, U. and R. Jambunathan. 1990. Pigeonpea: Postharvest technology. In: Proceedings of the International Workshop on Pigeonpea. Vol. 2: 435-455. ICRI-SAT, Patancheru, A.P. India.
■■

AGRICULTURAL MECHANIZATION IN ASIA, AFRICA, AND LATIN AMERICA 2008 VOL.39 NO.276
Study on Intelligent Measurement and Analysis System of Soil Electric Conductivity
byHe YongProfessor and DeanCollege of Biosystems Engineeringand Food Science, Zhejiang University,Hangzhou 310029, Zhejiang Province, P.R. [email protected]
Chen YongjunPh.D StudentCollege of Biosystems Engineeringand Food Science, Zhejiang University,Hangzhou 310029, Zhejiang ProvinceP.R. CHINA
AbstractA Virtual Instrumentation (VI)
based instrument capable of fast ac-quiring and real-time measuring soil EC was designed. This VI system consisted of a DAQ card 6024E, an EC sensor, a temperature sensor, and signal conditioning modules. Com-pared with traditional instrument, VI is different in system development and design due to the application of common graphical language Lab-VIEW. So the critical technologies VI and software design was ana-lyzed and discussed. Considering the influence factor of soil temperature, the temperature correction method was proposed to eliminate measure-ment errors automatically. So the instrument could measure soil EC at various temperature immediately. In addition, functions, such as data display, data storage, data print and network transmitting, were also re-alized. The precision tests of three KCl standard solutions (different concentration) have been done and the results showed the instrument had high accuracy and strong stabil-ity. This study provides a convenient method for valid measurements of multi-parameters.
IntroductionWith the development of agricul-
tural information technique and pre-cision farming, the soil EC measure-ments have been increasingly gain-ing attention. In terms of dielectric physics, the soil EC measurements belong to the field of theory and methodology research of dielectric wastage measurements. In recent years, the research of agrology shows that soil EC contains abundant infor-mation about soil characteristics and physical properties, which include soil salinity, water content, tempera-ture, organic matter content and tex-ture. In developed countries, it is a hotspot of precision farming research to evaluate the growth condition of a crop by measuring soil EC.
However, at present, there are few instruments for measuring soil EC and most of them can not reach fast and accuracy requirements in the agricultural information acquiring process because of the main defect, most of the traditional instruments use hardware entirely, which results in difficulties to realize temperature compensation that can calibrate the measurement bias. Besides, it is too complicated to use a mathematical model (e.g., four-electrode measure-ment method) for its excessive in-volvement of physical and mathemat-ical methods, although its accuracy is high (Yurui and Maohua, 2001). In order to overcome the drawback mentioned above, the major task is to develop an application program that
can efficiently collect data and timely process them to replace the tradi-tional instruments. To this purpose, we have designed the virtual instru-ment to acquire and measure the soil EC. This instrument was designed to synchronously gain real-time soil EC and soil temperature from sensors, and exteriorly calibrate soil EC via temperature correction.
Development ToolCurrent software for data acquisi-
tion (DA) is increasingly using the virtual instrument (VI) concept, which is a software emulation of a physical instrument. Virtual in-strumentation enables developers to design custom instruments with functionality defined by the user and suited for particular application. Unlike other types of DA software, a VI combines ease of use and flex-ibility, with the possibility of re-use
Fig. 1 Graphical user interface panelof a LabVIEW program takenfrom the sample library
Wu YanpingMs.c. StudentCollege of Biosystems Engineeringand Food Science, Zhejiang University,Hangzhou 310029, Zhejiang ProvinceP.R. CHINA
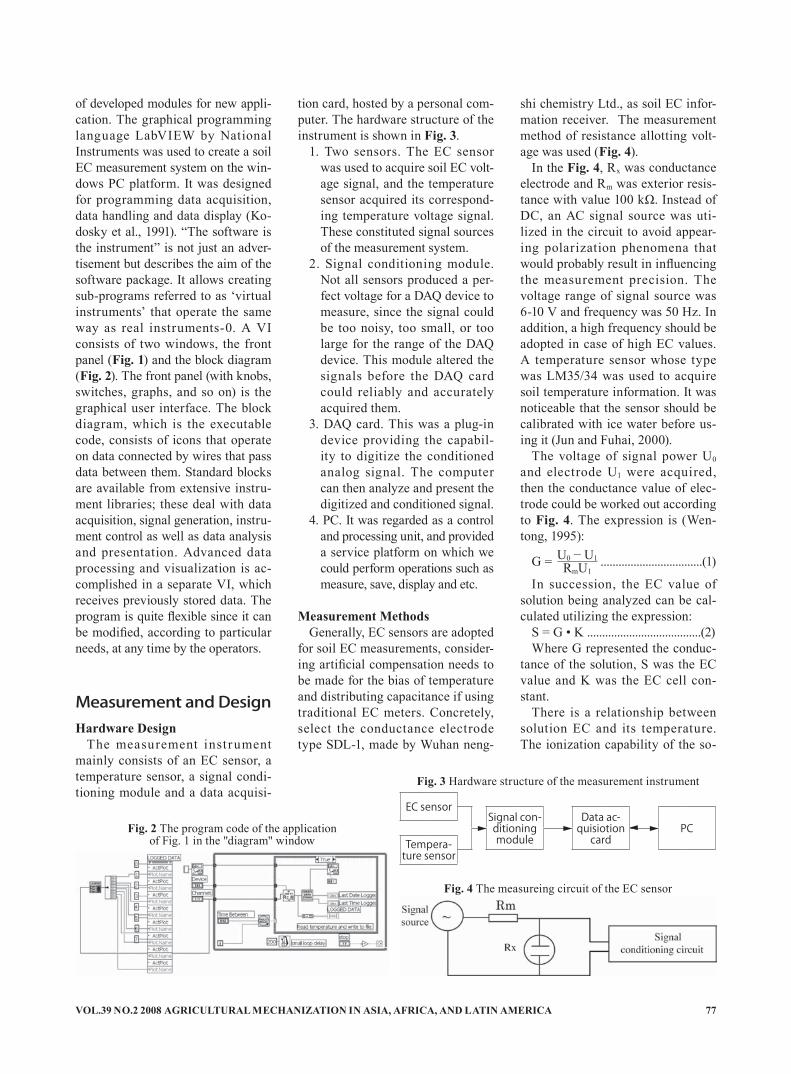
VOL.39 NO.2 2008 AGRICULTURAL MECHANIZATION IN ASIA, AFRICA, AND LATIN AMERICA 77
of developed modules for new appli-cation. The graphical programming language LabVIEW by National Instruments was used to create a soil EC measurement system on the win-dows PC platform. It was designed for programming data acquisition, data handling and data display (Ko-dosky et al., 1991). “The software is the instrument” is not just an adver-tisement but describes the aim of the software package. It allows creating sub-programs referred to as ‘virtual instruments’ that operate the same way as real instruments-0. A VI consists of two windows, the front panel (Fig. 1) and the block diagram (Fig. 2). The front panel (with knobs, switches, graphs, and so on) is the graphical user interface. The block diagram, which is the executable code, consists of icons that operate on data connected by wires that pass data between them. Standard blocks are available from extensive instru-ment libraries; these deal with data acquisition, signal generation, instru-ment control as well as data analysis and presentation. Advanced data processing and visualization is ac-complished in a separate VI, which receives previously stored data. The program is quite flexible since it can be modified, according to particular needs, at any time by the operators.
Measurement and DesignHardware Design
The measurement inst rument mainly consists of an EC sensor, a temperature sensor, a signal condi-tioning module and a data acquisi-
tion card, hosted by a personal com-puter. The hardware structure of the instrument is shown in Fig. 3.
1. Two sensors. The EC sensor was used to acquire soil EC volt-age signal, and the temperature sensor acquired its correspond-ing temperature voltage signal. These constituted signal sources of the measurement system.
2. Signal conditioning module. Not all sensors produced a per-fect voltage for a DAQ device to measure, since the signal could be too noisy, too small, or too large for the range of the DAQ device. This module altered the signals before the DAQ card could reliably and accurately acquired them.
3. DAQ card. This was a plug-in device providing the capabil-ity to digitize the conditioned analog signal. The computer can then analyze and present the digitized and conditioned signal.
4. PC. It was regarded as a control and processing unit, and provided a service platform on which we could perform operations such as measure, save, display and etc.
Measurement MethodsGenerally, EC sensors are adopted
for soil EC measurements, consider-ing artificial compensation needs to be made for the bias of temperature and distributing capacitance if using traditional EC meters. Concretely, select the conductance electrode type SDL-1, made by Wuhan neng-
shi chemistry Ltd., as soil EC infor-mation receiver. The measurement method of resistance allotting volt-age was used (Fig. 4).
In the Fig. 4, Rx was conductance electrode and Rm was exterior resis-tance with value 100 kΩ. Instead of DC, an AC signal source was uti-lized in the circuit to avoid appear-ing polarization phenomena that would probably result in influencing the measurement precision. The voltage range of signal source was 6-10 V and frequency was 50 Hz. In addition, a high frequency should be adopted in case of high EC values. A temperature sensor whose type was LM35/34 was used to acquire soil temperature information. It was noticeable that the sensor should be calibrated with ice water before us-ing it (Jun and Fuhai, 2000).
The voltage of signal power U0 and electrode U1 were acquired, then the conductance value of elec-trode could be worked out according to Fig. 4. The expression is (Wen-tong, 1995):
G = ..................................(1)
In succession, the EC value of solution being analyzed can be cal-culated utilizing the expression:
S = G • K ......................................(2)Where G represented the conduc-
tance of the solution, S was the EC value and K was the EC cell con-stant.
There is a relationship between solution EC and its temperature. The ionization capability of the so-
Fig. 2 The program code of the applicationof Fig. 1 in the "diagram" window
Fig. 3 Hardware structure of the measurement instrument
EC sensorSignal con-ditioning module
Data ac-quisiotion
cardPC
Tempera-ture sensor
▼ ▼▼ ▼
Fig. 4 The measureing circuit of the EC sensor
U0 − U1RmU1

AGRICULTURAL MECHANIZATION IN ASIA, AFRICA, AND LATIN AMERICA 2008 VOL.39 NO.278
lution increases when temperature rises and then the EC is expected to increase. Therefore, considerable attention must be paid to it and the measurement error caused should be eliminated or minimized. In the pro-cess of measuring, the temperature should be kept as close as possible to 25 ºC and be held steady, oth-erwise the temperature correction should be made if the temperature is out of the limits of 25 ±0.5 ºC.
Referring to the relationship men-tioned above, the EC at any tem-perature could be converted into the values at 25 ºC. The well-known ex-pression of GB6908-86 is (Yonghui and Guangming, 1997):
S25 = .......................(3)
where, St is the signal to be trans-formed, S25 is the conjugate of the St and β is the temperature correction coefficient. The formula (3) could be applied to correct measurement results.
Some preprocessing, including
low-pass filtering and difference magnification should be done to the DC signals from the temperature sensor before converting it into digital signals, while an application program was adopted to process the AC signals from the EC sensor be-cause its value was high.
Every DAQ card operated within LabVIEW requires a special driver. Consequently it was decided to use a data acquisition card manu-factured by National Instruments (DAQ 6024E). The card is installed and can be tested by a utility called “NI-DAQ”; the installation of Lab-VIEW which runs automatically. LabVIEW is still very stable without any noticeable change after the au-tomatic installation procedure. The card is the core of hardware that is completely “plug and play” for PCI bus computers and features 12-bit ADCs with 16 analog inputs and 200 KHz maximum sampling rate. It can be easily software-configured and calibrated (KrauB et al., 1999).
Software SolutionsThe front panel (Fig. 5) of the VI is
developed using the LabVIEW (Ze-bao and Linfeng, 1999; LabVIEW, 2000; Wells and Travis, 1997). The acquired signal is displayed as soon as new samples are available. Some controls allow the user to choose the sampling frequency, the number of points displayed and the analog channel to which the input signal is routed. The values assigned to these controls are inputs for the different blocks that constitute the diagram, shown in Fig. 4, for managing the acquisition process.
The VI program, if running, starts the samples acquiring, and allows display of the time-domain shape of the temperature and the voltage along with the value of its ampli-tude (Fig. 6). Once the samples are acquired, the expressions aforemen-tioned are applied to the displayed samples through which leads to on-line processing, while, the results such as soil EC and soil temperature
Materials Test values,μ S/cm
Standard values,μ S/cm
Relative errors
KCl (1 mol/L) 111,850 111,342 0.46 %KCl (0.1 mol/L) 12,935 12,856 0.61 %KCl (0.01 mol/L) 1,390 1,408.8 -1.33 %
Table 1 Comparison of test results and standard velues
Fig. 6 Block diagram of data collection programof the measuring instrument for soil EC
Fig. 5 Front panel of measuring program of soil EC
Fig. 7 The distribution map of soil EC at testing field
St • k1 + β(t − 25)

VOL.39 NO.2 2008 AGRICULTURAL MECHANIZATION IN ASIA, AFRICA, AND LATIN AMERICA 79
are displayed on the panel. The last samples displayed are then saved as an Excel file, or graph saved as a BMP file if “SAVE” button is pressed. Pressing the “REPORT” button causes the report forms to print that have existed, and the “REVIEW” button causes the data in the memory to be retrieved and displayed. Each press of the “STOP” button causes the acquisition pro-cess to stop, and the “PAUSE” but-ton causes a pause in the same way.
In order to accomplish network functions, the modules such as tel-net, ftp and email provided by Lab-VIEW software package are utilized to carry out remote logging in, mail sending, data transmitting and web publishing. Moreover, the graphics can be spread on real time due to using Datasocket tool.
Performance Verification and Experimental Results
The verification test of the mea-surement VI has been performed by measuring the KCl standard solu-tions, which are usually applied to calibration nicety of EC measure-ment instrument, by the reason of those EC values are stable at various temperatures and concentrations. During the verification, above all, the specific demands on experimen-tation were met according to nation-al standard. Successively, three KCl standard solutions of various con-centrations were collocated, which were 1 mol/L, 0.1 mol/L and 0.01 mol/L. Finally, the EC values were obtained by using this measure-ment VI. The comparison of the test results at 25 ºC with their standard values are illustrated in Table 1. It shows that the test results approach to their standard values, and the rela-tive errors are small to some extent.
To obtain soil EC in a scientific way, a measurement experiment was performed in a typical farm field of Zhejiang province. The area
of the test field was about 33 acres, and the hypsography of the field was relatively low in the west and north sections while high in other sections. The map of soil EC of the testing field was determined using the following procedures:
· Soil samples were respectively taken at depth 20 cm for each 50 m on the testing field, then 63 samples were put together.
· The samples were dried in an oven, and then diluted with wa-ter in the weight ratio of 3 to 1 (soil: water).
· The EC values of the samples were obtained using this virtual measurement instrument.
· The distance inverse ratio meth-od and software Arc View were used to analyze the obtained values.
A distribution map of soil EC was eventually obtained as descried in Fig. 7. From the figure, the EC val-ues were relatively great in the west section of the filed while small in other sections.
ConclusionAimed at drawbacks in traditional
instrumentation of soil EC such as coarseness and low-accuracy, a new measurement VI (Virtual Instru-mentation) for automatically mea-suring soil EC, was developed.
Aimed at improving the measure-ment accuracy of the new instru-ment, a suitable method of tempera-ture correction based on a software program was applied to automati-cally eliminate measurement errors.
Aimed at testing the performance of the new VI, an experiment fo-cusing on soil EC was carried out. After analyzing the results of the experiment, it was shown that the VI was fast and accurate in acquir-ing soil EC information.
Due to the application of soft-ware, the measurement VI had a friendly interface and was powerful
with its functions like data display, data storage, data print and network transmitting; it had qualities of real-time, convenience and flexibility.
The study of soil EC measure-ment has provided a methodology for validity measurements of multi-variations, and could be widely used in other fields.
REFERENCES
Yurui, S. and W. Maohua. 2001. A mathematical Model and its experimental study for a kind of measurement method of soil elec-tric conductivity. Transactions of the CSAE. 17(2): 20-23.
Kodosky, J., J. MacCrisken, and G. Rymar. 1991. Visual program-ming using structured data flow. Proc.IEEE Workshop on Visual Languages. Kobe, Japan.
Jun, L. and L. Fuhai. 2000. Detect-ing technique and instrumenta-tion. China Light Industry Publi-cation, China.
Wentong, L. 1995. Discussion on several problems in determination of electric conductivity. Sichuan Power Technique. 18(5): 41-48.
Yonghui, S. and L. Guangming. 1997. Improvement on the method of temperature rectifying calcu-lation of electrical conductivity. Jiangsu environmental science, 19(3): 45-47.
KrauB, A., U. Weimar, and W. Go-pel. 1999. LabVIEW for sensor data acquisition. Trends in ana-lytical chemistry. 18 (5): 312-318.
Zebao, W. and Ba Linfeng. 1999. Labview and virtual instrument design. International instrumenta-tion and automation, Trans. 68-70.
LabVIEW. 1997. LabView user mea-surement manual. Ver.6.0. Texas. 2000, NI, Inc
Wells, L. K. and J. Travis. 1997. LabView for everyone. Prentice Hall, Upper Saddle River NJ. Graphical programming made even easie.
■■

AGRICULTURAL MECHANIZATION IN ASIA, AFRICA, AND LATIN AMERICA 2008 VOL.39 NO.280
Design and Development of a Machine for Aonla Seed Removal
byAmbrish GanachariPost Graduate StudentDept. of Food and Agril. Process Engineering,Agricultural Engineering Collegeand Research Institute,Tamil Nadu Agricultural University,Coimbatore - 641 003INDIA
D. Manohar JesudasProfessorDept. of Farm Machinery and Power,Agricultural Engineering Collegeand Research Institute,Tamil Nadu Agricultural University,Coimbatore - 641 003INDIA
K. ThangavelProfessor and Head Post Harvest Technology CentreAgricultural Engineering Collegeand Research Institute,Tamil Nadu Agricultural University,Coimbatore - 641 003INDIA
R. ViswanathanProfessorDept. of Food and Agril. Process Engineering,Agricultural Engineering Collegeand Research Institute,Tamil Nadu Agricultural University,Coimbatore - 641 003INDIA
AbstractA hand-operated machine for
the removal of seed from the fresh aonla fruit was designed and de-veloped. The machine consisted of fruit seat, fruit punching rod, handle and frame to hold all the parts. The machine had a capacity of 16.66 kg/h or 530 fruits/h. The waste that included the pulp and juice was re-corded to be 10 percent. The cost of the machine calculated was Rs.650, in which only the seat and the punching rod were made of stain-less steel and all others parts were of mild steel. The cost of operation, including the labor cost and depreci-ation was Rs.10.20 per h. The aonla fruit after removal of seed by the machine was used for the produc-tion of intermediate moisture food by osmotic dehydration which had a good consumer acceptance.
IntroductionAonla (Emblica Officinalis) an
edible fruit indigenous to tropical India and South East Asia, is a rich source of vitamin C, Pectins and tannins apart from pharmaceutical properties. Because of its unique nutritive and therapeutic qualities aonla is considered as “Wonder fruit for health”, and it has extensive adoptability to grow in diverse cli-matic and soil conditions. The em-bolic fruit is spherical, smooth and has six ridges extending from the base to the apex that divide it into six months (Barthakur and Arnold, 1990). Aonla fruits are astringent, cooling, anodyne, carminative, di-gestive, stomachic, etc. and its me-dicinal and tanning properties have been reported by Rao and Siddique, 1964; Giri and Banerjee, 1986. The nutritional quality, ease of long dis-tance transportation and Vitamin C stability are properties of the fruit that makes it of interest for commer-cial exploitation. In India, the area under Aonla has increased from just 3,000 hectares in the 1980’s to 50,000 hectares in 2002 (Singh, 2003). Aonla fruit is available only
for a short period (October to Janu-ary), is highly perishable, and it is not consumed as fresh fruit due to its high acidic and astringent taste. Hence, it’s processing and storage is essential. A number of processed products like aonla pulp, RTS, Nec-tar squash, candy, pickle, sauce, fruit toffee and dehydrated shreds are prepared from aonla fruits to improve their acceptability and ex-ploit nutritional qualities, besides its use in ayurvedic formulations.
Seed are required to be removed from the fruit for most of prepara-tions and fruits in full shape or sliced form are needed after seed re-moval for the development of value added products from Aonla.
The shredding and removal of seed from Aonla done are done manually due to non availability of suitable machines. Therefore, a hand-operated machine for removal of seed from Aonla fruit has been developed and its features and per-formances are reported in this pa-per.
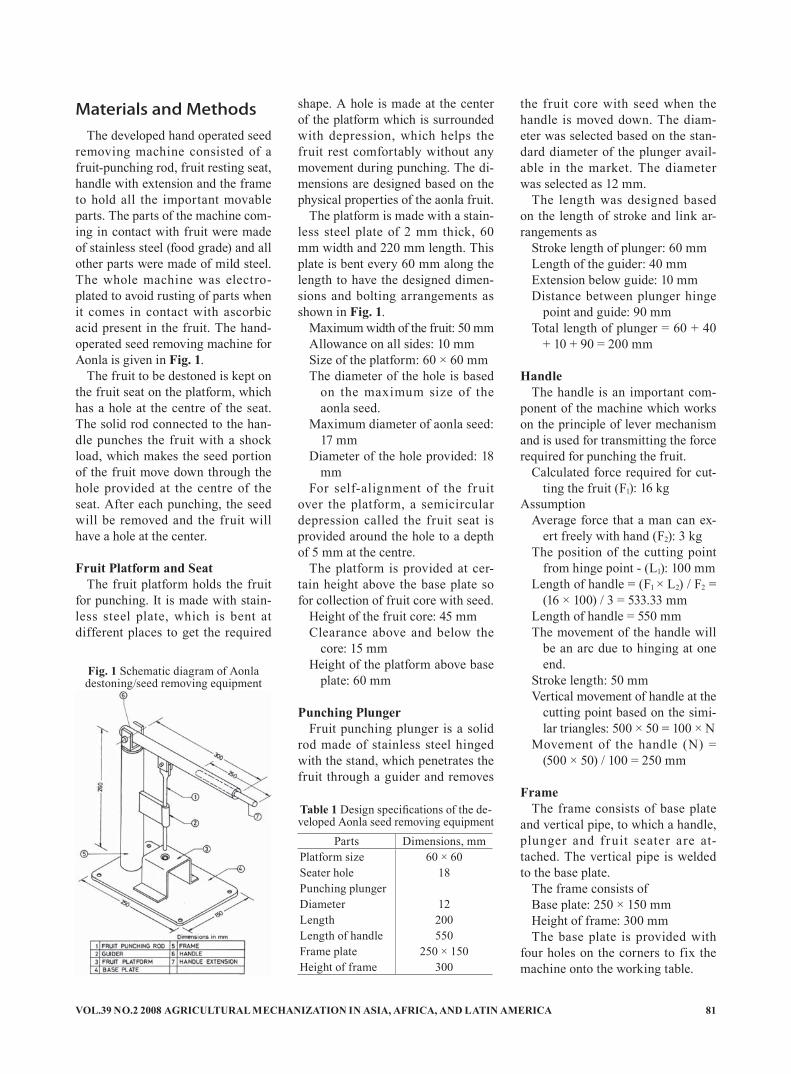
VOL.39 NO.2 2008 AGRICULTURAL MECHANIZATION IN ASIA, AFRICA, AND LATIN AMERICA 81
Materials and MethodsThe developed hand operated seed
removing machine consisted of a fruit-punching rod, fruit resting seat, handle with extension and the frame to hold all the important movable parts. The parts of the machine com-ing in contact with fruit were made of stainless steel (food grade) and all other parts were made of mild steel. The whole machine was electro-plated to avoid rusting of parts when it comes in contact with ascorbic acid present in the fruit. The hand-operated seed removing machine for Aonla is given in Fig. 1.
The fruit to be destoned is kept on the fruit seat on the platform, which has a hole at the centre of the seat. The solid rod connected to the han-dle punches the fruit with a shock load, which makes the seed portion of the fruit move down through the hole provided at the centre of the seat. After each punching, the seed will be removed and the fruit will have a hole at the center.
Fruit Platform and SeatThe fruit platform holds the fruit
for punching. It is made with stain-less steel plate, which is bent at different places to get the required
shape. A hole is made at the center of the platform which is surrounded with depression, which helps the fruit rest comfortably without any movement during punching. The di-mensions are designed based on the physical properties of the aonla fruit.
The platform is made with a stain-less steel plate of 2 mm thick, 60 mm width and 220 mm length. This plate is bent every 60 mm along the length to have the designed dimen-sions and bolting arrangements as shown in Fig. 1.
Maximum width of the fruit: 50 mmAllowance on all sides: 10 mmSize of the platform: 60 × 60 mmThe diameter of the hole is based
on the maximum size of the aonla seed.
Maximum diameter of aonla seed: 17 mm
Diameter of the hole provided: 18 mm
For self-alignment of the fruit over the platform, a semicircular depression called the fruit seat is provided around the hole to a depth of 5 mm at the centre.
The platform is provided at cer-tain height above the base plate so for collection of fruit core with seed.
Height of the fruit core: 45 mmClearance above and below the
core: 15 mmHeight of the platform above base
plate: 60 mm
Punching PlungerFruit punching plunger is a solid
rod made of stainless steel hinged with the stand, which penetrates the fruit through a guider and removes
the fruit core with seed when the handle is moved down. The diam-eter was selected based on the stan-dard diameter of the plunger avail-able in the market. The diameter was selected as 12 mm.
The length was designed based on the length of stroke and link ar-rangements as
Stroke length of plunger: 60 mmLength of the guider: 40 mmExtension below guide: 10 mmDistance between plunger hinge
point and guide: 90 mmTotal length of plunger = 60 + 40
+ 10 + 90 = 200 mm
Handle The handle is an important com-
ponent of the machine which works on the principle of lever mechanism and is used for transmitting the force required for punching the fruit.
Calculated force required for cut-ting the fruit (F1): 16 kg
AssumptionAverage force that a man can ex-
ert freely with hand (F2): 3 kgThe position of the cutting point
from hinge point - (L1): 100 mmLength of handle = (F1 × L2) / F2 =
(16 × 100) / 3 = 533.33 mmLength of handle = 550 mmThe movement of the handle will
be an arc due to hinging at one end.
Stroke length: 50 mmVertical movement of handle at the
cutting point based on the simi-lar triangles: 500 × 50 = 100 × N
Movement of the handle (N) = (500 × 50) / 100 = 250 mm
FrameThe frame consists of base plate
and vertical pipe, to which a handle, plunger and fruit seater are at-tached. The vertical pipe is welded to the base plate.
The frame consists ofBase plate: 250 × 150 mmHeight of frame: 300 mmThe base plate is provided with
four holes on the corners to fix the machine onto the working table.
Fig. 1 Schematic diagram of Aonla destoning/seed removing equipment
Parts Dimensions, mmPlatform size 60 × 60Seater hole 18Punching plungerDiameter 12Length 200Length of handle 550Frame plate 250 × 150Height of frame 300
Table 1 Design specifications of the de-veloped Aonla seed removing equipment

AGRICULTURAL MECHANIZATION IN ASIA, AFRICA, AND LATIN AMERICA 2008 VOL.39 NO.282
Performance Evaluation of the Machine
The performance of the developed Aonla fruit seed removing machine was evaluated based on its capacity, efficiency, percent pulp waste, per cent juice waste and percent pulp re-covery. The capacity of the machine was determined by calculat ing time of operation and weight of the aonla fruits used for seed removal. The capacity was also calculated in terms of number of fruits, since the time required for deseeding a small or large fruit is almost the same. The efficiency of the pulping was calculated based on the amount of pulp that could be obtained by the machine from the total amount of pulp present in the fruit.
Efficiency of Pulping = Amount of pulp out put along with de-seeded fruit / Total amount of pulp present fruit
The recovery percent indicates the capacity of the mechanism to recover the fruit pulp with respect to the total weight of the fruit including seed.
Recovery percentage = Weight of the pulp recovered / Total weight of the fruit
The economics of the developed machine was estimated by consid-ering the cost of the raw materials, overhead charges and labor charges. The cost of operation was calculated by estimating the fixed cost and variable cost.
Results and DiscussionThe specifications of the devel-
oped hand operated destoner/seed removing machine is given in the Table 1.
Performance Evaluation of the Machine
The capacity of the machine was found to be 16.66 kg/h and 530 fruits/h. The capacity of the machine was also determined on per day basis, which was 128 kg/day and 4,240
fruits/day, which a single labor can operate. Manual removal of seed is very laborious because of the hardy nature of the fruit; hence, the fruit needs prior blanching to remove the seed, which causes the loss of valu-able nutrients. The developed machine would be useful to remove the seeds from the fresh fruits and the deseeded fruits could be used for juice extrac-tion without any loss of nutrients. The fresh fruit after the removal of seed could also be used for the preparation of value added products and interme-diate moisture foods. The fresh Aonla fruit and fruit after removal of seed is shown in Figs. 2 and 3.
The mean value for efficiency of pulping was 90.65 percent. The 10 percent loss was due to adherence of hard fibers along with some pulp attached to the seed and draining of juice during the punching operation. It was found that 7.75 percent of pulp and 2.1 percent of juice was going as waste along with seed. The loss of pulp might be due to structural ar-rangement of the seed present almost at the center of the fruit, which was also removed while punching with a solid rod and the loss of juice might be due to shock load application. The recovery percent of the devel-oped mechanism was was 86.3.
Cost Economics The cost of the newly developed
machine was Rs.650. The cost of operation calculated was Rs.10.2 per hour.
ConclusionsA hand operated machine for the
removal of the seed from Aonla fruit was designed and developed. The developed machine had a capacity of 16.66 kg/h and 530 fruits/h. The waste that included the pulp and juice during seed removal was 10 percent. The ef-ficiency of pulping was 90.65 percent. The cost of the machine was Rs.650, in which the fruit platform and the punching rod were made of stainless steel and all others parts were of mild steel, which was electroplated. The cost of operation including the labor cost, depreciation and interest was Rs.10.2 per h. The developed machine could be used to remove seed from the fresh Aonla fruit and the deseeded Aonla fruit could be used in full shape for further value addition.
REFERENCES
Barthakur, N. N. and N. P. Arnold. 1991. Chemical analysis of the emblic (phyllanthus emblica L.) and its potential as a food source. Scientia Horticulturae, 47: 99-105.
Giri, A. K. and T. S. Banerjee. 1986. Antagonistic activity of herbal drug (Phyllanthus emblica) on cy-tological effects of environmental chemicals in mammalian cells.Cytologica, 15: 375-380.
Rao, M. R. R. and H. H. Siddique. 1964. Pharmacological studies on Emblica officinalis Gaertn. Indian J. Exp.Biol., 2: 29-31.
Singh, H. P. 2003. Augmentation of production and utilization of Aonla. National seminar on pro-duction and utilization of Aonla, 8-10 August, Salem, India. ■■
Fig. 2 Three varities of fresh Aonla fruit
Fig. 3 Aonla fruit after seed removalFig. 4 Aonla seed removing equipment

VOL.39 NO.2 2008 AGRICULTURAL MECHANIZATION IN ASIA, AFRICA, AND LATIN AMERICA 83
Agricultural Mechanization in BangladeshbyK. C. RoyChief Scientific OfficerFarm Machinery andPostharvest Process Engineering Division,Bangladesh Agricultural Research Institute,Gazipur, [email protected]
Gajendra SinghVice ChancellorDoon University,Dehradun,Uttarakhand, [email protected]
AbstractIn Bangladesh about 52 percent
of the work force are engaged in the agriculture sector, which contrib-utes about 21 percent to the gross domestic product. This indicates a very low labour productivity. It can be enhanced through increased use of agricultural machinery. High yielding varieties cover more than 80 percent of the production of rice, wheat, maize and potatoes. Use of fertilizers and agrochemicals are in-creasing every year. Water pumping for irrigation was first mechanized and, at the present time, 55 percent of the cultivable area is under irriga-tion, mainly by pumped groundwa-ter. The next operation that has been mechanized is the tillage operation mainly done by power tillers (single axle hand tractor) as the average farm size is very small. At present about 80 percent of the land prepara-tion is by power tillers and tractors. The next operation that is being rap-idly mechanized is threshing. Farm power availability was only 0.24 kW/ha in 1960, which has increased to 1.05 kW/ha in 2006. It is expected that the power will continue to in-crease further at a faster rate as there are many important agricultural operations that are yet to be mecha-nized. Due to various reasons, the degree of mechanization as well as contribution of agriculture to gross domestic product varied in different regions. With the increase of farm power availability and fertilizers, the
yield of crops continued to increase. Engines of shallow tubewell pumps are also widely used to power coun-try boats, small three wheelers, rice mills, etc. Power tillers are used to some extent for haulage, but tractors are mainly used for this purpose.
IntroductionBangladesh is a big delta plain
formed by the three great rivers Ganges, Brahmaputra and Meghna (GBM). A total of 700 rivers f low throughout the country having a to-tal length of 22,155 km (BBS, 2002) covering the country like veins and arteries of a human body, and flow-ing down to the Bay of Bengal. Out of these rivers, 57 originate from In-dia and Mayanmar (Zaman, 2000). The country is bordered by India on the east, west and north and by the Bay of Bengal on the south. There is also a small strip of border with Mayanmar on the southeastern edge (Fig. 1). The country is situated in the northeastern part of South Asia, between 20º34′ and 26º38′ North latitude and 88º01′ and 92º41′ East longitude.
Area, Climate, Soils, Rainfall Pat-tern and Agricultural Resources
Bangladesh has an area of 147,570 sq. km, i.e. 14.75 mha of which 8.29 mha is cultivable land. Of the cultivable land 7.19 mha, i.e. 87 per-cent is cultivated. It has a tropical and sub-tropical monsoon climate.
Sweltering heat and high humidity prevail for major part of the year. Though the country has six seasons - summer, rainy, autumn, late autumn, winter and spring, four seasons are quite distinct. They are summer, rainy, autumn and winter. Monsoon starts in June and continues up to August. Rainfall during this period varies from 1,600 to 2,000 mm in the west, 2,000 to 4,000 mm in the southeast and 2,500 to 4,000 mm in the northeast. On an average, 61 per-cent of annual rainfall occurs during this period and only 3.5 percent dur-ing November to March (Rabi sea-son) (Manalo, 1980). The country on an average receives about 2,030 mm rainfall annually ranging from 1,033 mm (in the northwest) to 5,412 mm (in the northeast). The country faces drainage problem during the rainy season, which in some years turns into heavy flood inundating as high as two-thirds of the country. Fig. 2 shows the average monthly rainfall and evaporation of Dhaka, which is a typical representation of many ar-eas of the country. It is conspicuous from the figure that during the Rabi season, crop production suffers if ir-rigation is not applied.
The winter, from December to February, is quite pleasant. The average minimum temperature ranges from 7.2 to 12.7 ºC and the maximum from 23.9 to 31.1 ºC. The mean temperature during the cool-est month (January) ranges from 17 to 19 ºC with December and Febru-ary 1 to 2 degrees hotter.
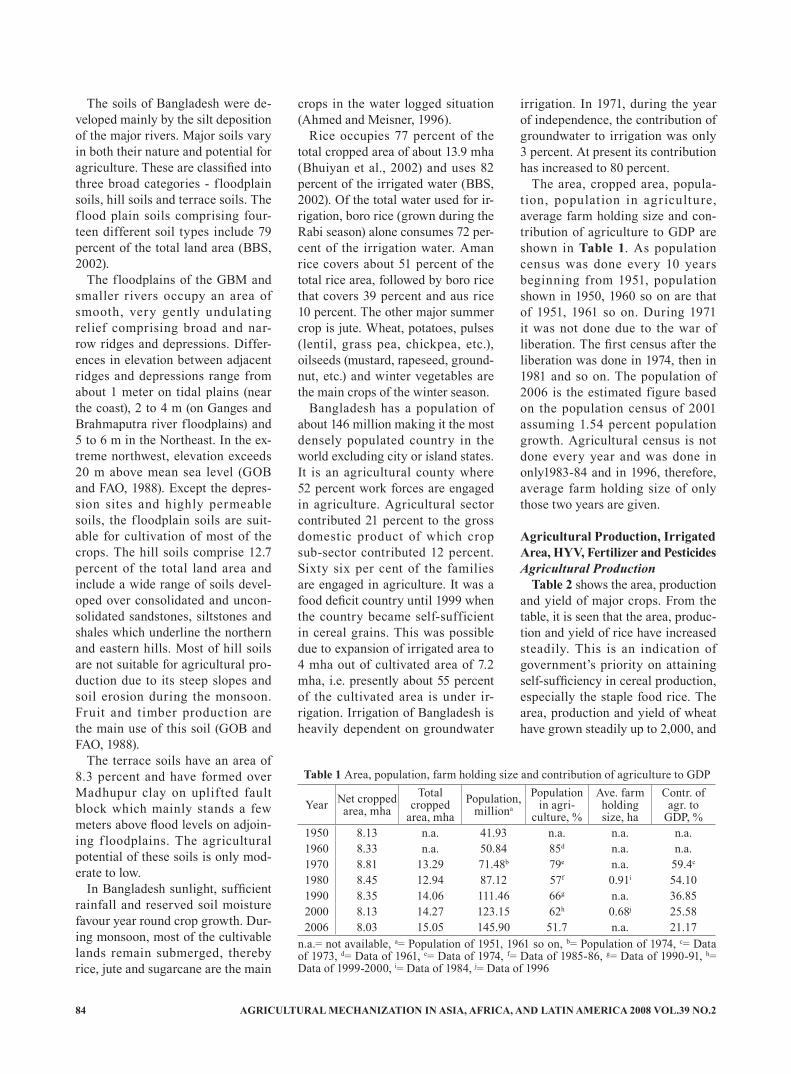
AGRICULTURAL MECHANIZATION IN ASIA, AFRICA, AND LATIN AMERICA 2008 VOL.39 NO.284
The soils of Bangladesh were de-veloped mainly by the silt deposition of the major rivers. Major soils vary in both their nature and potential for agriculture. These are classified into three broad categories - floodplain soils, hill soils and terrace soils. The f lood plain soils comprising four-teen different soil types include 79 percent of the total land area (BBS, 2002).
The floodplains of the GBM and smaller rivers occupy an area of smooth, very gently undulating relief comprising broad and nar-row ridges and depressions. Differ-ences in elevation between adjacent ridges and depressions range from about 1 meter on tidal plains (near the coast), 2 to 4 m (on Ganges and Brahmaputra river floodplains) and 5 to 6 m in the Northeast. In the ex-treme northwest, elevation exceeds 20 m above mean sea level (GOB and FAO, 1988). Except the depres-sion sites and highly permeable soils, the f loodplain soils are suit-able for cultivation of most of the crops. The hill soils comprise 12.7 percent of the total land area and include a wide range of soils devel-oped over consolidated and uncon-solidated sandstones, siltstones and shales which underline the northern and eastern hills. Most of hill soils are not suitable for agricultural pro-duction due to its steep slopes and soil erosion during the monsoon. Fruit and timber production are the main use of this soil (GOB and FAO, 1988).
The terrace soils have an area of 8.3 percent and have formed over Madhupur clay on uplifted fault block which mainly stands a few meters above flood levels on adjoin-ing f loodplains. The agricultural potential of these soils is only mod-erate to low.
In Bangladesh sunlight, sufficient rainfall and reserved soil moisture favour year round crop growth. Dur-ing monsoon, most of the cultivable lands remain submerged, thereby rice, jute and sugarcane are the main
crops in the water logged situation (Ahmed and Meisner, 1996).
Rice occupies 77 percent of the total cropped area of about 13.9 mha (Bhuiyan et al., 2002) and uses 82 percent of the irrigated water (BBS, 2002). Of the total water used for ir-rigation, boro rice (grown during the Rabi season) alone consumes 72 per-cent of the irrigation water. Aman rice covers about 51 percent of the total rice area, followed by boro rice that covers 39 percent and aus rice 10 percent. The other major summer crop is jute. Wheat, potatoes, pulses (lentil, grass pea, chickpea, etc.), oilseeds (mustard, rapeseed, ground-nut, etc.) and winter vegetables are the main crops of the winter season.
Bangladesh has a population of about 146 million making it the most densely populated country in the world excluding city or island states. It is an agricultural county where 52 percent work forces are engaged in agriculture. Agricultural sector contributed 21 percent to the gross domestic product of which crop sub-sector contributed 12 percent. Sixty six per cent of the families are engaged in agriculture. It was a food deficit country until 1999 when the country became self-sufficient in cereal grains. This was possible due to expansion of irrigated area to 4 mha out of cultivated area of 7.2 mha, i.e. presently about 55 percent of the cultivated area is under ir-rigation. Irrigation of Bangladesh is heavily dependent on groundwater
irrigation. In 1971, during the year of independence, the contribution of groundwater to irrigation was only 3 percent. At present its contribution has increased to 80 percent.
The area, cropped area, popula-tion, population in agriculture, average farm holding size and con-tribution of agriculture to GDP are shown in Table 1. As population census was done every 10 years beginning from 1951, population shown in 1950, 1960 so on are that of 1951, 1961 so on. During 1971 it was not done due to the war of liberation. The first census after the liberation was done in 1974, then in 1981 and so on. The population of 2006 is the estimated figure based on the population census of 2001 assuming 1.54 percent population growth. Agricultural census is not done every year and was done in only1983-84 and in 1996, therefore, average farm holding size of only those two years are given.
Agricultural Production, Irrigated Area, HYV, Fertilizer and PesticidesAgricultural Production
Table 2 shows the area, production and yield of major crops. From the table, it is seen that the area, produc-tion and yield of rice have increased steadily. This is an indication of government’s priority on attaining self-sufficiency in cereal production, especially the staple food rice. The area, production and yield of wheat have grown steadily up to 2,000, and
Year Net cropped area, mha
Total cropped
area, mhaPopulation,
milliona
Population in agri-
culture, %
Ave. farm holding size, ha
Contr. of agr. to
GDP, %1950 8.13 n.a. 41.93 n.a. n.a. n.a.1960 8.33 n.a. 50.84 85d n.a. n.a.1970 8.81 13.29 71.48b 79e n.a. 59.4c
1980 8.45 12.94 87.12 57f 0.91i 54.101990 8.35 14.06 111.46 66g n.a. 36.852000 8.13 14.27 123.15 62h 0.68j 25.582006 8.03 15.05 145.90 51.7 n.a. 21.17
Table 1 Area, population, farm holding size and contribution of agriculture to GDP
n.a.= not available, a= Population of 1951, 1961 so on, b= Population of 1974, c= Data of 1973, d= Data of 1961, e= Data of 1974, f= Data of 1985-86, g= Data of 1990-91, h= Data of 1999-2000, i= Data of 1984, j= Data of 1996

VOL.39 NO.2 2008 AGRICULTURAL MECHANIZATION IN ASIA, AFRICA, AND LATIN AMERICA 85
then declined due to weather hazard, low price and competition with rice, maize, potato and vegetables. On the other hand, the area, production and yield of maize are steadily in-creasing due to high price of grain, less problem with weather hazards and good marketing facilities. Usu-ally traders buy maize cobs or grain from the farmers’ field or home. In-troduction of hybrid varieties almost doubled the yield; therefore, farm-ers are getting much better yield and price. It may be mentioned here that, with the tremendous growth of poultry industries throughout the country, the demand of maize grain has increased tremendously and the present production of 0.78 million ton can only satisfy about 52 percent of the demand.
Almost all the grains are shelled by power operated maize sheller de-veloped by the Bangladesh Agricul-
tural Research Institute (BARI) and a small portion by BARI-developed hand maize sheller.
With the advancement of plastic industries, jute cannot compete with plastic materials in the world market; therefore, its production is decreas-ing. However, the price of jute dur-ing the last three years (2004-2006) was high, therefore, farmers are increasing its cultivation. A few entrepreneurs are exporting diver-sified jute products that created a good demand for jute. Though, with the population growth, the demand for sugar is increasing, its produc-tion is not increasing because of competition with high value crops like vegetables, spices and fruits. At present, only about 10 percent of the demand (1.2 million ton) is satisfied by local production. Similarly the production of pulses and oilseeds are not increasing with the popula-
tion growth, again due to competi-tion with rice and other high value crops. Though rice is not a high value crop, farmers want to grow it because of food security.
Irrigated AreaTable 3 shows the irrigated area
of Bangladesh starting from 1962 as that was the year when mechanized irrigation started in Bangladesh (then East Pakistan) by Bangladesh Agricultural Development Cor-poration (BADC) to irrigate high yield variety (HYV) boro rice (rice grown during November-December to April-May). Power operated centrifugal pumps are used to lift water from surface sources like riv-ers, canals, ponds, extended marshy lands, road-side ditches, etc. As its suction head is low, it is called low-lift pump (LLP) or power pump. Six different sizes (14, 21, 28, 56, 84
YearRice Wheat Maize Jute
Area,mha
Prod.,mt
Yield,t/ha
Area,mha
Prod.,mt
Yield,t/ha
Area,mha
Prod.,mt
Yield,t/ha
Area,mha
Prod.,mt
Yield,t/ha
1950 7.90 7.38 0.93 0.039 0.023 0.59 0.0049 0.003 0.61 0.63 0.61 0.961960 8.56 8.48 0.99 0.056 0.029 0.52 0.0028 0.002 0.71 0.56 0.99 1.771970 9.66 10.75 1.11 0.12 0.103 0.86 0.0032 0.003 0.94 0.93 1.19 1.281980 10.16 12.54 1.23 0.43 0.83 1.88 0.0020 0.001 0.50 0.76 1.08 1.411990 10.41 17.71 1.70 0.59 0.89 1.50 0.0035 0.003 1.00 0.54 0.84 1.502000 10.71 23.07 2.15 0.77 1.84 2.21 0.0220 0.120 5.35 0.41 0.71 1.732006 11.25 29.75 2.64 0.48 0.77 1.60 0.1300 0.780 5.72 0.40 0.75 1.88
Table 2 Area, production and yield of major crops of Bangladesh
YearSugarcane Pulses Oilseeds Potato
Area,mha
Prod.,mt
Yield,t/ha
Area,mha
Prod.,mt
Yield,t/ha
Area,mha
Prod.,mt
Yield,t/ha
Area,mha
Prod.,mt
Yield,t/ha
1950 0.09 3.10 33.70 0.40 0.27 0.68 0.29 0.12 0.42 n.a. n.a. n.a.1960 0.11 3.61 32.82 0.32 0.19 0.59 0.35 0.18 0.51 0.047 0.26 5.531970 0.16 7.51 36.04 0.35 0.26 0.74 0.34 0.31 0.91 0.850 0.85 10.001980 0.15 6.34 43.63 0.33 0.21 0.64 0.31 0.24 0.78 0.096 0.90 9.381990 0.19 7.40 39.80 0.74 0.51 0.69 0.57 0.43 0.77 0.110 1.07 9.152000 0.17 6.90 40.53 0.50 0.39 0.79 0.44 0.41 0.93 0.240 2.93 12.062006 0.08 3.59 44.88 0.63 0.59 0.94 0.58 0.63 1.08 0.370 5.37 14.51
YearAll vegetables All fruits All spices
Area,mha
Prod.,mt
Yield,t/ha
Area,mha
Prod.,mt
Yield,t/ha
Area,mha
Prod.,mt
Yield,t/ha
1950 0.221 1.094 4.95 0.145 0.568 3.92 0.105 0.162 1.541960 0.119 0.569 4.78 0.055 0.277 5.04 0.111 0.225 2.031970 n.a. 1.749 n.a. n.a. n.a. n.a. 0.164 0.378 2.301980 0.123 0.773 6.28 0.133 1.31 10.6 0.154 0.297 1.931990 0.163 1.058 6.49 0.151 1.39 8.6 0.148 0.330 2.232000 0.242 1.529 6.32 0.162 1.36 5.6 0.252 0.401 1.592006 0.650 7.787 11.52 0.385 4.60 11.95 0.450 1.693 3.76

AGRICULTURAL MECHANIZATION IN ASIA, AFRICA, AND LATIN AMERICA 2008 VOL.39 NO.286
and 120 lps) of pumps are used with 14, 28 and 56 lps being common. BADC stopped the LLP programme in 1990. Tubewell irrigation started with sinking of 380 deep tubewells (DTW) having 56 lps turbine pump by Bangladesh Water Development Board (BWDB) during 1961-66. BADC star ted sinking DTW in 1967-68 and continued up to 1992. After that DTW have been installed by private owners and others. Shal-low tubewell (STW) i r r igat ion started in early 1973 and in 2006 covered 67 percent of total irrigated area. These tubewells have a capac-ity of 10 to 21 lps.
Use of HYVTable 4 shows the use of high
yielding varieties (HYV) of rice. They were introduced in the 1960s. In the table production of local and HYV and the percentage of HYV are shown. In 1970, only 8 percent of rice production was HYV, it has increased to 77 percent in 2000 and to 87 percent in 2006. For wheat, potato and other crops, data on use of HYV are not available on a regu-lar basis, therefore, are not given. At present, 100 percent of wheat pro-duction is of HYV. For potato, this figure is 80 percent. In recent years, farmers are planting mainly hybrid maize seeds, which are giving much higher yield than the composite varieties. Most of the important vegetables are of HYV, which has increased the vegetables production in recent years.
Fertilizer and Agro-chemicalsThe use of chemical fertilizer in
Bangladesh started in the 1960s.
With the introduction of high yield-ing varieties, their use became popular. Similarly, the use of agro-chemicals (pesticides) became pop-ular among farmers after the 1970s. Table 5 shows the use of fertilizers and agro-chemicals. Fertilizer use includes N, P2O5 and K2O, not sul-phur and zinc which have become very common. Agrochemicals in-clude insecticides, fungicides, her-bicides and rodenticides.
Farm Power SourcesFarm mechanization in Bangla-
desh started with the mechanization of water pumping for irrigation. Introduction of HYV rice triggered the rapid expansion of irrigated area. At present about 55 percent of culti-vated area is under irrigation cover-age. Next operation that has been mechanized is the tillage operation. Before mid 1960s, the entire land preparation work used to be done by bullock-drawn plough. After that a few large public sector farms and commercial establishment like tea estates started using tractors and power tillers. Because of the high initial cost of the equipment, cost of cultivation by these was not com-petitive with bullock-drawn plough. BADC had tried to introduce trac-tors among farmers on rental basis
during 1970s, but the programme could not succeed due to lack of spare parts and technicians, poor management, fragmented lands and various other reasons. In 1977-78, the public sector involvement in tillage operation was abandoned. A good number of power tillers (PT) were imported from Japan. The price was so high that only a few rich farmers bought them. Therefore, its use did not increase much.
In the beginning, extension of irri-gation facilities was the responsibil-ity of the BADC. Before marketing any farm machinery (mainly trac-tors, power tillers, pumps, engines for irrigation pumps and sprayers), these required certification by the “Agricultural Machinery Standard-ization Committee” of the Ministry of Agriculture. Though the system ensured high quality machinery, only a limited makes and models of machinery having relatively higher price were available in the market. Also the standardization procedure was time consuming. During the devastating f lood of 1988, many draft animals died that created draft power shortage. The govern-ment abolished the standardization requirements in the same year and made the market open for import of agricultural machinery at a nominal
YearDeep tubewell Shallow tubewell Low-lift pump Total
irrig. area, mhaNo. Irrig.
area, mha No. Irrig. area, mha No. Irri. area,
mha1962 - - - - 1,555 0.03 0.031970 940 0.01 - - 17,846 0.26 0.271980 9,795 0.24 11,280 0.06 37,389 0.60 0.891990 22,412 0.45 252,500 1.13 56,500 0.49 2.062000 25,100 0.52 757,100 2.64 71,600 0.65 3.812006 28,289 0.70 1,182,525 3.12 119,135 0.80 4.62
Table 3 Irrigated area with different mechanized irrigation devices
Year Rice production, million ton Percentage of HYVLocal HYV Total
1970 10.86 0.92 11.78 81980 8.12 4.42 12.54 351990 7.57 10.13 17.70 572000 5.35 17.72 23.07 772006 3.93 25.82 29.75 87
Table 4 Production of HYV rice
Year Fertilizer use, kg/ha
Agro-chemicals use, kg/ha
1970 13 -1980 37 0.251990 94 0.692000 137 1.922006 205 3.35
Table 5 Use of fertilizer and pestcides

VOL.39 NO.2 2008 AGRICULTURAL MECHANIZATION IN ASIA, AFRICA, AND LATIN AMERICA 87
tariff. As a result, a large number of power tillers and small diesel en-gines started pouring into the coun-try, mainly from China. The price of a Chinese power tillers is about US $ 800. This price is affordable to large and medium farmers. As a re-sult, population of power tillers has increased rapidly in recent years and is still continuing. Even some small and landless farmers have bought these to provide custom services to farmers. It is estimated that at pres-ent about 300 thousand power tillers are in use in Bangladesh, which per-form tillage operations in 80 percent of total cropped area.
The next operation that is rapidly being mechanized is threshing. Pre-viously rice used to be threshed by bullock treading, hand beating and pedal thresher. With the reduction of cattle population and rapid increase in engines for irrigation pumps and power tillers, use of power threshers has increased in recent years. Table 6 shows the number of power sourc-es in agriculture. Animal population of 1960, 1977, 1984, 1989 and 1996 are available. Therefore, farm power availability has been calculated for those years. Population in agricul-ture is not available for every year; therefore, it has been estimated for the year under consideration. Ir-rigation sector was developed by BADC. During 1990s, they with-
drew from the sector and private sector is doing the development of the sector. BADC now surveys and monitors the irrigation equip-ment every year, therefore, data on number of DTW, STW and LLPs are available. On the other hand, no organization has been given the re-sponsibility of collecting data on the number of tractors, power tillers, threshers, shellers, sprayers, etc. Therefore, no reliable data are avail-able on their numbers. The numbers shown are secondary data collected from importers, manufacturers and other sources. It is estimated that in 2006, about 12,500 tractors are in use in the country, but most of them are used for haulage. Only 3,000 are used for tillage operation.
In Table 6, two kinds of threshers are shown. The open drum thresher is the longer version of pedal thresh-er with engine of 3 to 4.7 kW fitted at one end. Three to four persons, including women, hold bundles of paddy at a time on the rotating drum. Closed drum thresher is the axial-f low type thresher operated by 6.5 to 7.8 kW engines. With the increase of maize production, the number of maize shellers is increas-ing. It is operated by 6.5 to 7.8 kW engines. Threshers and shellers are manufactured by a large number of manufacturers in different parts of the country. About 70 percent of the
threshers and shellers are operated by engines of irrigation pumps or power tillers. So while calculating farm power available in kW/ha, it is assumed that 30 percent of the threshers and shellers are operated by additional engines bought entire-ly for these operations. Power rating of each unit is shown in Table 6. Farm power availability was only 0.24 kW/ha in 1960, it has increased to 0.50 in 1989 and 1.05 kW/ha in 2006. The increase has been rapid in recent years and it is expected that this increase will continue further in future years.
Farm Implements and Equipment Used
In addition to the implement and equipment listed in Table 6, some other equipment are also used. At present about 250 power tiller oper-ated seeders are used and it is ex-pected that the next operation that will be mechanized is sowing. Both power tiller operated seeder for upland crop and manually operated plastic-made drum seeder for sow-ing rice in puddled field will be pop-ularized. Manually operated weed-ers and sprayers are very widely used. The population of weeders is about 200,000 and sprayers is about one million. A few hundred pedal and power operated winnowers are also used.
Source Power rating, kW
Year1960 1977 1984 1989 1996 2006
Animal (million)Bullock 0.180 6.7 7.61 7.69 8.26 8.34 8.30Cow 0.135 2.82 3.32 2.13 3.30 3.42 3.70Buffalo 0.746 0.23 0.24 0.34 0.34 0.24 0.24
Human (million) 0.074 14.04 17.01 17.41 32.57 34.53 31.82Tractor 30 - 300 400 1,000 2,000 12,500Power tiller 8 - 200 500 5,000 100,000 300,000Deep tubewell 22 - 4,461 15,519 22,448 24,506 28,289Shallow tubewell 6 - 3,045 67,103 223,588 325,360 1,182,525Low lift pump 6 - 28,361 43,651 57,200 41,816 119,135Thresher (open drum) 4 - - 500 3,000 10,000 130,000Thresher (closed drum) 7 - - 100 1,000 5,000 45,000Maize sheller 7 - - - - 100 850Farm power available, kW/ha 0.24 0.303 0.317 0.501 0.613 1.05
Table 6 Population of different power sources in agriculture in different years

AGRICULTURAL MECHANIZATION IN ASIA, AFRICA, AND LATIN AMERICA 2008 VOL.39 NO.288
Mechanization in Different RegionsAs discussed earlier, mechaniza-
tion started with the mechaniza-tion of irrigation systems. Where i r r igat ion is int roduced, other operations like tillage, weeding, spraying, threshing and other op-erations are mechanized to some extent. As more crops are produced from irrigated lands, it is difficult to maintain the timeliness of differ-ent operations without mechanical means. As data on irrigation are available up to upazila (the smallest administrative unit) level through-out the country, for convenience the extent of irrigation has been evalu-ated for six administrative divisions like Dhaka, Chittagong, Rajshahi, Khulna, Barisal and Sylhet (Fig. 1) for the latest recorded year 2004.
Table 7 shows the i r r igat ion equipment and irrigated area of six divisions for 2004. The Rajshahi division has the highest number of DTW and STW and also the high-est percentage of irrigated area. The aquifers of this division are good for tubewell development, therefore, has the highest number of tubewells. Low-lift pumps are less in this divi-sion as the source of surface water is limited. As can be seen from Fig. 1, Barisal division is close to the Bay of Bengal, where fresh water is not available in STW or traditional DTW. Therefore, there is no tube-well in that division. Fresh water can be obtained if DTWs are dug very deep, which is not economi-cally feasible. On the other hand the division has a lot of rivers. LLPs are used to pump water from these rivers. Chittagong and Sylhet divi-sions have a lot of hilly areas where tubewells can not be developed due to presence of rock in underground layers of adjacent agricultural lands. Therefore, numbers of both STWs and DTWs are low. So it can be con-cluded that due to various reasons mentioned, degree of mechanization varied in different regions.
Table 8 depicts the agricultural land area, gross domestic product
(GDP) and rice production of six divisions for 1999-2000. Though rice production for later years was available, latest per capita and total GDP was available for 1999-2000. Therefore, the table shows data for that year. Both contributions to GDP and rice production have a direct relation with mechanization. Agricultural land area of Rajshahi division is 24.8 percent, whereas it contributes 26.5 percent to ag-riculture GDP and produces 31.1 percent of total rice production. Climate, soil, rainfall pattern and agriculture resources of the division are favourable for agricultural pro-duction. The main resource of the division is agriculture and not many industries have been set up. Though the division is rich in agriculture, people of the division, in general, are poorer than all other divisions as can be seen from per capita GDP ($302). In this division, there are not enough employment opportuni-ties in other sectors. Though per capita GDP of Sylhet division is the lowest, the economic condition of people of Sylhet is, in general, bet-ter than that of other divisions due to receipt of lot of remittance from overseas (mainly U.K.). The area of Chittagong division is 21.7 percent, but its contribution to agriculture GDP and rice production are 18.9 and 15.4 percent, respectively. The division has hilly areas, which is about 10 percent of the whole area of the country. Tubewells cannot be installed in many agricultural lands adjacent to the hills due to presence of rock below ground surface. The
main seaport of the country (Chit-tagong) is in this division. There are many industries in this division. Though its contribution to agricul-ture GDP is relatively lower, the per capita GDP is the second highest (US $360). In comparison to the agricultural land area, the contribu-tions to agriculture GDP and rice production are higher. As can be seen from Table 6, the number of DTW, STW and LLP of the division is higher than all other divisions except the Rajshahi division. As the capital of the country (Dhaka) is located in this division, it is the home of lot of industries; therefore, the overall economy is better and has the highest per capita GDP of US $443. The contribution of agri-culture GDP and rice production of Khulna division is relatively lower than its area; its per capita GDP ($ 355) is the third highest. There are a lot of industries in the division and has the second sea port (Mongla) of the country. Majority of the fish ex-ported are from this division.
Farm Power Availability and Fer-tilizer Input With Productivity
Table 9 depicts the relationship of farm power availability and fertil-izer input with rice productivity, as it is the main crop of the country. Therefore, its productivity has been used to establish relationship. As explained earlier (Table 6, farm power sources), farm power avail-ability of every 10 years could not be calculated. Fig. 3 shows the rela-tionship of farm power availability with rice yield. With the increase
Division No. of DTW No. of STW No. of LLP Total irrig. area, mha
% of irrig. area
Dhaka 6,452 227,428 18,122 1.14 28.25Chittagong 2,225 30,683 25,246 0.49 12.01Rajshahi 13,174 465,359 8,017 1.55 38.38Khulna 2,794 199,348 6,967 0.49 12.01Barisal 0 0 6,734 0.09 2.35Sylhet 73 2,334 12,681 0.28 7.00Total 24,718 925,152 79,850 4.04 100.0
Table 7 Number of irrigation equipment and irrigatedarea of six administrative divisions for 2004

VOL.39 NO.2 2008 AGRICULTURAL MECHANIZATION IN ASIA, AFRICA, AND LATIN AMERICA 89
of power availability, the yield of rice increased. From the graph it appears that if power availability is increased, yield would continue to increase, though not at the same rate. Fig. 4 depicts the relationship of fertilizer input with farm produc-tivity. It appears that, with more fer-tilizer input, the farm productivity will continue to increase. Of course, there is a limit of farm productiv-ity beyond which even with the increase in farm power or fertilizer, yield would not increase.
Development of Agricul-tural MechanizationSequence of Agricultural Mecha-nization
Irrigation has been practiced for many centuries. Earlier human and animal operated indigenous equip-ment like ‘don’ and ‘swing basket’ were used. In 1961-62, mechaniza-tion of irrigation equipment started with the low-lift pump, which is ba-
sically a centrifugal pump operated by engine for lifting water from sur-face water bodies. The deep tube-well irrigation started from 1966-67 and the shallow tubewell irrigation from 1973-74. Water pumping was the first operation to be mechanized. After the introduction of high yield-ing varieties (HYV) of rice during nineteen sixties, Japanese type pedal thresher and manual weed-ers for wet lands were introduced to a limited area. With the increase of HYV rice, demands for pedal thresher increased. At the same time manually beating the panicle on hard surface like wood or fuel drum and bullock treading were in prac-tice. The next agricultural operation that was mechanized was tillage op-eration. Though efforts were made by BADC to popularize the tractor first, then power tiller, it did not gain momentum. After the devastat-ing flood of 1988, due to the short-age of draft animal and government policy of zero tax and tariff on agricultural machinery, the use of
power tiller increased tremendously through private initiative. Private companies imported cheap power tillers and rich farmers bought them for their own use as well as for cus-tom hiring. Custom hiring became such a profitable business that an owner could get his money back within a year or two; therefore, the demand for power tillers continued to increase. With the mechanization of tillage operations, cropping in-tensity increased. At present, about 80 percent of the land preparation is done by 300 thousand power tillers, and only 3 thousand tractors.
Use of power threshers in Bangla-desh is relatively new. No reliable statistics are available on the num-ber of farm machines. It is estimated that the number of power tillers is 300 thousand and power threshers 45 thousand. Power threshers have been introduced mainly through private sector. There was not much extension work to popularize these like shallow tubewells. In the ab-sence of power threshers, farmers were able to thresh paddy by tra-ditional methods of bullock tread-ing, manually beating and pedal threshing. Due to shortage of draft power, farmers could not cultivate their land. Therefore, tillage became mechanized before threshing, which is contrary to the usual case where threshing is mechanized before till-age. Maize shelling is almost fully mechanized, as the capacity of lo-cally made hand operated sheller is only 35 kg/h against the power-operated sheller capacity of 3 ton/h.
Presently, R & D work on power tiller operated seeders is on going. Farmers are accepting this technol-ogy where demonstrations were given by research organizations. Country wide demonstrations of plastic-made drum seeders, devel-oped by IRRI and made in Vietnam, have been going on for the last three years and it is expected that this seeder will be popular among farm-ers, as the labour shortage occurs during transplanting. It is expected
Fig. 1 Map of Bangladesh

AGRICULTURAL MECHANIZATION IN ASIA, AFRICA, AND LATIN AMERICA 2008 VOL.39 NO.290
that after irrigation, tillage, thresh-ing and sowing will be mechanized. The next operation that is expected to be mechanized is harvesting of rice and wheat. R & D work on a lo-cally made reaper is going on and it is expected that a good design will be available within a few years.
Change in Farming Systems Before the introduction of me-
chanical devices, farmers could grow only one or two crops in a year. After their introduction, cropping in-tensity has increased by 180 percent. In many areas, growing three crops in a year has become very common. In the past, jute and sugarcane were the main cash crops. Now farmers have changed farming systems and introduced modern varieties of rice, potatoes, wheat, maize, vegetables, fruits, spices, etc. in their cropping sequence. Previously farmers used to grow rice for their own consump-tion. Now they consider it as a cash crop along with other crops.
Change in Mechanical System As a first step of mechanization of
tillage system, the government tried to introduce tractors during the 1970’s. But, it was not successful and the programme was abandoned. Fragmented land was one of the rea-sons for failure of the programme. The power tiller was found suitable for the small size farm, therefore its use increased many fold. Almost all the power tillers are used on custom hiring basis and its owner-ship does not depend on farm size. As farm sizes are very small, power tiller owners have enough time to till neighbours land after tilling their own land. As the cost of hir-ing power tillers is lower than that of bullock, even very small farmers hire power tiller, not bullock. As tilling others lands by power til-lers is a profitable business, many farmers, having a very small farm size, purchase a power tiller for earning money. This is also true for power thresher, which is used for
custom hiring. Many poor and land-less farmer purchase it for earning money. So it can be concluded that use of mechanical systems does not depend on farm size.
Nonlinear AdoptionAdoption of mechanical technolo-
gies in Bangladesh agriculture has followed a linear path, i.e. it oc-curred slowly and steadily without any sudden jump in adoption of mechanization in any agricultural operation. First water pumping was mechanized followed by tillage and threshing. Other agricultural opera-tions like harvesting and transplant-ing require higher level of precision. Therefore, they are yet to be mecha-nized. Sowing requires an interme-diate level of precision, therefore, its mechanization process has started to pickup.
Farm Equipment SupplyDifficulties Encountered in Sourc-ing
At present there is a great demand of reaper for rice and wheat. Though 52 percent of the population is en-gaged in agriculture, labour short-age occurs during transplanting and harvesting of rice and labour wage becomes very high. In order to re-
duce the cost of transplanting and harvesting, appropriate equipment is necessary. Several engineering workshops have fabricated proto-types of a reaper. As manufactur-ing requires a little higher level of precision than other common farm machinery, the performance of pro-totypes is not up to the mark. Scien-tists and manufacturers are jointly working to develop a good reaper model. Reapers from Thailand, Chi-na and Japan have been tried; some of the models are good, but costly. Therefore, these cannot be used for commercial application.
The price of imported rice trans-planters is very high, therefore, cannot be used commercially use. Research work has not been done seriously to adapt the machinery, at the present labour wage, the ma-chine would not be able to compete with human labour.
There is a good demand for dryer during the rainy season for drying paddy and maize. Maize is espe-cially vulnerable if it is not properly dried. A few private entrepreneurs started business in maize seed pro-duction and poultry feed industry based on maize. In the absence of any local dryer, some of them have imported dryers from abroad. In ad-dition, some of the dryers have been fabricated locally. For paddy drying,
Rainfall/Evaporation, mm
Input energy (MJ/ha)Output energy (MJ/ha)Net return energy (MJ/ha)
0
50
100
150
200
250
300
350
400
DecNovOctSepAugJulJunMayAprMarFebJanMonth
Rainfall, mmEvaporation, mm
Fig. 2 Average monthly rainfall vs. evaporation at Dhaka

VOL.39 NO.2 2008 AGRICULTURAL MECHANIZATION IN ASIA, AFRICA, AND LATIN AMERICA 91
still the age old practice of sun dry-ing is used at the farmers’ home as well as at most rice mills. Automatic rice mills mainly use the LSU type dryer. With the economic develop-ment, urban affluent people are now ready to pay a premium price for quality products. Therefore, it is ex-pected that more mechanical driers will be set up in order to have better quality rice.
In recent years, a power tiller-operated potato planter, potato dig-ger, potato graders, and multi-crop seed drills have been developed by scientists. There is no government organization to extend and popu-larize these new farm machines to farmers. Department of Agricultural Extension mainly deals with crops, and not machinery. They set up hundreds of demonstrations on new crop varieties nationwide. On the other hand, scientists demonstrate a new machinery on a very limited scale. Cost of crop demonstrations is comparatively lower than farm machinery demonstrations. Typical cost of a small plot demonstration of crop variety is only a few US dol-lars, whereas that of farm machin-ery is a few hundred US dollars. Therefore, it may take many years to introduce appropriate equipment to meet farmers’ demand.
Relationship of Retail Systems As mentioned above, imported
power tillers and engines are sold by importers to retailers of district towns. They also sell directly to farmers from their show rooms. Widely used locally made agricul-tural machines are pedal thresh-ers and knapsack sprayers. Pedal th reshers are manufactured by many small workshops and sold to farmers directly or through ma-chinery shops. No dealership is given for these threshers. Knapsack sprayers are manufactured by a few manufacturers. They sell through dealer f ranchise mechanism as well as through machine shops. Recently a few manufacturers are have produced power operated threshers. Most of them sell directly to farmers. Only one or two big manufactures have developed dealer franchise mechanism for marketing their products. It is expected that other manufacturers will also follow the same path.
Linkages in the Supply Chains A few businessmen import power
t i l lers and small engines f rom China. They do not have dealers in district level towns; rather busi-nessmen purchase PT and small engines from importers and sell to local farmers. Most of the running spare parts are locally made and are available throughout the country. Repair workshops are available in towns and some village markets.
Many farmers have learned to repair engines themselves. As low qual-ity Chinese engines have frequent breakdowns, these need regular repair and maintenance. So, a large number of mechanical workshops have been established in the private sector. As a result of mechanization, skilled man power development has occurred in the rural areas. A few workshops are manufacturing spare parts of engines and exporting to neighbouring countries in addition to selling in the local markets.
Engineering Technology During 1970’s and 1980’s, irriga-
tion coverage to grow boro rice was expanding at a very fast rate. At that time, there were not many metalled road in rural areas. So supply of agricultural inputs like seeds, fertil-izers, irrigation pumps and accesso-ries, pesticides and farm machinery, was difficult, time consuming and costly. Due to poor roads, market-ing of agricultural products was not easy. Bad transportation systems made the quality of products, espe-cially fruits and vegetables, unac-ceptable to consumers. So produc-ers could not get a good price. As a result commercial agriculture did not develop. At that time there was only a few rural areas with electric-ity. Farmers had to use diesel en-gines for pumping irrigation water. Toward the end of 1980s and 1990s,
Rice yield, t/ha
0.0 0.5 1.0 1.50.0
0.5
1.0
1.5
2.0
2.5
3.0
Farm power availability. kW/ha
R2 = 0.98
Rice yield, t/ha
0 50 100 150 200 2500.0
0.5
1.0
1.5
2.0
2.5
3.0
Fertilizer use, kW/ha
R2 = 0.99
Fig. 3 Relationship of farm power availability with yield Fig. 4 Relationship of fertilizer input with yield

AGRICULTURAL MECHANIZATION IN ASIA, AFRICA, AND LATIN AMERICA 2008 VOL.39 NO.292
many rural roads were built. At the same time rural electrification gained momentum. Due to good communication, input supply be-came relatively easier, quicker and less costly. Use of electrical power for water pumping made the irriga-tion cheaper. Therefore, it can be in-ferred that both roads and electric-ity supported private/commercial agricultural input supply chains and service structures.
Off-farm Use of Agricul-tural Machinery
To popularize farm machinery, the government waived tax and du-ties on farm machinery. For irriga-tion, shallow tubewells have been installed in almost all the areas of the country. Most of these shallow tubewells, popularly known as ‘shal-low’, are run by Chinese engines. These cheap engines have many uses. These are used to run small country boats and are popularly known as ‘shallow boat’ as shallow tubewell engines are used. This has created opportunity to move faster in river-dominant rural areas. Many people are using these engines for milling rice. Small hullers are fitted on tricycle vans and are moved door to door for milling rice. These small engines are also used to manufac-ture 3-wheeled vehicles for human haulage. In rural areas many people use engines for non-agricultural operations for income generation as well as poverty alleviation. Some power tillers are used in rural areas for haulage, in addition to tillage
operation. Owners of power til-lers think that they can earn extra money during the off-season if they use them for transportation of both agricultural and non-agricultural items. A majority of the tractors in Bangladesh are used for haulage of bricks, sands, woods, etc. as the transportation cost is cheaper than that by trucks.
The Role of PolicyUntil recently, only the public sec-
tor was involved in education, train-ing and infrastructure development in mechanization. About a decade ago, the government allowed es-tablishment of private universities. So far, 52 private universities have been established. But they mainly offer degrees in computer and busi-ness administration. In the public sector, besides universities giving a bachelor degree in engineering, polytechnic institutes offer a 3-year diploma (after secondary school ex-amination) in different disciplines of engineering. Trade courses are also offered by vocational training insti-tutes of public sectors. A few non-government organizations (NGO) are giving short-term training to
farmers and technicians on a very limited scale. Most of the techni-cians get on the job training in pri-vate engineering workshops. There are no standards and regulations to support or inhibit the development of technical capacity to support mechanization.
Economic, Business and Technical Factors
In general, economic condition of farmers of the country has im-proved in the recent years, mainly due to the adoption of various im-proved agricultural technologies. As the economic condition of farmers improved, they could afford to buy costly agricultural machinery and equipment like shallow tubewells, power pumps, power tillers, power threshers and power maize shellers. All these machinery and equip-ment are owned mostly by indi-vidual farmers, not by groups or co-operatives. As average farm size is small, almost all farmers use these machinery and equipment for giv-ing services to neighbors in addition to their own use. Thus, farmers use the machinery for business and they are able to increase their income
Year Rice yield, t/ha Farm power availability, kW/ha
Fertilizer input NPK, kg/ha
1960 0.99 0.240 -1977 1.17 0.303 18.971984 1.35 0.317 36.551989 1.52 0.501 52.401996 1.78 0.613 88.362006 2.64 1.050 205.00
Table 9 Relationship of farm power availability and fertilizer input with productivity
Division Area, sq. km % of total area Contirubutes to total GDP, %
Contributes of agri. to GDP, %
Per capita GDP, US $
Rice production, mt
% of rice production
Dhaka 26,771.7 21.77 37.74 24.52 443 5.85 25.37Chittagong 26,661.4 21.68 19.35 18.87 360 3.56 15.44Rajshahi 30,474.5 24.79 20.36 26.54 302 7.18 31.14Khulna 19,607.8 15.95 11.58 14.96 355 3.26 14.14Barisal 8,509.0 6.92 5.79 8.84 306 1.54 6.67Sylhet 10,930.6 8.89 5.18 6.27 296 1.67 7.24
Total 122,955 100.0 100.0 100.0 363 (Avg.) 23.06 100.0
Table 8 Agricultural land area, GDP and rice production of six administrative divisions for 1999-2000
VOL.39 NO.2 2008 AGRICULTURAL MECHANIZATION IN ASIA, AFRICA, AND LATIN AMERICA 93
and improve livelihood. If farmers did not use the machinery for busi-ness purpose, their use could not increase and agricultural mechani-zation could not materialize to the present level. With the advancement of agricultural mechanization, tech-nical expertise has been developed entirely in the private sector in rural areas. Small workshops have been set up in rural areas to provide repair and maintenance service of engines, pumps, sprayers, threshers, power tillers and other agricultural machinery. If these technical ser-vices did not exist, farmers would have been reluctant to adopt farm machinery. Therefore, it can be concluded that the combination of economic, business and engineering technology factors greatly inf lu-enced the farm mechanization and enabled the changes in this field.
Structural and Technical Factors
To popularize agricultural mecha-nizat ion among farmers, good quality machinery is essential. Many small workshop owners are manufacturing sub-standard quality machinery that creates negative im-pact among farmers. To improve the quality of manufacturing, technical people need to be trained. This may be done by government initiative. Small workshop owners, in general, do not use jigs and fixtures, so all machinery are not of the same stan-dard. Therefore, special emphasis should be given to use jigs and fix-tures for machine parts. Quality of raw materials, especially nuts and bolts, is poor. So the government should take necessary measures to ensure good quality raw materi-als in the market. Of course, when good quality materials would be used, the price of machinery will definitely increase. Initially farmers may be reluctant to pay extra money for good quality machinery, but in
the long run, use of better quality machinery is cheaper, so farmers would pay the extra amount for that. Medium and large manufacturers usually manufacture farm machin-ery. For them, establishing back-ward linkage is essential to reduce the cost of production. In order to provide repair and maintenance of farm machinery, establishment of small workshops in rural areas is es-sential. Without rural electrification, workshops can not be established. Operating cost of farm machinery can be reduced using electric motor. Therefore, the government needs to provide electricity in rural areas.
Transportation of machinery from urban to rural areas needs good road linkage. In addition, transportation of agriculture produce from field to farm house would be easier if power tiller operated trolleys could be used. Also, transportation loss can be reduced. Therefore, government should take measures to make farm roads.
ConclusionsFarm mechanizat ion in Ban-
gladesh is proceeding in the right direction. With economic develop-ment, more people will migrate to urban areas for better-paid jobs. Also in rural areas, more off-farm jobs will be available. As a result, shortages of agricultural labour will continue in the future. To overcome this problem, use of appropriate farm machinery is inevitable. For this, scientists and manufacturers need to work together closely. A few manufacturers have begun to produce farm machinery as per in-struction of scientists. It is expected that this co-operation will increase further. Recently the government has instructed banks to f inance farm machinery manufacturers and farmers. This will have a positive role in mechanization. In many ru-ral areas metalled roads have been
constructed and electric connec-tions have been provided. These two infrastructures play a very positive role in agricultural mechanization. The government has planned to con-struct more roads and electric lines that will further encourage mecha-nization of agriculture in Bangla-desh. Research and development of appropriate farm machinery will enhance the mechanization process to a great extent.
REFERENCES
Ahmed, S. M. and C. A. Meis-ner. 1966. Wheat Research and Development in Bangladesh, Bangladesh Australia Wheat Im-provement Project and CIMMYT-Bangladesh, Dhaka.
BBS (Bangladesh Bureau of Statis-tics). 2002. Statistical Yearbook of Bangladesh. Statistics Division, Ministry of Planning, Govt. of the People’s Republic of Bangladesh, Dhaka.
Bhuiyan, N. I., D. N. R. Paul, and M. A. Jabber. 2002. Feeding the extra millions by 2025-Challenges for rice research and extension in Bangladesh. Keynote paper pre-sented in the National Workshop on “Rice Research and Exten-sion-2002” held at Bangladesh Rice Research Institute, Joydeb-pur, 29-31 January 2002.
GOB (Government of Bangladesh) and FAO. 1988. Land resources appraisal of Bangladesh for agri-cultural development, Technical report, pp. 1-2.
Manalo, E. B. 1980. Agroclimatic Survey of Bangladesh, Interna-tional Rice Research Institute, Los Banos.
Zaman, S. M. H. 2000. Bangladesh Forwards 2025: Food security and water. In: Bangladesh Water Vi-sion 2025 Towards a Sustainable Water World, Q. K. Ahmad (Ed.), Bangladesh Water Partnership (BWP), Dhaka.
■■

AGRICULTURAL MECHANIZATION IN ASIA, AFRICA, AND LATIN AMERICA 2008 VOL.39 NO.294
ABSTRACTS The ABSTRACTS pages is to introduce the abstracts of the article which cannot be published in whole contents owing to the limited publication space and so many contributions to AMA. The readers who wish to know the contents of the article more in detail are kindly requested to contact the authors.
544Performance Evaluation of a Women Friendly Fer-
tilizer Broadcaster With Reference to Ergonomics: D. Sirisha, Research Scholar, Dept. of Farm Machinery, Ag-ricultural Engineering College & Research Institute, Tamil Nadu Agricultural University, Coimbatore - 641 003, India; K. Kathirvel, Professor & Head, Dept. of Farm Machinery, same; R. Manian, Dean, same.
Broadcasting of fertilizer is mostly done manually. This operation is generally done by farm women. Fertil-izer broadcaster is used to broadcast palette and granular fertilizer to ensure the precise and uniform application. A commercially available fertilizer broadcaster was ergo-nomically evaluated for assessing its suitability to farm women labours. The unit consists of hopper, agitator, broadcasting disc, handle and straps. The unit consists of a hopper with plastic lid, an agitator, rotor plate with guide vanes, handle, feed control lever, gear and straps. The hopper has an opening at the bottom through which the material falls on the rotor plate. A feed control lever is provided at the bottom of the hopper for regulating the flow of fertilizers from the hopper to the rotor plate. When the fertilizer falls from the hopper on to the rotor plate it is scattered by the guide vanes. The unit is fixed to the front portion of body with shoulder belt provision. Ten women subjects were selected and screened for nor-mal health for the investigation. The mean working heart rate and oxygen consumption were 140.10 beats min-1 and 0.648 l min-1 respectively. The energy expenditure for the broadcasting of fertilizer was computed as 13.55 kJ min-1 and classified as “very heavy”. The mean energy cost of operation in terms of the maximum aerobic capacity was 45.28 % of VO2 max, which was more that the Accept-able Work Load (AWL) of 35 % of VO2 max. The work pulse value was 54.67 against the Limit for Continuous Performance (LCP) value of 40. The Overall Discomfort Rating (ODR) and Body Part Discomfort Score (BPDS) were found to be 7.55 and 62.11 respectively. Based on the evaluation and subjects feed back, the ergonomical design features viz. reduction in hopper capacity, reduc-tion in length of crank handle, provision of cushion pad in between the hopper and subject and provision of transpar-ent lid were incorporated. The fertilizer broadcaster with ergonomic design features enhanced the human comfort with improved physiological indices of 14.93 %, 24.53 %, 33.77 % and 32.69 % reduction in heart rate, oxygen con-sumption, ODR and BPDS respectively besides bringing the value of oxygen consumption rate (37.15 % VO2 max) closer to AWL and work pulse (37.22) with in the LCP.
546Development and Performance Evaluation of Tractor
Operated Cotton Stalk Shredder Cum Insitu Applicator: T. Senthilkumar, Asst. Prof., KVK, Vamban, Pudukkottai, In-dia; R. Manian, Dean, AEC & RI, TNAU, Coinbatore, India; K. Kathirvel, Prof. & Head, same.
Incorporation of cotton stalks into the soil ensures rapid decomposition. The most rapid decomposition oc-curs when residue is placed 10 cm deep and shredding stalks as finely as possible also allows for rapid decompo-sition. The present migration of labour from rural sector to scholastic jobs in urban areas necessitates the need for mechanizing the faming operation of cotton stalk shred-ding and incorporation in the field. A tractor operated cotton stalk consisting of a shredder assembly, power transmission system with hydraulic motor, hitch frame and hydraulic lift was developed. The shredding unit con-sists of main shaft and two number of swing back type rotary blades. Lifting and lowering of the shredding unit is carried out by the hydraulic lift mounted in the front of the tractor. The power for the shredder is transmitted form the hydraulic motor and reduction gear box. The commercially available rotavator is used as insitu ap-plicator for incorporation of shredded cotton stalks. The shredding cotton stalks was accomplished by the shred-der in the front portion of the tractor and incorporation of the shredded cotton stalks was done by rotary tiller in the rear portion of the tractor. The unit was evaluated for its performance. Experiments were conducted with 4 treat-ments viz. disc ploughing with the standing cotton stalks, operation with cotton stalk shredder cum insitu applica-tor with 2.0, 2.5 and 3.0 km h-1 to find out the efficient method of cotton stalk shredding and insitu application. The influence of the selected treatments on soil physical and chemical properties was investigated. Operation with prototype cotton stalk shredder cum insitu application at 2 km h-1 forward speed is judged as the best among all the treatments as it records favorable increase in hydraulic conductivity (1.38 to 2.30 cm r-1), decrease in bulk density (1.33 to 1.25 Mg m-3), increase available N (199.0 to 0.54 kg ha-1), P (12.6 to 20.1 kg ha-1), K (541.0 to 640.0 kg ha-1) and organic carbon (0.36 to 0.54 kg ha-1) of the soil.
713Evaluation of a Pad System for Cooling Poultry House
in Iraq: Ali Mazin Abdul-Munaim, Dept. of Agricultural Mechanization, College of Agriculture, University of Bagh-dad, Baghdad, Iraq.
An experiment was undertaken to investigate of ef-fect of using three kinds of pads (Aspen white excelsior, Lagonychium farctum and Alhagi maurorum) with three
VOL.39 NO.2 2008 AGRICULTURAL MECHANIZATION IN ASIA, AFRICA, AND LATIN AMERICA 95
different thicknesses of pad (5, 8, and 11 cm). This was to measure interior dry-bulb temperature, relative humidity, air velocity, cooling efficiency and static pressure in order to determine which one of them is better in evaporative cooling when used in poultry house. A factorial experi-ment with completely randomized design with three replicates was used. The pad, which was constructed of Alhagi maurorum with pad thickness 11 cm, gave interior dry bulb temperature 25.5 ºC, relative humidity 80 %, air velocity 1.36 ms-1, cooling efficiency 87.2 % and static pressure 14.1 pa. Hence the pad made of Alhagi mauro-rum with 11 cm thick was recommended.
724Ergonomic Evaluation of Male and Female Operators
during Weeding Operation: R. Yadav, Professor, College of Agricultural Engineering & Technology, Junagadh Agri-cultural University, Junagadh, India; S. Pund, Dy Manager, Mahindra & Mahindra (R & D), Nashik, India; L. P. Gite, Proj-ect Coodinator, CIAE, Nabi Bagh, Bhopal, India.
All the agricultural equipment are either operated or controlled by human workers and these equipments re-quire skill, effort and correct speed. The estimated ener-gy expended values can be used to define limits of human effort for various agricultural operations. The operator’s performance in different field operations can be assessed on the basis of the physiological responses. The estima-tion of energy expenditure rate (EER) by measuring the OCR is fairly accurate and acceptable method. Using Morgan Oxylog II Apparatus recorded OCR during field operations. Oxylog can be easily mounted on the operator back and the oxygen consumed by operator during par-ticular operation in the field can be recorded and data can be downloaded on PC for analysis and calculation.
In Saurashtra region weeding by sickle and with man-ual weeder is a common practice used by the farmers. In view of this 4 male and 4 female workers took part in this study. Subjects were acclimatized for the experimental protocol. Heart rate and oxygen consumption rate of male workers were measured. The physiological cost of male and female subjects was worked out on the basis of OCR and it was found to be 15.87, 15.87, 16.08 and 15.87 kJ min-1 and 8.14, 8.35, 8.35 and 8.35 kJ min-1 for subjects 1, 2, 3 and 4 respectively. Similarly physiological cost was worked out for female workers during weeding by manual weeder and it was found to be 13.57, 14.41, 14.20 and 14.41 kJ min-1 for subjects 1, 2, 3 and 4 respectively.
740Studies on the Application of Microwa Ves for Pro-
ducing Banana Fruit Leather: T. Pandiarajan, Associate Professor, Agricultural Engineering College and Res. Insti-tute, Kumulur - 621 712 Trichirappalli, Tamil Nadu, India; Karpoora Sundara Pandian, same.
Banana fruit leather is a well established product man-ufactured by dehydrating the fruit pulp into a leathery sheet. Conventionally hot air drying is employed to make banana fruit leather. In the present study an attempt was made to prepare banana fruit leather using microwaves. A domestic microwave oven at 90 W power level was used for the preparation of banana fruit leather. It was found that the time taken to prepare fruit leather using microwaves was only 90 min against 9 hours in case of conventional hot air oven. The quality characters like total soluble solids, colour texture and organoloptic char-acters were studies. It was found that banana fruit leather prepared using microwave was superior to the leather prepared using hot air oven.
■■

AGRICULTURAL MECHANIZATION IN ASIA, AFRICA, AND LATIN AMERICA 2008 VOL.39 NO.296
-AFRICA-Benedict KayomboAssociate Professor of Soil and Water Engineering, Dept. of Agric. Engineering and Land Planning, Botswana College of Agriculture, University of Bo-tswana, Private Bag 0027, Gaborone, BOTSWANA.TEL(+267)-3650125, FAX(+267)-328753E-mail: [email protected]
Mathias Fru FontehAsst. Professor and Head, Dept. of Agric. Engineer-ing, Faculty of Agriculture, University of Dschang, P.O. Box 447, Dschang, West Province, CAMEROONTEL+237-45-1701/1994, FAX+237-45-2173/1932E-mail: [email protected]
Ahmed Abdel Khalek El BeheryAgric Engineering Research Institute, Agricultural Reserch Center, Nadi El-Said St. P.O. Box 256, Dokki 12311, Giza, EGYPT
Ali Mahmoud El HossarySenior Advisor to the Ministry of Agriculture and Chairman of (AGES)-Agengineering Consulting Group, Ministry of Agriculture - P.O.Box 195 Zama-lek 11211 Cairo, EGYPTTEL00-202-335-9304, FAX00-202-3494-132
B. S. PathakProject Manager, Agric. Implements Research and Improvement Centre, Melkassa, ETHIOPIA
Richard Jinks BaniLecturer & Co-ordinator, Agric. Engineering Div., Faculty of Agriculture, University of Ghana, Legon, GHANA
Israel Kofi DjokotoSenior Lecturer, University of Science and Technol-ogy, Kumasi, GHANA
David Kimutaiarap SomeProfessor, Deputy Vice-chancellor. Moi University, P.O. Box: 2405, Eldoret, KENYA
Karim HoumyProfessor and head of the Farm Mechanization Dept., Institute of Agronomy and Velerinary Medi-cine II, Secteur 13 Immeuble 2 Hay Riad, Rabat, MOROCCO, Tel+212-7-68-05-12, Fax+212-7-775801E-mail: [email protected]
Joseph Chukwugotium IgbekaProfessor, Dept. of Agricultural Engineering, Univ. of Ibadan,, Ibadan, NIGERIATEL+234-2-8101100-4, FAX+234-281030118E-mail: [email protected]
E. U. OdigbohProfessor, Agricultural Engg Dept., Faculty of En-gineering, University of Nigeria, Nsukka, Enugu state, NIGERIA, TEL+234-042-771676, FAX042- 770644/771550, E-mail: [email protected]
Kayode C. OniDirector/Chief Executive, National Centre for Agric. Mechanization (NCAM), P.M.B.1525, Ilorin, Kwara State, NIGERIATEL+234-031-224831, FAX+234-031-226257E-mail: [email protected]
N. G. KuyembehAssociate Professor, Njala University Colle, Univer-sity of Sierra Leone, Private Mail Bag, Free Town, SIERRA LEONETEL+249-778620-780045, FAX+249-11-771779
Abdien Hassan AbdounMember of Board, Amin Enterprises Ltd., P.O. Box 1333, Khartoum, SUDAN
Amir Bakheit SaeedAssoc. Professor, Dept. of Agric. Engineering, Fac-ulty of Agriculture, University of Khartoum, 310131 Shambat, SUDAN, TEL+249-11-310131
Abdisalam I. KhatibuNational Prolect Coordinafor and Direcror, FAO Ir-rigated Rice Production, Zanzibar, TANZANIA
Edward A. BaryehProfessor, Africa University, P.O.Box 1320, Mutare, ZIMBABWE
Solomon Tembo52 Goodrington Drive, PO Mabelreign,Sunridge, Harare, ZIMBABWE
-AMERICAS-Hugo Alfredo CetrangoloFull Professor and Director of Food and Agribusi-ness Program Agronomy College Buenos Aires University, Av. San Martin4453, (1417) Capital Fed-
eral, ARGENTINATEL+54-11-4524-8041/93, FAX+54-11-4514-8737/39E-mail: [email protected]
Irenilza de Alencar NääsProfessor, Agricultural Engineering College, UNI-CAMP, Agricultural Construction Dept.,P.O. Box 6011, 13081 -Campinas- S.P.,BRAZILTEL+55-19-7881039, FAX+55-19-7881010E-mail: [email protected]
A. E. GhalyProfessor, Biological Engineering Deparment Dalhousie University, P.O. Box 1000, Halifax, Nova Scotia, B3J2X4, CANADATEL+1-902-494-6014, FAX+1-902-423-2423E-mail: [email protected]
Edmundo J. HetzProfessor, Dept. of Agric. Eng. Univ. of Concepcion, Av. V.Mendez 595, P.O. Box 537, Chillan, CHILETEL+56-42-216333, FAX+56-42-275303E-mail: [email protected]
A. A. ValenzuelaEmeritus Professor, Ag. Eng. Fac., University of Concepcion,Casilla537Chillan, CHILETEL+56-42-223613, FAX+56-42-221167
Roberto AguirreAssociate Professor, National University of Colom-bia, A.A. 237, Palmira, COLOMBIATEL+57-572-2717000, FAX+57-572-2714235E-mail: [email protected]
Omar Ulloa-TorresProfessor, Escuela de Agricultura de la Region, Tropical Humeda(EARTH), Apdo. 4442- 1000, San Jose, COSTA RICA, TEL+506-255-2000, FAX +506-255-2726, E-mail: [email protected]
S. G. Campos MaganaLeader of Agric. Engineering Dept. of the Gulf of Mexico Region of the National Institute of Forestry and Agricultural Research, Apdo. Postal 429. Vera-cruz, Ver. MEXICO
Hipolito Ortiz-LaurelHead of Agric. Engineering and Mechanization Dept./ Postgraduate College, Iturbide 73, Salinas de Hgo, S.L.P., C.P. 78600, MEXICOTEL+52-496-30448, FAX+52-496-30240
B Kayombo M F Fonteh A A KEl Behery
A MEl Hossary
B S Pathak R J Bani I K Djokoto D K Some K Houmy J C Igbeka
E U-Odigboh K C Oni N GKuyembeh
A HAbdoun
A B Saeed A I Khatibu E A Baryeh S Tembo H ACetrangolo
I de A Nääs
A E Ghaly E J Hetz A AValenzuela
R Aguirre O Ulloa-Torres S G CMagana
H Ortiz-Laurel W JChancellor
M R Goyal A KMahapatra
Co-operating Editors

VOL.39 NO.2 2008 AGRICULTURAL MECHANIZATION IN ASIA, AFRICA, AND LATIN AMERICA 97
William J. ChancellorProfessor Emeritus, Bio. and Agr. Eng. Dept., Univ. of California, Davis, CA, 95616, U.S.A.TEL+1-530-753-4292, FAX+1-530-752-2640E-mail: [email protected]
Megh R. GoyalProf./Agric & Biomedical Engineering, Univer-sity of Puerto Rico, P.O.Box 5984, Mayaguez PR, 006815984, U.S.A., TEL+1-787-265-4702E-mail: [email protected]
Ajit K. MahapatraPresent add: Agric. & Biosystems Eng. Dept., South Dakota State Univ., P.O. Box2120 Brook-ings, SD 57007-1496, U.S.A., TEL605-6885291, FAX 605-6886764, E-mail: [email protected]
-ASIA and OCEANIA-Graeme R. QuickConsulting Enginner, 83 Morrisons Road, Peaches-ter, Queensland, 4519, AUSTRALIA
Shah M. FaroukProfessor (Retd.),Farm Power & Machinery Dept., Bangladesh Agricultural University, Mymensingh 2200, BANGLADESH, TEL+880-91-5695ext.2596, FAX91-55810, E-mail: [email protected]
Daulat HussainDean, Faculty of Agric. Engineering and Tech-nology, Bangladesh Agricultural University, My-mensingh-2202, BANGLADESH, TEL+880-91-52245, FAX91-55810, E-mail: [email protected]
Mohammed A. MazedMember-Director, Bangladesh Agri. Res. Council, Farmgate, Dhaka, BANGLADESHE-mail: [email protected]
Chetem WangchenProgramme Director Agricultural Machinery Centre Ministry of Agriculture Royal Government of Bhutan, Bondey Paro Bhutan 1228, BHUTAN, E-mail: [email protected]
Wang WanjunPast Vice Director and Chief Engineer/Chinese Academy of Agricultural Mechanization Sciences, 1 Beishatan, Beijing, 100083, CHINATEL+86-(0)83-001-6488-2710, FAX001-6488-2710E-mail: [email protected]
Sarath IllangantilekeRegional Representative for South and West
Asia, International Potato Center (CIP), Regional Office for CIP-South & West Asia, IARI (Indian Ag-ric. Res. Institute) Campus, Pusa, New Delhe-12, 110002, INDIA, TEL+91-11-5719601/5731481, FAX./5731481, E-mail: [email protected]
S. M. IlyasDirector, National Academy of Agricultural Re-search Management (NAARM), Rajendranagar, Hyderabad-500030, INDIA, Tel+91-40-24015070, Fax:+91-41-24015912, E-mail: [email protected]
A. M. Michael1/64, Vattekunnam, Methanam Road, Edappally North P.O., Cochin, 682024, Kerala State, S. INDIA
Gajendra SinghProfessor, Vice Chancellor, Doon University 388/2, India Nagar, Dehradun - 248006, INDIATEL+91-989-738-4111, FAX+91-135-320-1920Email: [email protected]
T. P. OjhaDirector General(Engg.) Retd., ICAR, 110, Vineet Kung Akbarpur, Kolar Road, Bhopal, 462 023, INDIATEL+91-755-290045
S. R. VermaProf. of Agr. Eng, & Dean Eng.(Retd), 14, Good Friends Colony, Barewal Road , Via Ayoli Kalan, Lud-hiana 142027 Punjab, INDIA, TEL+91-(0)161-463096E-mail: [email protected]
SoedjatmikoPresident, MMAI(Indonesian Soc. of Agric. Eng. & Agroindustry), Menara Kadin Indonesia Lt.29 Jl. HR. Rasuna Said X-5/2-3 Jakarta, 12940, INDONESIATEL+62-(0)21-9168137/7560544, FAX(0)21-5274485/5274486/7561109
Mansoor Behroozi-LarProfessor, Agr. Machinery, Ph.D, Tehran University Faculty of Agriculture, Karaj, IRANTEL+98-21-8259240, E-mail: [email protected]
Saeid MinaeiAssistant Professor, Dept. of Agr. Machinery Eng., Tarbiat Modarres Univ., P.O.Box 14115-111, Tehran, IRANTEL+9821-6026522-3(office ext.2060, lab ext.2168)FAX+9821-6026524, E-mail: [email protected]
Jun SakaiProfessor Emeritus, Kyushu University, 2-31-1 Chi-haya, Higashi-ku, Fukuoka city, 813, JAPANTEL+81-92-672-2929, FAX+81-92-672-2929E-mail: [email protected]
Bassam A. SnobarProfessor and Vice President, Jordan University of Science and Technology, P.O.Box 3030 Irbid, 22110, JORDAN, TEL+962-2-295111, FAX+962-2-295123E-mail: [email protected]
Chang Joo ChungEmeritus Professor, Seoul National University, Ag-ricutural Engineering Department, College of Agri-culture and Life Sciences, Suwon, 441-744, KOREATEL+82-(0)331-291-8131, FAX+82-(0)331-297-7478E-mail: [email protected]
Chul Choo LeeMailing Address: Rm. 514 Hyundate Goldentel Bld. 76-3 Kwang Jin Ku,Seoul, KOREATEL+82-(0)2-446-3473, FAX+82-(0)2-446-3473E-mail: [email protected]
Muhamad Zohadie BardaieProfessor, Department of Agricultural and Biosys-tems Engineering, University Putra Malaysia, 43400 upm, Serdang, Serdangor, MALAYSIATEL+60-3-89466410Email: [email protected]
Madan P. PariyarConsultant, Rural Development through Selfhelp Promotion Lamjung Project, German Technical Cooperation. P.O. Box 1457, Kathmandu, NEPAL
David Boakye AmpratwumAssociate Professor, Dept.of Bioresource and Agri-cultural Engineering, College of Agriculture, Sultan Qaboos University, P.O. Box 34, Post Code 123, Muscat, Sultanate of Oman, OMANTEL+968-513866, FAX513866E-mail: [email protected]
EITag Seif Eldin Mailling Address: Dept. of Agric. Mechanization, College of Agriculture, P.O. Box 32484, Al-Khod, Sultan Qaboos University, Muscat, Sultanate of Oman, OMAN
Linus U. OperaAssociate Professor, Agricultural Engineering & Postharvest technology, Director, Agricultural Experiment Station, Sultan Qaboos University, Muscat, Sultanate of Oman, OMAN
Allah Ditta ChaudhryProfessor and Dean Faculty of Agric. Engineering and Technology, University of Agriculture, Faisala-bad, PAKISTAN
G R Quick S M Farouk DaoulatHussain
M A Mazed Chetem Wangchen
Wang Wanjun
S Illangantileke S M Ilyas A M Michael
T P Ojha S R Verma Soedjatmiko M Behroozi-Lar
Saeid Minaei
J Sakai B A Snorbar C J Chung C C Lee M ZBardaie
M P Pariyar D BAmpratwum
E S Eldin A DChaudhry
A Q Mughal R ur Rehmen B TDevrajani
N AAbu-Khalaf
Surya NathL U Opera
G Singh

AGRICULTURAL MECHANIZATION IN ASIA, AFRICA, AND LATIN AMERICA 2008 VOL.39 NO.298
R PVenturina
A. Q. A. MughalVice Chancellor, Sindh Agriculture University, Tan-dojam, PAKISTAN
Rafiq ur RehmanDirector, Agricultural Mechanization Reserch Insti-tute, P.O. Box No. 416 Multan, PAKISTAN
Bherulal T. DevrajaniProfessor and Chairman, Faculty of Agricultural En-gineering, Sindh Agriculture University, Tandojam, Sindh, PAKISTANTEL+92-2233-5594
Nawaf A. Abu-KhalafEngineer, the Project Directorate in Palestinian Ag-ricultural Ministry, P.O.Box 405, Hebron, PALESTINETelfax: 972-2-2227846/7E-mail: [email protected]
Surya NathAssoci. Prof., Dept. of Agriculture, Papua New Guinea University of Technology, Private Mail Basg, Lae, PAPUA NEW GUINEA, TEL+675-475-5162, FAX473-4477, E-mail: [email protected]
Reynaldo M. LantinProfessor, College of Engineering and Agro-Indus-trial Technology University of the Philippines Los Banos, Laguna 4031, PHILIPPINESTEL+63-(0)49-536-2792, FAX+63-(0)49-536-2873E-mail: [email protected]
Ricardo P. VenturinaPresident & General Manager, Rivelisa publishing House, 215 F, Angeles St. cor Taft Ave. Ext., 1300 Pasay City, Metro Manila,PHILIPPINES
Saleh Abdulrahman Al-suhaibaniProfessor, Agricultural Engineering Dept.,College of Agriculture, King Saud University,P.O. Box 2460 Riyadh 11451, SAUDI ARABIA
Ali Mufarreh Saleh Al-AmriProfessor, Dept. of Agric. Engineering, Colleg of Agricultural and Food Sciences, King Faisal Univer-sity, Al-Ahsa,SAUDI ARABIAE-Mail: [email protected],[email protected]
Sen-Fuh ChangProfessor, Agric.-Machinery Dept. National Taiwan University, Taipei, TAIWAN
Tieng-song PengDeputy Director, Taiwan Agricultural Mechaniza-tion Research and Development Center. FL. 9-6, No. 391 Sinyi Road, Sec. 4, TAIWAN
Suraweth KrishnasreniSenior Expert in Agricultural En-gineering, Depart-ment of Agricul-ture, Chatuchak, Bangkok 10900, THAILANDTel5792153,5794497,5798520,Ext.124, Fax9405791, E-mail: [email protected]
Surin PhongsupasamitPresident, Institute for Promotion of Teaching Sci-ence and Technology, 924 Sukumit Rd. Klong Toey Bangkok, THAILAND
Chanchai RojanasarojResearch and Development Engineer, Dept. of Ag-riculture, Ministry of Agriculture and Cooperatives, Gang-Khen, Bangkok 10900, THAILAND
Vilas M. SalokheProfessor, AFE Program, Asian Institute of Technol-ogy, P.O. Box 4, Klang Luang. Pathumthani 12120, THAILAND, TEL+66-2-5245479, FAX+66-2-5246200E-mail: [email protected]
Yunus PinarProfessor, and Head, Agric. Machinery Dept, Fac-ulty of Agriculture, University of Ondokuz Mayis, Kurupelit, Samsun, TURKEY
Imad HaffarAssociate Professor of Agric. Engineering, Faculty of Agricultural Sciences, United Arab Emirates Univer-sity, Al Ain, P.O. Box 17555, UAE, Tel+971-506436385, E-mail: [email protected]
Nguyen HayAssociate Professor, Dean of Faculty of Engineering, Nonglam University, Linh Trung Ward, Thu Duc Dis-trict, Ho Chi Minh City, VIET NAME-mail: [email protected]
Pham Van LangDirector, Vietnam Institute of Agricultural Engineer-ing, A2-Phuong Mai, Dong Da Hanoi, VIET NAM
Abdulsamad Abdulmalik Hazza,aProfessor and Head of Agricultural Engineering De-partment, Faculty of Agriculture, Sana,a University, P.O.Box 12355, Sana,a YEMEN, Tel+9671-407300, Fax:9671-217711, E-mail: [email protected]
-EUROPE-Anastas Petrov KaloyanovProfessor & Head, Research Laboratory of Farm Mechanization, Higher Institute of Economics, So-fia, BULGARIA
Pavel KicVice-Dean/Technical Faculty, Czech University of Agriculture Prague, 16521 Prague 6-Suchdol, CZECH, Tel+420-2-24383141, Email: [email protected]
Henrik HaveProf. of Agric. Machinery and Mechanization at In-stitute of Agric. Engineering, Royal Veterinan/- and Agricultural University, Agrovej 10DK2630 Tastrup, DENMARK
Joachim MüllerFull Professor at the University Hohenheim, Insti-tute of Agricultural Engineering, Head of Agricul-tural Engineering in the Tropics and Subtropics, University of Hohenheim, 70593 Stuttgart, GERMA-NY, Tel+0711-459-22490, E-mail: joachim.muller@ uni-hohenheim.de
Giuseppe PellizziDirector of the Institute of Agric. Engineering of the University of Milano and Professor of Agric. Machinery and Mechanization, Via G. Celoria, 2-20133 Milano, ITALY, Tel+39-02-503-16871, E-mail: [email protected]
W. B. HoogmoedUniversity Lecturer, Faculty of Lsg Agrarische Bedrii-jfstechnologie, Wangeningen University, Agrotech-nologie en Voedingswetenshappen, Bornsesteeg 59, 6700 AA, Wageningen, P.O.Box 17, NETHERLAND, E-mail: [email protected]
Jan PawlakProfessor, head of the Dept. of Economics and Utilization of Farm Machines at IBMER, Professor at the Univ. of Warmia and Mazury in Olsztyn, Fac. of Tech. Sci., POLAND
Oleg S. MarchenkoProfessor and agricultural engineer, Department Head in All-Russia Research Institute for Mechani-zation in Agriculture (VIM), 1st Institutsky proezd, 5, Moscow 109428, RUSSIA, Tel+7(095)174-8700, Fax+7(095)171-4349, E-mail: [email protected]
John KilgourSenior Lecturer in Farm Machinery Design at Silsoe College, Silsoe Campus, Silsoe, Bedford, MK45 4DT, UK
Milan MartinovFull Professor on Agricultural Machinery, Univer-sity of Novi Sad, Faculty of Engineering, Institute of mechanization and machine design, TRG D. Obra-dovica 6, 21 121 Novi Sad, PF55, YUGOSLAVIA, TEL+ 381-21-350-122(298), E-mail: [email protected]
O SMarchenko
J Kilgour M Martinov
S AAl-Suhaibani
A M SAl-Amri
S F Chang T S Peng S Krishnasreni S Phong-supasamit
C Rojanasaroj V M Salokhe
Y Pinar I Haffar P V Lang A A Hazza,a A P
KaloyanovP Kic H Have J Müller G Pellizzi
Jan Pawlak
N Hay
R M Lantin
W BHoogmoed

VOL.39 NO.2 2008 AGRICULTURAL MECHANIZATION IN ASIA, AFRICA, AND LATIN AMERICA 99
Back Issues
AGRICULTURAL MECHANIZATION IN ASIA, AFRICA AND LATIN AMERICA
(Vol.37, No.3, Summer, 2006)Optimisation of Machine Parameters of Pnue-
matic Knapsack Cotton Pikker (K. Ran-gasamy, M. Muthamilselvan, C. Divaker Durairaj) ........................................................
Tractor and Implement Ownership and Uti-lization of Haryana (Sandeep Yadav, S. Kumar Lohan) ..............................................
Study on Different Tillage Treatments for Rice-Residue Incorporation and its Effect on Wheat Yield in Tarai Region of Ut-taranchal (T. P. Singh, Jayant Singh, Raj Kumar) .........................................................
A Comparative Study on the Crop Establish-ment Technologies for Lowland Rice (T. Pandiarajan, U. Solaiappan, K. Rubapathi)
Design of Tractor Operated Rotary Cultivator - a Computer Simulation (H. Raheman, R. K. Sahu) ........................................................
Machine-Crop Parameters Affecting Per-formance of an Axial-Flow Soya Been Thresher (Anusorn Vejasit, Vilas M. Sa-lokhe) ............................................................
Prospects and Problems of Power Tillers in Selected Districts of North Eastern Hilly Region in India - a Case Study (E. V. Thomas, C. S. Sahay, K. K. Satapathy) .......
Design and Development of Cylinder Type Cotton Pre-Cleaner (P. G. Patil, V. G. Ar-ude, G. R. Anap) ...........................................
The Effect of a Fogging System on Sensible and Latent Heat Transfer in a Rose Green-house (H. H. Öztürk) ....................................
Evaluation of Wheat Bed Planting System in Irrigated Vertisols of Sudan (A. W. Ad-belhadi, S. E. A. El Awad, M. A. Bashir, Takeshi Hata) ...............................................
Subsoiling - a Strategy to Combat Water Scarcity and Enhanced Productivity of Groundnut Crop (K. K. Jain, V. R. Vaga-dia, L. P. Singh, A. H. Memon) ...................
Evaluation of Practical Training in Uganda’s Agricultural Engineering Carriculum (W. S. Kisaalita, J. B. Kawongolo, J. S. Kibala-ma) ................................................................
Performance Evaluation of a Tractor-Operat-ed Sugarcane Harvester (H. M. Al Sharief, M. A. Haque, N. A. Aviara) .........................
Role of Computers in Eco-Friendly and Sus-tainable Agriculture of the 21th Century (Madan K. Jha, V. M. Salokhe, Satish K. Jain) ..............................................................
◇ ◇ ◇
AGRICULTURAL MECHANIZATION IN ASIA, AFRICA AND LATIN AMERICA
(Vol.37, No.4, Autumn, 2006)Potential of Farm Mechanization in Jammu
and Kashmir State of India- a Review (Jag-vir Dixit, A. S. Jeena, N. C. Shahi, Tahir Wahid) ..........................................................
Case Study in the Conversion of Fired-Wood Fuel to other Suitable ones in the Rural
Areas of Vietnam (Nguyen Hay, Le Quang Giang) ...........................................................
Establishment and Performance of an Indege-neous Small Scale Rice Processing Plant in Nigeria (Gbabo Agidi)..................................
Evaluation of Soil-Water Conservation Till-age Systems for Communal Farmers in the Eastern Cape, South Africe (O. T. Mandi-ringana, M. Mabi, T. E. Simalenga) ............
Recent Developments in Sugarcane Mechani-sation in India (M. P. Sharma, S. R. Misra, Ashutosh Mishra) .........................................
Performance Efficiency of an Active Evapo-rative Cooling System for the Storage of Fruits and Vegetables in a Semi Arid Envi-ronment (Adam U. Dzivama, J. C. Igbeka, I. Audu) .........................................................
Inspection of Watermelon Maturity by Test-ing Transmitting Velocity of Acoustic Wave (Rao Xiuqin, Ying Yibin) ..................
Development and Testing of a Chilli Seed Ex-tractor (M. Balakrishnan, V. Thirupathi, V. V. Sree Narayanan) .......................................
Design and Fabrication of a Small-Scale Fruit Picker of Adjustable Height (Mohamad I. Al-Widyan, Hind M. Al-Qutob, Ahmad H. Hajeer) ..........................................................
Non Polluting Pestcide Application Window for Fruit Orchards in South Central Chile (Edmundo J. Hetz, Fernando A. Venegas, Marco A. Lopez)...........................................
Performance Evaluation of an Evaporative Cooling System for Fruits and Vegitable Storage in the Tropics (F. A. Babarinsa) .....
Development and Testing of a Tomato Pulper Cum Straner (V. Thirupathi, R. Viswana-than, K. Thangavel) ......................................
Comparative Feasibility Analysis of Alterna-tive Renewable Energy Sources for Small Milk Cooling Plants of Southwestern Uganda) ........................................................
Development of Simple Pulper for Leaves of Green Plant (Julius K. Tangka) ....................
Constrains and Prospects of Agricultural Mechanisation in Samoa (Md. Wali Ullah)
Design and Development of an Off-Set Ro-tary Cultivator for Use with a Two-Wheel Tractor for Fruit Tree Cultivation (A. Sena-narong, K. Wannaronk) ................................
◇ ◇ ◇
AGRICULTURAL MECHANIZATION IN ASIA, AFRICA AND LATIN AMERICA
(Vol.38, No.1, Winter, 2007)The Evaluation of Performance and Energy
Usage in Submersible Deep Well irrigation Pumping Plants (Sedat Çalisir) ...................
Status of Farm Mechanization in Nalanda District of Bihar (V. B. Shambhu, R. B. Ram) .............................................................
Effect of Puddling on Physical Prosperities of Soil and Rice Yield (B. K. Hehera, B. P. Varshney, S. Swain)......................................
Ground Contact Pressure and Soil Sedimen-tation Period Affecting Transplanter Sink-
age and its Performance (B. K. Hehera, B. P. Varshney, S. Swain) ..................................
Development of a Reinforced Mud Silo (A. F. Alonge, A. A. Opeloyeru) ............................
Current Status, Constraints and Potentiality of Agricultural Mechanization in Fiji (M. W. Ullah, S. Anad) .......................................
Performance of some Pneumatic Tires Used in Camel Carts on Sandy Terrain (Ghan-shyam Tiwari, Ajay Kumar Sharma, K. P. Pandey) .........................................................
Feasibility of Collecting Ambient Air Mois-ture by Forced Condensation (Hamid Al-Jalil, Jumah Amayreh, Mohamad Al- Widyan) ........................................................
Energy Cost of Riding and Walking Type Power Tillers (Binisam, K. Kathirvel, R. Manian, T. Senthikumar) .............................
Vibration Mapping of Walking and Riding Type Power Tillers (K. Kathirvel, Binisam, R. Manian, T. Senthikumar) ........................
Oman Traditional Farms: Changes and Im-provement of Farms in Oman (Ahmed Al-Marshudi) .....................................................
Prospects of Maize Cultivation Mechaniza-tion in Hills of Himachal Pradesh (Sukhbir Singh, Dinesh Kumar Vatsa) .......................
Farm Mechanization in Andaman and Nico-bar Island (M. Din, P. S. Deshmukh, N. Ravisankar, S. G. Choudhuri) .....................
Current Status of Animal traction in Mexico (H. Ortiz-Laurel, D. Rössel) ........................
◇ ◇ ◇
AGRICULTURAL MECHANIZATION IN ASIA, AFRICA AND LATIN AMERICA
(Vol.38, No.2, Spring, 2007)Noise Levels in Indian Cotton Gins (V. G.
Arude) ..........................................................Evaluation of Hydraulic Energy Nozzels Suit-
able for Orchard Spraying (T. Senthilku-mar, V. J. F. Kumar) ......................................
An Innovative Vertical Axial-flow Threshing Machine Developed in China (Ji Ma) .........
Storage Stability of Selected Agricultural Grains (E. S. A. Ajisegiri, P. A. Idah) .........
Design of Tool Carrier for Tillage Studies of Disc in Field Conditions (B. K. Yadav, In-dra Mani, J. S. Panwar) ................................
Design, Development and Evaluation of Seed Cum Fertilizer Drill (Ajay Kumar Verma, M. L. Dewangan) ..........................................
Tillage Effect on Yield, Quality, Management and Cost of Sugarbeet (Koc Mehmet Tu-grul, Ilknur Dursun) .....................................
Potential for No-Tillage Agricultural in the Pandamatenga Vertisols of Botswana (M. Tepela, B. Kayombo, F. Pule-Meulenberg) .
Development and Performance Test of a La-ser Controlled Land Levelling Machine (Lin Jianhan, Liu Gang, Wang Maohua, Si Yongsheng, Lv Qingfei, Yang Yunuo) ........
Chikpea Threshing Efficiency and Energy Consumption for Different Beater-Con-trbeater Combinations (Turhan Koyuncu,
(Vol.37, No.3, Summer, 2006-)
9
15
18
25
27
32
39
46
52
62
68
71
79
85
9
15
21
27
33
36
42
46
49
52
60
66
69
76
81
87
9
18
23
29
34
39
46
51
55
61
68
74
78
83
9
13
18
23
29
33
38
42
48

AGRICULTURAL MECHANIZATION IN ASIA, AFRICA, AND LATIN AMERICA 2008 VOL.39 NO.2100
Erkut Peksen, Abdullah Sessiz, Yunus Pinar) ............................................................
Rotally Tiller Blade Surface Development (Varinder Singh, D. S. Wadhwa) .................
Present Status and Future Scope of Mechani-zation of Horticultural Crops in Mountais (Sukhbir Singh, Dinesh Kumar Vasta, S. K. Upadhaya) ................................................
Development of Solar Cabinet Dryer for Dates (D. B. Ampratwum, A. S. S. Dorvo, I. Haffer) ........................................................
Mechanical Consideration for Design and Development of Furrow Openers for Seed Cum Fertilizer Drill (Ajay Kumar Verma, M. L. Dewangan, V. V. Singh, Vineet Das)
Performance Evaluation of a Yum (Dioscorea spp.) Harvester (Issac N. Itodo, Joakim O. Daudu) ..........................................................
◇ ◇ ◇
AGRICULTURAL MECHANIZATION IN ASIA, AFRICA AND LATIN AMERICA
(Vol.38, No.3, Summer, 2007)Modification of Power Transmission Sys-
tem to the Stationary Combine Thresher (Mohamed Hassan Dahab, Hassan Elhaj Hamed Hassan, Mohamed Hassan Nayel) .
Performance Evaluation of Tractor Drawn Weeding Cum Earthing-up Equipment for Cotton (K. Kathirvel, R. Manian, T. Sent-hilkumar) .....................................................
Studies on Blending of Refined Soybean Oil and Ethanol with Diesel as Hybrid CI En-gine Fuel (Mukesh Singh, T. K. Bhattacha-rya, H. C. Joshi, T. N. Mishra) .....................
Effect of Whole Body Vibration of Riding Type Power Tiller (Binisam, K. Kathirvel, R. Manian, L. P. Gite) ..................................
Post Harvest Practices of Betel Leaves in Orissa, India (K. Rayaguru, Md. K. Khan, G. Sahoo, U. S. Pal) ......................................
Effect of Design and Operating Parameters of Performance of Inter-cultivation Sweep Vertisols (S. N. Yadav, M. M. Pandey, D. C. Saraswat) ..................................................
Development and Evaluation of a Light Weight Power Tiller Operated Seed Drill for Hilly Region (Sukhbir Singh, Dinesh Kumar Vasta) ................................................
An Air t ight Paddy Storage System for Small-scale Farmers in Sri Lanka (T. B. Adhikarinayake, J. Müller, J. Oostdam, W. Huisman, P. Richards) ..................................
Soybean Threshing Efficiency and Power Consumption for Different Concave Mate-rials (A. Sessiz, T. Koyuncu, Y. Pinar)........
Evaluation of the Agricultural Tractor Park of Ecuador (Lizardo Reina C, Edmundo J. Hetz) .............................................................
Improvement of the Modif icated Grain Thresher for Groundnut Threshing (Sheikh El Din Abdel Gadir El-Awad, Awad El-Karim Sir-Elkhatim Abdu-Elmagid, Mo-hamed Ahmed Ali) .......................................
Design, Development and Evaluation of a Ro-tary Type Chilly Dryer (S. Kaleemullah, R. Kaliappan) .....................................................
Influence of Forward Speed and terrain Con-dition on Hand Transmitted Vibration of Power Tiller (Binisam, K. Kathirvel, R. Manian, C. R. Mehta) ...................................
53
58
63
69
74
79
9
15
20
28
33
38
45
48
56
60
67
73
79
Performance Evaluation of Implements for Incorporation of Cotton Stalk (T. Senthil-kumar, Aravinda Reddy, R. Manian, K. Kathirvel) .....................................................
◇ ◇ ◇
AGRICULTURAL MECHANIZATION IN ASIA, AFRICA AND LATIN AMERICA
(Vol.38, No.4, Autumn, 2007)Design and Testing of a Small-Scale Solar
Crop Dryer (Mohamad I. Al-Widyan, Shatha Amourah, Lina Hilles, Rodainah Malkawi, Ahmed Abu-Al Rangheb) ..........
Energetics and Economics in Conventional Processing of Arecanut (Areca catechu L.) in India (J. John Gunasekar, S. Kaleemul-lah, P. Doraisamy, Z. John Kennedy) ..........
Hill Agricultural Mechanization in Himachal Pradesh - A Case Study in Two Selected Districts (Sukhbir Singh) .............................
Design and Evaluation of Portable Tunnels for Summer Growth of Ornamental Plants (V. P. Sethi) ...................................................
A Simulation Program for Predicting Haulage performance of 2WD Tractor and Balanced Trailer System (R. K. Sahu, K. P. Pandey) .
Comparative Performance of Four Bullock Drawn Puddlers (A. K. Shrivastava, R. K. Datta) ............................................................
Design and Testing of a Mangosteen Fruit Sizing Machines (Bundit Jarimopas, Cho-uw Inprasit, Siam Toomsaengtong) .............
Extraction of Essencial Oil: An Appropriate Rural Technology for Minimizing Wastage of Surplus Betel Leaves (P. Guha) ...............
Effect of Operational Speed and Moisture Content of Wheat Crop on Plot Combine Harvester (S. K. Patel, B. P. Varshney) .......
Enhancing the Shelf Life of Fully Ripe Guava and Mango Fruits Using Wax Emulsions (P. Rajkumar, R. Viswanathan, R. Kailap-pan, V. Thirupathi, L. Narayanan) ..............
Development of an Aqueous Palm Oil Extrac-tion System (O. K. owolarafe, L. A. Sanni, W. A. Olosunde, O. O. Fadeyi, O. O. Aji-bola) ..............................................................
The Response of Two-Sorghum Cultivars to Conventional and Conservation Tillage Systems in Central Sudan (Moheialdeen Ahmed Abdalla, Abdelmoniem Elamin Mohamed, Elsamawal Khalil Makki) .........
Tillage and Planting Management for Im-proving the Productivity and Profitability of Rice-Wheat Cropping System (K. K. Singh, A. S. Jat, S. K. Sharma) ....................
Development of a Yam Pounding Machine (A. O. Raji, K. O. Oriola) .............................
Possession, Knowledge and Operational Status of Farm Machinery with Surveyed Farm Woman in Vindhya Plateau Agro-climatic Zone of Madhya Pradesh (S. P. Singh, Nirmal Kumar, L. P. Gite, N. Agrawal) .......................................................
◇ ◇ ◇
AGRICULTURAL MECHANIZATION IN ASIA, AFRICA AND LATIN AMERICA
(Vol.39, No.1, Winter, 2008)Performance Comparisions of Tractor Tire
Configurations on Concrete Surface (Sarp
84
9
13
18
26
31
37
42
47
51
55
61
67
72
77
82
Korkut Sümer, Alaettin Sabanci) ................Assessment of Postural Discomfort Dur-
ing Power Tiller Operation (Bini Sam, K. Kathirvel) ......................................................
Agricultural Accidents - A Case Study in Etawah Districts of Uttar Pradesh in India (Sanjay Kumar Patel, M. R. Varma) ............
The Department of Biosystems Engineering (BSE) at Jordan University of Science and Technology (Adnan I. Khudair, Majed Abu-Zreiq) ....................................................
Evaluation, Constraints and Acceptability of Different Types of Vertical Conveyer Reaper for Harvesting Rice in Coastal Orissa, India (B. C. Parida) ..........................
Stracture, Management, Operation and Mechanization Possibilities of the Irriga-tion Systems in Turkey (A. Asik, H. B. Unal, M. Avci, V. Demir) .............................
Effect of Operating Parameters and Pestcide Flow Characteristics on Performance of Air Assisted Spraying (D. Dhalin, K. Kath-irvel, T. V. Job, R. Manian) ..........................
Field Application of Modified Low Cost Dry-er for Rice Seed Drying - A Case Study in West Java and Central Java, Indonesia (R. Rachmat, Sudaryono, S. Lubis, S. Nagraha, R. Thahir, J. F. Rickman, M. Gummert) .....
Under and Above Ground Storage Loss of Sorghum Grain in Eastern Hararge, Ethio-pia (Fekadu Lemessa) ...................................
Field Evaluation of Power Weeder for Rain-fed Crops in Kashmir Vally (Jagvir Dixit, Intikhab Syed) ..............................................
Ergonomic Studies on the Location and Op-erational Frequency of Controls in Indian Farm Tractor (Vinay Madan, H. S. Dhin-gra, Santokh Singh) ......................................
Performance of the Ram Press with Differ-ent Oilseeds (John M. Kamau, David K. Some).............................................................
Adaption of an Impeller Type Husker for Long Grain Rice (J. Aveyire, K. A. Dzisi, A. Bart-Plange) .............................................
Impact of Tractorization on Farming in India with Special Reference to the State of West Bengal (Pradip Banerjee, A. K. Giri) .........
The Farm Machinery Industry in Japan and Research Actives - The Present State of Farm Machinery Industry (Shin-Norinsha Co., Ltd) ........................................................
■■
9
14
19
24
29
33
39
46
49
53
57
61
65
71
77


