A.M. Best Market Briefing at the EAIC 2018 · purchase, sell or hold any securities, insurance...
37
A.M. Best Market Briefing at the EAIC 2018
Transcript of A.M. Best Market Briefing at the EAIC 2018 · purchase, sell or hold any securities, insurance...

A.M. Best Market Briefing
at the EAIC 2018

Agenda
2

Perspectives on the
Global Reinsurance Market
Stefan Holzberger
Chief Rating Officer
7 May 2018

© AM Best Company, Inc. (AMB) and/or its licensors and affiliates. All rights reserved. ALL INFORMATION CONTAINED HEREIN ISPROTECTED BY COPYRIGHT LAW AND NONE OF SUCH INFORMATION MAY BE COPIED OR OTHERWISE REPRODUCED,REPACKAGED, FURTHER TRANSMITTED, TRANSFERRED, DISSEMINATED, REDISTRIBUTED OR RESOLD, OR STORED FORSUBSEQUENT USE FOR ANY SUCH PURPOSE, IN WHOLE OR IN PART, IN ANY FORM OR MANNER OR BY ANY MEANSWHATSOEVER, BY ANY PERSON WITHOUT AMB’s PRIOR WRITTEN CONSENT. All information contained herein is obtained by AMB fromsources believed by it to be accurate and reliable. AMB does not audit or otherwise independently verify the accuracy or reliability of informationreceived or otherwise used and therefore all information contained herein is provided “AS IS” without warranty of any kind. Under nocircumstances shall AMB have any liability to any person or entity for (a) any loss or damage in whole or in part caused by, resulting from, orrelating to, any error (negligent or otherwise) or other circumstance or contingency within or outside the control of AMB or any of its directors,officers, employees or agents in connection with the procurement, collection, compilation, analysis, interpretation, communication, publication ordelivery of any such information, or (b) any direct, indirect, special, consequential, compensatory or incidental damages whatsoever (includingwithout limitation, lost profits), even if AMB is advised in advance of the possibility of such damages, resulting from the use of or inability to use,any such information. The credit ratings, financial reporting analysis, projections, and other observations, if any, constituting part of theinformation contained herein are, and must be construed solely as, statements of opinion and not statements of fact or recommendations topurchase, sell or hold any securities, insurance policies, contracts or any other financial obligations, nor does it address the suitability of anyparticular financial obligation for a specific purpose or purchaser. Credit risk is the risk that an entity may not meet its contractual, financialobligations as they come due. Credit ratings do not address any other risk, including but not limited to, liquidity risk, market value risk or pricevolatility of rated securities. AMB is not an investment advisor and does not offer consulting or advisory services, nor does the company or itsrating analysts offer any form of structuring or financial advice. NO WARRANTY, EXPRESS OR IMPLIED, AS TO THE ACCURACY,TIMELINESS, COMPLETENESS, MERCHANTABILITY OR FITNESS FOR ANY PARTICULAR PURPOSE OF ANY SUCH RATING OROTHER OPINION OR INFORMATION IS GIVEN OR MADE BY AMB IN ANY FORM OR MANNER WHATSOEVER. Each credit rating or otheropinion must be weighed solely as one factor in any investment or purchasing decision made by or on behalf of any user of the informationcontained herein, and each such user must accordingly make its own study and evaluation of each security or other financial obligation and ofeach issuer and guarantor of, and each provider of credit support for, each security or other financial obligation that it may consider purchasing,holding or selling.
4

Reinsurance Market Dynamics
Outlook ?
Convergence Capital
Intense Competition
Earnings Strained
Excess Capital
Inflation Potential
Low Investment
Yields
4

6
Global Reinsurance
Performance Results & Trends

Total Economic and Insured Losses
7
*Due to rounding, numbers do not sumSource: Swiss Re Institute
2017 2016Annual
Change (%)10-Year Average
Economic LossesUSD
Billions
USD
Billions
USD
Billions
Nat Cat 330 171 93% 178Man-made 7 10 -22% 12
Total 337 180* 87% 190
Insured LossesNat Cat 138 48 190% 50Man-made 6 8 -25% 7
Total 144 56 158% 58*
6

Global Combined Ratio
8
Source: A.M. Best data and research
55.9% 56.2% 56.2% 60.6%
76.5%
61.1%
31.9% 33.5% 34.2%34.7%
33.6%
33.6%
5.8% 5.4% 6.0% 5.8%
4.0%5.4%
0%
5%
10%
15%
20%
25%
30%
35%
40%
45%
50%
0%
20%
40%
60%
80%
100%
120%
2013 2014 2015 2016 2017 5yr Avg
Expense Ratio Loss Ratio Loss Reserve Development
110.1%
89.7% 90.4%95.2%
87.9%94.7%
7

Global Return on Equity
9
Source: A.M. Best data and research
13.0%
11.6%
9.5%
8.3%
-0.3%
-2%
0%
2%
4%
6%
8%
10%
12%
14%
2013 2014 2015 2016 2017
Return on Equity Five-Year Average

2018 Insurance
Market Briefing -
3 April 2018 10
Source: A.M. Best data and research
8.4%
4.5%
0%
1%
2%
3%
4%
5%
6%
7%
8%
9%
Five -Year Average Return on Equity Five -Year Average Return on Equity Excluding LossReserve Development
Global Return on Equity – Five-Year Average

11
Market Capacity

Top 10 Largest Reinsurance Groups
10 September 2017 12
Reinsurance WP Total
Life & Non-Life Shareholders’(USD Millions) Gross Net Funds
Swiss Re 35,622 33,570 35,716
Munich Re 33,154 31,891 33,493
Hannover Ruck 17,232 15,192 10,264
SCOR 14,569 13,238 7,055
Berkshire Hathaway 12,709 12,709 286,359
Lloyd's 11,576 8,694 34,101
RGA 10,107 9,249 7,093
China Re 7,857 7,517 10,384
Great West Lifeco 6,195 6,112 13,857
Korean Re 5,554 3,903 1,755
Source: A.M. Best data and research. Ranked by unaffiliated gross premium written in 2016

Estimate for Dedicated Reinsurance Capacity
13
320 340 332
345 345
48
60 68
75 82
0
50
100
150
200
250
300
350
400
450
2013 2014 2015 2016 2017
Convergence Capacity
Traditional Capacity
* ForecastSource: A.M. Best and Guy Carpenter
(US
D B
illio
ns)

Convergence Capacity
14
Source: A.M. Best and Guy Carpenter
4 3 4 5 5
25
34
41
4952
19
23
23
22
25
0
10
20
30
40
50
60
70
80
90
2013 2014 2015 2016 2017E*
ILW Collateralized Re Catastrophe Bonds
*Forecasted
0
10
20
30
40
50
60
70
0
2
4
6
8
10
12
14
1997
1998
1999
2000
2001
2002
2003
2004
2005
2006
2007
2008
2009
2010
2011
2012
2013
2014
2015
2016
2017
Num
ber o
f Deals
CAT Bonds Issued Number of Deals
CAT BondsConvergence Capacity
Source: A.M. Best and Artemis

15
Market Strategies & Opportunities

Global Market Strategies
16
Client Agent & Broker
Primary Insurance Company
Reinsurance Broker
Reinsurance Company
Convergence Capital
In A.M. Best’s opinion…
The market will continue to
become more efficient as all
players strive to become closer to
the client

Opportunities for the Reinsurance Sector
17
Cyber Insurance
Flood Mortgage Terrorism InsurTech

Global Reinsurance Outlook
Headwinds
Intense competition
Incr. interest from 3rd party capital
Earnings under pressure
Excess capacity hinders improvement
Potential for increased inflation
Although capitalization remains strong and rate deterioration halted, pressure on margins continues. Over the intermediate term, returns for some reinsurers will fall short on a risk-adjusted basis.
Maintain negative outlook.
Tailwinds
Cession rates increasing
Cat losses temporarily stabilize rates
Favorable reserve development
Strong risk-adjusted capital
Increase in interest rates
M&A
17

Credit Ratings and Market Update
in China
Christie Lee
Head of Analytics, Northeast Asia
7 May 2018

4%
16%
42%
34%
4%0%
4%
15%
44%
33%
2% 2%
A + + A + A A - B + + B +
FSR at Mar 30, 2017 FSR at Mar 30, 2018
Northeast Asia – Rating Distribution
20
• High growth
• Heavily weighted to Motor line
• Marginal underwriting results
• Japan: Slow domestic growth and overseas expansion
• Korea: Raising capital to get prepared for IFRS 17 and K-ICS in 2021
China Japan/ Korea
Key Market Characteristics
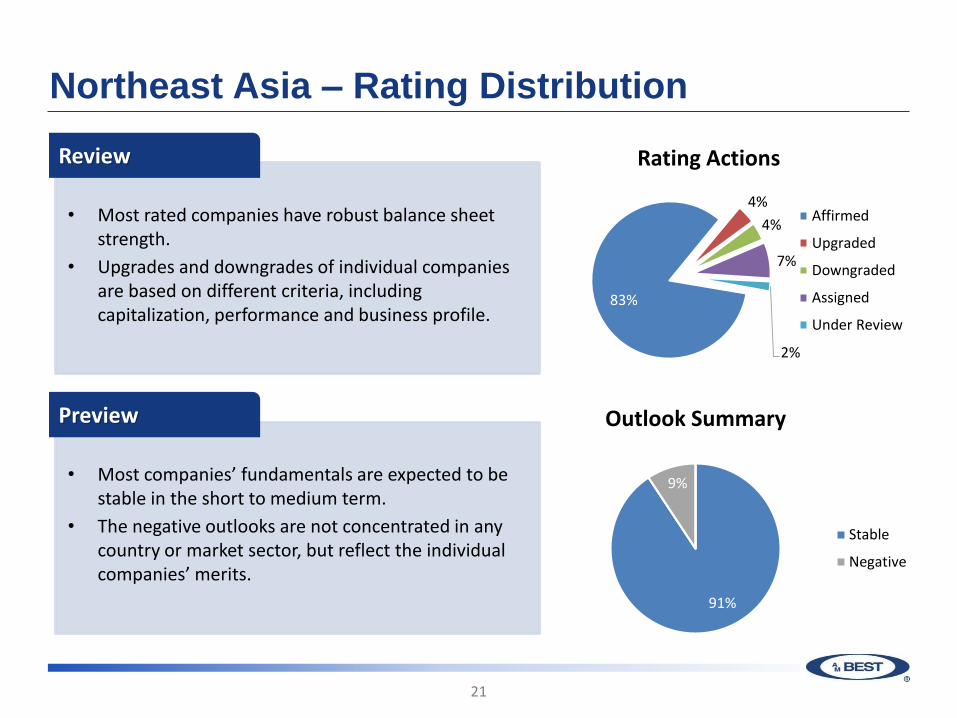
Northeast Asia – Rating Distribution
21
83%
4%
4%
7%
2%
Rating Actions
Affirmed
Upgraded
Downgraded
Assigned
Under Review
• Most rated companies have robust balance sheet strength.
• Upgrades and downgrades of individual companies are based on different criteria, including capitalization, performance and business profile.
Review
• Most companies’ fundamentals are expected to be stable in the short to medium term.
• The negative outlooks are not concentrated in any country or market sector, but reflect the individual companies’ merits.
Preview
91%
0%9%
0%
Outlook Summary
Stable
Negative

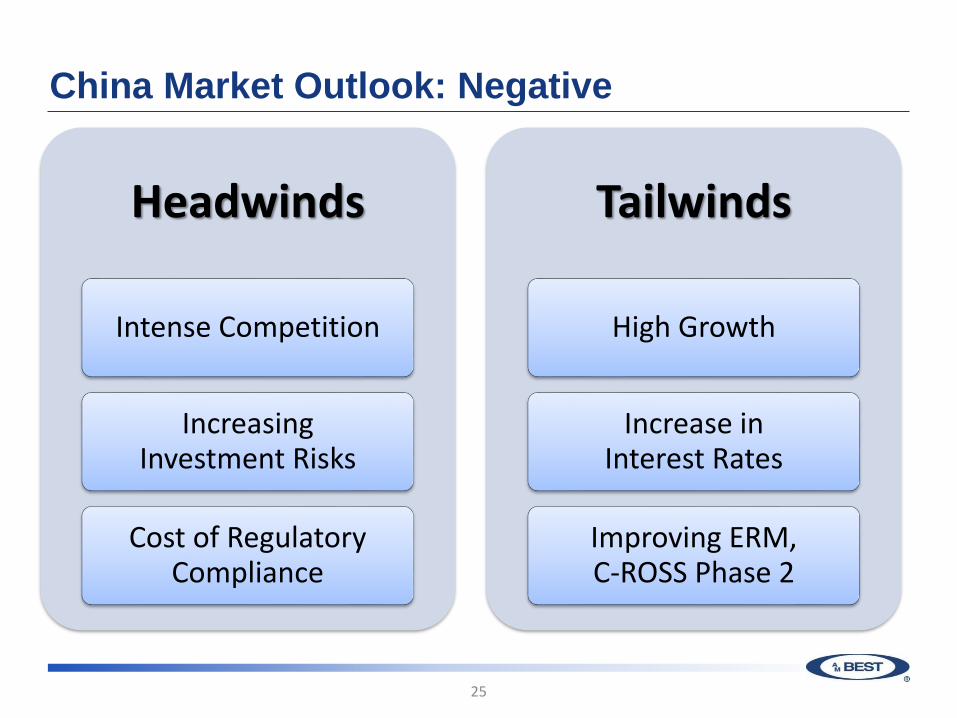
China Market Outlook: Negative
Headwinds
Intense Competition
Increasing Investment Risks
Cost of Regulatory Compliance
Tailwinds
High Growth
Increase in Interest Rates
Improving ERM, C-ROSS Phase 2
22

97.8% 98.0% 97.6%
106.4%108.3% 108.8%
2015 2016 2017 2015 2016 2017
China
23
Non-Life Real Premium Growth (2016)
Combined Ratio: China Non-Life Insurers
Large Insurers (Motor Focus)
S/M Insurers (Motor Focus)
Growth Opportunities Results in Intense Competition:
• China non-life market’s growth is almost equal to that of North America and Western Europe combined.
• In 2017, China’s non-life gross premium written grew to RMB 1 trillion (USD 160 billion), a 13.8% increase over 2016.
• Motor still accounts for over 70% of the market portfolio.
• Motor detariffication has intensified competition.

2018 EAIC 7 May 2018
China
24
• Overall operating results are highly reliant on investment returns.
• Investment returns are subject to domestic market volatility.
• Insurers have been increasing their allocations to other investments.
0
10
20
30
40
50
60
2013 2014 2015 2016 2017
RM
B (
Bri
llio
n)
Net Profit before Tax (Top 5)
Underwriting Investment
9.9% 11.7% 15.6% 18.3% 24.7% 27.4%
2012 2013 2014 2015 2016 2017
Investment Allocation (Top 5)
Cash & cash equivalents Bonds Equities and funds Long-term equities Other Investments
China Market Outlook: Negative
Headwinds
Intense Competition
Increasing Investment Risks
Cost of Regulatory Compliance
Tailwinds
High Growth
Increase in Interest Rates
Improving ERM, C-ROSS Phase 2
25

China - Opportunities
High growth and profitable lines - Liabilities, Credit & Surety, Personal Accident
Inward Reinsurance - Diversified the portfolio
Belt and Road – Collaborations between domestic and foreign insurers
Technology- Distribution, operational efficiencies, innovative products
26

Credit Ratings and Market Update in
Southeast Asia
Chi-Yeung Lok
Head of Analytics, Southeast Asia
and Australasia
7 May 2018

Overview
28
Introduction
Rating Distribution and Actions
Trends
Headwinds & Tailwinds
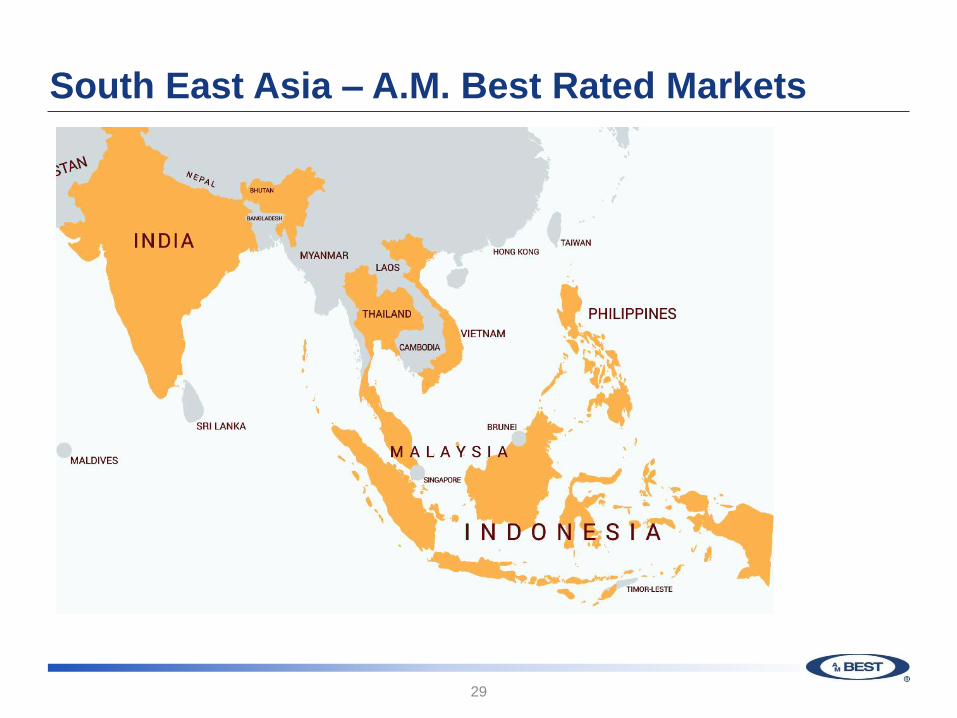
South East Asia – A.M. Best Rated Markets
29

South East Asia – Rating Distribution
30
Key Market Characteristics
Growth MarketsMature Markets
• Slowdown in growth
• Less commercial fire
• Small markets
• Still growing
• More commercial, fire
• Small markets – other than India
3%
15%
38%
33%
10%
3%
16%
39%
32%
11%
A+ A A- B++ B+
FSR as at Mar 17 FSR as at Mar 18
Source: A.M. Best

87%
2%
8%
3%
Rating Actions
Affirmed
Upgraded
Downgraded
Initial
79%
5%
16%
Outlooks
Stable
Positive
Negative
South East Asia – Rating Actions and Outlooks
31
• Most companies have solid risk-adjusted capitalization
• Downgrades / outlook changes
• Performance issues
• Reserving issues
Review
• Underwriting margins still positive in most South East
Asian markets – but becoming slimmer
• Ability to adapt to low growth environment and shift to
personal lines
• Relevance of technology in terms of channels,
efficiency, risk management?
Preview
Source: A.M. Best

Premium Growth Trends
32
0%
5%
10%
15%
20%
2012 2013 2014 2015 2016 2017
Vietnam
0%
5%
10%
15%
20%
2012 2013 2014 2015 2016 2017
Indonesia
-5%
0%
5%
10%
15%
2012 2013 2014 2015 2016 2017
Singapore
-5%
0%
5%
10%
15%
2012 2013 2014 2015 2016 2017
Thailand
• Growth in mature markets slowing more significantly
• Shift to retail in growth markets
• Slow rollout of government initiatives – fire and commercial growing slower than expected
-5%
0%
5%
10%
15%
2012 2013 2014 2015 2016 2017
Malaysia
Source: A.M. Best and regulatory statistics
0%
5%
10%
15%
20%
2013 2014 2015 2016 2017
Philippines

Combined Ratio Trends
33
80%
90%
100%
2012 2013 2014 2015 2016 2017
Vietnam
80%
90%
100%
2012 2013 2014 2015 2016 2017
Indonesia
80%
90%
100%
2012 2013 2014 2015 2016 2017
Malaysia
80%
90%
100%
2012 2013 2014 2015 2016 2017
Singapore
80%
90%
100%
2012 2013 2014 2015 2016 2017
Thailand
90%
100%
110%
2012 2013 2014 2015 2016 2017
Philippines
• Underwriting margins positive but declining
• As premiums are increasing in growth markets, so are combined ratios
• Need to manage quality of growth and expense ratios
Source: A.M. Best and regulatory statistics

UW Margins – South East Asia (2016)
34
48%55%
51%43%
52% 54%
49%40%
43%51%
41%33%
Vietnam Thailand Indonesia Philippines Singapore Malaysia
Loss Ratio Expense Ratio
Source: A.M. Best and regulatory statistics
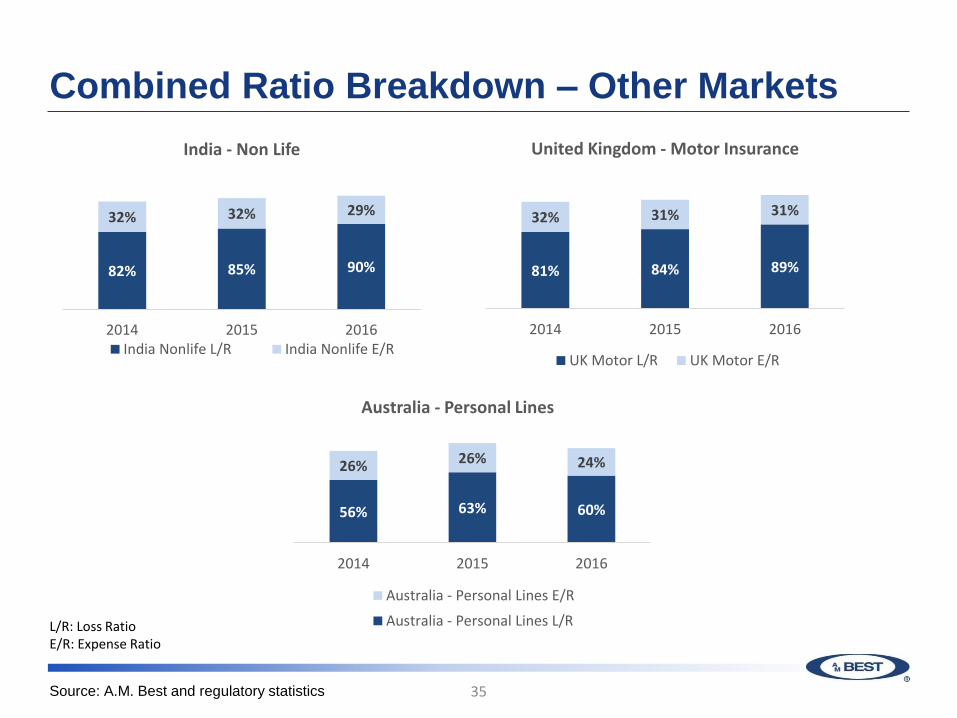
Combined Ratio Breakdown – Other Markets
35
81% 84% 89%
32% 31% 31%
2014 2015 2016
United Kingdom - Motor Insurance
UK Motor L/R UK Motor E/R
82% 85% 90%
32% 32% 29%
2014 2015 2016
India - Non Life
India Nonlife L/R India Nonlife E/R
56% 63% 60%
26% 26% 24%
2014 2015 2016
Australia - Personal Lines
Australia - Personal Lines E/R
Australia - Personal Lines L/RL/R: Loss RatioE/R: Expense Ratio
Source: A.M. Best and regulatory statistics

Conclusion
36
Headwinds
• Stagnant growth
• Quality of growth
• Technical expertise
Tailwinds
• Technology
• Low penetration
• Solid risk-adjusted capitalization

Questions & Answers