ALWAR DISTRICT SURVEY REPORT - PEOPLES PULSE
96
-------------------------------------------------------------------------------------------------------------------------------- 9B, Samrat Complex, Opp: AG’s Office, Saifabad, HYDERABAD- 500 004. [email protected] 1 | Page SURVEY REPORT ON PULSE OF THE ELECTORATE IN ALWAR DISTRICT (Rajasthan State) (Dates of Survey: 07/09/2013 to 11/09/2013)
Transcript of ALWAR DISTRICT SURVEY REPORT - PEOPLES PULSE

--------------------------------------------------------------------------------------------------------------------------------
9B, Samrat Complex, Opp: AG’s Office, Saifabad, HYDERABAD- 500 004.
1 | P a g e
SURVEY REPORT ON PULSE OF THE
ELECTORATE IN
ALWAR DISTRICT
(Rajasthan State)
(Dates of Survey: 07/09/2013 to 11/09/2013)

--------------------------------------------------------------------------------------------------------------------------------
9B, Samrat Complex, Opp: AG’s Office, Saifabad, HYDERABAD- 500 004.
2 | P a g e
METHODOLOGY
� A Public Opinion was conducted to gauge the implementation of welfare
schemes, performance of government & political preferences and felt needs of
the people in Alwar district of Rajasthan from 07/09/2013 to 11/09/2013
� 11 Assembly constituencies in the Alwar district were chosen for survey.
� Survey was conducted on the pulse of electorate to gauge the political
preferences of the people in Alwar district consisting of 11 Assembly segments
namely Alwar Rural(SC), Alwar Urban, Thanagazi, Tijara, Ramgarh, Rajgarh-
Laxmangarh(ST), Mundawar, Kishangarh Bas, Kathumar(SC), Bansur, and
Behror was conducted.
� A structured questionnaire and secret voting through ballot was used to collect
the data. Through this questionnaire, totally 13,200 respondents were
interviewed.
� The sample procedure followed for this study was that from each Assembly
constituency, 10 polling booths were selected through the method of Probability
proportional to size (PPS) for the survey.
� Out of 2342 Polling Stations, 132 are chosen for survey based on the method of
Probability Proportional to Size (PPS)
� Among the selected polling booths from each assembly segment respondents
were indentified through random sampling. Totally, 4 days field work was
carried in the Assembly segment. 100 samples collected from each polling
station.

--------------------------------------------------------------------------------------------------------------------------------
9B, Samrat Complex, Opp: AG’s Office, Saifabad, HYDERABAD- 500 004.
3 | P a g e
� Prof. Ashutosh Kumar of the Political Science Department of Pubjab University
chaired the workshop conducted for field investigators at Jaipur. Prof. Vibhutii
Singh Shekhawat, Associate Professor and Head of the Department of
Humanities and Social Sciences, MNIT, Jaipur , coordinated the survey work
with field investigators.
� Data Entry work coordinated and supervised by Ms. Pratima Umar, M.Phil.,
Economics, CESP/SSS/JNU
� Data analysis and report prepared by Mr. Sajjan Kumar, Research Scholar, CPS,
JNU and Mr. Bathula Suresh Babu, Research Scholar, School of Economics,
Hyderabad Central University.

--------------------------------------------------------------------------------------------------------------------------------
9B, Samrat Complex, Opp: AG’s Office, Saifabad, HYDERABAD- 500 004.
4 | P a g e
SAMPLE PROFILE
Total Sample – 13,200
GENDER AGE
Male - 59.2% Female – 40.8%
First Voter -3.7% 18-25 years – 21.0% 26-35 years – 32.9% 36-45 years – 23.8% 46-60 years – 13.3% 60 Above - 5.3%
PLACE OCCUPATION
Village - 64.2% Small Town - 19.4% Big Town - 14.0% District Head Quarter - 1.3% Assembly Head Quarter – 1.0%
Govt. Employee - 4.4% Daily Wage Labour - 14.6% Private Employee - 10.6% Farmer - 19.4% Business - 13.6% Others - 37.4%
EDUCATION CASTE
Below 10th Class – 38.2% Above 10th Class – 26.2% Degree - 9.5% Post Graduate - 5.0% Professional - 3.3% Uneducated - 17.6%
General - 24.6% OBC - 30.4% SC - 18.3% ST - 12.4% Minority – 13.5% Others - 0.9%
INCOME
Below 5,000/- - 36.1% Above 5,000/- - 33.2% Above 10, 000/- - 13.9% Above 15,000/- - 5.0% Above 20,000/- - 5.5% Above 25,000/- - 2.6% Above 30,000/- - 0.9% Above 50,000/- - 1.8% Above 1 Lakh - - 0.8%

--------------------------------------------------------------------------------------------------------------------------------
9B, Samrat Complex, Opp: AG’s Office, Saifabad, HYDERABAD- 500 004.
5 | P a g e
EXECUTIVE SUMMARY
It’s clearly going the way of Bharatiya Janata Party. Going by the extensive survey
done in all the 11 Assembly constituencies in Alwar district of Rajasthan, a clear
disenchantment towards the Congress and an inclination to look for the BJP is more
than evident on almost all parameters that matter in an election. With little time left for
the ensuing polls and the gap between the BJP and Congress too wide, there seems to
be hardly any scope for the Congress to stop the saffron party in its tracks. Apart from
unhappiness over the functioning of the State Government, price rise, for which the
UPA government at the Centre is being singularly blamed, are fuelling the public mood
against the Congress and more or less decisively in favour of BJP.
Of the 11 segments in the district, the Congress has a chance only in two – Bansur and
Kishangarh Bas – while the remaining nine are expected to go the BJP way. Likewise, it
will be difficult for the Congress to retain the Parliamentary seats as well.
A variety of factors appear to be working against the Congress. Chief among them are
as follows:
a) Over 55% of the respondents said they are not benefitting from any government
scheme.
b) Price Rise has been identified as the biggest problem by the voters and is bound
to influence the mind of the voters at the time of exercising their franchise.
c) On most parameters – electricity supply, employment, roads and general
development, voters do not seem to feel that anything substantial or worthwhile
has been done in the last 5 years in Congress regime.
d) Perhaps reflecting this mood, as many as 56% of the respondents felt
development was better during the previous BJP regime.

--------------------------------------------------------------------------------------------------------------------------------
9B, Samrat Complex, Opp: AG’s Office, Saifabad, HYDERABAD- 500 004.
6 | P a g e
e) Half the respondents – 50% -- are either fully or partly dissatisfied with the
performance of the sitting MLAs & MPs with exactly same percentage of people
saying that they cannot win again.
f) A significant 58 % of the respondents felt the Ashok Gehlot government should
not be given a chance again. Not surprisingly, almost an equal number (57.6)
preferred Vasundhara Raje as the Chief Minister vis-à-vis Gehlot who secured
the nod of only 32%.
g) Reflecting a similar trend, almost 60% of those surveyed predicted victory for
BJP in the coming elections with only 33% favouring the Congress.
h) Further the respondents were of the opinion that the conventional trend of “anti-
incumbency” will be repeated this time also.
i) In view of giving another chance to Congress, it is identified that both the male
and female categories are not agreeable to have Congress again in power
Overall, it looks that Rajasthan voters will stick to the time-tested formula of
governments being changed every five years. In fact, a majority of the voters (57%) felt
it would be the same this time too. Unhappiness with both the State and Central
governments apart, the overwhelming preference for Narendra Modi for the prime
ministership (59%) as against only 18% who opted for Rahul Gandhi, could also help
the BJP swing the election in its favour.
The Secret through ballot reveals that BJP has got the 61.2 percentage followed by
Congress with 36.1, BSP 0.8 and other 1.9 percentages respectively
� Gender-wise Party preference
Gender CONGRESS BJP BSP OTHERS
Male 35.5 61.5 0.8 2.2
Female 37.0 60.7 0.9 1.3

--------------------------------------------------------------------------------------------------------------------------------
9B, Samrat Complex, Opp: AG’s Office, Saifabad, HYDERABAD- 500 004.
7 | P a g e
SECRET BALLOT PAPER COUNTING –
PARTY-WISE VOTES (%) TALLY IN ALWAR DISTRICT
S. No. Name of the Assembly Segment Congress BJP BSP Others
1 ALWAR (RURAL) 32.6 58.5 4.7 4.1
2 ALWAR (URBAN) 37.5 56.3 0.8 5.4
3 THANAGAZI 36.1 57.6 1.7 4.6
4 TIJARA 28.6 70.5 0.8 0.0
5 RAMGARH 38.9 61.1 0.0 0.0
6 RAJGARH - LAXMANGARH 33.3 66.1 0.6 0.0
7 MUNDAWAR 18.5 81.5 0.0 0.0
8 KISHANGARH BAS 62.1 35.5 0.5 2.0
9 KATHUMAR 24.7 75.3 0.0 0.0
10 BANSAR 52.7 43.2 0.0 4.1
11 BAHROD 44.9 55.1 0.0 0.0
Overall in the district 36.1 61.2 0.8 1.9

--------------------------------------------------------------------------------------------------------------------------------
9B, Samrat Complex, Opp: AG’s Office, Saifabad, HYDERABAD- 500 004.
8 | P a g e
FINDINGS
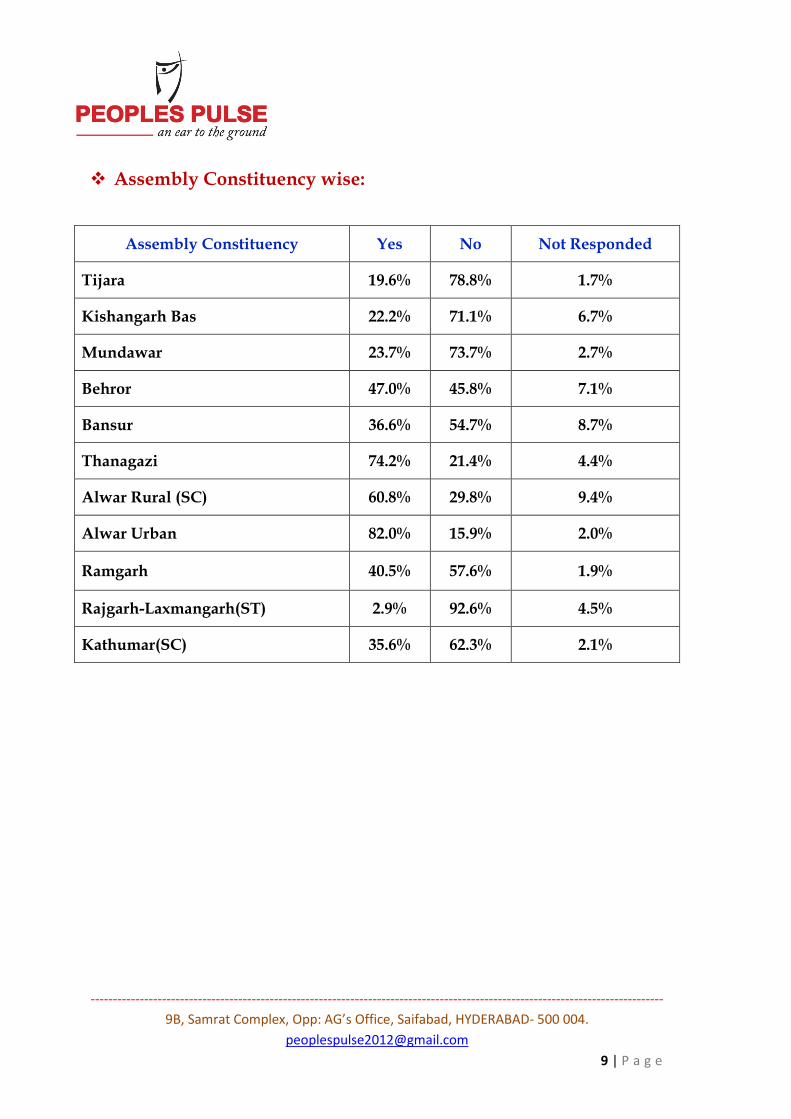
Q1. Are you or your family a beneficiary of any Government scheme?
� Yes - 40.6%
� No - 55.0%
� Not Responded - 4.4%
--------------------------------------------------------------------------------------------------------------------------------
9B, Samrat Complex, Opp: AG’s Office, Saifabad, HYDERABAD- 500 004.
9 | P a g e
� Assembly Constituency wise:
Assembly Constituency Yes No Not Responded
Tijara 19.6% 78.8% 1.7%
Kishangarh Bas 22.2% 71.1% 6.7%
Mundawar 23.7% 73.7% 2.7%
Behror 47.0% 45.8% 7.1%
Bansur 36.6% 54.7% 8.7%
Thanagazi 74.2% 21.4% 4.4%
Alwar Rural (SC) 60.8% 29.8% 9.4%
Alwar Urban 82.0% 15.9% 2.0%
Ramgarh 40.5% 57.6% 1.9%
Rajgarh-Laxmangarh(ST) 2.9% 92.6% 4.5%
Kathumar(SC) 35.6% 62.3% 2.1%

--------------------------------------------------------------------------------------------------------------------------------
9B, Samrat Complex, Opp: AG’s Office, Saifabad, HYDERABAD- 500 004.
10 | P a g e
Q2. If yes, which are the schemes you are availing?
1st Scheme:
S. No Schemes Percent
1 Housing 5.6
2 Pensions 10.4
3 Scholarships 0.6
4 Health 3.2
5 Subsidy Loans from Government 0.7
6 others 6.7
7 Not Responded 72.7
2nd Scheme:
S. No Schemes Percent
1 Housing 0.8
2 Pensions 3.4
3 Scholarships 1.3
4 Health 6.9
5 Subsidy Loans from Government 0.4
6 others 3.7
7 Not Responded 83.6
3rd Scheme:
S. No Schemes Percent
1 Housing 0.8
2 Pensions 0.3
3 Scholarships 0.3
4 Health 0.7
5 Subsidy Loans from Government 0.1
6 others 0.7
7 Not Responded 97.0

--------------------------------------------------------------------------------------------------------------------------------
9B, Samrat Complex, Opp: AG’s Office, Saifabad, HYDERABAD- 500 004.
11 | P a g e
Q3. Identify the three major problems that you and your family are facing? 1st Main Problem:
S. No Problem Percent
1 Price Rise 45.2
2 Unemployment 7.7
3 Corruption 8.9
4 Electricity Problem 5.4
5 Sanitation 0.7
6 Transport Facilities 0.0
7 Road Connectivity 3.4
8 Traffic Problem 0.0
9 Lack of School/ School is far away 0.6
10 Drinking water 9.9
11 No Proper health facility in the hospital 0.3
12 Law and Order 0.0
13 Pollution 0.2
14 Irrigation Water 0.0
15 Unavailability of welfare schemes 0.0
16 Others 5.6
17 Not Responded 12.1

--------------------------------------------------------------------------------------------------------------------------------
9B, Samrat Complex, Opp: AG’s Office, Saifabad, HYDERABAD- 500 004.
12 | P a g e
� Assembly Constituency wise: Assembly Constituency
1 2 3 4 5 6 7 9 10 11 13 16 17
Tijara 28.3% 6.7% 0.4% 1.2% 0.0% 0.0% 14.6% 0.0% 2.1% 0.4% 0.0% 10.0% 36.2%
Kishangarh Bas 18.7% 21.3% 4.4% 10.2% 0.0% 0.0% 0.4% 0.9% 14.2% 0.0% 0.0% 22.2% 7.6%
Mundawar 41.2% 11.1% 28.2% 1.9% 0.0% 0.0% 0.0% 0.8% 2.7% 0.0% 0.0% 6.1% 8.0%
Behror 57.7% 8.3% 14.9% 9.5% 0.6% 0.0% 1.8% 1.8% 2.4% 0.0% 0.0% 0.6% 2.4%
Bansur 62.7% 7.5% 8.7% 0.0% 0.0% 0.0% 0.6% 0.0% 9.9% 0.6% 0.0% 0.0% 9.9%
Thanagazi 48.4% 10.7% 17.1% 6.0% 0.0% 0.0% 0.8% 3.2% 8.7% 0.8% 0.0% 0.0% 4.4%
Alwar Rural (SC)
23.7% 6.9% 5.7% 4.9% 0.0% 0.0% 4.9% 0.0% 8.2% 0.4% 0.0% 4.5% 40.8%
Alwar Urban 79.2% 0.4% 1.2% 0.0% 6.9% 0.0% 0.0% 0.0% 8.6% 0.0% 0.0% 1.6% 2.0%
Ramgarh 19.8% 5.8% 3.5% 11.7% 0.0% 0.0% 9.3% 0.0% 40.5% 0.4% 0.0% 2.3% 6.6%
Rajgarh-Laxmangarh(ST)
75.0% 2.0% 2.9% 5.3% 0.0% 0.0% 2.5% 0.0% 7.0% 0.8% 0.0% 0.0% 4.5%
Kathumar (SC) 51.7% 5.1% 11.0% 8.1% 0.0% 0.4% 0.4% 0.0% 1.7% 0.0% 1.7% 13.1% 6.8%

--------------------------------------------------------------------------------------------------------------------------------
9B, Samrat Complex, Opp: AG’s Office, Saifabad, HYDERABAD- 500 004.
13 | P a g e
2nd Main Problem:
S. No Problem Percent
1 Price Rise 8.8
2 Unemployment 10.5
3 Corruption 7.9
4 Electricity Problem 9.1
5 Sanitation 1.3
6 Transport Facilities 0.2
7 Road Connectivity 5.1
8 Traffic Problem 0.1
9 Lack of School/ School is far away 0.6
10 Drinking water 11.6
11 No Proper health facility in the hospital 0.1
12 Law and Order 0.0
13 Pollution 0.2
14 Irrigation Water 0.1
15 Unavailability of welfare schemes 0.0
16 Others 2.4
17 Not Responded 42.0

--------------------------------------------------------------------------------------------------------------------------------
9B, Samrat Complex, Opp: AG’s Office, Saifabad, HYDERABAD- 500 004.
14 | P a g e
3rd Main Problem:
S. No Problem Percent
1 Price Rise 3.9
2 Unemployment 1.5
3 Corruption 2.1
4 Electricity Problem 5.8
5 Sanitation 2.4
6 Transport Facilities 0.1
7 Road Connectivity 2.1
8 Traffic Problem 0.2
9 Lack of School/ School is far away 0.3
10 Drinking water 5.5
11 No Proper health facility in the hospital 0.6
12 Law and Order 0.0
13 Pollution 0.1
14 Irrigation Water 0.1
15 Unavailability of welfare schemes 0.1
16 Others 1.2
17 Not Responded 74.1

--------------------------------------------------------------------------------------------------------------------------------
9B, Samrat Complex, Opp: AG’s Office, Saifabad, HYDERABAD- 500 004.
15 | P a g e
Q4. While voting, what is the most important criteria for you in deciding your
preference?
� Candidate - 36.5%
� Party - 32.2%
� Honesty - 19.9%
� Caste - 4.3%
� Money - 1.6%
� Poll Promises - 1.6%
� Not Responded - 3.9%

--------------------------------------------------------------------------------------------------------------------------------
9B, Samrat Complex, Opp: AG’s Office, Saifabad, HYDERABAD- 500 004.
16 | P a g e
� Assembly Constituency wise:
Assembly Constituency
Candidate Party Honesty Caste Money Poll
Promises Not
Responded
Tijara 36.7% 51.2% 7.5% 2.1% 0.0% 1.7% 0.8%
Kishangarh Bas
36.0% 41.3% 4.0% 4.4% 2.7% 5.3% 6.2%
Mundawar 56.5% 31.3% 8.0% 0.4% 0.0% 1.1% 2.7%
Behror 11.9% 53.0% 22.0% 7.1% 4.2% 0.6% 1.2%
Bansur 4.3% 45.3% 34.8% 1.9% 0.0% 4.3% 9.3%
Thanagazi 25.4% 40.5% 12.3% 12.7% 4.4% 0.4% 4.4% Alwar Rural (SC)
47.3% 13.5% 26.9% 1.6% 0.0% 0.0% 10.6%
Alwar Urban
41.2% 38.4% 9.8% 8.6% 0.8% 0.0% 1.2%
Ramgarh 70.0% 22.6% 5.4% 0.4% 0.0% 0.4% 1.2%
Rajgarh- Laxmangarh (ST)
43.9% 22.1% 13.1% 6.6% 5.3% 3.3% 5.7%
Kathumar (SC)
5.5% 6.8% 83.5% 2.1% 0.4% 0.4% 1.3%
� Gender-wise:
Gender Candidate Party Honesty Caste Money Poll
Promises Not
Responded
Male 36.8% 32.4% 21.9% 3.8% 1.4% 1.6% 2.0%
Female 37.8% 33.6% 18.1% 5.3% 1.9% 1.4% 2.0%
� Age-wise:
Age Candidate Party Honesty Caste Money Poll
Promises Not
Responded
First-time Voter
48.9% 22.8% 16.3% 2.2% 1.1% 0.0% 8.7%
18 to 25 yrs 43.2% 30.7% 18.0% 3.6% 0.8% 1.3% 2.3%
26 to 35 yrs 40.7% 32.3% 17.7% 5.2% 1.3% 1.5% 1.3%
36 to 45 yrs 32.1% 36.2% 21.8% 3.2% 3.0% 1.5% 2.0%
46 to 60 yrs 31.6% 35.9% 22.5% 6.7% 0.6% 1.8% 0.9%
60 & Above 22.1% 30.5% 35.1% 3.8% 3.1% 3.1% 2.3%

--------------------------------------------------------------------------------------------------------------------------------
9B, Samrat Complex, Opp: AG’s Office, Saifabad, HYDERABAD- 500 004.
17 | P a g e
� Occupation-wise:
Occupation Candidate Party Honesty Caste Money Poll
Promises Not
Responded
Govt. Employee
45.9% 20.2% 22.0% 7.3% 0.9% 0.9% 2.8%
Daily Wage Employee
39.5% 32.6% 20.2% 2.8% 0.6% 2.2% 2.2%
Pvt. Employee 39.3% 24.4% 29.4% 2.3% 1.9% 0.8% 1.9%
Farmer 31.2% 27.4% 30.1% 3.7% 2.3% 2.1% 3.1%
Business 36.8% 41.5% 14.2% 3.0% 1.8% 0.9% 1.8%
Others 38.0% 36.6% 14.8% 6.3% 1.6% 1.5% 1.2%
� Education-wise:
Education Candidate Party Honesty Caste Money Poll
Promises Not
Responded
Below 10th 33.4% 37.6% 18.0% 4.6% 2.5% 1.9% 2.0%
Above 10th 42.3% 27.1% 21.0% 4.6% 1.2% 1.2% 2.6%
Degree 43.4% 27.2% 20.0% 5.5% 0.4% 1.7% 1.7%
PG 53.7% 17.9% 19.5% 2.4% 2.4% 0.8% 3.3%
Professional 31.7% 56.1% 9.8% 2.4% 0.0% 0.0% 0.0%
Uneducated 31.4% 34.6% 26.5% 4.1% 0.9% 1.6% 0.9%
� Caste-wise:
Caste Candidate Party Honesty Caste Money Poll
Promises Not
Responded
General 39.1% 28.4% 25.1% 3.1% 1.7% 1.2% 1.5%
OBC 35.1% 35.4% 20.0% 4.8% 1.3% 1.2% 2.1%
SC 35.7% 31.0% 23.5% 4.7% 2.0% 1.8% 1.3%
ST 34.2% 30.0% 22.1% 8.5% 0.7% 1.6% 2.9%
Minority 44.6% 39.8% 6.9% 1.8% 2.4% 2.4% 2.1%
Others 38.1% 28.6% 14.3% 9.5% 4.8% 0.0% 4.8%

--------------------------------------------------------------------------------------------------------------------------------
9B, Samrat Complex, Opp: AG’s Office, Saifabad, HYDERABAD- 500 004.
18 | P a g e
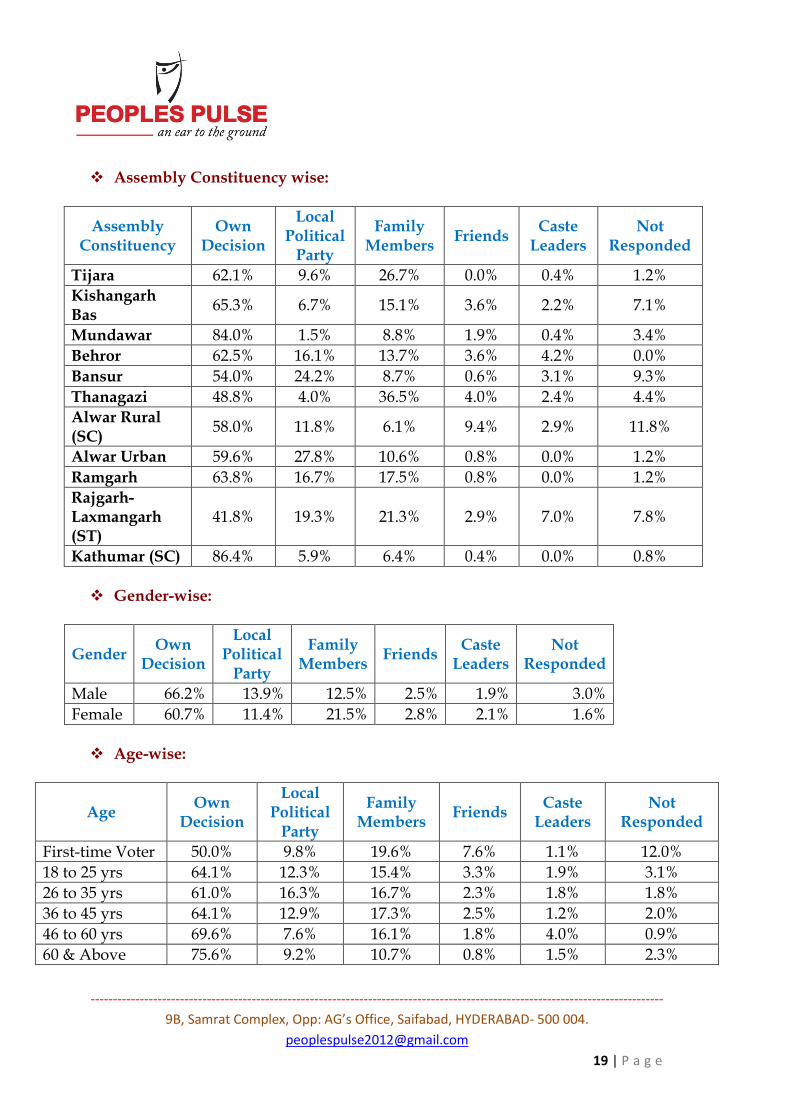
Q5. In deciding whom to vote, are you guided by anyone? If so, whose advice do
you value the most?
� Own Decision - 62.7%
� Local Political Leader - 12.6%
� Family Members - 15.9%
� Friends - 2.6%
� Caste Leaders - 1.9%
� Not Responded - 4.3%
--------------------------------------------------------------------------------------------------------------------------------
9B, Samrat Complex, Opp: AG’s Office, Saifabad, HYDERABAD- 500 004.
19 | P a g e
� Assembly Constituency wise:
Assembly Constituency
Own Decision
Local Political Party
Family Members
Friends Caste
Leaders Not
Responded
Tijara 62.1% 9.6% 26.7% 0.0% 0.4% 1.2%
Kishangarh Bas
65.3% 6.7% 15.1% 3.6% 2.2% 7.1%
Mundawar 84.0% 1.5% 8.8% 1.9% 0.4% 3.4%
Behror 62.5% 16.1% 13.7% 3.6% 4.2% 0.0%
Bansur 54.0% 24.2% 8.7% 0.6% 3.1% 9.3%
Thanagazi 48.8% 4.0% 36.5% 4.0% 2.4% 4.4%
Alwar Rural (SC)
58.0% 11.8% 6.1% 9.4% 2.9% 11.8%
Alwar Urban 59.6% 27.8% 10.6% 0.8% 0.0% 1.2%
Ramgarh 63.8% 16.7% 17.5% 0.8% 0.0% 1.2%
Rajgarh-Laxmangarh (ST)
41.8% 19.3% 21.3% 2.9% 7.0% 7.8%
Kathumar (SC) 86.4% 5.9% 6.4% 0.4% 0.0% 0.8%
� Gender-wise:
Gender Own
Decision
Local Political Party
Family Members
Friends Caste
Leaders Not
Responded
Male 66.2% 13.9% 12.5% 2.5% 1.9% 3.0%
Female 60.7% 11.4% 21.5% 2.8% 2.1% 1.6%
� Age-wise:
Age Own
Decision
Local Political Party
Family Members
Friends Caste
Leaders Not
Responded
First-time Voter 50.0% 9.8% 19.6% 7.6% 1.1% 12.0%
18 to 25 yrs 64.1% 12.3% 15.4% 3.3% 1.9% 3.1%
26 to 35 yrs 61.0% 16.3% 16.7% 2.3% 1.8% 1.8%
36 to 45 yrs 64.1% 12.9% 17.3% 2.5% 1.2% 2.0%
46 to 60 yrs 69.6% 7.6% 16.1% 1.8% 4.0% 0.9%
60 & Above 75.6% 9.2% 10.7% 0.8% 1.5% 2.3%
--------------------------------------------------------------------------------------------------------------------------------
9B, Samrat Complex, Opp: AG’s Office, Saifabad, HYDERABAD- 500 004.
20 | P a g e
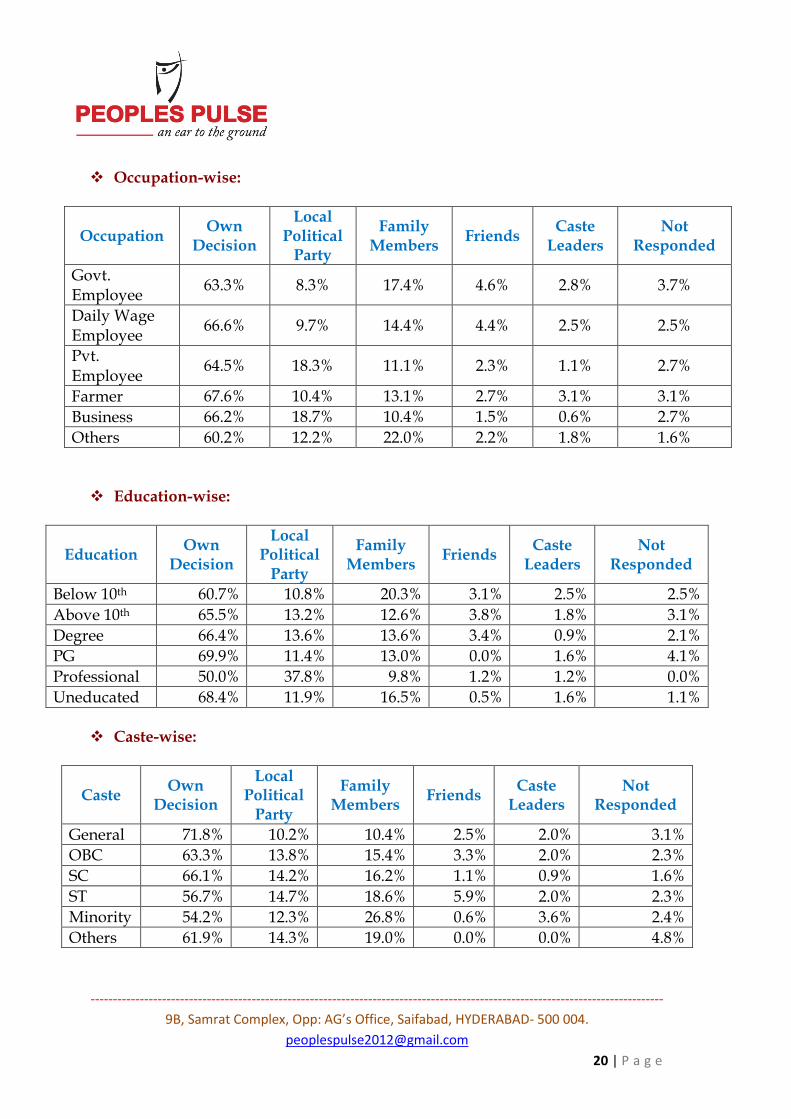
� Occupation-wise:
Occupation Own
Decision
Local Political Party
Family Members
Friends Caste
Leaders Not
Responded
Govt. Employee
63.3% 8.3% 17.4% 4.6% 2.8% 3.7%
Daily Wage Employee
66.6% 9.7% 14.4% 4.4% 2.5% 2.5%
Pvt. Employee
64.5% 18.3% 11.1% 2.3% 1.1% 2.7%
Farmer 67.6% 10.4% 13.1% 2.7% 3.1% 3.1%
Business 66.2% 18.7% 10.4% 1.5% 0.6% 2.7%
Others 60.2% 12.2% 22.0% 2.2% 1.8% 1.6%
� Education-wise:
Education Own
Decision
Local Political Party
Family Members
Friends Caste
Leaders Not
Responded
Below 10th 60.7% 10.8% 20.3% 3.1% 2.5% 2.5%
Above 10th 65.5% 13.2% 12.6% 3.8% 1.8% 3.1%
Degree 66.4% 13.6% 13.6% 3.4% 0.9% 2.1%
PG 69.9% 11.4% 13.0% 0.0% 1.6% 4.1%
Professional 50.0% 37.8% 9.8% 1.2% 1.2% 0.0%
Uneducated 68.4% 11.9% 16.5% 0.5% 1.6% 1.1%
� Caste-wise:
Caste Own
Decision
Local Political Party
Family Members
Friends Caste
Leaders Not
Responded
General 71.8% 10.2% 10.4% 2.5% 2.0% 3.1%
OBC 63.3% 13.8% 15.4% 3.3% 2.0% 2.3%
SC 66.1% 14.2% 16.2% 1.1% 0.9% 1.6%
ST 56.7% 14.7% 18.6% 5.9% 2.0% 2.3%
Minority 54.2% 12.3% 26.8% 0.6% 3.6% 2.4%
Others 61.9% 14.3% 19.0% 0.0% 0.0% 4.8%

--------------------------------------------------------------------------------------------------------------------------------
9B, Samrat Complex, Opp: AG’s Office, Saifabad, HYDERABAD- 500 004.
21 | P a g e
Q6. Now, I will ask about the work done by the Congress Government in Rajasthan during its 5-year rule. Tell me whether the following have improved, deteriorated or remained the same in the last five years?
S. No Issues Improved Remained
same Deteriorated Not
Responded
1 Supply of electricity 40.7 39.2 16.3 3.9
2 Employment 25.9 54.6 15.7 3.9
3 Education system 34.8 49.0 12.4 3.8
4 Facilities in Government
hospitals
36.1 45.7 14.3 3.9
5 Facilities in Government
schools
32.5 47.9 15.7 4.0
6 Conditions of roads 20.2 41.7 34.3 3.9
7 Supply of drinking water 28.0 39.4 28.7 3.9
8 Curbing Corruption 18.7 40.1 37.4 3.9
9 Development of Rajasthan
27.2 45.3 23.5 4.0

--------------------------------------------------------------------------------------------------------------------------------
9B, Samrat Complex, Opp: AG’s Office, Saifabad, HYDERABAD- 500 004.
22 | P a g e
Q7. Which party is better for the development of your state –Rajasthan?
� BJP - 56.6%
� Congress - 33.7%
� BJP & Congress - 1.7%
� No one - 4.9%
� Not Responded - 3.1%

--------------------------------------------------------------------------------------------------------------------------------
9B, Samrat Complex, Opp: AG’s Office, Saifabad, HYDERABAD- 500 004.
23 | P a g e
� Assembly Constituency wise:
Assembly Constituency
BJP Congress BJP &
Congress No One
Not Responded
Tijara 59.2% 31.2% 0.8% 8.3% 0.4%
Kishangarh Bas 46.7% 46.7% 3.1% 1.8% 1.8%
Mundawar 72.9% 16.8% 2.7% 5.0% 2.7%
Behror 54.8% 42.9% 0.0% 1.8% 0.6%
Bansur 40.4% 44.7% 1.2% 5.0% 8.7%
Thanagazi 53.2% 34.5% 2.8% 5.2% 4.4%
Alwar Rural (SC)
47.3% 29.8% 3.3% 11.8% 7.8%
Alwar Urban 53.5% 39.2% 0.0% 6.5% 0.8%
Ramgarh 56.8% 40.1% 0.8% 1.6% 0.8%
Rajgarh-Laxmangarh(ST)
66.8% 24.6% 0.4% 1.6% 6.6%
Kathumar(SC) 64.0% 28.8% 1.7% 4.7% 0.8%
--------------------------------------------------------------------------------------------------------------------------------
9B, Samrat Complex, Opp: AG’s Office, Saifabad, HYDERABAD- 500 004.
24 | P a g e
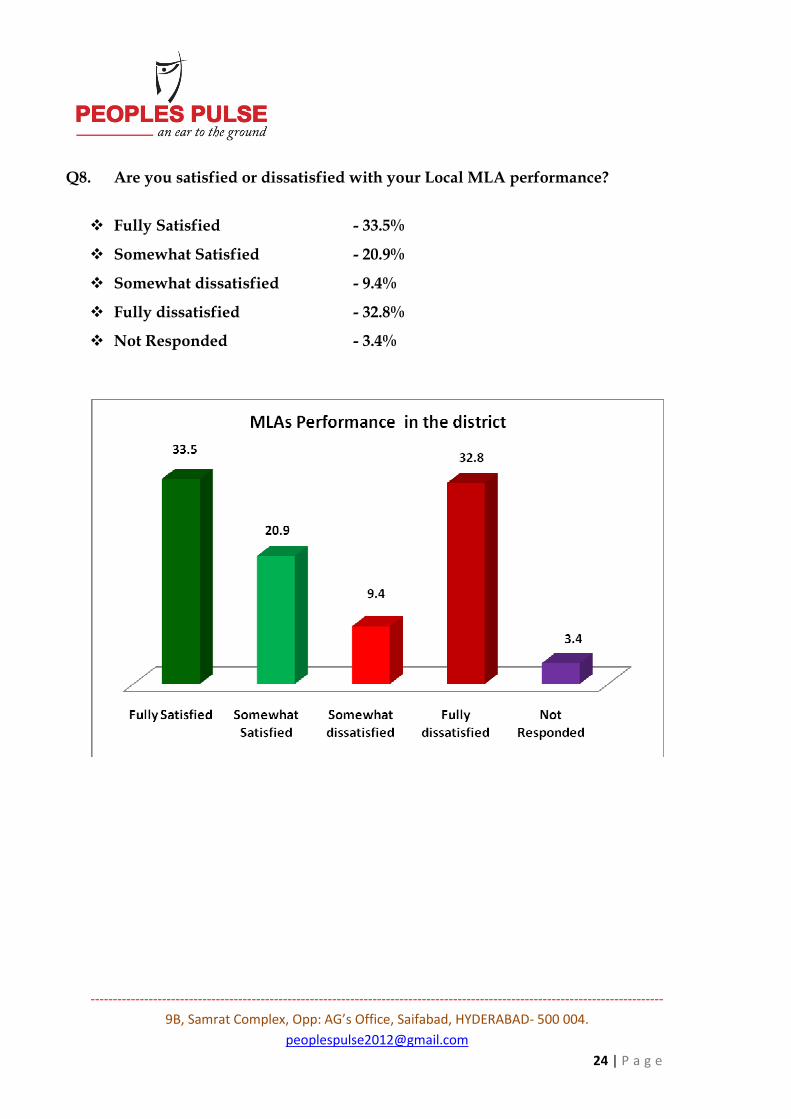
Q8. Are you satisfied or dissatisfied with your Local MLA performance?
� Fully Satisfied - 33.5%
� Somewhat Satisfied - 20.9%
� Somewhat dissatisfied - 9.4%
� Fully dissatisfied - 32.8%
� Not Responded - 3.4%

--------------------------------------------------------------------------------------------------------------------------------
9B, Samrat Complex, Opp: AG’s Office, Saifabad, HYDERABAD- 500 004.
25 | P a g e
� Assembly Constituency wise:
Assembly Constituency
Fully Satisfied
Somewhat Satisfied
Somewhat dissatisfied
Fully dissatisfied
Not Responded
Tijara 24.6% 4.6% 0.4% 70.0% 0.4%
Kishangarh Bas 12.0% 40.9% 22.7% 18.7% 5.8%
Mundawar 16.4% 25.6% 12.6% 42.7% 2.7%
Behror 38.1% 25.0% 8.9% 27.4% 0.6%
Bansur 23.0% 18.0% 22.4% 28.0% 8.7%
Thanagazi 40.5% 21.4% 5.6% 28.2% 4.4%
Alwar Rural (SC) 18.4% 32.7% 6.1% 35.1% 7.8%
Alwar Urban 45.3% 18.4% 24.9% 10.6% 0.8%
Ramgarh 34.6% 19.8% 2.3% 42.0% 1.2% Rajgarh-Laxmangarh(ST)
77.0% 7.0% 1.2% 8.6% 6.1%
Kathumar(SC) 35.2% 17.8% 1.7% 44.9% 0.4%
� Gender-wise:
Gender Fully
Satisfied Somewhat Satisfied
Somewhat dissatisfied
Fully dissatisfied
Not Responded
Male 34.80% 20.60% 9.70% 33.40% 1.50%
Female 33.30% 22.30% 9.50% 33.60% 1.40%
� Age-wise:
Age Fully
Satisfied Somewhat Satisfied
Somewhat dissatisfied
Fully dissatisfied
Not Responded
First-time Voter 27.2% 31.5% 7.6% 25.0% 8.7%
18 to 25 yrs 29.2% 27.4% 8.6% 32.4% 2.3%
26 to 35 yrs 37.7% 19.6% 11.3% 30.6% 0.9%
36 to 45 yrs 33.3% 21.0% 8.1% 36.5% 1.0%
46 to 60 yrs 38.6% 13.7% 12.8% 34.0% 0.9%
60 & Above 30.5% 21.4% 3.8% 44.3% 0.0%

--------------------------------------------------------------------------------------------------------------------------------
9B, Samrat Complex, Opp: AG’s Office, Saifabad, HYDERABAD- 500 004.
26 | P a g e
� Occupation-wise:
Occupation Fully
Satisfied Somewhat Satisfied
Somewhat dissatisfied
Fully dissatisfied
Not Responded
Govt. Employee
33.9% 18.3% 6.4% 38.5% 2.8%
Daily Wage Employee
27.9% 29.0% 9.4% 32.3% 1.4%
Pvt. Employee
34.0% 23.3% 11.1% 29.8% 1.9%
Farmer 35.8% 22.2% 8.1% 32.2% 1.7%
Business 36.5% 15.4% 12.5% 34.1% 1.5%
Others 35.1% 19.7% 9.5% 34.8% 1.0%
� Education-wise:
Education Fully
Satisfied Somewhat Satisfied
Somewhat dissatisfied
Fully dissatisfied
Not Responded
Below 10th 30.2% 21.3% 9.2% 38.1% 1.3%
Above 10th 33.7% 23.9% 10.9% 30.0% 1.5%
Degree 33.6% 24.3% 8.9% 31.1% 2.1%
PG 37.4% 20.3% 8.9% 30.1% 3.3%
Professional 50.0% 12.2% 30.5% 6.1% 1.2%
Uneducated 39.8% 18.3% 5.5% 35.7% 0.7%
� Caste-wise:
Caste Fully
Satisfied Somewhat Satisfied
Somewhat dissatisfied
Fully dissatisfied
Not Responded
General 36.6% 21.9% 10.2% 30.2% 1.0%
OBC 34.2% 21.4% 10.4% 32.2% 1.9%
SC 31.3% 22.2% 9.5% 36.1% 0.9%
ST 30.6% 21.8% 11.1% 35.5% 1.0%
Minority 36.7% 18.7% 5.7% 36.7% 2.1%
Others 52.4% 14.3% 0.0% 28.6% 4.8%

--------------------------------------------------------------------------------------------------------------------------------
9B, Samrat Complex, Opp: AG’s Office, Saifabad, HYDERABAD- 500 004.
27 | P a g e
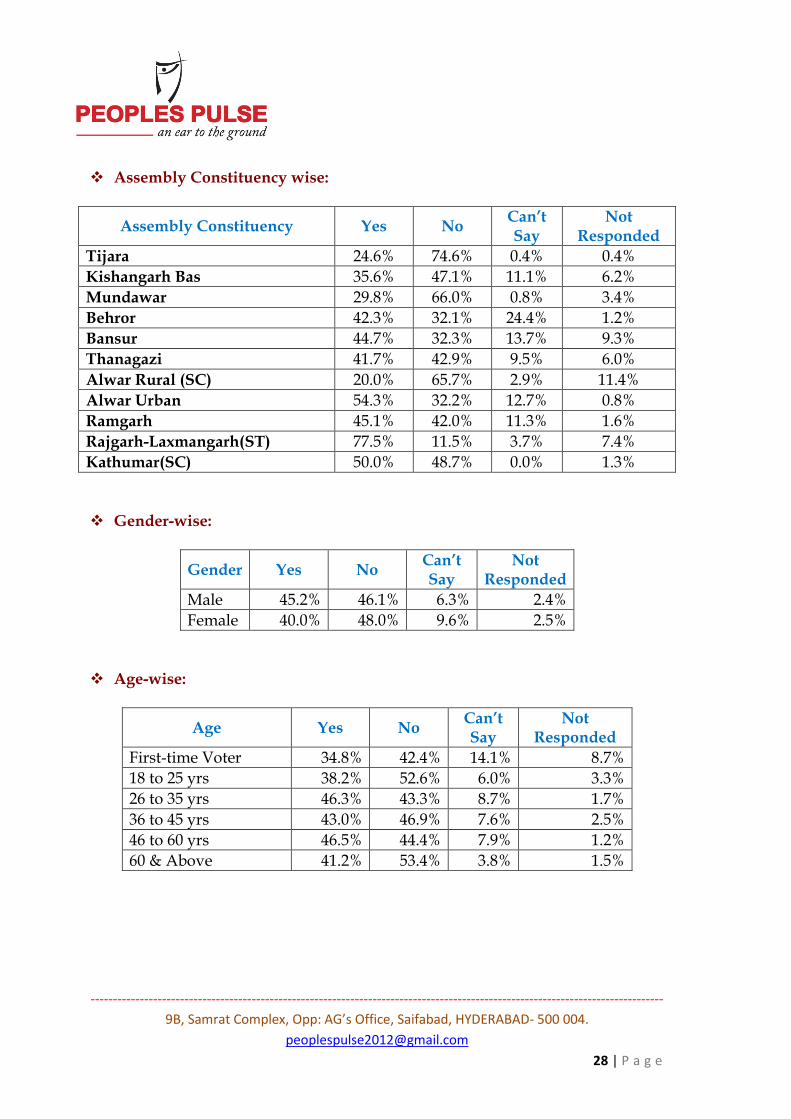
Q9. Do you think the present MLA should be given another chance?
� Yes - 42.2%
� No - 45.9%
� Can’t Say - 7.5%
� Not Responded - 4.4%
--------------------------------------------------------------------------------------------------------------------------------
9B, Samrat Complex, Opp: AG’s Office, Saifabad, HYDERABAD- 500 004.
28 | P a g e
� Assembly Constituency wise:
Assembly Constituency Yes No Can’t Say
Not Responded
Tijara 24.6% 74.6% 0.4% 0.4%
Kishangarh Bas 35.6% 47.1% 11.1% 6.2%
Mundawar 29.8% 66.0% 0.8% 3.4%
Behror 42.3% 32.1% 24.4% 1.2%
Bansur 44.7% 32.3% 13.7% 9.3%
Thanagazi 41.7% 42.9% 9.5% 6.0%
Alwar Rural (SC) 20.0% 65.7% 2.9% 11.4%
Alwar Urban 54.3% 32.2% 12.7% 0.8%
Ramgarh 45.1% 42.0% 11.3% 1.6%
Rajgarh-Laxmangarh(ST) 77.5% 11.5% 3.7% 7.4%
Kathumar(SC) 50.0% 48.7% 0.0% 1.3%
� Gender-wise:
Gender Yes No Can’t Say
Not Responded
Male 45.2% 46.1% 6.3% 2.4%
Female 40.0% 48.0% 9.6% 2.5%
� Age-wise:
Age Yes No Can’t Say
Not Responded
First-time Voter 34.8% 42.4% 14.1% 8.7%
18 to 25 yrs 38.2% 52.6% 6.0% 3.3%
26 to 35 yrs 46.3% 43.3% 8.7% 1.7%
36 to 45 yrs 43.0% 46.9% 7.6% 2.5%
46 to 60 yrs 46.5% 44.4% 7.9% 1.2%
60 & Above 41.2% 53.4% 3.8% 1.5%

--------------------------------------------------------------------------------------------------------------------------------
9B, Samrat Complex, Opp: AG’s Office, Saifabad, HYDERABAD- 500 004.
29 | P a g e
� Occupation-wise:
Occupation Yes No Can’t Say
Not Responded
Govt. Employee 38.5% 51.4% 6.4% 3.7%
Daily Wage Employee
39.0% 50.0% 8.3% 2.8%
Pvt. Employee 47.3% 45.0% 5.3% 2.3%
Farmer 47.8% 41.0% 8.7% 2.5%
Business 44.2% 48.4% 4.5% 3.0%
Others 41.3% 48.1% 8.9% 1.8%
� Education-wise:
Education Yes No Can’t Say
Not Responded
Below 10th 37.5% 50.6% 9.6% 2.3%
Above 10th 44.7% 47.2% 5.7% 2.5%
Degree 42.6% 46.0% 7.7% 3.8%
PG 45.5% 41.5% 9.8% 3.3%
Professional 58.5% 35.4% 4.9% 1.2%
Uneducated 49.7% 42.1% 6.6% 1.6%
� Caste-wise:
Caste Yes No Can’t Say
Not Responded
General 44.4% 48.3% 5.3% 2.0%
OBC 44.7% 44.1% 8.1% 3.1%
SC 39.5% 50.8% 8.2% 1.6%
ST 38.8% 50.2% 9.1% 2.0%
Minority 46.7% 42.2% 8.4% 2.7%
Others 38.1% 38.1% 14.3% 9.5%

--------------------------------------------------------------------------------------------------------------------------------
9B, Samrat Complex, Opp: AG’s Office, Saifabad, HYDERABAD- 500 004.
30 | P a g e
Q10. Are you satisfied or dissatisfied with your Local MP performance?
� Fully Satisfied - 29.1%
� Somewhat Satisfied - 18.6%
� Somewhat dissatisfied - 11.6%
� Fully dissatisfied - 37.2%
� Not Responded - 3.5%

--------------------------------------------------------------------------------------------------------------------------------
9B, Samrat Complex, Opp: AG’s Office, Saifabad, HYDERABAD- 500 004.
31 | P a g e
� Assembly Constituency wise:
Assembly Constituency
Fully Satisfied
Somewhat Satisfied
Somewhat dissatisfied
Fully dissatisfied
Not Responded
Tijara 31.7% 6.2% 1.2% 60.0% 0.8%
Kishangarh Bas 30.7% 35.6% 19.6% 8.0% 6.2%
Mundawar 43.5% 20.2% 9.2% 24.0% 3.1%
Behror 11.3% 29.2% 18.5% 40.5% 0.6%
Bansur 16.8% 18.0% 19.9% 36.6% 8.7%
Thanagazi 26.2% 23.4% 10.7% 35.3% 4.4%
Alwar Rural (SC) 32.7% 33.9% 5.3% 18.4% 9.8%
Alwar Urban 28.2% 15.5% 40.4% 15.1% 0.8%
Ramgarh 32.7% 12.5% 5.4% 48.2% 1.2%
Rajgarh-Laxmangarh(ST)
48.8% 7.8% 2.0% 36.9% 4.5%
Kathumar(SC) 5.9% 6.4% 0.4% 86.9% 0.4%
� Gender-wise:
Gender Fully
Satisfied Somewhat Satisfied
Somewhat dissatisfied
Fully dissatisfied
Not Responded
Male 30.0% 17.8% 12.1% 38.3% 1.8%
Female 29.2% 20.7% 11.3% 37.4% 1.4%
� Age-wise:
Age Fully
Satisfied Somewhat Satisfied
Somewhat dissatisfied
Fully dissatisfied
Not Responded
First-time Voter 26.1% 28.3% 7.6% 28.3% 9.8%
18 to 25 yrs 29.4% 25.0% 10.7% 32.8% 2.1%
26 to 35 yrs 29.3% 16.3% 17.2% 36.2% 1.0%
36 to 45 yrs 32.5% 16.9% 8.3% 40.8% 1.5%
46 to 60 yrs 30.1% 18.5% 10.0% 41.0% 0.3%
60 & Above 22.1% 16.8% 6.1% 53.4% 1.5%

--------------------------------------------------------------------------------------------------------------------------------
9B, Samrat Complex, Opp: AG’s Office, Saifabad, HYDERABAD- 500 004.
32 | P a g e
� Occupation-wise:
Occupation Fully
Satisfied Somewhat Satisfied
Somewhat dissatisfied
Fully dissatisfied
Not Responded
Govt. Employee 33.0% 14.7% 11.0% 38.5% 2.8%
Daily Wage Employee 29.8% 25.4% 8.6% 34.5% 1.7%
Pvt. Employee 27.1% 21.4% 14.1% 34.7% 2.7%
Farmer 30.4% 18.5% 7.9% 41.2% 2.1%
Business 29.7% 13.6% 16.3% 38.9% 1.5%
Others 29.7% 18.5% 13.0% 38.0% 0.9%
� Education-wise:
Education Fully
Satisfied Somewhat Satisfied
Somewhat dissatisfied
Fully dissatisfied
Not Responded
Below 10th 30.7% 21.6% 9.9% 36.1% 1.7%
Above 10th 30.9% 17.9% 13.8% 35.4% 2.0%
Degree 29.4% 20.0% 12.3% 37.4% 0.9%
PG 22.0% 24.4% 12.2% 39.0% 2.4%
Professional 37.8% 4.9% 43.9% 13.4% 0.0%
Uneducated 26.5% 15.8% 6.6% 49.9% 1.1%
� Caste-wise:
Caste Fully
Satisfied Somewhat Satisfied
Somewhat dissatisfied
Fully dissatisfied
Not Responded
General 25.4% 20.0% 11.9% 41.4% 1.3%
OBC 29.1% 18.6% 12.1% 38.3% 1.9%
SC 27.1% 21.7% 11.3% 38.8% 1.1%
ST 26.7% 17.9% 16.3% 38.1% 1.0%
Minority 44.9% 16.0% 5.7% 30.7% 2.7%
Others 42.9% 14.3% 23.8% 19.0% 0.0%

--------------------------------------------------------------------------------------------------------------------------------
9B, Samrat Complex, Opp: AG’s Office, Saifabad, HYDERABAD- 500 004.
33 | P a g e
Q11. Do you think the present MP should be given another chance?
� Yes - 35.1%
� No - 50.5%
� Can’t Say - 9.9%
� Not Responded - 4.5%

--------------------------------------------------------------------------------------------------------------------------------
9B, Samrat Complex, Opp: AG’s Office, Saifabad, HYDERABAD- 500 004.
34 | P a g e
� Assembly Constituency wise:
Assembly Constituency Yes No Can’t Say
Not Responded
Tijara 23.8% 72.5% 2.1% 1.7%
Kishangarh Bas 54.7% 30.2% 8.9% 6.2%
Mundawar 56.1% 38.5% 1.9% 3.4%
Behror 20.2% 47.6% 31.0% 1.2%
Bansur 31.7% 39.1% 19.9% 9.3%
Thanagazi 29.4% 54.8% 11.5% 4.4%
Alwar Rural (SC) 38.8% 46.9% 2.4% 11.8%
Alwar Urban 32.2% 43.7% 22.9% 1.2%
Ramgarh 36.6% 50.2% 11.3% 1.9%
Rajgarh-Laxmangarh(ST) 48.0% 38.5% 6.1% 7.4%
Kathumar(SC) 8.5% 89.8% 0.4% 1.3%
� Gender-wise:
Gender Yes No Can’t Say Not Responded
Male 36.1% 53.3% 8.1% 2.5%
Female 35.5% 49.2% 12.8% 2.5%
� Age-wise:
Age Yes No Can’t Say Not Responded
First-time Voter 34.8% 40.2% 16.3% 8.7%
18 to 25 yrs 36.7% 53.9% 6.1% 3.3%
26 to 35 yrs 35.3% 49.9% 12.9% 1.8%
36 to 45 yrs 37.9% 51.6% 8.3% 2.2%
46 to 60 yrs 36.5% 50.8% 11.6% 1.2%
60 & Above 26.7% 61.1% 8.4% 3.8%
� Occupation-wise:
Occupation Yes No Can’t Say Not Responded
Govt. Employee 33.9% 55.0% 6.4% 4.6%
Daily Wage Employee 39.0% 51.1% 7.2% 2.8%
Pvt. Employee 36.6% 48.5% 11.1% 3.8%
Farmer 37.6% 49.1% 10.0% 3.3%
Business 31.2% 58.8% 8.6% 1.5%
Others 35.5% 51.0% 11.9% 1.6%

--------------------------------------------------------------------------------------------------------------------------------
9B, Samrat Complex, Opp: AG’s Office, Saifabad, HYDERABAD- 500 004.
35 | P a g e
� Education-wise:
Education Yes No Can’t Say Not Responded
Below 10th 37.5% 48.1% 11.3% 3.2%
Above 10th 36.8% 52.2% 8.3% 2.8%
Degree 37.9% 49.8% 11.1% 1.3%
PG 28.5% 59.3% 9.8% 2.4%
Professional 41.5% 45.1% 13.4% 0.0%
Uneducated 31.4% 57.9% 9.2% 1.6%
� Caste-wise:
Caste Yes No Can’t Say Not Responded
General 31.7% 59.6% 6.9% 1.8%
OBC 35.6% 50.9% 10.7% 2.8%
SC 33.7% 51.4% 12.9% 2.0%
ST 32.2% 52.8% 12.7% 2.3%
Minority 50.0% 38.3% 7.8% 3.9%
Others 47.6% 38.1% 14.3% 0.0%
--------------------------------------------------------------------------------------------------------------------------------
9B, Samrat Complex, Opp: AG’s Office, Saifabad, HYDERABAD- 500 004.
36 | P a g e
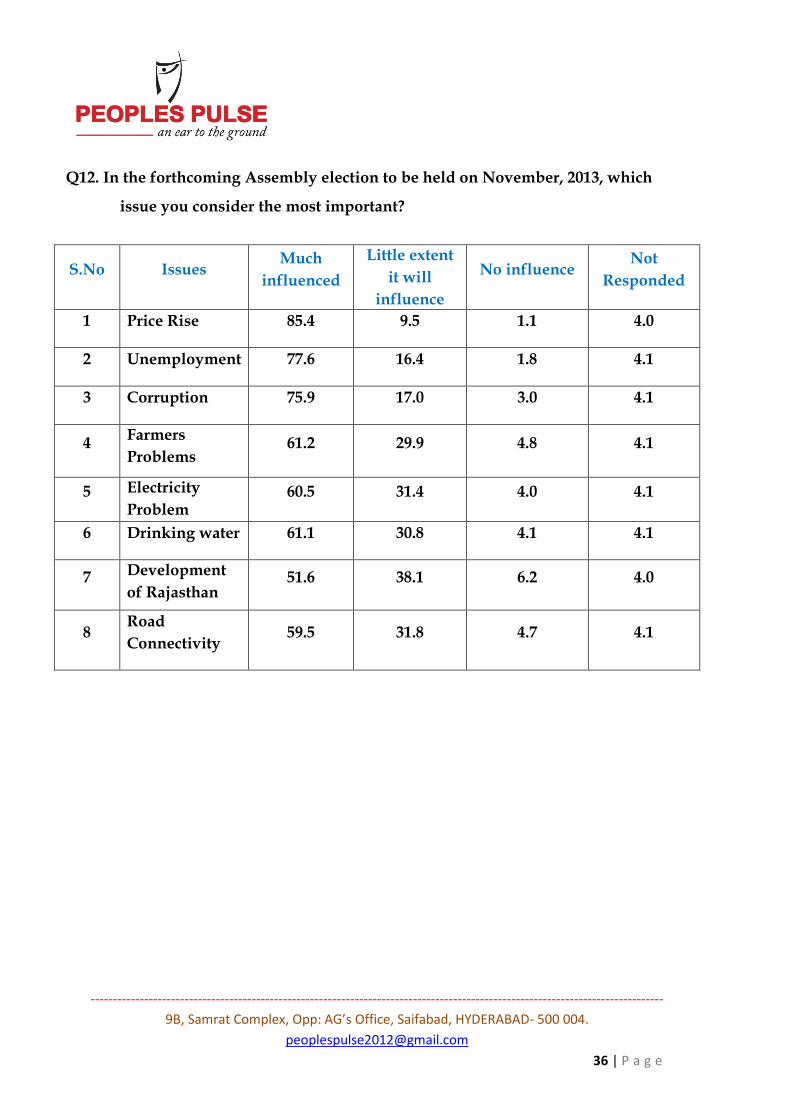
Q12. In the forthcoming Assembly election to be held on November, 2013, which
issue you consider the most important?
S.No Issues Much
influenced
Little extent
it will
influence
No influence Not
Responded
1 Price Rise 85.4 9.5 1.1 4.0
2 Unemployment 77.6 16.4 1.8 4.1
3 Corruption 75.9 17.0 3.0 4.1
4 Farmers
Problems 61.2 29.9 4.8 4.1
5 Electricity
Problem 60.5 31.4 4.0 4.1
6 Drinking water 61.1 30.8 4.1 4.1
7 Development
of Rajasthan 51.6 38.1 6.2 4.0
8 Road
Connectivity 59.5 31.8 4.7 4.1

--------------------------------------------------------------------------------------------------------------------------------
9B, Samrat Complex, Opp: AG’s Office, Saifabad, HYDERABAD- 500 004.
37 | P a g e
Q13. In the forthcoming Assembly election to be held in November 2013, which issue
you consider the most important election issue?
S. No Most important election issue Percent
1 Price Rise 52.0
2 Unemployment 14.5
3 Corruption 13.4
4 Electricity Problem 3.2
5 Sanitation 0.1
6 Transport Facilities 0.0
7 Road Connectivity 1.2
8 Traffic Problem 0.0
9 Lack of School/ School is far away 0.3
10 Drinking water 2.9
11 No Proper health facility in the hospital 0.0
12 Law and Order 0.0
13 Pollution 0.0
14 Irrigation Water 0.3
15 Unavailability of welfare schemes 0.3
16 Others 11.7
17 Not Responded 0.2

--------------------------------------------------------------------------------------------------------------------------------
9B, Samrat Complex, Opp: AG’s Office, Saifabad, HYDERABAD- 500 004.
38 | P a g e
� Assembly Constituency wise:
Assembly Constituency
1 2 3 4 5 7 9 10 11 14 15 16 17
Tijara 82.0% 8.8% 7.5% 0.4% 0.0% 0.0% 0.0% 0.0% 0.0% 0.0% 0.0% 1.3% 0.0%
Kishangarh Bas
33.3% 34.8% 12.4% 1.4% 0.0% 0.0% 0.0% 7.1% 0.0% 1.0% 0.0% 9.0% 1.0%
Mundawar 16.0% 24.6% 23.8% 7.8% 0.4% 0.8% 0.0% 3.3% 0.0% 0.0% 0.0% 23.4% 0.0%
Behror 60.6% 13.9% 17.0% 2.4% 0.0% 0.0% 0.6% 2.4% 0.0% 0.0% 0.0% 3.0% 0.0%
Bansur 78.8% 6.8% 10.3% 0.7% 0.0% 0.0% 0.7% 0.0% 0.0% 0.7% 2.1% 0.0% 0.0%
Thanagazi 45.4% 20.0% 16.7% 4.6% 0.4% 1.2% 1.7% 7.1% 0.4% 0.4% 1.2% 0.4% 0.4%
Alwar Rural (SC)
51.3% 8.0% 14.7% 1.3% 0.0% 0.7% 0.0% 0.7% 0.0% 0.0% 0.0% 23.3% 0.0%
Alwar Urban
42.0% 9.9% 12.8% 0.0% 0.0% 0.0% 0.0% 0.8% 0.0% 0.0% 0.0% 34.6% 0.0%
Ramgarh 45.8% 17.1% 13.9% 4.0% 0.0% 8.4% 0.0% 8.4% 0.0% 0.0% 0.0% 2.4% 0.0%
Rajgarh-Laxmangarh (ST)
71.8% 3.1% 16.7% 5.7% 0.0% 0.4% 0.0% 0.0% 0.0% 0.9% 0.0% 0.4% 0.9%
Kathumar (SC)
58.1% 8.7% 0.9% 4.8% 0.0% 0.0% 0.0% 0.0% 0.0% 0.0% 0.0% 27.5% 0.0%

--------------------------------------------------------------------------------------------------------------------------------
9B, Samrat Complex, Opp: AG’s Office, Saifabad, HYDERABAD- 500 004.
39 | P a g e
Q14. According to you, which party is more responsible for the price rise?
� UPA Government at the Centre - 41.3%
� Congress Government in the state - 17.5%
� Both - 34.1%
� Not Responded - 7.1%

--------------------------------------------------------------------------------------------------------------------------------
9B, Samrat Complex, Opp: AG’s Office, Saifabad, HYDERABAD- 500 004.
40 | P a g e
� Assembly Constituency wise:
Assembly Constituency
UPA Government at
the centre
Congress Government in the state
Both Not
Responded
Tijara 75.8% 14.6% 7.5% 2.1%
Kishangarh Bas 46.7% 18.7% 27.1% 7.6%
Mundawar 46.9% 26.7% 21.8% 4.6%
Behror 24.4% 23.2% 47.0% 5.4%
Bansur 21.1% 18.6% 42.2% 18.0%
Thanagazi 32.1% 9.9% 53.2% 4.8%
Alwar Rural (SC) 48.6% 7.8% 31.8% 11.8%
Alwar Urban 24.9% 6.9% 51.8% 16.3%
Ramgarh 13.2% 51.4% 32.7% 2.7% Rajgarh-Laxmangarh(ST)
33.2% 7.8% 53.7% 5.3%
Kathumar(SC) 79.2% 6.4% 11.0% 3.4%
� Gender-wise:
Gender UPA
Government at the centre
Congress Government in the state
Both Not
Responded
Male 43.3% 17.0% 34.6% 5.0%
Female 40.6% 19.1% 34.8% 5.5%
� Age-wise:
Age UPA Government
at the centre
Congress Government in the state
Both Not
Responded
First-time Voter 39.1% 20.7% 28.3% 12.0%
18 to 25 yrs 46.1% 16.1% 32.8% 5.0%
26 to 35 yrs 37.5% 17.4% 39.3% 5.8%
36 to 45 yrs 44.7% 18.4% 31.8% 5.1%
46 to 60 yrs 40.1% 18.2% 38.3% 3.3%
60 & Above 52.7% 21.4% 22.1% 3.8%

--------------------------------------------------------------------------------------------------------------------------------
9B, Samrat Complex, Opp: AG’s Office, Saifabad, HYDERABAD- 500 004.
41 | P a g e
� Occupation-wise:
Occupation UPA Government at
the centre
Congress Government in the state
Both Not
Responded
Govt. Employee 43.1% 6.4% 45.0% 5.5%
Daily Wage Employee 48.9% 21.5% 24.9% 4.7%
Pvt. Employee 35.5% 14.5% 43.9% 6.1%
Farmer 44.5% 19.5% 32.6% 3.3%
Business 36.2% 16.3% 39.2% 8.3%
Others 42.3% 18.5% 34.2% 5.0%
� Education-wise:
Education UPA Government at
the centre
Congress Government in the state
Both Not
Responded
Below 10th 43.8% 19.4% 31.7% 5.2%
Above 10th 38.0% 17.8% 37.8% 6.4%
Degree 48.9% 11.1% 36.2% 3.8%
PG 30.9% 10.6% 55.3% 3.3%
Professional 22.0% 7.3% 48.8% 22.0%
Uneducated 48.7% 22.2% 27.7% 1.4%
� Caste-wise:
Caste UPA Government at
the centre
Congress Government in the state
Both Not
Responded
General 41.9% 15.3% 38.6% 4.1%
OBC 37.2% 17.5% 38.1% 7.2%
SC 46.1% 21.1% 28.8% 4.0%
ST 40.1% 16.0% 38.4% 5.5%
Minority 52.4% 20.5% 22.9% 4.2%
Others 19.0% 23.8% 52.4% 4.8%

--------------------------------------------------------------------------------------------------------------------------------
9B, Samrat Complex, Opp: AG’s Office, Saifabad, HYDERABAD- 500 004.
42 | P a g e
Q15. What is your assessment of the work done by Chief Minister, Ashok Ghelot in
Rajasthan during his 5 years rule? Would you say that you are satisfied or
dissatisfied with his performance?
� Fully Satisfied - 25.7%
� Somewhat satisfied - 19.5%
� Somewhat Dissatisfied - 11.6%
� Fully Dissatisfied - 39.6%
� Not Responded - 3.6%

--------------------------------------------------------------------------------------------------------------------------------
9B, Samrat Complex, Opp: AG’s Office, Saifabad, HYDERABAD- 500 004.
43 | P a g e
� Assembly Constituency wise:
Assembly Constituency
Fully Satisfied
Somewhat Satisfied
Somewhat dissatisfied
Fully dissatisfied
Not Responded
Tijara 39.2% 3.3% 1.2% 55.4% 0.8%
Kishangarh Bas 13.8% 43.6% 27.6% 8.9% 6.2%
Mundawar 21.0% 20.6% 10.7% 44.3% 3.4%
Behror 24.4% 40.5% 12.5% 22.0% 0.6%
Bansur 23.6% 19.9% 26.7% 20.5% 9.3%
Thanagazi 28.2% 14.3% 7.9% 44.8% 4.8%
Alwar Rural (SC) 29.0% 20.4% 7.3% 33.9% 9.4%
Alwar Urban 24.9% 23.3% 33.9% 16.7% 1.2%
Ramgarh 25.3% 23.0% 4.3% 46.7% 0.8% Rajgarh-Laxmangarh(ST)
30.7% 0.8% 0.0% 63.5% 4.9%
Kathumar(SC) 21.2% 12.3% 1.7% 64.4% 0.4%

--------------------------------------------------------------------------------------------------------------------------------
9B, Samrat Complex, Opp: AG’s Office, Saifabad, HYDERABAD- 500 004.
44 | P a g e
Q16. Do you think the present Congress government led by Ashok Ghelot should be
given another chance?
� Yes - 33.5%
� No - 57.7%
� May be - 4.4%
� Not Responded - 4.4%

--------------------------------------------------------------------------------------------------------------------------------
9B, Samrat Complex, Opp: AG’s Office, Saifabad, HYDERABAD- 500 004.
45 | P a g e
� Assembly Constituency wise:
Assembly Constituency
Yes No May be Not
Responded
Tijara 29.6% 67.5% 1.7% 1.2%
Kishangarh Bas 41.3% 48.4% 4.0% 6.2%
Mundawar 24.8% 68.7% 2.3% 4.2%
Behror 40.5% 48.8% 8.9% 1.8%
Bansur 53.4% 33.5% 4.3% 8.7%
Thanagazi 35.3% 55.6% 4.4% 4.8%
Alwar Rural (SC) 29.8% 53.9% 2.4% 13.9%
Alwar Urban 33.5% 55.5% 9.4% 1.6%
Ramgarh 30.7% 56.8% 11.3% 1.2% Rajgarh-Laxmangarh(ST)
27.5% 66.8% 0.8% 4.9%
Kathumar(SC) 31.8% 67.4% 0.0% 0.8%
� Gender-wise:
Gender Yes No May be Not
Responded
Male 34.0% 58.9% 4.6% 2.5%
Female 34.3% 59.0% 4.3% 2.4%
� Age-wise:
Age Yes No May be Not Responded
First-time Voter 41.3% 43.5% 4.3% 10.9%
18 to 25 yrs 36.3% 56.6% 4.8% 2.3%
26 to 35 yrs 32.8% 60.1% 5.3% 1.8%
36 to 45 yrs 31.3% 61.6% 3.9% 3.2%
46 to 60 yrs 39.5% 57.4% 2.7% 0.3%
60 & Above 29.0% 61.8% 6.1% 3.1%
--------------------------------------------------------------------------------------------------------------------------------
9B, Samrat Complex, Opp: AG’s Office, Saifabad, HYDERABAD- 500 004.
46 | P a g e
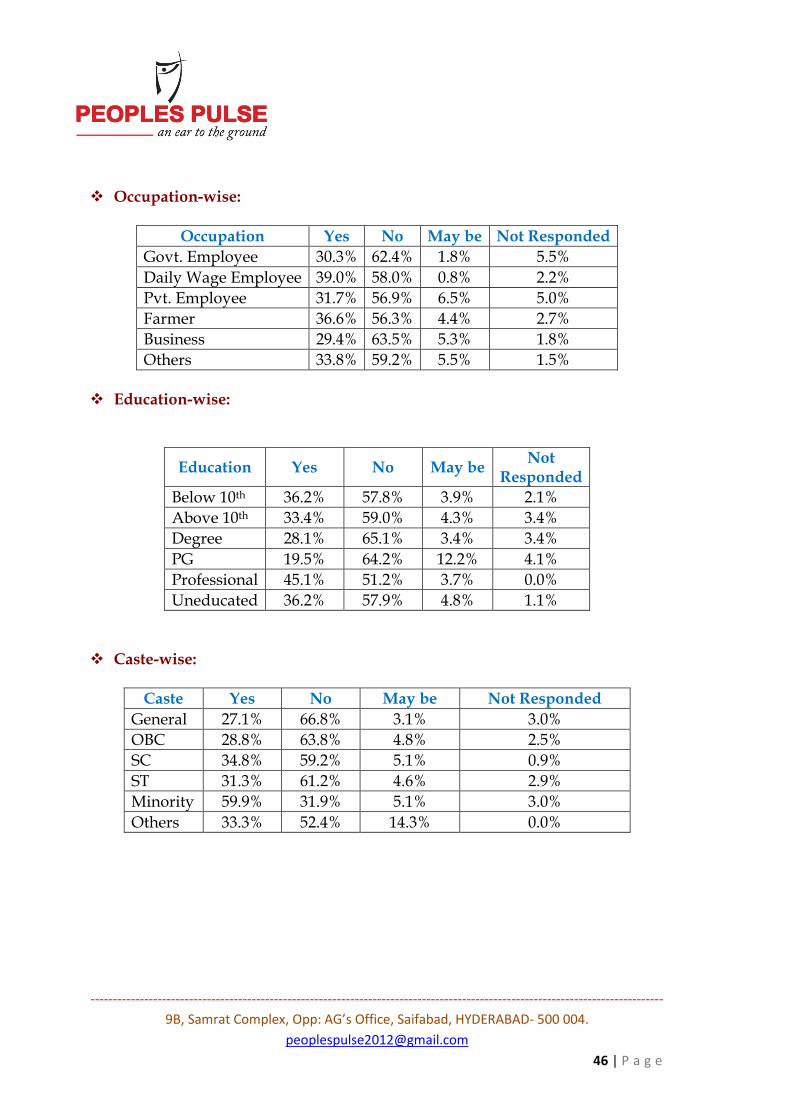
� Occupation-wise:
Occupation Yes No May be Not Responded
Govt. Employee 30.3% 62.4% 1.8% 5.5%
Daily Wage Employee 39.0% 58.0% 0.8% 2.2%
Pvt. Employee 31.7% 56.9% 6.5% 5.0%
Farmer 36.6% 56.3% 4.4% 2.7%
Business 29.4% 63.5% 5.3% 1.8%
Others 33.8% 59.2% 5.5% 1.5%
� Education-wise:
Education Yes No May be Not
Responded
Below 10th 36.2% 57.8% 3.9% 2.1%
Above 10th 33.4% 59.0% 4.3% 3.4%
Degree 28.1% 65.1% 3.4% 3.4%
PG 19.5% 64.2% 12.2% 4.1%
Professional 45.1% 51.2% 3.7% 0.0%
Uneducated 36.2% 57.9% 4.8% 1.1%
� Caste-wise:
Caste Yes No May be Not Responded
General 27.1% 66.8% 3.1% 3.0%
OBC 28.8% 63.8% 4.8% 2.5%
SC 34.8% 59.2% 5.1% 0.9%
ST 31.3% 61.2% 4.6% 2.9%
Minority 59.9% 31.9% 5.1% 3.0%
Others 33.3% 52.4% 14.3% 0.0%

--------------------------------------------------------------------------------------------------------------------------------
9B, Samrat Complex, Opp: AG’s Office, Saifabad, HYDERABAD- 500 004.
47 | P a g e
Q17. On a comparative scale, whom do you find better -- the last BJP government
led by Smt.Vasudhara Raj Scindiya and the present Congress government led by
Ashok Ghelot?
� Smt.Vasudhara Raj Scindiya - 57.6%
� Ashok Ghelot - 32.3%
� Both equally good - 2.7%
� Both equally Bad - 3.6%
� Not Responded - 3.8%

--------------------------------------------------------------------------------------------------------------------------------
9B, Samrat Complex, Opp: AG’s Office, Saifabad, HYDERABAD- 500 004.
48 | P a g e
� Assembly Constituency wise:
Assembly Constituency
Smt. Vasudhara Raj Scindiya
Ashok Ghelot
Both equally good
Both equally Bad
Not Responded
Tijara 70.8% 20.8% 0.8% 7.1% 0.4%
Kishangarh Bas 42.2% 34.7% 15.1% 1.8% 6.2%
Mundawar 72.9% 21.4% 0.4% 0.8% 4.6%
Behror 51.8% 38.1% 3.0% 6.5% 0.6%
Bansur 35.4% 50.3% 0.0% 5.0% 9.3%
Thanagazi 53.6% 35.3% 2.8% 3.6% 4.8%
Alwar Rural (SC) 47.3% 28.6% 2.0% 11.8% 10.2%
Alwar Urban 53.9% 38.0% 4.5% 2.4% 1.2%
Ramgarh 60.3% 37.7% 0.4% 0.8% 0.8% Rajgarh-Laxmangarh(ST)
65.6% 28.7% 0.4% 0.4% 4.9%
Kathumar(SC) 68.6% 29.7% 0.4% 0.8% 0.4%

--------------------------------------------------------------------------------------------------------------------------------
9B, Samrat Complex, Opp: AG’s Office, Saifabad, HYDERABAD- 500 004.
49 | P a g e
Q18. In your opinion, which Party is likely to win from your assembly segment in
the coming assembly elections to be held in November 2013:
� BJP - 58.2%
� Congress - 31.8%
� BSP - 0.5%
� Others - 5.8%
� Not Responded - 3.7%

--------------------------------------------------------------------------------------------------------------------------------
9B, Samrat Complex, Opp: AG’s Office, Saifabad, HYDERABAD- 500 004.
50 | P a g e
� Assembly Constituency wise:
Assembly Constituency
BJP Congress BSP Others Not
Responded
Tijara 62.9% 33.8% 0.8% 1.7% 0.8%
Kishangarh Bas 51.1% 42.2% 0.0% 0.4% 6.2%
Mundawar 74.0% 19.1% 0.8% 2.3% 3.8%
Behror 58.3% 39.3% 0.0% 0.0% 2.4%
Bansur 40.4% 49.1% 0.0% 1.9% 8.7%
Thanagazi 61.5% 27.4% 0.8% 5.6% 4.8%
Alwar Rural (SC) 50.6% 31.4% 1.6% 7.3% 9.0%
Alwar Urban 55.1% 37.1% 0.4% 6.1% 1.2%
Ramgarh 60.7% 38.1% 0.0% 0.0% 1.2%
Rajgarh-Laxmangarh(ST)
42.6% 19.3% 0.4% 33.6% 4.1%
Kathumar(SC) 75.4% 22.9% 0.0% 1.3% 0.4%
� Gender-wise:
Gender BJP Congress BSP Others Not
Responded
Male 59.9% 32.1% 0.6% 5.7% 1.6%
Female 58.7% 32.9% 0.3% 6.1% 2.0%
� Age-wise:
Age BJP Congress BSP Others Not Responded
First-time Voter 48.9% 39.1% 0.0% 4.3% 7.6%
18 to 25 yrs 58.7% 34.5% 0.2% 4.2% 2.3%
26 to 35 yrs 60.1% 31.2% 0.6% 6.6% 1.5%
36 to 45 yrs 60.4% 31.3% 0.3% 6.4% 1.5%
46 to 60 yrs 58.4% 34.3% 0.9% 6.4% 0.0%
60 & Above 62.6% 28.2% 0.8% 5.3% 3.1%

--------------------------------------------------------------------------------------------------------------------------------
9B, Samrat Complex, Opp: AG’s Office, Saifabad, HYDERABAD- 500 004.
51 | P a g e
� Occupation-wise:
Occupation BJP Congress BSP Others Not Responded
Govt. Employee 59.6% 30.3% 0.9% 6.4% 2.8%
Daily Wage Employee
59.7% 33.7% 0.0% 4.1% 2.5%
Pvt. Employee 60.3% 30.9% 1.1% 5.0% 2.7%
Farmer 57.4% 33.9% 0.6% 6.4% 1.7%
Business 65.0% 27.0% 0.9% 5.3% 1.8%
Others 58.0% 34.0% 0.2% 6.7% 1.1%
� Education-wise:
Education BJP Congress BSP Others Not
Responded
Below 10th 57.9% 35.1% 0.7% 4.6% 1.7%
Above 10th 59.1% 31.7% 0.5% 6.6% 2.1%
Degree 66.0% 21.7% 0.9% 10.2% 1.3%
PG 61.8% 26.0% 0.0% 9.8% 2.4%
Professional 48.8% 43.9% 0.0% 6.1% 1.2%
Uneducated 60.9% 33.6% 0.0% 4.1% 1.4%
� Caste-wise:
Caste BJP Congress BSP Others Not
Responded
General 68.3% 25.2% 0.2% 5.1% 1.2%
OBC 66.0% 26.0% 0.3% 5.7% 2.0%
SC 61.4% 32.8% 0.4% 3.8% 1.6%
ST 54.1% 29.3% 1.3% 14.0% 1.3%
Minority 31.3% 61.1% 0.9% 3.6% 3.0%
Others 47.6% 52.4% 0.0% 0.0% 0.0%

--------------------------------------------------------------------------------------------------------------------------------
9B, Samrat Complex, Opp: AG’s Office, Saifabad, HYDERABAD- 500 004.
52 | P a g e
Q19. In your opinion, which political party will form the next government with
absolute majority after the elections in Rajasthan?
� BJP - 59.9%
� Congress - 33.2%
� Others - 2.2%
� Not Responded - 4.7%

--------------------------------------------------------------------------------------------------------------------------------
9B, Samrat Complex, Opp: AG’s Office, Saifabad, HYDERABAD- 500 004.
53 | P a g e
� Assembly Constituency wise:
Assembly Constituency
BJP Congress Others Not
Responded
Tijara 68.8% 29.2% 0.8% 1.2%
Kishangarh Bas 50.7% 40.9% 0.4% 8.0%
Mundawar 76.3% 17.9% 1.9% 3.8%
Behror 57.1% 40.5% 0.0% 2.4%
Bansur 39.8% 50.3% 1.2% 8.7%
Thanagazi 54.0% 38.9% 2.4% 4.8%
Alwar Rural (SC) 49.4% 31.4% 5.7% 13.5%
Alwar Urban 55.5% 37.1% 4.9% 2.4%
Ramgarh 59.5% 38.5% 0.4% 1.6%
Rajgarh-Laxmangarh(ST)
65.6% 26.6% 2.5% 5.3%
Kathumar(SC) 73.3% 22.9% 3.0% 0.8%
--------------------------------------------------------------------------------------------------------------------------------
9B, Samrat Complex, Opp: AG’s Office, Saifabad, HYDERABAD- 500 004.
54 | P a g e
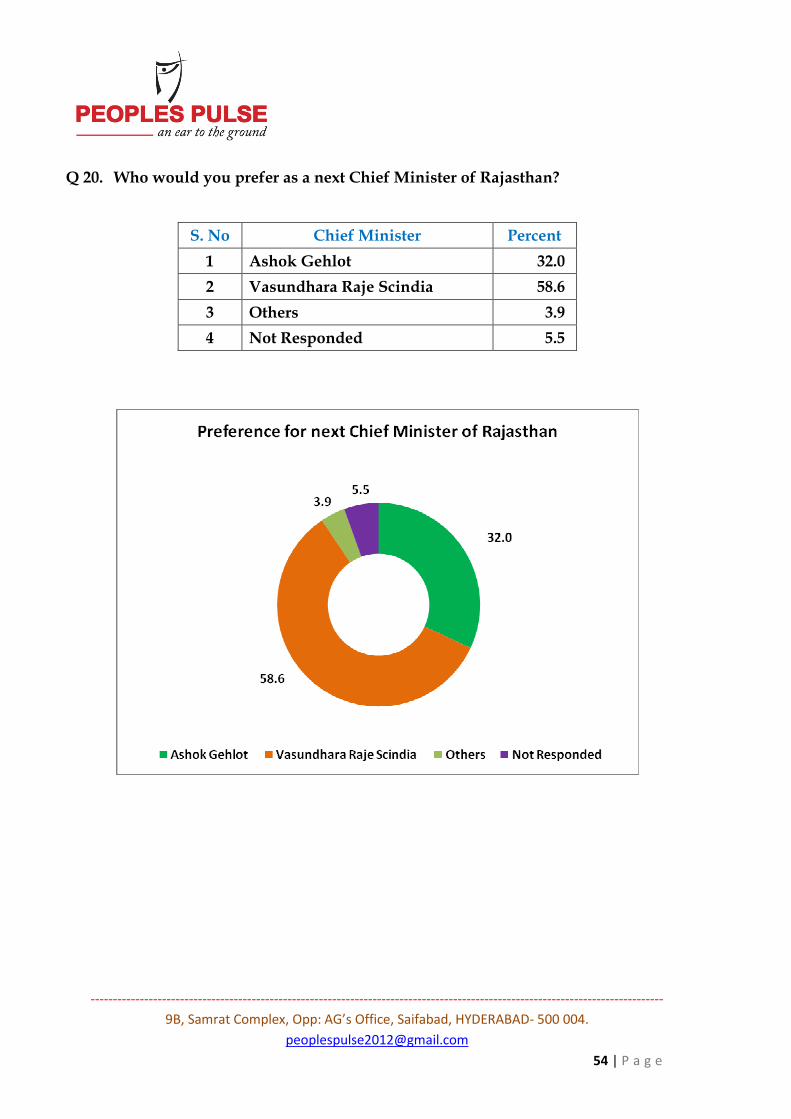
Q 20. Who would you prefer as a next Chief Minister of Rajasthan?
S. No Chief Minister Percent
1 Ashok Gehlot 32.0
2 Vasundhara Raje Scindia 58.6
3 Others 3.9
4 Not Responded 5.5

--------------------------------------------------------------------------------------------------------------------------------
9B, Samrat Complex, Opp: AG’s Office, Saifabad, HYDERABAD- 500 004.
55 | P a g e
� Assembly Constituency wise:
Assembly Constituency
Ashok Gehlot
Vasundhara Raje Scindia
Others Not
Responded
Tijara 29.6% 68.8% 0.0% 1.7%
Kishangarh Bas 43.6% 49.3% 0.0% 7.1%
Mundawar 19.8% 76.3% 0.0% 3.8%
Behror 45.2% 48.8% 1.8% 4.2%
Bansur 51.6% 38.5% 1.2% 8.7%
Thanagazi 29.8% 50.4% 14.3% 5.6%
Alwar Rural (SC) 22.0% 50.6% 6.9% 20.4%
Alwar Urban 35.5% 56.3% 6.5% 1.6%
Ramgarh 39.3% 59.1% 0.0% 1.6%
Rajgarh-Laxmangarh(ST) 19.3% 66.4% 9.8% 4.5%
Kathumar(SC) 28.4% 68.6% 0.0% 3.0%
� Gender-wise:
Gender Ashok Gehlot
Vasundhara Raje Scindia
Others Not
Responded
Male 33.1% 59.7% 4.5% 2.7%
Female 31.9% 59.8% 3.2% 5.1%
� Age-wise:
Age Ashok Gehlot
Vasundhara Raje Scindia
Others Not
Responded
First-time Voter 37.0% 48.9% 3.3% 10.9%
18 to 25 yrs 35.7% 56.2% 3.6% 4.4%
26 to 35 yrs 30.9% 61.7% 4.7% 2.7%
36 to 45 yrs 30.3% 62.4% 3.4% 3.9%
46 to 60 yrs 35.9% 57.8% 4.6% 1.8%
60 & Above 29.0% 62.6% 2.3% 6.1%

--------------------------------------------------------------------------------------------------------------------------------
9B, Samrat Complex, Opp: AG’s Office, Saifabad, HYDERABAD- 500 004.
56 | P a g e
� Occupation-wise:
Occupation Ashok Gehlot
Vasundhara Raje Scindia
Others Not
Responded
Govt. Employee 25.7% 60.6% 6.4% 7.3%
Daily Wage Employee 36.2% 58.8% 1.9% 3.0%
Pvt. Employee 31.7% 60.3% 5.7% 2.3%
Farmer 33.5% 58.8% 1.9% 5.8%
Business 27.3% 66.8% 3.9% 2.1%
Others 33.7% 57.9% 5.1% 3.3%
� Education-wise:
Education Ashok Gehlot
Vasundhara Raje Scindia
Others Not
Responded
Below 10th 33.6% 58.9% 2.8% 4.6%
Above 10th 31.5% 60.8% 4.6% 3.1%
Degree 26.4% 62.6% 8.5% 2.6%
PG 26.8% 67.5% 4.1% 1.6%
Professional 40.2% 51.2% 3.7% 4.9%
Uneducated 35.7% 57.9% 3.0% 3.4%
� Caste-wise:
Caste Ashok Gehlot
Vasundhara Raje Scindia
Others Not
Responded
General 23.8% 71.3% 1.8% 3.1%
OBC 27.5% 66.1% 3.1% 3.3%
SC 34.4% 59.2% 2.7% 3.8%
ST 30.0% 55.0% 9.4% 5.5%
Minority 59.9% 30.1% 6.0% 3.9%
Others 28.6% 57.1% 14.3% 0.0%

--------------------------------------------------------------------------------------------------------------------------------
9B, Samrat Complex, Opp: AG’s Office, Saifabad, HYDERABAD- 500 004.
57 | P a g e
Q21. In the political History of Rajasthan there has been a trend of changing the
Government every five years? In your opinion, will the same trend continue in this
election or will it be different?
� Same trend continues - 57.6%
� Change in the trend - 24.5%
� Can’t Say - 10.2%
� Not Responded - 7.7%

--------------------------------------------------------------------------------------------------------------------------------
9B, Samrat Complex, Opp: AG’s Office, Saifabad, HYDERABAD- 500 004.
58 | P a g e
� Assembly Constituency wise:
Assembly Constituency Same trend
continues
Change in the trend
Can’t Say
Not Responded
Tijara 70.0% 27.5% 0.4% 2.1%
Kishangarh Bas 47.1% 40.4% 0.0% 12.4%
Mundawar 79.8% 15.3% 1.1% 3.8%
Behror 43.5% 19.6% 24.4% 12.5%
Bansur 45.3% 15.5% 26.1% 13.0%
Thanagazi 52.8% 34.1% 7.1% 6.0%
Alwar Rural (SC) 49.4% 16.3% 13.1% 21.2%
Alwar Urban 59.2% 36.3% 2.0% 2.4%
Ramgarh 41.2% 27.6% 26.5% 4.7%
Rajgarh-Laxmangarh(ST) 56.1% 17.6% 17.2% 9.0%
Kathumar(SC) 80.1% 15.7% 2.5% 1.7%

--------------------------------------------------------------------------------------------------------------------------------
9B, Samrat Complex, Opp: AG’s Office, Saifabad, HYDERABAD- 500 004.
59 | P a g e
Q22. Who would you prefer as a next Prime Minister of India?
S. No Prime Minister Percent
1 Narendra Modi 59.0
2 Rahul Gandhi 18.4
3 Sonia Gandhi 1.3
4 Manmohan Singh 10.6
5 L.K.Advani 2.3
6 Sushma Swaraj 0.3
7 Arun Jaitley 0.2
8 Mulayam Singh Yadav 0.5
9 Mayawati 0.3
10 Nitish Kumar 0.1
11 Mamatha Benerji 0.0
12 Jaya Lalitha 0.0
13 Others 1.9
14 Not Responded 5.1
--------------------------------------------------------------------------------------------------------------------------------
9B, Samrat Complex, Opp: AG’s Office, Saifabad, HYDERABAD- 500 004.
60 | P a g e
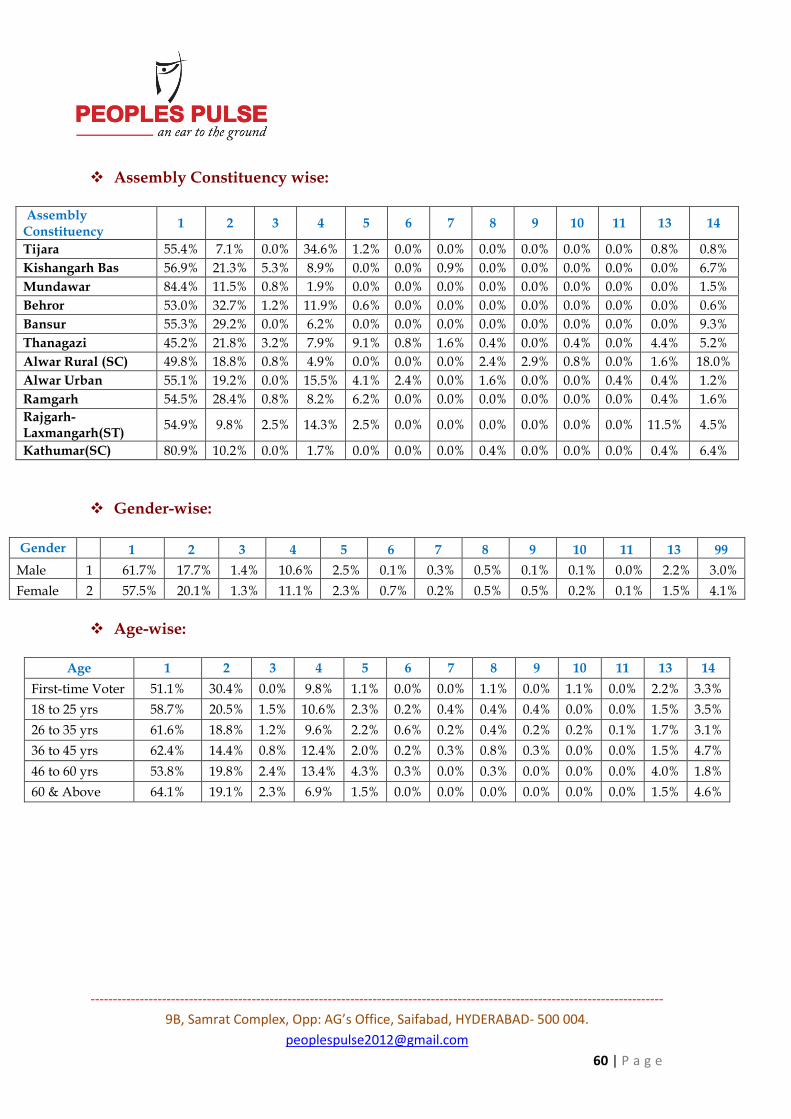
� Assembly Constituency wise:
Assembly Constituency
1 2 3 4 5 6 7 8 9 10 11 13 14
Tijara 55.4% 7.1% 0.0% 34.6% 1.2% 0.0% 0.0% 0.0% 0.0% 0.0% 0.0% 0.8% 0.8%
Kishangarh Bas 56.9% 21.3% 5.3% 8.9% 0.0% 0.0% 0.9% 0.0% 0.0% 0.0% 0.0% 0.0% 6.7%
Mundawar 84.4% 11.5% 0.8% 1.9% 0.0% 0.0% 0.0% 0.0% 0.0% 0.0% 0.0% 0.0% 1.5%
Behror 53.0% 32.7% 1.2% 11.9% 0.6% 0.0% 0.0% 0.0% 0.0% 0.0% 0.0% 0.0% 0.6%
Bansur 55.3% 29.2% 0.0% 6.2% 0.0% 0.0% 0.0% 0.0% 0.0% 0.0% 0.0% 0.0% 9.3%
Thanagazi 45.2% 21.8% 3.2% 7.9% 9.1% 0.8% 1.6% 0.4% 0.0% 0.4% 0.0% 4.4% 5.2%
Alwar Rural (SC) 49.8% 18.8% 0.8% 4.9% 0.0% 0.0% 0.0% 2.4% 2.9% 0.8% 0.0% 1.6% 18.0%
Alwar Urban 55.1% 19.2% 0.0% 15.5% 4.1% 2.4% 0.0% 1.6% 0.0% 0.0% 0.4% 0.4% 1.2%
Ramgarh 54.5% 28.4% 0.8% 8.2% 6.2% 0.0% 0.0% 0.0% 0.0% 0.0% 0.0% 0.4% 1.6%
Rajgarh-Laxmangarh(ST)
54.9% 9.8% 2.5% 14.3% 2.5% 0.0% 0.0% 0.0% 0.0% 0.0% 0.0% 11.5% 4.5%
Kathumar(SC) 80.9% 10.2% 0.0% 1.7% 0.0% 0.0% 0.0% 0.4% 0.0% 0.0% 0.0% 0.4% 6.4%
� Gender-wise:
Gender 1 2 3 4 5 6 7 8 9 10 11 13 99
Male 1 61.7% 17.7% 1.4% 10.6% 2.5% 0.1% 0.3% 0.5% 0.1% 0.1% 0.0% 2.2% 3.0%
Female 2 57.5% 20.1% 1.3% 11.1% 2.3% 0.7% 0.2% 0.5% 0.5% 0.2% 0.1% 1.5% 4.1%
� Age-wise:
Age 1 2 3 4 5 6 7 8 9 10 11 13 14
First-time Voter 51.1% 30.4% 0.0% 9.8% 1.1% 0.0% 0.0% 1.1% 0.0% 1.1% 0.0% 2.2% 3.3%
18 to 25 yrs 58.7% 20.5% 1.5% 10.6% 2.3% 0.2% 0.4% 0.4% 0.4% 0.0% 0.0% 1.5% 3.5%
26 to 35 yrs 61.6% 18.8% 1.2% 9.6% 2.2% 0.6% 0.2% 0.4% 0.2% 0.2% 0.1% 1.7% 3.1%
36 to 45 yrs 62.4% 14.4% 0.8% 12.4% 2.0% 0.2% 0.3% 0.8% 0.3% 0.0% 0.0% 1.5% 4.7%
46 to 60 yrs 53.8% 19.8% 2.4% 13.4% 4.3% 0.3% 0.0% 0.3% 0.0% 0.0% 0.0% 4.0% 1.8%
60 & Above 64.1% 19.1% 2.3% 6.9% 1.5% 0.0% 0.0% 0.0% 0.0% 0.0% 0.0% 1.5% 4.6%

--------------------------------------------------------------------------------------------------------------------------------
9B, Samrat Complex, Opp: AG’s Office, Saifabad, HYDERABAD- 500 004.
61 | P a g e
� Occupation-wise:
Occupation 1 2 3 4 5 6 7 8 9 10 11 13 14
Govt. Employee
60.6% 14.7% 1.8% 8.3% 2.8% 0.0% 0.0% 0.0% 1.8% 1.8% 0.0% 3.7% 4.6%
Daily Wage Employee
63.3% 18.8% 1.1% 10.5% 1.4% 0.0% 0.6% 0.6% 0.0% 0.3% 0.0% 0.6% 3.0%
Pvt. Employee
61.1% 19.1% 0.4% 8.8% 2.7% 0.4% 0.0% 1.5% 1.1% 0.0% 0.0% 2.7% 2.3%
Farmer 58.4% 19.3% 1.2% 8.9% 2.1% 0.0% 0.0% 0.0% 0.2% 0.0% 0.0% 2.7% 7.1%
Business 66.2% 17.8% 0.9% 7.4% 2.7% 0.3% 0.6% 0.6% 0.0% 0.0% 0.0% 1.5% 2.1%
Others 56.7% 19.1% 1.9% 13.9% 2.7% 0.6% 0.2% 0.3% 0.0% 0.0% 0.1% 1.8% 2.5%
� Education-wise:
Education 1 2 3 4 5 6 7 8 9 10 11 13 14
Below 10th 58.8% 18.7% 1.5% 11.5% 2.4% 0.3% 0.1% 0.3% 0.2% 0.0% 0.0% 0.8% 5.3%
Above 10th 62.5% 17.0% 0.9% 11.5% 2.6% 0.3% 0.3% 0.6% 0.2% 0.3% 0.2% 1.8% 1.8%
Degree 66.8% 13.6% 0.0% 8.9% 1.3% 0.9% 0.0% 0.9% 0.4% 0.4% 0.0% 3.8% 3.0%
PG 65.9% 18.7% 1.6% 3.3% 4.9% 0.0% 0.0% 0.0% 1.6% 0.0% 0.0% 3.3% 0.8%
Professional 50.0% 29.3% 0.0% 15.9% 2.4% 0.0% 1.2% 0.0% 0.0% 0.0% 0.0% 0.0% 1.2%
Uneducated 54.9% 22.0% 2.7% 10.5% 1.8% 0.2% 0.5% 0.5% 0.0% 0.0% 0.0% 3.4% 3.4%
� Caste-wise:
Caste 1 2 3 4 5 6 7 8 9 10 11 13 14
General 69.8% 15.3% 1.2% 5.1% 2.3% 0.3% 0.2% 0.7% 0.3% 0.0% 0.0% 1.8% 3.0%
OBC 68.9% 15.0% 0.3% 7.9% 1.5% 0.4% 0.1% 0.5% 0.1% 0.3% 0.0% 1.7% 3.3%
SC 59.0% 20.8% 2.2% 8.6% 2.9% 0.7% 0.0% 0.2% 0.4% 0.0% 0.2% 0.9% 4.0%
ST 59.9% 14.7% 0.7% 11.1% 3.6% 0.0% 0.7% 0.7% 0.3% 0.3% 0.0% 4.2% 3.9%
Minority 24.1% 34.6% 2.7% 30.1% 2.7% 0.0% 0.3% 0.0% 0.0% 0.0% 0.0% 1.8% 3.6%
Others 47.6% 19.0% 4.8% 19.0% 4.8% 0.0% 0.0% 0.0% 0.0% 0.0% 0.0% 4.8% 0.0%

--------------------------------------------------------------------------------------------------------------------------------
9B, Samrat Complex, Opp: AG’s Office, Saifabad, HYDERABAD- 500 004.
62 | P a g e
SECRET BALLOT BOX SURVEY FINDINGS
� Party Preference: Overall Alwar district
CONGRESS BJP BSP OTHERS
36.1 61.2 0.8 1.9

--------------------------------------------------------------------------------------------------------------------------------
9B, Samrat Complex, Opp: AG’s Office, Saifabad, HYDERABAD- 500 004.
63 | P a g e
� Gender-wise Party preference
Gender CONGRESS BJP BSP OTHERS
Male 35.5 61.5 0.8 2.2
Female 37.0 60.7 0.9 1.3

--------------------------------------------------------------------------------------------------------------------------------
9B, Samrat Complex, Opp: AG’s Office, Saifabad, HYDERABAD- 500 004.
64 | P a g e
ASSEMBLY SEGMENT-WISE
ALWAR RURAL (SC)
� Party Preference:
CONGRESS BJP BSP OTHERS
32.6 58.5 4.7 4.1

--------------------------------------------------------------------------------------------------------------------------------
9B, Samrat Complex, Opp: AG’s Office, Saifabad, HYDERABAD- 500 004.
65 | P a g e
� Gender-wise Party preference:
Gender CONGRESS BJP BSP OTHERS
Male 29.9 62.4 3.4 4.3
Female 36.8 52.6 6.6 3.9

--------------------------------------------------------------------------------------------------------------------------------
9B, Samrat Complex, Opp: AG’s Office, Saifabad, HYDERABAD- 500 004.
66 | P a g e
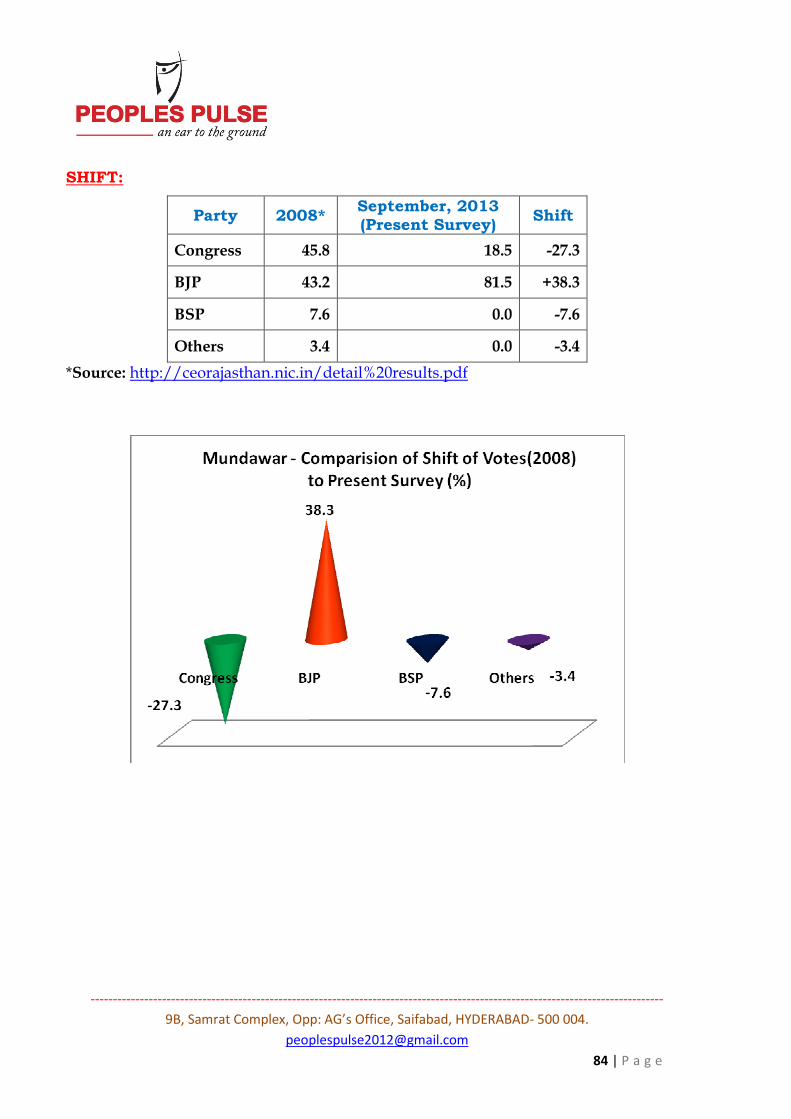
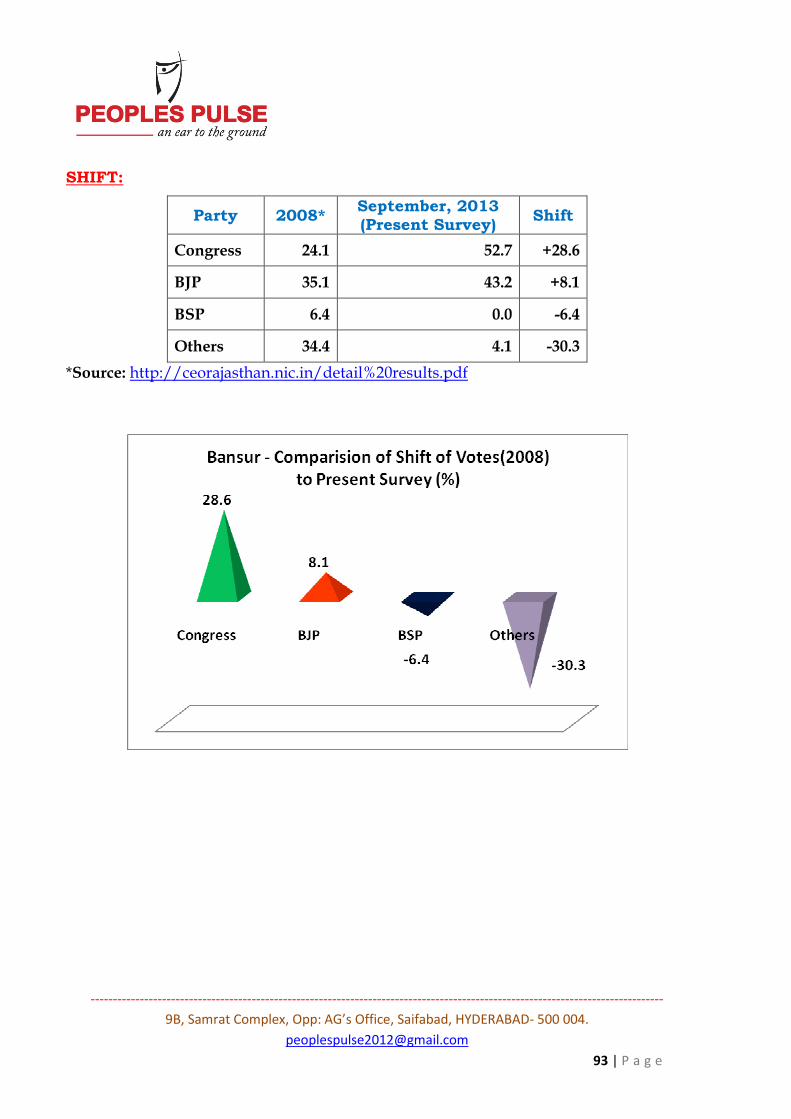
SHIFT:
Party 2008* September, 2013 (Present Survey)
Shift
Congress 36.6 32.6 -4.0
BJP 27.9 58.5 +30.6
BSP 20.7 4.7 -16.0
Others 14.8 4.1 -10.7
*Source: http://ceorajasthan.nic.in/detail%20results.pdf

--------------------------------------------------------------------------------------------------------------------------------
9B, Samrat Complex, Opp: AG’s Office, Saifabad, HYDERABAD- 500 004.
67 | P a g e
ALWAR URBAN
� Party Preference:
CONGRESS BJP BSP OTHERS
37.5 56.3 0.8 5.4

--------------------------------------------------------------------------------------------------------------------------------
9B, Samrat Complex, Opp: AG’s Office, Saifabad, HYDERABAD- 500 004.
68 | P a g e
� Gender-wise Party preference:
Gender CONGRESS BJP BSP OTHERS
Male 34.7 56.2 1.7 7.4
Female 40.3 56.3 0.0 3.4

--------------------------------------------------------------------------------------------------------------------------------
9B, Samrat Complex, Opp: AG’s Office, Saifabad, HYDERABAD- 500 004.
69 | P a g e
SHIFT:
Party 2008* September, 2013 (Present Survey)
Shift
Congress 34.7 37.5 +2.8
BJP 48.2 56.3 +8.1
BSP 7.7 0.8 -6.9
Others 9.4 5.4 -4.0
*Source: http://ceorajasthan.nic.in/detail%20results.pdf

--------------------------------------------------------------------------------------------------------------------------------
9B, Samrat Complex, Opp: AG’s Office, Saifabad, HYDERABAD- 500 004.
70 | P a g e
THANAGAZI
� Party Preference:
CONGRESS BJP BSP OTHERS
36.1 57.6 1.7 4.6
--------------------------------------------------------------------------------------------------------------------------------
9B, Samrat Complex, Opp: AG’s Office, Saifabad, HYDERABAD- 500 004.
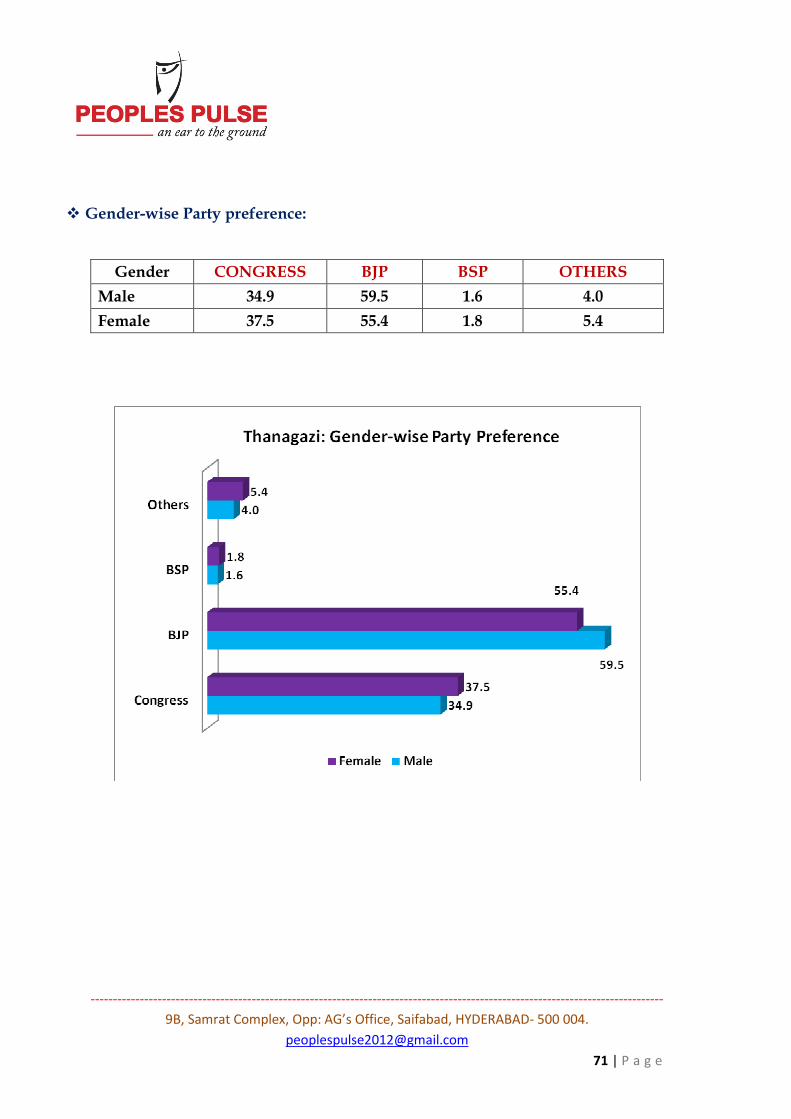
71 | P a g e
� Gender-wise Party preference:
Gender CONGRESS BJP BSP OTHERS
Male 34.9 59.5 1.6 4.0
Female 37.5 55.4 1.8 5.4

--------------------------------------------------------------------------------------------------------------------------------
9B, Samrat Complex, Opp: AG’s Office, Saifabad, HYDERABAD- 500 004.
72 | P a g e
SHIFT:
Party 2008* September, 2013 (Present Survey)
Shift
Congress 23.6 36.1 +12.5
BJP 32.4 57.6 +25.2
BSP 7.2 1.7 -5.5
Others 36.8 4.6 -32.2
*Source: http://ceorajasthan.nic.in/detail%20results.pdf

--------------------------------------------------------------------------------------------------------------------------------
9B, Samrat Complex, Opp: AG’s Office, Saifabad, HYDERABAD- 500 004.
73 | P a g e
TIJARA
� Party Preference:
CONGRESS BJP BSP OTHERS
28.6 70.5 0.8 0.0

--------------------------------------------------------------------------------------------------------------------------------
9B, Samrat Complex, Opp: AG’s Office, Saifabad, HYDERABAD- 500 004.
74 | P a g e
� Gender-wise Party preference:
Gender CONGRESS BJP BSP OTHERS
Male 30.6 69.4 0.0 0.0
Female 26.7 71.7 1.7 0.0

--------------------------------------------------------------------------------------------------------------------------------
9B, Samrat Complex, Opp: AG’s Office, Saifabad, HYDERABAD- 500 004.
75 | P a g e
SHIFT:
Party 2008* September, 2013 (Present Survey)
Shift
Congress 27.2 28.6 +1.4
BJP 0.0 70.5 +70.5
BSP 20.4 0.8 -19.6
Others 52.4 0.0 -52.4
*Source: http://ceorajasthan.nic.in/detail%20results.pdf

--------------------------------------------------------------------------------------------------------------------------------
9B, Samrat Complex, Opp: AG’s Office, Saifabad, HYDERABAD- 500 004.
76 | P a g e
RAMGARH
� Party Preference:
CONGRESS BJP BSP OTHERS
38.9 61.1 0.0 0.0

--------------------------------------------------------------------------------------------------------------------------------
9B, Samrat Complex, Opp: AG’s Office, Saifabad, HYDERABAD- 500 004.
77 | P a g e
� Gender-wise Party preference:
Gender CONGRESS BJP BSP OTHERS
Male 40.3 59.7 0.0 0.0
Female 36.8 63.2 0.0 0.0

--------------------------------------------------------------------------------------------------------------------------------
9B, Samrat Complex, Opp: AG’s Office, Saifabad, HYDERABAD- 500 004.
78 | P a g e
SHIFT:
Party 2008* September, 2013 (Present Survey)
Shift
Congress 35.9 38.9 +3.0
BJP 48.6 61.1 +12.5
BSP 6.4 0.0 -6.4
Others 9.1 0.0 -9.1
*Source: http://ceorajasthan.nic.in/detail%20results.pdf

--------------------------------------------------------------------------------------------------------------------------------
9B, Samrat Complex, Opp: AG’s Office, Saifabad, HYDERABAD- 500 004.
79 | P a g e
RAJGARH – LAXMANGARH (ST)
� Party Preference:
CONGRESS BJP BSP OTHERS
33.3 66.1 0.6 0.0

--------------------------------------------------------------------------------------------------------------------------------
9B, Samrat Complex, Opp: AG’s Office, Saifabad, HYDERABAD- 500 004.
80 | P a g e
� Gender-wise Party preference:
Gender CONGRESS BJP BSP OTHERS
Male 29.9 69.2 0.9 0.0
Female 40.4 59.6 0.0 0.0

--------------------------------------------------------------------------------------------------------------------------------
9B, Samrat Complex, Opp: AG’s Office, Saifabad, HYDERABAD- 500 004.
81 | P a g e
SHIFT:
Party 2008* September, 2013 (Present Survey)
Shift
Congress 36.3 33.3 -3.0
BJP 6.1 66.1 +60.0
BSP 8.9 0.6 -8.3
Others 48.7 0.0 -48.7
*Source: http://ceorajasthan.nic.in/detail%20results.pdf

--------------------------------------------------------------------------------------------------------------------------------
9B, Samrat Complex, Opp: AG’s Office, Saifabad, HYDERABAD- 500 004.
82 | P a g e
MUNDAWAR
� Party Preference:
CONGRESS BJP BSP OTHERS
18.5 81.5 0.0 0.0

--------------------------------------------------------------------------------------------------------------------------------
9B, Samrat Complex, Opp: AG’s Office, Saifabad, HYDERABAD- 500 004.
83 | P a g e
� Gender-wise Party preference:
Gender CONGRESS BJP BSP OTHERS
Male 23.2 76.8 0.0 0.0
Female 11.6 88.4 0.0 0.0
--------------------------------------------------------------------------------------------------------------------------------
9B, Samrat Complex, Opp: AG’s Office, Saifabad, HYDERABAD- 500 004.
84 | P a g e
SHIFT:
Party 2008* September, 2013 (Present Survey)
Shift
Congress 45.8 18.5 -27.3
BJP 43.2 81.5 +38.3
BSP 7.6 0.0 -7.6
Others 3.4 0.0 -3.4
*Source: http://ceorajasthan.nic.in/detail%20results.pdf

--------------------------------------------------------------------------------------------------------------------------------
9B, Samrat Complex, Opp: AG’s Office, Saifabad, HYDERABAD- 500 004.
85 | P a g e
KISHANGARH BAS
� Party Preference:
CONGRESS BJP BSP OTHERS
62.1 35.5 0.5 2.0
--------------------------------------------------------------------------------------------------------------------------------
9B, Samrat Complex, Opp: AG’s Office, Saifabad, HYDERABAD- 500 004.
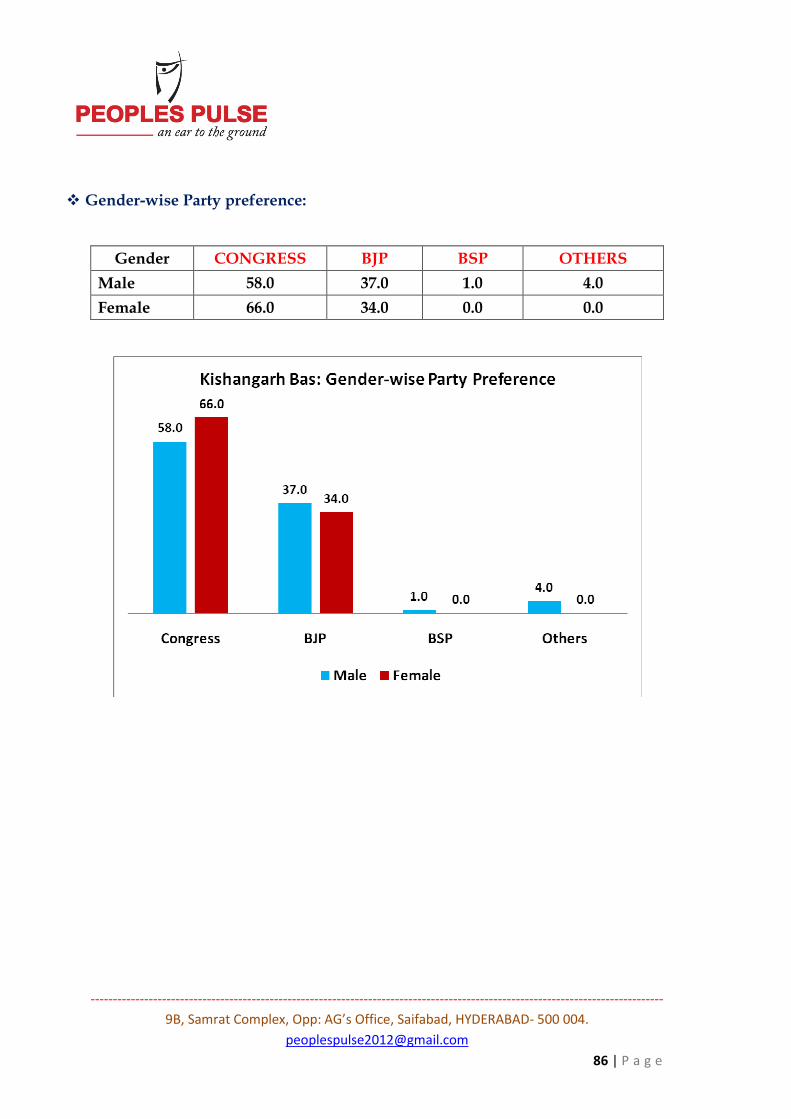
86 | P a g e
� Gender-wise Party preference:
Gender CONGRESS BJP BSP OTHERS
Male 58.0 37.0 1.0 4.0
Female 66.0 34.0 0.0 0.0

--------------------------------------------------------------------------------------------------------------------------------
9B, Samrat Complex, Opp: AG’s Office, Saifabad, HYDERABAD- 500 004.
87 | P a g e
SHIFT:
Party 2008* September, 2013 (Present Survey)
Shift
Congress 24.7 62.1 +37.4
BJP 26.5 35.5 +9.0
BSP 15.0 0.5 -14.5
Others 33.8 2.0 -31.8
*Source: http://ceorajasthan.nic.in/detail%20results.pdf
--------------------------------------------------------------------------------------------------------------------------------
9B, Samrat Complex, Opp: AG’s Office, Saifabad, HYDERABAD- 500 004.
88 | P a g e
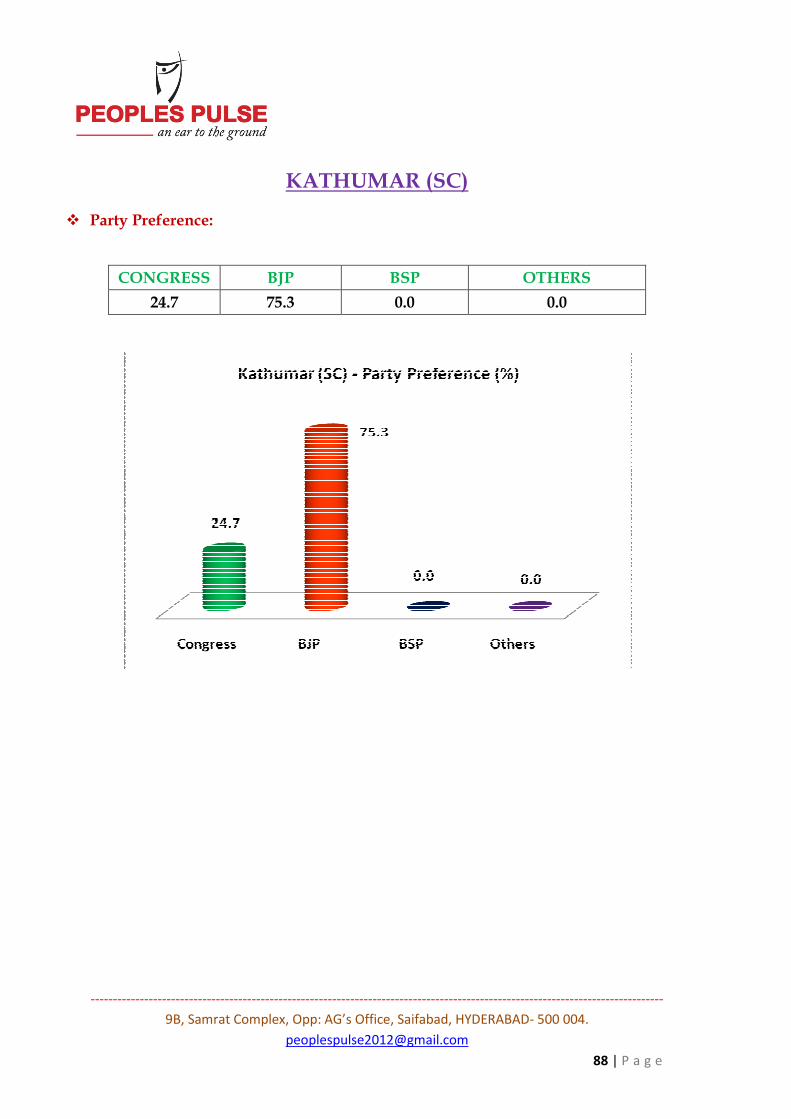
KATHUMAR (SC)
� Party Preference:
CONGRESS BJP BSP OTHERS
24.7 75.3 0.0 0.0

--------------------------------------------------------------------------------------------------------------------------------
9B, Samrat Complex, Opp: AG’s Office, Saifabad, HYDERABAD- 500 004.
89 | P a g e
� Gender-wise Party preference:
Gender CONGRESS BJP BSP OTHERS
Male 23.8 76.2 0.0 0.0
Female 26.4 73.6 0.0 0.0
--------------------------------------------------------------------------------------------------------------------------------
9B, Samrat Complex, Opp: AG’s Office, Saifabad, HYDERABAD- 500 004.
90 | P a g e
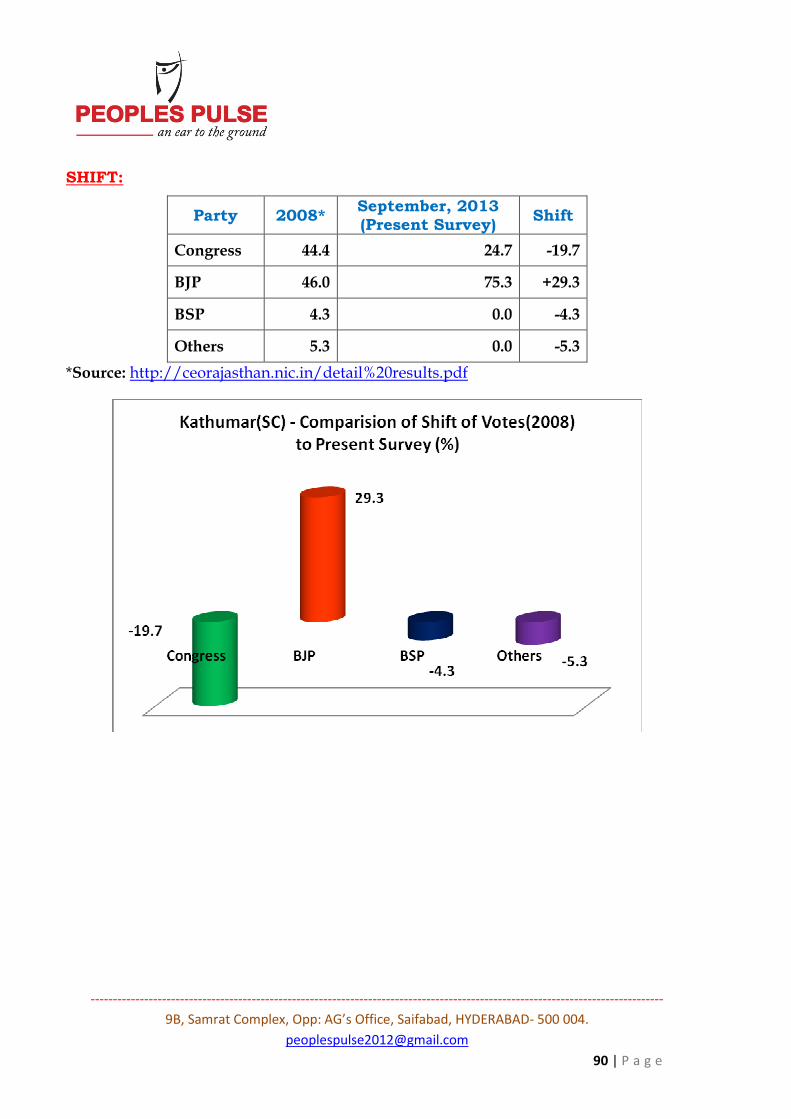
SHIFT:
Party 2008* September, 2013 (Present Survey)
Shift
Congress 44.4 24.7 -19.7
BJP 46.0 75.3 +29.3
BSP 4.3 0.0 -4.3
Others 5.3 0.0 -5.3
*Source: http://ceorajasthan.nic.in/detail%20results.pdf

--------------------------------------------------------------------------------------------------------------------------------
9B, Samrat Complex, Opp: AG’s Office, Saifabad, HYDERABAD- 500 004.
91 | P a g e
BANSUR
� Party Preference:
CONGRESS BJP BSP OTHERS
52.7 43.2 0.0 4.1

--------------------------------------------------------------------------------------------------------------------------------
9B, Samrat Complex, Opp: AG’s Office, Saifabad, HYDERABAD- 500 004.
92 | P a g e
� Gender-wise Party preference:
Gender CONGRESS BJP BSP OTHERS
Male 56.7 37.5 0.0 5.8
Female 42.9 57.1 0.0 0.0
--------------------------------------------------------------------------------------------------------------------------------
9B, Samrat Complex, Opp: AG’s Office, Saifabad, HYDERABAD- 500 004.
93 | P a g e
SHIFT:
Party 2008* September, 2013 (Present Survey)
Shift
Congress 24.1 52.7 +28.6
BJP 35.1 43.2 +8.1
BSP 6.4 0.0 -6.4
Others 34.4 4.1 -30.3
*Source: http://ceorajasthan.nic.in/detail%20results.pdf

--------------------------------------------------------------------------------------------------------------------------------
9B, Samrat Complex, Opp: AG’s Office, Saifabad, HYDERABAD- 500 004.
94 | P a g e
BEHROD
� Party Preference:
CONGRESS BJP BSP OTHERS
42.3 57.7 0.0 0.0

--------------------------------------------------------------------------------------------------------------------------------
9B, Samrat Complex, Opp: AG’s Office, Saifabad, HYDERABAD- 500 004.
95 | P a g e
� Gender-wise Party preference:
Gender CONGRESS BJP BSP OTHERS
Male 39.1 60.9 0.0 0.0
Female 44.9 55.1 0.0 0.0

--------------------------------------------------------------------------------------------------------------------------------
9B, Samrat Complex, Opp: AG’s Office, Saifabad, HYDERABAD- 500 004.
96 | P a g e
SHIFT:
Party 2008* September, 2013 (Present Survey)
Shift
Congress 32.9 42.3 +9.4
BJP 50.7 57.7 +7.0
BSP 6.6 0.0 -6.6
Others 9.8 0.0 -9.8
*Source: http://ceorajasthan.nic.in/detail%20results.pdf