Alves et al, 2013 - uevora.pthome.dbio.uevora.pt/~hadao/FCT_Proj/Alves et al, 2013.pdf · Alves et...
14
Ecological Indicators 24 (2013) 462–475 Contents lists available at SciVerse ScienceDirect Ecological Indicators jo ur n al homep ag e: www.elsevier.com/locate/ecolind Benthic meiofauna as indicator of ecological changes in estuarine ecosystems: The use of nematodes in ecological quality assessment A.S. Alves a,d,∗ , H. Adão b,d , T.J. Ferrero c , J.C. Marques a , M.J. Costa d , J. Patrício a a IMAR – Institute of Marine Research, c/o Department of Life Sciences, Faculty of Sciences and Technology, University of Coimbra, 3004-517 Coimbra, Portugal b University of Évora, Biology Department, Apartado 94, 7002-554 Évora, Portugal c The Natural History Museum, Department of Zoology, Cromwell Road, London SW7 5BD, UK d Centre of Oceanography, Faculty of Sciences, University of Lisbon, Campo Grande, 1749-016 Lisbon, Portugal a r t i c l e i n f o Article history: Received 25 April 2012 Received in revised form 12 July 2012 Accepted 21 July 2012 Keywords: Meiobenthos Free-living nematodes Indicators Biodiversity Estuaries a b s t r a c t Estuarine meiofauna communities have been only recently considered to be good indicators of ecolog- ical quality, exhibiting several advantages over macrofauna, such as their small size, high abundance, rapid generation times and absence of a planktonic phase. In estuaries we must account not only for a great natural variability along the estuarine gradient (e.g. sediment type and dynamics, oxygen availabil- ity, temperature and flow speed) but also for the existence of anthropogenic pressures (e.g. high local population density, presence of harbors and dredging activities). Spatial and temporal biodiversity patterns of meiofauna and free-living marine nematodes were stud- ied in the Mondego estuary (Portugal). Both taxonomic and functional approaches were applied to nematode communities in order to describe the community structure and to relate it with the envi- ronmental parameters along the estuary. At all sampling events, nematode assemblages reflected the estuarine gradient, and salinity and grain size composition were confirmed to be the main abiotic factors controlling the distribution of the assemblages. Moreover, the low temporal variability may indicate that natural variability is superimposed by the anthropogenic pressures present in some areas of the estuary. The characterization of both meiofauna and nematode assemblages highlighted the usefulness of the integration of both taxonomic and functional attributes, which must be taken into consideration when assessing the ecological status of estuaries. © 2012 Elsevier Ltd. All rights reserved. 1. Introduction Meiofauna features are a good indicator of environmental con- ditions and changes in their density, diversity, structure and functioning may indicate alterations in the system. Although not being included in the biological compartment that needs to be monitored in the scope of the Water Framework Directive (WFD, Directive 2000/60/EC), meiofauna gives valuable informa- tion regarding ecosystems health. According to Sheppard (2006), marine scientists need to increase awareness of and emphasize the importance of the many species that have no appeal, which are not attractive and, for the most part, are not seen, like meiofauna. Despite these difficulties, meiofauna communities are reason- ably well characterized around the world, with studies ranging from the deep sea floor to alpine lakes, as well as from tropical ∗ Corresponding author at: IMAR – Institute of Marine Research, c/o Department of Life Sciences, Faculty of Sciences and Technology, University of Coimbra, 3004-517 Coimbra, Portugal. E-mail address: [email protected] (A.S. Alves). reefs to polar sea ice (Giere, 2009). In Europe, studies on meioben- thic communities mostly encompass the more northerly estuarine ecosystems (e.g. Warwick and Gee, 1984; Li and Vincx, 1993; Smol et al., 1994; Soetaert et al., 1995; Ferrero et al., 2008). In south- ern Europe there is a serious gap in knowledge. Particularly in the Iberian Peninsula, there is a lack of information on both spatial and temporal distribution of meiofauna and free living nematodes in estuarine environments, being essential to describe those biodi- versity patterns. Meiobenthic communities provide information of great interest not only due to their important role in marine benthic food chains (Heip et al., 1985; Moens et al., 2005) but also due to their ecolog- ical characteristics (small size, high abundance, rapid generation times and absence of a planktonic phase), giving meiofauna several advantages over the commonly used macrofauna communities as monitoring organisms (Kennedy and Jacoby, 1999; Schratzberger et al., 2000; Austen and Widdicombe, 2006). In fact, nematodes have been pointed out as potential indicators of anthropogenic disturbance in aquatic ecosystems (e.g. Coull and Chandler, 1992; Schratzberger et al., 2004; Steyaert et al., 2007; Moreno et al., 2008). The inclusion of information regarding their functional traits 1470-160X/$ – see front matter © 2012 Elsevier Ltd. All rights reserved. http://dx.doi.org/10.1016/j.ecolind.2012.07.013
Transcript of Alves et al, 2013 - uevora.pthome.dbio.uevora.pt/~hadao/FCT_Proj/Alves et al, 2013.pdf · Alves et...

Ecological Indicators 24 (2013) 462–475
Contents lists available at SciVerse ScienceDirect
Ecological Indicators
jo ur n al homep ag e: www.elsev ier .com/ locate /eco l ind
Benthic meiofauna as indicator of ecological changes in estuarine ecosystems:The use of nematodes in ecological quality assessment
A.S. Alves a,d,∗, H. Adãob,d, T.J. Ferrero c, J.C. Marques a, M.J. Costad, J. Patrício a
a IMAR – Institute of Marine Research, c/o Department of Life Sciences, Faculty of Sciences and Technology, University of Coimbra, 3004517 Coimbra, Portugalb University of Évora, Biology Department, Apartado 94, 7002554 Évora, Portugalc The Natural History Museum, Department of Zoology, Cromwell Road, London SW7 5BD, UKd Centre of Oceanography, Faculty of Sciences, University of Lisbon, Campo Grande, 1749016 Lisbon, Portugal
a r t i c l e i n f o
Article history:Received 25 April 2012
Received in revised form 12 July 2012
Accepted 21 July 2012
Keywords:Meiobenthos
Freeliving nematodes
Indicators
Biodiversity
Estuaries
a b s t r a c t
Estuarine meiofauna communities have been only recently considered to be good indicators of ecolog
ical quality, exhibiting several advantages over macrofauna, such as their small size, high abundance,
rapid generation times and absence of a planktonic phase. In estuaries we must account not only for a
great natural variability along the estuarine gradient (e.g. sediment type and dynamics, oxygen availabil
ity, temperature and flow speed) but also for the existence of anthropogenic pressures (e.g. high local
population density, presence of harbors and dredging activities).
Spatial and temporal biodiversity patterns of meiofauna and freeliving marine nematodes were stud
ied in the Mondego estuary (Portugal). Both taxonomic and functional approaches were applied to
nematode communities in order to describe the community structure and to relate it with the envi
ronmental parameters along the estuary. At all sampling events, nematode assemblages reflected the
estuarine gradient, and salinity and grain size composition were confirmed to be the main abiotic factors
controlling the distribution of the assemblages.
Moreover, the low temporal variability may indicate that natural variability is superimposed by the
anthropogenic pressures present in some areas of the estuary. The characterization of both meiofauna and
nematode assemblages highlighted the usefulness of the integration of both taxonomic and functional
attributes, which must be taken into consideration when assessing the ecological status of estuaries.
© 2012 Elsevier Ltd. All rights reserved.
1. Introduction
Meiofauna features are a good indicator of environmental con
ditions and changes in their density, diversity, structure and
functioning may indicate alterations in the system. Although
not being included in the biological compartment that needs to
be monitored in the scope of the Water Framework Directive
(WFD, Directive 2000/60/EC), meiofauna gives valuable informa
tion regarding ecosystems health. According to Sheppard (2006),
marine scientists need to increase awareness of and emphasize the
importance of the many species that have no appeal, which are not
attractive and, for the most part, are not seen, like meiofauna.
Despite these difficulties, meiofauna communities are reason
ably well characterized around the world, with studies ranging
from the deep sea floor to alpine lakes, as well as from tropical
∗ Corresponding author at: IMAR – Institute of Marine Research, c/o Department of
Life Sciences, Faculty of Sciences and Technology, University of Coimbra, 3004517
Coimbra, Portugal.
Email address: [email protected] (A.S. Alves).
reefs to polar sea ice (Giere, 2009). In Europe, studies on meioben
thic communities mostly encompass the more northerly estuarine
ecosystems (e.g. Warwick and Gee, 1984; Li and Vincx, 1993; Smol
et al., 1994; Soetaert et al., 1995; Ferrero et al., 2008). In south
ern Europe there is a serious gap in knowledge. Particularly in the
Iberian Peninsula, there is a lack of information on both spatial and
temporal distribution of meiofauna and free living nematodes in
estuarine environments, being essential to describe those biodi
versity patterns.
Meiobenthic communities provide information of great interest
not only due to their important role in marine benthic food chains
(Heip et al., 1985; Moens et al., 2005) but also due to their ecolog
ical characteristics (small size, high abundance, rapid generation
times and absence of a planktonic phase), giving meiofauna several
advantages over the commonly used macrofauna communities as
monitoring organisms (Kennedy and Jacoby, 1999; Schratzberger
et al., 2000; Austen and Widdicombe, 2006). In fact, nematodes
have been pointed out as potential indicators of anthropogenic
disturbance in aquatic ecosystems (e.g. Coull and Chandler, 1992;
Schratzberger et al., 2004; Steyaert et al., 2007; Moreno et al.,
2008). The inclusion of information regarding their functional traits
1470160X/$ – see front matter © 2012 Elsevier Ltd. All rights reserved.
http://dx.doi.org/10.1016/j.ecolind.2012.07.013

A.S. Alves et al. / Ecological Indicators 24 (2013) 462–475 463
(e.g. trophic structure, life strategy) can provide critical information
on the functioning of ecosystems (Norling et al., 2007; Danovaro
et al., 2008).
Estuaries are naturally stressed systems with a high degree of
variability in their physical–chemical characteristics. The natural
gradient of salinity, linked with other gradients (e.g. bed sedi
ment type and dynamics, oxygen availability, temperature and
current speed), are well documented as important factors in deter
mining temporal and spatial variations of meiofauna communities
(Bouwman, 1983; Heip et al., 1985; Austen and Warwick, 1989;
Soetaert et al., 1995; Li et al., 1997; Forster, 1998; Moens and Vincx,
2000; Steyaert et al., 2003; Derycke et al., 2007; Alves et al., 2009;
Adão et al., 2009) but studies encompassing the entire salinity range
from marine to freshwater conditions are few (e.g. Portugal: Alves
et al., 2009; Adão et al., 2009; Patrício et al., 2012; United King
dom: Ferrero et al., 2008; The Netherlands: Soetaert et al., 1994,
Australia: Hourston et al., 2011). Moreover, most studies cover a
small temporal range, providing only limited information on the
behavior of assemblages over longer time scales.
The present study compares the characteristics of meiofauna
and free living nematodes assemblages in the subtidal sediments
of different locations from Euhaline to Oligohaline areas of the
Mondego estuary. Furthermore, the temporal (seasonal) variability
between the assemblages of different locations is assessed and the
use of nematodes as biological indicators of environmental quality
is considered.
This study aimed to investigate changes in patterns of meiofauna
and nematode assemblage composition and nematode diversity,
trophic composition and life strategies between different estuarine
locations and sampling occasions
The following null hypotheses were tested: (a) there would be
no differences in meiofauna taxon and nematode assemblage com
position and trophic composition along the estuary; and (b) there
would be no differences in the meiofaunal taxon and nematode
assemblage composition and trophic composition at different sea
sonal sampling events.
2. Materials and methods
2.1. Study area
The Mondego estuary (Fig. 1), located on the Atlantic coast of
Portugal (40◦08′N, 8◦50′W), is a polyhaline system influenced by a
warmtemperate climate. The estuary is 21 km long (based on the
extent of tidal influence) with an area of about 8.6 km2 and, in its
terminal part (at a distance of 7 km from the sea) it divides into
two arms, northern and southern, separated by an alluvial island
(Murraceira island), which rejoin near the estuary’s mouth. The two
arms have very different hydrological characteristics. The north
ern arm is deeper (5–10 m during high tide), receives most of the
system’s freshwater input, being influenced by seasonal fluctuation
in water flow (Flindt et al., 1997), and forms the main navigation
channel on which the Figueira da Foz harbor is located. The south
ern arm is shallower (2–4 m during high tide), has large areas of
intertidal mudflats (almost 75% of the area) exposed during low
tide and, until the Spring of 2006, was almost silted up in the upper
zones. In May 2006, the communication between both arms was re
established in order to improve the water quality in the terminal
part of the estuary by reducing the residence time in the southern
arm (Neto et al., 2010).
The Mondego estuary supports not only the Figueira da Foz har
bor (regular dredging is carried out to ensure shipping conditions)
but also numerous industries and receives agricultural runoff from
rice and corn fields in the Lower River valley (Marques et al., 2003).
2.2. Sampling strategy
The subtidal softbottom meiobenthic assemblages were sam
pled along the salinity gradient of the Mondego estuary on six
sampling occasions: August 2006 (summer, Su06), November 2006
(autumn, Au06), March 2007 (winter, Wi07), June 2007 (spring,
Sp07), September 2009 (summer, Su09) and December 2009
(autumn, Au09).
Eleven sampling stations were selected following the division of
the estuary proposed by Teixeira et al. (2008) (Fig. 1). The estuary
was thus divided in five different areas: Euhaline (station 4; salinity
30–34); Polyhaline of the South Arm (st 6, 7 and 9; salinity 18–30),
Polyhaline of the North Arm (st 12 and 13; salinity 18–30), Meso
haline (18 and 19; salinity 5–18) and Oligohaline (st 21, 23 and 25;
salinity 0.5–5).
2.2.1. Environmental dataAt each sampling station, bottom water parameters were mea
sured in situ with a YSI Data Sonde Survey 4: salinity (Practical
Salinity Scale) (in Autumn 2009 – no salinity data was recorded),
temperature (◦C), pH, and dissolved oxygen (DO) (mg L−1). Water
samples were collected for determination of nutrients and chloro
phyll a (mg m−3) in laboratory: nitrate (NO3−N) and nitrite
(NO2−N) concentrations (mmol L−1) were analyzed according to
standard methods described in Strickland and Parsons (1972)
and ammonium (NH4+N) and phosphate (PO4
3−P) concentra
tions (mmol L−1) were analyzed following the Limnologisk Metodik
(1992). Chlorophyll a (Chl a) determinations were performed
according to Parsons et al. (1985). Sediment samples were taken
at each station to determine the organic matter content and grain
size. Sediment organic matter (OM) content was defined as the dif
ference between the weight of each sample after ovendrying at
60 ◦C for 72 h followed by combustion at 450 ◦C for 8 h, and was
expressed as the percentage of the total weight. Grain size was ana
lyzed by dry mechanical separation through a column of sieves of
Fig. 1. Mondego estuary (Portugal): station location (black circles). Areas: Euhaline (station 4), Polyhaline of the South Arm (stations 6, 7 and 9), Polyhaline of the North Arm
(stations 12 and 13), Mesohaline (stations 18 and 19) and Oligohaline (stations 21, 23 and 25).

464 A.S. Alves et al. / Ecological Indicators 24 (2013) 462–475
different mesh sizes, corresponding to the five classes described
by Brown and McLachlan (1990): (a) gravel (>2 mm), (b) coarse
sand (0.500–2.000 mm), (c) mean sand (0.250–0.500 mm), (d) fine
sand (0.063–0.250 mm), and (e) silt and clay (<0.063 mm). The rel
ative content of the different grainsize fractions was expressed as
a percentage of the total sample weight.
2.2.2. Biological dataThree replicate samples of subtidal meiobenthos were collected,
at each sampling station, by forcing a Kajak sediment corer (inner
diameter: 4.6 cm) 3 cm into the sediment. All samples were pre
served in 4% buffered formaldehyde and were sieved through 1 mm
and 38 mm mesh size sieves (material retained on the smaller
mesh was collected). Meiofauna was extracted from the sediment
fraction using Ludox HS40 colloidal silica at a specific gravity of
1.18 g cm−3 (Vincx, 1996). All meiobenthic organisms were iden
tified to major taxa level under a stereomicroscope using Higgins
and Thiel (1988) and Giere (2009) and the density (individuals per
10 cm2) of each taxon was quantified.
From each replicate, a random set of 120 nematodes, or the total
number of individuals in samples with less than 120 nematodes,
were picked, cleared in glycerol–ethanol solution, transferred to
anhydrous glycerol by evaporation and mounted on slides for iden
tification (Vincx, 1996). All nematodes were identified to genus
level using a microscope fitted with a 100× oil immersion objec
tive and based on the pictorial keys of Platt and Warwick (1983,
1988), Warwick et al. (1998), the online information system NeMys
(Steyaert et al., 2005) and on Abebe et al. (2006).
2.3. Data analysis
Univariate and multivariate analyses to detect spatial and
temporal changes in the community structure were performed
according to the procedures described by Clarke (1993), using the
PRIMER v6 software package (Clarke and Warwick, 2001) with the
PERMANOVA addon package (Anderson et al., 2008).
2.3.1. Environmental variablesA Principal Component Analysis (PCA) of the environmental
variables was performed to find patterns in multidimensional
data by reducing the number of dimensions, with minimal loss
of information. Prior to the calculation of the environmental
parameter resemblance matrix based on Euclidean distance, the
environmental variables (temperature, salinity, dissolved oxygen,
pH, ammonium, nitrate, nitrite, phosphate, silicates, organic mat
ter and each of the five granulometric classes) were squareroot
transformed (except dissolved oxygen and pH data) and followed
normalization.
2.3.2. Meiofauna assemblagesTotal meiofauna density and density of individual major maio
fauna taxa (individuals per 10 cm2) were calculated, for each area
and sampling occasion.
In order to test the hypothesis that the composition of
meiofauna changes spatially and seasonally, a twoway PER
MANOVA analysis was carried out with the following crossed
factor design: “area” and “sampling occasion” as fixed factors,
with five (Euhaline, Polyhaline North Arm, Polyhaline South
Arm, Mesohaline and Oligohaline) and six levels (Su06, Au06,
Wi07, Sp07, Su09 and Au09), respectively. Meiofauna taxa den
sity data were square root transformed in order to scale down
densities of highly abundant taxa and therefore increase the
importance of the less abundant taxa in the analyses. The PER
MANOVA test was conducted on Bray–Curtis similarity matrix
and the residuals were permutated under a reduced model, with
9999 permutations. The null hypothesis was rejected when the
significance level p was <0.05 (if the number of permutation
was lower than 150, the Monte Carlo permutation p was used). If
significant differences were detected, these were examined using aposteriori pairwise comparisons, using 9999 permutations under
a reduced model. Afterwards, the similarity between meiofauna
assemblages along the estuary, in the different sampling occasions,
was plotted using nonmetric multidimensional scaling (nMDS),
with Bray–Curtis as similarity measure (Clarke and Green, 1988).
2.3.3. Nematodes assemblagesAs the Nematoda was always the dominant meiofaunal group,
we decided to study this group in particular depth. Therefore, total
density, genera diversity, trophic composition and several eco
logical indicators, either based on diversity (Margalef Index, d;
ShannonWiener diversity, H′) or on ecological strategies (Index of
Trophic Diversity, ITD; Maturity Index, MI), were calculated using
the nematodes dataset, for each area and sampling occasion.
In order to investigate the trophic composition of the assem
blages, marine nematodes genera were assigned to one of the four
functional feeding groups, designated by Wieser (1953), based on
buccal cavity morphology: selective (1A) and nonselective (1B)
deposit feeders, epigrowth feeders (2A) and omnivores/predators
(2B). The trophic classification of the freshwater nematodes was
based on diet and buccal cavity structure information (Yeates et al.,
1993; Traunspurger, 1997).
The Index of Trophic Diversity (Heip et al., 1985) was calculated
as: ITD =∑
�2, where � is the density contribution of each trophic
group to total nematode density, ranging from 0.25 (highest trophic
diversity, i.e., each of the four trophic guilds account for 25% of the
nematode density), to 1.0 (lowest trophic diversity, i.e., one trophic
guild accounts for 100% of the nematode density). The Maturity
Index (Bongers, 1990; Bongers et al., 1991) was used to analyze
nematodes life strategy. Nematode genera were assigned a value on
a scale (c–p score) accordingly their ability for colonizing or persist
ing in a certain habitat, from “colonizers” (c; organisms with a high
tolerance to disturbance events) to “persisters” (p; low tolerance).
Thus, the index is expressed as a c–p value, ranging from 1 (extreme
colonizers) to 5 (extreme persisters) representing lifehistory char
acteristics associated with r and Kselection, respectively (Bongers
and Bongers, 1998; Bongers and Ferris, 1999) and varies from 1,
under disturbed conditions, to 3 or 4, under undisturbed conditions.
The index was calculated as the weighted average of the individual
colonizer–persister (c–p) values as MI =
∑n
i=1v(i) · f (i), where v(i)
is the c–p value of the taxon i and f(i) is the frequency of that taxon.
Twoway permutational analyses of variance (PERMANOVA)
were applied to test the null hypotheses that no significant spa
tial (between areas) and temporal (between sampling occasions)
differences existed, in the nematode assemblage descriptors (total
density, genera diversity, trophic composition, d, H′, ITD and MI).
PERMANOVA was used as an alternative to ANOVA since its
assumptions were not met, even after data transformation. Two
way PERMANOVA analyses were carried out with the same design
described for meiofauna analysis. All PERMANOVA tests were con
ducted on Euclideandistance similarity matrices and the residuals
were permutated under a reduced model, with 9999 permutations.
The null hypothesis was rejected when the significance level p was
<0.05 (if the number of permutation was lower than 150, the Monte
Carlo permutation p was used). Whenever significant differences
were detected, these were examined using a posteriori pairwise
comparisons, using 9999 permutations under a reduced model.
In order to test for temporal and spatial differences regard
ing nematodes assemblages’ composition, a twoway PERMANOVA
analysis was carried out with the previously described design
(“area”: 5 levels; “sampling occasion”: 6 levels), using Bray–Curtis
as similarity measure. The null hypothesis was rejected when
the significance level p was <0.05 (if the number of permutation

A.S. Alves et al. / Ecological Indicators 24 (2013) 462–475 465
was lower than 150, the Monte Carlo permutation p was used).
If significant differences were detected, these were examined
using a posteriori pairwise comparisons, using 9999 permutations
under a reduced model. Nematode genera density data were first
square root transformed in order to scale down densities of highly
abundant genera and therefore increase the importance of the
less abundant genera in the analyses, and the similarity between
communities along the estuary, in the different sampling occa
sions, was plotted by nonmetric multidimensional scaling (nMDS),
using the Bray–Curtis similarity measure (Clarke and Green, 1988).
Afterwards, the relative contribution of each genus to the aver
age dissimilarities between areas and sampling occasions were
calculated using twoway crossed similarity percentage analysis
procedure (SIMPER, cutoff percentage: 90%).
2.3.4. Nematodes assemblages vs. environmental variablesThe relationship between environmental variables and the
structure of the nematodes community was explored by carry
ing out the BIOENV procedure (Clarke and Ainsworth, 1993), using
Spearman’s correlation.
3. Results
3.1. Environmental variables
Along the estuary, salinity and nutrient concentrations showed
opposite trends, with higher salinity values and lower nutrient
concentrations downstream and lower salinity values and higher
nutrient concentrations upstream. A decrease in grain size was also
observed from Oligohaline area toward the mouth of the estuary.
The PCA ordination of the environmental factors showed that
the first two components (PC1, 29.0% and PC2, 23.8%) accounted
for about 53% of the variability of the data (Fig. 2). The Oligohaline
and Mesohaline samples were characterized by high nutrients con
centration, at all sampling occasions, while in Autumn 2006, Winter
2007 and Spring 2007, the samples from these two upstream areas
were clearly separated from the remaining ones mainly due to
higher percentage of coarser sediments.
In general, independently from the sampling occasion, higher
salinity, finer sediments and lower nutrient concentrations
characterized the samples from the Polyhaline NA, Polyhaline SA
and Euhaline areas. With a few exceptions (mainly in Summer
2009), the two Polyhaline areas presented different environmen
tal attributes: the Polyhaline NA samples having coarser sediments
and the Polyhaline SA samples being characterized by finer sedi
ments and higher OM content.
3.2. Meiofauna assemblages
Fourteen major taxa were identified along the estuary during the
sampling period with Nematoda the dominant taxon (92.4%), fol
lowed by Polychaeta (4.7%) and Harpacticoid copepods (1.5%). All
other taxa attained less than 1% [e.g. Bivalvia (0.4%), Oligochaeta
(0.4%), Ostracoda (0.2%), Tardigrada (0.1%), Gastropoda (0.1%),
Amphipoda (0.1%), Nauplii (0.1%)] and some taxa presented very
low density (less than 0.03%), such as Ciliophora, Halacaroidea,
Turbellaria and Cladocera.
Total meiofauna density (±sd) ranged from 25.4 ± 25.9 ind
10 cm−2 (Oligohaline, Sp07) to 1383.5 ± 687.9 ind 10 cm−2 (Euha
line, Su06) and the number of taxa present varied from three
(Mesohaline, Sp07; Euhaline, Au06 and Au09) to eleven (Polyhaline
SA and Euhaline in Su06), with no clear increase from Oligohaline
to Euhaline areas (Table 1).
PERMANOVA analysis of meiofauna assemblage composition
data showed a significant interaction between “area” and “sam
pling occasion” (Table 2A). The Oligohaline area was different from
all others on all sampling occasions, with minor exceptions in Au06
(Oligohaline similar to Euhaline, t = 1.35, p = 0.143), in Wi07 (Oligo
haline only different from the Polyhaline SA, t = 2.94, p = 0.002) and
in Sp07 (Oligohaline similar to Mesohaline, t = 1.57, p = 0.104). This
pattern is distinctly visible in the nMDS ordination (Fig. 3), with
a clear separation of Oligohaline and Mesohaline areas from the
remaining ones.
3.3. Nematodes assemblages
3.3.1. Structure and trophic compositionThe density (N) of nematodes ranged from 21.4 ± 23.5 ind
10 cm−2 in the Oligohaline area (Sp07) to 1323.1 ± 674.7 ind
10 cm−2 in the Euhaline area (Su06). Over the whole estuary, mean
Fig. 2. Principal Component Analysis (PCA) plot based on the environmental variables measured in each “area” (Oligohaline, Mesohaline, Polyhaline North Arm, Polyhaline
South Arm and Euhaline) and “sampling occasion” (Summer 06, Autumn 06, Winter 07, Spring 07, Summer 09 and Autumn 09). PC1 = 29.0%, PC2 = 23.8%.

466 A.S. Alves et al. / Ecological Indicators 24 (2013) 462–475
Ta
ble
1
Mean
den
sity
±
stan
dard
dev
iati
on
(nu
mb
er
of
ind
ivid
uals
per
10
cm2)
of
meio
fau
nal
tax
a
in
each
are
a
(Oli
go
hali
ne, M
eso
hali
ne, P
oly
hali
ne
No
rth
Arm
, Po
lyh
ali
ne
So
uth
Arm
an
d
Eu
hali
ne)
an
d
sam
pli
ng
occ
asi
on
(Su
mm
er
20
06
,
Su
06
;
Au
tum
n
20
06
, Au
06
;
Win
ter
20
07
, Wi0
7;
Sp
rin
g
20
07
, Sp
07
;
Su
mm
er
20
09
, Su
09
an
d
Au
tum
n
20
09
, Au
09
).
Are
aSam
pli
ng
occ
asi
on
Nem
ato
da
Po
lych
aeta
Co
pep
od
aB
ivalv
iaO
lig
och
aeta
Ost
raco
da
Gast
rop
od
aN
au
pli
iT
ard
igra
da
Am
ph
ipo
da
Cil
iop
ho
raH
ala
caro
idea
Tu
rbell
ari
a
Cla
do
cera
To
tal
Eu
hali
ne
Su
06
13
23
.1±
67
4.7
4.8±
2.2
30
.9±
14
.0
6.4±
0.7
4.0±
1.5
4.0±
3.1
3.2±
3.1
5.2±
4.1
0.8±
0.3
0.6±
0.6
0.4±
0.7
13
83
.5±
68
7.9
Au
06
52
.6
±
19
.9
0.6
±
1.0
0.2
±
0.3
53
.4
±
20
.5
Wi0
7
33
2.7
±
13
4.2
5.0
±
1.5
33
.5
±
34
.4
0.2
±
0.3
0.2
±
0.3
1.2
±
1.2
1.6
±
0.3
37
4.5
±
16
0.2
Sp
07
13
9.3±
9.9
8.8±
4.6
3.6±
0.6
1.0
±
1.7
15
2.7
±
10
.5
Su
09
15
7.5
±
63
.4
0.6
±
1.0
2.8
±
2.4
1.0
±
1.3
0.2
±
0.3
1.2
±
1.2
0.2
±
0.3
16
3.6
±
65
.7
Au
09
10
3.6±
22
.9
1.2±
0.6
4.2±
4.2
10
9.0±
26
.2
Po
lyh
ali
ne
SA
Su
06
61
7.0±
46
8.7
42
.3±
22
.8
14
.2±
18
.3
0.6±
0.5
0.4±
0.5
5.9
±
8.4
0.1
±
0.1
0.1
±
0.1
0.1
±
0.2
1.1
±
1.0
0.1
±
0.1
68
1.9
±
50
0.5
Au
06
17
2.0
±
15
0.7
15
.7
±
14
.9
1.1
±
1.8
0.1
±
0.2
18
9.0
±
16
1.8
Wi0
75
26
.1
±
50
6.0
8.7
±
7.7
7.8
±
7.7
0.4
±
0.5
0.9
±
1.1
0.1
±
0.2
0.1
±
0.1
54
4.0
±
52
1.8
Sp
07
19
6.9±
13
4.9
9.9
±
9.4
2.9
±
3.4
0.1
±
0.1
0.7
±
0.5
0.1
±
0.1
21
0.6
±
14
5.0
Su
09
20
1.2
±
81
.0
7.8
±
1.5
2.4
±
2.3
0.3
±
0.3
0.1
±
0.1
1.1
±
0.9
0.1
±
0.1
21
2.9
±
77
.5
Au
09
18
2.6
±
70
.7
9.5
±
4.5
1.5
±
1.3
0.1
±
0.2
0.2
±
0.2
0.1
±
0.1
0.1
±
0.1
0.1
±
0.1
19
4.3
±
69
.2
Po
lyh
ali
ne
NA
Su
06
23
8.4
±
13
.6
16
.8
±
10
.4
4.0
±
4.0
1.2
±
0.6
3.2
±
2.8
0.1
±
0.1
1.0
±
1.4
0.4
±
0.3
1.8
±
3.6
0.1
±
0.1
26
7.0
±
1.3
Au
06
25
9.9
±
14
.8
2.3
±
1.3
0.1
±
0.1
0.1
±
0.1
26
2.4
±
16
.0
Wi0
7
72
.8
±
10
3.0
1.7
±
2.4
0.3
±
0.3
0.4
±
0.6
0.1
±
0.1
0.1
±
0.1
75
.5
±
10
6.7
Sp
07
17
3.5±
98
.3
10
.1±
9.5
0.2±
0.3
0.1
±
0.1
0.1
±
0.1
18
4.0
±
10
8.1
Su
09
30
3.7
±
11
5.9
2.4
±
0.0
1.1
±
1.3
0.1
±
0.1
5.7
±
7.5
0.1
±
0.1
31
3.2
±
12
1.9
Au
09
24
7.0
±
10
0.2
2.4
±
2.8
0.7
±
1.0
0.2
±
0.3
1.9
±
1.8
25
2.3
±
97
.9
Meso
hali
ne
Su
06
18
3.8±
1.7
63
.8±
24
.4
2.2±
2.6
0.5±
0.4
0.5
±
0.7
1.2
±
0.3
0.2
±
0.0
0.3
±
0.4
0.1
±
0.1
0.2
±
0.3
25
2.9
±
28
.7
Au
06
26
0.5
±
16
.5
2.0
±
0.6
0.1
±
0.1
0.1
±
0.1
0.2
±
0.3
0.1
±
0.1
26
3.0
±
15
.2
Wi0
7
20
9.8
±
10
6.3
5.4
±
0.3
0.2
±
0.3
0.2
±
0.3
0.1
±
0.1
0.5
±
0.7
21
6.2
±
10
5.7
Sp
07
68
.0
±
74
.6
2.4
±
1.1
0.2
±
0.3
70
.6
±
75
.5
Su
09
55
.6
±
43
.7
6.0
±
1.7
0.5
±
0.1
0.3
±
0.4
1.6
±
2.3
64
.0
±
44
.6
Au
09
55
.1
±
17
.5
1.0
±
0.0
0.6
±
0.9
0.5
±
0.4
1.1
±
1.0
58
.3
±
17
.2
Oli
go
hali
ne
Su
06
85
.8±
41
.4
29
.2
±
11
.7
1.5
±
1.3
12
.3
±
18
.8
0.5
±
0.8
0.1
±
0.1
0.2
±
0.2
0.2
±
0.2
12
9.7
±
43
.5
Au
06
23
.9
±
6.0
0.7
±
0.6
0.1
±
0.1
1.9
±
3.2
0.1
±
0.1
0.1
±
0.1
26
.8
±
7.5
Wi0
7
67
.4
±
82
.0
4.5
±
6.9
0.3
±
0.4
0.3
±
0.6
0.1
±
0.1
0.1
±
0.1
5.4
±
9.4
78
.2
±
98
.5
Sp
07
21
.4
±
23
.5
1.9
±
2.3
1.6
±
0.9
0.2
±
0.3
0.2
±
0.2
0.1
±
0.1
25
.4
±
25
.9
Su
09
29
.7±
22
.8
1.5±
1.0
3.0±
4.5
2.2±
3.8
0.1±
0.2
36
.6±
19
.5
Au
09
32
.6
±
17
.3
1.2
±
0.2
0.7
±
0.5
0.1
±
0.1
0.1
±
0.1
0.1
±
0.2
0.1
±
0.1
2.5
±
3.6
0.2
±
0.2
37
.5
±
21
.2

A.S. Alves et al. / Ecological Indicators 24 (2013) 462–475 467
Table 2
Details of the twofactor PERMANOVA test (“area” with 5 levels, and “sampling occasion” with 6 levels, as fixed factors) for all variables analyzed. Bold values stand for the
significant differences (p < 0.05). A – meiofauna composition; B – nematodes descriptors.
Source of variation Degrees of freedom Sum of squares Mean squares PseudoF P (perm)
A. Meiofauna
Composition Area 4 39,752 9937.9 16.28 0.0001
Sampling occasion 5 23,716 4743.3 7.77 0.0001
Area × sampling occasion 19 24,391 1283.7 2.10 0.0001
Residual 139 84,871 610.58
Total 167 175,020
B. Nematodes
Total density Area 4 2,423,900 605,970 24.31 0.0001
Sampling occasion 5 2,012,300 404,860 16.24 0.0001
Area × sampling occasion 19 4,162,200 219,060 8.79 0.0001
Residual 139 3,464,500 24,925
Total 167 10,996,000
Number of genera Area 4 471.19 117.8 10.37 0.0001
Sampling occasion 5 318.13 63.626 5.60 0.0001
Area × sampling occasion 19 373.84 19.676 1.73 0.0401
Residual 139 1578.6 11.357
Total 167 2823.6
Trophic composition Area 4 19,645 4911.3 8.10 0.0001
Sampling occasion 5 19,402 3880.4 6.40 0.0001
Area × sampling occasion 19 22,170 1166.9 1.92 0.0006
Residual 139 84,261 606.2
Total 167 150,940
Composition Area 4 98,388 24,597 16.37 0.0001
Sampling occasion 5 37,623 7524.6 5.01 0.0001
Area × sampling occasion 19 61,000 3210.5 2.14 0.0001
Residual 139 208,840 1502.4
Total 167 420,420
Margalef Index Area 4 48.505 12.126 21.99 0.0001
Sampling occasion 5 4.5976 0.91952 1.67 0.152
Area × sampling occasion 19 19.238 1.0125 1.84 0.025
Residual 139 76.665 0.55154
Total 167 155.88
ShannonWiener Index Area 4 13.633 3.4082 8.22 0.0001
Sampling occasion 5 2.0816 0.41632 1.00 0.4157
Area × sampling occasion 19 11.831 0.62267 1.50 0.0972
Residual 139 57.633 0.41462
Total 167 87.925
Index of Trophic Diversity Area 4 0.31339 0.078347 3.05 0.0203
Sampling occasion 5 0.11341 0.022682 0.88 0.4951
Area × sampling occasion 19 0.59974 0.031565 1.23 0.2383
Residual 139 3.5658 0.025653
Total 167 4.5852
Maturity Index Area 4 4.1698 1.0425 9.86 0.0001
Sampling occasion 5 0.99525 0.19905 1.88 0.1054
Area × sampling occasion 19 3.5231 0.18543 1.75 0.0438
Residual 139 14.701 0.10576
Total 167 24.568
Fig. 3. nMDS ordination based on meiobenthos in each of the sampling stations in each “area” (Oligohaline, Mesohaline, Polyhaline North Arm, Polyhaline South Arm and
Euhaline) and “sampling occasion” (Summer 06, Autumn 06, Winter 07, Spring 07, Summer 09 and Autumn 09).

468 A.S. Alves et al. / Ecological Indicators 24 (2013) 462–475
Fig. 4. Nematode community in each “area” (Oligohaline, Mesohaline, Polyhaline North Arm, Polyhaline South Arm and Euhaline) during the study period (Su06, Summer
2006; Au06, Autumn 2006; Wi07, Winter 2007; Sp07, Spring 2007; Su09, Summer 2009; Au09, Autumn 2009). (A) Average density (ind 10 cm−2); (B) number of genera (S).
density (±sd) was highest in Wi07 (363.40 ± 343.16 ind 10 cm−2),
and lowest during Au09 (123.04 ± 154.79 ind 10 cm−2). Generally,
the highest densities were reached in the Euhaline and Polyha
line areas (Fig. 4A). PERMANOVA analysis of density data showed
a significant interaction between “area” and “sampling occasion”
(Table 2B). Individual pairwise comparisons on interaction factor
(“area” × “sampling occasion”) showed that the Oligohaline area, in
general, showed significantly lower density values than the other
areas, regardless of the sampling occasion. Moreover, the Polyha
line NA did not show significant differences through time while
all other areas showed significant differences in density between
one or more sampling occasions (see Supplementary material –
Annex).
Nematodes accounted for between 88% (Su06) and 95% (Au06)
of the total meiofaunal density and a total of 106 nematode genera,
belonging to 40 families, were identified along the estuary during
the study period. The most abundant orders were Chromadorida
(46.3%), Monhysterida (36.7%) and Enoplida (11.7%) and the most
abundant families were Comesomatidae (25.3%), Xyalidae (16.7%),
Linhomoeidae (11.8%), Chromadoridae (10.3%) and Sphaerolaimi
dae (8.6%).
The number of genera (S) ranged between 8 in the Polyhaline
NA area (Su09) and 19 in the Euhaline area (Su06) (Fig. 4B). PER
MANOVA revealed a significant interaction of factors “area” and
“sampling occasion” for the number of genera (Table 2B). The pair
wise tests performed on the interaction term showed that in Au06,
Sp07 and Au09 there were no significant differences in number
of genera between areas, while in the remaining sampling occa
sions the Euhaline area showed higher diversity than the other
areas. All areas showed significant variation in the number of gen
era between at least two sampling occasions (see Supplementary
material – Annex).

A.S. Alves et al. / Ecological Indicators 24 (2013) 462–475 469
Table 3
Average density (x̄; number individuals per 10 cm2), percentage of contribution (%) and rank by density (Rk) of nematode genera in each area of the Mondego estuary derived
from pooled data from all sampling occasions. Table only lists the genera that contributed >0.5% to the total density and the five most abundant genera in each area are
bolded.
Genera Total average
density
% Euhaline Polyhaline SA Polyhaline NA Mesohaline Oligohaline
x̄ % Rk x̄ % Rk x̄ % Rk x̄ % Rk x̄ % Rk
Sabatieria 249.9 23.5 38.5 10.9 2 87.5 31.9 1 121.7 51.9 1 1.6 1.0 12 0.5 1.1 16
Daptonema 163.1 15.3 36.4 10.3 3 45.9 16.7 3 22.2 9.5 3 47.6 29.8 1 11.1 25.8 1
Terschellingia 86.7 8.2 7.3 2.1 13 49.3 18.0 2 7.8 3.3 7 21.6 13.5 3 0.8 1.8 12
Metachromadora 86.0 8.1 76.7 21.8 1 5.6 2.0 9 3.6 1.5 10 0.1 0.0 45 0.1 0.1 47
Sphaerolaimus 84.6 8.0 18.9 5.4 6 34.9 12.7 4 22.2 9.5 2 8.5 5.3 6 0.1 0.3 30
Anoplostoma 75.5 7.1 25.3 7.2 5 9.5 3.5 6 10.2 4.3 5 28.2 17.7 2 2.2 5.2 4
Dichromadora 47.1 4.4 5.0 1.4 18 5.5 2.0 10 20.9 8.9 4 13.6 8.5 4 2.2 5.1 5
Viscosia 37.0 3.5 14.4 4.1 7 8.9 3.3 7 9.1 3.9 6 4.3 2.7 8 0.3 0.7 19
Ptycholaimellus 35.4 3.3 8.4 2.4 11 10.5 3.8 5 4.8 2.1 8 10.4 6.5 5 1.3 3.1 7
Microlaimus 30.1 2.8 29.7 8.4 4 0.4 0.2 16 0.0 0.1 56
Linhomoeus 18.5 1.7 8.8 2.5 10 7.7 2.8 8 1.8 0.8 11 0.1 0.0 38 0.1 0.3 28
Axonolaimus 14.4 1.4 11.1 3.2 8 0.1 0.0 26 0.5 0.2 14 1.6 1.0 11 1.0 2.4 9
Paracyatholaimus 13.4 1.3 2.4 0.7 22 0.1 0.0 28 0.3 0.1 17 7.4 4.6 7 3.3 7.6 3
Mesodorylaimus 12.5 1.2 0.4 0.1 35 2.8 1.7 10 9.4 21.8 2
Prochromadorella 11.0 1.0 10.7 3.0 9 0.1 0.0 27 0.1 0.1 23
Leptolaimus 8.4 0.8 1.5 0.4 27 0.6 0.2 16 4.5 1.9 9 1.4 0.9 13 0.4 0.9 18
Molgolaimus 8.0 0.8 7.7 2.2 12 0.2 0.1 25 0.1 0.0 28 0.1 0.0 40
Calyptronema 7.0 0.7 6.4 1.8 14 0.7 0.2 15
Chromadora 6.4 0.6 5.2 1.5 16 0.6 0.2 17 0.5 0.2 13
Spilophorella 5.6 0.5 0.2 0.1 23 1.7 0.7 12 3.5 2.2 9 0.1 0.3 29
Aegialoalaimus 5.5 0.5 5.5 1.6 15
Halalaimus 5.4 0.5 3.9 1.1 20 0.9 0.3 13 0.3 0.1 18 0.2 0.1 26 0.2 0.4 26
Paralinhomoeus 5.2 0.5 5.1 1.4 17 0.1 0.0 41
Oncholaimellus 5.0 0.5 4.7 1.3 19 0.2 0.1 29 0.1 0.1 40
Other genera 41.3 3.9 17.8 5.1 5.3 1.9 1.9 0.8 6.5 4.1 9.8 22.8
Mean density 351.7 274.0 234.8 159.6 43.0
Total genera number 53 33 35 58 84
Throughout the study period, fifteen genera dominated
the nematode assemblages (90.8%): Sabatieria, Daptonema, Terschellingia, Metachromadora, Sphaerolaimus, Anoplostoma, Dichromadora, Viscosia, Ptycholaimellus, Microlaimus, Linhomoeus, Axonolaimus, Paracyatholaimus, Mesodorylaimus and Prochromadorella(Table 3). The remaining genera all represented abundances lower
than 1%. The most spatially widespread genus was Daptonema
(present along the whole length of the estuary through the
entire sampling period), followed by Sabatieria and Dichromadora
(Table 3). Freshwater nematodes comprised 3.5% of the total nema
todes density (1% in Sp07 to 4.4% in Wi07).
The five dominant genera showed clear variation over the
study period, as shown in Fig. 5, and a distinct pattern of gen
era turnover along the estuary is visible. Nonselective deposit
feeders (1B) like Sabatieria and Daptonema, showed an opposite
density contribution trend in the Polyhaline areas, with the contri
bution of Sabatieira increasing from Wi07 to Au09, and Daptonemadecreasing in the same period. Sabatieria was almost absent in
the Mesohaline and Oligohaline areas, where Daptonema showed
a high contribution. Terschellingia, a selective deposit feeder (1A),
showed high contributions in Wi07, especially in the Polyhaline
SA and Mesohaline areas. Predators (2B), like Metachromadoraand Sphaerolaimus, peaked on different sampling occasions, with
a high contribution of Metachromadora in the Euhaline area, while
Sphaerolaimus was mostly observed in the Polyhaline NA (Au06)
and Mesohaline (Wi07) areas.
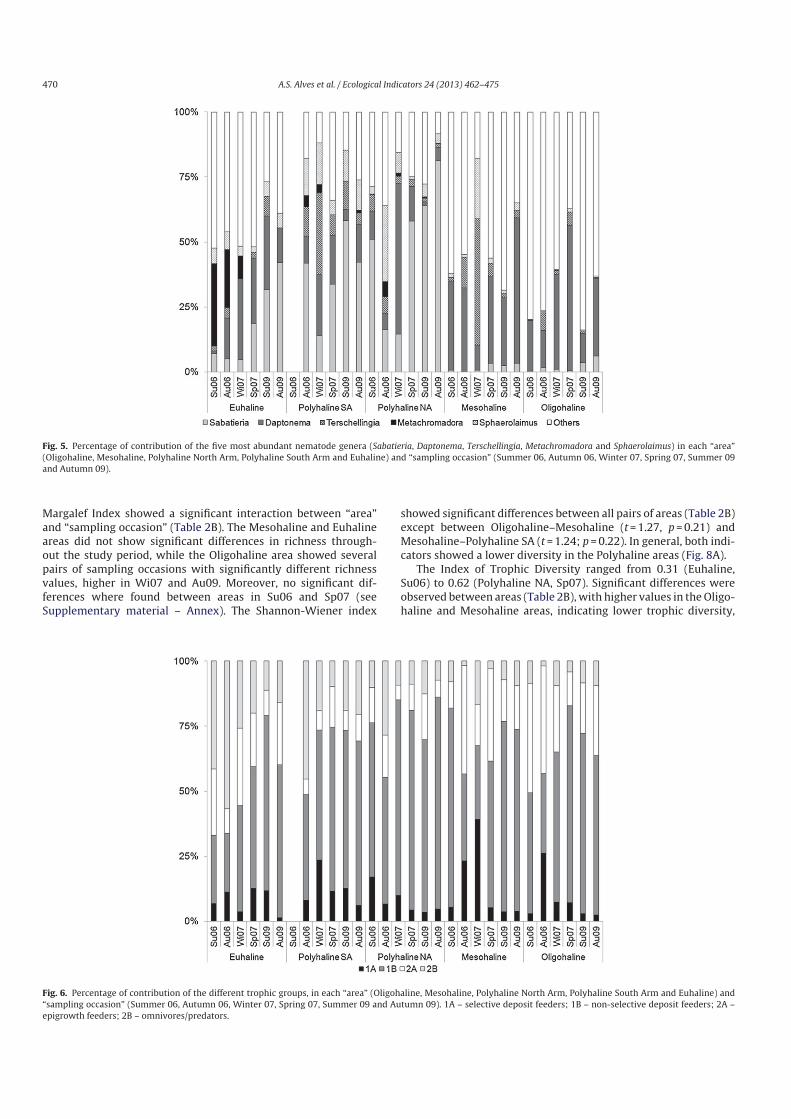
Throughout the estuary, the nematodes community was
characterized by a dominance of nonselective deposit feeders
(52.0 ± 12.1%) during the entire study period, followed by omni
vores/predators (23.2 ± 8.1%), epigrowth feeders (15.9 ± 3.3%) and
selective deposit feeders (8.9 ± 4.8%). Nonselective deposit feed
ers were the most abundant trophic group, in almost all areas
and sampling occasions, ranging from 22.5% (Euhaline area, Au06)
to 81.6% (Polyhaline NA area, Au09). In the Mesohaline and
Oligohaline areas there was a lower contribution of predators on all
sampling occasions (ranging from 1.7% in Au06 to 16.6% in Wi07,
both in the Mesohaline area) compared with the remaining areas
(ranging from 7.3% in Au09, Polyhaline NA area to 56.7% in Au06,
Euhaline area) (Fig. 6). PERMANOVA analysis of trophic structure
data showed a significant interaction between factor “area” and
“sampling occasion” (Table 2B). Individual pairwise comparisons
performed on the interaction factor showed significant differences
in trophic composition between areas on all sampling occasions
and also significant differences at each area throughout the study
period (see Supplementary material – Annex).
Regarding the overall composition, multivariate PERMANOVA
analysis showed that the estuarine assemblages were different
between areas and sampling occasions (Table 2B). In concrete,
depending on the chosen area, there were significant differ
ences between distinct pair of sampling occasions. The results are
supported by a visual assessment of the patterns in the nMDS
ordination of squareroot transformed data, using Bray–Curtis, as
shown in Fig. 7.
Twoway SIMPER analysis showed how the nematodes gen
era contributed to similarity values of the a priori defined groups.
Maximum dissimilarities were obtained between the Oligohaline
area and both the Polyhaline areas (80.15% with Polyhaline SA and
79.57% with Polyhaline NA) and Euhaline area (79.78%). Maximum
dissimilarities were also observed between Summer 06 and the fol
lowing three sampling occasions, Autumn 06 (71.57%), Winter 07
(68.59%) and Spring 07 (68.58%). The genera that contributed most
to the similarity within both sampling occasions and areas were
Daptonema, Sabatieria, Sphaerolaimus and Dichromadora.
3.3.2. Indices estimationMargalef Index (d) and ShannonWiener index values (H′)
(Fig. 8A), followed the trend shown by the number of genera
(Spearman correlation = 0.74 and 0.72, respectively; p < 0.05). The
470 A.S. Alves et al. / Ecological Indicators 24 (2013) 462–475
Fig. 5. Percentage of contribution of the five most abundant nematode genera (Sabatieria, Daptonema, Terschellingia, Metachromadora and Sphaerolaimus) in each “area”
(Oligohaline, Mesohaline, Polyhaline North Arm, Polyhaline South Arm and Euhaline) and “sampling occasion” (Summer 06, Autumn 06, Winter 07, Spring 07, Summer 09
and Autumn 09).
Margalef Index showed a significant interaction between “area”
and “sampling occasion” (Table 2B). The Mesohaline and Euhaline
areas did not show significant differences in richness through
out the study period, while the Oligohaline area showed several
pairs of sampling occasions with significantly different richness
values, higher in Wi07 and Au09. Moreover, no significant dif
ferences where found between areas in Su06 and Sp07 (see
Supplementary material – Annex). The ShannonWiener index
showed significant differences between all pairs of areas (Table 2B)
except between Oligohaline–Mesohaline (t = 1.27, p = 0.21) and
Mesohaline–Polyhaline SA (t = 1.24; p = 0.22). In general, both indi
cators showed a lower diversity in the Polyhaline areas (Fig. 8A).
The Index of Trophic Diversity ranged from 0.31 (Euhaline,
Su06) to 0.62 (Polyhaline NA, Sp07). Significant differences were
observed between areas (Table 2B), with higher values in the Oligo
haline and Mesohaline areas, indicating lower trophic diversity,
Fig. 6. Percentage of contribution of the different trophic groups, in each “area” (Oligohaline, Mesohaline, Polyhaline North Arm, Polyhaline South Arm and Euhaline) and
“sampling occasion” (Summer 06, Autumn 06, Winter 07, Spring 07, Summer 09 and Autumn 09). 1A – selective deposit feeders; 1B – nonselective deposit feeders; 2A –
epigrowth feeders; 2B – omnivores/predators.

A.S. Alves et al. / Ecological Indicators 24 (2013) 462–475 471
Fig. 7. nMDS ordination based on nematodes dataset in each “area” (Oligohaline, Mesohaline, Polyhaline North Arm, Polyhaline South Arm and Euhaline) and “sampling
occasion” (Summer 06, Autumn 06, Winter 07, Spring 07, Summer 09 and Autumn 09).
Table 4
BIOENV results carried out for nematodes assemblages and environmental data, in
each sampling occasion.
Sampling occasion Spearman’s rank
correlation
Variables
Summer 2006 0.938 Salinity, NO3− , mean sand,
coarse sand, Chl aAutumn 2006 0.245 pH, fine sand, coarse sand
Winter 2007 0.636 Salinity, pH, mean sand
Spring 2007 0.839 Salinity, NO3−
Summer 2009 0.862 Salinity, NO3−
Autumn 2009 0.642 NO3− , silicates, %OM, mean
sand
and lower values in the Polyhaline and Euhaline areas (Polyhaline
NA > Polyhaline SA, Polyhaline NA > Euhaline), indicative of a higher
trophic diversity (Fig. 8B).
The Maturity Index (MI) ranged between 2.1 (Polyhaline NA in
Wi07, Sp07, Su09 and Au09; Mesohaline in Su06 and Sp07) and
3.0 (Oligohaline, Su06) (Fig. 8B) and most nematodes showed a c–pvalue of 2 (average = 70%), followed by c–p values of 3 (26%). The
MI showed a significant interaction between the factors “area” and
“sampling occasion” (Table 2B). Individual pairwise comparisons
performed on the interaction revealed no seasonal differences in
the Polyhaline SA area. The MI values of the Mesohaline area exhib
ited the highest temporal variations. Interestingly, in Au06 (flood
period), no significant differences in MI were recorded along the
estuary.
3.4. Environmental variables vs. nematode assemblages
Separate BIOENV analysis were performed for each sampling
occasion in order to analyze the main factors responsible for the
distribution of nematodes along the estuary in each sampling occa
sion, with salinity, grain size variables and nutrients always being
correlated with the nematode assemblage composition (Table 4).
4. Discussion
The combination of the temporal and spatial information on
meiofauna and nematodes of the Mondego estuary allowed a full
description of the meiobenthic communities along the estuarine
gradient to me made. The information was then analyzed in the
context of the ecological assessment of transitional waters using
these communities, making available information on the ecologi
cal conditions of the system and initiating a baseline for longterm
monitoring studies. Previous studies have only been focused on
one season, lacking temporal replication (Alves et al., 2009; Adão
et al., 2009; Patrício et al., 2012), and the present study, as well
as integrating the complete estuarine gradient, was repeated on
six sampling occasions, allowing a more extensive database to be
analyzed and related to the environmental gradient.
The environmental characterization of the Mondego estuary
was based on abiotic measurements collected at each sampling
event. The characterization of a system based on chemical param
eters only provides information about quality at the time of
measurement, lacking the sensitivity to determine the impact of
previous events on the ecology of the system (Spellman and Drinan,
2001). However, bioindicators provide indications about past con
ditions and accurately assess ecological conditions it is necessary
to use a set of indicators which represent the structure, function
and composition of the system. In this study, meiobenthic commu
nities were studied in detail, with special emphasis on nematodes
assemblages.
A clear estuarine gradient, from the oligohaline area toward
the euhaline zone was observed during the survey period, mainly
caused by variations in salinity, nutrient concentrations and sed
iment grain size. The identification of both arms of the Mondego
estuary as two different subsystems was confirmed, represent
ing distinct hydrological regimes. Salinity increased from upstream
toward the mouth of the estuary on all sampling occasions except in
Autumn 2006. During this season, a period of heavy rain and flood
ing occurred (INAG source), lowering salinity values and confirming
the importance of extreme events in changing the environmental
characteristics of estuaries. The nematode community was affected
at this time since the separation of salinity zones along the estuary
was not so distinct. The severe flood may have caused sediment
displacement and erosion as well as changing the interstitial water
salinity (Santos et al., 1996), and organisms may have been washed
away, leading to the low density values observed during this season.
Both salinity and sediment structure are major factors influ
encing meiobenthic community structure (Heip et al., 1985) and
results from the BIOENV analysis showed that the distribution
pattern of nematodes was mainly structured by distinct environ
mental factors like salinity, sediment grain size and water nutrients,
supporting the primary influence of the estuarine gradient on

472 A.S. Alves et al. / Ecological Indicators 24 (2013) 462–475
Fig. 8. Ecological indicators values in each “area” (Oligohaline, Mesohaline, Polyhaline North Arm, Polyhaline South Arm and Euhaline) and “sampling occasion” (Summer 06,
Autumn 06, Winter 07, Spring 07, Summer 09 and Autumn 09). (A) Margalef Index (d ± standard deviation) and ShannonWiener index (H′ ± standard deviation) (bits ind−1);
(B) Index of Trophic Diversity (ITD ± standard deviation) and Maturity Index (MI ± standard deviation).
nematode community patterns (Austen and Warwick, 1989; Vincx
et al., 1990; Coull, 1999; Ferrero et al., 2008; Schratzberger et al.,
2008; Adão et al., 2009). However, despite the other environ
mental differences between the polyhaline areas, the meiofauna
and nematode communities were similar, emphasizing the prime
importance of salinity in defining and limiting species distribu
tion in transitional water systems (Austen and Warwick, 1989;
Vincx et al., 1990; Soetaert et al., 1995; Attrill, 2002; Ferrero et al.,
2008), its effects overriding that of sediment grain size composition
(Austen and Warwick, 1989; Adão et al., 2009).
Meiofauna density and diversity were similar to other meio
fauna communities, with densities falling within the range
observed in other European estuaries (Smol et al., 1994; Soetaert
et al., 1994, 1995). The dominance of nematodes over all other
taxa is well documented, with Nematoda typically being the most
abundant taxon (usually 60–90%) (Coull, 1999). Polychaeta ranked
second, contrary to the common observation that copepods are
usually more abundant (Coull, 1999). Harpacticoid copepods are
sensitive to environmental perturbation (Hicks and Coull, 1983;
Van Damme et al., 1984) and the low densities observed may

A.S. Alves et al. / Ecological Indicators 24 (2013) 462–475 473
indicate anthropogenic disturbances in the Mondego estuary. Low
density of harpacticoid copepods was also observed in the West
erschelde (Van Damme et al., 1984; Soetaert et al., 1995) and was
ascribed to pollution effects.
The increase in taxonomic resolution (from meiofauna major
taxa to nematode genus level) enhanced our knowledge of the sys
tem, suggesting that higher taxonomic resolution may be more
informative for measurement of changes in meiofauna commu
nity structure. However, some studies of meiofauna communities
as indicators of status in marine environments (Schratzberger et al.,
2000) and as indicators of pollution in harbors (Moreno et al.,
2008), for instance, have shown that meiofauna taxon assemblages
could provide a sensitive and clear measure of environmental status
when comparing inshore and offshore locations and that indicators
based on meiofauna taxa demonstrated a significant correlation
with the concentration of contaminants.
Nematodes communities comprised a high number of genera
but with few dominant ones, as observed in other estuaries (Austen
et al., 1989; Li and Vincx, 1993; Soetaert et al., 1995; Rzeznik
Orignac et al., 2003; Steyaert et al., 2003; Ferrero et al., 2008).
The dominant genera were similar to those found in the Brouage
mudflat (France) (RzeznikOrignac et al., 2003) and in the Thames
estuary (United Kingdom) (Ferrero at al., 2008), indicating that
species that are able to tolerate the highly variable salinity in estu
aries tend to be abundant, taking advantage of the plentiful food
resources of estuaries (Hourston et al., 2011). Also, the wide dis
tribution range of Daptonema, Sabatieria and Dichromadora, also
observed by Ferrero et al. (2008), reflects the wide salinity range
tolerated by these genera (Heip et al., 1985; Moens and Vincx,
2000; Ferrero et al., 2008). Moreover, Sabatieria, Daptonema and
Terschellingia, the three most abundant genera in the present study,
are known to be tolerant to pollution (Soetaert et al., 1995; Austen
and Somerfield, 1997; Schratzberger et al., 2006; Steyaert et al.,
2007; Gambi et al., 2009; Armenteros et al., 2009), and their high
densities along the Mondego estuary may be indicative of the pres
sures from which this estuary suffers. In fact, Moreno et al. (2011),
in an evaluation of the use of nematodes as biological indicators
of environmental quality in sediments of the Mediterranean Sea
stated that the presence of some genera provided accurate informa
tion on the ecology and adaptation of organisms to environmental
conditions. In this study, disturbed places were characterized by
a high density of Terschellingia, Paracomesoma and Sabatieira, and
sites classified as in moderate or poor ecological quality status were
also dominated by Daptonema, indicating that such inhospitable
habitat conditions can only be tolerated by genera able to thrive in
extreme conditions (Moreno et al., 2008).
Genera diversity broadly followed the Remane’s diagram (1934)
for the effect of the salinity gradient on benthic invertebrates
species richness (postulated for the Baltic Sea), with high diver
sity in the more stable marine and freshwater waters. According to
Attrill (2002), salinity variation over time may be more important
than average salinity for the distribution of nematodes along the
estuary (also confirmed by Ferrero et al., 2008).
The premise that environmental variables influence meioben
thic communities is well described, but the question of how far
back we should consider the environmental history of a system in
order to explain the distribution of the communities depends on
the lifehistory characteristics of the species and, coupled with the
characterization of the environment, extreme events should also
be taken in consideration (Soetaert et al., 1995).
Spatial variability, with the transition between areas being char
acterized by different assemblages and with strong variations in
genera dominance, was detected. The shift from an oligohaline
nematode community, characterized by low density, high nema
tode diversity and high abundance of Daptonema, to a typical
estuarine community, characterized by high nematode density,
was observed, as in the Thames estuary (Ferrero et al., 2008). The
remaining areas were also discrete, each one characterized by a dif
ferent community, with the exception of the Polyhaline areas (see
above).
In the present study, besides the clear spatial pattern, some tem
poral variations were also observed. Similar results were observed
in the Swan River estuary, Australia (Hourston et al., 2009), with
nematode species being markedly influenced by both site and
season, with site being the most important factor. In temperate
regions, nematode densities usually peak in the warmest months
(Hicks and Coull, 1983; Smol et al., 1994) and in this study, although
the highest density was observed in Summer 2006, the pattern was
not repeated in the other warm seasons.
The multivariate analysis allowed a representation of both
environmental and biological (meiofauna and nematodes) data,
showing that the estuarine abiotic gradient was mostly reflected
in the biological communities.
Spatial and temporal variations of nematode assemblages has
been studied in several systems (e.g. Yodnarasri et al., 2008;
Armenteros et al., 2009; Hourston et al., 2009, 2011; Semprucci
et al., 2010) and, in order to use that information for ecological
assessment, the application of ecological indices to the nematodes
assemblages enhanced our knowledge on the benthic environ
ment. Coupled with the taxonomic diversity, functional diversity
is important for interpreting distribution patterns of the commu
nities (Schratzberger et al., 2008). In what refers to meiobenthic
communities, and besides the common diversity measures, spe
cific indicators rely on nematodes information, such as the Maturity
Index and the Index of Trophic Diversity. These two indices do
not depend on the system, not suffering from lack of generality
and the use of indicators based on different ecological principles
is, according to Dauer et al. (1993) highly recommended in deter
mining the environmental quality status of an ecosystem (Marques
et al., 2009).
Knowing that the Mondego estuary suffers from anthropogenic
pressures, especially in the Polyhaline areas (Northern arm – dredg
ing activities, harbor; Southern arm – inputs from the Pranto River
and agricultural runoffs), we can evaluate the performance of the
indices in differentiating homogeneous sectors of impact along the
estuary. The results verified that the indices behaved differently.
For example, the Index of Trophic Diversity, generally used to cor
relate trophic diversity with pollution levels (Heip et al., 1985),
appeared only to differentiate “extreme” conditions such as the
relatively good ecological conditions in the mouth of the estuary
(reflected in high trophic diversity index values) and the upstream
part of the estuary having lower ecological status. In the upstream
zone, the incorporation of feeding information on the freshwater
genera, mostly predators, may have contributed to the observed
pattern. However, if this dominance is a natural feature in estu
aries, the parameters of this index should be readjusted so that
the predominance of freshwater nematodes does not exclusively
imply a classification of bad ecological conditions. A similar result
was observed by Moreno et al. (2011), with the ITD not separating
sites with different ecological classifications and even indicating a
good Ecological Quality Status in disturbed sites.
Furthermore, the classification of feeding complexity, as first
described by Wieser (1953), has the disadvantage of confining
nematode species to a single trophic status (Heip et al., 1985),
which may not represent the real complexity of feeding habitats of
nematodes (Moens and Vincx, 1997), with trophic plasticity being
described for most feeding types (Moens et al., 2005; Schratzberger
et al., 2008).
On the other hand, the low Maturity Index values observed in
both the polyhaline and euhaline areas suggested a high stress level,
since opportunistic genera increase in abundance in adverse condi
tions (Bongers and Bongers, 1998; GyeduAbabio and Baird, 2006).

474 A.S. Alves et al. / Ecological Indicators 24 (2013) 462–475
An opposite trend was observed in the oligohaline area, where the
MI reached maximum values, indicating a better ecological status,
with the MI also capturing the composition variations that occurred
in the upstream area over time (higher dispersion of oligohaline
samples in the nMDS). These observations may be related to the
origin of the index which, contrary to the Index of Trophic Diver
sity, was developed for soil and freshwater nematodes (Bongers
and Bongers, 1998) and lately extended to assessing the condition
of marine and brackish sediments, being less frequently applied to
marine nematodes (Bongers et al., 1991), partly due to a lack of
empirical support for the classification of some marine genera and
the absence or rarity of extreme colonizers and persisters in most
marine habitats (Schratzberger et al., 2006). According to Moreno
et al. (2011), the analysis of the percentage composition of the dif
ferent c–p classes in each site allowed a better classification of the
studied sites than the application of the MI.
This study emphasized the need for the development of
a nematodebased multimetric index (Patrício et al., 2012),
taking in consideration density, composition, and genera sensi
tivity/tolerance to stress, as proposed by Moreno et al. (2011).
Moreover, this multimetric index should include information with
parameters more accurately based on marine/estuarine nematodes
including maturity and trophic values specifically calculated for the
genera. There is also the need for reevaluation of the boundaries
of the indices used, as an index can provide a good characteriza
tion of the system but may be limited to a specific spatial area. The
correct application of nematode information and its integration
into a multimetric index, with a suitable combination of several
indicators, would provide clearer information regarding ecosys
tem status, since it would overcome the limitations of individual
analyses. It is also important to bear in mind that the evaluation
of reference conditions in order to provide comparisons with dis
turbed environments is usually required. Since meiobenthic studies
are quite recent in Portuguese estuaries, it may be interesting to
determine if the analysis of meiobenthic communities in an estu
ary where human perturbations are almost absent (Mira estuary –
Alves et al., 2009; Adão et al., 2009) may be used in the establish
ment of reference conditions.
Acknowledgements
The present study was carried out using funds provided by the
research projects RECONNECT (PTDC/MAR/64627/2006) and 3M
RECITAL (LTER/BIABEC/0019/2009). Additionally, it benefited from
one grant, given by FCT – (SFRH/BD/62000/2009). The study was
also subsidized by the European Social Fund and MCTES national
funds, through the QREN and POPH: Human Potential Operational
Programme – NSRF: National Strategic Reference Framework – 4.4.
A special thanks to all who assisted us during field and laboratory
work. The senior author (J. Patrício) provided a major contribution
as project’s leader.
Appendix A. Supplementary data
Supplementary data associated with this article can
be found, in the online version, at http://dx.doi.org/
10.1016/j.ecolind.2012.07.013.
References
Abebe, E., Traunspurger, W., Andrássy, I., 2006. Freshwater Nematodes: Ecology andTaxonomy. CABI Publishing, Oxfordshire, UK, 752 pp.
Adão, H., Alves, A., Patrício, J., Neto, J.M., Costa, M.J., Marques, J.C., 2009. Spatialdistribution of subtidal Nematoda communities along the salinity gradient intwo Southern European estuaries (Portugal). Acta Oecol. 35, 287–300.
Alves, A.S., Adão, H., Patrício, J., Neto, J.M., Costa, M.J., Marques, J.C., 2009. Spatialdistribution of subtidal meiobenthos along estuarine gradients in two SouthernEuropean estuaries (Portugal). J. Mar. Biol. Assoc. U. K. 89 (8), 1529–1540.
Anderson, M.J., Gorley, R.N., Clarke, K.R., 2008. PERMANOVA A+ for PRIMER: Guideto Software and Statistical Methods. PRIMERE, Plymouth, UK.
Armenteros, M., RuizAbierno, A., FernándezGarcés, R., PérezGarcía, J.A., DíazAsencio, L., Vincx, M., Decraemer, W., 2009. Biodiversity patterns of freelivingmarine nematodes in a tropical bay: Cienfuegos, Caribbean Sea. Estuar. Coast.Shelf Sci. 85, 179–189.
Attrill, M.J., 2002. A testable linear model for diversity trends in estuaries. J. Anim.Ecol. 71, 262–269.
Austen, M.C., Somerfield, P.J., 1997. A community level sediment bioassay appliedto an estuarine heavy metal gradient. Mar. Environ. Res. 43, 315–328.
Austen, M.C., Widdicombe, S., 2006. Comparison of the response of meio and macrobenthos to disturbance and organic enrichment. J. Exp. Mar. Biol. Ecol. 330,96–104.
Austen, M.C., Warwick, R.M., Rosado, M.C., 1989. Meiobenthic and macrobenthiccommunity structure along a putative pollution gradient in Southern Portugal.Mar. Pollut. Bull. 20, 398–405.
Austen, M.C., Warwick, R.M., 1989. Comparison of univariate and multivariateaspects of estuarine meiobenthic community structure. Estuar. Coast. Shelf Sci.29, 23–42.
Bongers, T., 1990. The Maturaty Index: an ecological measure of environmentaldisturbance based on nematode species composition. Oecologia 83, 14L 19.
Bongers, T., Ferris, H., 1999. Nematode community structure as a bioindicator inenvironmental monitoring. Trends Ecol. Evol. 14, 224–228.
Bongers, T., Alkemade, R., Yeates, G.W., 1991. Interpretation of disturbanceinducedmaturity decrease in marine nematode assemblages by means of Maturity Index.Mar. Ecol. Prog. Ser. 76, 135–142.
Bongers, T., Bongers, M., 1998. Functional diversity of nematodes. Appl. Soil Ecol. 10,239–251.
Bouwman, L.A., 1983. A survey of Nematoda from the Ems estuary: species assemblages and associations. Zool. Jahrb. System. Okol. Geogr. Tiere 110, 345–376.
Brown, A.C., McLachlan, A., 1990. Ecology of Sandy Shores. Elsevier, Amsterdam.Clarke, K.R., 1993. Nonparametric multivariate analyses of changes in community
structure. Aust. J. Ecol. 18, 117–143.Clarke, K.R., Green, R.H., 1988. Statistical design and analysis for a ‘biological effects’
study. Mar. Ecol. Prog. Ser. 46, 213–226.Clarke, K.R., Ainsworth, M., 1993. A method of linking multivariate community struc
ture to environmental variables. Mar. Ecol. Prog. Ser. 92, 205–219.Clarke, K.R., Warwick, R.M., 2001. Changes in Marine Communities: An Approach to
Statistical Analysis and Interpretation, second ed. PrimerE, Plymouth.Coull, B.C., 1999. Role of meiofauna in estuarine softbottom habitats. Aust. J. Ecol.
24, 327–343.Coull, B.C., Chandler, G.T., 1992. Pollution and meiofauna: field, laboratory and meso
cosm studies. Oceanogr. Mar. Biol.: Annu. Rev. 30, 191–271.Danovaro, R., Gambi, C., Dell’Anno, A., Corinaldesi, C., Fraschetti, S., Vanreusel, A.,
Vincx, M., Gooday, A.J., 2008. Exponential decline of deepsea ecosystem functioning linked to benthic biodiversity loss. Curr. Biol. 18, 1–8.
Dauer, D.M., Luckenbach, M.W., Rodi Jr., A.J., 1993. Abundance biomass comparison (ABC method): effects of an estuarine gradient, anoxic/hypoxic events andcontaminated sediments. Mar. Biol. 116, 507–518.
Derycke, S., Hendrickx, F., Backeljau, T., D’Hondt, S., Camphijn, L., Vincx, M., Moens,T., 2007. Effects of sublethal abiotic stressors on population growth and geneticdiversity of Pellioditis marina (Nematoda) from the Westerschelde estuary.Aquat. Toxicol. 82, 110–119.
Ferrero, T.J., Debenham, N.J., Lambshead, P.J.D., 2008. The nematodes of the Thamesestuary: assemblage structure and biodiversity, with a test of Attrill‘s linearmodel. Estuar. Coast. Shelf Sci. 79, 409–418.
Forster, S.J., 1998. Osmotic stress tolerance and osmoregulation of intertidal andsubtidal nematodes. J. Exp. Mar. Biol. Ecol. 224, 109–125.
Flindt, M.R., KampNielsen, L., Marques, J.C., Pardal, M.A., Bocci, M., Bendoricchio, G.,Salomonsen, J., Nielsen, S.N., Jørgensen, S.E., 1997. Description of three shallowestuaries: Mondego river (Portugal), Roskilde Fjord (Denmark) and the lagoonof Venice (Italy). Ecol. Model. 102, 17–31.
Gambi, C., Bianchelli, S., Pérez, M., Invers, O., Ruiz, J.M., Danovaro, R., 2009. Biodiversity response to experimental induced hypoxic–anoxic conditions in seagrasssediments. Biodivers. Conserv. 18, 33–54.
Giere, O., 2009. Meiobenthology: The Microscopic Motile Fauna of Aquatic Sediments, second ed. SpringerVerlag, Berlin.
GyeduAbabio, T.K., Baird, D., 2006. Response of meiofauna and nematode communities to increased levels of contaminants in a laboratory microcosm experiment.Ecotoxicol. Environ. Saf. 63 (3), 443–450.
Heip, C.H., Vincx, M., Vranken, G., 1985. The ecology of marine Nematoda. Oceanogr.Mar. Biol.: Annu. Rev. 23, 399–489.
Hicks, G.R.F., Coull, B.C., 1983. The ecology of marine meiobentic harpacticoid copepods. Oceanogr. Mar. Biol.: Annu. Rev. 21, 67–175.
Higgins, P.R., Thiel, H., 1988. Introduction to the Study of Meiofauna. SmithsonianInstitution Press, Washington, DC.
Hourston, M., Potter, I.C., Warwick, R.M., Valesini, F.J., Clarke, K.R., 2009. Spatialand seasonal variations in the ecological characteristics of the freeliving nematode assemblages in a large microtidal estuary. Estuar. Coast. Shelf Sci. 82, 309–322.
Hourston, M., Potter, I.C., Warwick, R.M., Valesini, F.J., 2011. The characteristics ofthe nematode faunas in subtidal sediments of a large microtidal estuary andnearshore coastal waters differ markedly. Estuar. Coast. Shelf Sci. 94, 68–76.

A.S. Alves et al. / Ecological Indicators 24 (2013) 462–475 475
Kennedy, A.D., Jacoby, C.A., 1999. Biological indicators of marine environmentalhealth: meiofauna – a neglected benthic component? Environ. Monit. Assess.54, 47–68.
Li, J., Vincx, M., 1993. The temporal variation of intertidal nematodes in the Westerschelde. I. The importance of an estuarine gradient. Neth. J. Aquat. Ecol. 27,319–326.
Li, J., Vincx, M., Herman, P.M.J., Heip, C.H., 1997. Monitoring meiobenthos using cm,m and kmscales in the Southern Bight of the North Sea. Mar. Environ. Res. 34,265–278.
Limnologisk Metodik, 1992. In: Universitet Københavns (Ed.), FerskvandsbiologiskLaboratorium. Akademisk Forlag, København, pp. 113–119.
Marques, J.C., Nielsen, S.N., Pardal, M.A., Jørgensen, S.E., 2003. Impact of eutrophication and river management within a framework of ecosystem theories. Ecol.Model. 166, 147–168.
Marques, J.C., Salas, F., Patrício, J., Neto, J., Teixeira, H., 2009. Ecological Indicatorsfor Coastal and Estuarine Environmental Assessment – A User Guide. WIT Press,208 pp.
Moens, T., Vincx, M., 1997. Observations on the feeding ecology of estuarine nematodes. J. Mar. Biol. Assoc. U. K. 77, 211–227.
Moens, T., Vincx, M., 2000. Temperature and salinity constraints on the life cycle oftwo brackishwater nematode species. J. Exp. Mar. Biol. Ecol. 243, 115–135.
Moens, T., Bouillon, S., Gallucci, F., 2005. Dual stable isotope abundances unraveltrophic position of estuarine nematodes. J. Mar. Biol. Assoc. U. K. 85, 1401–1407.
Moreno, M., Ferrero, T.J., Gallizia, I., Vezzulli, L., Albertelli, G., Fabiano, M., 2008. Anassessment of the spatial heterogeneity of environmental disturbance within anenclosed harbour through the analysis of meiofauna and nematode assemblages.Estuar. Coast. Shelf Sci. 77, 565–576.
Moreno, M., Semprucci, F., Vezzulli, L., Balsamo, M., Fabiano, M., Albertelli, G., 2011.The use of nematodes in assessing ecological quality status in the Mediterraneancoastal ecosystems. Ecol. Ind. 11, 328–336.
Neto, J.M., Teixeira, H., Patrício, J., Baeta, A., Veríssimo, H., Pinto, R., Marques, J.C.,2010. The response of estuarine macrobenthic communities to natural andhumaninduced changes: dynamics and ecological quality. Estuaries Coasts 33,1327–1339.
Norling, K., Rosenberg, R., Hulth, S., Grémare, A., Bonsdorff, E., 2007. Importance offunctional biodiversity and speciesspecific traits of benthic fauna for ecosystemfunctions in marine sediment. Mar. Ecol. Prog. Ser. 332, 11–23.
Parsons, T.R., Maita, Y., Lally, C.M., 1985. Pigments. In: A Manual of Chemical andBiological Methods for Seawater Analysis. Pergamon Press, pp. 101–104.
Patrício, J., Adão, H., Neto, J.M., Alves, A.S., Traunspurger, W., Marques, J.C., 2012. Donematode and macrofauna assemblages provide similar ecological assessmentinformation? Ecol. Ind. 14, 124–137.
Platt, H.M., Warwick, R.M., 1983. Freeliving marine nematodes. Part I: British enoplids. Pictorial key to world genera and notes for the identification of Britishspecies. Synopses of the British Fauna (New Series), vol. 28. Cambridge University Press, Cambridge, 307 pp.
Platt, H.M., Warwick, R.M., 1988. Freeliving marine nematodes. Part II: British chromadorids. Pictorial key to world genera and notes for the identification of Britishspecies. Synopses of the British Fauna (New Series), vol. 38. E.J. Brill, Leiden, 502.
Remane, A., 1934. Die Brackwasserfauna. Zool. Anz. 7 (Suppl.), 34–74.RzeznikOrignac, J., Fichet, D., Boucher, G., 2003. Spatiotemporal structure of the
nematode assemblages of the Brouage mudflat (Marennes Oléron, France).Estuar. Coast. Shelf Sci. 58, 77–88.
Santos, P.J.P., Castel, J., SouzaSantos, L.P., 1996. Seasonal variability of meiofaunalabundance in the oligomesohaline area of the Gironde Estuary, France. Estuar.Coast. Shelf Sci. 43, 549–563.
Schratzberger, M., Gee, J.M., Rees, H.L., Boyd, S.E., Wall, C.M., 2000. The structure andtaxonomic composition of sublittoral meiofauna assemblages as an indicator ofthe status of the marine environment. J. Mar. Biol. Assoc. U. K. 80, 969–980.
Schratzberger, M., Whomersley, P., Kilbride, R., Rees, H.L., 2004. Structure and taxonomic composition of subtidal nematode and macrofauna assemblages at fourstations around the UK coast. J. Mar. Biol. Assoc. U. K. 84, 315–322.
Schratzberger, M., Bolam, S., Whomersley, P., Warr, K., 2006. Differential response ofnematode colonist communities to the intertidal placement of dredged material.J. Exp. Mar. Biol. Ecol. 334, 244–255.
Schratzberger, M., Maxwell, T.A.D., Warr, K., Ellis, J.R., Rogers, S.I., 2008. Spatial variability of infaunal nematode and polychaete assemblages in two muddy subtidalhabitats. Mar. Biol. 153, 621–642.
Semprucci, F., Boi, P., Manti, A., Covazzi Harriague, A., Rocchi, M., Colantoni, P., Papa,S., Balsamo, M., 2010. Benthic communities along a littoral of the Central AdriaticSea (Italy). Helgoland Mar. Res. 64, 101–115.
Sheppard, C., 2006. The muddle of “Biodiversity”. Mar. Pollut. Bull. 52, 123–124(Editorial).
Smol, N., Willems, K.A., Govaere, J.C., Sandee, A.J.J., 1994. Composition, distributionand biomass of meiobenthos in the Oosterschelde estuary (SW Netherlands).Hydrobiologia 282/283, 197–217.
Soetaert, K., Vincx, M., Wittoeck, J., Tulkens, M., Van Gansbeke, D., 1994. Spatial patterns of Westerschelde meiobentos. Estuar. Coast. Shelf Sci. 39, 367–388.
Soetaert, K., Vincx, M., Wittoeck, J., Tulkens, M., 1995. Meiobenthic distribution andnematode community structure in five European estuaries. Hydrobiologia 311,185–206.
Spellman, F.R., Drinan, J.E., 2001. Stream Ecology and Selfpurification: An Introduction, second ed. Taylor and Francis, Pennsylvania, USA, 261 pp.
Steyaert, M., Vanaverbeke, J., Vanreusel, A., Barranguet, C., Lucas, C., Vincx, M., 2003.The importance of finescale, vertical profiles in characterizing nematode community structure. Estuar. Coast. Shelf Sci. 58, 353–366.
Steyaert, M., Moodley, L., Nadong, T., Moens, T., Soetaert, K., Vincx, M., 2007.Responses of intertidal nematodes to shortterm anoxic events. J. Exp. Mar. Biol.Ecol. 345, 175–184.
Steyaert, M., Deprez, T., Raes, M., Bezerra, T., Demesel, I., Derycke, S., Desmet, G.,Fonseca, G., Franco, M.A., Gheskiere, T., Hoste, E., Ingels, J., Moens, T., Vanaverbeke, J., Van Gaever, S., Vanhove, S., Vanreusel, A., Verschelde, D., Vincx, M., 2005.Electronic Key to the Freeliving Marine Nematodes, http://nemys.ugent.be/.
Strickland, J.D.M., Parsons, T.R., 1972. A practical Handbook of Seawater Analysis. Fisheries Research Board of Canada Bulletin, vol. 167., second ed. FisheriesResearch Board of Canada, Ottawa, 311 pp.
Teixeira, H., Salas, F., Borja, A., Neto, J.M., Marques, J.C., 2008. A benthic perspectivein assessing the ecological status of estuaries: the case of the Mondego estuary(Portugal). Ecol. Ind. 8, 404–416.
Van Damme, D., Heip, C., Willems, K.A., 1984. Influence of pollution on the harpacticoid copepods of two North Sea estuaries. Hydrobiologia 112, 143–160.
Vincx, M., Meire, P., Heip, C., 1990. The distribution of the Nematoda communitiesin southern Bight of the North Sea. Cah. Biol. Mar. 31, 439–462.
Vincx, M., 1996. Meiofauna in marine and freshwater sediments. In: Hall, G.S. (Ed.),Methods for the Examination of Organismal Diversity in Soils and Sediments.Cab International, Wallinfort, UK, pp. 187–195.
Warwick, R.M., Gee, J.M., 1984. Community structure of estuarine meiobenthos. Mar.Ecol. Prog. Ser. 18, 97–111.
Warwick, R.M., Platt, H.M., Sommerfield, P.J., 1998. Freeliving nematodes (Part III)Monhysterids. In: Synopsis of British Fauna, No. 53. Barnes and Crothers.
Water Framework Directive, 2000/60/EC. Eur. Commun. Off. J. L327 (22.12.2000).Wieser, W., 1953. Die Beziehung zwischen Mundhöhlengestalt, Ernährungswiese
und 1000 Vorkommen bei freilebenden marinen Nematoden. Ark. Zool. 4,439–484.
Traunspurger, W., 1997. Bathymetric, seasonal and vertical distribution of thefeedingtypes of nematodes in an oligotrophic lake. Vie Milieu 47, 1–7.
Yeates, G.W., Bongers, T., De Goede, R.G.M., Freckman, D.W., Georgieva, S.S., 1993.Feeding habitats in soil nematode families and genera – an outline for soil ecologists. J. Nematol. 25 (3), 315–333.
Yodnarasri, S., Montani, S., Tada, K., Shibanuma, S., Yamada, T., 2008. Is there anyseasonal variation in marine nematodes within the sediments of the intertidalzone? Mar. Pollut. Bull. 57, 149–154.