Alternative UCITS Barometer - Hedge ConnectionCapital... · Introduction 2 ML Capital Asset...
14
Alternative UCITS Barometer Quarter 3, 2014
Transcript of Alternative UCITS Barometer - Hedge ConnectionCapital... · Introduction 2 ML Capital Asset...

Alternative UCITS Barometer
Quarter 3, 2014

Introduction
2
ML Capital Asset Management, the investment manager and promoter of the MontLake UCITS Platform, is delighted topresent the 15th edition of the quarterly ML Capital Alternative UCITS Barometer (Barometer).
The Barometer is designed to help identify and anticipate key trends in the demand for the major strategies within theAlternative UCITS sector.
The capital introductory team at ML Capital survey a diverse range of 60 investors who collectively manage almost $95billion and today invest upwards of $35 billion into Alternative UCITS, reflecting the widening of the investor base forregulated alternative products in Europe. Respondents range from insurance and pension funds to private bankingorganisations, with a significant constituent of financial advisers that deal with the primary source of Alternative UCITSinflows, the mid-net-worth investor.
Commenting on the highlights of the latest Barometer, John Lowry, Co - Founder & CIO of ML Capital;
“With markets near all-time highs, investors are increasingly looking for Multi-Strategy funds which have the ability todeliver returns less dependent on market movements. Our latest Barometer shows a sustained high level of interest forLong Short funds focussed on the following areas, US equities, Global equities and those that concentrate on investingin the Emerging Markets. In the non-equity sector, for the family offices, wealth managers and other institutions thatwe interact with, there is also a strong demand for less correlated strategies such as Global Macro and Multi-Strategyfunds.
With asset levels at all-time highs in the overall hedge fund industry, a large number of well-respected US managersare now expanding their product ranges through launching a regulated UCITS product to support the widening ofdemand for investment products that are not fully dependent on the direction of the stock-markets".
We hope that the Barometer will provide a useful insight into current appetite levels across some of the major sectorsof the regulated fund universe.
Should you have any questions then please do not hesitate to contact a member of our Cap Intro or Fund Hostingteams.
Cyril Delamare, CEO

Q3 Barometer Highlights
3
16% 2%
63%
18%
Participant Location
Continental Europe
Scandinavia
UK
Switzerland
Sharp Rise in Interest for Multi-Strategy Funds
The most dramatic result by far this quarter is for Multi-Strategy funds, which
show an almost five fold rise in the levels of demand over last quarters result.
There has been a large spike in the level of allocators to Alternative UCITS planning
to increase the size of their Multi-Strategy holdings this quarter. Almost half of our
respondents (47%) are looking to allocate to the space, with a cautious eye on the
relatively highly priced equity and bond markets.
Bullish views on both US and Global Long Short Funds
Highest level of interest for US Long Short strategies since the inception of the
Alternative UCITS Barometer. Following a drop in interest towards the tail end of
2013, sentiment towards the US L/S space has somewhat changed and interest has
rallied going into Q3.
Furthermore, whilst UK Long Short slides out of favour, 51% of respondents plan to
increase exposures to Global Long Short Funds.
Healthy Upswing towards Emerging Markets
There is a healthy move back towards the Emerging Markets shown this quarter.
Our research has highlighted that there is emphatic support for Globally diversified
funds (39%) as opposed to the more targeted regional products.
16%
18%
12%4%
49%
Participant Type
Bank/institution
Family Office
Fund of Funds
Private bank
Wealth manager / IFA

4
Looking to launch a regulated fund?
ML Capital can help you.
Whether it is a standalone fund structure or a new sub-fund of an existing umbrella,ML Capital’s structuring team will be able to advise you on the best way forward.
Investment Manager and Promoter to Regulated Funds
Dedicated UCITS platform with access to top tier service providers
Structuring expertise - Re-domiciliation, Mergers
UCITS & QIAIF infrastructure support, enabling you to focus on your investment
strategy
Cross border distribution expertise and fund registration
Experienced sales team for retail and institutional distribution
ML Capital: your one stop shop for investment managers looking to launch a Europeanregulated fund.
For more information please contact [email protected] or +44 207 925 2748

Long/Short Equities Trending
5
Global Long/Short
US Long/Short
UK Long/Short
Japan Long/Short
• MORE • SAME • LESS • MORE • LESS
51%35%
14%
61%31%
8%
8%
69%
22%
0%
10%
20%
30%
40%
50%
60%
Q1 Q2 Q3 Q4 Q1 Q2 Q3 Q4 Q1 Q2 Q3 Q4 Q1 Q2 Q3
Pe
rce
nta
ge C
han
ge
0%
10%
20%
30%
40%
50%
60%
70%
Q1 Q2 Q3 Q4 Q1 Q2 Q3 Q4 Q1 Q2 Q3 Q4 Q1 Q2 Q3
Pe
rce
nta
ge C
han
ge
0%
10%
20%
30%
40%
50%
Q1 Q2 Q3 Q4 Q1 Q2 Q3 Q4 Q1 Q2 Q3 Q4 Q1 Q2 Q3
Pe
rce
nta
ge C
han
ge
16%
65%
18%
0%
10%
20%
30%
40%
50%
Q1 Q2 Q3 Q4 Q1 Q2 Q3 Q4 Q1 Q2 Q3 Q4 Q1 Q2 Q3
Pe
rce
nta
ge C
han
ge

Long/Short Equities Trending
European Long/Short
6
This quarter, most Equity strategies continue to receive substantial interest from investors, with the biggest spike in demand
experienced for US and Global Long Short funds. A slight majority (51%) are forecasting that they will be moving more of their asset
base towards Globally diversified products this quarter, whilst over 60% plan to further increase their holdings of US Equity funds.
After such a strong and sustained rally in equities and with global stock markets near or at their all-time highs, a degree of profit
taking can be regarded as healthy. Whilst central banks continue to support stocks globally, some investors make the point that
relative to bond prices equity markets continue to offer some value. Nevertheless, the next phase of the market cycle may well favour
managers that adopt a more opportunistic, trading focused investment approach.
Demand levels for European strategies, although still strong, have fallen back to a degree this quarter. Last time out, European funds
were the most popular of all Equity strategies but have now been superseded by both the US and Global categories. Clearly many
investors have significant concerns over the ongoing Eurozone situation. Despite these issues, the demand levels for European
focussed Equity funds remains healthy with almost half of respondents (47%) expecting to raise their commitment levels.
The fortunes of funds dedicated to the UK and Japan appear to be going in opposite directions, with a healthy upward spike towards
Japan funds contrasting with a more muted interest level for UK strategies.
Commentary
47%47%
6%
0%
10%
20%
30%
40%
50%
60%
Q1 Q2 Q3 Q4 Q1 Q2 Q3 Q4 Q1 Q2 Q3 Q4 Q1 Q2 Q3
Pe
rce
nta
ge C
han
ge• MORE • SAME • LESS • MORE • LESS

Global Emerging
Pan-Asia
Commentary
Latin America
7
Emerging Markets Trending
A significant trend back towards Emerging Markets, with some respondents viewing the current levels as an interesting entry or re-
entry point following a difficult 2 year period. While still off its historic level of demand of 60% at the start of 2013, today almost 2 in
5 of respondents are looking to up their exposure levels to globally diversified EM products. However, somewhat of a contrarian or
controversial viewpoint, as at the same time as 40% are looking to increase, one third of investors are in fact planning to reduce
exposures to the very same strategy. It will be very interesting to see who has called this one correctly over the coming months.
Emerging market economies are beginning to see the positive knock on effects from the economic recoveries in the developed world,
led by the US and the UK. Many emerging markets have seen significant and painful depreciation in their currencies over the past 18
months. These devaluations have resulted in greatly improved levels of export competitiveness which should result in a strong export
lead recovery in many of the economies of the developing world. Globally diversified funds are by far and away the most popular type
of EM product, with a far lower level of interest shown to dedicated Asian and Latin American products, with the Lat Am space only
showing a 2% level of interest.
39%
29%
33%
8%
67%
24%
2%
51%47%
0%
10%
20%
30%
40%
50%
60%
70%
Q1 Q2 Q3 Q4 Q1 Q2 Q3 Q4 Q1 Q2 Q3 Q4 Q1 Q2 Q3
Pe
rce
nta
ge C
han
ge
0%
10%
20%
30%
40%
Q1 Q2 Q3 Q4 Q1 Q2 Q3 Q4 Q1 Q2 Q3 Q4 Q1 Q2 Q3
Pe
rce
nta
ge C
han
ge
0%
10%
20%
30%
40%
50%
60%
70%
Q1 Q2 Q3 Q4 Q1 Q2 Q3 Q4 Q1 Q2 Q3 Q4 Q1 Q2 Q3
Pe
rce
nta
ge C
han
ge• MORE • SAME • LESS • MORE • LESS
Fixed Income
Relative Value Trending
Market Neutral
Convertible Arbitrage
Commentary
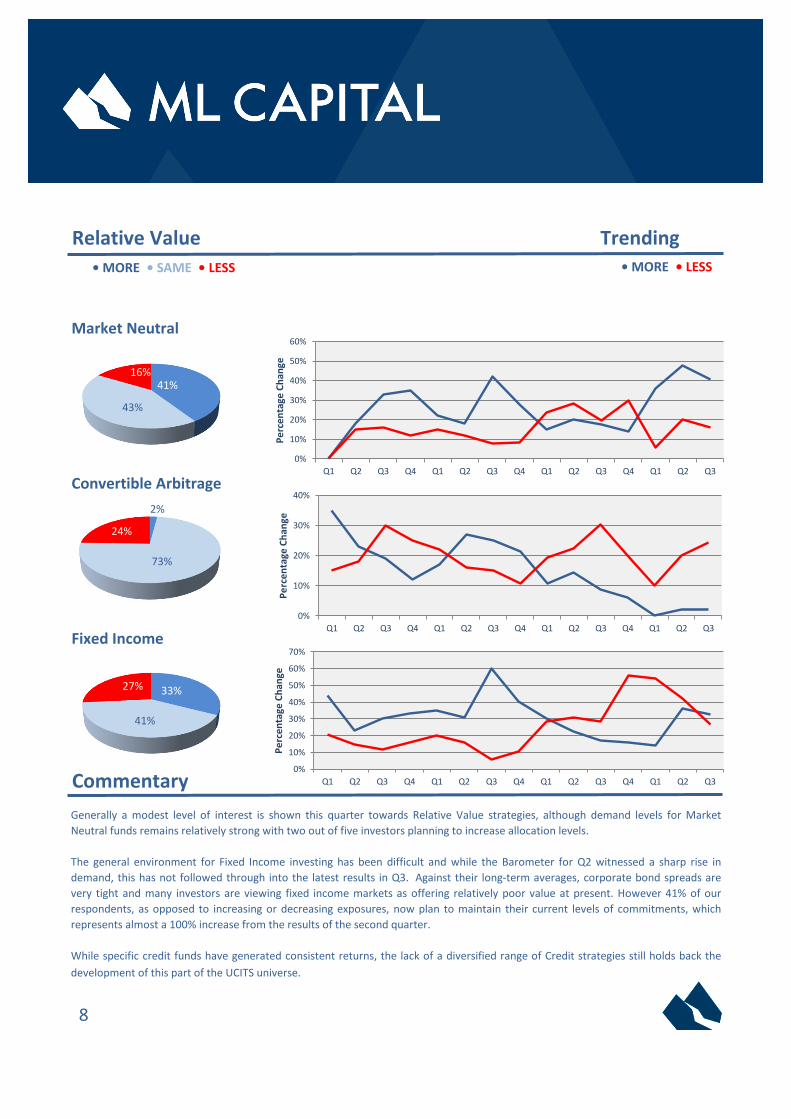
Generally a modest level of interest is shown this quarter towards Relative Value strategies, although demand levels for Market
Neutral funds remains relatively strong with two out of five investors planning to increase allocation levels.
The general environment for Fixed Income investing has been difficult and while the Barometer for Q2 witnessed a sharp rise in
demand, this has not followed through into the latest results in Q3. Against their long-term averages, corporate bond spreads are
very tight and many investors are viewing fixed income markets as offering relatively poor value at present. However 41% of our
respondents, as opposed to increasing or decreasing exposures, now plan to maintain their current levels of commitments, which
represents almost a 100% increase from the results of the second quarter.
While specific credit funds have generated consistent returns, the lack of a diversified range of Credit strategies still holds back the
development of this part of the UCITS universe.
8
41%
43%
16%
73%
24%
2%
33%
41%
27%
0%
10%
20%
30%
40%
50%
60%
Q1 Q2 Q3 Q4 Q1 Q2 Q3 Q4 Q1 Q2 Q3 Q4 Q1 Q2 Q3
Pe
rce
nta
ge C
han
ge
0%
10%
20%
30%
40%
Q1 Q2 Q3 Q4 Q1 Q2 Q3 Q4 Q1 Q2 Q3 Q4 Q1 Q2 Q3
Pe
rce
nta
ge C
han
ge
0%
10%
20%
30%
40%
50%
60%
70%
Q1 Q2 Q3 Q4 Q1 Q2 Q3 Q4 Q1 Q2 Q3 Q4 Q1 Q2 Q3
Pe
rce
nta
ge C
han
ge• MORE • SAME • LESS • MORE • LESS
Commentary
Distressed
Event Driven Trending
Multi-Strategy
Merger Arbitrage
9
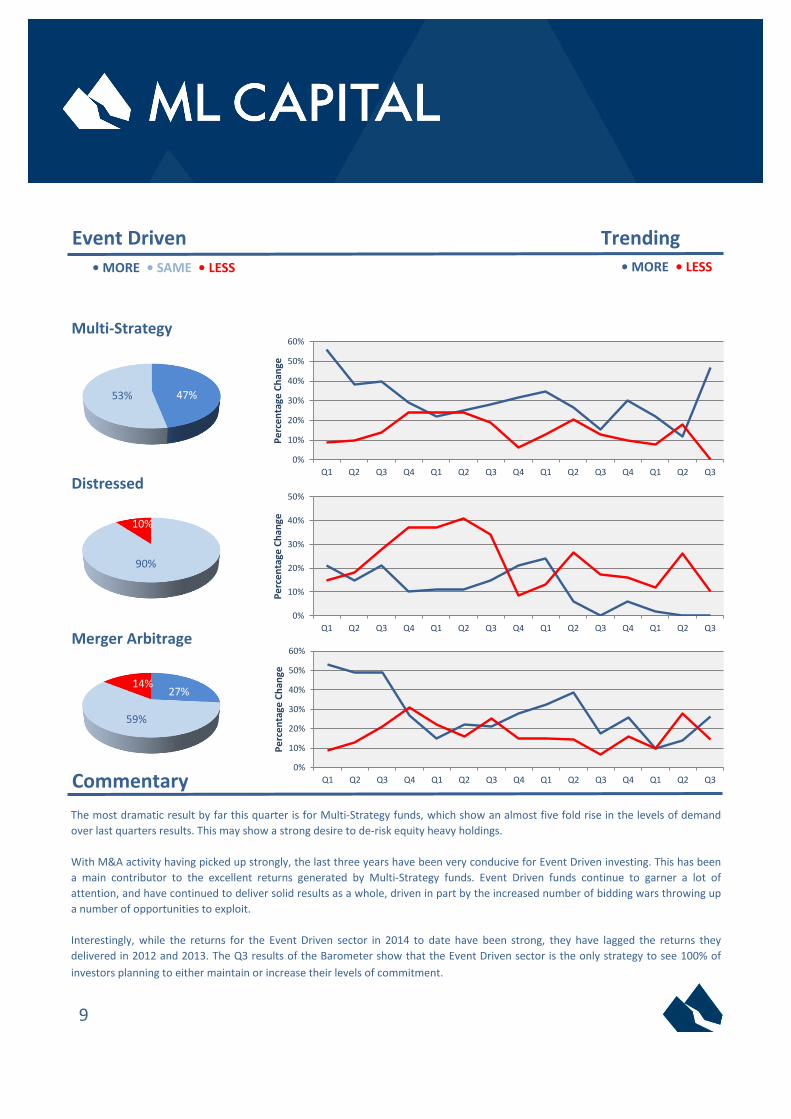
The most dramatic result by far this quarter is for Multi-Strategy funds, which show an almost five fold rise in the levels of demand
over last quarters results. This may show a strong desire to de-risk equity heavy holdings.
With M&A activity having picked up strongly, the last three years have been very conducive for Event Driven investing. This has been
a main contributor to the excellent returns generated by Multi-Strategy funds. Event Driven funds continue to garner a lot of
attention, and have continued to deliver solid results as a whole, driven in part by the increased number of bidding wars throwing up
a number of opportunities to exploit.
Interestingly, while the returns for the Event Driven sector in 2014 to date have been strong, they have lagged the returns they
delivered in 2012 and 2013. The Q3 results of the Barometer show that the Event Driven sector is the only strategy to see 100% of
investors planning to either maintain or increase their levels of commitment.
47%53%
90%
10%
27%
59%
14%
0%
10%
20%
30%
40%
50%
60%
Q1 Q2 Q3 Q4 Q1 Q2 Q3 Q4 Q1 Q2 Q3 Q4 Q1 Q2 Q3
Pe
rce
nta
ge C
han
ge
0%
10%
20%
30%
40%
50%
Q1 Q2 Q3 Q4 Q1 Q2 Q3 Q4 Q1 Q2 Q3 Q4 Q1 Q2 Q3
Pe
rce
nta
ge C
han
ge
0%
10%
20%
30%
40%
50%
60%
Q1 Q2 Q3 Q4 Q1 Q2 Q3 Q4 Q1 Q2 Q3 Q4 Q1 Q2 Q3
Pe
rce
nta
ge C
han
ge• MORE • SAME • LESS • MORE • LESS
10
Managed Futures / CTAs
Commentary
Macro & CTA Trending
Global Macro-Discretionary
Global Macro Systematic
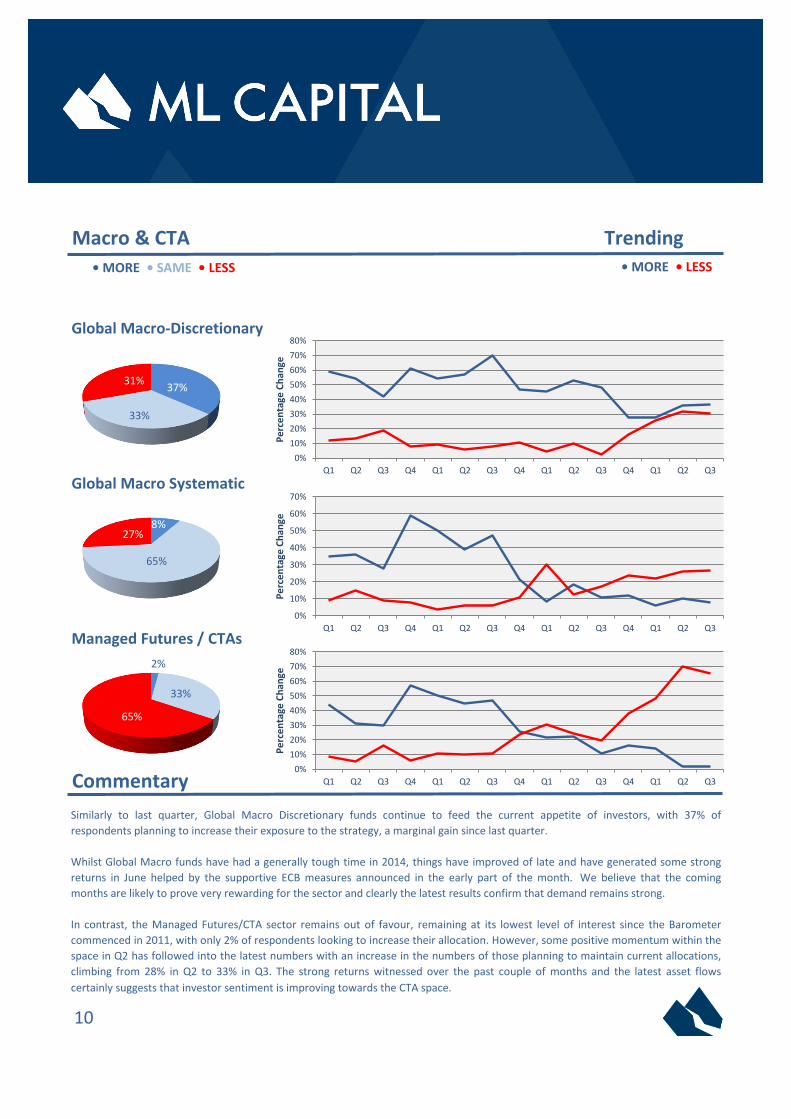
Similarly to last quarter, Global Macro Discretionary funds continue to feed the current appetite of investors, with 37% of
respondents planning to increase their exposure to the strategy, a marginal gain since last quarter.
Whilst Global Macro funds have had a generally tough time in 2014, things have improved of late and have generated some strong
returns in June helped by the supportive ECB measures announced in the early part of the month. We believe that the coming
months are likely to prove very rewarding for the sector and clearly the latest results confirm that demand remains strong.
In contrast, the Managed Futures/CTA sector remains out of favour, remaining at its lowest level of interest since the Barometer
commenced in 2011, with only 2% of respondents looking to increase their allocation. However, some positive momentum within the
space in Q2 has followed into the latest numbers with an increase in the numbers of those planning to maintain current allocations,
climbing from 28% in Q2 to 33% in Q3. The strong returns witnessed over the past couple of months and the latest asset flows
certainly suggests that investor sentiment is improving towards the CTA space.
37%
33%
31%
8%
65%
27%
2%
33%
65%
0%
10%
20%
30%
40%
50%
60%
70%
80%
Q1 Q2 Q3 Q4 Q1 Q2 Q3 Q4 Q1 Q2 Q3 Q4 Q1 Q2 Q3
Pe
rce
nta
ge C
han
ge
0%
10%
20%
30%
40%
50%
60%
70%
Q1 Q2 Q3 Q4 Q1 Q2 Q3 Q4 Q1 Q2 Q3 Q4 Q1 Q2 Q3
Pe
rce
nta
ge C
han
ge
0%
10%
20%
30%
40%
50%
60%
70%
80%
Q1 Q2 Q3 Q4 Q1 Q2 Q3 Q4 Q1 Q2 Q3 Q4 Q1 Q2 Q3
Pe
rce
nta
ge C
han
ge• MORE • SAME • LESS • MORE • LESS

Global Macro Discretio'
Market Neutral 40.8% 42.9% 16.3%
Multi-Strategy 46.9% 53.1% 0.0%
Global Macro Systemat' 8.2% 65.3% 26.5%
More Same Less
Macro & CTA
Distressed 0.0% 89.8%
Managed Futures/CTA
Source Data
More Same Less
Global L/S Equity
UK L/S Equity
US L/S Equity
European L/S Equity
Japan L/S Equity
51.0%
8.2%
34.7% 14.3%
69.4% 22.4%
61.2% 30.6%
More Same
11
Convertible Arbitrage 2.0% 73.5% 24.5%
More Same Less
2.0% 32.7% 65.3%
36.7% 32.7% 30.6%
10.2%
Merger Arbitrage 26.5%
18.4%
Latin America
8.2%
46.9%
Long / Short EquityEmerging Markets
Relative Value
More Same
46.9%
Less
Global Emerging 38.8% 28.6% 32.7%
2.0% 51.0%
Pan-Asia 8.2% 67.3% 24.5%
6.1%
16.3% 65.3%
Lowest Surveyed Hedge Allocation USD $ 25 m
Highest Surveyed Alt UCITS Allocation USD $ 6 bn
Lowest Surveyed Alt UCITS Allocation USD $ 10 m
Highest Surveyed Avg Alt UCITS Ticket USD $ 302 m
Lowest Surveyed Avg Alt UCITS Ticket USD $ 50 k
Highest Surveyed Hedge Allocation USD $250 bn
Barometer Participants
Barometer Surveyed Alt UCITS Assets USD $ 35 bn
59.2% 14.3%
Less
Barometer Surveyed Hedge Fund Assets USD $ 513 bn
Further Statistics
Total Press Reported Hedge Fund Assets USD $3,000 bn
Press Reported
Total Press Reported Alt UCITS Assets USD $ 265 bn
Event Driven
Fixed Income 32.7% 40.8% 26.5%
46.9%

About ML Capital
About The MontLake UCITS Platform
12
ML Capital is a forward looking and leading independent investment management firm specializing in European regulated fundstructures, headquartered in Dublin, Ireland. As an award winning platform provider, we partner with the very best of investmentmanagers to bring to market the latest most appropriate fund structures to comply with the raft of incoming regulatoryrequirements, whilst meeting the ever increasing expectations of investors.
ML Capital handles all aspects of the fund structuring and launch on investment managers’ behalf. Through our dedicated networkwe offer fund sales and distribution if required and have had comprehensive coverage of investors in all key European markets forthe past 20 years.
Our goal is to provide the most appropriate fund structures to maximize distribution opportunities across all key markets. Oursolutions bring together market leading service providers with some of the very best minds in the regulated fund space; providingwell managed European investment products with the highest levels of service and governance. We ensure that all incominginvestors and partners come in with the full knowledge that they are investing into structures that are designed to protect and
preserve investor interest.
The MontLake UCITS Platform, domiciled in Ireland and regulated by the Central Bank of Ireland provides investment managerswith a turnkey solution for launching a UCITS fund under its umbrella structure. Typical time to market is 10 weeks, or less, withthe platform offering immediate access to a wide range of investors through ML Capital’s distribution network.
Funds placed on the platform by ML Capital will benefit from top-tier service providers including Citi for custody, administrationand trustee services, KPMG for audit, and Bridge Consulting for oversight and directorships. ML Capital has also ensured thatmanagers utilising the MontLake UCITS Platform will have unfettered access to a network of the leading prime brokerage firms.
For more information on ML Capital please visit our website www.mlcapital.com or our platform website www.montlakeucits.com.

IRELAND
26 Upper Fitzwilliam Street Dublin 2Ireland
+353 1535 0912
MALTA
Suite 5Tigne PalaceBisazza StreetSliema
+356 2133 4801
www.mlcapital.com
SWITZERLAND
Rue de la Cloche 81201Geneva
+41 (0) 22 318 56 70
UK
30 St James's SquareLondonSW1Y 4AL
+44 (0)207 9252 748

DISCLAIMER
14
FOR INVESTMENT PROFESSIONALS ONLY
This financial promotion is issued by ML Capital Limited. This document is not intended as an
offer to acquire or dispose of any security. Information given in it has been obtained from, or
based upon, sources believed by us to be reliable and accurate although ML does not accept
liability for the accuracy of the contents. This information is not intended to constitute a basis
for any specific investment decision.
For Addressee only. The distribution of this report does not constitute an offer or solicitation.
Past performance is not a guide to future performance. The value of investments can fall as
well as rise. You should ensure you understand the risk profile of the products or services you
plan to purchase. The services provided by ML Capital Limited are available only to investors
who come within the category of the Eligible Counterparty or Professional Client as defined in
the Financial Services Authority’s Handbook they are not available to individual investors,
who should not rely on this communication. Information given in this document has been
obtained from, or based upon, sources believed by us to be reliable and accurate although
ML Capital does not accept liability for the accuracy of the contents. ML Capital does not
offer investment advice or make recommendations regarding investments.