Alternative Tests for Durability of Cement Stabilized … Tests for... · Alternative Tests for...
39
LTRC LTRC Louisiana Transportation Research Center Alternative Tests for Durability of Cement Stabilized Low Plasticity Soils Presentation to Louisiana Engineering Conference February 2007
Transcript of Alternative Tests for Durability of Cement Stabilized … Tests for... · Alternative Tests for...

LTRCLTRCLouisiana Transportation Research Center
Alternative Tests for Durability of Cement
Stabilized Low Plasticity Soils
Presentation to Louisiana Engineering Conference
February 2007

Background
o Portland cement has been effective in improving the engineering properties of a wide variety of soils, including granular materials, silts, and clays
o Two important engineering properties Strength/stiffness
300 psi for 8.5” soil cement 150 psi for 12” cement-treated Lab test, TR 432
Durability AASHTO 135 or ASTM 559
DOTD– Only for special soil types– Follow AASHTO 135

Durability Test
o Time consuming
12 wet – dry cycles, 6 – 8 weeks
o Specimen preparation is important to prevent premature failure
Break down along the interface of compaction layers
o Need for a quick and better method
o Intrinsic correlation between the strength and durability

Strength vs. Durability(from Portland Cement Association)

Tube Suction Test
by Saarenketo and Scullion
0
5
10
15
20
25
0 100 200 300 400
Time (hour)
Die
lectr
ic v
alu
e

Tube Suction Test cont.
o A capacitance probe measures the dielectric value (DV) of materials
o Some typical dielectric values
Air: 1; Soil solids: 3~5; water: 81
o Is only used to test aggregate base
Sample with ability to absorb more free water will be less durable for their engineering properties

Tube Suction Test cont.
o Good: maximum DV less than 10
o Marginal: maximum DV ranging from 10 to 16
o Poor: maximum DV larger than 16
o Short test period: less than 2 weeks
Base Aggregate
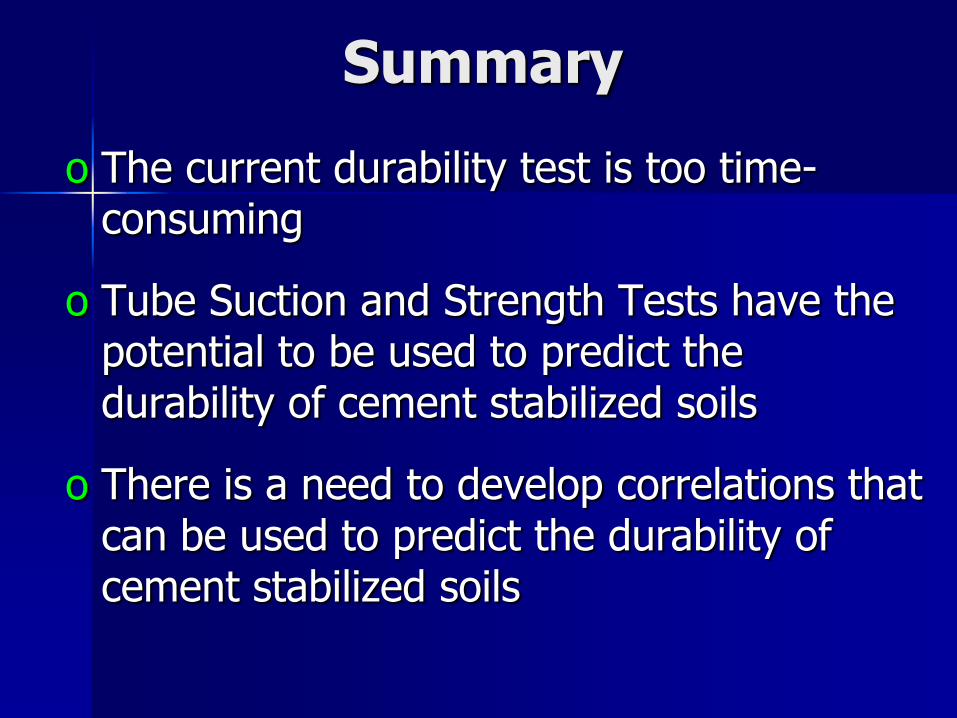
Summary
o The current durability test is too time-consuming
o Tube Suction and Strength Tests have the potential to be used to predict the durability of cement stabilized soils
o There is a need to develop correlations that can be used to predict the durability of cement stabilized soils

Objectives of Research
o Simultaneously compare, evaluate, and understand the three test procedureswith respect to the durability prediction for cement stabilized soils
o Establish tentative criteria for using DV or strength to predict/determine the durability of cement stabilized soils

Soil Properties
10
12
14
16
18
20
6 10 14 18 22 26 30
Moisture Content (%)
Dry
Den
sity
(kN
/m3 )
Standard Proctor
Curve
Zero air void curve
TS Samples
wopt=18.5%
dmax=16.4kN/m3
Soil TypeSilt (%)
Clay (%)
LL (%)
PI (%)
Optimum Moisture Content
(%)
gdmax
(kN/m3)Soil Classification
USCS/AASHTO
Silty Clay 71.7 24.5 37 15 18.5 16.4 CL/A-6(15)
104 pcf

Planned Test Factorial
Molding moisture content
Cement content
(%)
Dry unit weight
(kN/m3/pcf)Planned tests
15.5%2.54.56.5 8.5
10.512.5
16.4/104Wetting-drying
durability
Tube suction
7-day UCS
18.5% 16.4/104
21.5% 16.4/104
24.5% 15.5/98.3

Tube Suction Test

Specimen Molding and Testing

Variation of dielectric value (DV) with elapsed time
0
4
8
12
16
20
24
28
32
36
40
0 20 40 60 80 100 120 140 160 180 200 220
Time (hours)
DV
w=12.5%
w=15.5%
w=18.5%
w=21.5%
w=24.5%
Raw Soil
2 days 4 days 6 days

0 50 100 150 200Time (hour)
0
4
8
12
16
20
24
28
32
36
Die
lect
ric
Va
lue
Legend: wm = molding water content
2.5% cement
4.5% cement
6.5% cement
8.5% cement
10.5% cement
12.5% cement
0 50 100 150 200Time (hour)
0
4
8
12
16
20
24
28
32
36
Die
lect
ric
Va
lue
0 50 100 150 200Time (hour)
0
4
8
12
16
20
24
28
32
36
Die
lect
ric
Va
lue
0 50 100 150 200Time (hour)
0
4
8
12
16
20
24
28
32
36
Die
lect
ric
Va
lue
(a) wm=15.5% (b) wm=18.5%
(c) wm=21.5% (d) wm=24.5%
Stabilized Soil
2 days 5 days2 days2 days 8 days 2 days 8 days5 days
15.5%18.5%
21.5% 24.5%

0 50 100 150 200Time (hour)
0
4
8
12
16
20
24
28
32
36
Die
lect
ric V
alue
Legend: wm = molding water content
wm=15.5%
wm=18.5%
wm=21.5%
wm=24.5%
0 50 100 150 200Time (hour)
0
4
8
12
16
20
24
28
32
36
Die
lect
ric V
alue
0 50 100 150 200Time (hour)
0
4
8
12
16
20
24
28
32
36D
iele
ctric
Val
ue
0 50 100 150 200Time (hour)
0
4
8
12
16
20
24
28
32
36
Die
lect
ric V
alue
(a) cement=2.5% (b) cement=4.5%
(c) cement=6.5% (d) cement=8.5%
0 50 100 150 200Time (hour)
0
4
8
12
16
20
24
28
32
36
Die
lect
ric V
alue
0 50 100 150 200Time (hour)
0
4
8
12
16
20
24
28
32
36
Die
lect
ric V
alue
(e) cement=10.5%(f) cement=12.5%
Stabilized Soil
2 days 8 days5 days 2 days 8 days5 days
2.5% 4.5%
6.5% 8.5%
10.5% 12.5%

Influence Factors on Max DV
0
5
10
15
20
25
30
35
40
0 2 4 6 8 10 12 14
Cement, %
Max D
V
15.5% moisture
18.5% moisture
21.5% moisture
24.5% moisture

Observation
o Both molding moisture content and cement content affect the specimen’s ability to absorb free water
o Increase of cement usage delayed moisture intrusion and reduced free moisture in cement stabilized soils

Influence Factors on Max DVCont.
0
5
10
15
20
25
30
35
40
0 2 4 6 8 10 12
Water-Cement Ratio
Max D
V
102 pcf, average
96 pcf, average

Influence Factors on TS UCS
0
100
200
300
400
500
600
0 2 4 6 8 10 12 14
Cement, %
TS
UC
S, p
si
15.5% moisture
18.5% moisture
21.5% moisture
24.5% moisture

Influence Factors on TS UCS cont.
0
100
200
300
400
500
600
700
0 2 4 6 8 10
Water-Cement Ratio
TS
UC
S, p
si
102 pcf, average
96 pcf, average

TS UCS with Max DV
0
100
200
300
400
500
600
700
0 5 10 15 20 25 30 35 40
Max DV
TS
UC
S,
psi 102 pcf, average
96 pcf, average

Seven (7) Day UCS

Variation of Seven Day UCS
0
50
100
150
200
250
300
350
400
450
0 2 4 6 8 10
Water-Cement Ratio
7 D
ay U
CS
, p
si 106 pcf, average
97 pcf, average

Comparison of Seven Day UCS
0
100
200
300
400
500
600
700
0 2 4 6 8 10
Water-Cement Ratio
UC
S, p
si
7 day UCS
TS UCS

Durability Test

Variation of Soil Cement Loss
0
5
10
15
20
25
30
35
40
45
0 2 4 6 8 10 12 14
Cement Content, %
So
il C
em
en
t L
os
s, % 15.5%, average
18.5%, average
21.5%, average
24.5%, average
A-6, 7%

Observation
o Soil cement loss is well correlated with cement content, but its strength and Max DV is not
o Soil cement loss is not a good indicator for the variation of strength and ability to absorb free water
o Is soil cement loss the best indicator for the durability of cement stabilized soils ?

Durability Prediction

Durability Prediction from Max DV
0
5
10
15
20
25
30
35
40
45
0 5 10 15 20 25 30 35 40
Max DV
So
il C
em
en
t L
os
s, %
15.5%, average
18.5%, average
21.5%, average
24.5%, average

Durability Prediction from Max DV cont.
y = 0.1287x + 3.1743
R2 = 0.9441
0
5
10
15
20
25
30
35
40
45
50
0 50 100 150 200 250 300 350
Maximum DV * Water Cement Ratio
So
il ce
me
nt lo
ss (
%) testing data
95% low er
95% upper

Durability Prediction from Max DV cont.
0
2
4
6
8
10
12
14
16
18
0 10 20 30 40
Maximum DV
Wa
ter
ce
me
nt
rati
o
Samples failing PCA soil-cement loss criterion
Samples passing PCA soil-cement loss criterion
Boundary curve: MDV*w/c=29.7
Boundary curve,+0.05

Durability Prediction from 7 Day UCS
0
5
10
15
20
25
30
35
40
45
0 50 100 150 200 250 300 350 400 450
7 Day UCS, psi
So
il C
em
en
t L
os
s, %
15.5%, average
18.5%, average
21.5%, average
24.5%, average

Durability Prediction from 7 Day UCS cont.
y = 1.8902x + 6.4965
R2 = 0.8936
0
5
10
15
20
25
30
35
40
45
50
0 4 8 12 16 20
Water cement ratio/7-day UCS
So
il ce
me
nt lo
ss (
%) Testing data
95% low er
95% upper

Durability Prediction from 7 Day UCS cont.
0
2
4
6
8
10
12
0 50 100 150 200 250 300 350 400 450
7- day UCS, psi
Wa
ter
ce
me
nt
rati
o
Samples failing PCA soil-cement loss criterion
Samples passing PCA soil-cement loss criterion
Boundary curve, +0.05
Boundary curve: w/c=0.27*UCS

Conclusion
o Good correlations exist among the maximum DV, 7-day UCS, and soil-cement mass loss.
o Therefore, the water susceptibility for cement stabilized soils can be evaluated and predicted by these methods
Tube Suction
7-day UCS
Durability test

Conclusion - cont.
o The water-cement ratio of cement-stabilized soil had a significant influence on the maximum DV and 7-day UCS
o The dry unit weight of cement-stabilized soil could cause variations in the maximum DV and 7-day UCS

Recommendation
Since primarily CL material was used, additional soil types should be tested to improve these charts for future use in design and construction

Question ?