Alternative energy sources, alternative energy sources list, how to save electricity bill

ALTERNATIVE ELECTRICAL ENERGY SOURCESFOR MAINE
W.J. Jones M. Ruane
Appendix J
OCEAN AND RIVERINE CURRENT ENERGY CONVERSION
J. Mays
Prepared for the Central Maine Power Company.
Report No. MIT-E1 77-010MIT Energy LaboratoryJuly 1977
This appendix is one of thirteen volumes; the remaining volumes are asfollows: A. Conversion of Biomass; B. Conservation; C. GeothermalEnergy Conversion; E. Ocean Thermal Energy Conversion; E. Fuel Cells;F. Solar Energy Conversion; G. Conversion of Solid Wastes; H. Storageof Energy; I. Wave Energy Conversion; K. Wind Energy Conversion, andL. -Environmental Impacts.


Acknowl edgmentsAcno . Iame
Initial literature reviews and drafts of the various technical
appendices were prepared by the following people:
Appendix A
Appendix B
Appendix C
Appendix D
Appendix E
Appendix F
Appendix G
Appendix H
Appendix 1
Appendix J
Appendix K
Appendix L
Conversion of Biomass - C. Glaser, M. Ruane
Conservation - P. Carpenter, W.J. Jones, S. Raskin, R. Tabors
Geothermal Energy Conversion - A. Waterflow
Ocean Thermal Energy Conversion - M. Ruane
Fuel Cells - W.J, Jones
Solar Energy Conversion S. Finger, J. Geary, W.J. Jones
Conversion of Solid Wastes - M. Ruane
Storage of Energy - M. Ruane
Wave Energy Conversion - J. Mays
Ocean and Riverine Current Energy Conversion J. Mays
Wind Energy Conversion . T. Labuszewski
Environmental Impacts ~ J. Gruhl
Numerous people shared reports and data with us and provided comments on
the draft material. We hope that everyone has been acknowledged through the
references in the technical sections, but if we missed anyone, thank you!
Ms. Alice Sanderson patiently weathered out many drafts and prepared thefinal document.


Preface
The Energy Laboratory of the Mass. Inst. of Tech. was retained by
the Central Maine Power Company to evaluate several technologies
as possible alternatives to the construction of Sears Island #1
(a 600 MWe coal fired generating plant scheduled for startup in
1986). This is an appendix to Report MIT-EL 77-010 which presents
the results of the study for one of the technologies.
The assessments were made for the Central Maine Power Company on
the basis that a technology should be:
1) an alternative to a base-load electric
power generation facility. Base-load is
defined as ability to furnish upto a rated
capacity output for 6 5 7 0 hrs. per year.
2) not restricted to a single plant. It
may be several plants within the state of
Maine. The combined output, when viewed
in isolation, must be a separate, "stand-
alone", source of power.
3) available to deliver energy by 1 9 8 5.


APPENDIX J
OCEAN AND RIVERINE CURRENT ENERGY CONVERSION
Page
1.0 INTRODUCTION J-1
1.1 Ocean Currents J-1
1.2 Riverine Currents J-1
2.0 TECHNICAL FACTORS J-2
2.1 Fluid Power J-2
2.2 Power Extraction j-2
2.2.1 Paadle Wheel J-2
2.2.2 Screw Turbine J-2
2.2.3 Savonius Rotor J 3
2.3 Other Technical ConsiderationsJ.9
3.0 APPLICABILITY TO MAINE j-13
4.0 ECONOMICS J-15
5.0 ENVIRONMENTAL IMPACTS j-16
6.0 CONCLUSION j-16
7.0 REFERENCES J-17
Technical Note A J- 18
Technical Note B J-19
Technical Note C J-23J- 23

LIST OF TABLES
Table
3.1 Current Tables for Selected Maine Sites
4.1 Estimated Current Device Costs
J-14
J-16
ii
Page

LIST OF FIGURES
Page
Figure 2.1 Efficiency vs Tip Speed Ratio for Different Wind Turbines J-4
Figure 2.2 Proposed Florida Current Energy Extraction Device J-5
Figure 2.3 Proposed Florida Current Energy Extraction Device J-6
Figure 2.4 Proposed Florida Current Energy Extraction Device J-7
Figure 2.5 Modified Paddle Wheel Design J-8
Figure 2.6 Savonius Rotor Design J-8
Figure 2.7 Efficiency vs Torque for Savonius Rotor and Windmill J-10
Figure 2.8 A Proposed Rotor-Type Floating Anchored Kinetic Energy J-11Machine for Extracting Energy from Tidal River Currents
Figure 2.9 Proposed Florida Current Energy Extraction Device J-12
Figure B.1 Changes in Pressure and Velocity of the Propeller Disk,Momentum Theory J-20
Figure C.1 Characteristics of a Tidal Current J-24
iii

1.0 INTRODUCTION
1.1 Ocean Currents:
Ocean currents off the Maine coast due to non-tidal effects are very slight. There is a large,
counter-clockwise eddy in the Gulf of Maine formed by a meander off of the Gulf Stream called the
slope water current. The behavior of this eddy is seasonal. (TRIGOM, 1974)
winter-spring 0.04 - 0.16 knots
late spring 0.29 - 0.34
July-August 0.20
autumn 0.20 - 0.25
Thus, the ocean current in the Gulf of Maine has an approximate rate of 0.2 knots resulting in a
power density of 0.57 watts/m2, which is negligible.
As a rule, most ocean currents are too weak to be considered as power sources with the exception
of such intense, near-shore streams as the Florida current where the mean speed is 2.2 knots, resulting
in a power density of 0.75 KW/m2 . It has been calculated that the total power in the Florida current
is on the order of 25,000 MW. (Somers and Shoup, 1974).
1.2 Riverine Currents:
There are, however, riverine currents that are driven by rain water runoff and by tidal forcing.
In this Appendix, we shall not consider tidal power as the phrase is conventionally used. We shall
look at the resource potential of quickly flowing rivers and develop a means for analyzing tidal
streams that may have application as power sources.
The literature on tidal energy is voluminous. Some of it is applicable to riverine and tidal
stream power extraction. Charlier (1969a, 1969b, 1970), Gray and Gashus (1972), and Wilson (1973)
may be consulted. Of more direct relevance is the work of Heronemus (1974) and other contributors
to the MacArthur Workshop on Energy from the Florida Current, Feb. 27 - Mar. 1, 1974, hosted by
the National Oceanic and Atmospheric Administration (NOAA) - Atlantic Oceanographical and Meteorolo-
gical Laboratories.
Tidal mills, machines that extract power from the tidal streams, were quite prevalent in pre-
vious centuries. Areas that enjoyed significant tidal ranges usually had large tidal streams.
Early records indicate that tide mills were being worked along the Atlantic coastof Europe, notably in Great Britain, France, and Spain by the llth century. Onesuch installation in the Deben Estuary, in Great Britain, was mentioned as earlyas 1170 in the records of the Parish of Woodbridge. This is believed to be stillin operation. Tidal energy was widely used in coastal areas where the tides at-tained a sufficient range to the middle of the 19th century. Part of the watersupply of London in 1824 was provided by 20 ft. diameter waterwheels installed in1580 under the arches of the London Bridge. A tidal power installation for pumpingsewage was still in use in Hamburg in 1880. Other installations have been reportedthroughout this era in Russia, North America, and Italy. Some of the old structureswere of impressive size. A tide mill in Rhode Island built in the 18th centuryused 20-ton wheels 11 ft. in diameter and 26 ft. in width.
(Gray and Gashus, 1970)
Heronemus (1974) further delineates tidal mills as to whether they are fixed or floating. We shall
consider only floating tidal mills because the fixed tidal mills usually require extensive construc-
tion of coffer dams entailing great expense and ecological impact, not to mention impairment of
navigation and other traditional uses of a river.
J-1
2.0 TECHNICAL FACTORS
2.1 Fluid Power
The power in a flux of fluid is equal to the mass flow rate times the energy per unit area.
v2 Av3Power = pAv x 2 = p 2 (1.1)
where
p = fluid density
A = area of section
v = velocity of flow.
Note that the power is proportional to the cube of the fluid speed. The analysis that follows is ap-
plicable to windmills as well as water mills, the appropriate density being used. In this context,
efficiency will be defined as the power actually extracted by a device of area A divided by the
available fluid power, equation (1.1).
2.2 Power Extraction
There are a number of devices that have been used to take power out of a fluid stream; some use
drag force entirely while others utilize lift force as well. A screw propeller uses lift, while a
paddle wheel uses drag. Turbines, of which there are many kinds, may use a combination of lift and
drag forces for their operation. The water velocities measured in tidal rivers produce a head which
is quite small. Head is defined as the pressure difference that causes the fluid to flow in the first
place and can be calculated by
head (meters) =2 v2/g (1.2)
where
g = gravitational acceleration = 9.8m/sec2
The size of the head will determine the device. Hydro-electric power plants use turbines that
are rated for large heads on the order of hundreds of meters. A head of 0.12 meters is associated
with a current of 3 knots.
We shall consider three types of devices for the extraction of power: the undershot paddle
wheel, the screw turbine, and the Savonius motor.
2.2.1 Paddle wheel
The simplified theory of the paddle wheel provided in Technical Note A shows that the maximum
theoretical efficiency is 33%. We shall consider a paddle wheel supported on a moored raft such that
the lower half of the wheel is in the free stream of the current. The tip speed of the paddle cannot
exceed the current velocity. Two important parameters characterizing the output of rotational
energy extractors are (i) tip speed ratio = tip speed/current velocity, and (ii) torque. Typically,
high-torque devices have slow tip speeds and are large, massive devices such as the old-fashioned
water wheels. The energy output is used directly as mechanical work such as pumping water or
grinding. Electric generators, on the other hand, are usually designed as high-speed devices for
better efficiency and lower cost. The paddle wheel with the inherent limitations of low tip speed
and low efficiency does not seem a suitable candidate except for ease in construction.
2.2.2 Screw turbine
The screw turbine is equivalent to the windmill. Windmills that are used for mechanical work
have relatively low tip speeds, high torque, and high solidity (which is the proportion of cross-
J-2
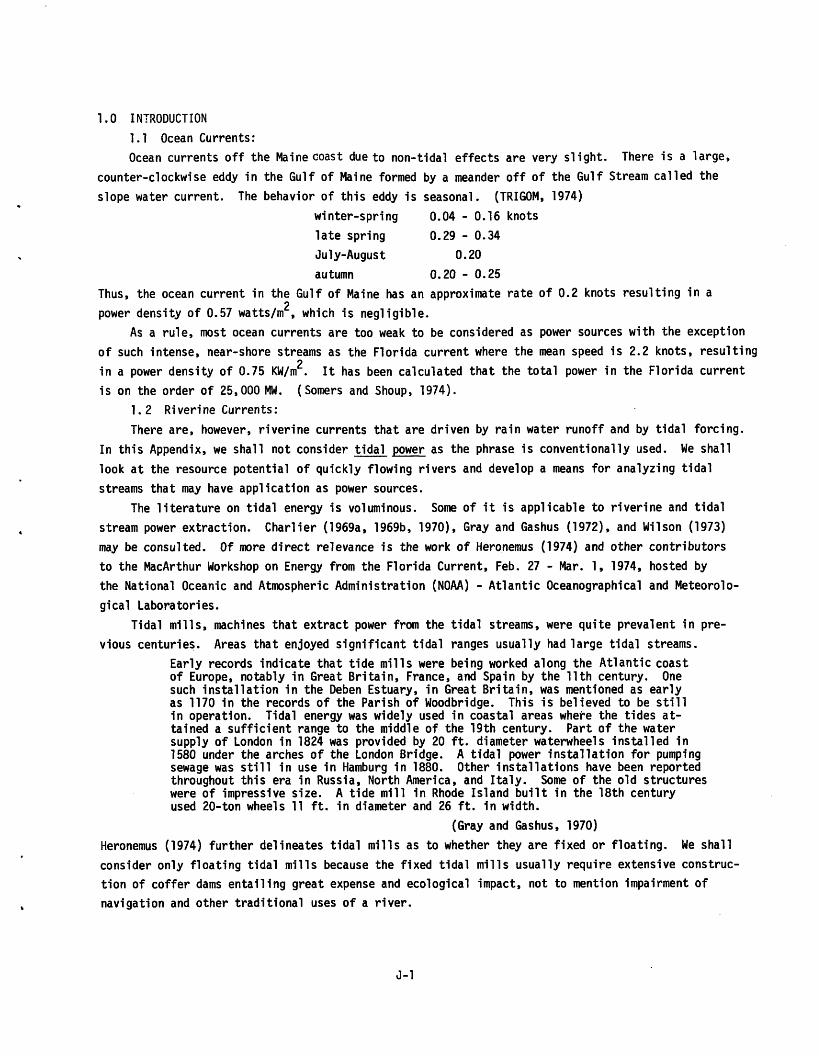
sectional area taken up by blades). See curve 2 on Figure 2.1.If high rpm and efficiency are wanted,
then very few blades, perhaps only two or three, are used with a resulting low solidity. Curves 3 and
4 in Figure 2.1 display this feature.
The maximum power that can be extracted from a screw turbine is given in Technical Note B as
59% of the total power of the current. In addition to that, we expect other types of hydro-dynamic
losses as well due to interference with the hub, induced drag, and so on. The greatest efficiency
in Figure 2.1 is around 45% with a tip speed ratio of 3.5 for a four-bladed screw. By changing the
number and the design of the blade, the tip speed ratio can be increased up to 6.0 with a correspon-
ding loss in output to 35%. It is important to recognize that efficiency is not the most important
element in power extraction since we are presumably not paying anything for the energy we are ex-
tracting. We are paying for the conversion system so it is necessary to match total power out as a
function of cost to get the most economically efficient machine.
What allows the screw turbine to achieve tip speeds in excess of the current velocity is the
fact that they use the phenomenon of lift to provide their drive much in the same way that an air-
plane is able to fly. The relative speed of the fluid, provided by the sum of the current and the
peripheral velocity of the blades, acts at an angle of attack on the blade or foil in such a way as
to provide a strong force perpendicular to the resultant velocity. The lift provides the torque
necessary to allow the blades to go faster until an equilibrium is reached between the torque of
the generator and the torque of the turbine. Elaborate turbines are provided with automatic pitch
control that always keep the angle of the blade at the optimum angle of attack for best power out
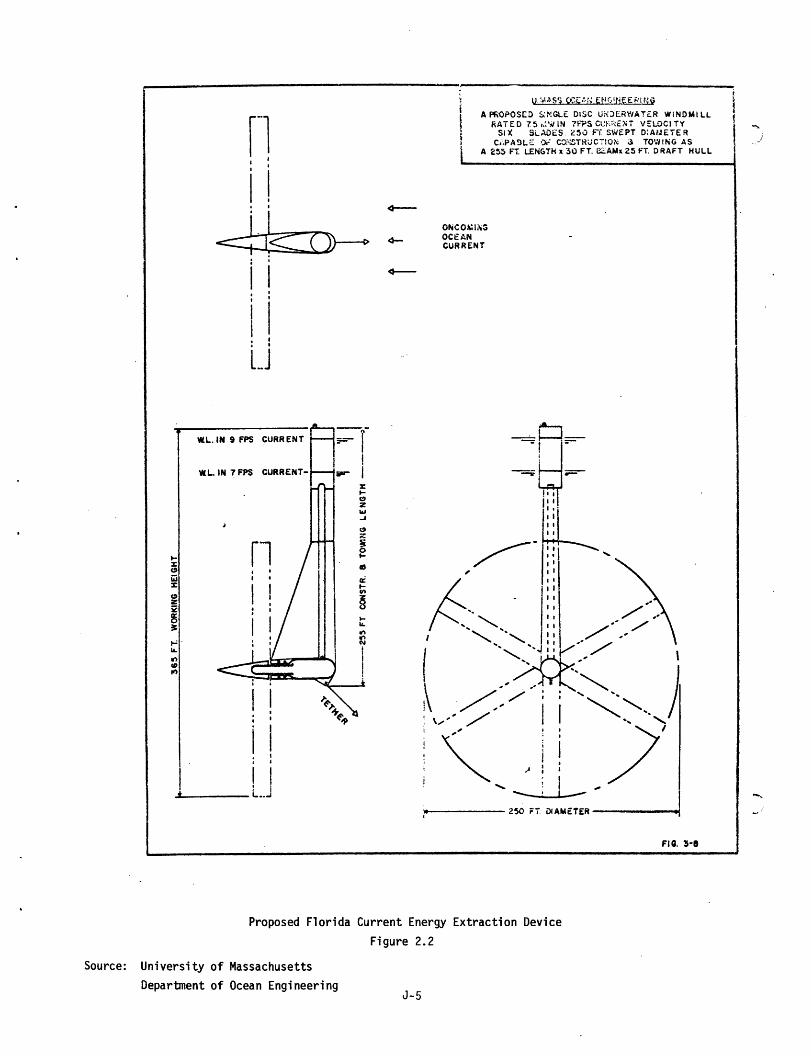
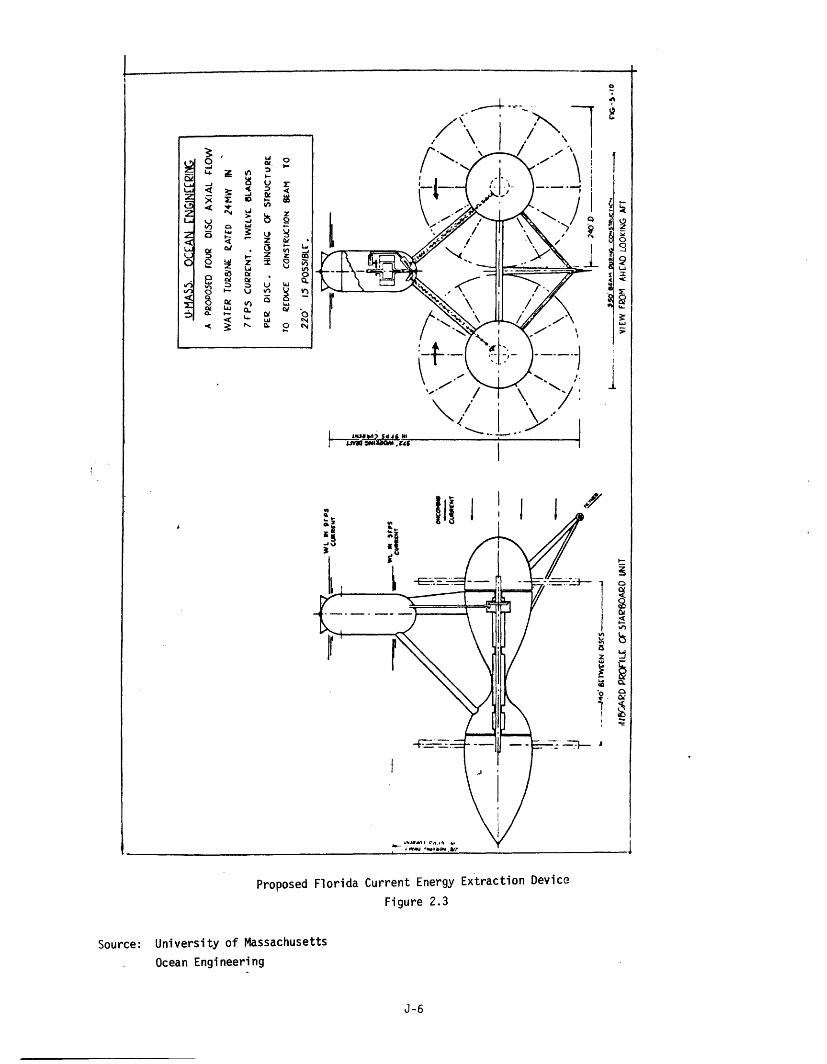
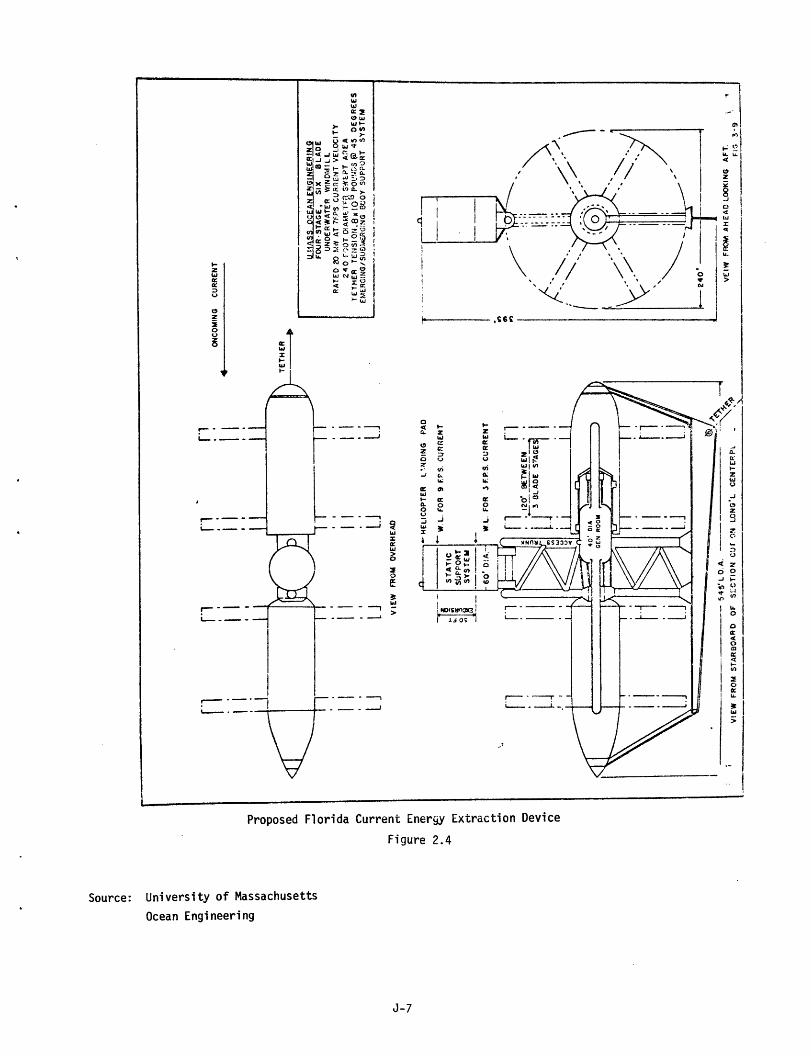
as the fluid speed changes. Figures 22,2 2,3, and 2, 4 illustrate several screw turbine designs
that have been proposed for the extraction of energy from the Florida current, (Heronemus, 1974),
2.2.3 Savonius Rotor
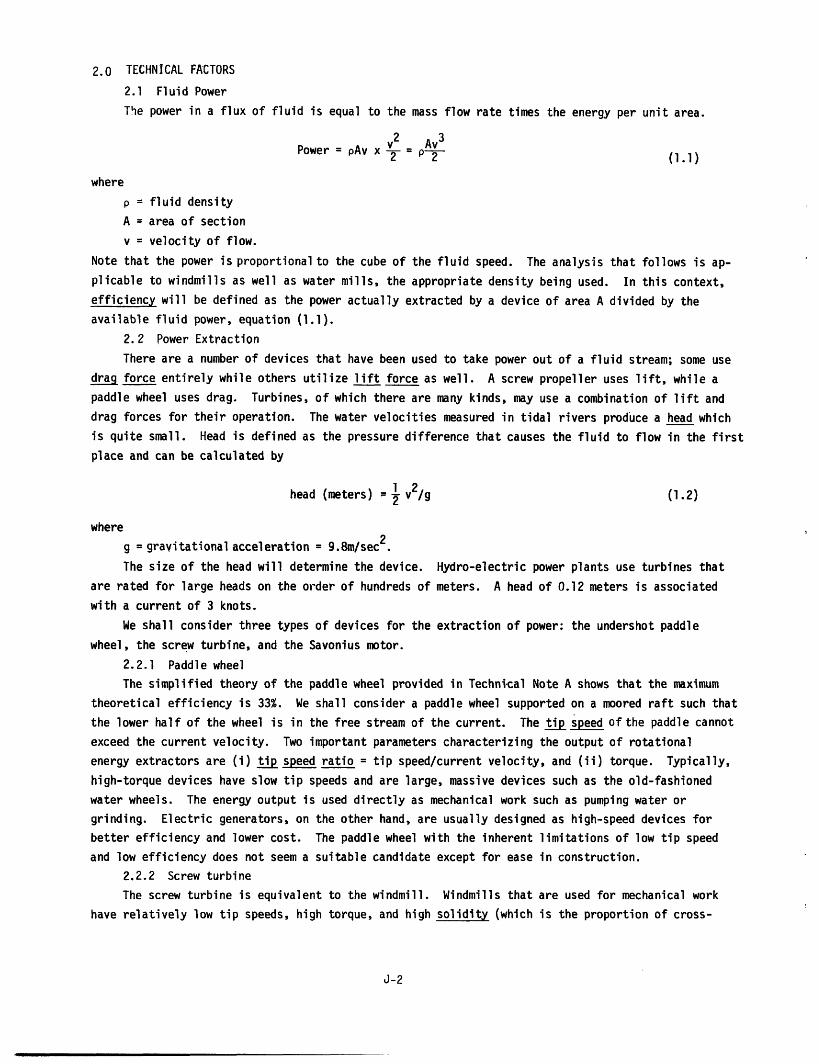
The S-shaped rotor, invented by a Finnish engineer, evolved from the paddle wheel design. Figure
2.5 shows how a paddle wheel with semi-circular blades can be modified to fit entirely in a current.
The mechanism of motion is primarily the difference in drag between the concave and convex sides of
the rotor. Savonius took this idea and displaced the halves in such a way that the flow is redi-
rected, producing a greater exchange of momentum, Figure 2.6. Several series of tests on different
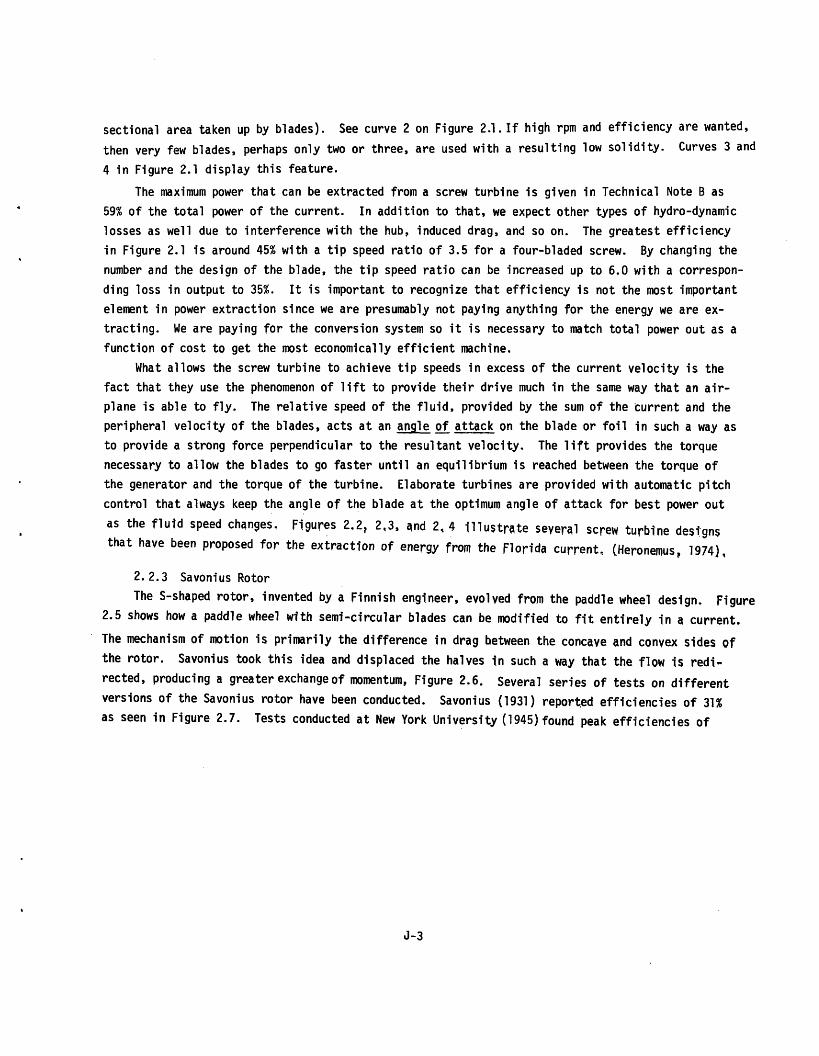
versions of the Savonius rotor have been conducted. Savonius (1931) reported efficiencies of 31%
as seen in Figure 2.7. Tests conducted at New York University (1945) found peak efficiencies of
J-3
,. ;;VO-I ,j.1rotor )
I
i-
Efficiency vs Tip Speed
0 2
T
......i
Ratio for Different Wind Turbines
Figure 2.1
J-4
i
iII
!I
I
,-A(()
o:F;.
HFI-I-irr-.
I
I
Ilft --
I
4
A
i U'.uaS Cr~C~UAS EFl'r('EEIrtNG
A PROPOSED SNGLE DISC UDERWATER WINDMILLRATED 75t,,"1N ?FPS CURFiENT VELOCITY
SIX SLADES. 250 F SWEPT D:AUETERCiPASLE 0~ C=,TRUCT.ION TOVWING AS
A 255 FT. LENGTH x 30 FT. AMx 25 FT. DRAFT HULL
ONCO1i4,SOCEANCURRENT
I
I 1
;I ,
i I
'II a
I I
: .a'I II .i,I i
III II aI i
.--. "
;N1-
I I I.
I I, .I!I, i-I t . ._,,_~~~~~~~~i
.%4 ~ 2250 FT. DIAMETER
FIG. 3-8
Proposed Florida Current Energy Extraction Device
Figure 2.2
Source: University of Massachusetts
Department of Ocean EngineeringJ-b
WL.I
*L.
i
0
g
IL
EDInz
_ _ _ ___·
7--
i
iL--Zi
i \~~~~_ *I" I - I.1
II I
L.
22L.24CLC
X
, ,
>e z U@
o .- U X
a- U .. -O iv' eOXat QX X 4s: Lo
L~.
I
I
S
16V9aI
I
It 0'
Lsi
01-* 0'
A (
Proposed Florida Current Energy Extraction Device
Figure 2.3
Source: University of Massachusetts
Ocean Engineering
J-6
Qz0013
2
r.
__
- -
e
< -i - a
I
I_ .i
I.- $.-z zw X
01
E U.
o 0C, C..m -I
-i
i --
-- .L . _
r- --- r -;.. . , -.-. . ......-..
Proposed Florida Current Energy Extraction Device
Figure 2.4
Source: University of Massachusetts
Ocean Engineering
J-7
z
8
fiS
t.X-t,l0
-- ,S6
z
I.,WW
:1
0z
2
0
9
1`1-4
0
z0
!ier
ee
1
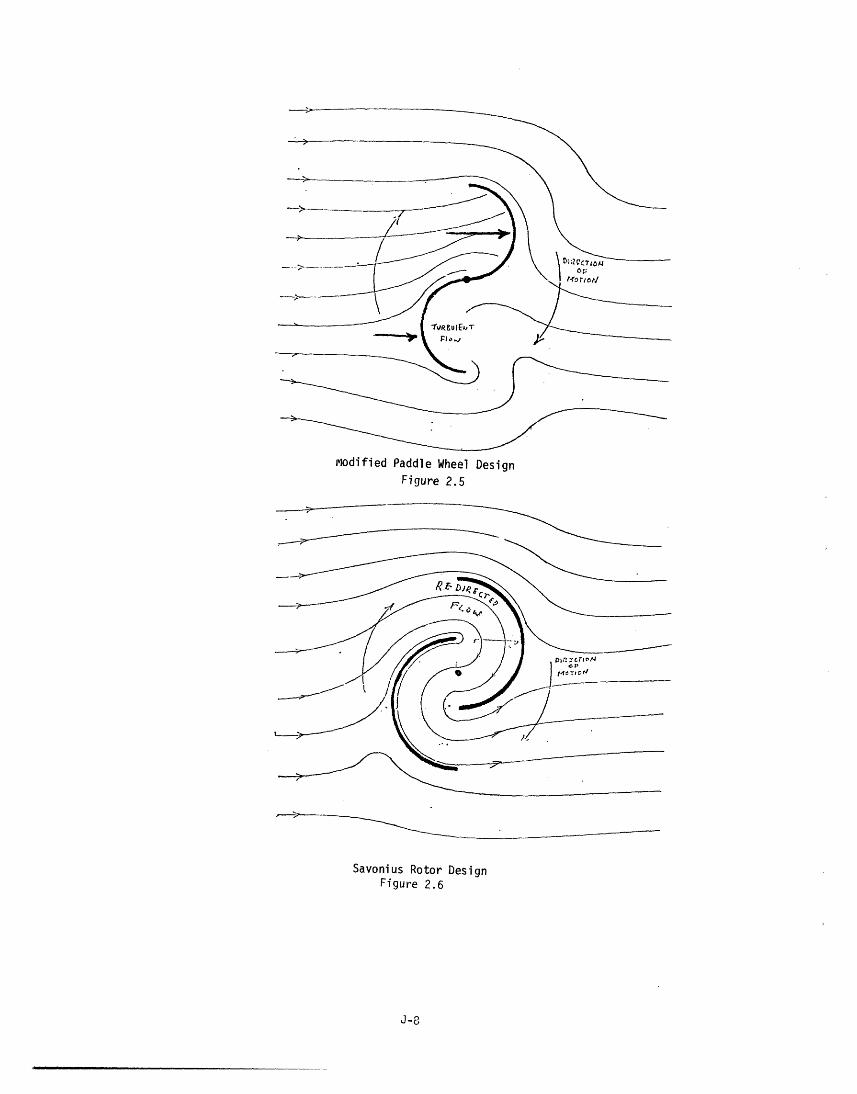
odified Paddle Wheel Design
Figure 2.5
Savonius Rotor DesignFigure 2.6
*
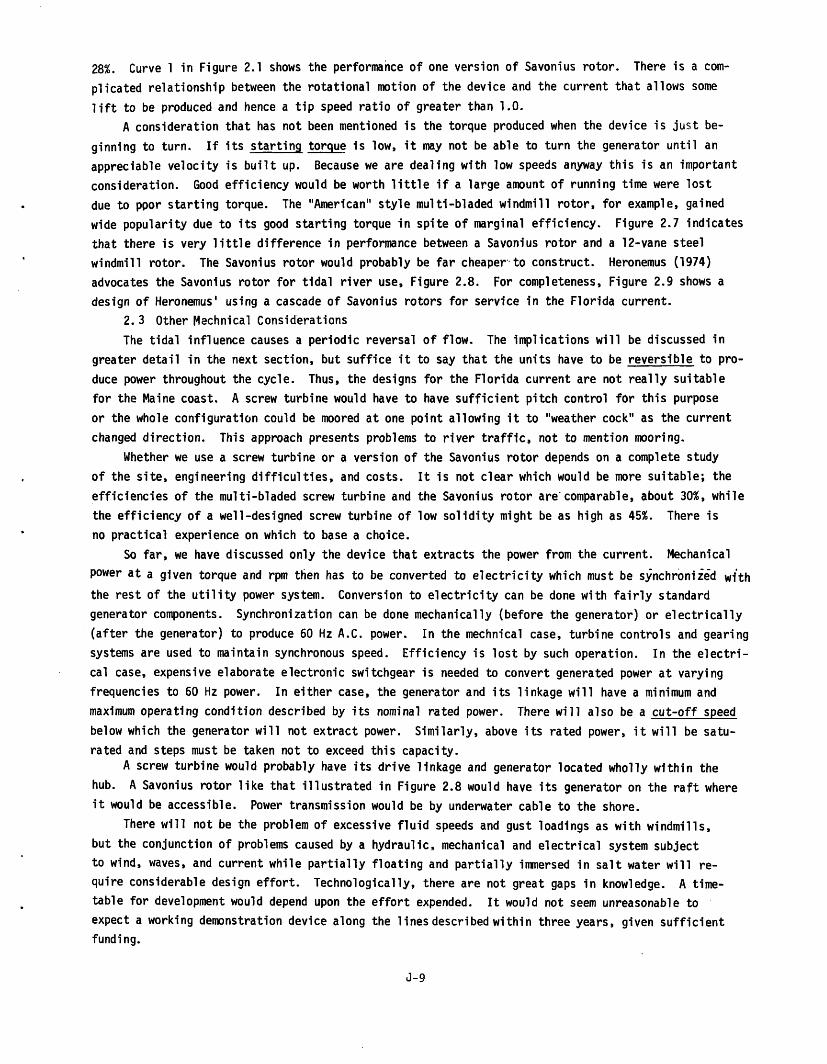
28%. Curve 1 in Figure 2.1 shows the performance of one version of Savonius rotor. There is a com-
plicated relationship between the rotational motion of the device and the current that allows some
lift to be produced and hence a tip speed ratio of greater than 1.O.
A consideration that has not been mentioned is the torque produced when the device is just be-
ginning to turn. If its starting torque is low, it may not be able to turn the generator until an
appreciable velocity is built up. Because we are dealing with low speeds anyway this is an important
consideration. Good efficiency would be worth little if a large amount of running time were lost
due to poor starting torque. The "American" style multi-bladed windmill rotor, for example, gained
wide popularity due to its good starting torque in spite of marginal efficiency. Figure 2.7 indicates
that there is very little difference in performance between a Savonius rotor and a 12-vane steel
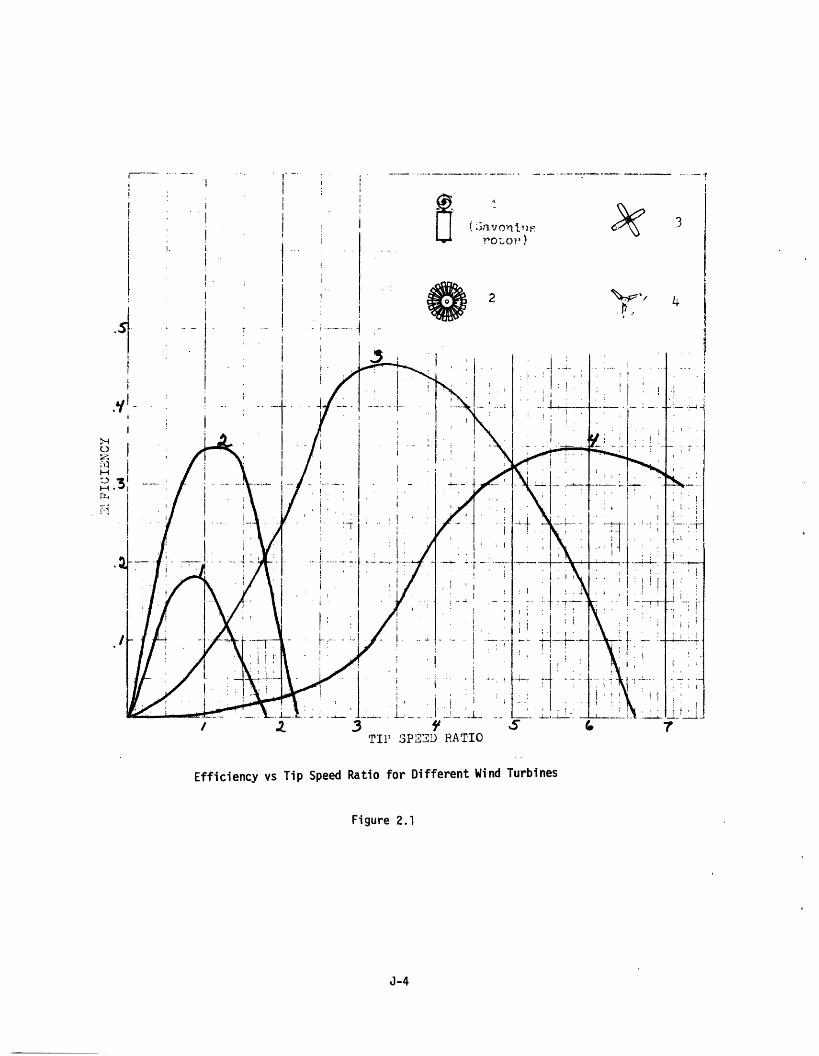
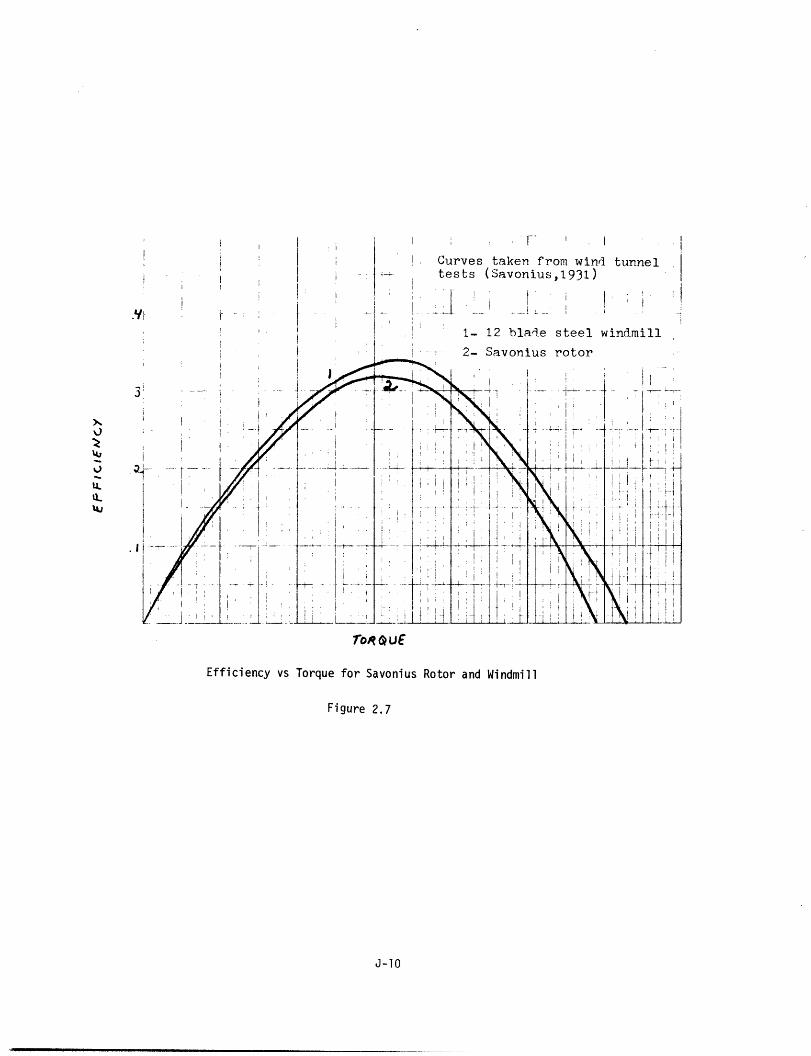
windmill rotor. The Savonius rotor would probably be far cheaper' to construct. Heronemus (1974)
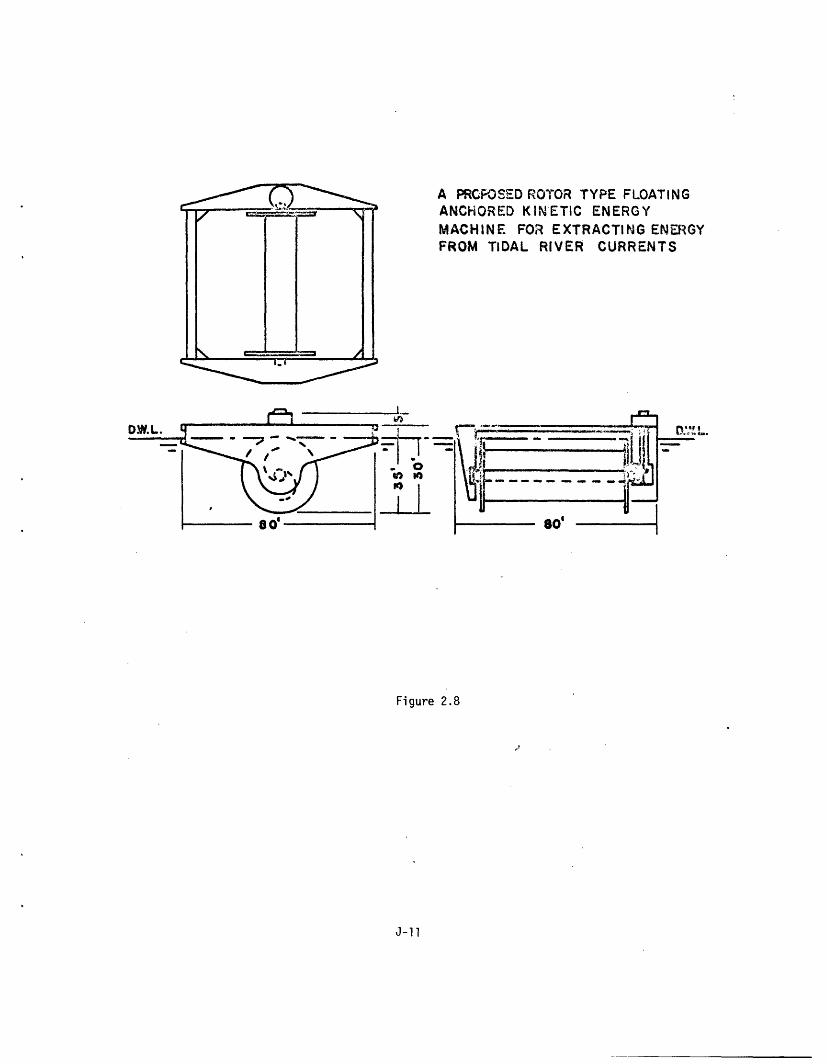
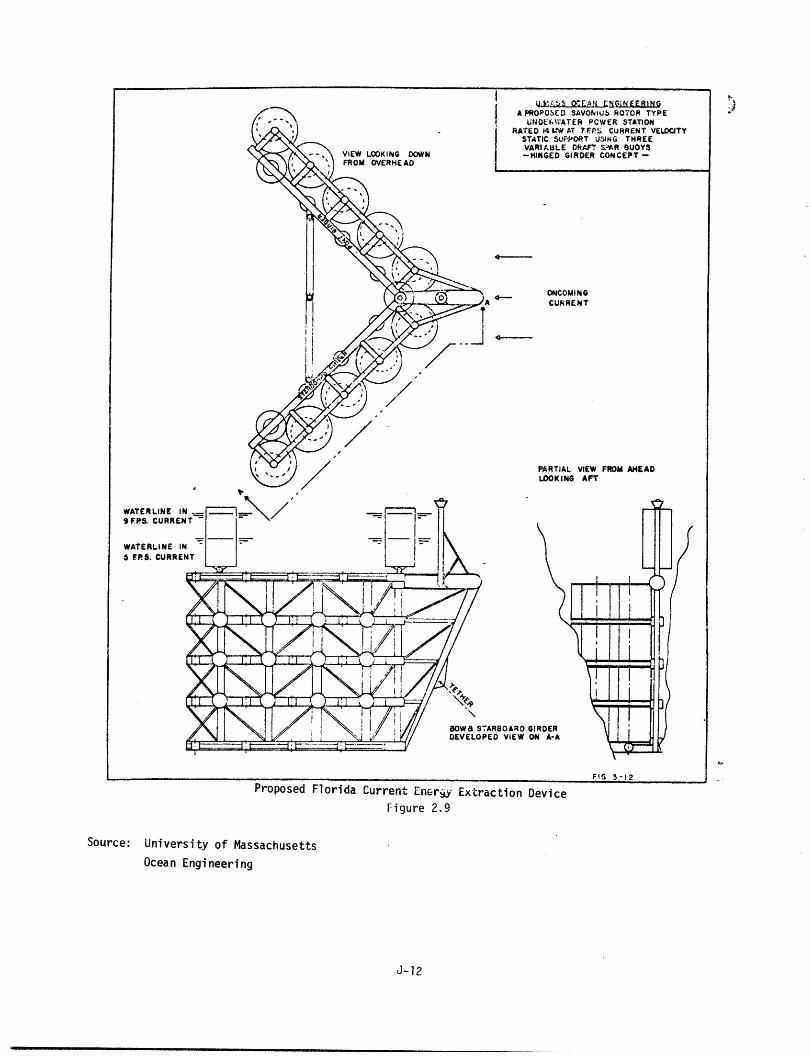
advocates the Savonius rotor for tidal river use, Figure 2.8. For completeness, Figure 2.9 shows a
design of Heronemus' using a cascade of Savonius rotors for service in the Florida current.
2.3 Other Mechnical Considerations
The tidal influence causes a periodic reversal of flow. The implications will be discussed in
greater detail in the next section, but suffice it to say that the units have to be reversible to pro-
duce power throughout the cycle. Thus, the designs for the Florida current are not really suitable
for the Maine coast. A screw turbine would have to have sufficient pitch control for this purpose
or the whole configuration could be moored at one point allowing it to "weather cock" as the current
changed direction. This approach presents problems to river traffic, not to mention mooring.
Whether we use a screw turbine or a version of the Savonius rotor depends on a complete study
of the site, engineering difficulties, and costs. It is not clear which would be more suitable; the
efficiencies of the multi-bladed screw turbine and the Savonius rotor are'comparable, about 30%, while
the efficiency of a well-designed screw turbine of low solidity might be as high as 45%. There is
no practical experience on which to base a choice.
So far, we have discussed only the device that extracts the power from the current. Mechanical
power at a given torque and rpm then has to be converted to electricity which must be synchronized with
the rest of the utility power system. Conversion to electricity can be done with fairly standard
generator components. Synchronization can be done mechanically (before the generator) or electrically
(after the generator) to produce 60 Hz A.C. power. In the mechnical case, turbine controls and gearing
systems are used to maintain synchronous speed. Efficiency is lost by such operation. In the electri-
cal case, expensive elaborate electronic switchgear is needed to convert generated power at varying
frequencies to 60 Hz power. In either case, the generator and its linkage will have a minimum and
maximum operating condition described by its nominal rated power. There will also be a cut-off speed
below which the generator will not extract power. Similarly, above its rated power, it will be satu-
rated and steps must be taken not to exceed this capacity.
A screw turbine would probably have its drive linkage and generator located wholly within the
hub. A Savonius rotor like that illustrated in Figure 2.8 would have its generator on the raft where
it would be accessible. Power transmission would be by underwater cable to the shore.
There will not be the problem of excessive fluid speeds and gust loadings as with windmills,
but the conjunction of problems caused by a hydraulic, mechanical and electrical system subject
to wind, waves, and current while partially floating and partially immersed in salt water will re-
quire considerable design effort. Technologically, there are not great gaps in knowledge. A time-
table for development would depend upon the effort expended. It would not seem unreasonable to
expect a working demonstration device along the lines described within three years, given sufficient
funding.
J-9
..;
I-~--·:n--- -
~1~
i,
I
I
i
. . I
. I, _ _
.,
-t-
C! urves taltests (Sai
' ' I
ken from wind tunnelvonius ,1931 )
. _ I _ f . i ;
1- 12 blade steel windmill
--- 2- Savonius rotor-#e I
I , it i
I I
.- - -t-- -
;I !.. , 1,
-1I
4- .--I I
!
+ ' 1
i '
-- I2 II Ti
:s ' I1
i ' I, 1 i
1 1I i
. ,i
!- i
I
-- 1 ,
' , t
.I
IV . , ,
, V
it - ---I i i I| I
01'l
K- '
ii
J- -I I
rToR uE
Efficiency vs Torque for Savonius Rotor and Windmill
Figure 2.7
J-10
.I
3
It
U4-U
'u
_C _ - ·: . . . - ~- -- -' I L
X- ---- 1-�-·- I
,-Z- --- -
---- L-4- , .
I II
7
i ,
; i
i
I71% . I
I·
! ' I
; - .1
I-- r -j
I I II
! : I
I 1
t- " -1 -I I I
I . I i
I
i - I-J
1 I.
l!Ni;1:
i iI IIit
I �T:I T
! 1,. i. ! i,
J~
I , 1I
I . I I
A PRCPOSED ROTOR TYPE FLOATINGANCHORED KIN'ETIC ENERGY
MACHINE FOR EXTRACTING ENERGYFROM TIDAL RIVER CURRENTS
Figure 2.8
J-11
-I 1~~~~~~--JI
VIEW LOOKING DOWNFROM OVERHEAD
IUJkS OoE-L iA PROPOSED SAVOlNU5 ROTOR TYPE
UNDE\YIATER PCWER STATIONRATED i4 M'W AT ? F.S CURRENT VELOCITY
STATIC SIFPORT USING THREEVARIA.iLE DRAFT S-AR UOYS-HINGED GIRDER CONCEPT-
4-
ONCOMINGCURRENT
PARTIAL VIEW FROM AHEADLOOKING AFT
TARBOARD GIPED VIEW 1O
Proposed Florida Current Energy Extraction Device
Figure 2.9
Fi1 -10
Source: University of Massachusetts
Ocean Engineering
J-12
WATERLINE II9 FPS. CURREI
WATERLINE II5 EPS. CURRE
__~~~~~~~~~~~~~~~~~~~~~~~~~~~~~--
- -
L_ ___
__- I · I - I 1-�- ---- -- ---
V.-
3.0 APPLICABILITY TO MAINE
Maine has a number of tidal rivers that could be candidates for current extraction. Implicit
throughout this presentation is that present uses of the river be maintained and that environmental
effects due to current loss and tidal range diminution from power extraction be carefully considered
to provide maximum social benefit. An inventory of the power extractable from all the tidal rivers
in Maine has not been made at this time. The case has to be presented in detail for each river.
A narrow channel in a river will produce larger currents, thus increasing the power considerably.
Environmental impact of current power is very site-specific. What we shall do is to look at one
site each on the Kennebec and the Piscataqua. These "sites" were chosen only because current flow
information on them is readily accessible and that it is supposed that they are representative of
other sites insofar as power available is concerned, see Table 3.1.
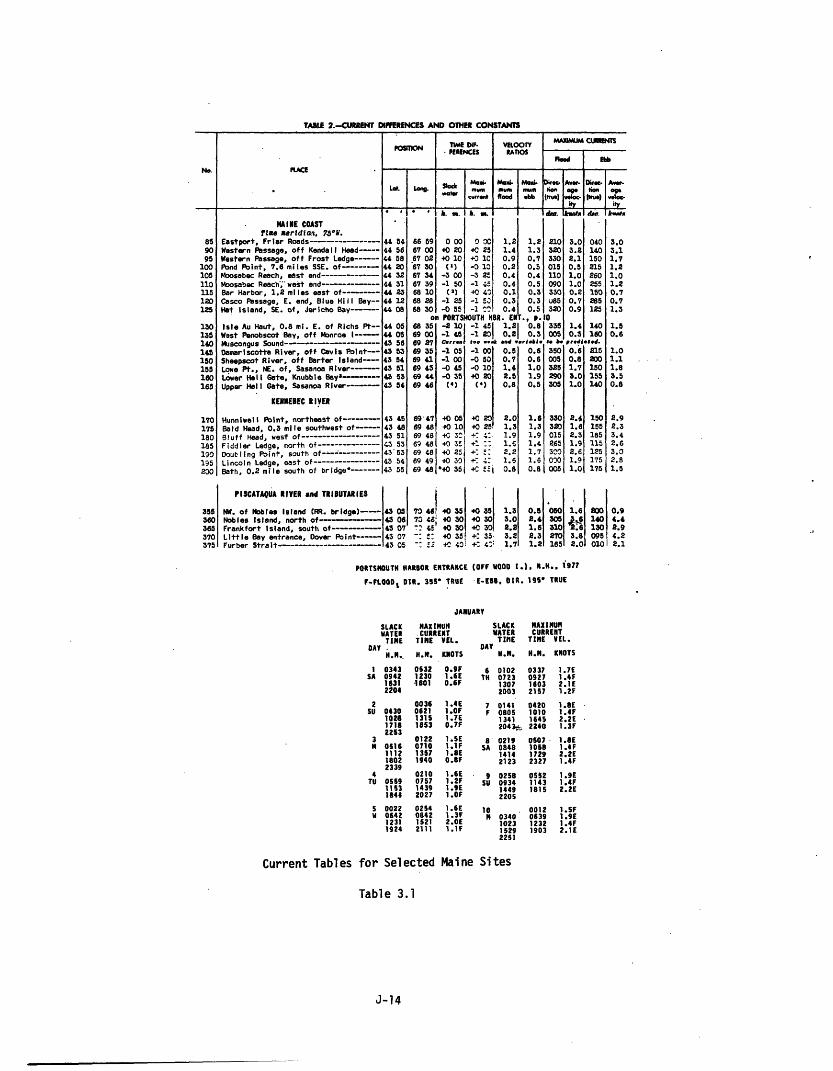
Heronemus (1974) did an analysis based on the current at different locations on the Piscataqua
for a random selection of days throughout the year. The available energy is deduced by integrating
the power over time subject to a power cut-off below a given current speed. We assume simplistically
that the current speed varies like a sine curve whose amplitude is the maximum current and at a pe-
riod equal to 12 hours and 40 minutes, the semi-diurnal tidal period:
v = a sin 2t (3.1)
where
w = 3.1416
a = amplitude (max current)
T = 12 hr 40 min
Technical Note C deduces a formula for the energy per cross-sectional area averaged over one month:
Emonth = 5223(af + ae) KWH/m2 (3.2)
af = max flood current in knots
ae = max ebb current in knots
The current tables give the amplitudes for the Piscataqua at the Nobles Island station as:
af = 4.4k ae = 3.6k
Emonth = 689. kwh/month x m
Peff = .96 KW/m2 (average over a month)
Prated = 6.02 KW/m2 rated power (maximum power)rated
On the Kennebec,south of Doubling Point,
af 2.2k ae = 1.7k
Emonth = 81.3 KWH/month x m2
Peff = .11 KW/m2 (average over a month)
Prated = '75KW/m2 (maximum power)
J-13
TALE 2.-CURRENT DIFfERENCES AND OTHER CONSTANTS
No.
859095
100105110115120125
130135140145150155160165
170175180185190195200
LACE
1OSON
Lot.
44 5444 5644 5844 2044 3244 3144 2344 124408
44 0544 0543 5643 5343 5443 5143 5343 54
43 4543 4843 5143 53
AIIIE COASTfrie eridita. 75'F.
Eastport, Friar Roads-----------------Western Passage, off Kendall Head-----Western Passage, off Frost Ledge------Pond Point, 7.6 miles SSE. of---------Moosabec Reach, east end- ------------Moosabec Reach, west end--------------Bar Harbor, 1.2 miles east of ---------Casco Passage, E. end, Blue Hill Bay--Hat Island, SE. of, Jericho Bay-------
Isle Au Haut, 0.8 mi. E. of Richs Pt--West Penobscot Bay, off Monroe I------Muscongus Sound---------------------Damarlscotta River, off Cavls Point---Sheepscot River, off Barter Island----Lowe Pt., NE. of, Sasanoa River-------Lower Hell Gate, Knubble Bay --------Upper Hell Gate, Sasanoa River -------
KENNEBEC RIVER
Hunnlell Point, northeast of -------Bald Head, 0.3 mile southwest of------Bluff Head, west of -------------------Fiddler Ledge, north of ---------------Doubling Point, south of- ------------Lincoln Ledge, east of----------------Bath, 0.2 mile south of bridge --------
PISCATAQUA RIVER and TRIBUTARIES
3551 N. of Nobles Island CRR. bridg)--- 43360 Nobles Island, north of --- 43368 Frankfort Island, south ot--------143370 Little Bay entrance, Dover Point------1433751 Furber Strait ------------------------. 43
66 5967 0067 0267 3067 3467 3968 1068 2868 30
a68 3569 0069 2769 3569 4169 43694469 46
69-47694869 4869 48
TIME DIrS- ERENCES
Slack
:. .
00040 2040 10
(1)-300-1 50
(5)-1 25-0 55
i PORTS-2 10-1 45
. Curten
-1 05-1 00-0 45-0 35
(4)
40 05+0 10
I EI4353' 69 48; ' 2543 54 69 49 +0 3043 55 69 481 '0 35
Maomumcq)1ta
. in.
OX+C 2543 1C-3 13-3 2!-1 4'+C 42;-1 ' I 1.
4OUTH HE-1 45-1 231
-1 oo-O 51-O 10
40 2,
4040 25.
I-+: -+1 _
+-- ' !
VELOCITYRATIOS
Mimum
1.21.40.90.20.40.40.10.30.4
I. EN1.20.2 I n 0.50.71.42.50.8
2.01.31.91. C2.21.60.8
Mmbb
db
1.21.30.70.50.40.50.30.30.5
r.. .0.80.3
.r'·.·1
0.60.61.01.90.5
1.61.31.91.41.71.60.8
MAXIMJM CURENTS
Mood
Xec-tioaIw-
dw.
210320330015110090330u85320
0335005
350005325290305
33032001526530000005
gil
,,l-
3.03.22.10.51.01.00.20.70.9
1.40.3
0.60.81.73.01.0
2.41.62.31.92.61.91.0
Ebb
Dire Ae
- I we*bIfte).10.
040140150215260255150285125
140160
:t.d.
215200150155140
150155185115125175175
3.03.11.71.21.01.20.70.71.3
1.50.6
1.01.11.83.50.8
2.92.33.42.63.02.81.5
05 746 03 40 35 1.3 0.5 50 1.6 0o 0.906 73 46 030 4030 3.0 2.4 05 1401 4.4
07 4! 40 30 40 30 2.2 1.6 310 130 2.907 0 : 35 33 . 2. 70 3.8 095 4.2
05 --: I 401 + 4; 1.7 1.21 185 2.01 010 2.1
PORTSMOUTH HARBOR ETRAIICE (OFF OD00 1.). N.H., i977
F-FLOOO1 DIR. 355 TRUE -Eli. OIR. 19S' TRUE
JANUARY
nAXIMUMCURRENT
TIE VEL.
H.N. KNOTS
0532 0.9F1230 1.6E1801 0.6F
0036 1.4E0621 1.OF1315 1.7E1853 0.7F
0122 1.5E0710 1.IF1357 1.8E1940 0.8F
0210 1.6E0757 1.2F1439 1.9E2027 1.OF
0254 1.6E0842 1.3F1521 2.0E2111 1.1F
SLACK NAXIMUMWATER CURRENTTIME TIIIE VEL.
DAYN.o H.M. KNOTS
6 0102 0337 1.7ETH 0723 0927 1.4F
1307 1603 2.1E2003 2157 1.2F
7 0141 0420 1.8EF 0805 1010 1.4F
1341 1645 2.2E2043.. 2240 1.3F
8' 0219 0507- 1.8ESA 0848 1058 1.4F
1414 1729 2.2E2123 2327 1.4F
9 0258 0552 1.9ESU 0934 1143 1.4F
1449 1815 2.2E2205
10 0012 1.SFn 0340 0639 1.9E
1023 1232 1.4F1529 1903 2.1E2251
Current Tables for Selected Maine Sites
Table 3.1
J-14
SLACKWATERTIME
DATYNH.l.
1 0343SA 0942
16312204
2SU 0430
102617182253
3n 016
111218022339
4TU 0559
11531844
5 00221 0642
12311924
LonV.
_n. "--t r.
These values are somewhat understated due to the nature of the averaging process. The values given
in the current tables for af and ae are averages of the maximum flood and ebbing currents. The cube
of the average maximum current is less than the average of the cubes of the maximum current. We esti-
mate this factor may cause actual energies to be 1.5 to 3.0 times larger than values calculated from
Table 3.1. Extraction efficiencies are on the order of 10%-20% and conversion efficiencies to electri-
city are on the order of 85%. Total efficiencies would therefore be between 8% and 17%. To correct
for the manner in which the data in Table 3.1 were averaged, we will use a value of 0.24 for our effec-
tive efficiency (efficiency x data conversion factor):
E p =689 KWH x 12 mo x 300 m2 x .24Piscataqua mo m2
: 595.3 MWH/year
E = 8.13 KWH x 12 mo x 300 m2 x .24Kennebec = 8.13 mo m2
= 70.2 MWH/year.
If we assume, for comparison's sake, an annual average capability (the average power level which
would produce the same energy) based on 6000 hrs/yr operation, Piscataqua would be rated at 99 KW and
Kennebec at 12 KW. Because of tidal periodicities the units would have to be rated at much higher power
levels but would operate much shorter periods of time (Technical Note C). A point to be made here is
that a large premium is gained by even a slight increase in current speed. Cost will depend on the
size and complexity of the structure. It would certainly appear to be useful to consider methods of
concentrating the current by special channels or ducts in such a way as not to change the overall flow
characteristics or traditional usage of the river. Since the cost of ducts or channeling may increase
the costs far less quickly than the increase in power out, considerable economies may be achieved by
proper system design.
Clearly, these power and energy levels do not offer a viable alternative to conventional base-loaded
generation. In addition to being quantitatively inadequate, significant amounts of power are available
only every three hours with the device on line about 70% of the time (Technical Note C), and would be
qualitatively different from the constant output of base-loaded generation. Storage could be used to
level the tidal variations, but the best use would probably be in a fuel saver mode. In this mode the
energy from tidal current units would be used to replace energy which would otherwise be generated by
fossil fuels. This mode requires the least sophisticated control equipment and operating strategy and
always is economically attractive since the operating costs of a unit of energy from an existing tidal
current device will always be less than the operating costs for a unit of energy from fuels. Since the
energy, barring failure of equipment, would be available on a predictable basis each day, fossil fuel-
powered generation could be backed down when tidal current energy was being produced.
4.0 ECONOMICS
As there is no modern design experience with current power generators, capital cost data have
been taken directly from estimates by the Kaman Corporation (1976) for a wind turbo-generator.
peak rated power cost of drive system cost of elec. system total cost cost per kw 1986 $/kw*
500kw $ 64,800 $ 43,800 $108,600 $217 $326
1500kw $ 181,000 $ 78,000 $259,000 $173 $258
Assuming a unit of 300 m2, our sites on the Piscataqua and the Kennebec have rated powers of 1806
and 226 kw respectively. These imply power system costs of $466,000 for Piscataqua and $73,700
for Kennebec. Recall these refer to only one device whose cross-sectional area normal to the flow is
300 m2. Costs are in 1986 dollars, and do not include moorings, foundations, site access, environmental
monitoring, or interest costs during construction.
Transmission cost estimates (Somers and Shoupp, 1974), when applied to a river tidal turbine, would
probably contribute only about $18/kw as the transmission distance to shore is negligible; losses are
small and repair is easy. Transmission costs to the grid depend on the site.
*Assumes simple escalation @ 5% per year.
J-15
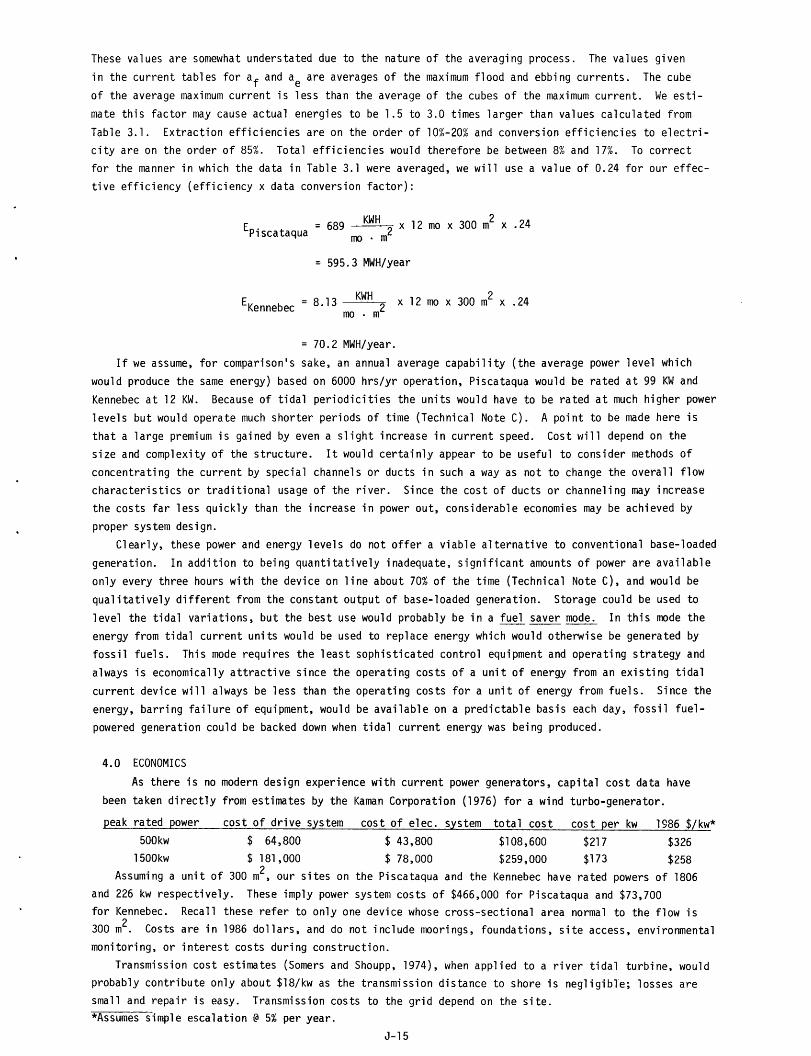
Table 4.1
Estimated Current Device Costs
"Piscataqua" "Kennebec"
COSTS: (1986 dollars) $1000 $1000
rotor $ 325.7 $ 43.9
generator 140.0 29.6
transmission to shore 32.4 4.1
(1) Subtotal $ 498.1 $ 77.6
operation and maintenance
@ 6% of (1) per year 29.9 4.7
levelized annual capital
charges for (1) at 18% 89.7 14.0
Total annual costs 119.6 18.7
electrical energy per year 595.3 MWH/year 70.2 MWH/year
ENERGY COST(1986 dollars) 201 mills/KWH 266 mills/KWH
5.0 ENVIRONMENTAL IMPACTS
The use of either a Savonius rotor or a multibladed turbine will probably have similar effects
on the environment. The turbine will have higher tip speeds thus posing some possibility of danger
to fish.
The moored structure will not add to the esthetics of the river but to the extent that moored
ships degrade the view, the insult will be minimal.
The siting should obviously be done to minimize the impact upon the environment and traditional
uses of the site such as navigation, fishing, pleasure boating, etc. Some rivers like the Kennebec
have quite a lot of ice which would pose a problem.
The greatest direct threat stems from the fact that as energy is absorbed the current is dimi-
nished. In Technical Note B it is derived that optimum extraction would diminish the local current
by one third. However, the whole river is not going to be tapped, just some fraction. Obviously
themore devices that are emplaced, the more the flow will be retarded.
An important element of an environmental statement for a proposed site would be just how the
river flow would be affected and hence the ecosystem the river supports.
6.0 CONCLUSION
Ocean currents off the Maine coast are too weak to be considered as a power source, however,
tidal forced river currents do offer power densities on the order of 1 - 5 KW per square meter of
intercepted current. The power output varies as the cube of the current velocity and depends primari-
ly on the tidal cycle. Consideration of current power on a base-loaded mode is not likely due to
the periodicity and small power density. Generation of power in a fuel-saver mode may be considered
if the estimated energy cost of 201 mills/KWH (1986 dollars) becomes competitive.
J-16

7.0 REFERENCES
Woolley, M. and J. Platts, "Energy on the Crest of a Wave," New Scientist, May 1, 1975, 241---3.
Zeigler, M.H., P.V. Hyer, and M.L. Wass, "Environmental Effects Arising from Salinity Gradient and
Ocean Wave Power Generating Plants," ERDA Report Number C00O-2946-1.
Charlier, R.H. "Harnessing the Energies of the Ocean, a Review and Bibliography," Marine Society
Technology Journal, 1969, 3(3) and 1969b 3(4).
Gray, T.J., and O.K. Gashus, Tidal Power, Proceeedings of the 1971 International Conference on the
Utilization of Tidal Power, Plenum Press, 1972.
Heroneumus, W.E., and P.A. Mangarella, "On the Extraction of Kinetic Energy from Oceanic and Tiday
River Currents," MacArthur Workshop on Energy from the Florida Current, Feb. 27 - March 1, 1974,
NOAA Atlantic Ocean. and Meteor. Lab., Miami.
Kaman Aerospace Corporation, Design of Wind Turbines 50 KW to 3000 KW for Electric Utility Applications
ERDA/NASA - 19404-76, February 1976.
National Ocean Survey, Tidal Current Tables 1977, Atlantic Coast of North America, U.S. Dept. of Com-
merce, 1976.
New York University, "Final Report on the Wind Turbine," Appendix C, Office of Production Research and
Development, PB 25370, 1946.
Savonius, S.J., "The S-Rotor and its Applications," Mechanical Engineering, 53, 5, May, 1931.
Sheets, H., "Energy Recovery from Fluid Motion," MacArthur Workshop op. cit., 1974.
Somers, E.N. and Shoupp, W.E., "Electric Power Production from the Florida Current," MacArthur Workshop,
op cit. 1974.
TRIGOM, A Socio-Economic and Environmental Inventory of the North Atlantic Region, Vol. I, Book I.,
(TRIGOM - The Research Institute of the Gulf of Maine, under contract 08550-CT3-8 to Bureau
of Land Management), November 1974.
Wilson, E.M., "Energy from the Sea -- Tidal Power," Underwater Journal, 1973, (5), 175-186.
J-17

TECHNICAL NOTE A
ENERGY EXTRACTION FROM DRAG-ASSOCIATED DEVICES_
When a stationary surface is placed in a fluid moving perpendicularly to the surface with
velocity U and density p, the force on the surface is given by
F = Cdp A U2 = p Cd A U 2
dP2 d
A = area of surface
Cd = coefficient of drag (A.1)
Cd depends primarily on the shape of the surface. If the surface is moving with a velocity v which
is less than U, then the relative velocity of the fluid with respect to the surface is (v - U).
The force on the surface is then
F = Cp A (v - U)2 (A.2)
and the power absorbed by the moving surface is given by
P = Cd p A (v - U)2v (A.3)
The velocity of the surface which will result in the maximum power absorbed can be found by taking
the derivative of (A.3) with respect to v:
d. PCdA(U2v - 2Uv2 + v3 )] = .CdpA (U2 _ 4Uv + 3v2) (A.4)
Setting this equal to zero, we get
(U - 3v) (U - v) = O. (A.5)
The maximum power is absorbed when v = U or when the surface is moving down stream at one-third
of the current speed. When the surface is moving at this velocity, the power absorbed is
P = CdPA(U- v) v = dPA (U v)2 U (A.6)
= of the power available to the moving surface.
So the maximum efficiency of extraction for a drag device is 33%.
J-18

TECHNICAL NOTE B
ENERGY EXTRACTION FROM LIFT-ASSOCIATED DEVICES (from Sheets, 1974)
The recovery of energy from fluid motion such as from water by means of water wheels, or from
air by means of windmills, has been in use for a long time. Over the years, the configuration of
the impeller wheels has changed. The basic problem consists in that the fluid velocity in the
energy recovery cannot be reduced to zero, as this would stop the fluid motion. It is quite evident
that too high a flow restriction by the energy-recovering device would simply cause the flow to by-
pass the energy recovery device. One can postulate the question, "How much can the velocity of the
fluid flow be reduced for optimum energy recovery and simultaneously without harming the environment?"
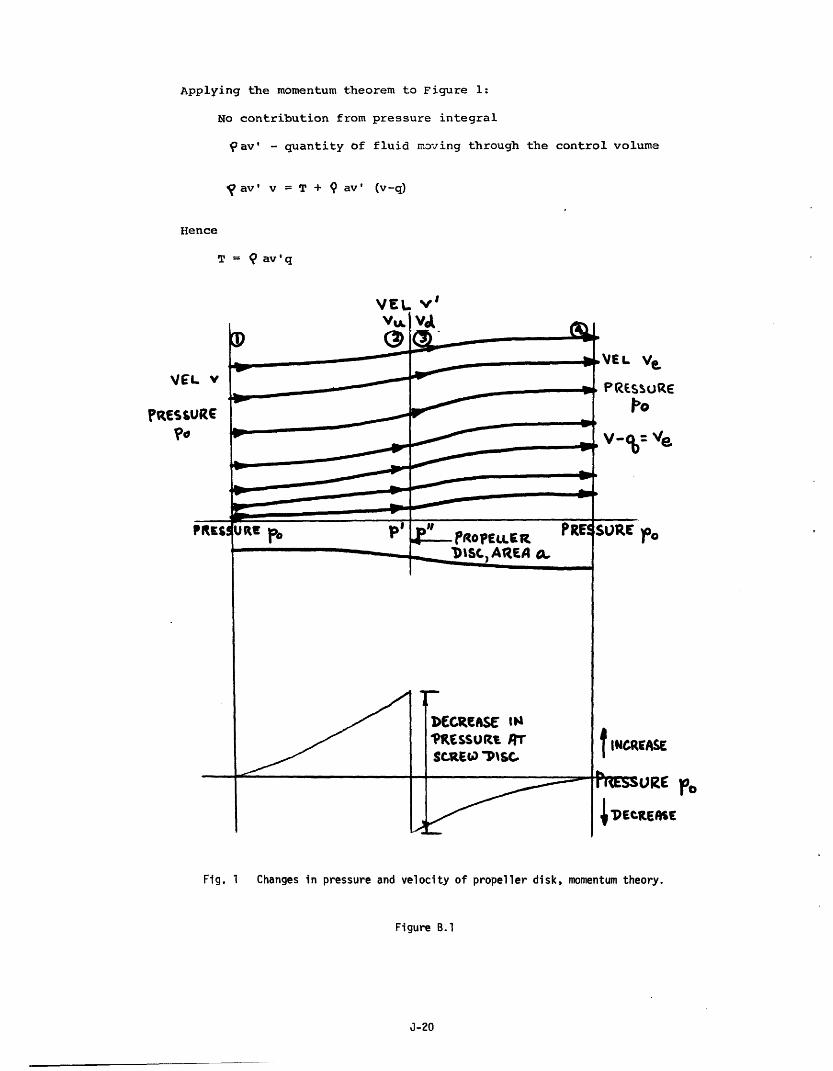
The following analysis solves this problem for the ideal case of an unshrouded propeller (Fig. B.1)
which is treated as an infinitely think disk. For this analysis, the following nomenclature is used:
p - undistributed pressure
v - inflow velocity
v - q - exit velocity
a - cross-sectional area of the actuator disk
p' - pressure in front of the actuator disk
p" - pressure behind the actuator disk
q - velocity removed from the fluid by the disk.
In the immediate vicinity of the disk by continuity:
avu = avd = av' (B.1)
Hence, the velocity in front of (Vu) and behind (Vd) the disk is the same. Employing Bernoulli's
Theorem along the streamline 1 - 2 gives:
P + pv 2 =p' + p 2 (B.2)
and along 3 - 4 gives:
1 2 1 ,2 (B.3)pO + p(v q) = p + v (B3)
By subtraction we get the drop of pressure p = p' - p"
p - p" = A P + p v2 - 1 (v q)
AP 1 2 (v _ 2qv + )
= p q(.2v - q)
AP = rpq(v - q/2) (B.4)
Then the thrust imparted to the actuator disk by the fluid is
Td = a p = p aq(v - q/2) (B.5)
or the thrust imparted to the fluid by the disk is
J-19
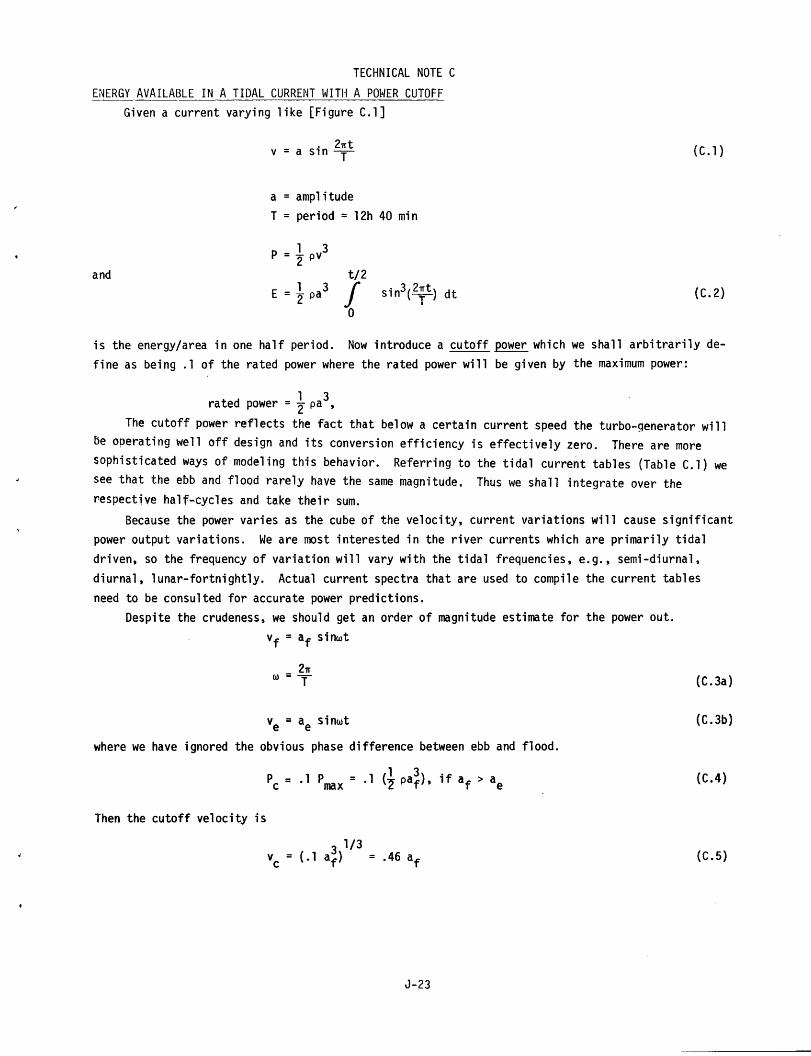
Applying the momentum theorem to Figure 1:
No contribution from pressure integral
pav' - quantity of fluid monving through the control volume
Vav v = T + 9 av' (v-q)
HEence
T = Q av'q
'ROPopEL ERS) AIREA a.
PREC
iVEL Ve,
PRESSURE
ISIRE o
h,~ssORE o
, 9EclME AS
Fig. 1 Changes in pressure and velocity of propeller disk, momentum theory.
Figure B.1
J-20
VEL v'v.. I vlL"I 'C·-
-1--
V/EL v
PRESSURC
Po
PRES Rt po p.
IDCCRCASE 1I
'PREssuRE ftSC.REP P\SC,
r P.
-
- Im IIq
- -
m------
i , I . -
D ( SL�-cC�·e�
S�c---ec�-3

(B.6)Tf = - Td = paq (- v + q/2)
Applying the momentum theorem to Figure B.1:
No contribution from pressure integral
p av' - quantity of fluid flowing through the control volume
p av' v = Td + p av' (v - q) (B.7)
Hence
Td = av' q. (B.8)
Comparing equations (B.5) and (B.8) gives:
v' v - q/2 (B.9)
Available work is: where r= radius (effective) of propeller
E = r2 v' p
= r2 p q(v - q/2)2 (B.10)
This obtains a maximum value when
2v (B.11)q=- 3-.
Substituting gives:
Ema wr2 2v 2v- )2
2 2v 2v 2= r p 3_ (T)
8 v 3. (B.12)Emax = wr p (B.12)
The maximum energy obtainable from the free stream is:
Etotal = mass flow rate x energy/unit mass Etta l = p v x v2
Etota = r2 v (B.13)
Therefore, the maximum theoretical efficiency is:
~-E I 2 3 - ~7Emax 27 r2 v 16nth Etotal 2 r v A2
nth = .5926
Ve = v - q = v - v = v (B.14)e 3 3½
J-21

The above analysis indicates that there is indeed an optimum discharge velocity, ve , which
equals one-third of the incoming velocity, v, for the ideal case. It also indicates that the
maximum energy recovery for this ideal case equals 59.3% of the incoming kinetic energy. This
case considers only a single open propeller turbine unit. It is also clear that the surrounding
fluid motion and its field of forces will accelerate the discharge fluid, ve , to bring it back
to a uniform value with the surrounding fluid flow. The above analysis is, therefore, only cor-
rect for a single unit, and it assumes that the amount of flow acting on the energy recovery device
is relatively small compared to the surrounding flow.
If more than one unit for energy recovery is needed, the arrangement in clusters will be jus-
tified only if the flow through these units is small compared to the total fluid. In order to re-
duce effects on the environment, it may be preferable to arrange multiple units with space be-
tween each other so that the flow has an opportunity to adjust itself in as short a time and
as short a distance as possible.
J-22
___
TECHNICAL NOTE C
ENERGY AVAILABLE IN A TIDAL CURRENT WITH A POWER CUTOFF
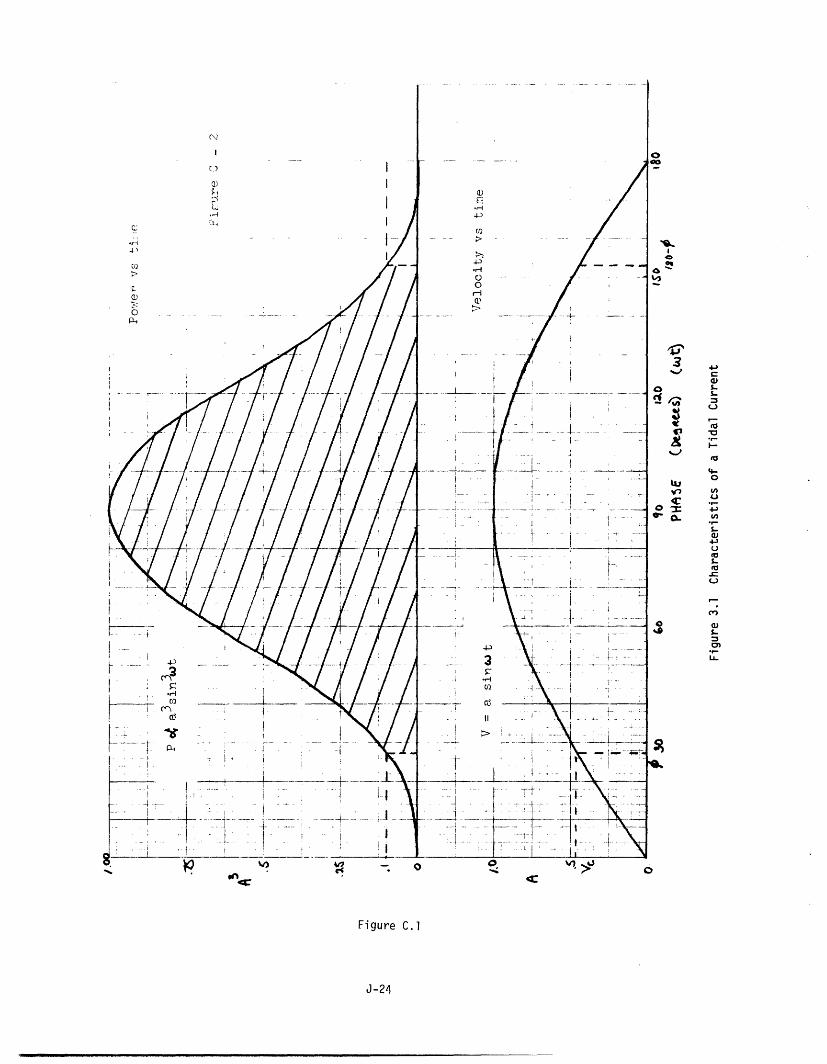
Given a current varying like [Figure C.1]
v = a sin 2 (C.1)
a = amplitude
T = period = 12h 40 min
P = pv32
and t/2
E = a3 / sin3(2 dt (C.2)
0
is the energy/area in one half period. Now introduce a cutoff power which we shall arbitrarily de-
fine as being .1 of the rated power where the rated power will be given by the maximum power:
13rated power = pa
The cutoff power reflects the fact that below a certain current speed the turbo-generator will
be operating well off design and its conversion efficiency is effectively zero. There are more
sophisticated ways of modeling this behavior. Referring to the tidal current tables (Table C.1) we
see that the ebb and flood rarely have the same magnitude. Thus we shall integrate over the
respective half-cycles and take their sum.
Because the power varies as the cube of the velocity, current variations will cause significant
power output variations. We are most interested in the river currents which are primarily tidal
driven, so the frequency of variation will vary with the tidal frequencies, e.g., semi-diurnal,
diurnal, lunar-fortnightly. Actual current spectra that are used to compile the current tables
need to be consulted for accurate power predictions.
Despite the crudeness, we should get an order of magnitude estimate for the power out.
vf = af sinwt
2wwe T (C.3a)
ve = ae sinwt (C.3b)
where we have ignored the obvious phase difference between ebb and flood.
1 3 (C.4)Pc: .1 Pma = .1 (2 paf), if af > ae (C.4)
Then the cutoff velocity is
31/3c (.1 af) = .4 6 af (C.5)
~~~~~~~~~~~~~~~~~~C.5)
J-23
C-~~~~~~~-la)-l
-4,
C-0U)C'
O .II
f- --- PI I _
I i
- - -- -i
-H- · KZ
onf0
I
19
I
-t_. _ _ffj
I j
O
rH
4 ~~~I-
I- -i- _ _
3
co(2
i
I - v t - .
1 .,, i -
_~~ ~ ~ __,.___
x - --* - - --, } l-r !i I - -
- -- I , I - . .,- I-
--- :w-- - 21
I i .i_-
i ' - II -I-
O 04c
Figure C.1
J-24
O¢0
a
'3
3 J
aQ)
0 LS-)
i i
(a
4-tu °4cO = 4)
5-Q'Uoo5-uUQ1 .Qa
cnL
0yl- -- -w~~~- -- - , .- _,----- _---- -· . - IL~--~ I-
-- C-- I_ -- s
I
I
I
I
t
-_
. I
7-
f -
im
IiI
. _
"-1't
i
-,"r- --I-I I \
rf

Because of the third power behavior, we get no power from the converter until the current has reached
almost half of its maximum. Refer to Figure C.2.
When the current has reached vv the the device comes on line and all the power in the current
can be extracted. The shaded area in Figure C.2 represents available energy per half cycle.
E = pa3 fEf 2 pa f
E =I k 3~~~~4
Ee P% *
(C.7a)sin 3 (t) dt
sin3 (wt) dt (C.7b)
T2
T1
sin3 wt dt = -3coswt + cos 3wt4w 12w
where T2 = - +, T1 = + = sin 1 (vc/a) = sinl1 (.46) = .478.
1.309Evaluating, we get 1 as the value of the integral.
If we had no cutoff this value would be 1.5 so we lose (1.5 - 1.309/1.5) = 13% of the energy due to
cutoff at 10% of the rated power. Furthermore we can see that the current necessary is about half
(.478) max current, and
2 = .30
implying that the device will not be extracting any power about 30% of the time.
1 3 1.309f = 2 pf Ef = pa3 1.309e 2 pe
Over the period of one month there are 28 flood half-cycles and 28 ebb half-cycles.
Emonth = 29 x x p x /w x 1.309 x (af + a) = 5223 (af + ae) kwh
where
p = 1035 kg/m3 for salt water
= 2 = .469 radians/hour
afs ae are given in knots (1 knot q 5.5 m/sec).
(C.9a)
(C.9b)
(C.10)
J-25
(C.8)