Alternate Testing Method for Fault Testing onboard Dynamic ... · ships classification and ensure...
44
Alternate Testing Method for Fault Testing onboard Dynamic Positioning Vessels Using a PLC Anna J. Moorman Thesis submitted to the faculty of the Virginia Polytechnic Institute and State University in partial fulfillment of the requirements for the degree of Master of Science in Electrical Engineering Virgilio A. Centeno, Chair Jaime de la Ree Lopez Steve Southward July 6th, 2015 Blacksburg, Virginia Keywords: PLC, Dynamic Positioning, Shipboard Power Systems, Short Circuit testing
Transcript of Alternate Testing Method for Fault Testing onboard Dynamic ... · ships classification and ensure...
Alternate Testing Method for Fault Testing onboard Dynamic Positioning Vessels Using a
PLC
Anna J. Moorman
Thesis submitted to the faculty of the Virginia Polytechnic Institute and State University in
partial fulfillment of the requirements for the degree of
Master of Science
in
Electrical Engineering
Virgilio A. Centeno, Chair
Jaime de la Ree Lopez
Steve Southward
July 6th, 2015
Blacksburg, Virginia
Keywords: PLC, Dynamic Positioning, Shipboard Power Systems, Short Circuit testing

Alternate Testing Method for Fault Testing onboard Dynamic Positioning Vessels Using a PLC
Anna Moorman
(ABSTRACT)
Direct fault testing onboard Dynamic Position Vessels is a requirement to maintain the
ships classification and ensure redundancy of the power system onboard to maintain position.
The most vulnerable part of the ship when testing occurs is when a three phase fault is placed on
a main bus. This puts tremendous amount of strain on the system. This thesis offers an alternate
and safer way to ensure the protection equipment is working properly by using a fault signal
using from Programmable Logic Controller in conjunction with the protection relays. A working
PSCAD model of Transocean’s DEEPWATER CHAMPION was developed using a one line
diagram. Using the developed PSCAD model three phase fault currents could be calculated and
then simulated as a scaled down secondary current to use for testing the protection relays. To test
the development of the system model, different bus configurations were analyzed to determine
loss of thruster capabilities which deter the vessel to maintain position.

iii
Acknowledgments
I am appreciative of a committee who helped me increase my skills in engineering. Their
guidance, patience, and encouragement were a strong motivator.
I would like to thank the U.S. Coast Guard Marine Safety Center for giving me the opportunity
to study at Virginia Tech to further my knowledge. In particular, I would like to thank Dave
O’Donnell and engineer at the Marine Safety Center who helped procure drawings and reports
from his colleagues in the offshore industry.
Next, I would like to thank my lab mates in the Power Lab who helped make my last two years
enjoyable. They offered sound advice and different methods to trouble shoot various problems
that arise.
Finally, I would like to thank my family who always put an importance on education growing up.
Without their support I do not know where I would be.

iv
Table of Contents
Abstract .................................................................................................................................... ii
Acknowledgments ....................................................................................................................iii
List of Figures and Tables ........................................................................................................iv
Chapter 1: Introduction and Review of Dynamic Position Vessels ................................... 1
1-1 : DP Power System............................................................................................................................. 2
1-2 : Loss of position .............................................................................................................................. 3
1-3 : Design Storm method ...................................................................................................................... 3
Chapter 2: Modeling DEEPWATER CHAMPION in PSCAD ........................................ 6
2-1 : Cables.............................................................................................................................................. 7
2-2 : Generators model ............................................................................................................................. 8
2-3 : Transformers model ....................................................................................................................... 10
2-4 : Circuit Breakers model .................................................................................................................. 10
2-5 : Relays ............................................................................................................................................ 11
2-6 : Thrusters model.............................................................................................................................. 13
2-7 : Faults .............................................................................................................................................. 13
2-8 : FULL DEEPWATER CHAMPION model................................................................................... 14
2-9 : Validation of the model .................................................................................................................. 15
Chapter 3: Programmable Logic Controller ..................................................................... 16
3-1 : Background of Testing .................................................................................................................. 16
3-2 : Testing Hardware .......................................................................................................................... 17
3-3 : Findings ........................................................................................................................................19
Chapter 4: PSCAD fault current calculations ....................................................................24
4-1 : Split bus configuration ................................................................................................................... 25
4-2 : Ring configuration ......................................................................................................................... 29
4-3 : Single bus configuration ................................................................................................................ 31
Chapter 5: Conclusions, Recommendations and Future Work ........................................ 33
References ............................................................................................................................. 35

v
Appendix A: Protection configuration……………………………………………….…36
Appendix B: One line diagram view of PSCAD model…………………………...…....37
Appendix C: Wiring diagram for hardware......................................................................38
vi
List of Figures and Tables
Figure 2.1: Generator model ............................................................................................... 9
Figure 2.2: Relays to control breaker operation ................................................................. 12
Figure 2.3: One-line diagram of DEEPWATER CHAMPION…………………………..14
Figure 3.1: Relay and PLC .................................................................................................18
Figure 3.2: Phase A fault .................................................................................................... 19
Figure 3.3: Phase B fault ................................................................................................... 20
Figure 3.4: Phase C fault ................................................................................................... 21
Figure 3.5: B-C fault ......................................................................................................... 22
Figure 3.6: Three phase fault ............................................................................................ 22
Figure 4.1: Three phase fault on center switchboard ........................................................ 25
Figure 4.2: Fault on center switchboard............................................................................ 25
Figure 4.3: Three phase fault on port switchboard ........................................................... 26
Figure 4.4: Fault on port switchboard .............................................................................. 27
Figure 4.5: Three phase fault on starboard switchboard .................................................. 28
Figure 4.6: Fault on starboard switchboard ...................................................................... 28
Figure 4.7: Three phase fault on ring configuration… .................................................... 29
Figure 4.8: Fault placement in ring configuration ........................................................... 30
Figure 4.9: Three phase fault on single bus configuration… ........................................... 31
Table 4.1: Configuration and loss of thrusters…………………………………………..32

1
Chapter 1: Introduction and Review of Dynamic Position Vessels
Hydrocarbon reserves are estimated to be about 4 billion in the Gulf of Mexico [1]. To
extract these reserves dynamic position (DP) drill ships are used to remain on location at ocean
depths up to 10,000 ft. under extreme weather conditions. To maintain position and heading, the
reliability of the power system onboard these vessels is crucial. The most vulnerable part of the
power system onboard these vessels is a main bus while the most onerous fault is the three phase
fault. In fact, the marine consultancy group of Global Maritime conducts the Failure Mode and
Effects Analysis (FMEA) which performs reliability tests including short circuit tests during
proving trials. All DP vessels have to have trials maintained during operational phase, if
alterations are made to the system, or updates to the test program are needed to maintain the
vessel’s classification [2].
DP drill ships are categorized with different classifications depending on their redundancy
and ability to remain on position due to a failure. The different classification allows owners and
workers to determine the risk criteria for whichever operation is needed. The ship that is
modeled in this work is Transocean’s DEEPWATER CHAMPION which is a DP2 classification.
According to the International Maritime Organization publication 645, (IMO, 1994), “Equipment
class 2 has redundancy so that no single fault in an active system will cause the system to fail.
Loss of position should not occur from a single fault of an active component or system such as
generators, thruster, and switchboards, but may occur after failure of a static component such as
cables, pipes, manual and valves” [2].

2
1-1: DP Power System
The power system onboard DP drill ships can be thought of as an island system. The
electrical capability is dependent on the amount of generators onboard. The generation on these
ships should supply power to the thrusters that maintain the position of the vessel as well as the
auxiliary loads for ship service. However the ship service and auxiliary loads should not affect
the DP operation. The most common type of generators for DP vessels are diesel electric and
they operate in parallel so the loss of one generator does not affect power loss. The power system
is wired as an ungrounded delta system. Since the system is ungrounded, the types of faults
onboard are phase to phase and three phase faults with no phase to ground faults [3].
Uninterruptable power supplies (UPS) specifically designated for the DP control system
are used to protect against loss of power. There is a UPS for each switchboard and in the case of
loss of the main power supply the UPS should supply power for at least 30 minutes after a failure
[4]. There are emergency generators onboard but this generation is not considered in the DP
system and the FMEA trials do not take into account the emergency system [4].
The distribution of the power supply is comprised of switchboards, busbars, and cables.
The switchboards are the means that allow the power system to operate in different
configurations as they are joined together by bus ties. In this way the DP vessels can obtain
redundancy by isolating a system that has a fault. The switchboard also serves as a way to
distribute the power generation to the different consumers such as the motors, transformers, and
thrusters downstream. The IMO MSC/Circ.645 Guidelines for vessels with dynamic positioning
systems states in item 3.2.3:
“For equipment class 2, the power system should be divisible into two or more systems such that
in the event of failure of one system at least one other system will remain in operation. The

3
power system may be run as one system during operation, but should be arranged by bus-tie
breakers to separate automatically upon failures which could be transferred from one system to
another, including overloading and short-circuits” [2].
The interconnection of all the elements is through the cables which have the same purpose of
transmission lines on terrestrial power systems.
1-2 2: Loss of position
Propulsion of the DP vessels is accomplished by thrusters which allow the vessel to
maintain position and heading despite the effects of water current and wind. The thrusters are the
main load of the system their failure is the primary reason a loss of position occurs. There are
two designations for loss of position. The first is a “drive-off” which means that the vessel
moves from its designated position. This can occur at full power and is usually due to wrong
position inputs or false position information from the operator [5]. “Drift-off” is the loss of
position that is a result of the loss of power due to a blackout or partial blackout that results in
the loss of thrusters. When this occurs the vessel is subject to the elements of environment [5].
1-3 3: Design Storm method
The amount of generators onboard is not only designed to accommodate the large
thrusters load but is also limited to mitigate casualties such as fire or flooding that can potentially
consume one engine room onboard a vessel. This is known as the Design Storm method which
requires that the amount of power needed by the vessel be dependent on the amount of engine
rooms as seen in equation 1 below, where n= number of engine rooms [6]:
𝑃𝑟𝑒𝑞𝑢𝑖𝑟𝑒𝑑 = 𝑃𝑜𝑝𝑒𝑟𝑎𝑡𝑖𝑜𝑛(
𝑛𝑛−1
) (1)
4
For example, if a ship needs 35 MW for operation and only has room for two engine rooms, the
required power would be 70 MW. Therefore, if there is a loss of one engine room, there would not
be a loss of more than one generator or thruster. In most ships if power is lost, there is a backup
generator that will supply power. The emergency generator onboard the DEEPWATER
CHAMPION will pick up power automatically within 10 seconds if power is not restored from the
main generators [7].
The amount of engine rooms through the design storm method is an example of the
inherent redundancy of dynamic position vessels. This redundancy is characterized by the
survivability of the ship in case of a casualty due to fire or flooding that can engulf one complete
engine room. In fact, the casualty can be contained due to watertight bulkheads between
compartments. Furthermore, the redundancy of an extra compartment for the emergency
generator, not included in the design storm method, is an additional redundancy for the power
system.
With the UPS, emergency generator, and the configuration great thought has been put
into the survivability of the power system onboard DP vessels. However, the final safety layer is
the protection system onboard which consists of differential, overcurrent, overvoltage, and
under-frequency relays along with many others that protect equipment such as the transformers,
generators, and thrusters. In addition to equipment protection, the relays onboard also act as a
way to isolate portions of the system. The focus of this thesis will be on safer alternatives for the
required test on the overcurrent relays that are installed to segregate the system. In particular, the

5
overcurrent relay response to a fault on a main bus. Emphasis is put on the three phase fault
which is the fault that has the greatest current.
Where there is much thought put into the design of the power system just as much is put
into the continual maintenance of the power system through testing. To maintain DP vessels
classification test are performed with actual faults is placed on the system. This thesis discusses
an alternate way to test the protection system response without placing an actual short on the
vessel electric system. The proposed alternative tests bypass the power system equipment and
involve putting a signal from existing PLC to the protection relays. In this way the protection
system is tested without strain to the actual power system. To determine the required current
values seen by the relays, an accurate electrical model of a DP vessel is required. For this work a
detail model of the DEEPWATER CHAMPION vessel was built in PSCAD based on one line
diagrams and available information on the electric system components.
The implementation of the PSCAD model of a DP vessel is covered in Chapter two, Chapter 3
describes the PLC implementation of the required relay input currents and the overcurrent relay
setup and response, chapter 4 presents the fault placement and results within the PSCAD model,
and chapter 5 lists the results, conclusions and future work.
6
Chapter 2: Modeling DEEPWATER CHAMPION in PSCAD
The goal of finding a safe way to test for a three phase fault onboard a DP vessel requires
an accurate three phase model of a DP vessel. When a fault is placed on a bus it is important to
determine if all three phases react the same or differently by the current magnitudes. The model
had to be built because there is a lack of electrical power systems of DP vessels readily available
for research. The different companies that own a particular ship keep electrical configurations
classified.
Power System Computer Aided Design (PSCAD)/Electromagnetic Transient including
Direct Current (EMTDC) is a simulation software that can be used to model all parts of the
power system. PSCAD has a vast library and small building block logic to create different
control circuits. The ability to build new control circuits is suited for ships where certain
elements of regular terrestrial power systems may be different. It is important to have the ability
to breakdown or create new circuits. The software was also used because it was considered one
of the better software by engineers at the Marine Safety Center who built other ship models on
this software.
The data used to model the system is from a relay coordination report provided by
Transocean’s DEEPWATER CHAMPION drillship. Transocean cooperated with the Marine
Safety Center to allow a report with a one line diagram to be used for research. In this report, the
single line diagram along with equipment specifications is provided which is the basis for a
working model in PSCAD. The main benefit of having a working model is in the ability of
testing and analyzing different scenarios generated when a fault is placed in different locations.
The easy user interface makes it easy to gather current readings anywhere the user desires.
7
2-1 1: Cables
One of the main differences between shipboard power systems and their land
counterparts is the length of the cables. The length of the Deepwater Champion is 229.21 meters
with its longest line being 271 meters which is dwarfed by the mile long lines on land. For this
reason, the zones of protection used on transmission systems on land lines are not used onboard
ships because shorter lines lose accuracy within the scope of the zones of protection [3]. The
DEEPWATER CHAMPION uses instantaneous overcurrent and overcurrent relays for
protection of its short lines. [7] In fact, because the length is so short, ships have the advantage
that the communication between relay elements can be considered instantaneous.
Within PSCAD, there are usually three types of models for transmission lines: Bergeron,
frequency dependent (Mode), and the Frequency dependent (phase). The Bergeron method
represents the line with the RLC components of the pi-model which is best used for their load-
flow models and relay studies. The pi-model is used on land systems for short lines. The
frequency dependent mode is “accurate for systems of ideally transformed conductors or single
conductors” [8]. The frequency dependent phase model is the most accurate time domain model.
Since changing frequency was not taken into account and a fixed frequency of 60 hertz is
assumed, both the frequency dependent mode and frequency dependent phase mode were not
considered necessary. In fact, since the vessel is considered an island any slight change in
frequency within the system is not critical as it will be the same throughout the vessel. For these
reasons the Bergeron method was chosen because it was the simplest to implement where the
impedance for the three phases are manually entered from the line parameters given for the
cables. The other two frequency dependent methods solve the line parameters through modal

8
methods which requires the geometry of the conductors of the lines for transposition. The
geometry of the conductors was not given in the data.
Since shipboard cables are standard three conductor cables with one conductor per phase
with an ungrounded neutral, manual data entry with the Bergeron model is used to model the
transmission lines. This requires the deletion of the entry for the ground data within the PSCAD
model that represents the ground return path. Therefore, the data entered was the positive,
negative, and zero sequence of the impedances in ohm per kilometer along with the amount of
conductors, frequency, and length of the line.
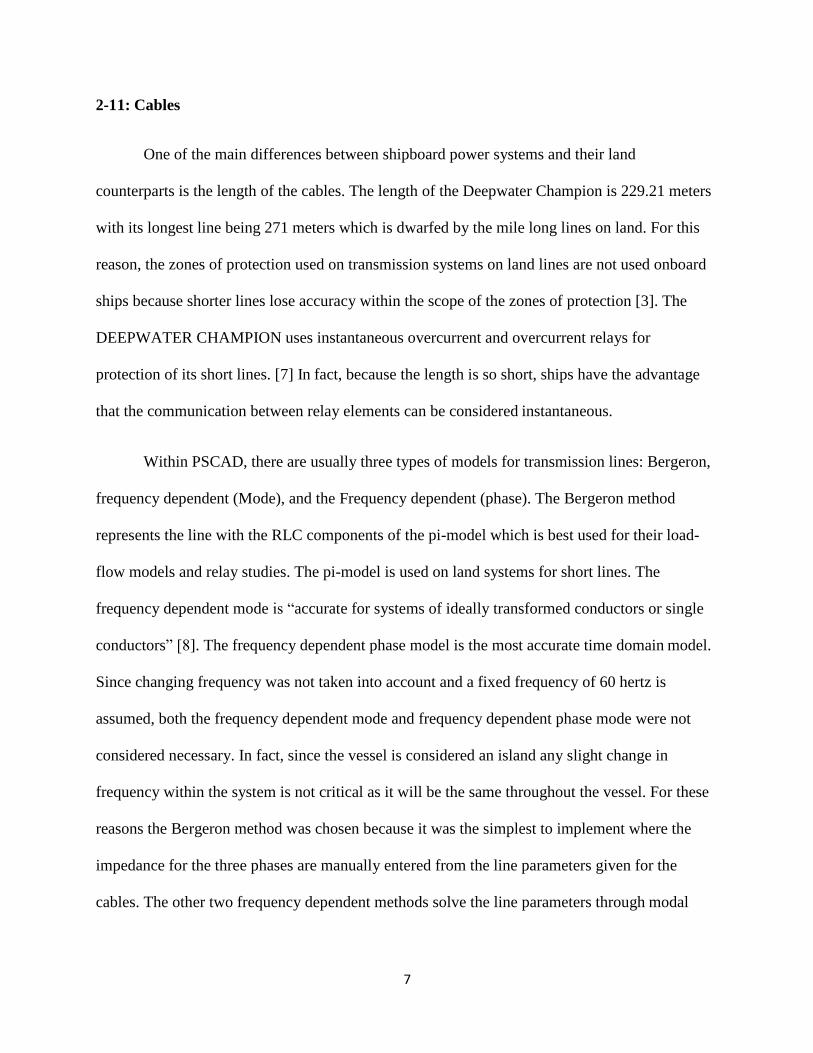
2-2 2: Generators model
The generators onboard are also wired as ungrounded delta connections. An approach to
modeling an ungrounded system is to put a large resistance in the grounding connection so that
the current will not flow through to the ground [3]. In PSCAD, three single phase constant
voltage sources were chosen without a ground then connected to form three phases. Within this
circuit three grounds attached containing one mega ohm resistance before ground as seen in
Figure 2.1 below. PSCAD was designed to model terrestrial systems and requires sources to be
grounded. To avoid a perceived PSCAD error, a large grounding resistance is required in the
generator model in Figure 2.1.
9
Figure 2.1: Generator model
The component for the voltage sources in PSCAD requires both real and reactive power
outputs. Since the data for the generators was given in apparent power, calculations for real and
reactive power were made after assuming a power factor of .85 leading.
The sub-transient reactance ( X”d) for the generators was given in per unit on its own base. The
impedance base was calculated by using the equation below:
𝑍𝐵𝑎𝑠𝑒=
(11𝑘𝑉)2
𝑥 𝑀𝑉𝐴
(2)
The MVA is the apparent power from the generator. Then the sub-transient reactance values
were multiplied by the base impedance to find the impedance to enter into each voltage source
per phase. The base of the system was determined to be100 MVA.
10
2-3 3: Transformers model
The transformers are modelled as three phase winding transformer in a -wye
configuration. The delta side was connected to the generator and bus, and the wye side of the
transformer was used to step down the line voltage to feed the thruster load. The main data
entered into the component within PSCAD was the MVA of the transformer from Trasfor
manufacturer specification [7], [13]. This data sheet included the winding type for all three
windings, positive sequence leakage reactance for all three sides, and the winding voltages.
These were supplied by the transformer data sheet from the manufacturer.
The copper losses were calculated from the transformer data sheet and assumed to be the
load losses from the primary winding converted to the base of the system. The eddy current
losses were calculated from the no-load loss and also converted to the base of the system off the
primary side.
2-4 4: Circuit Breakers model
All the circuit breakers where modelled as three phase circuit breakers. The bus tie circuit
breakers are controlled by directional and overcurrent relays. These circuit breakers where used
to separate the main bus ties and operate as a master slave on each end of the bus in response to a
fault. The timing of the circuit breaker operator was accomplished by a timed breaker logic that
could either be opened or closed at the beginning of the simulation. In this way the different bus
configurations can be implemented.
Additional circuit breaker where added to the model to connect the generators. By
opening/closing the circuit breaker attached downstream to the generator generation is taken on
or off the system model. The condition of the breaker is controlled by a signal with the same

11
name as the breaker it is controlling. This signal is attached to the timed breaker logic
component.
2-5 5: Relays
The relays were modeled by creating their own definitions within PSCAD. A definition
is a user created circuit with logic and elements of the PSCAD library combined to create a new
element. The definition creates a small icon that is displayed on the one line diagram of the
system but once selected directs the user to another page where all the circuitry that was built can
be seen. This allows the user to copy definitions easily and keep the one line diagram view clean.
The definition is in a sense creating a new component for the library and was used when creating
relays to add onto the model. The input of the relay definition depends on a signal from an
ammeter which is installed on the line in front of the circuit breaker being controlled. Likewise,
the logic output from the relay definition controls the operation of the three phase circuit breaker.
Inside the relay definition can be seen in Figure 2.2 below and appendix A:

12
Figure 2.2: Relays to control breaker operation
The signal from the ammeter is split into three phases where it is then fed into current
transformers. Once the current is stepped down, it goes into an RMS meter set in analog mode to
take the time domain input from the signal with a 0.02 sec smoothing time constant to respond
fast to changes. Then the signal on each phase goes into the relay itself which produces a logic
argument of either one or zero with respect to its entered pickup current setting. The signal
proceeds through a Boolean bitwise AND function. The dial fed into the following AND gate
allows the user to set the position of the circuit breaker manually. Finally, the zero or one logic is
output from the definition to control the designated circuit breaker.

13
The value of having an individual relay definition is the potential to add more circuit
elements with output channels of graphs and later splitting the three lines into their different
sequence components. The model grows within the definitions while the main page of the model
can remain as close to the single line diagram as possible.
The over frequency and over voltage relays had a comparator element that compared the
signal from the ammeter to the relay setting. PSCAD contains a timing delay element as well as
an inverse curve element that can be combined into the logic function of the breaker control.
2-6 6: Thrusters Model
The data for the load of the thrusters was not given in the one line diagram but was rather
found online from a website describing the main characteristics of the vessel. The thrusters are
each rated 6,705 horsepower and are roughly equivalent to 6,705 kVA [10]. From the apparent
power the real and reactive power was calculated assuming 0.85 lagging power factor and an
efficiency of 90%. The load was modelled in PSCAD as a fixed load with the rated real and
reactive power per phase entered into the component. The greatest assumptions in the model are
contained within these load assumptions. Assuming that the fixed load is always operating at its
greatest load gives the worst case fault scenario for modeling.
2-7 7: Faults
The fault is controlled by a timed fault logic command which was initiated 0.1 seconds after
runtime. The fault generated a signal for every phase of the fault. Inside the fault element the
type of fault could be determined by picking which phase or neutral the desired fault was to
occur.

14
2-8 8: Full DEEPWATER CHAMPION model
The model developed in PSCAD for this project is shown below in Figure 2.3 and appendix B.
The boxes toward the top of the model are comprised of separate modules that represent the
generators for which the definition were created separately and not seen in the one-line diagram
view of the model. The transformers can be seen as they were an element taken from the PSCAD
library. The motor and thruster loads are denoted by the orange boxes towards the bottom of the
model.
Figure 2.3: One-line diagram of DEEPWATER CHAMPION

15
2-9 9: Validation of the model
Once the model was completed the fault currents were compared to the fault currents
obtained from the relay coordination where a field fault report was provided. The derived model
consistently had the currents higher than the currents reported from the fault report. For instance,
the current reported for the three phase fault on the center switchboard was 22.67 kA and the
fault current obtained after manipulation of the load was 26.68[7]. The difference of at most of
5kA was consistent across the tests. The fault report was conducted on an aged ship and the
motor and thruster loads within the PSCAD model were approximated. The difference of 5kA
puts the model at about 84% accuracy. The model is justified because the current difference is
uniform across the three comparison tests. The differences most likely occurred due to status of
the load of the thrusters. The one line diagram used to model the load displayed the highest draw
from the thrusters where when the live short circuit test was being conducted the full load was
likely not used.
16
Chapter 3: Programmable Logic Controller
3-1: Background of Testing
To test for bus faults onboard Dynamic Position vessels a “short or ground is typically
placed on the load side of a protective relay on the switchboard. The relay settings are adjusted to
allow demonstration of bus tie and generator protective relays” [4]. By following this method,
the switchboard protection is tested and not the faulted feeder protection.
The fault current that is placed on the load side of the protective relay is typically set to a
third of the maximum current the equipment is designed for. “For example, on a drill ship with 6
generators, the system is designed to withstand the fault current available with all 6 generators
online. Fault testing is performed with two generators online, so the fault current is only about a
third of the maximum the equipment is designed for”[4]. By operating within the range the
equipment is designed for the risk due to the stage fault is reduced but not eliminated. If the
relays do not respond properly to a third of the current the system is deficient in some way.
The secondary means of protection onboard the DP vessels are instantaneous overcurrent
relays. Overcurrent relays were the “earliest protective system to evolve” and its main objective
is to clear a fault or short to the system [9]. Overcurrent relays onboard vessels are used to
protect the motors, transformers, and generators and allow the system to be isolated through the
bus tie interconnection relays. The bus tie connections are responsible for determining the
configuration options for the vessel and will split the system up to isolate a fault. The current
practice to ensure the survivability of the ship is to place a short circuit on the bus to test that the
protection system is operating correctly and isolating the fault properly.
17
3-2 2: Testing Hardware
An alternate way to test how the protection system will respond to fault current is to use a
Programmable Logic Controller to generate the signal of the secondary of the instrument
transformers and feed them into the ship relays. Therefore the relay will be expecting to see a
current that is in between 0.25A and 5A [11]. The control signal that will represent the fault
current from the PLC will be within this current range.
For this work the control signal was implemented using a PLC system which consists of a
controller, modules, and ladder logic program. The controller used is the Allen Bradley 1756-
PA72/C series which has an AC power supply. The controller stores all the updates from the
RSLogix5000 which is the software used to write the ladder logic program. Ladder logic runs a
program by a top down and left to right method that executes the logic commands of the top
rungs before proceeding to the next rung. The main routine of the program consists of an input
switch that can be toggled to control an output switch. Each rung of the main routine will execute
the desired logic representing either phase “a”, “b”, or “c”. In this way by selecting the input for
phase “a” there will be a signal that will representing a single phase fault. Likewise, the final run
will have one input that will control all three phases representing a three phase fault.
The output module used to generate the fault currents is the 1756-OA16 A which is a 16
point AC output module. The signal capabilities of this module are 120V with a current that
ranges from 0.2mA up to 0.5 A per point depending on the load attached [11]. The output
modules were designed so the maximum current that can be tolerated when the circuit is roughly
2 A [11].

18
The test output from the module is then placed in the Ia, Ib, Ic ports of a Schweitzer SEL-351S
relay. These ports along with the output ports are located on the back panel of the relay. The
nominal current input of these ports is 1 A or 5 A. The outputs were re wired to have the control
signal connect to the front through banana clips. The relay has instantaneous and time
overcurrent elements where the tripping logic can be easily programed. On the front panel is the
trip/close pushbuttons along with the serial port used to communicate with the relay. There are
also serial ports on the front that can be used to communicate with other relays for downstream
relay coordination.
The SEL-351S was used because it is a very comment overcurrent relay and it was
available and known to work as the DP vessel overcurrent relays. The DEEPWATER
CHAMPION specifically used overcurrent relays for “the Hi-Set Phase Overcurrent function
(50) is set to trip both tie breakers in 0.2 seconds to split the system, while the time overcurrent
function (51) is set to open all of the generators connected to the faulted section in 0.6 seconds
[7]. In this way the overcurrent relays controlled the breakers that acted as master slave on either
side of the bus which would isolate the bus if a fault were present. The setup of the test can be
seen in Figure 3.1 below the wiring diagram can be seen in appendix C:
Figure 3.1: Relay and PLC

19
The relay settings are changed using AcSELerator Quickset software that allows a
desktop computer to easily read and send new settings to the relay as well as retrieve the event
report. The event report contains the history of the breaker status as well as the value of the
current and voltage. The event can be designated to last 15 or 30 cycles which is roughly
equivalent to about half a second. The settings used on the relay are 0.25 amps pickup for each
phase.
After the breaker is opened an event report is retrieved and opened in SEL SynchroWAVe event
which allows the file to see the all three current and phase voltages together. It will also allow
more than one event report to be displayed on a single plot allowing coordination studies of
multiple relays and their timing studies to be tracked.
3-3 3: Findings
The results for phase A, B, and C faults are shown below in figures 3.2, 3.3, and 3.4 and were
generated from the even report of the relay.
Figure 3.2: Phase A fault
20
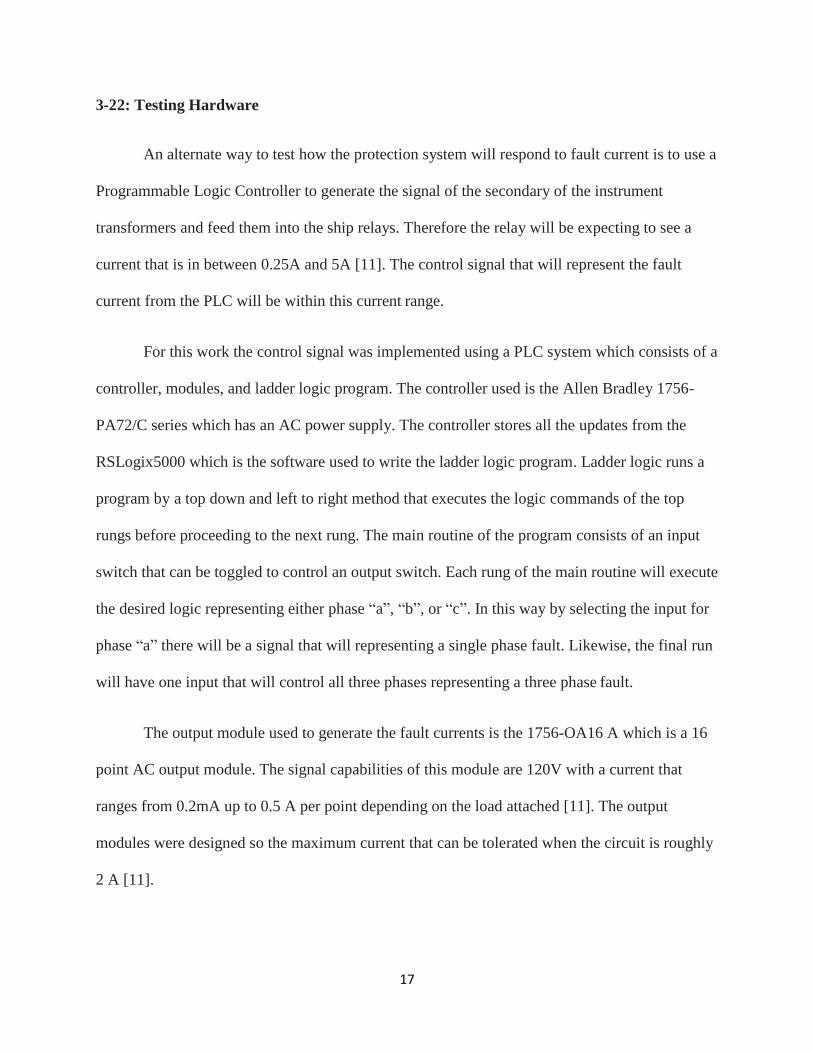
The magnitude of phase “a” is close to 0.5 amps the maximum amount the PLC is able to
generate for the signal. The voltage in the bottom reflects 120V with a small amount of noise
seen in the other two phases.
Figure 3.3: Phase B fault
The phase B fault is showing slightly larger current than the 0.5 amps of phase “a” and the
maximum amplitude reaches 0.7 amps. This greater current than the specifications of the 0.5
amps of the module cannot be sustained for very long and was immediately turned off to not
destroy the 1756- OA16 module. Similar results from the voltage in figure 3.2 is displayed in
Figure 3.3 of the signal generating 120V.
21
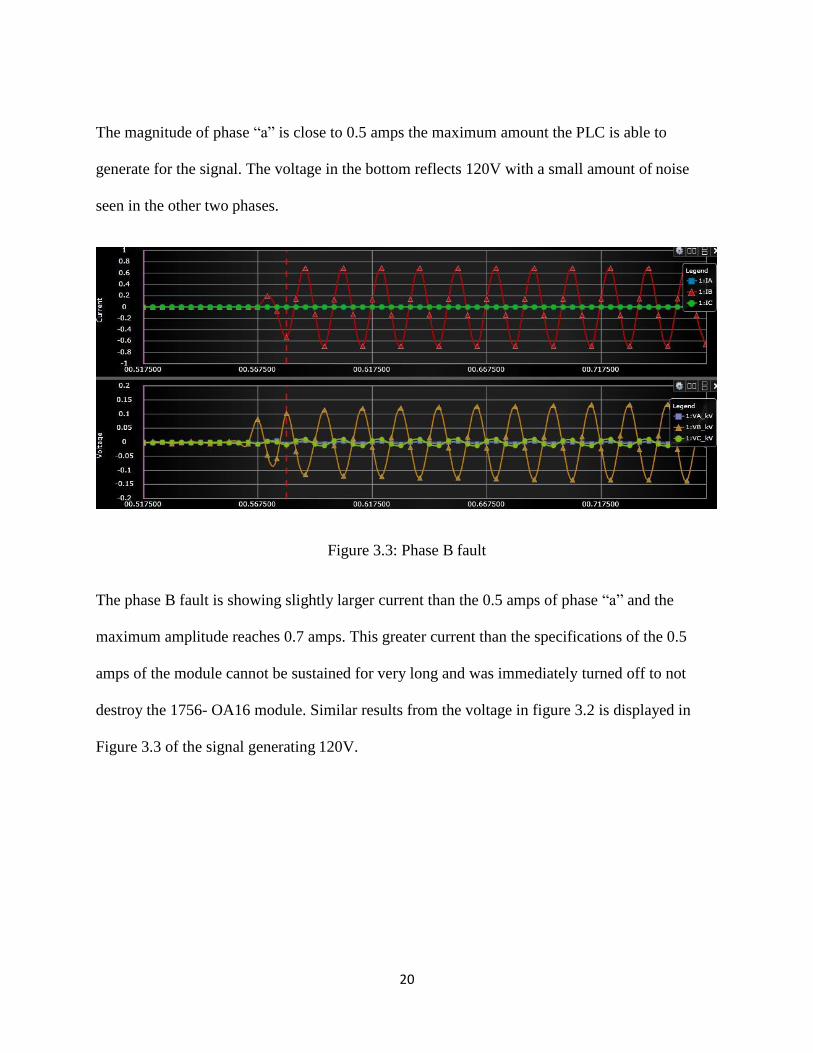
Figure 3.4: Phase C fault
All three phase faults look similar except for a slight change in magnitude. The other two
phases are close to zero and resemble noise because the input current and voltage ports are not
receiving a signal from the PLC. A difference between these results and actual voltage and phase
current is that there is no phase shift present between phase “a”, “b”, and “c” because the same
exact signal is generated from the PLC. The AC source used for the single phase faults was the
AC source from the controller.
The SEL 351 S relay has a trip logic equation that is changed by the setting 51P1T. The
relay looks for the phase current that is carrying the maximum magnitude in any particular phase.
The red dotted line represents when the trip occurred. The amount of time it took the relay to
operate the trip command from seeing the fault current was approximately 0.0125 seconds which
is the amount of time of one cycle of the sine wave and the amount of time it took to reach the
maximum amplitude of 0.25 amps or the peak.
22
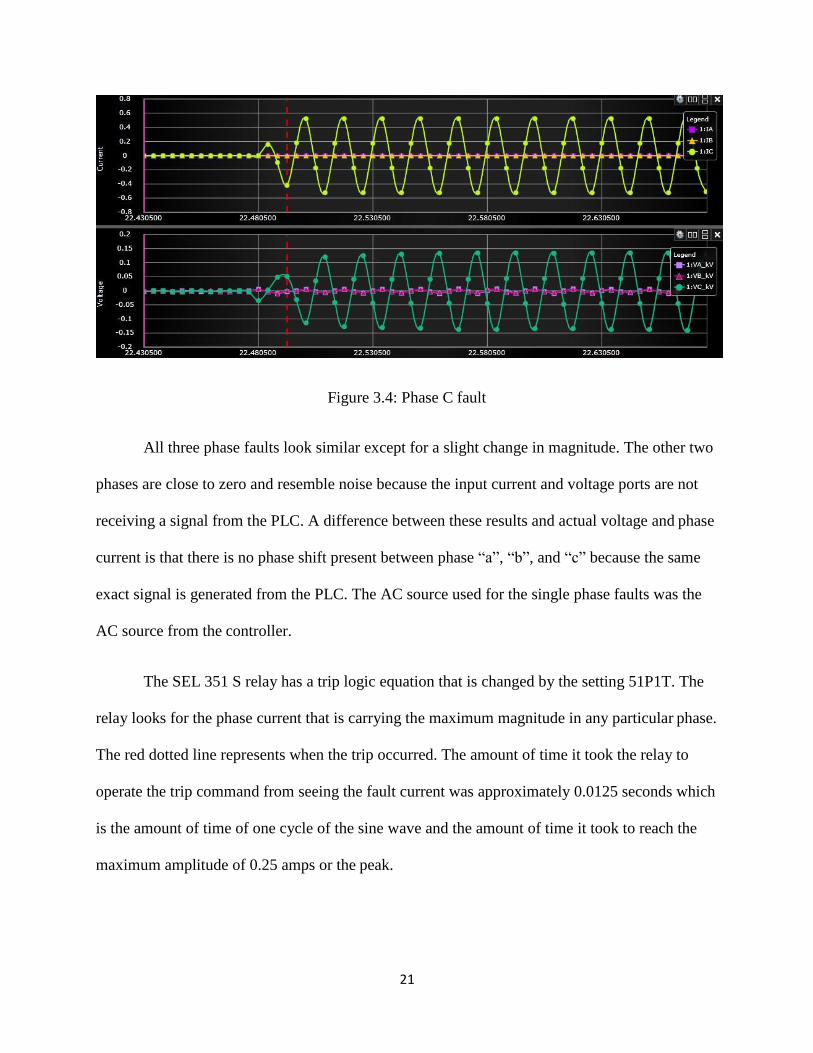
To generate a double line to ground or three phase fault a three phase AC signal generator
was used. Each phase had its own group within the 1756-OA16 A. The module is split into two
groups with eight output pins per group [11]. Using two modules the three phases could be
represented and powered by a separate phase “a”, “b”, or “c” analog signal. In this way the AC
signal generator could represent the three phases with the appropriate 120 degree phase shift. In
Figure 3.5 below the phase “b” and “c” were set above the tripping level while phase “a” is still
present but has a magnitude less than the tripping threshold.
Figure 3.5: B-C fault
The amount of time it took for the relay to trip was slightly greater in this test where the
relay tripped in 0.014 seconds but is still instantaneous. Figure 4 also shows a burst of the control
signal where it was immediately turned off but not before the relay sensed that there was a fault
present and tripped.
Figure 3.6: Three phase fault

23
In figure 3.6 the three phase fault was induced where all three phases contained
magnitudes greater than the 0.25 tripping threshold. When the relay tripped after 0.06 seconds
phase “a” had a magnitude of 0.255 amps, phase “b” -0.356 amps, and phase “c” 0.371 amps.
The different magnitudes were controlled by the different loads placed on each phase. Phase “b”
had 300 ohm, phase “c”, and phase “a” had 240 ohm attached.

24
Chapter 4: PSCAD fault current calculations
For a short circuit test a fault is placed on the system and there is unhindered electrical
current flowing through the system. Usually the three phase fault occurs on a DP vessels due to a
“failure of electrical insulation by accidentally damaging or coming into contact with electrical
conductors” [12]. Since the three phase fault has the highest current values it is the fault that puts
the most strain on the system though large amounts of heat and mechanical force response that
can cause a great deal of damage to equipment. The worst case scenario is when the three phase
fault occurs on a switchboard. Therefore great emphasis is put on the testing and calculations of
the magnitudes of the three phase fault to determine if the protection system can safely interrupt
the fault and the equipment can be braced. The following tests were completed on the PSCAD
model of the Deepwater Champion developed for this work.
The three phase fault was placed on the system after 0.1 seconds of a 0.5 seconds runtime
simulation to track any decay in the fault current. The graphs represent the fault currents from a
short circuit placed on the bus with various generators and lines acting as contributors to the
fault. The following three phase fault tests were completed for the three main configurations:
three separate bus, ring bus, and single bus. Each type of configuration has their advantages to
which generators need to be running. For the three separate bus tests all the generators that are
attached to that bus are online. In the ring bus or single bus configuration different combinations
of generators are online to have the required amount of three generators online.
25
4-1 1: Split bus configuration
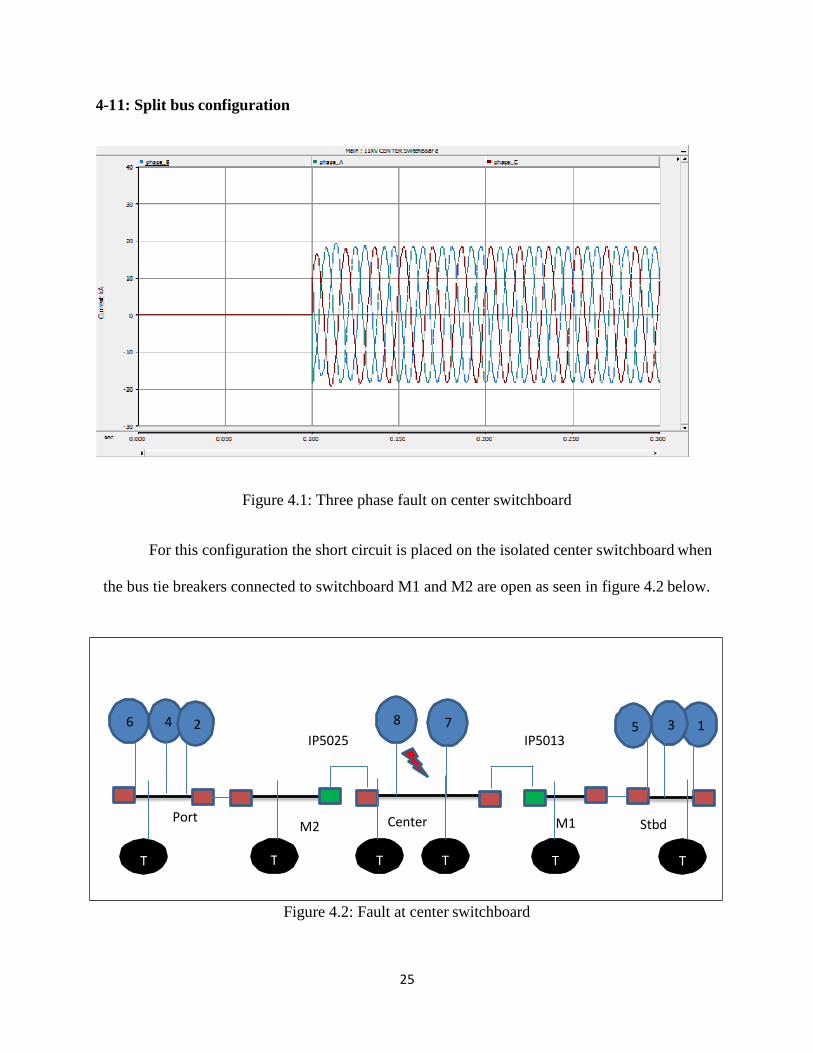
Figure 4.1: Three phase fault on center switchboard
For this configuration the short circuit is placed on the isolated center switchboard when
the bus tie breakers connected to switchboard M1 and M2 are open as seen in figure 4.2 below.
Figure 4.2: Fault at center switchboard
6 4 2 8 7 5 3 1 IP5025 IP5013
Port M2 Center M1 Stbd
T T T T T T

26
The current contributors to this fault from the 11 KV side were the two generators DG7 and DG8
along with the transmission lines of IP5025 and IP5013. Phase “a”, “b”, and “c” maximum
current magnitudes are 18.32 kA, 19.68 kA, and 18.94 kA.
Figure 4.3: Three phase fault on port switchboard
27
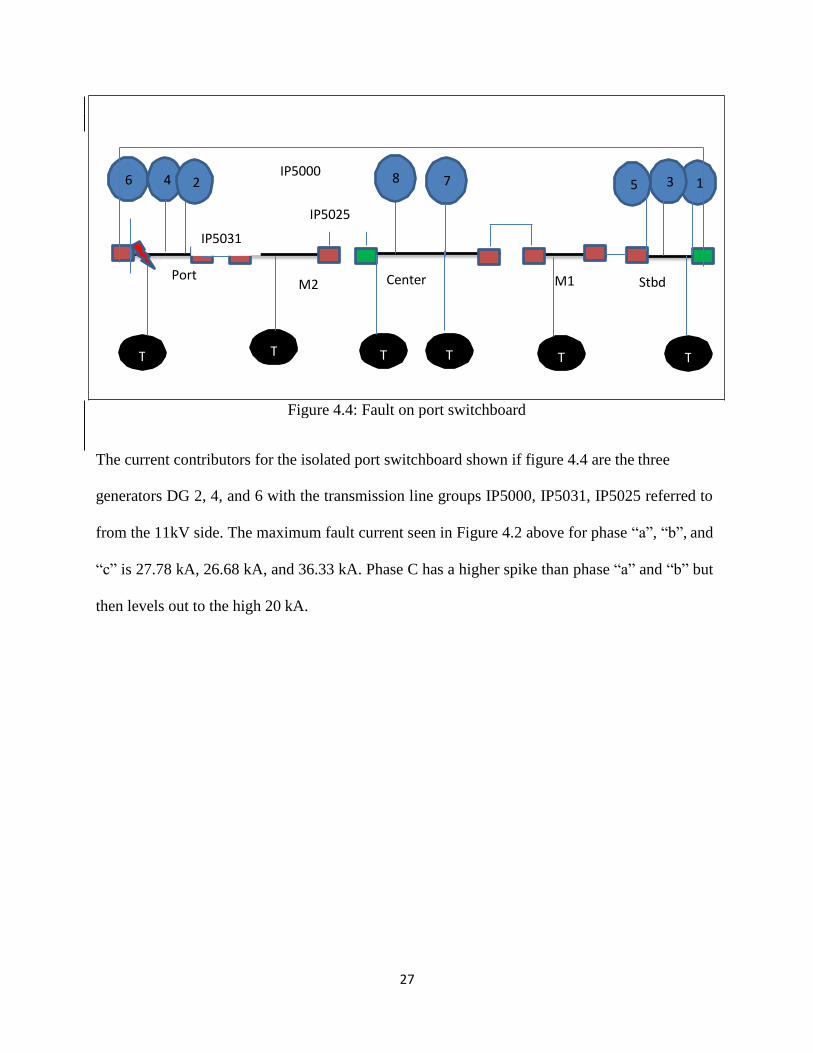
The current contributors for the isolated port switchboard shown if figure 4.4 are the three
generators DG 2, 4, and 6 with the transmission line groups IP5000, IP5031, IP5025 referred to
from the 11kV side. The maximum fault current seen in Figure 4.2 above for phase “a”, “b”, and
“c” is 27.78 kA, 26.68 kA, and 36.33 kA. Phase C has a higher spike than phase “a” and “b” but
then levels out to the high 20 kA.
Figure 4.4: Fault on port switchboard
6 4 2 IP5000 8 7 5 3 1
IP5025
IP5031
Port M2 Center M1 Stbd
T T T T T T
28
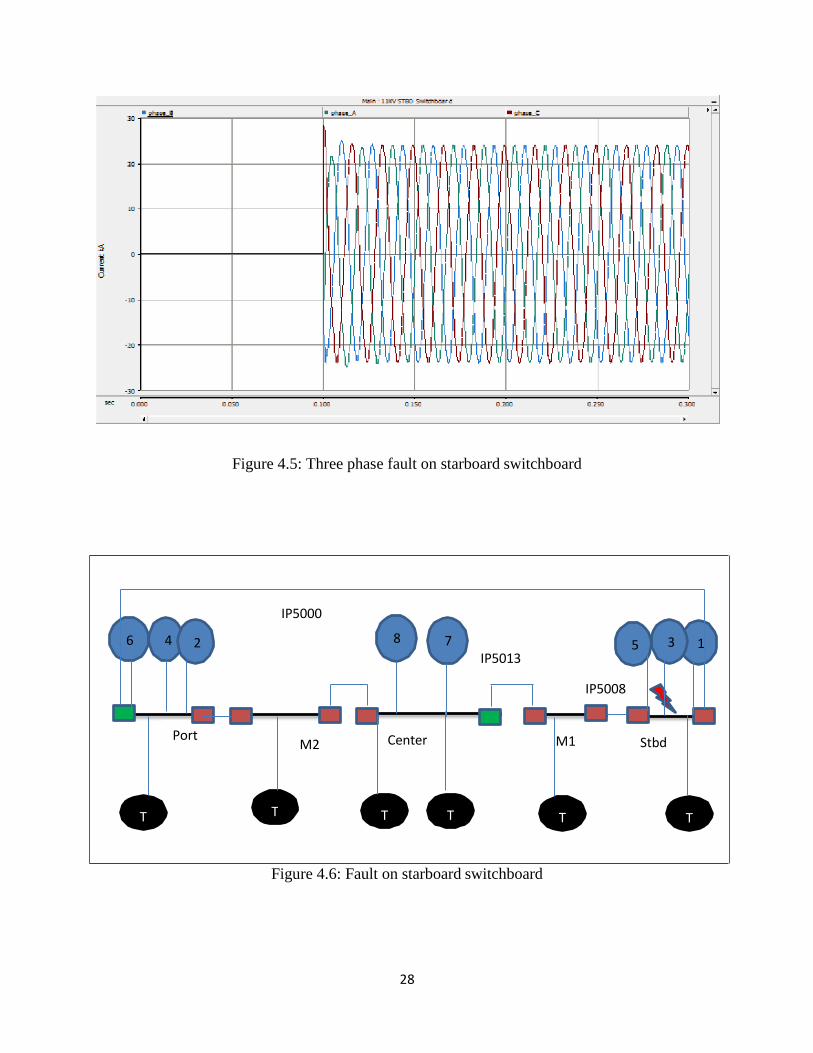
Figure 4.5: Three phase fault on starboard switchboard
Figure 4.6: Fault on starboard switchboard
IP5000
6 4 2 8 7 5 3 1 IP5013
IP5008
Port M2 Center M1 Stbd
T T T T T T
29
The current contributors for the isolated starboard switchboard shown in figure 4.5 are
the three generators DG 1, 3, and 5 with the transmission cable groups IP5008, IP5013, IP5000
referred to from the 11kV side. The maximum fault current seen in Figure 2 above for phase
“a”,“ b and “c” is 23.95 kA, 24.96 kA, and 28.31 kA.
4-2 2: Ring configuration
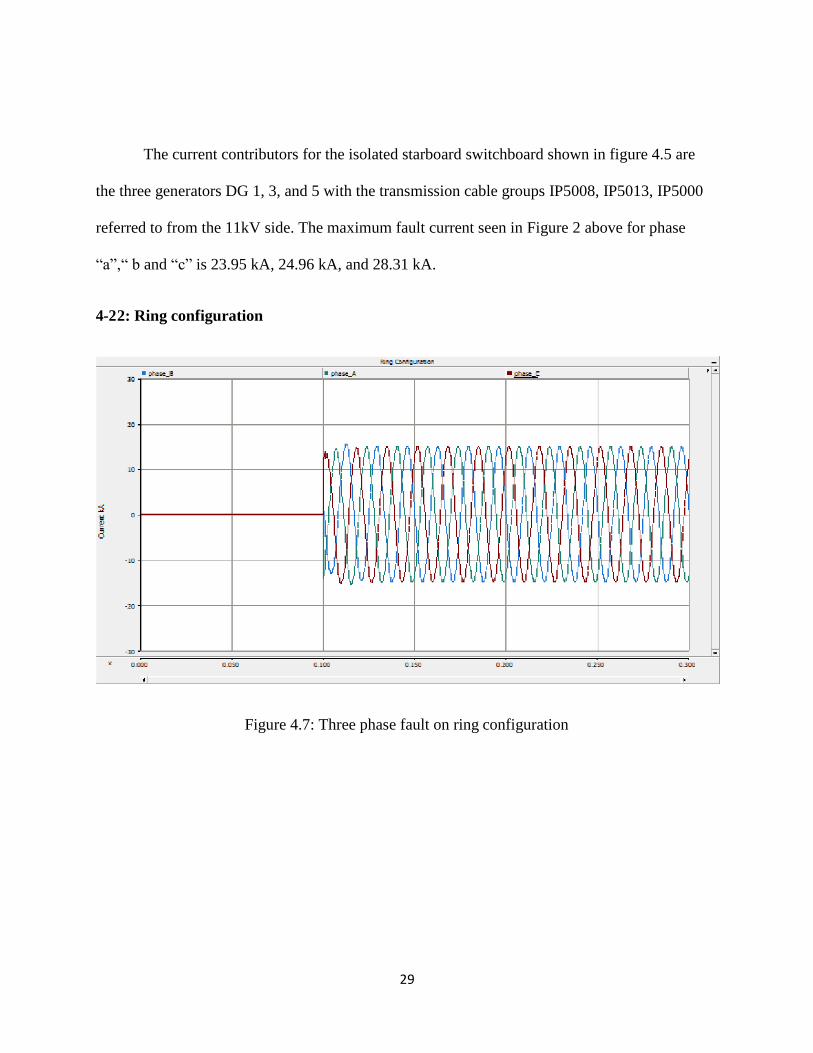
Figure 4.7: Three phase fault on ring configuration
30
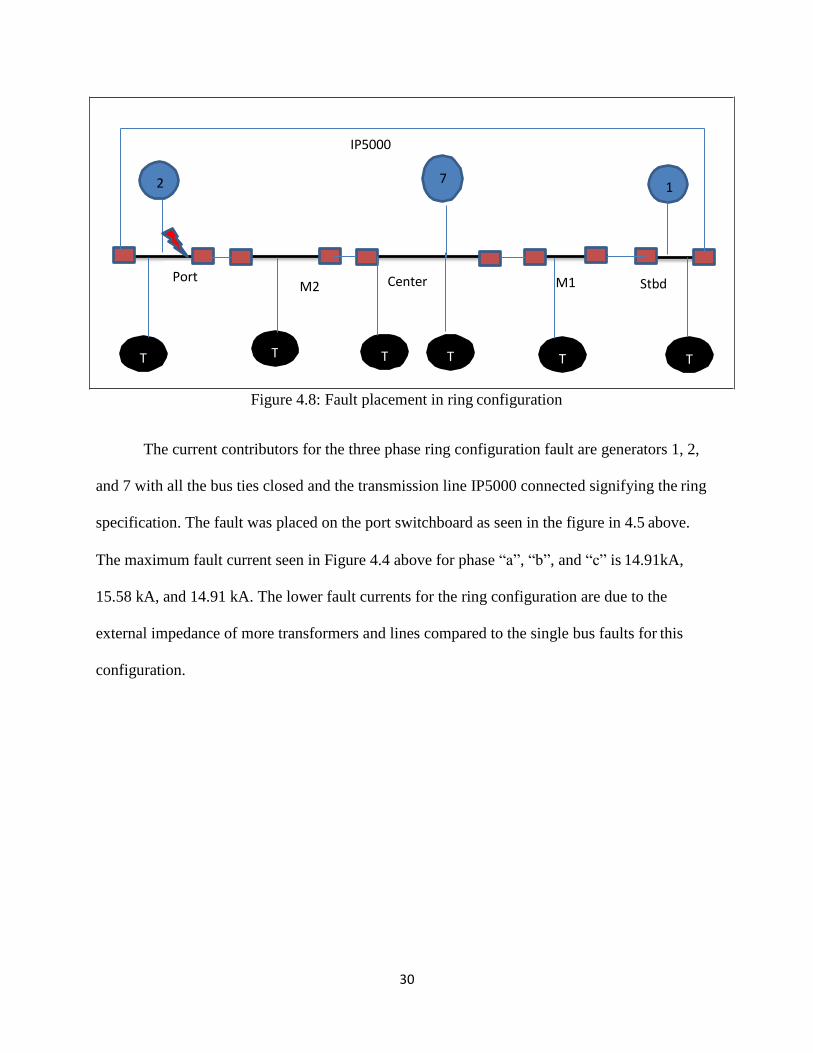
Figure 4.8: Fault placement in ring configuration
The current contributors for the three phase ring configuration fault are generators 1, 2,
and 7 with all the bus ties closed and the transmission line IP5000 connected signifying the ring
specification. The fault was placed on the port switchboard as seen in the figure in 4.5 above.
The maximum fault current seen in Figure 4.4 above for phase “a”, “b”, and “c” is 14.91kA,
15.58 kA, and 14.91 kA. The lower fault currents for the ring configuration are due to the
external impedance of more transformers and lines compared to the single bus faults for this
configuration.
IP5000
2 7 1
Port M2 Center M1 Stbd
T T T T T T
31
4-3 3: Single bus configuration
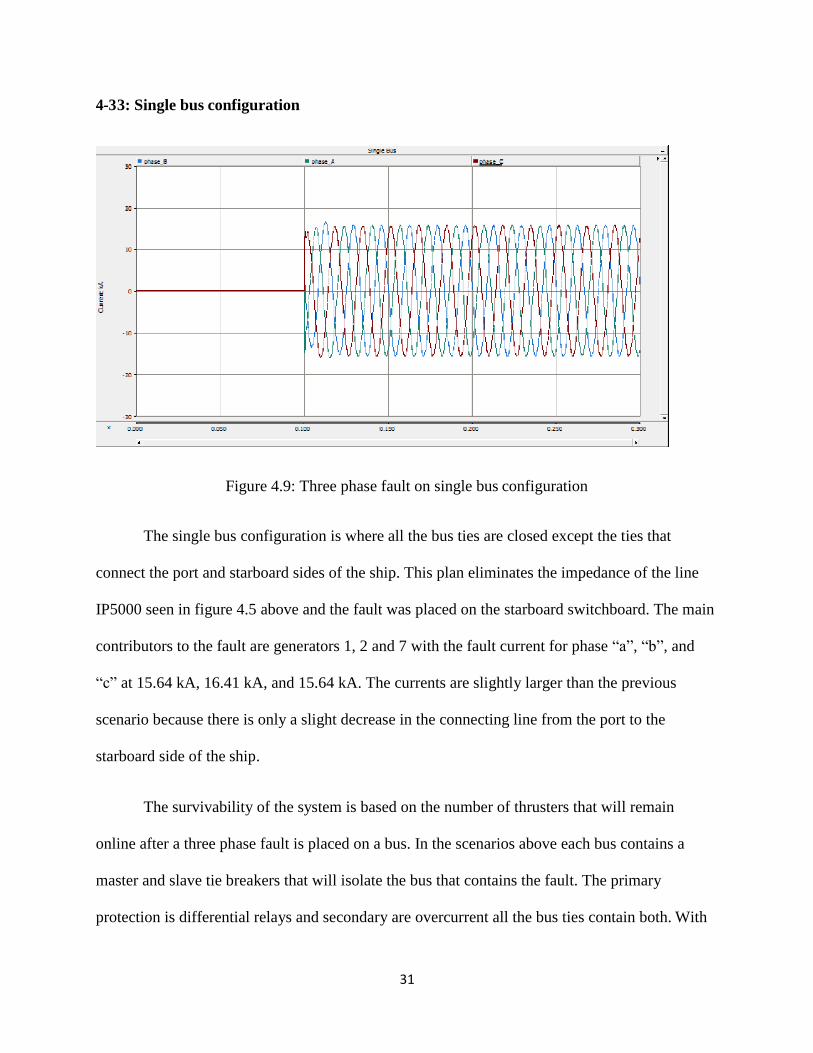
Figure 4.9: Three phase fault on single bus configuration
The single bus configuration is where all the bus ties are closed except the ties that
connect the port and starboard sides of the ship. This plan eliminates the impedance of the line
IP5000 seen in figure 4.5 above and the fault was placed on the starboard switchboard. The main
contributors to the fault are generators 1, 2 and 7 with the fault current for phase “a”, “b”, and
“c” at 15.64 kA, 16.41 kA, and 15.64 kA. The currents are slightly larger than the previous
scenario because there is only a slight decrease in the connecting line from the port to the
starboard side of the ship.
The survivability of the system is based on the number of thrusters that will remain
online after a three phase fault is placed on a bus. In the scenarios above each bus contains a
master and slave tie breakers that will isolate the bus that contains the fault. The primary
protection is differential relays and secondary are overcurrent all the bus ties contain both. With

32
the removal of the bus from the system comes the removal of that thruster that was connected
downstream. Below in the table the number of thrusters that will be lost due to the scenarios
described in the tests above [7].
Configuration, fault location Generators online Thrusters lost
Three separate bus, center swbd 7,8 2,5
Three separate bus, port swbd 2,4, and 6 4,1
Three separate bus, starboard swbd 1,3, and 5 3,6
Ring, port swbd 1,2, and 7 4
Single bus, starboard swbd 1,2, and 7 3
Table 4.1: Configuration and loss of thrusters
By determining the fault currents through the PSCAD model of the ship the secondary
currents can be calculated from the current transformers that are connected to the relays. This
secondary current will be an accurate representation of the fault current and can be generated by
a PLC instead directly from the system. The benefit of this would be that the risk of putting a
short circuit on the bus is removed while still seeing that the coordination of the protection
system is operating. Since, you are only testing the protection system there is no chance for a
“drift-off” and the position of the vessel stable.

33
Chapter 5: Conclusions, Recommendations and Future Work
The need to place a short circuit on a bus can be avoided by first obtaining the expected
secondary current values from the model of a DP vessel. For each bus the current contributors
change with the different configuration and an accurate model ensures the correct current values
are used to test the relays. The current values can then be scaled within the tolerable ranges of a
PLC and send to the DP Vessel relays. In this way, the protection different schemes surrounding
the bus being tested can be evaluated. The main function of the relays on either side of the bus is
to open the breakers so that the faulted bus is isolated. The coordination of the second relay can
be daisy chained from the output terminals of the first relay to the input terminals of the second
so that it is also seeing the same current. The relay event report current magnitudes can be
compared to the current graphs from PSCAD to ensure that they are accurate.
The current graphs obtained in Chapters 3 and 4 prove that the proposed method is a
feasible option especially for a captain or owner of a vessel who does not want to put additional
strain on his or her ship and risk losing position. This test could also be used as a preliminary
step if the actual short circuit test is required to find hidden faults beforehand. In this way the
engineers would have an opportunity to repair their equipment before the test takes place for
additional insurance that position will be maintained.
The main contributions of this work are: a) a detailed and realistic PSCAD model of a DP
vessel that can be used to evaluate, test and research possible problems or enhancements to the
protection system of DP vessels and b) an alternative method to test the proper operation of
relays in a DP vessel that reduces the risk involved with the existing methods that place a real
fault on the vessel electric system.
34
Future work
An area to explore for the future would be to put the output signal from the PLC into an
amplifier to increase the range of the current. Without the amplifier there is only a range from
0.25 A to 0.5 A window being used were the scaling of the fault current of the actual system has
to fall within a narrow range.
More 1756-OA16A modules are needed as they are the most sensitive piece of equipment
because of the low current tolerance. The source or load attached to the circuit can easily draw
too much current for the module and blow a fuse. Once a fuse is blown that group of the module
becomes inoperable.
With additional modules the signal from the first relay can be daisy chained to a second relay
and coordination of the two relays can be performed. This can simulate the master slave
relationship that is present on the bus tie connections to isolate a main switchboard. In this way a
timing study can take place.
Another area to explore is a more in depth study of the fault placement within the model built in
PSCAD. The faults were placed only on the 11kV switchboards but the 480kV also require a
three phase fault test survivability. Fault can also be performed by placing them on the generator
and transformers windings and see how this will affect the loss of thrusters.

35
References
[1] A. Kallah, “Electrical Power Plant and Thruster Systems Design Considerations for
Dynamically Positioned Vessels,” in DP Conference., Houston. TX, 1997, pp. 2.
[2] “Failure Mode Effects Analysis (FMEA) of Redundant Systems,” Recommended Practice
DNV-RP-D102. Jan. 2012.<http://www.dnv.com>.
[3] Meadowcroft, Brian. Hidden Failures in Shipboard Electrical Integrated Propulsion Plant.
Thesis. Virginia Tech, 2010. N.p.: n.p., n.d. Print.
[4] O’Donnell, Dave. “Dynamic Position Question.” Personal interview Jun 5, 2015.
[5] Shi, Xiao Bing, Phillips, Doug, and Martinez, Diego. Case Study of DP Vessels Performing
SIMOPS. Proc. of Dynamic Positioning Committtee. Web. 10 Jun. 2015. < http://dynamic-
positioning.com/proceedings/dp2005/operations_shi.pdf>.
[6] May, John J., and Halvard Foss. Power Management System for the "Deepwater Horizon" a
Dynamic Positioned All Weathered Semisubmersible. Proc. of Dynamic Positioning Committtee.
Web. 15 Aug. 2014. <http://www.dynamic-positioning.com/dp2000/power_foss.pdf>.
[7] Maldonado, Jose L., and Randy G. Denton. Deepwater Champion Protection and Relay
Studies. JLM24NOV10 REV2. N.p.: n.p., n.d. Print.
[8] Power Systems Computer Aided Design Users Manual. Manitoba HVDC Research Centre.
Manitoba, Canada.
[9] Horowitz, Stanley H., and Arun G. Phadke. Power System Relaying. Taunton, England:
Research Studies, 1992. 167. Print.
[10] De la Ree, Jaime. "Modeling Shipboard Power Systems." Personal interview. July 2014.
[11] Rockwell Automation 1756 TD002 Manual p.218
<http://literature.rockwellautomation.com/idc/groups/literature/documents/td/1756-td002_-en- e.pdf>.
[12] Warwick, Jim, Ascherl, Barr, and Martinez, Diego. Power Plant Electrical Systems
Analysis. Proc. of Marine Technology Society Dynamic Positioning Conference. 21-22 October,
1997. <http://dynamic-positioning.com/proceedings/dp1997/power_warwick.pdf >.
[13] Trasfor. 19 June 2015 <http://www.trasfor.com/products>.

36
Appendix A: Protection configuration

37
Appendix B: One line diagram view of PSCAD model
38
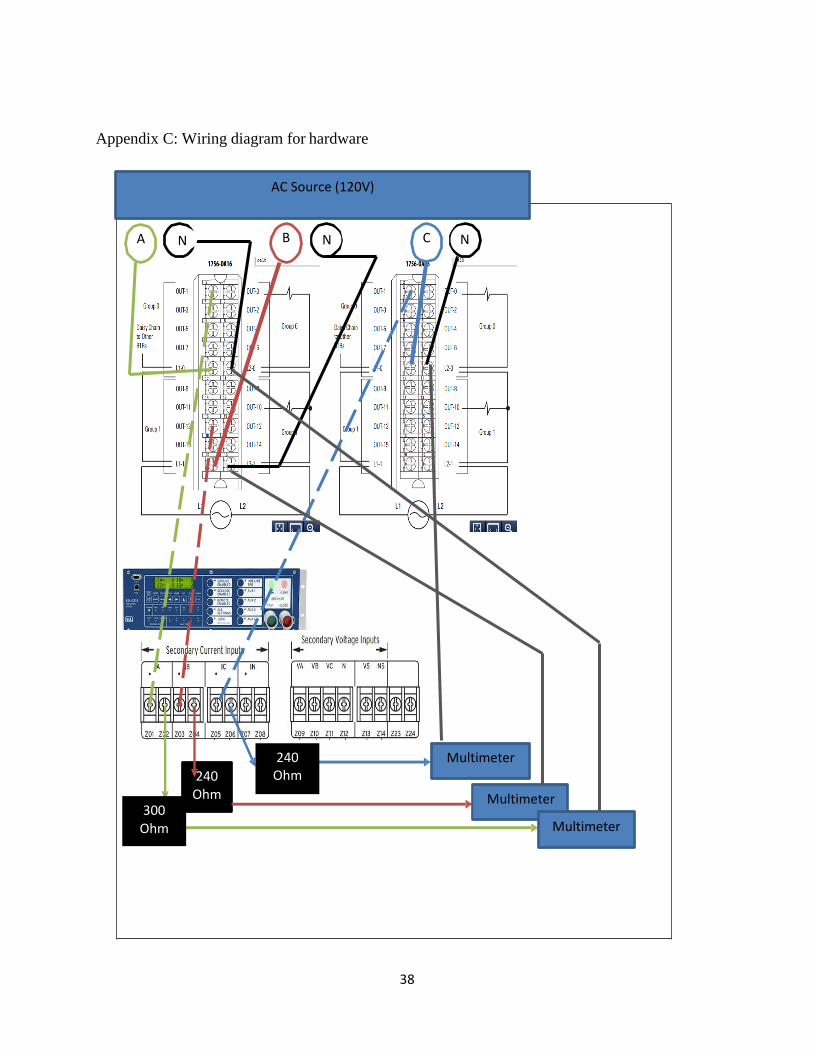
AC Source (120V)
B A C
240 Ohm
Multimeter
Multimeter
Multimeter
Appendix C: Wiring diagram for hardware
240 Ohm
300 Ohm
N
N N