AlphaDelta Growth of Dividend Income Class Quarter 4, 2019 ...
9
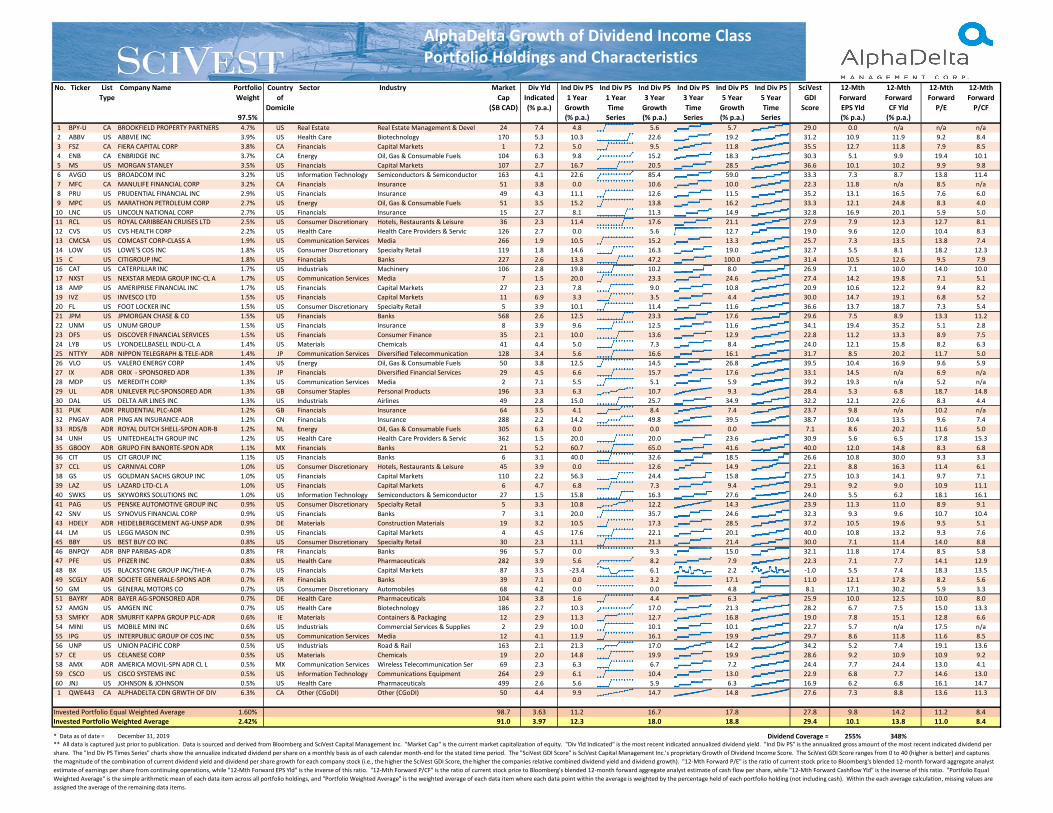
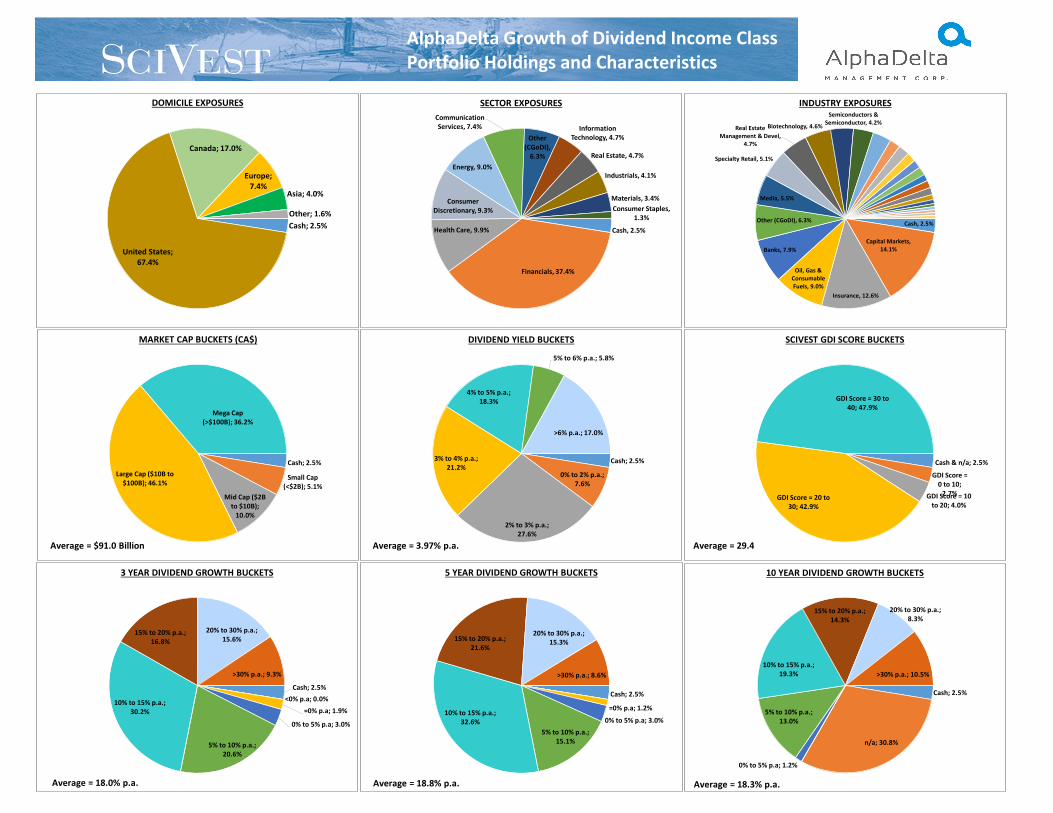
Page | 1 AlphaDelta Growth of Dividend Income Class Quarter 4, 2019, Commentary Hello everyone, This is the quarterly advisor update of the AlphaDelta Growth of Dividend Income Class (“GoDI” or the “Fund”) from SciVest Capital Management Inc., the sub-advisor of the Fund. Attached to this commentary is the GoDI Portfolio Disclosure as of the end of the quarter. The first page of the Portfolio Disclosure shows all of the current stock holdings of the Fund, as well as some descriptive dividend and valuation characteristics for each portfolio holding – plus overall portfolio averages. The second page of the Portfolio Disclosure shows a number of relevant pie charts depicting overall GoDI portfolio characteristics such as sector, market capitalization, dividend yield and dividend growth “bucket” exposures. We also publish and post on our website a monthly version of the GoDI Portfolio Disclosure document (http://scivest.com/strategies/manager-commentary). Portfolio Income and Income Growth: The two primary objectives of the Fund are to provide its shareholders with: (i) a consistent, and above average, annual distribution yield; and (ii) growth in the absolute level of distributions per share through time (i.e., income growth). We attempt to deliver on these Fund-level objectives by investing in a global portfolio of equities which, on average, pay a higher than average dividend yield and which are growing their dividends per share at a relatively high rate (in the context of their current yield). As shown in the Portfolio Disclosure, across the Fund’s current holdings, the weighted average gross dividend yield is 4.0% per annum (versus 1.8% for the Russell 1000 Index and 2.4% for the MSCI World Index) with impressive double-digit trailing 1, 3 and 5-year dividend growth rates of 12.3%, 18.0% and 18.8%, respectively. This 4.0% average portfolio dividend yield is well covered by company earnings and cash-flow. Specifically, the 4.0% average dividend yield compares to a portfolio weighted average forward earnings per share yield of 10.1% (i.e., 255% dividend coverage by earnings) and forward cashflow yield of 13.8% (i.e., 348% dividend coverage by cash-flow). The Fund has a distribution policy whereby it distributes to its shareholders on a month-end basis every dollar (and no more) of dividend income (net of any dividend withholding taxes) accrued by the Fund during the month. As a result, monthly income varies with the dividend cycle of the Fund’s holdings, but the distributions perfectly reflect the true dividend income received by the Fund. Thus, the Fund does not experience the typical net asset value per share “grind” that other funds experience when their distributions are set higher than the income they actually receive. And, since the distributions are a true reflection of the underlying income received by the Fund, they can be used to judge the true income generation and income growth capability of the Fund. AlphaDelta Growth of Dividend Income Class Quarterly Commentary
Transcript of AlphaDelta Growth of Dividend Income Class Quarter 4, 2019 ...
Page | 1
AlphaDelta Growth of Dividend Income Class Quarter 4, 2019, Commentary Hello everyone, This is the quarterly advisor update of the AlphaDelta Growth of Dividend Income Class (“GoDI” or the “Fund”) from SciVest Capital Management Inc., the sub-advisor of the Fund. Attached to this commentary is the GoDI Portfolio Disclosure as of the end of the quarter. The first page of the Portfolio Disclosure shows all of the current stock holdings of the Fund, as well as some descriptive dividend and valuation characteristics for each portfolio holding – plus overall portfolio averages. The second page of the Portfolio Disclosure shows a number of relevant pie charts depicting overall GoDI portfolio characteristics such as sector, market capitalization, dividend yield and dividend growth “bucket” exposures. We also publish and post on our website a monthly version of the GoDI Portfolio Disclosure document (http://scivest.com/strategies/manager-commentary). Portfolio Income and Income Growth: The two primary objectives of the Fund are to provide its shareholders with: (i) a consistent, and above average, annual distribution yield; and (ii) growth in the absolute level of distributions per share through time (i.e., income growth). We attempt to deliver on these Fund-level objectives by investing in a global portfolio of equities which, on average, pay a higher than average dividend yield and which are growing their dividends per share at a relatively high rate (in the context of their current yield). As shown in the Portfolio Disclosure, across the Fund’s current holdings, the weighted average gross dividend yield is 4.0% per annum (versus 1.8% for the Russell 1000 Index and 2.4% for the MSCI World Index) with impressive double-digit trailing 1, 3 and 5-year dividend growth rates of 12.3%, 18.0% and 18.8%, respectively. This 4.0% average portfolio dividend yield is well covered by company earnings and cash-flow. Specifically, the 4.0% average dividend yield compares to a portfolio weighted average forward earnings per share yield of 10.1% (i.e., 255% dividend coverage by earnings) and forward cashflow yield of 13.8% (i.e., 348% dividend coverage by cash-flow). The Fund has a distribution policy whereby it distributes to its shareholders on a month-end basis every dollar (and no more) of dividend income (net of any dividend withholding taxes) accrued by the Fund during the month. As a result, monthly income varies with the dividend cycle of the Fund’s holdings, but the distributions perfectly reflect the true dividend income received by the Fund. Thus, the Fund does not experience the typical net asset value per share “grind” that other funds experience when their distributions are set higher than the income they actually receive. And, since the distributions are a true reflection of the underlying income received by the Fund, they can be used to judge the true income generation and income growth capability of the Fund.
AlphaDelta Growth of Dividend Income Class Quarterly Commentary
Page | 2
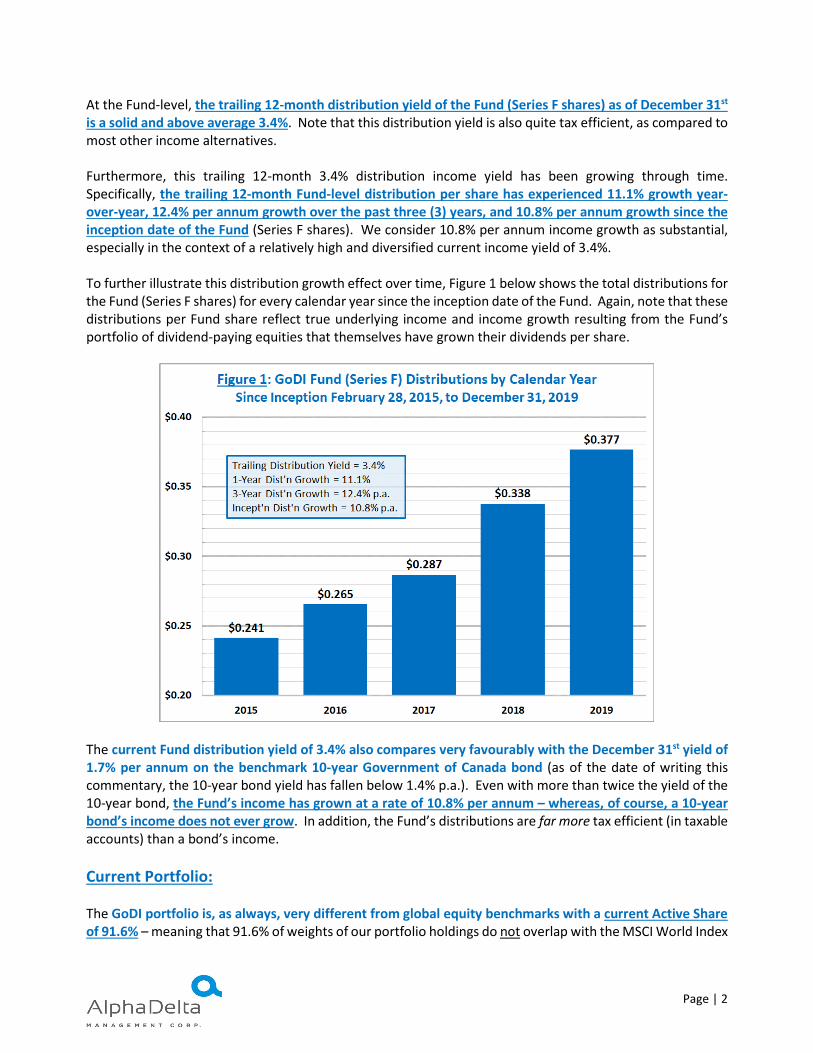
At the Fund-level, the trailing 12-month distribution yield of the Fund (Series F shares) as of December 31st is a solid and above average 3.4%. Note that this distribution yield is also quite tax efficient, as compared to most other income alternatives. Furthermore, this trailing 12-month 3.4% distribution income yield has been growing through time. Specifically, the trailing 12-month Fund-level distribution per share has experienced 11.1% growth year-over-year, 12.4% per annum growth over the past three (3) years, and 10.8% per annum growth since the inception date of the Fund (Series F shares). We consider 10.8% per annum income growth as substantial, especially in the context of a relatively high and diversified current income yield of 3.4%. To further illustrate this distribution growth effect over time, Figure 1 below shows the total distributions for the Fund (Series F shares) for every calendar year since the inception date of the Fund. Again, note that these distributions per Fund share reflect true underlying income and income growth resulting from the Fund’s portfolio of dividend-paying equities that themselves have grown their dividends per share.
The current Fund distribution yield of 3.4% also compares very favourably with the December 31st yield of 1.7% per annum on the benchmark 10-year Government of Canada bond (as of the date of writing this commentary, the 10-year bond yield has fallen below 1.4% p.a.). Even with more than twice the yield of the 10-year bond, the Fund’s income has grown at a rate of 10.8% per annum – whereas, of course, a 10-year bond’s income does not ever grow. In addition, the Fund’s distributions are far more tax efficient (in taxable accounts) than a bond’s income. Current Portfolio: The GoDI portfolio is, as always, very different from global equity benchmarks with a current Active Share of 91.6% – meaning that 91.6% of weights of our portfolio holdings do not overlap with the MSCI World Index

Page | 3
benchmark (alternatively, only 8.4% of the weights of the GoDI portfolio holdings overlap with the MSCI World Index). This means that the GoDI portfolio should provide diversification and differentiation within an otherwise diversified portfolio. The current GoDI portfolio is itself well diversified across sectors and industry groups with the largest sector allocation (Financials) currently at 37.4%. In order of size, we have the following sector exposures: 37.4% Financials, 9.9% Health Care, 9.3% Consumer Discretionary, 9.0% Energy, 7.4% Communication Services, 4.7% Information Technology, 4.7% Real Estate, 4.1% Industrials, 3.4% Materials, 1.3% Consumer Staples, and 0.0% Utilities. In addition, the Fund holds 6.3% in the “Other” sector category, which represents the Fund’s investment in the AlphaDelta Canadian Growth of Dividend Income Fund. On an individual stock holding basis, we currently hold a diversified portfolio of 60 equity positions (not including the Fund’s holding in the AlphaDelta Canadian Growth of Dividend Fund which itself holds another 33 individual equity holdings). The top 10 individual equity holdings represent 34.2% of the Fund’s assets and are in descending order of size: Brookfield Property Partners (BPY.U, 4.7%), Abbvie Inc (ABBV, 3.9%), Fiera Capital Corp (FSZ, 3.8%), Enbridge Inc (ENB, 3.7%), Morgan Stanley (MS, 3.5%), Broadcom Ltd (AVGO, 3.2%), Manulife Financial Corp (MFC, 3.2%), Prudential Financial Inc (PRU, 2.9%), Marathon Petroleum Corp (MPC, 2.7%), and Lincoln National Corp (LNC, 2.7%). (See entire GoDI portfolio attached hereto.) A byproduct of the sub-advisor’s growing income investment strategy is that the GoDI portfolio typically has much better (i.e., cheaper) valuations than the overall equity markets. Currently, the portfolio weighted average 12-month forward price-to-earnings ratio is 11.0x (versus 18.7x for the Russell 1000 Index and 17.0x for the MSCI World Index) and the average 12-month forward price-to-cash-flow ratio is 8.4x (versus 12.8x for the Russell 1000 Index and 11.2x for the MSCI World Index). Portfolio Changes and Movers: During the fourth quarter we eliminated our positions in American Tower Corp (AMT), China Mobile Ltd (CHL), Crown Castle International Corp (CCI), Fedex Corp (FDX), Intel Corp (INTC), Lam Research Corp (LRCX), Nissan Motor Co (NSANY), Omega Healthcare Investors (OHI), and QTS Realty Trust Inc (QTS). We typically eliminate positions when their forward-looking dividend growth becomes less promising (due to a number of potential reasons) and/or their valuations become excessively high (and thus dividend yields low). We also decreased (by at least 0.5%) our existing positions in CVS Health Corp (CVS), Fiera Capital Corp (FSZ), Prudential Financial Inc (PRU), and Valero Energy Corp (VLO). During the fourth quarter, we initiated new positions in the global investment bank Goldman Sachs Group Inc (GS) and the specialty insurer Unum Group (UNM). We also increased (by at least 0.5%) our existing positions in Broadcom Inc (AVGO), CIT Group Inc (CIT), Lincoln National Corp (LNC) and Meredith Corp (MDP). Amongst the GoDI portfolio holdings (that were held through the entire quarter), the five (5) highest returns during the fourth quarter (in descending order) were: Skyworks Solutions Inc (+52.5%), UnitedHealth Group Inc (UNH, +35.3%), Smurfit Kappa Group PLC (SMFKY, +27.3%), Best Buy Co Inc (BBY, +27.3%), and Societe Generale (SCGLY, +26.8%). Amongst the GoDI holdings (that were held through the entire quarter), the five (5) lowest returns during the fourth quarter were: Brookfield Property Partners (BPY.U, -11.8%), Meredith Corp (MDP, -11.4%), Foot Locker Inc (FL, -9.7%), Legg Mason Inc (LM, -6.0%), and Unilever PLC (UL, -4.9%).
Page | 4
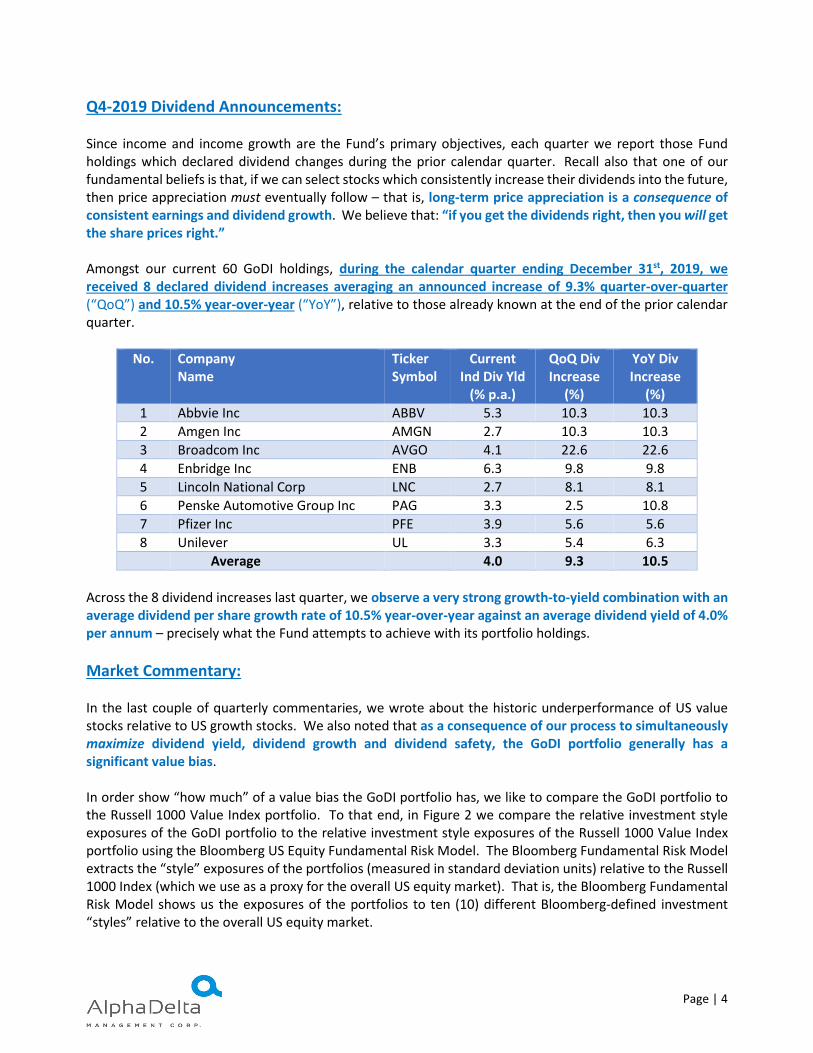
Q4-2019 Dividend Announcements: Since income and income growth are the Fund’s primary objectives, each quarter we report those Fund holdings which declared dividend changes during the prior calendar quarter. Recall also that one of our fundamental beliefs is that, if we can select stocks which consistently increase their dividends into the future, then price appreciation must eventually follow – that is, long-term price appreciation is a consequence of consistent earnings and dividend growth. We believe that: “if you get the dividends right, then you will get the share prices right.” Amongst our current 60 GoDI holdings, during the calendar quarter ending December 31st, 2019, we received 8 declared dividend increases averaging an announced increase of 9.3% quarter-over-quarter (“QoQ”) and 10.5% year-over-year (“YoY”), relative to those already known at the end of the prior calendar quarter.
No. Company Name
Ticker Symbol
Current Ind Div Yld
(% p.a.)
QoQ Div Increase
(%)
YoY Div Increase
(%) 1 Abbvie Inc ABBV 5.3 10.3 10.3 2 Amgen Inc AMGN 2.7 10.3 10.3 3 Broadcom Inc AVGO 4.1 22.6 22.6 4 Enbridge Inc ENB 6.3 9.8 9.8 5 Lincoln National Corp LNC 2.7 8.1 8.1 6 Penske Automotive Group Inc PAG 3.3 2.5 10.8 7 Pfizer Inc PFE 3.9 5.6 5.6 8 Unilever UL 3.3 5.4 6.3 Average 4.0 9.3 10.5
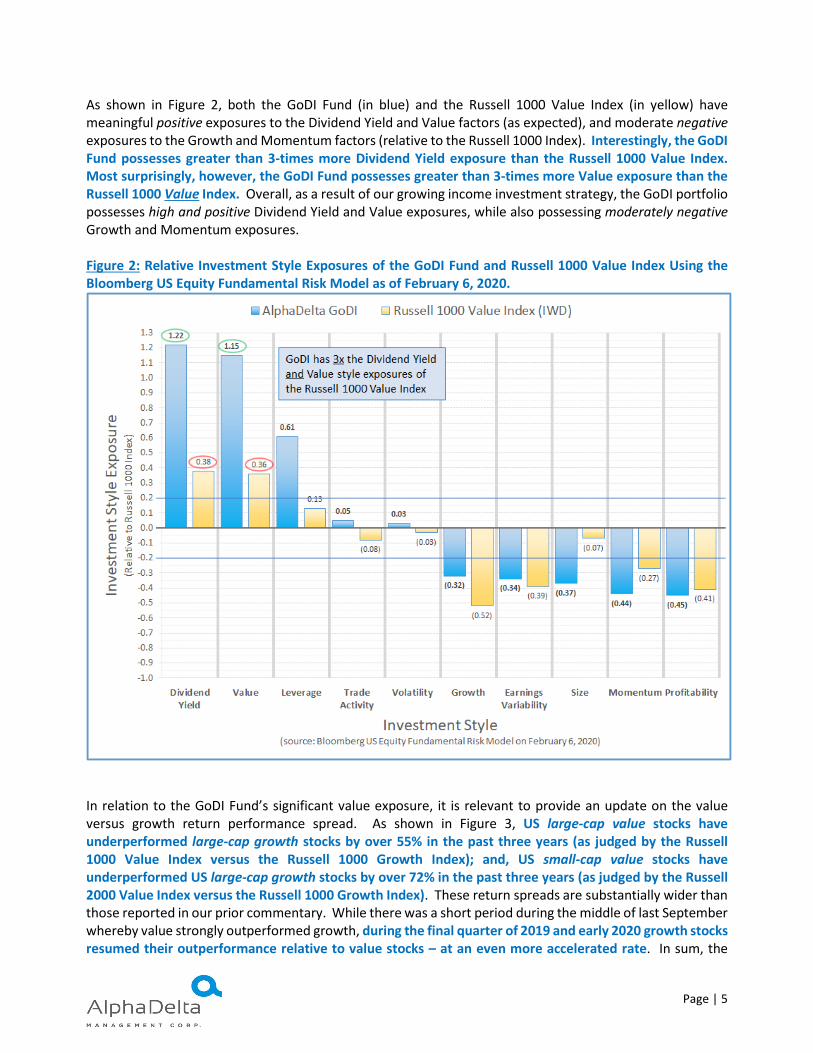
Across the 8 dividend increases last quarter, we observe a very strong growth-to-yield combination with an average dividend per share growth rate of 10.5% year-over-year against an average dividend yield of 4.0% per annum – precisely what the Fund attempts to achieve with its portfolio holdings. Market Commentary: In the last couple of quarterly commentaries, we wrote about the historic underperformance of US value stocks relative to US growth stocks. We also noted that as a consequence of our process to simultaneously maximize dividend yield, dividend growth and dividend safety, the GoDI portfolio generally has a significant value bias. In order show “how much” of a value bias the GoDI portfolio has, we like to compare the GoDI portfolio to the Russell 1000 Value Index portfolio. To that end, in Figure 2 we compare the relative investment style exposures of the GoDI portfolio to the relative investment style exposures of the Russell 1000 Value Index portfolio using the Bloomberg US Equity Fundamental Risk Model. The Bloomberg Fundamental Risk Model extracts the “style” exposures of the portfolios (measured in standard deviation units) relative to the Russell 1000 Index (which we use as a proxy for the overall US equity market). That is, the Bloomberg Fundamental Risk Model shows us the exposures of the portfolios to ten (10) different Bloomberg-defined investment “styles” relative to the overall US equity market.
Page | 5
As shown in Figure 2, both the GoDI Fund (in blue) and the Russell 1000 Value Index (in yellow) have meaningful positive exposures to the Dividend Yield and Value factors (as expected), and moderate negative exposures to the Growth and Momentum factors (relative to the Russell 1000 Index). Interestingly, the GoDI Fund possesses greater than 3-times more Dividend Yield exposure than the Russell 1000 Value Index. Most surprisingly, however, the GoDI Fund possesses greater than 3-times more Value exposure than the Russell 1000 Value Index. Overall, as a result of our growing income investment strategy, the GoDI portfolio possesses high and positive Dividend Yield and Value exposures, while also possessing moderately negative Growth and Momentum exposures. Figure 2: Relative Investment Style Exposures of the GoDI Fund and Russell 1000 Value Index Using the Bloomberg US Equity Fundamental Risk Model as of February 6, 2020.
In relation to the GoDI Fund’s significant value exposure, it is relevant to provide an update on the value versus growth return performance spread. As shown in Figure 3, US large-cap value stocks have underperformed large-cap growth stocks by over 55% in the past three years (as judged by the Russell 1000 Value Index versus the Russell 1000 Growth Index); and, US small-cap value stocks have underperformed US large-cap growth stocks by over 72% in the past three years (as judged by the Russell 2000 Value Index versus the Russell 1000 Growth Index). These return spreads are substantially wider than those reported in our prior commentary. While there was a short period during the middle of last September whereby value strongly outperformed growth, during the final quarter of 2019 and early 2020 growth stocks resumed their outperformance relative to value stocks – at an even more accelerated rate. In sum, the

Page | 6
mean-reversion of value relative to growth has not yet begun – despite some definitions of growth and value showing the widest return spread in history (including the tech bubble), with the current episode being the longest time period of such underperformance of value relative to growth in history as well. Figure 3: Relative Performance of the Russell 1000 Growth Index, Russell 1000 Value Index and Russell 2000 Value Index – January 1, 2017, to February 6, 2020.
Figure 4 shows the 12-month forward P/E ratios (using analyst expected EPS) for the constituents of the Russell 1000 Growth Index relative to the constituents of the Russell 1000 Value Index since January 1, 2017. Over the past three years, Russell 1000 Growth stocks have increased in valuation from a forward P/E of approximately 18.6x to 24.5x (+32%), while Russell 1000 Value stocks have actually decreased in valuation from a forward P/E of approximately 16.8x to 15.8x (-6%). That is, the Russell 1000 Growth Index’s historic 55% outperformance over the past three years is NOT because the constituent growth stocks have grown earnings and earnings expectations 55% more than the Russell 1000 Value Index constituents; it is primarily because the valuation of growth stocks have increased so much (approximately 40%) relative to value stocks. In other words, the vast majority of the return disparity between the Russell 1000 Growth Index and the Russell 1000 Value Index is because the Russell 1000 Growth Index constituents have become much more expressive, while the Russell 1000 Value Index constituents have actually become less expensive. Overall, we believe that the majority of US stocks within the US market are not expensive – it is just the mega and large-cap growth stocks are very expensive making the overall US market itself appear expensive. Indeed, US large-cap value stocks are actually cheaper today than they were three years ago.

Page | 7
While the unwind of growth stock returns and valuations relative to value stocks has not yet begun, when it does begin it may be very significant and long-lasting. While we wait patiently, we take comfort in our portfolio holdings providing an average 4% dividend yield with 18% per annum dividend income growth. Figure 4: Forward P/E Ratio of Russell 1000 Growth Index Constituents and Russell 1000 Value Index Constituents – January 1, 2017, to February 6, 2020.
Always remember our primary message: “Growing income”, as opposed to “fixed income”, is the only means of maintaining the purchasing power of your (or your client’s) income stream over the years and decades to come. If you would like more information regarding the AlphaDelta Growth of Dividend Income Class and its current portfolio (including the up-to-date presentation piece), please feel free to contact me directly or alternatively contact AlphaDelta Management Corp. ( www.AlphaDelta.com ). Thank you for your continued interest in the Fund, John J. Schmitz John J. Schmitz, Ph.D., CFA
No. Ticker List Company Name Portfolio Country Sector Industry Market Div Yld Ind Div PS Ind Div PS Ind Div PS Ind Div PS Ind Div PS Ind Div PS SciVest 12‐Mth 12‐Mth 12‐Mth 12‐MthType Weight of Cap Indicated 1 Year 1 Year 3 Year 3 Year 5 Year 5 Year GDI Forward Forward Forward Forward
Domicile ($B CAD) (% p.a.) Growth Time Growth Time Growth Time Score EPS Yld CF Yld P/E P/CF97.5% (% p.a.) Series (% p.a.) Series (% p.a.) Series (% p.a.) (% p.a.)
1 BPY‐U CA BROOKFIELD PROPERTY PARTNERS 4.7% US Real Estate Real Estate Management & Devel 24 7.4 4.8 5.6 5.7 29.0 0.0 n/a n/a n/a2 ABBV US ABBVIE INC 3.9% US Health Care Biotechnology 170 5.3 10.3 22.6 19.2 31.2 10.9 11.9 9.2 8.43 FSZ CA FIERA CAPITAL CORP 3.8% CA Financials Capital Markets 1 7.2 5.0 9.5 11.8 35.5 12.7 11.8 7.9 8.54 ENB CA ENBRIDGE INC 3.7% CA Energy Oil, Gas & Consumable Fuels 104 6.3 9.8 15.2 18.3 30.3 5.1 9.9 19.4 10.15 MS US MORGAN STANLEY 3.5% US Financials Capital Markets 107 2.7 16.7 20.5 28.5 36.6 10.1 10.2 9.9 9.86 AVGO US BROADCOM INC 3.2% US Information Technology Semiconductors & Semiconductor 163 4.1 22.6 85.4 59.0 33.3 7.3 8.7 13.8 11.47 MFC CA MANULIFE FINANCIAL CORP 3.2% CA Financials Insurance 51 3.8 0.0 10.6 10.0 22.3 11.8 n/a 8.5 n/a8 PRU US PRUDENTIAL FINANCIAL INC 2.9% US Financials Insurance 49 4.3 11.1 12.6 11.5 35.2 13.1 16.5 7.6 6.09 MPC US MARATHON PETROLEUM CORP 2.7% US Energy Oil, Gas & Consumable Fuels 51 3.5 15.2 13.8 16.2 33.3 12.1 24.8 8.3 4.010 LNC US LINCOLN NATIONAL CORP 2.7% US Financials Insurance 15 2.7 8.1 11.3 14.9 32.8 16.9 20.1 5.9 5.011 RCL US ROYAL CARIBBEAN CRUISES LTD 2.5% US Consumer Discretionary Hotels, Restaurants & Leisure 36 2.3 11.4 17.6 21.1 27.9 7.9 12.3 12.7 8.112 CVS US CVS HEALTH CORP 2.2% US Health Care Health Care Providers & Servic 126 2.7 0.0 5.6 12.7 19.0 9.6 12.0 10.4 8.313 CMCSA US COMCAST CORP‐CLASS A 1.9% US Communication Services Media 266 1.9 10.5 15.2 13.3 25.7 7.3 13.5 13.8 7.414 LOW US LOWE'S COS INC 1.8% US Consumer Discretionary Specialty Retail 119 1.8 14.6 16.3 19.0 32.7 5.5 8.1 18.2 12.315 C US CITIGROUP INC 1.8% US Financials Banks 227 2.6 13.3 47.2 100.0 31.4 10.5 12.6 9.5 7.916 CAT US CATERPILLAR INC 1.7% US Industrials Machinery 106 2.8 19.8 10.2 8.0 26.9 7.1 10.0 14.0 10.017 NXST US NEXSTAR MEDIA GROUP INC‐CL A 1.7% US Communication Services Media 7 1.5 20.0 23.3 24.6 27.4 14.2 19.8 7.1 5.118 AMP US AMERIPRISE FINANCIAL INC 1.7% US Financials Capital Markets 27 2.3 7.8 9.0 10.8 20.9 10.6 12.2 9.4 8.219 IVZ US INVESCO LTD 1.5% US Financials Capital Markets 11 6.9 3.3 3.5 4.4 30.0 14.7 19.1 6.8 5.220 FL US FOOT LOCKER INC 1.5% US Consumer Discretionary Specialty Retail 5 3.9 10.1 11.4 11.6 36.6 13.7 18.7 7.3 5.421 JPM US JPMORGAN CHASE & CO 1.5% US Financials Banks 568 2.6 12.5 23.3 17.6 29.6 7.5 8.9 13.3 11.222 UNM US UNUM GROUP 1.5% US Financials Insurance 8 3.9 9.6 12.5 11.6 34.1 19.4 35.2 5.1 2.823 DFS US DISCOVER FINANCIAL SERVICES 1.5% US Financials Consumer Finance 35 2.1 10.0 13.6 12.9 22.8 11.2 13.3 8.9 7.524 LYB US LYONDELLBASELL INDU‐CL A 1.4% US Materials Chemicals 41 4.4 5.0 7.3 8.4 24.0 12.1 15.8 8.2 6.325 NTTYY ADR NIPPON TELEGRAPH & TELE‐ADR 1.4% JP Communication Services Diversified Telecommunication 128 3.4 5.6 16.6 16.1 31.7 8.5 20.2 11.7 5.026 VLO US VALERO ENERGY CORP 1.4% US Energy Oil, Gas & Consumable Fuels 50 3.8 12.5 14.5 26.8 39.5 10.4 16.9 9.6 5.927 IX ADR ORIX ‐ SPONSORED ADR 1.3% JP Financials Diversified Financial Services 29 4.5 6.6 15.7 17.6 33.1 14.5 n/a 6.9 n/a28 MDP US MEREDITH CORP 1.3% US Communication Services Media 2 7.1 5.5 5.1 5.9 39.2 19.3 n/a 5.2 n/a29 UL ADR UNILEVER PLC‐SPONSORED ADR 1.3% GB Consumer Staples Personal Products 196 3.3 6.3 10.7 9.3 28.4 5.3 6.8 18.7 14.830 DAL US DELTA AIR LINES INC 1.3% US Industrials Airlines 49 2.8 15.0 25.7 34.9 32.2 12.1 22.6 8.3 4.431 PUK ADR PRUDENTIAL PLC‐ADR 1.2% GB Financials Insurance 64 3.5 4.1 8.4 7.4 23.7 9.8 n/a 10.2 n/a32 PNGAY ADR PING AN INSURANCE‐ADR 1.2% CN Financials Insurance 288 2.2 14.2 49.8 39.5 38.7 10.4 13.5 9.6 7.433 RDS/B ADR ROYAL DUTCH SHELL‐SPON ADR‐B 1.2% NL Energy Oil, Gas & Consumable Fuels 305 6.3 0.0 0.0 0.0 7.1 8.6 20.2 11.6 5.034 UNH US UNITEDHEALTH GROUP INC 1.2% US Health Care Health Care Providers & Servic 362 1.5 20.0 20.0 23.6 30.9 5.6 6.5 17.8 15.335 GBOOY ADR GRUPO FIN BANORTE‐SPON ADR 1.1% MX Financials Banks 21 5.2 60.7 65.0 41.6 40.0 12.0 14.8 8.3 6.836 CIT US CIT GROUP INC 1.1% US Financials Banks 6 3.1 40.0 32.6 18.5 26.6 10.8 30.0 9.3 3.337 CCL US CARNIVAL CORP 1.0% US Consumer Discretionary Hotels, Restaurants & Leisure 45 3.9 0.0 12.6 14.9 22.1 8.8 16.3 11.4 6.138 GS US GOLDMAN SACHS GROUP INC 1.0% US Financials Capital Markets 110 2.2 56.3 24.4 15.8 27.5 10.3 14.1 9.7 7.139 LAZ US LAZARD LTD‐CL A 1.0% US Financials Capital Markets 6 4.7 6.8 7.3 9.4 29.1 9.2 9.0 10.9 11.140 SWKS US SKYWORKS SOLUTIONS INC 1.0% US Information Technology Semiconductors & Semiconductor 27 1.5 15.8 16.3 27.6 24.0 5.5 6.2 18.1 16.141 PAG US PENSKE AUTOMOTIVE GROUP INC 0.9% US Consumer Discretionary Specialty Retail 5 3.3 10.8 12.2 14.3 23.9 11.3 11.0 8.9 9.142 SNV US SYNOVUS FINANCIAL CORP 0.9% US Financials Banks 7 3.1 20.0 35.7 24.6 32.3 9.3 9.6 10.7 10.443 HDELY ADR HEIDELBERGCEMENT AG‐UNSP ADR 0.9% DE Materials Construction Materials 19 3.2 10.5 17.3 28.5 37.2 10.5 19.6 9.5 5.144 LM US LEGG MASON INC 0.9% US Financials Capital Markets 4 4.5 17.6 22.1 20.1 40.0 10.8 13.2 9.3 7.645 BBY US BEST BUY CO INC 0.8% US Consumer Discretionary Specialty Retail 30 2.3 11.1 21.3 21.4 30.0 7.1 11.4 14.0 8.846 BNPQY ADR BNP PARIBAS‐ADR 0.8% FR Financials Banks 96 5.7 0.0 9.3 15.0 32.1 11.8 17.4 8.5 5.847 PFE US PFIZER INC 0.8% US Health Care Pharmaceuticals 282 3.9 5.6 8.2 7.9 22.3 7.1 7.7 14.1 12.948 BX US BLACKSTONE GROUP INC/THE‐A 0.7% US Financials Capital Markets 87 3.5 ‐23.4 6.1 2.2 ‐1.0 5.5 7.4 18.3 13.549 SCGLY ADR SOCIETE GENERALE‐SPONS ADR 0.7% FR Financials Banks 39 7.1 0.0 3.2 17.1 11.0 12.1 17.8 8.2 5.650 GM US GENERAL MOTORS CO 0.7% US Consumer Discretionary Automobiles 68 4.2 0.0 0.0 4.8 8.1 17.1 30.2 5.9 3.351 BAYRY ADR BAYER AG‐SPONSORED ADR 0.7% DE Health Care Pharmaceuticals 104 3.8 1.6 4.4 6.3 25.9 10.0 12.5 10.0 8.052 AMGN US AMGEN INC 0.7% US Health Care Biotechnology 186 2.7 10.3 17.0 21.3 28.2 6.7 7.5 15.0 13.353 SMFKY ADR SMURFIT KAPPA GROUP PLC‐ADR 0.6% IE Materials Containers & Packaging 12 2.9 11.3 12.7 16.8 19.0 7.8 15.1 12.8 6.654 MINI US MOBILE MINI INC 0.6% US Industrials Commercial Services & Supplies 2 2.9 10.0 10.1 10.1 22.7 5.7 n/a 17.5 n/a55 IPG US INTERPUBLIC GROUP OF COS INC 0.5% US Communication Services Media 12 4.1 11.9 16.1 19.9 29.7 8.6 11.8 11.6 8.556 UNP US UNION PACIFIC CORP 0.5% US Industrials Road & Rail 163 2.1 21.3 17.0 14.2 34.2 5.2 7.4 19.1 13.657 CE US CELANESE CORP 0.5% US Materials Chemicals 19 2.0 14.8 19.9 19.9 28.6 9.2 10.9 10.9 9.258 AMX ADR AMERICA MOVIL‐SPN ADR CL L 0.5% MX Communication Services Wireless Telecommunication Ser 69 2.3 6.3 6.7 7.2 24.4 7.7 24.4 13.0 4.159 CSCO US CISCO SYSTEMS INC 0.5% US Information Technology Communications Equipment 264 2.9 6.1 10.4 13.0 22.9 6.8 7.7 14.6 13.060 JNJ US JOHNSON & JOHNSON 0.5% US Health Care Pharmaceuticals 499 2.6 5.6 5.9 6.3 16.9 6.2 6.8 16.1 14.71 QWE443 CA ALPHADELTA CDN GRWTH OF DIV 6.3% CA Other (CGoDI) Other (CGoDI) 50 4.4 9.9 14.7 14.8 27.6 7.3 8.8 13.6 11.3
Invested Portfolio Equal Weighted Average 1.60% 98.7 3.63 11.2 16.7 17.8 27.8 9.8 14.2 11.2 8.4Invested Portfolio Weighted Average 2.42% 91.0 3.97 12.3 18.0 18.8 29.4 10.1 13.8 11.0 8.4
* Data as of date = December 31, 2019 Dividend Coverage = 255% 348%** All data is captured just prior to publication. Data is sourced and derived from Bloomberg and SciVest Capital Management Inc. "Market Cap" is the current market capitalization of equity. "Div Yld Indicated" is the most recent indicated annualized dividend yield. "Ind Div PS" is the annualized gross amount of the most recent indicated dividend per share. The "Ind Div PS Times Series" charts show the annualize indicated dividend per share on a monthly basis as of each calendar month‐end for the stated time period. The "SciVest GDI Score" is SciVest Capital Management Inc.'s proprietary Growth of Dividend Income Score. The SciVest GDI Score ranges from 0 to 40 (higher is better) and captures the magnitude of the combination of current dividend yield and dividend per share growth for each company stock (i.e., the higher the SciVest GDI Score, the higher the companies relative combined dividend yield and dividend growth). "12‐Mth Forward P/E" is the ratio of current stock price to Bloomberg's blended 12‐month forward aggregate analyst estimate of earnings per share from continuing operations, while "12‐Mth Forward EPS Yld" is the inverse of this ratio. "12‐Mth Forward P/CF" is the ratio of current stock price to Bloomberg's blended 12‐month forward aggregate analyst estimate of cash flow per share, while "12‐Mth Forward Cashflow Yld" is the inverse of this ratio. "Portfolio Equal Weighted Average" is the simple arithmetic mean of each data item across all portfolio holdings, and "Portfolio Weighted Average" is the weighted average of each data item where each data point within the average is weighted by the percentage held of each portfolio holding (not including cash). Within the each average calculation, missing values are assigned the average of the remaining data items.
AlphaDelta Growth of Dividend Income ClassPortfolio Holdings and Characteristics
Cash; 2.5%
n/a; 30.8%
0% to 5% p.a; 1.2%
5% to 10% p.a.; 13.0%
10% to 15% p.a.; 19.3%
15% to 20% p.a.; 14.3%
20% to 30% p.a.; 8.3%
>30% p.a.; 10.5%
10 YEAR DIVIDEND GROWTH BUCKETS
Cash; 2.5%<0% p.a; 0.0%
=0% p.a; 1.9%
0% to 5% p.a; 3.0%
5% to 10% p.a.; 20.6%
10% to 15% p.a.; 30.2%
15% to 20% p.a.; 16.8%
20% to 30% p.a.; 15.6%
>30% p.a.; 9.3%
3 YEAR DIVIDEND GROWTH BUCKETS
Cash; 2.5%
=0% p.a; 1.2%
0% to 5% p.a; 3.0%
5% to 10% p.a.; 15.1%
10% to 15% p.a.; 32.6%
15% to 20% p.a.; 21.6%
20% to 30% p.a.; 15.3%
>30% p.a.; 8.6%
5 YEAR DIVIDEND GROWTH BUCKETS
Cash; 2.5%
Small Cap (<$2B); 5.1%
Mid Cap ($2B to $10B); 10.0%
Large Cap ($10B to $100B); 46.1%
Mega Cap (>$100B); 36.2%
MARKET CAP BUCKETS (CA$)
AlphaDelta Growth of Dividend Income ClassPortfolio Holdings and Characteristics
Cash; 2.5%
0% to 2% p.a.; 7.6%
2% to 3% p.a.; 27.6%
3% to 4% p.a.; 21.2%
4% to 5% p.a.; 18.3%
5% to 6% p.a.; 5.8%
>6% p.a.; 17.0%
DIVIDEND YIELD BUCKETS
Cash & n/a; 2.5%
GDI Score = 0 to 10; 2.7%GDI Score = 10
to 20; 4.0%GDI Score = 20 to
30; 42.9%
GDI Score = 30 to 40; 47.9%
SCIVEST GDI SCORE BUCKETS
Cash; 2.5%
United States; 67.4%
Canada; 17.0%
Europe; 7.4%
Asia; 4.0%
Other; 1.6%
DOMICILE EXPOSURES
Average = $91.0 Billion Average = 3.97% p.a. Average = 29.4
Average = 18.0% p.a. Average = 18.8% p.a. Average = 18.3% p.a.
Cash, 2.5%
Financials, 37.4%
Health Care, 9.9%
Consumer Discretionary, 9.3%
Energy, 9.0%
Communication Services, 7.4%
Other (CGoDI), 6.3%
Information Technology, 4.7%
Real Estate, 4.7%
Industrials, 4.1%
Materials, 3.4%Consumer Staples,
1.3%
SECTOR EXPOSURES
Cash, 2.5%
Capital Markets, 14.1%
Insurance, 12.6%
Oil, Gas & Consumable Fuels, 9.0%
Banks, 7.9%
Other (CGoDI), 6.3%
Media, 5.5%
Specialty Retail, 5.1%
Real Estate Management & Devel,
4.7%
Biotechnology, 4.6%
Semiconductors & Semiconductor, 4.2%
INDUSTRY EXPOSURES