
Alpha Services and Holdings S.A.
86
Alpha Services and Holdings S.A. Pillar III Disclosures Report for June 30, 2021
Transcript of Alpha Services and Holdings S.A.

Alpha Services and Holdings S.A.
Pillar III Disclosures
Report for June 30, 2021

Pillar III Disclosures for June 30, 2021 1
Contents
1 Introduction ................................................................................................................................................ 7
1.1 General Information .............................................................................................................................. 7
2 Pillar III Disclosures Overview .................................................................................................................. 8
2.1 Background .......................................................................................................................................... 8
2.1.1 Disclosure enhancements ............................................................................................................ 8
2.1.2 Approval and publication .............................................................................................................. 9
2.2 Supervision and Regulatory Framework ............................................................................................... 9
2.3 Significant Developments ....................................................................................................................11
2.3.1 Capital Issuances ........................................................................................................................11
2.3.2 Stress Test ..................................................................................................................................11
2.3.3 Minimum Requirement of Own Funds and Eligible Liabilities ......................................................12
2.3.4 NPE Plan & NPE initiatives .........................................................................................................12
2.3.5 Updated Strategic Plan ................................................................................................................13
3 Capital Management .................................................................................................................................15
3.1 Capital Ratios ......................................................................................................................................15
3.1.1 Key metrics ..................................................................................................................................16
3.2 IFRS 9 Capital Impact..........................................................................................................................18
3.3 Reconciliation of regulatory own funds to the balance sheet according to IFRS .................................19
3.4 Capital requirements under Pillar I ......................................................................................................23
3.5 Capital Buffers .....................................................................................................................................25
4 Leverage ....................................................................................................................................................29
5 Credit Risk .................................................................................................................................................34
5.1 Credit risk mitigation ............................................................................................................................48
5.1.1 Description of the main collateral types .......................................................................................48
5.2 Additional Credit Risk reporting to COVID-19 ......................................................................................54
6 Exposure to Securitisation positions ......................................................................................................59
7 Counterparty credit risk (CCR) ................................................................................................................64
8 Market Risk ................................................................................................................................................70

Pillar III Disclosures for June 30, 2021 2
8.1 IMA approach for market risk ..............................................................................................................70
8.2 Standardised approach for market risk ................................................................................................74
9 Liquidity Risk ............................................................................................................................................76
9.1 Liquidity Coverage Ratio (LCR) ...........................................................................................................76
9.2 Net Stable Funding Ratio (NSFR) .........................................................................................................78
10 Appendix ..................................................................................................................................................80
10.1 Appendix I – Own Funds structure ....................................................................................................80

Pillar III Disclosures for June 30, 2021 3
ID Template Description Section Page
Capital Management
1 Capital Adequacy Ratios 3.1 16
2 KM1 Key Metrics template 3.1.1 17
3 IFRS9-FL
Comparison of own funds and capital and leverage ratios with and without the application of transitional arrangements for IFRS
3.2 19
4 CC2 Reconciliation of regulatory own funds to balance sheet in the audited financial statements
3.3 20
5 Own Funds Structure 3.3 22
6 OV1 Overview of RWAs 3.4 24
7 CCyB1 Geographical distribution of credit exposures relevant for the calculation of the countercyclical capital buffer
3.5 26
8 CCyB2 Amount of institution-specific countercyclical capital buffer
3.5 28
Leverage
9 LR1 Summary reconciliation of accounting assets and leverage ratio exposures
4 29
10 LR2 Leverage ratio common disclosure 4 31
11 LR3 Split-up of on balance sheet exposures (excluding derivatives, SFTs and exempted exposures)
4 33
Credit Risk
12 CR1-A Maturity of exposures 5 34
13 CQ5 Credit quality of loans and advances to non-financial corporations by industry
5 35
14 CQ4 Quality of non-performing exposures by geography
5 37
15 CQ1 Credit quality of forborne exposures 5 39
16 CQ3 Credit quality of performing and non-performing exposures by past due days
5 41
17 CR1 Performing and non-performing exposures and related provisions
5 43
18 CR2 Changes in the stock of non-performing loans and advances
5 45
19 CR5 Standardised approach 5 46
20 CR3 CRM techniques overview: Disclosure of the use of credit risk mitigation techniques
5.1.1 49
21 CR4 Standardised approach – credit risk exposure and CRM effects
5.1.1 51

Pillar III Disclosures for June 30, 2021 4
22 CQ7 Collateral obtained by taking possession and execution processes
5.1.1 53
23 COVID1 Information on loans and advances subject to legislative and non-legislative moratoria
5.2 55
24 COVID2
Breakdown of loans and advances subject to legislative and non-legislative moratoria by residual maturity of moratoria
5.2 56
25 COVID3
Information on newly originated loans and advances provided under newly applicable public guarantee schemes introduced in response to COVID-19 crisis
5.2 58
Exposure to Seruritisation positions
26 SEC1 Securitisation exposures in the non-trading book
6 60
27 SEC3 Securitisation exposures in the non-trading book and associated regulatory capital requirements - institution acting as originator or as sponsor
6 61
28 SEC4 Securitisation exposures in the non-trading book and associated regulatory capital requirements - institution acting as investor
6 62
29 SEC5 Exposures securitised by the institution - Exposures in default and specific credit risk adjustments
6 63
Counterparty Credit Risk (CCR)
30 CCR1 Analysis of CCR by approach 7 65
31 CCR2 Transactions subject to own funds requirements for CVA risk
7 66
32 CCR8 Exposures to CCPs 7 67
33 CCR3 Standardised approach – CCR exposures by regulatory portfolio and risk
7 68
34 CCR5 Composition of collateral for CCR exposures
7 69
Market Risk
35 MR2-A Market risk under the internal Model Approach (IMA)
8.1 70
36 MR2-B RWA flow statements of market risk exposures under the IMA
8.1 71
37 MR3 IMA values for trading portfolios 8.1 73
38 MR4 Comparison of VaR estimates with gains/losses
8.1 74
39 MR1 Market risk under the standardised approach
8.2 75
Liquidity Risk
40 LIQ1 Quantitative information of LCR 9.1 77
41 LIQ2 Net Stable Funding Ratio 9.2 78
Appendix
42 CC1 Composition of Regulatory own funds 10.1 80

Pillar III Disclosures for June 30, 2021 5
List of Abbreviations
Abbreviation Definition
ACM Ambit Capital Manager
ALCo Assets-Liabilities Management Committee
BoD Board of Directors
BoG Bank of Greece
Bps Basis Point
BRRD Bank Recovery and Resolution Directive
CAR Capital Adequacy Ratios
CBR Combined Buffers Requirements
CCF Credit Conversion Factor
CCP Code of Civil Procedure
CCR Counterparty Credit Risk
CCyB Countercyclical Capital Buffer
CDS Credit Default Swaps
CET1 Common Equity Tier 1
CEO Chief Executive Officer
CFO Chief Financial Officer
CRD Capital Requirements Directive
CRE Commercial Real Estate
CRM Credit Risk Mitigation
CRO Chief Risk Officer
CRR Capital Requirements Regulation
CSA Credit Support Annex
CVA Credit Valuation Adjustment
DTA Deferred Tax Assets
EAD Exposure at Default
EBA European Banking Authority
ECAI External Credit Assessment Institutions
ECB European Central Bank
ECL Expected Credit Loss
ELA Emergency Liquidity Assistance
EU European Union
FRTB Fundamental Review of the Trading Book
FTP Fund Transfer Pricing mechanism
FVTOCI Fair Value Through Other Comprehensive Income
FVTPL Fair Value Through Profit or Loss
FX Foreign Exchange
GDP Gross Domestic product
GL Guidelines
GMRA Global Master Repurchase Agreement
KPI Key Performance Indicator
KRI Key Risk Indicator
LAS Liquidity Adequacy Statements
LCR Liquidity Coverage Ratio
LGD Loss given default
LTV Loan to Value
HDIGF Hellenic Deposit and Investment Guarantee Fund
IAS International Accounting Standards
ICAAP Internal Capital Adequacy Assessment Process
ICS Internal Control System
ILAAP Internal Liquidity Adequacy Assessment Process

Pillar III Disclosures for June 30, 2021 6
Abbreviation Definition
IFRS International Financial Reporting Standards
IMA Internal Model Approach
IRB Internal Ratings Based (approach)
IRRBB Interest Rate Risk in the Banking Book
ISDA International Swap and Derivatives Association
IT Information Technology
MREL Minimum Requirement for Eligible Liabilities
NCA National Competent Authorities
NPE Non-Performing Exposure
NPL Non-Performing Loan
NRA National Resolution Authorities
NSFR Net Stable Funding Ratio
OCR Overall Capital Requirement
O-SII Other Systemically Important Institution
OTC Over the Counter
P2R Pillar 2 Requirement
PD Probability of default
POCI Purchased or Originated Credit Impaired
RAF Risk Appetite Framework
RAS Risk Appetite Statement
RCSA Risk Control Self – Assessment
RRE Residential Real Estate
RemCo Remuneration Committee
RWA Risk Weighted Assets
SA Standardized Approach
SFTs Securities Financing Transactions
SME Small & Medium Enterprises
SPPI Solely Payments of Principle and Interest
SRB Single Resolution Board
SREP Supervisory Review and Evaluation Process
SRM Single Resolution Mechanism
SSM Single Supervisory Mechanism
STA Standardized Approach
SVaR Stressed Value at Risk
TAC Troubled Assets Committee
TC Total Capital
TSCR Total SREP Capital Requirements
UTP Unlikely to Pay
VaR Value at Risk

Pillar III Disclosures for June 30, 2021 7
1 Introduction
1.1 General Information
Alpha Bank is one of the leading banks of the Greek privately owned banking sector and constitutes a
consistent point of reference for over 140 years. The Bank offers a wide range of high-quality financial
products and services, including retail banking, SMEs and corporate banking, asset management and
private banking, distribution of insurance products, investment banking, brokerage and real estate
management.
Alpha Bank, which was founded in 1879 by John F. Kostopoulos, has its headquarters at 40 Stadiou Street,
Athens, and is registered in the Register of Companies with number 6066/06/B/86/05. The Bank is subject
to the Greek banking law and is supervised by the European Central Bank (ECB) and the Single
Supervisory Mechanism (SSM).
On 12.3.2021, the Bank’s Board of Directors decided the convening of the Extraordinary General Meeting
of the Shareholders on 2.4.2021, with agenda items, among others the approval of the demerger of the
société anonyme under the corporate name “Alpha Bank S.A.” by way of hive down of its banking business
sector with the incorporation of a new entity.
On 16 April 2021, the demerger of the former Alpha Bank S.A., then authorized to operate as a credit
institution (under G.E.MI. number 223701000 and Tax Identification Number 094014249), which has been
already renamed to “Alpha Services and Holdings S.A.”, (“Group”) was announced pursuant to the Decision
of the Ministry of Development and Investments under protocol no 45089/16.4.2021 by way of hive-down
of the banking business sector with the incorporation of a new company, which was licensed to operate as
a credit institution under the name “Alpha Bank S.A.” (under G.E.MI. number 159029160000 and Tax
Identification Number 996807331) (the “Bank”), in accordance to the provisions of Article 16 of Greek law
2515/1997, as well as Articles 54 paragraph 3, 57 paragraph 3, 59-74 and 140 paragraph 3 of Greek law
4601/2019 and Article 145 of Greek law 4261/2014, as in force (the “Hive Down”). As a consequence of
the Hive Down, the Bank substituted Alpha Holdings by operation of Greek law, as universal successor, in
all of its assets and liabilities, rights and obligations and in general its legal relationships within the banking
business sector.
Following the demerger, “Alpha Services and Holdings S.A.”, is supervised on a consolidated basis and
“Alpha Bank S.A” is supervised on a standalone basis by the European Central Bank (ECB) and the Bank
of Greece (BoG).
The Group is active in the Greek and international banking market, with presence in the United Kingdom,
Cyprus, Romania, Albania and Luxemburg

Pillar III Disclosures for June 30, 2021 8
2 Pillar III Disclosures Overview
2.1 Background
Group’s Pillar III Report is prepared in accordance with disclosure requirements as laid down in Part Eight
of the “Regulation (EU) No 575/2013 on prudential requirements for credit institutions and investment firms”
(Capital Requirements Regulation, or CRR) and the “Directive 2013/36/EU on access to the activity of credit
institutions and the prudential supervision of credit institutions and investment firms” (Capital Requirements
Directive IV, or CRD IV).
2.1.1 Disclosure enhancements
In January 2015, the Basel Committee on Banking Supervision (BCBS) published the Revised Pillar III
Disclosure Requirements, followed by the publication, in December 2016, of the EBA Final Guidelines on
disclosure requirements. These Guidelines provide banks with guidance in attaining compliance with the
CRR and with the Basel Committee, and are effective from 31 December 2017.
In December 2018 EBA published guidelines that specify the common content and uniform disclosure
formats for the information on NPEs, forborne exposures and foreclosed assets that credit institutions
should disclose. Proportionality is embedded in the guidelines based on two criteria – the significance of
the credit institution and the level of NPEs – and there is a set of templates that needs to be disclosed only
by significant credit institutions with a gross NPL ratio of 5% or above.
Starting from 30 June 2021, institutions should align their disclosures with the changes introduced by the
revised Regulation (EU) No 2019/876 (CRR2), amending Regulation (EU) No 575/2013 (CRR). The new
regulation, combined with the implementation of the EBA’s new policy strategy on institutions’ Pillar III
disclosures, seek to increase efficiency, consistency and comparability between insitutions’ disclosures and
promote market discipline, in alignment with Basel Standards.
The new framework introduces the following updates:
New quantitative and qualitative information regarding:
Disclosure of liquidity requirements
Disclosure of exposures to securitisation positions
Amendments in the disclosure of existing information (quantitative or/and the qualitative), such as:
Disclosure of the leverage ratio
Disclosure of exposures to counterparty credit risk (revised in order to align them with CRR2 and
with the revised Basel standards)
Following the outbreak of the COVID-19 pandemic and the response of governments across the globe and
in the EU states by implementing measures to support borrowers, additional reporting and disclosures
requirements were introduced on 2 June 2020 for the purposes of market discipline and transparency. The
specific requirements take into account the Guidelines on legislative and non-legislative moratoria on loan
repayments applied in the light of the COVID-19 crisis (date of publication 2 April 2020).
EBA published on 1 March 2021, a consultation paper on draft implementing technical standards (ITS) on
Pillar 3 disclosures on Environmental, Social and Governance (ESG) risks. The draft ITS put forward
comparable disclosures that show how climate change may exacerbate other risks within institutions’
balance sheets, how institutions are mitigating those risks, and their green asset ratio on exposures
financing taxonomy-aligned activities, such as those consistent with the Paris agreement goals.

Pillar III Disclosures for June 30, 2021 9
On 28 May 2021, EBA launched a public consultation on draft implementing technical standards (ITS) on
Pillar 3 disclosures regarding exposures to interest rate risk on positions not held in the trading book
(IRRBB). The draft ITS put forward comparable disclosures that would allow stakeholders to assess
institutions’ IRRBB risk management framework as well as the sensitivity of institutions’ economic value of
equity and net interest income to changes in interest rates. The proposed standards will amend the
comprehensive ITS on institutions’ public disclosures, in line with the strategic objective of developing a
single and comprehensive Pillar 3 package that should facilitate implementation by institutions and further
promote market discipline.
2.1.2 Approval and publication
In accordance with the Group’s internal governance framework, a “Pillar III Disclosures Policy” has been
developed and implemented that ensures consistent and continuous compliance with the disclosure
requirements of the regulatory framework and best practices.
The adopted policy sets the minimum content of public disclosures presented.
The Bank with the aim to apply, at all times, best practices and cover any new regulatory requirements,
revises its disclosure policy on an annual basis or when deemed necessary and updates the extent and
type of information provided at each disclosure date accordingly.
The Bank publishes the Pillar III report via its website, within the applicable deadlines. The data included in
this report may be different than the respective accounting data, mainly due to differences between the
regulatory consolidation and the accounting consolidation and/or differences in the definitions used.
However, the Group’s financial statements, used together with Pillar III disclosures, complement market
participants’ information and enhance transparency.
The disclosures included within this report were verified and approved internally in line with the Disclosures
policy which is approved by the Board. Business units attest to the accuracy and of their data submissions.
Consistency checks and reconciliations are performed with accounting and regulatory data. The information
in this report is subject to the same level of internal control processes as the information provided by the
Group for its financial reporting.
2.2 Supervision and Regulatory Framework
Single Supervisory Mechanism (SSM)
Since November 2014, Alpha Bank has been assessed as “Other Systemically Important Institution” (O-
SII) and, as such, is directly supervised by the ECB in accordance with the SSM framework.
The Single Supervisory Mechanism (SSM) refers to the system of banking supervision in Europe and it
comprises the ECB and the national supervisory authorities of the participating countries.
The applicable banking regulatory framework in the European Union (EU), the Basel 3 capital framework,
is effective from January 1, 2014.It was implemented by the “Regulation (EU) No 575/2013 on prudential
requirements for credit institutions and investment firms” (Capital Requirements Regulation, or CRR)
published on June 27, 2013, in combination with the “Directive 2013/36/EU on access to the activity of
credit institutions and the prudential supervision of credit institutions and investment firms” (Capital
Requirements Directive IV, or CRD IV) published on June 27, 2013 that has been transposed into the Greek
legislative framework by the Law 4261/2014. The framework has been amended by the Regulation (EU)
2019/876 (CRR II) of 20 May 2019 and the Directive (EU) 2019/878 (CRD V) of 20 May 2019. The latter
has been transposed into the Greek legislative framework by the Law 4799/2021
Pillar III Disclosures for June 30, 2021 10
For the calculation of capital adequacy ratio the above framework is followed.
Regarding the capital ratios the following minimums apply:
• Besides the 8% capital adequacy limit, there are applicable limits of 4.5% for CET 1 ratio and 6% for
Tier 1 ratio, respectively
• The maintenance of capital buffers additional to the CET1 capital are required. In particular the
Combined Buffer Requirement (CBR) consisting of:
o The Capital conservation buffer stands at 2.5%.
o The capital buffers set by the Bank of Greece through Executive Committee Acts:
- Other systemically important institutions (O-SII) buffer, which will gradually rise to “one
percent” (1%) from 1.1.2019 to 1.1.2023. For 2021, the O-SII buffer stands at 0.5%.
- Countercyclical capital buffer equal to “zero percent” (0%) for 2021
Supervisory Review and Evaluation Process (SREP)
According to Council Regulation 1024/2013, ECB conducts annually a Supervisory Review and Evaluation
Process (SREP) to assess the risk profiles of the institutions under its remit.
This process evaluates the:
Sustainability and viability of business model
Adequacy of governance and risk management
Assessment of risk to capital and
Assessment of risks to liquidity and funding
Following the assessment the ECB determines the minimum capital requirements and sets qualitative
requirements to each of the banking institutions.
On 28 December 2020, the ECB informed Alpha Bank that since 31st January 2021 the minimum limit for
the Overall Capital Requirement (OCR) remains unchanged from 2020 at 14%.The OCR is composed by
the minimum own funds requirements (8%), according to article 92(1) of the CRR, the additional Pillar II
own funds requirements (P2R), according to article 16(2) (a) of the Regulation 1024/2013/EU which
corresponds to 3%, and the combined buffer requirements (CBR), according to article 128(6) of the
Directive 2013/36/EU which correspond to 3%. The above minimum ratio should be maintained on a phase-
in basis under applicable transitional rules of the CRR/CRD IV, at all times.
Measures taken for the banks in order to tackle Covid-19 pandemic
As the economic effects of the coronavirus (COVID-19) started becoming apparent, the ECB, the European
Banking Authority (EBA) and the European Commission (EC), announced a number of measures to ensure
that the banks they supervise will continue to fulfil their role in funding the real economy. Specifically,
starting from March 2020, the ECB and the EBA announced the following relaxation measures for the
minimum capital requirements for Banks in the Eurozone:
• Banks are temporarily allowed to operate below the level of capital defined by the Capital
Conservation Buffer and the Countercyclical Buffer. In addition, on July 2020, the ECB announced
through a press release that financial institutions are allowed to operate below the aforementioned
thresholds at least up to the end of 2022.
Furthermore, the change expected in 2021 under CRD V regarding the composition of the Pillar 2
requirement (P2R) buffer was brought forward allowing the (P2R) to be covered by Additional Tier
1 (AT1) capital by 18.75% and Tier 2 (T2) capital by 25% and not only by CET 1.

Pillar III Disclosures for June 30, 2021 11
• In parallel ECB issued a recommendation to banks to limit the payment of dividends and share buy-
backs. According to a press release issued by the ECB on 23 July 2021 this recommendation
remains applicable until 30 September 2021. In addition, on 23 July 2021, the ECB announced that
it expects that banks will adopt a prudent and forward-looking approach when deciding on
remuneration policies.
The European Commission decided to revise the existing regulatory framework by bringing forward
regulations that would normally come with the CRR2/CRDV framework as well as provide a greater
flexibility to the phase-in of the impact of the IFRS 9 on capital. The revised framework was published in
the Official Journal of the European Union as at June 22, 2020.
In 26 June 2020, the Bank of Greece under an Executive Committee Act determined the capital buffer of
systemically important institutions (O-SII) at 0.50%, maintaining stable for 2021 and extending
consequently the existing phasing-in period. The third and the fourth phases have been delayed by 12
months each and will apply starting from 1 January 2022 and 1 January 2023 respectively. This decision is
in the context of the response to Covid19 pandemic in order to mitigate the subsequent financial impact.
In 22 December 2020, the Commission Delegated Regulation (EU) 2020/2176 of 12 November 2020,
amending Delegated Regulation (EU) 241/2014 concerning the deduction of software assets from CET1
items, was published in the Official Journal of the European Union.
2.3 Significant Developments
2.3.1 Capital Issuances
As part of the strategic capital management during 2021, Alpha Services and Holdings S.A. has
successfully completed:
• On March 4th 2021, Alpha Bank S.A. placed a Euro 500 million Tier 2 bond. The subordinated bond has
a 10.25-year maturity and is callable anytime between year 5 and year 5.25 with a coupon of 5.5%. The
bond is listed on the Luxembourg Stock Exchange – EuroMTF Market.
• On July 2nd 2021, the offer of € 800 million of new common shares further strengthening its capital ratios.
2.3.2 Stress Test
Following the postponement of the 2020 Stress Test due to the outbreak of COVID – 19 (Coronavirus)
and its global spread, the European Banking Authority (EBA) launched the 2021 EU-wide Stress Test on
29 January 2021. The Stress Test was conducted based on a static balance sheet approach under a
baseline and an adverse macro scenario with a 3-year forecasting horizon (2020-2023). The exercise will
be used as an input in the Supervisory Evaluation Process (SREP). The results of the exercise were
published on 30 July 2021. According to the results the Group concluded successfully the 2021 EU-wide
Stress Test under both scenarios. More specifically:
Under the baseline scenario, the capital generation for the 3-year period was 2.8% fully absorbing
2.4% IFRS 9 phase-in, resulting in 2023 to a CET1 fully loaded ratio of 17.3% while the 2023
Leverage ratio (fully loaded) came to 13.0%.
Under the adverse scenario, the 2023 CET1 transitional ratio stood at 8.3%, largely driven by the
negative impact of Credit Risk, with the lowest point of CET1 fully loaded at 8.1%, in 2022. The
2023 Leverage ratio (fully loaded) resulted in 6.1%.

Pillar III Disclosures for June 30, 2021 12
The Stress Test methodology does not take into account capital strengthening (i.e. Tier II issuance,
Share Capital Increase) and balance sheet de-risking (i.e. Galaxy transaction), events post
December 31st, 2020. Pro-forma with the Share Capital Increase for the baseline scenario, the 2023
CET1 fully loaded ratio reached 19.1%, while the 2023 Leverage ratio (fully loaded) came to 14.4%.
Under the adverse scenario, the 2023 CET1 fully loaded ratio stood at 10.2%, while the 2023
Leverage ratio (fully loaded) came to 7.6%.
2.3.3 Minimum Requirement of Own Funds and Eligible Liabilities
On 15 April 2021, Alpha Bank received a communication from the Single Resolution Board (SRB)
regarding the binding Minimum Requirement of Own Funds and Eligible Liabilities (MREL). The
requirements are based on the Bank Recovery and Resolution Directive (“BRRD2”), which was transposed
under Greek law 4799/2021 on 18.5.2021.
The SRB decision is based on a single point of entry resolution strategy.
According to the SRB decision, Alpha Bank needs to meet from 1 January 2026 on a consolidated basis
the following MREL requirements, namely 22.76% of Total Risk Exposure Amount (TREA) and 5.91% of
Leverage Exposure (LRE). The communication also sets out the interim MREL requirements that must be
met from 1 January 2022, namely 14.02% of TREA and 5.91% of LRE.
The MREL ratio expressed as a percentage of RWAs does not include the Combined Buffer Requirement
(CBR), currently at 3% and expected to increase to 3.25% on 1 January 2022. With regard to the
requirement for a minimum amount of own funds and subordinated eligible liabilities (“the Subordinated
MREL Requirement”), the SRB has decided that no subordination requirement applies to Alpha Bank.
The MREL requirements, including the multi-year transitional period, are in line with Alpha Bank’s
expectations. Alpha Bank’s long-term funding plan foresees further MREL strengthening so that these
requirements can be met when applicable.
On September 16th, Alpha Bank successfully completed its inaugural Senior Preferred offering to continue
to build its MREL basket. In this respect, Alpha Bank launched its inaugural EUR 500m Senior Preferred
bond. The issuance has a 6.5-year maturity and is callable in year 5.5 with a coupon of 2.5% and a yield
of 2.625%. The bond is listed on the Luxembourg Stock Exchange – EuroMTF Market .This transaction,
fully aligned with Alpha Bank’s MREL strategy communicated earlier in the year, significantly enhances
the Bank’s presence in the international capital markets, diversifies its investor base and improves its
funding profile.
2.3.4 NPE Plan & NPE initiatives
NPE Plan (Update)
On April 2021, the Bank submitted an updated NPE Business Plan for the period 2021 - 2023 incorporating
Covid-19 impact in its projections according to the latest requirement from SSM.
The NPE plan is based on a Covid-19 pandemic scenario under which the economic activity is expected to
pick up as we progress in 2021.
The Group’s total NPE portfolio as of Q4 2020 amounted to c. Euro 20.9 billion with a corresponding NPE
ratio of 43%. The target group NPE ratio for end of 2023 was set at 6% translated to a Euro 18.4 billion
reduction when compared to Q4 2020.

Pillar III Disclosures for June 30, 2021 13
NPE initiatives
One of the key pillars of the Bank’s Strategy is the de-risking of its balance sheet, putting capital to work
with a view to improve its asset quality and normalize the cost of risk.
Alpha Bank planned a frontloading of its efforts through a large securitization transaction of c. Euro 10.8
billion GBV, of both retail and wholesale NPEs, known as project Galaxy, making use of the Hellenic Asset
Protection Scheme for the retained senior tranche of Euro 3.8 billion. Despite the difficulties faced due to
the persistence of the COVID-19 pandemic, the transaction was concluded in Q2 2021.
Along with the securitization transaction, Alpha Bank also concluded the sale of its servicing platform,
supporting Project Galaxy and enhancing business model efficiency. The servicer, new CEPAL, is expected
to manage a total of Euro 28 billion of NPEs from Alpha Bank and third parties, including an exclusivity
agreement with Alpha Bank to manage its remaining NPEs.
Finally, the Hive Down, which is a key enabler to this whole endeavor, which entailed a corporate
reorganization structure allowing for a much better risk profile in terms of asset quality, was completed in
April 2021.
Following the delivery of Project Galaxy, the largest NPE securitization in Greece and second largest in
Europe, Alpha Bank, within its Q1 2021 results announcement, guided for an acceleration of the NPE
reduction targets by committing to delivering a further clean-up of Euro 8.1 billion of NPE volumes in 2021-
2022, contained within four distinct projects and smaller initiatives which have already been initiated:
‒ Project Cosmos (for which application will be submitted under the HAPS scheme
extension) - mainly secured portfolio of Euro 3.5 billion GBV majority consisting of
mortgage and SBL NPEs
‒ Project Solar – an SME portfolio of Euro 0.4 billion GBV that has been assigned by all
systemic banks for management to DoValue
‒ Project Orbit – sale of a domestic retail unsecured portfolio of Euro 1.3 billion GBV
‒ Project Sky – sale of a mixed portfolio of residential mortgages and corporate/SME
exposures in Cyprus, of a total GBV of Euro 2.2 billion
‒ Other transactions - selected wholesale and leasing exposures of up to Euro 0.7 billion
GBV, for which the Bank is currently working with Cepal to identify the optimal transaction
structure
After the completion of project Galaxy, the Group NPE and NPL ratio stands at 26% and 16%, respectively,
and it is expected to be reduced to c.7% and c.5% respectively by the end of 2022, as a result of the above
series of NPE transactions, as well as considering the expected organic evolution of the remaining book.
This would entail reduction of total stock of NPEs by approximately 75% until the end of 2022 allowing to
reduce NPE stock to c. Euro 2.9 billion
2.3.5 Updated Strategic Plan
During its Q1 2021 results, Alpha Bank shared the latest strategy update based on four main pillars:
‒ Decisively conclude NPE initiatives (as described above), reducing NPE ratio to average
European levels; following project Galaxy delivery, NPE reduction targets will be
accelerated by delivering a further clean-up of EUR 8.1 billion of NPE volumes contained
within four distinct projects and other smaller initiatives that have already been initiated

Pillar III Disclosures for June 30, 2021 14
‒ Continue progress in delivery on ambitious targets of the cost reduction and
transformational plans; cost reduction will be achieved through a) reduction of NPEs that
will drive down the respective costs along with b) the transformation effort put together in
our operations transformation plan which aims at modernizing the Bank, increasing speed
and quality of processes while also optimizing third party spend throughout spend
categories
‒ Leverage partnerships in driving the growth of fee and commission income; the increase
will be mainly driven a) by the higher business activity and improvement in lending volumes
(in light of higher RRF driven lending), b) the increase in bancassurance fees on the back
of the exclusive partnership signed with Generali, c) the significant growth in Asset
Management related fees and d) the international fee income that is mostly related to
Romania fee growth
‒ Strategic deployment of excess capital in Romania to accelerate lending growth and
increase profitability
The updated Strategic Plan suggested a capital raise of Euro 800 million to be in position to fully reap the
benefits from the RRF growth potential. Securing this growth capital, would allow Alpha Bank to reach the
profitability target sooner and provide the Bank with the flexibility needed to commit in financing high-value
projects.
Alpha Bank successfully concluded the share capital increase in July 2021, positioning the Group to be one
of the key banking pillars that will unlock RRF funds for its customers.

Pillar III Disclosures for June 30, 2021 15
3 Capital Management
The overall Group’s Risk and Capital Strategy sets specific risk limits, based on management’s risk
appetite, as well as thresholds to monitor whether actual risk exposure deviates from the limits set.
The Capital Strategy of the Group commits to maintain sound capital adequacy both from economic and
regulatory perspective. It aims at monitoring and adjusting the Group’s capital levels, taking into
consideration capital markets’ demand and supply, in an effort to achieve the optimal balance between the
economic and regulatory considerations. The objectives of the Group’s capital management policy are to
ensure that the Group has sufficient capital to cover the risks of its business, to support its strategy and to
comply with regulatory capital requirements, at all times.
The Group remains committed to the implementation of its strategy, re-calibrating its approach in order to
reflect changes in the market environment. The Bank has consistently delivered on its targets to clean-up
its balance sheet and is on track with the execution of its NPE plan. It also has successfully addressed the
challenges and risks that the outbreak of COVID-19 posed to banks. Following the announcement of the
project “Tomorrow” and the recent successful share capital increase the Bank is well positioned to look
ahead, towards a period of strong growth for the economy and the banking system, and deliver on the
targets of its Strategic Plan.
Main elements impacting Asset Quality, Capital and Liquidity
‒ The Group completed a Euro 0.8 billion Share Capital Increase in July 2021. Post
completion of Galaxy and equity raise, Group’s capital position remains solid with Total
Capital Ratio at 17.4% and Fully loaded CET1 at 15.4%.
‒ The Group NPE cash coverage increased to 54% and in Greece to 49%. The NPL
coverage ratio stands at 84%, while total coverage including collateral came to 126%.
‒ The Group’s Loan to Deposit Ratio materially improved to 83% at the end of June 2021
versus 96% the year prior and the Group’s Liquidity Coverage Ratio (LCR) stands at
169%, far exceeding the regulatory minimum of 100%.
‒ ECB funding stood at Euro 12.9 billion or 18% over Total Assets, with a significant positive
contribution on Net Interest Income from the benefit of 1.00% TLTRO cost.
3.1 Capital Ratios
The Capital Adequacy Ratio is calculated as the result of the Group’s regulatory capital (own funds) to its
RWAs. Regulatory capital includes Common Equity Tier 1 (CET1) capital (share capital, reserves, and
minority interests), additional Tier 1 capital (AT1) (hybrid securities) and Tier 2 capital (subordinated debt).
RWAs include the credit risk of the banking book, the market risk of the trading book, the operational risk,
the counterparty credit risk/CCR and credit valuation adjustment/CVA.
As shown in the following table, on 30.6.2021, Alpha Bank’s CET1 stood at Euro4.9 billion and the total
Regulatory Capital at 5.9 billion, while the total RWAs amounted to Euro 38.1billion resulting in a CET1
ratio of 12.8%, and total Capital Adequacy Ratio of 15.5% decreased by 283 bps versus 31.03.2021, mainly
due to the completion of the Galaxy transaction.
The Deferred Tax Assets (DTAs) stood at Euro 5.3 billion with the eligible amount to be converted to tax
credit claims at Euro 2.97 billion.

Pillar III Disclosures for June 30, 2021 16
Template 1: Capital Adequacy Ratios (%)
(Amounts in millions of Euro)
a b
30.6.2021 31.3.2021
Capital Type
CET1 4.877 7.086
Tier 1 Capital 4.878 7.087
Tier 2 Capital 1.013 1.013
Total Regulatory Capital for C.A.R. calculation 5.892 8.100
Risk Weighted Assets 38.109 44.296
Capital Ratios
CET1 Ratio 12.8% 16.0%
Tier 1 Ratio 12.8% 16.0%
Capital Adequacy Ratio (Tier 1 + Tier 2) 15.5% 18.3%
3.1.1 Key metrics
In the following table EU KM1 key regulatory metrics and ratios are provided as well as related input
components as defined by the amended versions of CRR and CRD. They comprise own funds, RWAs,
capital ratios, additional requirements based on SREP, capital buffer requirements, leverage ratio, liquidity
coverage ratio and net stable funding ratio.

Pillar III Disclosures for June 30, 2021 17
Template 2: EU KM1 - Key metrics template
(Amounts in millions of Euro)
a b c d e
30.6.2021 31.3.2021 31.12.2020 30.9.2020 30.6.2020
Available own funds (amounts)
1 Common Equity Tier 1 (CET1) capital 4,877 7,086 7,827 7,909 7,941
2 Tier 1 capital 4,878 7,087 7,830 7,912 7,944
3 Total capital 5,892 8,100 8,342 8,424 8,456
Risk-weighted exposure amounts
4 Total risk-weighted exposure amount 38,109 44,296 45,369 46,054 46,289
Capital ratios (as a percentage of risk-weighted exposure amount)
5 Common Equity Tier 1 ratio (%) 12.8% 16.0% 17.3% 17.2% 17.2%
6 Tier 1 ratio (%) 12.8% 16.0% 17.3% 17.2% 17.2%
7 Total capital ratio (%) 15.5% 18.3% 18.4% 18.3% 18.3%
Additional own funds requirements to address risks other than the risk of excessive leverage (as a percentage of risk-weighted exposure amount)
EU 7a Additional own funds requirements to address risks other than the risk of excessive leverage (%)
3.00% 3.00% 3.00% 3.00% 3.00%
EU 7b of which: to be made up of CET1 capital (percentage points)
1.69% 1.69% 1.69% 1.69% 1.69%
EU 7c of which: to be made up of Tier 1 capital (percentage points)
2.25% 2.25% 2.25% 2.25% 2.25%
EU 7d Total SREP own funds requirements (%) 11.00% 11.00% 11.00% 11.00% 11.00%
Combined buffer requirement (as a percentage of risk-weighted exposure amount)
8 Capital conservation buffer (%) 2.50% 2.50% 2.50% 2.50% 2.50%
EU 8a Conservation buffer due to macro-prudential or systemic risk identified at the level of a Member State (%)
0.00% 0.00% 0.00% 0.00% 0.00%
9 Institution specific countercyclical capital buffer (%) 0.00% 0.00% 0.00% 0.00% 0.00%
EU 9a Systemic risk buffer (%) 0.00% 0.00% 0.00% 0.00% 0.00%
10 Global Systemically Important Institution buffer (%) 0.00% 0.00% 0.00% 0.00% 0.00%
EU 10a Other Systemically Important Institution buffer 0.50% 0.50% 0.50% 0.50% 0.50%
11 Combined buffer requirement (%) 3.00% 3.00% 3.00% 3.00% 3.00%
EU 11a Overall capital requirements (%) 14.00% 14.00% 14.00% 14.00% 14.00%
12 CET1 available after meeting the total SREP own funds requirements (%)
4.55%
Leverage ratio
13 Leverage ratio total exposure measure 60,729 62,194 61,765 62,678 67,430
14 Leverage ratio 8.0% 11.4% 12.7% 12.6% 11.8%
Additional own funds requirements to address risks of excessive leverage (as a percentage of leverage ratio total exposure amount)
EU 14a Additional own funds requirements to address the risk of excessive leverage (%)
0.00%
EU 14b of which: to be made up of CET1 capital (percentage points)
0.00%
EU 14c Total SREP leverage ratio requirements (%) 3.44%
EU 14d Leverage ratio buffer requirement (%) 0.00%
EU 14e Overall leverage ratio requirements (%) 3.44%
Liquidity Coverage Ratio

Pillar III Disclosures for June 30, 2021 18
a b c d e
30.6.2021 31.3.2021 31.12.2020 30.9.2020 30.6.2020
15 Total high-quality liquid assets (HQLA) (Weighted value -average)
7,309 7,484 6,602 6,097
EU 16a Cash outflows - Total weighted value 6,329 6,376 6,295 6,166
EU 16b Cash inflows - Total weighted value 1,105 1,124 1,199 1,216
16 Total net cash outflows (adjusted value) 5,224 4,789 5,097 4,950
17 Liquidity coverage ratio (%) (adjusted values) (1) 140.0% 128.0% 129.0% 123.0%
17a Liquidity coverage ratio (%) 169.2% 147.3%
Net Stable Funding Ratio
18 Total available stable funding 58,977
19 Total required stable funding 52,936
20 NSFR ratio (%) 111.4%
(1)Average figures based on previous monthly data points
3.2 IFRS 9 Capital Impact
On December 12, 2017 the EU adopted Regulation No 2395/2017 of the European Parliament and of the
Council amending EU Regulation 575/2013, as regards transitional arrangements to mitigate the impact of
the introduction of IFRS 9 on regulatory capital and leverage ratios. The new Regulation inserts a new
article 473a in CRR 575/2013 which introduces a 5-year transitional period during which allows banks to
add to the CET1 ratio the post-tax amount of the difference in provisions that resulted from the transition to
the IFRS 9 in relation to the provisions that have been recognized at 31.12.2017 in accordance with IAS 39
("Static” amount). The weighting factors were set per year at 0.95 in 2018, 0.85 in 2019, 0.7 in 2020, 0.5 in
2021 and 0.25 in 2022.
On June 24, 2020 as a response to the COVID-19 pandemic the EU adopted Regulation No 2020/873 of
the European Parliament and of the Council amending Regulations (EU) No 575/2013 and (EU) 2019/876.
The Regulation introduced a new 5-year transitional period for the impairment losses that occurred due to
the COVID-19 pandemic. According to the revised 473a article, institutions are allowed to fully add back to
their CET 1 capital any increase in the expected credit loss provisions that they recognize in 2020 and 2021
for their financial assets that are not credit-impaired and new transitional factors introduced for the
remaining period. The weighting factors were set at 1.00 for the first two years (2020 and 2021), 0.75 in
2022, 0.5 in 2023 and 0.25 in 2024.
Alpha Bank has decided to make use of Article 473a of the above Regulation and applies the transitional
provisions for the calculation of Capital Adequacy on both a standalone and consolidated basis.
The following table shows a comparison of own funds and capital and leverage ratios with and without the
application of the transitional arrangements for IFRS 9.

Pillar III Disclosures for June 30, 2021 19
Template 3: EU IFRS9-FL - Comparison of own funds and capital and leverage ratios with and
without the application of transitional arrangements for IFRS
(Amounts in millions of Euro)
a b c d e
30.6.2021 31.3.2021 31.12.2020 30.9.2020 30.6.2020
Available capital (amounts)
Common Equity Tier 1 (CET1) capital 4,877 7,086 7,827 7,909 7,941
CET1 capital as if IFRS 9 or analogous ECLs transitional arrangements had not been applied
3,962 6,171 6,554 6,564 6,592
Tier 1 capital 4,878 7,087 7,830 7,912 7,944
Tier 1 capital as if IFRS 9 or analogous ECLs transitional arrangements had not been applied
3,962 6,171 6,554 6,564 6,592
Total capital 5,892 8,100 8,342 8,424 8,456
Total capital as if IFRS 9 or analogous ECLs transitional arrangements had not been applied
4,977 7,185 7,069 7,078 7,107
Risk-weighted assets (amounts)
Total Risk-weighted assets 38,109 44,296 45,369 46,054 46,289
Total Risk-weighted assets as if IFRS 9 or analogous ECLs transitional arrangements had not been applied
37,312 43,499 44,254 44,866 45,098
Capital ratios
Common Equity Tier 1 ratio (%) 12.8% 16.0% 17.3% 17.2% 17.2%
CET1 ratio (%) as if IFRS 9 or analogous ECLs transitional arrangements had not been applied
10.6% 14.2% 14.8% 14.6% 14.6%
Tier 1 ratio (%) 12.8% 16.0% 17.3% 17.2% 17.2%
Tier 1 ratio (%) as if IFRS 9 or analogous ECLs transitional arrangements had not been applied
10.6% 14.2% 14.8% 14.6% 14.6%
Total ratio (%) 15.5% 18.3% 18.4% 18.3% 18.3%
Total ratio (%) as if IFRS 9 or analogous ECLs transitional arrangements had not been applied
13.3% 16.5% 16.0% 15.8% 15.8%
Leverage ratio
Leverage ratio total exposure measure 60,729 62,194 61,765 62,678 67,430
Leverage ratio 8.0% 11.4% 12.7% 12.6% 11.8%
Leverage ratio as if IFRS 9 or analogous ECLs transitional arrangements had not been applied
6.6% 10.1% 10.8% 10.7% 9.9%
3.3 Reconciliation of regulatory own funds to the balance sheet according to
IFRS
The table below highlights the difference in the basis of consolidation for accounting and prudential
purposes as it compares the carrying values as reported under IFRS with the carrying values under the
scope of the regulatory consolidation. References in the last column of the table provide the mapping of
regulatory balance sheet items used to calculate regulatory capital. The reference-columns presented
below provides the mapping to the references-columns as presented in the template “EU CC1–
Composition of regulatory own funds”.

Pillar III Disclosures for June 30, 2021 20
Template 4: EU CC2 - reconciliation of regulatory own funds to balance sheet in the audited financial
statements as of 30.6.2021
(Amounts in millions of Euro)
a b c
Balance sheet as in published financial
statements
Under regulatory scope of consolidation
Reference
30.6.2021
Assets - Breakdown by asset classes according to the balance sheet in the published financial statements
1 Cash and balances with central banks 9,393 9,393
2 Due from banks 3,266 3,266
3 Trading securities 18 18
4 Derivative financial assets 1,044 1,045
5 Loans and advances to customers 37,500 37,499
6 Investment securities
- Measured at fair value through other comprehensive income
6,677 6,091
- Measured at amortised cost 3,502 3,502
- Measured at fair value through profit or loss 178 96
7 Investments in associates and joint ventures 61 164
8 Investment property 552 552
9 Property, plant and equipment 765 763
10 Goodwill and other intangible assets 471 434 (a)
11 Deferred tax assets 5,298 5,298 (b)
12 Other assets 1,644 1,621
13 Assets classified as held for sale 99 99
14 Total assets 70,468 69,841
Liabilities - Breakdown by liability classes according to the balance sheet in the published financial statements
1 Due to banks 14,320 14,320
2 Derivative financial liabilities 1,392 1,392
3 Due to customers 45,032 45,055
4 Debt securities in issue and other borrowed funds 1,684 1,709 (c)
5 Liabilities for current income tax and other taxes 104 102
6 Deferred tax liabilities 31 17
7 Employee defined benefit obligations 88 88
8 Other liabilities 970 973
9 Provisions 815 236
10 Liabilities related to assets classified as held for sale
0 0

Pillar III Disclosures for June 30, 2021 21
a b c
Balance sheet as in published financial
statements
Under regulatory scope of consolidation
Reference
30.6.2021
11 Total liabilities 64,437 63,892
Equity
1 Share Capital 464 464
2 Funds received in advance of share issue 77 77
3 Share premium 10,803 10,803
4 Reserves 438 377
5 Retained earnings -5,794 -5,814
6 Non-controlling interests 29 29
7 Hybrid securities 15 15 (d)
8 Total equity 6,031 5,949

Pillar III Disclosures for June 30, 2021 22
The following table presents the analysis of Own funds structure.
Template 5: Own Funds Structure
(Amounts in millions of Euro)
30.6.2021 31.3.2021
Share capital 464 464
Share premium 10,803 10,803
Retained Earnings and Other Reserves ( 2,809) ( 2,891)
o/w FVOCI reserves 111 106
Period results ( 2,336) ( 287)
Minority interest (transitional) 0 0
Common equity tier 1 capital before regulatory adjustments 6,122 8,089
PVA ( 8) ( 8)
Intangible assets ( 314) ( 380)
Adjustments due to IFRS 9 transitional adjustments 797 797
DTA amortization ( 1,700) ( 1,395)
Irrevocable payment commitment ( 20) ( 16)
Total regulatory adjustments to common equity tier 1 (1,245) ( 1,002)
Common equity tier 1 capital (CET1) (1) 4,877 7,086
Hybrid instruments 15 15
Additional Tier I before regulatory adjustments 15 15
Hybrid instruments transitional ( 13) ( 13)
(-) Goodwill/Intangible investments - -
of which deductible from Additional Tier I ( 13) ( 13)
of which deductible from CET1 - -
Total regulatory adjustments to additional Tier I ( 13) ( 13)
Additional Tier I 1 1
Tier I Capital (CET1 + AT1) 4,878 7,087
Subordinated loan 1,000 1,000
Hybrid instruments (transitional) 13 13
Tier II capital before regulatory adjustments 1,013 1,013
Total regulatory adjustments to Tier II - -
Tier II capital 1,013 1,013
Total Capital (TC = Tier I + Tier II) 5,892 8,100
Total RWA 38,109 44,296
Common equity tier 1 Ratio 12.8% 16.0%
Tier I Ratio 12.8% 16.0%
Capital Adequacy Ratio (Tier I + Tier II) 15.5% 18.3%

Pillar III Disclosures for June 30, 2021 23
3.4 Capital requirements under Pillar I
The Group calculates and reports to the designated authorities its capital requirements (Pillar I RWAs)
according to the provisions of the CRR and implementing the Technical Standards developed by the EBA
on a solo and consolidated basis.
The approaches adopted for the calculation of the capital requirements under Pillar I (advanced or
standardized methodologies) are determined by the general policy of the Group in conjunction with factors
such as the nature and type of risks the Group undertakes, the level and complexity of the Group’s business
and other factors such as the degree of readiness of the information and software systems.
Capital Requirements are calculated using the following approaches:
Credit Risk: The Group follows the Standardized Approach (STA). The advanced method is used
for the valuation of financial collateral.
Operational Risk: The Group follows the Standardized Approach (STA).
Market Risk: A Value at Risk (VaR) model developed at a bank level for the significant exposures
and approved by the Bank of Greece. Additionally, the Bank uses the Standardized approach to
calculate Market Risk for the remaining, non-significant exposures.
The following template summarizes RWA and minimum capital requirements by risk type. Minimum capital
requirement is calculated at 8% of RWA.

Pillar III Disclosures for June 30, 2021 24
Template 6: EU OV1 – Overview of risk weighted exposure amounts
(Amounts in millions of Euro)
Risk weighted exposure amounts (RWEAs)
Total own funds requirements
a b c
30.6.2021 31.3.2021 30.6.2021
1 Credit risk (excluding CCR) 32,899 39,201 2,632
2 Of which the standardised approach 32,899 39,201 2,632
3 Of which the foundation IRB (FIRB) approach -
4 Of which slotting approach -
EU 4a Of which equities under the simple riskweighted approach -
5 Of which the advanced IRB (AIRB) approach - - -
6 Counterparty credit risk - CCR 337 339 27
7 Of which the standardised approach 206 161 17
8 Of which internal model method (IMM) - -
EU 8a Of which exposures to a CCP 1 2 0
EU 8b Of which credit valuation adjustment - CVA 21 51 2
9 Of which other CCR 109 125 9
15 Settlement risk - - -
16 Securitisation exposures in the non-trading book (after the cap) 310 127 25
17 Of which SEC-IRBA approach -
18 Of which SEC-ERBA (including IAA) -
19 Of which SEC-SA approach -
EU 19a Of which 1250%/ deduction -
20 Position, foreign exchange and commodities risks (Market risk) 1,358 1,423 109
21 Of which the standardised approach 22 30 2
22 Of which IMA 1,336 1,394 107
EU 22a Large exposures - - -
23 Operational risk 3,205 3,205 256
EU 23a Of which basic indicator approach - - -
EU 23b Of which standardised approach 3,205 3,205 256
EU 23c Of which advanced measurement approach - - -
24 Amounts below the thresholds for deduction (subject to 250% risk weight) (For information)
1,494 2,101 119
29 Total 38,109 44,296 3,049
As of 30.6.2021 the total risk weighted assets reduced by Euro 6.2billion or 14.0% compared to the previous
quarter, amounting to Euro 38.1billion versus Euro 44.3billion as of 31.3.2021.
The decrease is mainly driven by the derecognition of the Galaxy loan portfolio .Out of the total amount,
credit risk weighted assets (incl. CCR and amounts below the thresholds for deduction) represent
approximately 88.0%.

Pillar III Disclosures for June 30, 2021 25
3.5 Capital Buffers
The countercyclical capital buffer (CCyB) is a CRD IV instrument, designed to help counter pro-cyclicality
in the financial system. Credit institutions are required to set aside additional CET 1 capital during periods
of excessive credit growth. This will help maintain the supply of credit and dampen the downswing of the
financial cycle. The main purpose of the CCyB is to increase the banks' resilience in good times to absorb
potential losses that could arise in a downturn and to support the continued supply of credit to the real
economy. For 2021 Bank of Greece, as National Competent Authority, set the countercyclical buffer at 0%.
CCyB is also set at currently 0% in all other countries in which Alpha Bank has significant exposures. Total
Risk exposure amount in the following tables includes General Credit (excluding CCR) and Securitization
exposures.

26
Template 7a: EU CCyB1 - Geographical distribution of credit exposures relevant for the calculation of the countercyclical buffer as of
30.6.2021
(Amounts in millions of Euro)
a b c d e f g h i j k l m
General credit exposures
Relevant credit exposures – Market risk
Securitisation exposures
Exposure value for non-trading
book
Total exposure
value
Own fund requirements
Risk-weighted exposure amounts
Own fund requirements
weights (%)
Countercyclical buffer rate
(%)
Exposure value under
the standardised
approach
Exposure value under
the IRB approach
Sum of long and short
positions of trading book
exposures for SA
Value of trading book exposures for internal
models
Relevant credit risk
exposures - Credit risk
Relevant credit
exposures – Market risk
Relevant credit exposures –
Securitisation positions in the
non-trading book
Total
010
Breakdown by country:
Bulgaria 88 - - - - 88 6 - - 6 72 0% 0.5%
Luxembourg 334 - - - - 334 3 - - 3 37 0% 0.5%
Norway 2 - - - - 2 0 - - 0 1 0% 1%
Other 38,513 - - - 3,774 42,287 2,075 - 25 2,100 26,249 100%
020 Total 38,937 - - - 3,774 42,711 2,084 - 25 2,109 26,360 100%

27
Template 7b: EU CCyB1 - Geographical distribution of credit exposures relevant for the calculation of the countercyclical buffer as of
31.12.2020
(Amounts in millions of Euro)
a b c d e f g h i j k l m
General credit exposures
Relevant credit exposures – Market risk
Securitisation exposures
Exposure value for non-trading
book
Total exposure
value
Own fund requirements
Risk-weighted exposure amounts
Own fund requirements
weights (%)
Countercyclical buffer rate
(%)
Exposure value under
the standardised
approach
Exposure value under
the IRB approach
Sum of long and short
positions of trading book
exposures for SA
Value of trading book exposures for internal
models
Relevant credit risk
exposures - Credit risk
Relevant credit
exposures – Market risk
Relevant credit exposures –
Securitisation positions in the
non-trading book
Total
010
Breakdown by country:
Bulgaria 55 3 3 0% 0.5%
Luxembourg 40 3 3 0% 0.25%
Norway 1 0 0 0% 1%
Other 44,662 11 2,707 10 2,717 100%
020 Total 44,759 11 2,714 10 2,724 100%

Pillar III Disclosures for June 30, 2021 28
The following table presents an overview of institution - specific countercyclical exposure and buffer
requirements.
Template 8a: EU CCyB2 - Amount of institution-specific countercyclical capital buffer
(Amounts in millions of Euro)
a
30.6.2021
1 Total risk exposure amount 38,109
2 Institution specific countercyclical capital buffer rate 0.00%
3 Institution specific countercyclical capital buffer requirement 0.8
Template 8b: EU CCyB2 - Amount of institution-specific countercyclical capital buffer
(Amounts in millions of Euro)
a
31.12.2020
1 Total risk exposure amount 45,369
2 Institution specific countercyclical capital buffer rate 0.00%
3 Institution specific countercyclical capital buffer requirement 0.4

Pillar III Disclosures for June 30, 2021 29
4 Leverage
The leverage ratio, which is defined as Tier 1 capital divided by total exposure, is a binding requirement
with the application of the CRR II package, as of June 2021. The “risk of excessive leverage” means the
risk that results from an institution's vulnerability due to leverage or contingent leverage that may require
unintended corrective measures to its business plan, including distressed selling of assets which might
result in losses or in valuation adjustments to its remaining assets.
The level of the leverage ratio with reference date 30.6.2021 on consolidated basis was 8.0%, according
to the transitional definition of Tier 1 capital, exceeding by 2,6x the 3% minimum threshold applied by the
competent authorities, implying that the Bank is not taking on excessive leverage risk.
The Bank submits to the regulatory authorities the leverage ratio on a quarterly basis and monitors the level
and the factors that affect the ratio.
The table below provides a reconciliation of the total exposure measure with the total assets disclosed in
published financial statements.
Template 9a: EU LR1 - LRSum: Summary reconciliation of accounting assets and leverage ratio
exposures as of 30.6.2021
(Amounts in millions of Euro)
a
Applicable amount
1 Total assets as per published financial statements 70,468
2 Adjustment for entities which are consolidated for accounting purposes but are outside the scope of prudential consolidation
(627)
3 (Adjustment for securitised exposures that meet the operational requirements for the recognition of risk transference)
-
4 (Adjustment for temporary exemption of exposures to central bank (if applicable)) (9,007)
5 (Adjustment for fiduciary assets recognised on the balance sheet pursuant to the applicable accounting framework but excluded from the total exposure measure in accordance with point (i) of point (i) of Article 429a(1) CRR)
-
6 Adjustment for regular-way purchases and sales of financial assets subject to trade date accounting
-
7 Adjustment for eligible cash pooling transactions -
8 Adjustments for derivative financial instruments 253
9 Adjustment for securities financing transactions (SFTs) 218
10 Adjustment for off-balance sheet items (ie conversion to credit equivalent amounts of off-balance sheet exposures)
1,361
11 (Adjustment for prudent valuation adjustments and specific and general provisions which have reduced Tier 1 capital)
-
EU-11a
(Adjustment for exposures excluded from the total exposure measure in accordance with point (c ) of Article 429a(1) CRR)
-
EU-11b
(Adjustment for exposures excluded from the total exposure measure in accordance with point (j) of Article 429a(1) CRR)
-
12 Other adjustments (1,937)
13 Total exposure measure 60,730

Pillar III Disclosures for June 30, 2021 30
Template 9b: EU LR1 - LRSum: Summary reconciliation of accounting assets and leverage ratio
exposures as of 31.12.2020
(Amounts in millions of Euro)
a
Applicable amount
1 Total assets as per published financial statements 70,057
2 Adjustment for entities which are consolidated for accounting purposes but are outside the scope of prudential consolidation
( 579)
3 (Adjustment for securitised exposures that meet the operational requirements for the recognition of risk transference)
-
4 (Adjustment for temporary exemption of exposures to central bank (if applicable)) ( 7,077)
5 (Adjustment for fiduciary assets recognised on the balance sheet pursuant to the applicable accounting framework but excluded from the total exposure measure in accordance with point (i) of point (i) of Article 429a(1) CRR)
-
6 Adjustment for regular-way purchases and sales of financial assets subject to trade date accounting
-
7 Adjustment for eligible cash pooling transactions -
8 Adjustments for derivative financial instruments ( 161)
9 Adjustment for securities financing transactions (SFTs) 62
10 Adjustment for off-balance sheet items (ie conversion to credit equivalent amounts of off-balance sheet exposures)
1,429
11 (Adjustment for prudent valuation adjustments and specific and general provisions which have reduced Tier 1 capital)
-
EU-11a
(Adjustment for exposures excluded from the total exposure measure in accordance with point (c ) of Article 429a(1) CRR)
-
EU-11b
(Adjustment for exposures excluded from the total exposure measure in accordance with point (j) of Article 429a(1) CRR)
-
12 Other adjustments ( 1,966)
13 Total exposure measure 61,765
The following template presents a breakdown of the components of the leverage exposure, the minimum requirements and buffers.

Pillar III Disclosures for June 30, 2021 31
Template 10: EU LR2 - LRCom: Leverage ratio common disclosure
(Amounts in millions of Euro)
CRR leverage ratio exposures
a b
30.6.2021 31.12.2020
On-balance sheet exposures (excluding derivatives and SFTs)
1 On-balance sheet items (excluding derivatives, SFTs, but including collateral) 56,933 59,405
2 Gross-up for derivatives collateral provided where deducted from the balance sheet assets pursuant to the applicable accounting framework
19 -
3 (Deductions of receivables assets for cash variation margin provided in derivatives transactions)
( 1,125) ( 1,582)
4 (Adjustment for securities received under securities financing transactions that are recognised as an asset)
- -
5 (General credit risk adjustments to on-balance sheet items) -
6 (Asset amounts deducted in determining Tier 1 capital) 784 1,104
7 Total on-balance sheet exposures (excluding derivatives and SFTs) 56,611 58,927
Derivative exposures
8 Replacement cost associated with SA-CCR derivatives transactions (ie net of eligible cash variation margin)
1,153 883
EU-8a Derogation for derivatives: replacement costs contribution under the simplified standardised approach -
9 Add-on amounts for potential future exposure associated with SA-CCR derivatives transactions
163 224
EU-9a Derogation for derivatives: Potential future exposure contribution under the simplified standardised approach -
EU-9b Exposure determined under Original Exposure Method - -
10 (Exempted CCP leg of client-cleared trade exposures) (SA-CCR) -
EU-10a (Exempted CCP leg of client-cleared trade exposures) (simplified standardised approach) -
EU-10b (Exempted CCP leg of client-cleared trade exposures) (Original exposure method) - -
11 Adjusted effective notional amount of written credit derivatives - -
12 (Adjusted effective notional offsets and add-on deductions for written credit derivatives) - -
13 Total derivatives exposures 1,316 1,107
Securities financing transaction (SFT) exposures
14 Gross SFT assets (with no recognition of netting), after adjustment for sales accounting transactions
1,224 240
15 (Netted amounts of cash payables and cash receivables of gross SFT assets) -
16 Counterparty credit risk exposure for SFT assets 218 63
EU-16a Derogation for SFTs: Counterparty credit risk exposure in accordance with Articles 429e(5) and 222 CRR
- -
17 Agent transaction exposures - -
EU-17a (Exempted CCP leg of client-cleared SFT exposure) - -
18 Total securities financing transaction exposures 1,442 303
Other off-balance sheet exposures
19 Off-balance sheet exposures at gross notional amount 7,554 7,964
20 (Adjustments for conversion to credit equivalent amounts) (6,192) (6,535)
21 (General provisions deducted in determining Tier 1 capital and specific provisions associated with off-balance sheet exposures)
- -
22 Off-balance sheet exposures 1,361 1,429
Excluded exposures
EU-22a (Exposures excluded from the leverage ratio total exposure measure in accordance with point (c ) of Article 429a(1) CRR)
-
EU-22b (Exposures exempted in accordance with point (j) of Article 429a (1) CRR (on and off balance sheet))
- -
EU-22c (Excluded exposures of public development banks (or units) - Public sector investments)
- -

Pillar III Disclosures for June 30, 2021 32
CRR leverage ratio exposures
a b
30.6.2021 31.12.2020
EU-22d
(Excluded exposures of public development banks (or units) - Promotional loans): - Promotional loans granted by a public development credit institution - Promotional loans granted by an entity directly set up by the central government, regional governments or local authorities of a Member State - Promotional loans granted by an entity set up by the central government, regional governments or local authorities of a Member State through an intermediate credit institution)
- -
EU-22e
(Excluded passing-through promotional loan exposures by non-public development banks (or units): - Promotional loans granted by a public development credit institution - Promotional loans granted by an entity directly set up by the central government, regional governments or local authorities of a Member State - Promotional loans granted by an entity set up by the central government, regional governments or local authorities of a Member State through an intermediate credit institution)
- -
EU-22f (Excluded guaranteed parts of exposures arising from export credits) - -
EU-22g (Excluded excess collateral deposited at triparty agents) - -
EU-22h (Excluded CSD related services of CSD/institutions in accordance with point (o) of Article 429a(1) CRR)
- -
EU-22i (Excluded CSD related services of designated institutions in accordance with point (p) of Article 429a(1) CRR)
- -
EU-22j (Reduction of the exposure value of pre-financing or intermediate loans) - -
EU-22k (Total exempted exposures) - -
Capital and total exposure measure
23 Tier 1 capital 4,878 7,830
24 Total exposure measure 60,730 61,765
Leverage ratio
25 Leverage ratio 8.03% 12.68%
EU-25 Leverage ratio (excluding the impact of the exemption of public sector investments and promotional loans) (%)
8.03% 12.68%
25a Leverage ratio (excluding the impact of any applicable temporary exemption of central bank reserves)
7.00% 11.37%
26 Regulatory minimum leverage ratio requirement (%) 3.44% 3.34%
EU-26a Additional own funds requirements to address the risk of excessive leverage (%) 0.00% 0.00%
27 Leverage ratio buffer requirement (%) 0.00% 0.00%
EU-27a Overall leverage ratio requirement (%) 3.44% 3.34%
Choice on transitional arrangements and relevant exposures
EU-27 Choice on transitional arrangements for the definition of the capital measure Transitional Transitional

Pillar III Disclosures for June 30, 2021 33
Template 11a: EU LR3 - LRSpl: Split-up of on balance sheet exposures (excluding derivatives, SFTs
and exempted exposures) as of 30.6.2021
(Amounts in millions of Euro)
a
CRR leverage ratio exposures
EU-1 Total on-balance sheet exposures (excluding derivatives, SFTs, and exempted exposures), of which:
55,827
EU-2 Trading book exposures -
EU-3 Banking book exposures, of which: 55,827
EU-4 Covered bonds -
EU-5 Exposures treated as sovereigns 10,943
EU-6 Exposures to regional governments, MDB, international organisations and PSE not treated as sovereigns
655
EU-7 Institutions 2,811
EU-8 Secured by mortgages of immovable properties 13,965
EU-9 Retail exposures 3,750
EU-10 Corporates 10,889
EU-11 Exposures in default 5,688
EU-12 Other exposures (e.g. equity, securitisations, and other non-credit obligation assets) 7,125
Template 11b: EU LR3 - LRSpl: Split-up of on balance sheet exposures (excluding derivatives, SFTs
and exempted exposures) as of 31.12.2020
(Amounts in millions of Euro)
a
CRR leverage ratio
exposures
EU-1 Total on-balance sheet exposures (excluding derivatives, SFTs, and exempted exposures), of which:
57,823
EU-2 Trading book exposures -
EU-3 Banking book exposures, of which: 57,823
EU-4 Covered bonds -
EU-5 Exposures treated as sovereigns 11,934
EU-6 Exposures to regional governments, MDB, international organisations and PSE not treated as sovereigns
1,213
EU-7 Institutions 3,187
EU-8 Secured by mortgages of immovable properties 13,996
EU-9 Retail exposures 3,860
EU-10 Corporates 10,264
EU-11 Exposures in default 11,616
EU-12 Other exposures (e.g. equity, securitisations, and other non-credit obligation assets) 1,752

Pillar III Disclosures for June 30, 2021 34
5 Credit Risk
Credit risk arises from the potential weakness of borrowers or counterparties to repay their debts as they
arise from their loan obligations to the Group. The primary objective of the Group’s strategy for the credit
risk management in order to achieve the maximization of the adjusted return relative to the performance
risk is the continuous, timely and systematic monitoring of the loan portfolio and the maintenance of the
credit risks within the framework of acceptable overall risk limits. The framework of the Group’s credit risk
management is developed based on a series of credit policy procedures, systems and models for
measuring, monitoring and validating credit risk. These models are subject to an ongoing review process.
In order to effectively manage credit risk, the Group has developed specific methodologies and credit risk
measurement systems in accordance with regulatory and Basel III requirements while incorporating
banking industry best practices. These methodologies and systems are continuously evolving to provide
the Business Units with timely and effective support in the decision-making process and to avoid possible
adverse consequences for the Group.
The Group identifies and assesses existing and potential risks inherent in any product or activity as the
basis for effective credit risk management.
The table below presents the net credit exposures by maturities.
Template 12a: EU CR1-A: Maturity of exposures as of 30.6.2021
(Amounts in millions of Euro)
a b c d e f
Net exposure value
On demand <= 1 year > 1 year <= 5
years > 5 years
No stated maturity
Total
1 Loans and advances 231 5,634 17,255 14,380 - 37,500
2 Debt securities - 1,389 3,443 4,764 - 9,596
3 Total 231 7,023 20,699 19,143 - 47,096

Pillar III Disclosures for June 30, 2021 35
The following tables show the total exposure amounts broken down by significant industry of counterparty
as of 30.6.2021 and 31.12.2020.
Template 13a: EU CQ5: Credit quality of loans and advances to non-financial corporations by
industry as of 30.6.2021
(Amounts in millions of Euro)
a c e f
Gross carrying
amount
Accumulated impairment
Accumulated negative changes in fair value due to credit risk on non-
performing exposures
Of which defaulted
010 Agriculture, forestry and fishing 344 88 (59) -
020 Mining and quarrying 85 28 (17) -
030 Manufacturing 4,216 873 (462) -
040 Electricity, gas, steam and air conditioning supply 1,052 4 (4) -
050 Water supply 43 3 (2) -
060 Construction 2,134 966 (657) -
070 Wholesale and retail trade 4,867 1,705 (873) (23)
080 Transport and storage 3,409 344 (106) (68)
090 Accommodation and food service activities 2,318 299 (101) -
100 Information and communication 239 65 (36) -
110 Financial and insurance activities - - - -
120 Real estate activities 1,672 364 (121) (24)
130 Professional, scientific and technical activities 472 47 (24) -
140 Administrative and support service activities 407 60 (35) -
150 Public administration and defense, compulsory social security
3 0 (0) -
160 Education 82 31 (11) -
170 Human health services and social work activities 231 25 (15) -
180 Arts, entertainment and recreation 255 68 (50) -
190 Other services 437 105 (103) (0)
200 Total 22,266 5,074 (2,674) (115)

Pillar III Disclosures for June 30, 2021 36
Template 13b: EU CQ5: Credit quality of loans and advances to non-financial corporations by
industry as of 31.12.2020
(Amounts in millions of Euro)
a c e f
Gross carrying
amount
Accumulated impairment
Accumulated negative changes in fair value due to credit risk on non-
performing exposures
Of which defaulted
010 Agriculture, forestry and fishing 488 238 ( 98) -
020 Mining and quarrying 109 51 ( 32) -
030 Manufacturing 5,364 2,087 ( 1,083) -
040 Electricity, gas, steam and air conditioning supply 1,228 7 ( 9) -
050 Water supply 45 8 ( 5) -
060 Construction 2,513 1,374 ( 791) -
070 Wholesale and retail trade 6,548 3,435 ( 1,786) ( 19)
080 Transport and storage 3,235 445 ( 162) ( 43)
090 Accommodation and food service activities 2,668 690 ( 261) -
100 Information and communication 284 141 ( 80) ( 1)
110 Financial and insurance activities 0 - - -
120 Real estate activities 1,817 472 ( 148) ( 24)
130 Professional, scientific and technical activities 445 109 ( 53) -
140 Administrative and support service activities 489 156 ( 85) -
150 Public administration and defense, compulsory social security
1 0 ( 0) -
160 Education 89 41 ( 14) -
170 Human health services and social work activities 203 63 ( 36) -
180 Arts, entertainment and recreation 326 137 ( 81) -
190 Other services 547 196 ( 149) ( 3)
200 Total 26,401 9,649 ( 4,872) ( 90)

Pillar III Disclosures for June 30, 2021 37
The tables below present the credit quality of the Group’s exposures broken down by significant
geographical area as of 30.6.2021 and 31.12.2020
Template 14a: EU CQ4: Quality of non-performing exposures by geography as of 30.6.2021
(Amounts in millions of Euro)
a c e f g
Gross carrying/nominal
amount
Accumulated impairment
Provisions on off-balance-
sheet commitments and financial guarantees
given
Accumulated negative
changes in fair value due to credit risk on
non-performing exposures
Of which defaulted
010 On-balance-sheet exposures 53,141 11,364 (5,948) (116)
020 Greece 40,178 8,545 (4,175) (40)
030 United Kingdom 1,594 699 (536) -
040 Romania 2,976 186 (119) (21)
050 Cyprus 2,628 1,523 (947) -
070 Other countries 5,764 411 (172) (55)
080 Off-balance-sheet exposures 7,628 347 48
090 Greece 6,817 316 35
100 United Kingdom 79 1 0
110 Romania 472 17 5
120 Cyprus 213 13 8
140 Other countries 46 0 0
150 Total 60,769 11,711 (5,948) 48 (116)

Pillar III Disclosures for June 30, 2021 38
Template 14b: EU CQ4: Quality of non-performing exposures by geography as of 31.12.2020
(Amounts in millions of Euro)
a c e f g
Gross carrying/nominal
amount
Accumulated impairment
Provisions on off-balance-
sheet commitments and financial guarantees
given
Accumulated negative
changes in fair value due to credit risk on
non-performing exposures
Of which defaulted
010 On-balance-sheet exposures 68,359 20,971 (9,752) (91)
020 Greece 52,091 18,010 (8,172) (37)
030 United Kingdom 2,751 741 (471) -
040 Romania 3,383 186 (126) (21)
050 Cyprus 2,982 1,592 (806) -
070 Other countries 7,151 443 (177) (33)
080 Off-balance-sheet exposures 7,970 336 91
090 Greece 7,172 319 78
100 United Kingdom 54 3 0
110 Romania 494 4 5
120 Cyprus 209 10 8
140 Other countries 41 0 0
150 Total 76,329 21,308 (9,752) 91 (91)
Amounts shown by country in this table are based on the country of residence of the counterparty.
The following tables provide an overview of the credit quality of forborne exposures.

39
Template 15a: EU CQ1: Credit quality of forborne exposures as of 30.6.2021
(Amounts in millions of Euro)
a b c d e f g h
Gross carrying amount/nominal amount of
exposures with forbearance measures
Accumulated impairment, accumulated negative changes in fair value due to
credit risk and provisions
Collateral received and financial guarantees received on forborne
exposures
Performing forborne
Non-performing forborne
On performing forborne exposures
On non-performing forborne exposures
Of which collateral and financial guarantees
received on non-performing exposures
with forbearance measures
Of which defaulted
Of which impaired
005 Cash balances at central banks and other demand deposits
- - - - - - - -
010 Loans and advances 4,261 7,678 7,678 7,497 (205) (3,444) 6,758 3,465
020 Central banks - - - - - - - -
030 General governments 0 1 1 1 (0) (0) 0 0
040 Credit institutions - - - - - - - -
050 Other financial corporations 2 4 4 4 (0) (2) 2 1
060 Non-financial corporations 1,329 2,988 2,988 2,808 (48) (1,309) 2,420 1,440
070 Households 2,930 4,686 4,686 4,686 (158) (2,133) 4,336 2,023
080 Debt Securities - - - - - - - -
090 Loan commitments given 4 1 1 1 0 0 0 0
100 Total 4,265 7,678 7,678 7,498 (205) (3,444) 6,759 3,465

40
Template 15b: EU CQ1: Credit quality of forborne exposures as of 31.12.2020
(Amounts in millions of Euro)
a b c d e f g h
Gross carrying amount/nominal amount of
exposures with forbearance measures
Accumulated impairment, accumulated negative changes in fair value due to
credit risk and provisions
Collateral received and financial guarantees received on forborne
exposures
Performing forborne
Non-performing forborne
On performing forborne exposures
On non-performing forborne exposures
Of which collateral and financial guarantees
received on non-performing exposures
with forbearance measures
Of which defaulted
Of which impaired
005 Cash balances at central banks and other demand deposits
- - - - - - - -
010 Loans and advances 4,038 12,708 12,708 12,526 (293) (4,874) 9,496 6,458
020 Central banks - - - - - - - -
030 General governments - 1 1 1 - (0) 0 0
040 Credit institutions - - - - - - - -
050 Other financial corporations 2 7 7 7 (0) (3) 5 4
060 Non-financial corporations 1,075 5,169 5,169 4,986 (67) (2,118) 3,256 2,486
070 Households 2,960 7,531 7,531 7,531 (227) (2,753) 6,235 3,968
080 Debt Securities - - - - - - - -
090 Loan commitments given 9 3 3 3 0 - 0 0
100 Total 4,046 12,711 12,711 12,529 (293) (4,874) 9,497 6,458

41
Template 16a: EU CQ3: Credit quality of performing and non-performing exposures by past due days as of 30.6.2021
(Amounts in millions of Euro)
a b c d e f g h i j k l
Gross carrying amount/nominal amount
Performing exposures Non-performing exposures
Not past due or
past due ≤ 30 days
Past due > 30 days ≤ 90 days
Unlikely to pay that are not past due or are past due ≤ 90
days
Past due > 90 days ≤ 180 days
Past due > 180 days
≤ 1 year
Past due > 1 year ≤
2 years
Past due > 2 years ≤
5 years
Past due > 5 years ≤
7 years
Past due > 7 years
Of which defaulted
005 Cash balances at central banks and other demand deposits
12,274 12,274 - 70 - - - - - - 70 70
010 Loans and advances 32,168 31,996 172 11,364 4,085 606 464 846 2,136 715 2,513 11,364
020 Central banks - - - - - - - - - - - -
030 General governments 64 64 - 1 1 0 - 0 0 - 0 1
040 Credit institutions - - - - - - - - - - - -
050 Other financial corporations 4,095 4,095 - 10 3 1 0 0 1 0 6 10
060 Non-financial corporations 17,192 17,151 41 5,074 2,165 192 114 306 707 253 1,338 5,074
070 Of which SMEs 7,343 7,303 40 3,193 1,182 110 86 133 446 140 1,096 3,193
080 Households 10,817 10,685 132 6,278 1,916 413 350 540 1,428 462 1,169 6,278
090 Debt securities 9,609 9,609 - - - - - - - - - -
100 Central banks - - - - - - - - - - - -
110 General governments 7,955 7,955 - - - - - - - - - -
120 Credit institutions 807 807 - - - - - - - - - -
130 Other financial corporations 33 33 - - - - - - - - - -
140 Non-financial corporations 814 814 - - - - - - - - - -
150 Off-balance-sheet exposures 7,282 347 347
160 Central banks - - -
170 General governments 192 - -
180 Credit institutions 642 - -
190 Other financial corporations 42 4 4
200 Non-financial corporations 4,670 342 342
210 Households 1,735 1 1
220 Total 61,332 53,878 172 11,780 4,085 606 464 846 2,136 715 2,583 11,780

42
Template 16b: EU CQ3: Credit quality of performing and non-performing exposures by past due days as of 31.12.2020
(Amounts in millions of Euro)
a b c d e f g h i j k l
Gross carrying amount/nominal amount
Performing exposures Non-performing exposures
Not past due or
past due ≤ 30 days
Past due > 30 days ≤ 90 days
Unlikely to pay that are not past due or are past due ≤ 90
days
Past due > 90 days ≤ 180 days
Past due > 180 days
≤ 1 year
Past due > 1 year ≤
2 years
Past due > 2 years ≤
5 years
Past due > 5 years ≤
7 years
Past due > 7 years
Of which defaulted
005 Cash balances at central banks and other demand deposits
9,819 9,819 - 70 - - - - - - 70 70
010 Loans and advances 28,228 27,886 342 20,901 6,280 335 622 2,057 3,363 1,204 7,041 20,901
020 Central banks - - - - - - - - - - - -
030 General governments 79 79 0 2 1 - - 0 0 - 1 2
040 Credit institutions - - - - - - - - - - - -
050 Other financial corporations 160 159 0 36 15 0 0 1 5 0 14 36
060 Non-financial corporations 16,752 16,707 45 9,649 3,207 125 288 868 1,295 416 3,451 9,649
070 Of which SMEs 7,125 7,107 18 6,784 1,923 104 87 455 739 288 3,187 6,784
080 Households 11,237 10,940 297 11,215 3,058 210 335 1,187 2,062 788 3,575 11,215
090 Debt securities 9,341 9,341 - - - - - - - - - -
100 Central banks - - - - - - - - - - - -
110 General governments 7,950 7,950 - - - - - - - - - -
120 Credit institutions 689 689 - - - - - - - - - -
130 Other financial corporations 15 15 - - - - - - - - - -
140 Non-financial corporations 686 686 - - - - - - - - - -
150 Off-balance-sheet exposures 7,634 336 336
160 Central banks - - -
170 General governments 194 - -
180 Credit institutions 623 - -
190 Other financial corporations 52 4 4
200 Non-financial corporations 5,062 332 332
210 Households 1,703 1 1
220 Total 55,021 47,046 342 21,308 6,280 335 622 2,057 3,363 1,204 7,111 21,308

43
Template 17a: EU CR1: Performing and non-performing exposures and related provisions as of 30.6.2021
(Amounts in millions of Euro)
a b c D e f g h i j k l m n o
Gross carrying amount/nominal amount Accumulated impairment, accumulated negative changes in fair
value due to credit risk and provisions
Accumulated partial write-off
Collateral and financial guarantees received
Performing exposures Non-performing exposures Performing exposures –
accumulated impairment and provisions
Non-performing exposures – accumulated impairment,
accumulated negative changes in fair value due to credit risk
and provisions
On performing exposures
On non-performing exposures
Of which stage 1
Of which stage 2
Of which stage 2
Of which stage 3
Of which stage 1
Of which stage 2
Of which stage 2
Of which stage 3
005 Cash balances at central banks and other demand deposits
12,274 12,274 - 70 - 70 ( 1) ( 1) - ( 70) - ( 70) - -
010 Loans and advances 32,168 25,577 5,367 11,364 - 8,922 ( 414) ( 125) ( 231) ( 5,619) - ( 4,412) ( 5,292) 24,496 4,788
020 Central banks - - - - - - - - - - - - - - -
030 General governments 64 64 1 1 - 1 ( 0) ( 0) ( 0) ( 0) - ( 0) ( 0) 56 1
040 Credit institutions - - - - - - - - - - - - - - -
050 Other financial corporations
4,095 4,086 7 10 - 8 ( 2) ( 1) ( 0) ( 7) - ( 6) ( 10) 3,905 3
060 Non-financial corporations
17,192 14,559 2,207 5,074 - 4,041 ( 189) ( 106) ( 72) ( 2,601) - ( 2,009) ( 3,511) 12,126 2,122
070 Of which SMEs 7,343 6,033 1,186 3,193 - 2,642 ( 66) ( 18) ( 42) ( 1,660) - ( 1,315) ( 2,096) 5,015 1,282
080 Households 10,817 6,869 3,152 6,278 - 4,872 ( 223) ( 18) ( 159) ( 3,011) - ( 2,396) ( 1,771) 8,409 2,663
090 Debt securities 9,609 9,554 24 - - - ( 31) ( 31) ( 0) - - - - - -
100 Central banks - - - - - - - - - - - - - - -
110 General governments 7,955 7,955 - - - - ( 17) ( 17) - - - - - - -
120 Credit institutions 807 805 - - - - ( 11) ( 11) - - - - - - -
130 Other financial corporations
33 5 - - - - ( 0) ( 0) - - - - - - -
140 Non-financial corporations
814 790 24 - - - ( 3) ( 3) ( 0) - - - - - -
150 Off-balance-sheet exposures
7,282 6,889 391 347 - 347 ( 13) ( 5) ( 8) ( 35) - ( 35) 1,106 64
160 Central banks - - - - - - - - - - - - - -
170 General governments 192 192 1 - - - ( 0) ( 0) ( 0) - - - 0 -
180 Credit institutions 642 641 1 - - - ( 1) ( 1) ( 0) - - - - -
190 Other financial corporations
42 42 0 4 - 4 ( 0) ( 0) ( 0) ( 0) - ( 0) 6 0
200 Non-financial corporations
4,670 4,339 331 342 - 342 ( 11) ( 3) ( 8) ( 35) - ( 35) 1,065 63
210 Households 1,735 1,676 59 1 - 0 ( 1) ( 1) ( 0) ( 0) - ( 0) 34 0
220 Total 61,332 54,294 5,782 11,780 - 9,339 ( 459) ( 161) ( 239) ( 5,724) - ( 4,517) ( 5,292) 25,602 4,851

44
Template 17b: EU CR1: Performing and non-performing exposures and related provisions as of 31.12.2020
(Amounts in millions of Euro)
a b c D e f g h i j k l m n o
Gross carrying amount/nominal amount Accumulated impairment, accumulated negative changes in fair
value due to credit risk and provisions
Accumulated partial write-off
Collateral and financial guarantees received
Performing exposures Non-performing exposures Performing exposures –
accumulated impairment and provisions
Non-performing exposures – accumulated impairment,
accumulated negative changes in fair value due to credit risk
and provisions
On performing exposures
On non-performing exposures
Of which stage 1
Of which stage 2
Of which stage 2
Of which stage 3
Of which stage 1
Of which stage 2
Of which stage 2
Of which stage 3
005 Cash balances at central banks and other demand deposits
9,819 9,819 - 70 - 70 ( 0) ( 0) - ( 70) - ( 70) - -
010 Loans and advances 28,228 20,810 7,237 20,901 - 20,671 ( 562) ( 143) ( 419) ( 9,187) - ( 9,096) ( 11,419) 20,552 9,951
020 Central banks - - - - - - - - - - - - - - -
030 General governments 79 79 0 2 - 2 ( 0) ( 0) ( 0) ( 1) - ( 1) ( 1) 72 1
040 Credit institutions - - - - - - - - - - - - - - -
050 Other financial corporations
160 149 10 36 - 36 ( 2) ( 1) ( 0) ( 16) - ( 16) ( 101) 81 18
060 Non-financial corporations
16,752 13,744 2,826 9,649 - 9,419 ( 239) ( 119) ( 120) ( 4,724) - ( 4,634) ( 7,780) 11,809 4,088
070 Of which SMEs 7,125 5,587 1,538 6,784 - 6,758 ( 104) ( 23) ( 81) ( 3,448) - ( 3,427) ( 5,640) 4,891 2,735
080 Households 11,237 6,838 4,400 11,215 - 11,214 ( 321) ( 22) ( 299) ( 4,446) - ( 4,446) ( 3,537) 8,590 5,845
090 Debt securities 9,341 9,300 28 - - - ( 23) ( 23) ( 0) - - - - - -
100 Central banks - - - - - - - - - - - - - - -
110 General governments 7,950 7,950 - - - - ( 16) ( 16) - - - - - - -
120 Credit institutions 689 687 - - - - ( 5) ( 5) - - - - - - -
130 Other financial corporations
15 5 - - - - ( 0) ( 0) - - - - - - -
140 Non-financial
corporations 686 657 28 - - - ( 3) ( 2) ( 0) - - - - - -
150 Off-balance-sheet exposures
7,634 7,150 484 336 - 336 ( 17) ( 8) ( 9) ( 75) - ( 75) 1,252 59
160 Central banks - - - - - - - - - - - - - -
170 General governments 194 194 0 - - - ( 0) ( 0) ( 0) - - - 0 -
180 Credit institutions 623 608 15 - - - ( 1) ( 1) ( 0) - - - - -
190 Other financial corporations
52 51 0 4 - 4 0 0 0 ( 0) - ( 0) 3 0
200 Non-financial corporations
5,062 4,643 419 332 - 332 ( 15) ( 6) ( 9) ( 74) - ( 74) 1,222 59
210 Households 1,703 1,653 50 1 - 1 ( 1) 1 0 0 - 0 28 0
220 Total 55,021 47,079 7,749 21,308 - 21,078 ( 602) ( 173) ( 429) ( 9,331) - ( 9,241) ( 11,419) 21,805 10,010
The reported amounts for Stage 2 and Stage 3 as at 31.12.2020 are not comparable to those of 30.6.2021 as the latter do not include POCI exposures according to the amended
supervisory reporting requirements.

Pillar III Disclosures for June 30, 2021 45
Templates 18a and 18b show the changes in stock of non-performing loans and advances.
Template 18a: EU CR2: Changes in the stock of non-performing loans and advances as of 30.6.2021
(Amounts in millions of Euro)
a
Gross carrying
amount
010 Initial stock of non-performing loans and advances 20,901
020 Inflows to non-performing portfolios 1,723
030 Outflows from non-performing portfolios ( 11,260)
040 Outflows due to write-offs ( 251)
050 Outflow due to other situations ( 11,009)
060 Final stock of non-performing loans and advances 11,364
Template 18b: EU CR2: Changes in the stock of non-performing loans and advances as of
31.12.2020
(Amounts in millions of Euro)
a
Gross carrying amount
010 Initial stock of non-performing loans and advances 21,827
020 Inflows to non-performing portfolios 2,018
030 Outflows from non-performing portfolios ( 2,944)
040 Outflows due to write-offs ( 709)
050 Outflow due to other situations ( 2,235)
060 Final stock of non-performing loans and advances 20,901
Under the Standardised Approach, credit risk is measured by applying risk weights outlined in CRD IV,
based on the exposure class to which the exposure is allocated. The following tables outline the
Standardised exposure classes by CRD IV prescribed risk weight. Exposures subject to counterparty credit
risk are not included in the table.

46
Template 19a EU CR5: Standardised approach as of 30.6.2021
(Amounts in millions of Euro)
Exposure classes
Risk weight Total
Of which unrated 0% 2% 4% 10% 20% 35% 50% 70% 75% 100% 150% 250% 370% 1250% Others
a b c d e f g h i j k l m n o p q
1 Central governments or central banks 17,685 - - - 12 - - - - 3,125 - 504 - - - 21,326
2 Regional government or local authorities - - - - 11 - - - - - - - - - - 11
3 Public sector entities 1,036 - - - 0 - - - - 645 - - - - - 1,680
4 Multilateral development banks 404 - - - - - - - - - - - - - - 404
5 International organisations 209 - - - - - - - - - - - - - - 209
6 Institutions 1,198 - - - 728 - 483 - - 37 163 - - - - 2,610
7 Corporates - - - - 10 - 79 - - 10,141 75 - - - - 10,305
8 Retail exposures - - - - - - - - 3,155 - - - - - - 3,155
9 Exposures secured by mortgages on immovable property
- - - - - 7,346 4,018 - 1,151 1,253 - - - - - 13,768
10 Exposures in default - - - - - - - - - 4,683 833 - - - - 5,516
11 Exposures associated with particularly high risk - - - - - - - - - - 176 - - - - 176
12 Covered bonds - - - - - - - - - - - - - - - -
13 Exposures to institutions and corporates with a short-term credit assessment
- - - - - - - - - - - - - - - -
14 Units or shares in collective investment undertakings
0 - - - - - - - - 7 - - - - - 7
15 Equity exposures - - - - - - - - - 233 - 94 - - - 327
16 Other items 410 - - - - - - - - 3,042 - - - - - 3,452
17 TOTAL 20,942 - - - 761 7,346 4,580 - 4,306 23,165 1,247 597 - - - 62,944

47
Template 19b: EU CR5: Standardised approach as of 31.12.2020
(Amounts in millions of Euro)
Exposure classes
Risk weight Total
Of which unrated 0% 2% 4% 10% 20% 35% 50% 70% 75% 100% 150% 250% 370% 1250% Others
a b c d e f g h i j k l m n o p q
1 Central governments or central banks 15,605 - - - 3 - 0 - - 3,169 - 800 - - - 19,577
2 Regional government or local authorities - - - - 27 - - - - - - - - - - 27
3 Public sector entities 799 - - - 0 - - - - 636 - - - - - 1,435
4 Multilateral development banks 428 - - - - - - - - - - - - - - 428
5 International organisations 341 - - - - - - - - - - - - - - 341
6 Institutions 51 - - - 817 - 390 - - 57 62 - - - - 1,377
7 Corporates - - - - - - 61 - - 9,791 48 - - - - 9,900
8 Retail exposures - - - - - - - - 3,360 - - - - - - 3,360
9 Exposures secured by mortgages on immovable property
- - - - - 7,295 4,117 - 1,239 1,128 - - - - - 13,778
10 Exposures in default - - - - - - - - - 10,294 1,162 - - - - 11,456
11 Exposures associated with particularly high risk - - - - - - - - - - 200 - - - - 200
12 Covered bonds - - - - - - - - - - - - - - - -
13 Exposures to institutions and corporates with a short-term credit assessment
- - - - - - - - - - - - - - - -
14 Units or shares in collective investment undertakings
- - - - - - - - - 7 - - - - - 7
15 Equity exposures - - - - - - - - - 192 - 68 - - - 260
16 Other items 410 - - - - - - - - 3,550 - - - - - 3,960
17 TOTAL 17,634 - - - 848 7,295 4,567 - 4,599 28,824 1,471 868 - - - 66,106
Pillar III Disclosures for June 30, 2021 48
5.1 Credit risk mitigation
Credit risk mitigation techniques reduce exposure value and expected loss. According to CRR 575/2013,
only specific types of credit risk mitigation are eligible for capital adequacy calculation purposes.
Moreover, the Bank of Greece sets additional criteria which should be satisfied during the collateral
management process (market value monitoring, insurance, legal validity) and the terms and conditions of
the relevant agreements.
Collateral can be used in order to mitigate the credit risk created in case a customer or counterparty to a
financial instrument fails to meet their contractual obligations.
Collaterals are holdings or rights of every type provided to the Bank by its debtors or third parties to be used
as additional funding sources in case of claim liquidation.
The main collateral types are mortgages, cash, mutual funds and sovereign securities (repos, bonds).
5.1.1 Description of the main collateral types
Collateral used to mitigate risk, both for mortgage and other lending is diversified. The main types of
guarantors are corporates, individuals, financial institutions and sovereigns. Their creditworthiness is
assessed on a case by-case basis.
There are two broad categories of collateral: Contractual collaterals – guarantees and tangible collaterals.
Guarantees are the most common collateral type of the first category. A guarantee is a legally enforceable
relationship between the Bank and the borrower, through which the guarantor assumes the responsibility
of paying the debt. It is documented and presupposes the existence of another legally enforceable
relationship between the Bank and the borrower (loan).
The most common types of tangible collateral are mortgages on real estate properties and pledges on
commodities, deposits and cheques or claims and receivables.
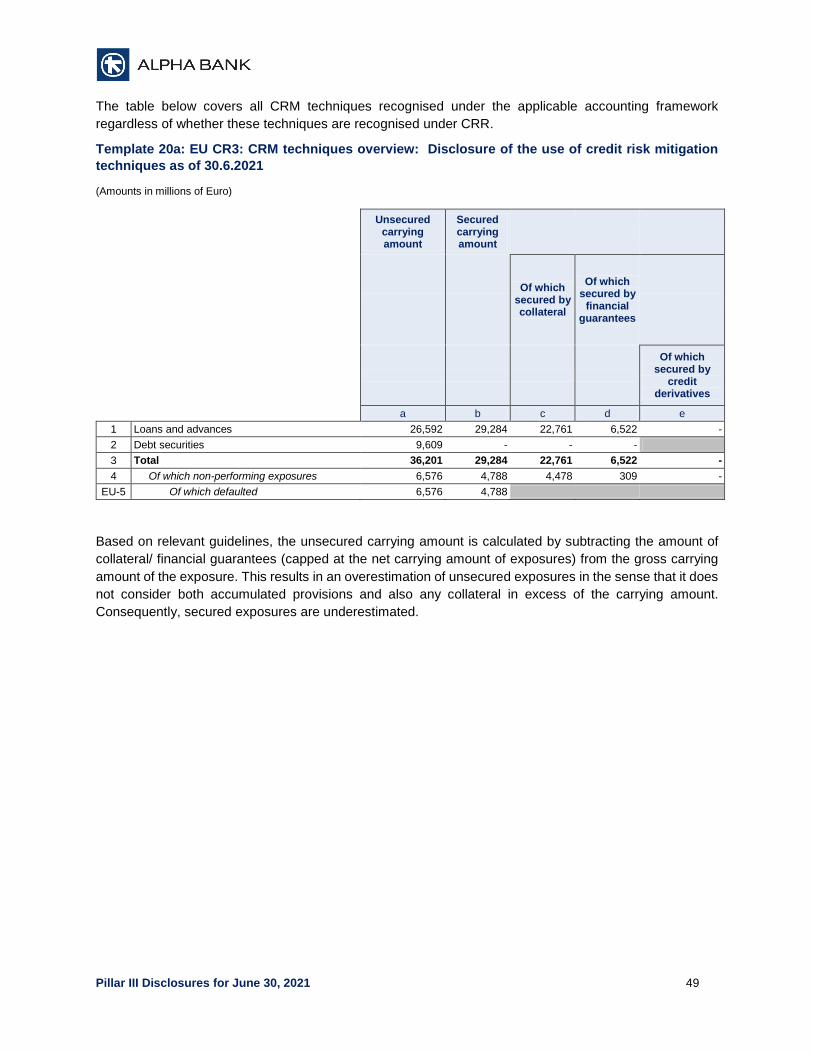
Pillar III Disclosures for June 30, 2021 49
The table below covers all CRM techniques recognised under the applicable accounting framework
regardless of whether these techniques are recognised under CRR.
Template 20a: EU CR3: CRM techniques overview: Disclosure of the use of credit risk mitigation
techniques as of 30.6.2021
(Amounts in millions of Euro)
Unsecured
carrying amount
Secured carrying amount
Of which
secured by collateral
Of which secured by
financial guarantees
Of which secured by
credit derivatives
a b c d e
1 Loans and advances 26,592 29,284 22,761 6,522 -
2 Debt securities 9,609 - - -
3 Total 36,201 29,284 22,761 6,522 -
4 Of which non-performing exposures 6,576 4,788 4,478 309 -
EU-5 Of which defaulted 6,576 4,788
Based on relevant guidelines, the unsecured carrying amount is calculated by subtracting the amount of
collateral/ financial guarantees (capped at the net carrying amount of exposures) from the gross carrying
amount of the exposure. This results in an overestimation of unsecured exposures in the sense that it does
not consider both accumulated provisions and also any collateral in excess of the carrying amount.
Consequently, secured exposures are underestimated.

Pillar III Disclosures for June 30, 2021 50
Template 20b: EU CR3: CRM techniques overview: Disclosure of the use of credit risk mitigation
techniques as of 31.12.2020
(Amounts in millions of Euro)
Unsecured
carrying amount
Secured carrying amount
Of which
secured by collateral
Of which secured by
financial guarantees
Of which secured by
credit derivatives
a b c d e
1 Loans and advances 28,515 30,503 27,905 2,598
2 Debt securities 9,341 - - -
3 Total 37,856 30,503 27,905 2,598
4 Of which non-performing exposures 10,950 9,951 9,642 309
EU-5 Of which defaulted 10,950 9,951
Based on relevant guidelines, the unsecured carrying amount is calculated by subtracting the amount of
collateral/ financial guarantees (capped at the net carrying amount of exposures) from the gross carrying
amount of the exposure. This results in an overestimation of unsecured exposures in the sense that it does
not consider both accumulated provisions and also any collateral in excess of the carrying amount.
Consequently, secured exposures are underestimated.

Pillar III Disclosures for June 30, 2021 51
The tables below present Standardised exposures before Credit Conversion Factor (CCF) and Credit Risk
Mitigation (CRM) and after CCF and CRM at 30.6.2021 and 31.12.2020, excluding exposures subject to
counterparty credit risk.
Template 21a: EU CR4 – Standardised approach – Credit risk exposure and CRM effects as of
30.6.2021
(Amounts in millions of Euro)
Exposure classes
Exposures before CCF and before CRM
Exposures post CCF and post CRM
RWAs and RWAs density
On-balance-
sheet exposures
Off-balance-sheet
exposures
On-balance-sheet
exposures
Off-balance-sheet
exposures RWAs
RWAs density (%)
a b c d e f
1 Central governments or central banks 20,761 190 21,326 - 4,386 20.57%
2 Regional government or local authorities 11 1 11 0 2 20.00%
3 Public sector entities 644 4 1,680 1 645 38.38%
4 Multilateral development banks 105 - 404 0 - 0.00%
5 International organisations 209 - 209 - - 0.00%
6 Institutions 2,811 573 2,608 1 669 25.63%
7 Corporates 10,889 3,462 9,690 615 9,214 89.41%
8 Retail 3,750 2,959 3,012 143 2,153 68.26%
9 Secured by mortgages on immovable property
13,965 84 13,737 31 6,116 44.42%
10 Exposures in default 5,688 281 5,441 75 5,933 107.55%
11 Exposures associated with particularly high risk
198 - 176 - 264 150.00%
12 Covered bonds - - - - - 0.00%
13 Institutions and corporates with a short-term credit assessment
- - - - - 0.00%
14 Collective investment undertakings 7 - 7 - 7 98.01%
15 Equity 327 - 327 - 467 143.03%
16 Other items 3,452 1 3,452 - 3,042 88.11%
17 TOTAL 62,817 7,554 62,079 865 32,899 52.27%

Pillar III Disclosures for June 30, 2021 52
Template 21b: EU CR4 – Standardised approach – Credit risk exposure and CRM effects as of
31.12.2020
(Amounts in millions of Euro)
Exposure classes
Exposures before CCF and before CRM
Exposures post CCF and post CRM
RWAs and RWAs density
On-balance-
sheet exposures
Off-balance-sheet
exposures
On-balance-sheet
exposures
Off-balance-sheet
exposures RWAs
RWAs density (%)
a b c d e f
1 Central governments or central banks 19,011 191 19,577 0 5,171 26%
2 Regional government or local authorities 27 1 27 0 5 20%
3 Public sector entities 635 3 1,434 1 636 44%
4 Multilateral development banks 210 - 428 - - 0%
5 International organisations 341 - 341 - - 0%
6 Institutions 3,187 616 1,366 11 508 37%
7 Corporates 10,264 3,798 9,226 674 8,922 90%
8 Retail 3,860 2,900 3,276 84 2,346 70%
9 Secured by mortgages on immovable property
13,996 119 13,743 35 6,193 45%
10 Exposures in default 11,616 250 11,389 67 12,037 105%
11 Exposures associated with particularly high risk
222 - 200 - 299 150%
12 Covered bonds - - - - - 0%
13 Institutions and corporates with a short-term credit assessment
- - - - - 0%
14 Collective investment undertakings 7 - 7 - 7 100%
15 Equity 260 - 260 - 363 139%
16 Other items 3,960 - 3,960 - 3,550 90%
17 TOTAL 67,597 7,879 65,233 872 40,036 61%

Pillar III Disclosures for June 30, 2021 53
The tables below provide information on the instruments that were cancelled in exchange for the collateral
obtained by taking possession and on the value of the collateral obtained by taking possession as of
30.6.2021 and 31.12.2020.
Template 22a: EU CQ7: Collateral obtained by taking possession and execution processes as of
30.6.2021
(Amounts in millions of Euro)
a b
Collateral obtained by taking possession
Value at initial
recognition Accumulated
negative changes
010 Property, plant and equipment (PP&E) 47 35
020 Other than PP&E 1,058 885
030 Residential immovable property 345 313
040 Commercial Immovable property 703 566
050 Movable property (auto, shipping, etc.) 0 0
060 Equity and debt instruments 11 5
070 Other collateral - -
080 Total 1,105 920
Template 22b: EU CQ7: Collateral obtained by taking possession and execution processes as of
31.12.2020
(Amounts in millions of Euro)
a b
Collateral obtained by taking possession
Value at initial
recognition Accumulated
negative changes
010 Property, plant and equipment (PP&E) 48 35
020 Other than PP&E 1,137 910
030 Residential immovable property 333 301
040 Commercial Immovable property 798 603
050 Movable property (auto, shipping, etc.) 0 0
060 Equity and debt instruments 6 6
070 Other collateral - -
080 Total 1,185 946

Pillar III Disclosures for June 30, 2021 54
5.2 Additional Credit Risk reporting to COVID-19
In response to the need to address negative economic consequences of COVID-19 pandemic, the
European Union (EU) and Member States have introduced a wide range of mitigating measures to support
the real economy and the financial sector.
On 2 April 2020, the EBA published Guidelines on legislative and non-legislative moratoria on loan
repayments applied in the light of the COVID-19 crisis which clarifies a set of criteria and conditions under
which such measures do not trigger forbearance classification of loans and advances, and sets out their
further prudential treatment in this context.
The table below provides an overview of the credit quality of loans and advances subject to moratoria on
loan repayments applied in the light of the COVID-19 crisis, in accordance with EBA/GL/2020/02:

55
Template 23a: COVID1: Information on loans and advances subject to legislative and non-legislative moratoria as of 30.6.2021
(Amounts in millions of Euro)
a b c D e f g h i j k l m n o
Gross carrying amount Accumulated impairment, accumulated negative changes in fair value due
to credit risk
Gross carrying amount
Performing Non performing
Performing Non performing
Inflows to non-
performing exposures
Of which: exposures
with forbearance measures
Of which: Instruments
with significant increase in credit risk
since initial recognition
but not credit-
impaired (Stage 2)
Of which: exposures
with forbearance measures
Of which: Unlikely to pay that are
not past-due or past-due <= 90
days
Of which: exposures
with forbearance measures
Of which: Instruments
with significant increase in credit risk
since initial recognition
but not credit-
impaired (Stage 2)
Of which: exposures
with forbearance measures
Of which: Unlikely to pay that are
not past-due or past-due <= 90
days
1 Loans and advances subject to moratorium
87 47 16 29 39 36 39 (8) (2) (1) (2) (6) (6) (6) 0
2 of which: Households 60 32 10 21 28 24 28 (5) (1) (1) (1) (4) (4) (4) 0
3
of which: Collateralised by residential immovable property
50 28 8 17 22 18 22 (3) (0) (0) (0) (2) (2) (2) 0
4 of which: Non-financial corporations
27 15 6 8 12 12 12 (3) (1) (0) (0) (2) (2) (2) -
5 of which: Small and Medium-sized Enterprises
26 14 5 6 12 12 12 (3) (0) (0) (0) (2) (2) (2) -
6
of which: Collateralised by commercial immovable property
19 12 5 6 7 7 7 (1) (0) (0) (0) (1) (1) (1) -

56
The following table provides an overview of the volume of loans and advances subject to legislative and non-legislative moratoria in accordance with EBA/GL/2020/02 by residual maturity of these moratoria:
Template 24a: COVID2: Breakdown of loans and advances subject to legislative and non-legislative
moratoria by residual maturity of moratoria as of 30.6.2021
(Amounts in millions of Euro)
a b c d e f g h i
Number of
obligors
Gross carrying amount
Of which: legislative moratoria
Of which: expired
Residual maturity of moratoria
<= 3 months
> 3 months
<= 6 months
> 6 months <= 9
months
> 9 months <= 12
months > 1 year
Loans and advances for which moratorium was offered
186,503 10,690
Loans and advances subject to moratorium (granted)
139,062 8,651 1,185 8,564 22 65 - - -
of which: Households
4,666 494 4,606 13 47 - - -
of which: Collateralised by residential immovable property
3,699 429 3,649 11 39 - - -
of which: Non-financial corporations
3,954 674 3,928 9 17 - - -
of which: Small and Medium-sized Enterprises
2,294 53 2,269 9 16 - - -
of which: Collateralised by commercial immovable property
2,487 591 2,468 7 12 - - -

57
Template 24b: COVID2: Breakdown of loans and advances subject to legislative and non-legislative
moratoria by residual maturity of moratoria as of 31.12.2020
(Amounts in millions of Euro)
a b c d e f g h i
Number of
obligors
Gross carrying amount
Of which: legislative moratoria
Of which: expired
Residual maturity of moratoria
<= 3 months
> 3 months
<= 6 months
> 6 months <= 9
months
> 9 months <= 12
months > 1 year
Loans and advances for which moratorium was offered
194,618 11,449
Loans and advances subject to moratorium (granted)
148,716 9,411 1,164 9,411 - - - - -
of which: Households
5,113 512 5,113 - - - - -
of which: Collateralised by residential immovable property
4,065 442 4,065 - - - - -
of which: Non-financial corporations
4,266 636 4,266 - - - - -
of which: Small and Medium-sized Enterprises
2,627 62 2,627 - - - - -
of which: Collateralised by commercial immovable property
2,713 540 2,713 - - - - -
The table provides an overview of the stock of newly originated loans and advances subject to public guarantee schemes introduced in response to COVID-19 crisis:

58
Template 25a: COVID3: Information on newly originated loans and advances provided under newly applicable public guarantee schemes
introduced in response to COVID-19 crisis as of 30.6.2021
(Amounts in millions of Euro)
a b c d
Gross carrying amount Maximum amount of the guarantee
that can be considered Gross carrying amount
of which: forborne Public guarantees received
Inflows to non-performing exposures
1 Newly originated loans and advances subject to public guarantee schemes
1,358 - 1,092 3
2 of which: Households - -
3 of which: Collateralised by residential immovable property - -
4 of which: Non-financial corporations 1,355 - 1,089 3
5 of which: Small and Medium-sized Enterprises 1,005 3
6 of which: Collateralised by commercial immovable property 10 -
Template 25b: COVID3: Information on newly originated loans and advances provided under newly applicable public guarantee schemes
introduced in response to COVID-19 crisis as of 31.12.2020
(Amounts in millions of Euro)
a b c d
Gross carrying amount Maximum amount of the guarantee
that can be considered Gross carrying amount
of which: forborne Public guarantees received
Inflows to non-performing exposures
1 Newly originated loans and advances subject to public guarantee schemes
1,041 - 837 8
2 of which: Households - -
3 of which: Collateralised by residential immovable property - -
4 of which: Non-financial corporations 1,040 - 837 8
5 of which: Small and Medium-sized Enterprises 729 8
6 of which: Collateralised by commercial immovable property 5 -

Pillar III Disclosures for June 30, 2021 59
6 Exposure to Securitisation positions
The amounts reported in the following two templates provide details of Group’s securitization exposures
separately for the regulatory non-trading and trading book.
The template EU SEC1 below presents the total non-trading book securitization exposure split by exposure
type that is securitized as either originator or sponsor and finally positions which have been purchased
through investment activities as investor.

60
Template 26: EU-SEC1 - Securitisation exposures in the non-trading book as of 30.6.2021
(Amounts in millions of Euro)
a b c D e f g h i j k l m n o
Institution acts as originator Institution acts as sponsor Institution acts as investor
Traditional Synthetic Sub-total Traditional
Synthetic
Sub-total Traditional
Synthetic
Sub-total
STS Non-STS
of which
SRT STS Non-STS STS Non-STS
of which SRT
of which SRT
1 Total exposures - - 20 20 - - 20 - - - - - 11 - 11
2 Retail (total) - - 13 13 - - 13 - - - - - 11 - 11
3 residential mortgage - - 13 13 - - 13 - - - - - 11 - 11
4 credit card - - - - - - - - - - - - - - -
5 other retail exposures - - - - - - - - - - - - - - -
6 re-securitisation - - - - - - - - - - - - - - -
7 Wholesale (total) - - 6 6 - - 6 - - - - - - - -
8 loans to corporates - - 6 6 - - 6 - - - - - - - -
9 commercial mortgage - - - - - - - - - - - - - - -
10 lease and receivables - - - - - - - - - - - - - - -
11 other wholesale - - - - - - - - - - - - - - -
12 re-securitisation - - - - - - - - - - - - - - -
Templates EU-SEC3 and EU-SEC4 include information on securitisation exposures in the non- trading book only with significant risk transfer

61
Template 27: EU-SEC3 - Securitisation exposures in the non-trading book and associated regulatory capital requirements -
institution acting as originator or as sponsor as of 30.6.2021
(Amounts in millions of Euro)
a b c d e f g h i j k l m n o EU-p EU-q
Exposure values (by RW bands/deductions) Exposure values (by regulatory
approach) RWEA (by regulatory approach) Capital charge after cap
≤20% RW
>20% to 50%
RW
>50% to 100%
RW
>100% to <1250%
RW
1250% RW/ deductions
SEC-IRBA
SEC-ERBA (including
IAA)
SEC-SA
1250%/ deductions
SEC-IRBA
SEC-ERBA (including
IAA)
SEC-SA
1250%/ deductions
SEC-IRBA
SEC-ERBA (including
IAA)
SEC-SA
1250% RW/ deductions
1 Total exposures - - - 20 - - - 20 - - - 180 - - - 14 -
2 Traditional transactions - - - 20 - - - 20 - - - 180 - - - 14 -
3 Securitisation - - - 20 - - - 20 - - - 180 - - - 14 -
4 Retail underlying - - - 13 - - - 13 - - - 136 - - - 11 -
5 Of which STS - - - - - - - - - - - - - - - - -
6 Wholesale - - - 6 - - - 6 - - - 44 - - - 4 -
7 Of which STS - - - - - - - - - - - - - - - - -
8 Re-securitisation - - - - - - - - - - - - - - - - -
9 Synthetic transactions - - - - - - - - - - - - - - - - -
10 Securitisation - - - - - - - - - - - - - - - - -
11 Retail underlying - - - - - - - - - - - - - - - - -
12 Wholesale - - - - - - - - - - - - - - - - -
13 Re-securitisation - - - - - - - - - - - - - - - - -

62
Template 28: EU-SEC4 - Securitisation exposures in the non-trading book and associated regulatory capital requirements -
institution acting as investor as of 30.6.2021
(Amounts in millions of Euro)
a b c d e f g h i j k l m n o p q
Exposure values (by RW bands/deductions) Exposure values (by regulatory
approach) RWEA (by regulatory approach) Capital charge after cap
≤20% RW
>20% to 50%
RW
>50% to 100%
RW
>100% to <1250%
RW
1250% RW/ deductions
SEC-IRBA
SEC-ERBA (including
IAA)
SEC-SA
1250%/ deductions
SEC-IRBA
SEC-ERBA (including
IAA)
SEC-SA
1250%/ deductions
SEC-IRBA
SEC-ERBA (including
IAA)
SEC-SA
1250%/ deductions
1 Total exposures - - - 11 - - 11 - - - 130 - - - 10 - -
2 Traditional securitisation - - - 11 - - 11 - - - 130 - - - 10 - -
3 Securitisation - - - 11 - - 11 - - - 130 - - - 10 - -
4 Retail underlying - - - 11 - - 11 - - - 130 - - - 10 - -
5 Of which STS - - - - - - - - - - - - - - - - -
6 Wholesale - - - - - - - - - - - - - - - - -
7 Of which STS - - - - - - - - - - - - - - - - -
8 Re-securitisation - - - - - - - - - - - - - - - - -
9 Synthetic securitisation - - - - - - - - - - - - - - - - -
10 Securitisation - - - - - - - - - - - - - - - - -
11 Retail underlying - - - - - - - - - - - - - - - - -
12 Wholesale - - - - - - - - - - - - - - - - -
13 Re-securitisation - - - - - - - - - - - - - - - - -

Pillar III Disclosures for June 30, 2021 63
Templates EU-SEC5 reflect the exposures in default and credit risk adjustments made during the period
Template 29: EU-SEC5 - Exposures securitised by the institution - Exposures in default and specific
credit risk adjustments 30.6.2021
(Amounts in millions of Euro)
A b c
Exposures securitised by the institution - Institution acts as originator or as sponsor
Total outstanding nominal amount Total amount of specific credit risk adjustments made
during the period
Of which exposures in default
1 Total exposures 22,089 16,776 -
2 Retail (total) 17,832 13,634 -
3 residential mortgage 16,137 12,677 -
4 credit card 748 30 -
5 other retail exposures 947 928 -
6 re-securitisation - - -
7 Wholesale (total) 4,257 3,142 -
8 loans to corporates 3,556 3,009 -
9 commercial mortgage - - -
10 lease and receivables 475 133 -
11 other wholesale 227 - -
12 re-securitisation - - -

Pillar III Disclosures for June 30, 2021 64
7 Counterparty credit risk (CCR)
Counterparty credit risk is the risk of default of a counterparty before the final settlement of all existing
transactions’ cash flows. An economic loss would occur if the portfolio of transactions with the counterparty
has a positive economic value to the Group at the time of counterparty default. According to CRR 575/2013
the term transaction refers to:
Over the counter (OTC) derivative transactions, such as FX or interest rate derivative transactions
Repurchase transactions, securities or commodities lending or borrowing transactions or margin
lending transactions
Long settlement transactions
Alpha Bank Group has the first two types of transactions.
The exposures generating counterparty credit risk are monitored on a daily basis. The Group has set limits
per counterparty group, per counterparty and per product.
In order to reduce counterparty credit risk exposure, Alpha Bank Group uses ISDA (International Swap and
Derivatives Association) and GMRA (Global Master Repurchase Agreement) bilateral contracts for financial
products transactions with financial institutions.
Since 30/06/2021 Alpha Bank Group has adopted the Standardised approach for counterparty credit risk
(SA-CCR), the new methodology for calculating the EAD under CRR II, which is significantly different to its
predecessor, the CEM under the CRR I. The SA-CCR is more risk sensitive compared to the prescribed
approaches under CRR I, thus is expected to provide an EAD value which better reflects the risks to which
Banks are exposed to as a result of derivative transactions.
The tables below present the Group’s counterparty credit exposures, including the impact of netting and
collateral. Current credit exposures consist of the replacement cost of contracts together with potential
future credit exposure.

65
Template 30: EU CCR1 – Analysis of CCR by approach as of 30.6.2021
(Amounts in millions of Euro)
a b c d e f g h
Replacement
cost (RC)
Potential future
exposure (PFE)
EEPE
Alpha used for computing regulatory
exposure value
Exposure value pre-
CRM
Exposure value post-
CRM
Exposure value
RWEA
EU1 EU - Original Exposure Method (for derivatives) - - 1.4 - - - -
EU2 EU - Simplified SA-CCR (for derivatives) - - 1.4 - - - -
1 SA-CCR (for derivatives) 163 144 1.4 431 431 431 207
2 IMM (for derivatives and SFTs) - - - - -
2a Of which securities financing transactions netting sets - - - - -
2b Of which derivatives and long settlement transactions netting sets - - - - -
2c Of which from contractual cross-product netting sets - - - - -
3 Financial collateral simple method (for SFTs) - - - -
4 Financial collateral comprehensive method (for SFTs) 1,430 - - -
5 VaR for SFTs - - - -
6 Total 1,861 431 431 207

Pillar III Disclosures for June 30, 2021 66
According to CRR 575/2013 Article 381, financial institutions are required to calculate the own funds
requirements for Credit Valuation Adjustment (CVA Risk).
The CVA reflects the current market value of the counterparty credit risk to the institution. Own Funds
requirements for CVA risk, are calculated for all derivative transactions with financial institutions all OTC
derivative instruments excluding credit derivatives.
In order to calculate CVA, Alpha Bank incorporates the Standardized methodology according to article 384
of CRR 575/2013.
The most important factors that influence the capital requirements of CVA are the Weight of the
counterparty, the real notional-weighted maturity, the contribution of the exposures to the counterparties as
well as the number of the counterparties of the portfolio.
The following tables present the CVA calculation of the Group:
Template 31a: EU CCR2 – Transactions subject to own funds requirements for CVA risk as of
30.6.2021
(Amounts in millions of Euro)
a b
Exposure value RWEA
1 Total transactions subject to the Advanced method - -
2 (i) VaR component (including the 3× multiplier) -
3 (ii) stressed VaR component (including the 3× multiplier) -
4 Transactions subject to the Standardised method 26 21
EU4 Transactions subject to the Alternative approach (Based on the Original Exposure Method)
- -
5 Total transactions subject to own funds requirements for CVA risk 26 21
Template 31b: EU CCR2 – Transactions subject to own funds requirements for CVA risk as of
31.12.2020
(Amounts in millions of Euro)
a b
Exposure value RWEA
1 Total transactions subject to the Advanced method
2 (i) VaR component (including the 3× multiplier)
3 (ii) stressed VaR component (including the 3× multiplier)
4 Transactions subject to the Standardised method 56 55
EU4 Transactions subject to the Alternative approach (Based on the Original Exposure Method)
5 Total transactions subject to own funds requirements for CVA risk 56 55
The tables below present the Group’s exposures to central counterparties (CCPs) and related capital
requirements.

Pillar III Disclosures for June 30, 2021 67
Template 32a: EU CCR8 – Exposures to CCPs as of 30.6.2021
(Amounts in millions of Euro)
a b
Exposure value RWEA
1 Exposures to QCCPs (total) 1
2 Exposures for trades at QCCPs (excluding initial margin and default fund contributions); of which
39 1
3 (i) OTC derivatives 39 1
4 (ii) Exchange-traded derivatives - -
5 (iii) SFTs - -
6 (iv) Netting sets where cross-product netting has been approved - -
7 Segregated initial margin -
8 Non-segregated initial margin - -
9 Prefunded default fund contributions - -
10 Unfunded default fund contributions - -
11 Exposures to non-QCCPs (total) -
12 Exposures for trades at non-QCCPs (excluding initial margin and default fund contributions); of which
- -
13 (i) OTC derivatives - -
14 (ii) Exchange-traded derivatives - -
15 (iii) SFTs - -
16 (iv) Netting sets where cross-product netting has been approved - -
17 Segregated initial margin -
18 Non-segregated initial margin - -
19 Prefunded default fund contributions - -
20 Unfunded default fund contributions - -
Template 32b: EU CCR8 – Exposures to CCPs as of 31.12.2020
(Amounts in millions of Euro)
a b
Exposure value RWEA
1 Exposures to QCCPs (total) 0
2 Exposures for trades at QCCPs (excluding initial margin and default fund contributions); of which
59 0
3 (i) OTC derivatives 59 0
4 (ii) Exchange-traded derivatives
5 (iii) SFTs
6 (iv) Netting sets where cross-product netting has been approved
7 Segregated initial margin
8 Non-segregated initial margin
9 Prefunded default fund contributions
10 Unfunded default fund contributions
11 Exposures to non-QCCPs (total)
12 Exposures for trades at non-QCCPs (excluding initial margin and default fund contributions); of which
13 (i) OTC derivatives
14 (ii) Exchange-traded derivatives
15 (iii) SFTs
16 (iv) Netting sets where cross-product netting has been approved
17 Segregated initial margin
18 Non-segregated initial margin
19 Prefunded default fund contributions
20 Unfunded default fund contributions
The tables below show the CCR exposures by regulatory portfolio and risk as of 30.6.2021 and 31.12.2020.

68
Template 33a: EU CCR3 – Standardised approach – CCR exposures by regulatory portfolio and risk as of 30.6.2021
(Amounts in millions of Euro)
a b c d e f g h i j k l
Exposure classes
Risk weight Total exposure
value 0% 2% 4% 10% 20% 50% 70% 75% 100% 150% Others
1 Central governments or central banks 23 - - - - - - - - - - 23
2 Regional government or local authorities - - - - - - - - - - - -
3 Public sector entities - - - - - - - - - - - -
4 Multilateral development banks - - - - - - - - - - - -
5 International organisations - - - - - - - - - - - -
6 Institutions 89 39 - - 133 37 - - - - - 298
7 Corporates - - - - - - - - 321 - - 321
8 Retail - - - - - - - 7 - - - 7
9 Institutions and corporates with a short-term credit assessment - - - - - - - - - - - -
10 Other items - - - - - - - - 0 - - 0
11 Total exposure value 112 39 - - 133 37 - 7 321 - - 649
Template 33b: EU CCR3 – Standardised approach – CCR exposures by regulatory portfolio and risk as of 31.12.2020
(Amounts in millions of Euro)
a b c d e f g h i j k l
Exposure classes
Risk weight Total exposure
value 0% 2% 4% 10% 20% 50% 70% 75% 100% 150% Others
1 Central governments or central banks 788 - - - - - - - - - 788
2 Regional government or local authorities
3 Public sector entities
4 Multilateral development banks
5 International organisations
6 Institutions - 59 - - 97 44 - - - 6 205
7 Corporates - - - - - - - - 250 - 250
8 Retail - - - - - - - 1 - - 1
9 Institutions and corporates with a short-term credit assessment
10 Other items
11 Total exposure value 788 59 - - 97 44 - 1 250 6 1,244

69
The following tables provide a breakdown of all types of collateral posted or received to support or reduce CCR exposures related to derivative
transactions or to securities financing transaction (SFTs ) as of 30.6.2021 and 31.12.2020.
Template 34a: EU CCR5 – Composition of collateral for CCR exposures 30.6.2021
(Amounts in millions of Euro)
a b c d e f g h
Collateral used in derivative transactions Collateral used in SFTs
Collateral type
Fair value of collateral received Fair value of posted collateral Fair value of collateral received Fair value of posted collateral
Segregated Unsegregated Segregated Unsegregated Segregated Unsegregated Segregated Unsegregated
1 Cash – domestic currency 28 2 174 1,045 - 4 - 973
2 Cash – other currencies 0 0 2 - - - - 0
3 Domestic sovereign debt - 900 - - - 600 - -
4 Other sovereign debt - - - - - 898 - -
5 Government agency debt - - - - - - - -
6 Corporate bonds - - - - - - - -
7 Equity securities - - - - - - - -
8 Other collateral - - - - - - - -
9 Total 28 902 176 1,045 - 1,503 - 973
Template 34b: EU CCR5 – Composition of collateral for CCR exposures as of 31.12.2020
(Amounts in millions of Euro)
a b c d e f g h
Collateral used in derivative transactions Collateral used in SFTs
Collateral type
Fair value of collateral received Fair value of posted collateral Fair value of collateral received Fair value of posted collateral
Segregated Unsegregated Segregated Unsegregated Segregated Unsegregated Segregated Unsegregated
1 Cash – domestic currency 0 1 170 1,461 - 728 - -
2 Cash – other currencies - - - - - - - -
3 Domestic sovereign debt - 900 - - - 396 - -
4 Other sovereign debt - - - - - 40 - -
5 Government agency debt - - - - - - - -
6 Corporate bonds - - - - - - - -
7 Equity securities - - - - - - - -
8 Other collateral - - - - - - - -
9 Total 0 901 170 1,461 - 1,164 - -

Pillar III Disclosures for June 30, 2021 70
8 Market Risk
Market risk is the risk of reduction in economic value arising from unfavorable changes in the value or
volatility of interest rates, foreign exchange rates, stock exchange indices, equities and commodities.
Market risk management is conducted in accordance with policies and procedures that have been
developed and are implemented by all Group companies.
Alpha Bank calculates Value at Risk (VaR) for internal risk management purposes since 1999. The VaR
methodology applied is historical simulation, using a 99% percentile, one tailed confidence interval, a
historical observation period of 2 years un-weighted data and a 1 and 10–day holding period. 10 day VaR
is calculated with a 10 day horizon and a 1 day fixed step (overlapping periods). Calculation of the value-
at-risk value is performed on a daily basis using full valuation across all risk factors and positions. The
Stressed VaR methodology is based on the current VaR methodology. All risk factors included in the
regulatory VaR model are considered in the Stressed VaR model. The Bank computes the Stressed VaR
measure on a daily basis, to coincide with the VaR periodicity. Currently, the stress period used by the
Bank is January 2016 – December 2016. The selection of the stressed period is based on the assessment
of the most volatile period in recent history.
8.1 IMA approach for market risk
The risk categories covered by Alpha Bank’s regulatory internal model are general risk of equity
instruments, general risk of debt instruments, foreign exchange risk and commodities risk.
The own fund requirements under the IMA at 30.06.2021 are displayed in the following table:
Template 35a: EU MR2-A: Market risk under the internal Model Approach (IMA) as of 30.6.2021
(Amounts in millions of Euro)
a b
RWAs Own funds
requirements
1 VaR (higher of values a and b) 454 36
(a) Previous day’s VaR (VaRt-1) 12
(b) Multiplication factor (mc) x average of previous 60 working days (VaRavg) 36
2 SVaR (higher of values a and b) 883 71
(a) Latest available SVaR (SVaRt-1)) 22
(b) Multiplication factor (ms) x average of previous 60 working days (sVaRavg) 71
3 IRC (higher of values a and b) - -
(a) Most recent IRC measure -
(b) 12 weeks average IRC measure -
4 Comprehensive risk measure (higher of values a, b and c) - -
(a) Most recent risk measure of comprehensive risk measure -
(b) 12 weeks average of comprehensive risk measure -
(c) Comprehensive risk measure Floor -
5 Other - -
6 Total 1,336 107

Pillar III Disclosures for June 30, 2021 71
Template 35b: EU MR2-A: Market risk under the internal Model Approach (IMA) as of 31.12.2020
(Amounts in millions of Euro)
a b
RWAs Own funds
requirements
1 VaR (higher of values a and b) 529 42
(a) Previous day’s VaR (VaRt-1) 11
(b) Multiplication factor (mc) x average of previous 60 working days (VaRavg) 42
2 SVaR (higher of values a and b) 1,030 82
(a) Latest available SVaR (SVaRt-1)) 21
(b) Multiplication factor (ms) x average of previous 60 working days (sVaRavg) 82
3 IRC (higher of values a and b) - -
(a) Most recent IRC measure -
(b) 12 weeks average IRC measure -
4 Comprehensive risk measure (higher of values a, b and c) - -
(a) Most recent risk measure of comprehensive risk measure -
(b) 12 weeks average of comprehensive risk measure -
(c) Comprehensive risk measure Floor -
5 Other - -
6 Total 1,559 125
A flow statement explaining the variations in the market RWAs is displayed in the following table:
Template 36a: EU MR2-B - RWA flow statements of market risk exposures under the IMA as of
30.6.2021
(Amounts in millions of Euro)
a b c d e f g
VaR SVaR IRC Comprehensive
risk measure Other
Total RWAs
Total own funds
requirements
1 RWAs at previous period end 475 919 - - - 1,394 112
1a Regulatory adjustment (2) 332 660 - - - 993 79
1b RWAs at the previous quarter-end (end of the day)
142 259 - - - 401 32
2 Movement in risk levels 7 15 - - - 22 2
3 Model updates/changes - - - - - - -
4 Methodology and policy - - - - - - -
5 Acquisitions and disposals - - - - - - -
6 Foreign exchange movements - - - - - - -
7 Other 1 3 - - - 4 0
8a RWAs at the end of the disclosure period (end of the day)
150 277 - - - 427 34
8b Regulatory adjustment (2) 303 606 - - - 910 73
8 RWAs at the end of the disclosure period 454 883 - - - 1,336 107

Pillar III Disclosures for June 30, 2021 72
Template 36b: EU MR2-B - RWA flow statements of market risk exposures under the IMA as of
31.3.2021
(Amounts in millions of Euro)
a b c d e f g
VaR SVaR IRC Comprehensive
risk measure Other
Total RWAs
Total own funds
requirements
1 RWAs at previous period end 529 1,030 - - - 1,560 125
1a Regulatory adjustment (2) 395 769 - - - 1,164 93
1b RWAs at the previous quarter-end (end of the day)
135 261 - - - 396 32
2 Movement in risk levels 6 7 - - - 13 1
3 Model updates/changes ( 6) ( 10) - - - ( 16) ( 1)
4 Methodology and policy - - - - - -
5 Acquisitions and disposals - - - - - -
6 Foreign exchange movements - - - - - -
7 Other 8 - - - - 8 1
8a RWAs at the end of the disclosure period (end of the day)
142 259 - - - 401 32
8b Regulatory adjustment (2) 332 660 - - - 993 79
8 RWAs at the end of the disclosure period 475 919 - - - 1,394 112
(2) The regulatory adjustment takes into account the Bank’s multiplier in terms of the Internal Model which is embedded in the
calculation of the RWAs.
VaR and SVaR values as estimated during the first semester of 2021for the Bank trading portfolio, including
the FX position due to participations, are given in the following table:

Pillar III Disclosures for June 30, 2021 73
Template 37a: EU MR3 - IMA values for trading portfolios as of 30.6.2021
(Amounts in millions of Euro)
a
30.6.2021
VaR (10 day 99%)
1 Maximum value 12
2 Average value 11
3 Minimum value 10
4 Period end 12
SVaR (10 day 99%)
5 Maximum value 23
6 Average value 21
7 Minimum value 20
8 Period end 22
IRC (99.9%)
9 Maximum value -
10 Average value -
11 Minimum value -
12 Period end -
Comprehensive risk measure (99.9%)
13 Maximum value -
14 Average value -
15 Minimum value -
16 Period end -
Template 37b: EU MR3 - IMA values for trading portfolios as of 31.12.2020
(Amounts in millions of Euro)
a
31.12.2020
VaR (10 day 99%)
1 Maximum value 13
2 Average value 12
3 Minimum value 11
4 Period end 11
SVaR (10 day 99%)
5 Maximum value 24
6 Average value 23
7 Minimum value 21
8 Period end 21
IRC (99.9%)
9 Maximum value -
10 Average value -
11 Minimum value -
12 Period end -
Comprehensive risk measure (99.9%)
13 Maximum value -
14 Average value -
15 Minimum value -
16 Period end -

Pillar III Disclosures for June 30, 2021 74
Additionally, VaR model validation (back testing) is performed on a daily basis. Both actual and hypothetical
back testing is conducted in order to comply with the regulatory requirements. A comparison between the
results of estimates from the regulatory VaR model with both hypothetical and actual trading outcomes is
presented in the following graph:
Table 38: EU MR4 – Comparison of VaR estimates with gains/losses
Alpha Bank Group is in compliance with Bank of Greece requirements regarding the systems and controls
through which the requirement for the provision of accurate and reliable valuation results is satisfied with,
as described in Appendix VII of Directive 2591/20.8.2007.
8.2 Standardised approach for market risk
Capital charges for specific risk on a solo basis are calculated with the Standardized approach. Alpha Bank
Group uses also the Standardized approach for the measurement of market risk exposure and capital
requirements for all its subsidiaries.
The following table summarizes the Group’s capital requirements for market risk per risk factor based on
Standardized approach at 30.06.2021.
-6
-5
-4
-3
-2
-1
0
1
2
3
mio
EU
R
VaR(99%) Total Hypothetical P&L Total Actual P&L

Pillar III Disclosures for June 30, 2021 75
Template 39a: EU MR1 - Market risk under the standardised approach as of 30.6.2021
(Amounts in millions of Euro)
a
RWEAs
Outright products
1 Interest rate risk (general and specific) 0
2 Equity risk (general and specific) 6
3 Foreign exchange risk 9
4 Commodity risk 7
Options
5 Simplified approach -
6 Delta-plus approach 0
7 Scenario approach -
8 Securitisation (specific risk) -
9 Total 22
Template 39b: EU MR1 - Market risk under the standardised approach as of 31.12.2020
(Amounts in millions of Euro)
a
RWEAs
Outright products
1 Interest rate risk (general and specific) -
2 Equity risk (general and specific) 5
3 Foreign exchange risk 2
4 Commodity risk 119
Options
5 Simplified approach -
6 Delta-plus approach 0
7 Scenario approach -
8 Securitisation (specific risk) -
9 Total 127

Pillar III Disclosures for June 30, 2021 76
9 Liquidity Risk
Definition
Liquidity is the risk arising from the Group’s inability to meet its obligations as they become due, or fund
new business, without incurring substantial losses as well as the inability to manage unplanned contraction
or changes in funding sources. Liquidity risk also arises from the Group’s failure to recognize or address
changes in market conditions that affect the ability to liquidate assets quickly and with minimal loss in
value. Liquidity risk is also a Balance Sheet risk, since it may arise from banking book activities.
9.1 Liquidity Coverage Ratio (LCR)
The LCR refers to the proportion of the high-quality liquid assets held by financial institutions, to ensure
their ability to meet their short-term net cash flows, over a 30-day stress period. The LCR became
mandatory on 1 October 2015. The regulatory limit established is 100%.
The Bank monitors and reports the LCR on an individual and on consolidated basis. The LCR disclosures
of the Pillar III report refer to the consolidated figures.
As of June 2021 the Group LCR stood at 169%. The liquidity buffer stood at EUR 9.4 billion on 30.06.2021,
increased by EUR 1.8 billion since 31.03.2021, mainly due to increase of customer deposits by € 1.4 bn.
Net outflows increased by € 390 mn, mainly due to increase of LCR retail and corporate deposit perimeter
by € 2.4 bn.
The following table provides a breakdown of the LCR as of 30 June 2021, in accordance with Article 435
of the Regulation (EU) No 575/2013 and the respective guidelines on LCR disclosure (EBA/GL/2017/01).
The figures are calculated as simple averages of end-of-month observations beginning from June 2020,
following the restoration of the Group LCR.

Pillar III Disclosures for June 30, 2021 77
Template 40: EU LIQ1: Quantitative information of LCR
(Amounts in millions of Euro)
a b c d e f g h
Total unweighted value (average) Total weighted value (average)
EU 1a Quarter ending on (DD Month YYY)
30.6.2021 31.3.2021 31.12.2020 30.9.2020 30.6.2021 31.3.2021 31.12.2020 30.9.2020
EU 1b Number of data points used in the calculation of averages
12 10 7 4 12 10 7 4
HIGH-QUALITY LIQUID ASSETS
1 Total high-quality liquid assets (HQLA)
7,309 7,484 6,602 6,097
CASH - OUTFLOWS
2 Retail deposits and deposits from small business customers, of which:
34,071 34,198 33,175 32,594 1,904 1,922 1,802 1,757
3 Stable deposits 17,922 18,094 17,325 16,930 896 905 866 847
4 Less stable deposits 8,954 9,030 8,251 8,029 1,007 1,016 934 909
5 Unsecured wholesale funding 7,230 7,287 7,253 7,057 3,310 3,338 3,316 3,196
6 Operational deposits (all counterparties) and deposits in networks of cooperative banks
202 205 186 184 50 51 47 46
7 Non-operational deposits (all counterparties)
7,008 7,063 7,035 6,873 3,239 3,268 3,238 3,150
8 Unsecured debt 20 18 31 - 20 18 31 -
9 Secured wholesale funding 45 42 67 70
10 Additional requirements 377 389 378 381 253 254 254 254
11 Outflows related to derivative exposures and other collateral requirements
242 242 242 242 242 242 242 242
12 Outflows related to loss of funding on debt products
- - - - - - - -
13 Credit and liquidity facilities 135 147 136 139 11 12 11 12
14 Other contractual funding obligations
465 471 513 546 433 439 477 510
15 Other contingent funding obligations
7,424 7,400 7,408 7,394 384 382 380 379
16 TOTAL CASH OUTFLOWS 6,329 6,376 6,295 6,166
CASH - INFLOWS
17 Secured lending (e.g. reverse repos)
- - - - - - - -
18 Inflows from fully performing exposures
520 556 594 622 260 278 297 311
19 Other cash inflows 1,784 1,783 1,860 1,898 844 846 902 905
EU-19a
(Difference between total weighted inflows and total weighted outflows arising from transactions in third countries where there are transfer restrictions or which are denominated in non-convertible currencies)
- - - -
EU-19b
(Excess inflows from a related specialised credit institution)
- - - -
20 TOTAL CASH INFLOWS 2,304 2,339 2,454 2,519 1,105 1,124 1,199 1,216
EU-20a
Fully exempt inflows - - - - - - - -
EU-20b
Inflows subject to 90% cap - - - - - - - -
EU-20c
Inflows subject to 75% cap 2,304 2,339 2,454 2,519 1,105 1,124 1,199 1,216
TOTAL ADJUSTED VALUE
EU-21 LIQUIDITY BUFFER 7,309 6,700 6,602 6,097
22 TOTAL NET CASH OUTFLOWS 5,224 4,789 5,097 4,950
23 LIQUIDITY COVERAGE RATIO 140% 128% 129% 123%

Pillar III Disclosures for June 30, 2021 78
9.2 Net Stable Funding Ratio (NSFR)
The NSFR ratio relates the Bank's available stable funding to its required stable funding and it should be
equal to at least 100%. The ratio is calculated in accordance with the Regulation (EU) 2019/876 of the
European Parliament and of the Council and a limit of 100% became binding in June 2021.
Template 41: EU LIQ2: Net Stable Funding Ratio as of 30.6.2021
(Amounts in millions of Euro)
a b c d e
Unweighted value by residual maturity Weighted
value No maturity < 6 months 6 months to < 1yr
≥ 1yr
Available stable funding (ASF) Items
1 Capital items and instruments 5,964 - - 1,000 6,964
2 Own funds 5,964 - - 1,000 6,964
3 Other capital instruments - - - -
4 Retail deposits 34,198 1,394 12 33,201
5 Stable deposits 22,353 773 8 21,978
6 Less stable deposits 11,845 621 4 11,223
7 Wholesale funding: 10,981 191 14,991 18,813
8 Operational deposits 239 - - -
9 Other wholesale funding 10,742 191 14,991 18,813
10 Interdependent liabilities - - - -
11 Other liabilities: - - - - -
12 NSFR derivative liabilities -
13 All other liabilities and capital instruments not included in the above categories
- - - -
14 Total available stable funding (ASF) 58,977
Required stable funding (RSF) Items
15 Total high-quality liquid assets (HQLA) 8,224
EU-15a
Assets encumbered for a residual maturity of one year or more in a cover pool
- - - -
16 Deposits held at other financial institutions for operational purposes
- - - -
17 Performing loans and securities: 4,356 1,906 22,090 23,249
18 Performing securities financing transactions with financial customers collateralised by Level 1 HQLA subject to 0% haircut
- - - -
19 Performing securities financing transactions with financial customer collateralised by other assets and loans and advances to financial institutions
668 13 162 235
20 Performing loans to non- financial corporate clients, loans to retail and small business customers, and loans to sovereigns, and PSEs, of which:
3,375 1,678 16,318 21,925
21 With a risk weight of less than or equal to 35% under the Basel II Standardised Approach for credit risk
111 100 1,103 4,732
22 Performing residential mortgages, of which: 161 153 4,569 -
23 With a risk weight of less than or equal to 35% under the Basel II Standardised Approach for credit risk
124 129 3,810 -

Pillar III Disclosures for June 30, 2021 79
a b c d e
Unweighted value by residual maturity Weighted
value No maturity < 6 months 6 months to < 1yr
≥ 1yr
24 Other loans and securities that are not in default and do not qualify as HQLA, including exchange-traded equities and trade finance on-balance sheet products
152 62 1,042 1,089
25 Interdependent assets - - - -
26 Other assets: 4,773 2,045 20,363 20,846
27 Physical traded commodities - -
28 Assets posted as initial margin for derivative contracts and contributions to default funds of CCPs
- - 102 87
29 NSFR derivative assets 747 747
30 NSFR derivative liabilities before deduction of variation margin posted
1,141 57
31 All other assets not included in the above categories 2,885 157 18,475 19,956
32 Off-balance sheet items
33 Total RSF 52,936
34 Net Stable Funding Ratio (%) 111.41%

Pillar III Disclosures for June 30, 2021 80
10 Appendix
10.1 Appendix I – Own Funds structure
The following table presents the analysis of Own funds structure:
Template 42: EU CC1 - Composition of regulatory own funds
(Amounts in millions of Euro)
a a b
Source based on reference
numbers/letters of the balance sheet under the regulatory scope of
consolidation
30.6.2021 31.12.2020
Common Equity Tier 1 (CET1) capital: instruments and reserves
1 Capital instruments and the related share premium accounts
11,266 11,264
2 Retained earnings ( 3,367) ( 3,459)
3 Accumulated other comprehensive income (and other reserves)
342 319
EU-3a Funds for general banking risk - -
4 Amount of qualifying items referred to in Article 484 (3) CRR and the related share premium accounts subject to phase out from CET1
5 Minority interests (amount allowed in consolidated CET1)
0 0
EU-5a Independently reviewed interim profits net of any foreseeable charge or dividend
- 89
6 Common Equity Tier 1 (CET1) capital before regulatory adjustments
8,241 8,213
Common Equity Tier 1 (CET1) capital: regulatory adjustments
7 Additional value adjustments (negative amount) ( 8) ( 9)
8 Intangible assets (net of related tax liability) (negative amount)
( 314) ( 413) (a)
10
Deferred tax assets that rely on future profitability excluding those arising from temporary differences (net of related tax liability where the conditions in Article 38 (3) CRR are met) (negative amount)
( 49) ( 11) (b)
11 Fair value reserves related to gains or losses on cash flow hedges of financial instruments that are not valued at fair value
216 224
12 Negative amounts resulting from the calculation of expected loss amounts
- -
13 Any increase in equity that results from securitised assets (negative amount)
- -
14 Gains or losses on liabilities valued at fair value resulting from changes in own credit standing
- -
15 Defined-benefit pension fund assets (negative amount)
16 Direct, indirect and synthetic holdings by an institution of own CET1 instruments (negative amount)

Pillar III Disclosures for June 30, 2021 81
a a b
Source based on reference
numbers/letters of the balance sheet under the regulatory scope of
consolidation
30.6.2021 31.12.2020
17
Direct, indirect and synthetic holdings of the CET 1 instruments of financial sector entities where those entities have reciprocal cross holdings with the institution designed to inflate artificially the own funds of the institution (negative amount)
- -
18
Direct, indirect and synthetic holdings by the institution of the CET1 instruments of financial sector entities where the institution does not have a significant investment in those entities (amount above 10% threshold and net of eligible short positions) (negative amount)
- -
19
Direct, indirect and synthetic holdings by the institution of the CET1 instruments of financial sector entities where the institution has a significant investment in those entities (amount above 10% threshold and net of eligible short positions) (negative amount)
- -
EU-20a Exposure amount of the following items which qualify for a RW of 1250%, where the institution opts for the deduction alternative
EU-20b of which: qualifying holdings outside the financial sector (negative amount)
- -
EU-20c of which: securitisation positions (negative amount) - -
EU-20d of which: free deliveries (negative amount) - -
21
Deferred tax assets arising from temporary differences (amount above 10% threshold, net of related tax liability where the conditions in Article 38 (3) CRR are met) (negative amount)
( 1,685) ( 1,433) (b)
22 Amount exceeding the 17,65% threshold (negative amount)
( 85) -
23
of which: direct, indirect and synthetic holdings by the institution of the CET1 instruments of financial sector entities where the institution has a significant investment in those entities
( 13)
25 of which: deferred tax assets arising from temporary differences
( 71) (b)
EU-25a Losses for the current financial year (negative amount) ( 2,336) -
EU-25b
Foreseeable tax charges relating to CET1 items except where the institution suitably adjusts the amount of CET1 items insofar as such tax charges reduce the amount up to which those items may be used to cover risks or losses (negative amount)
-
27 Qualifying AT1 deductions that exceed the AT1 items of the institution (negative amount)
- -
27a Other regulatory adjustments 895 1,257
28 Total regulatory adjustments to Common Equity Tier 1 (CET1)
( 3,364) ( 386)
29 Common Equity Tier 1 (CET1) capital 4,877 7,827
Additional Tier 1 (AT1) capital: instruments

Pillar III Disclosures for June 30, 2021 82
a a b
Source based on reference
numbers/letters of the balance sheet under the regulatory scope of
consolidation
30.6.2021 31.12.2020
30 Capital instruments and the related share premium accounts
31 of which: classified as equity under applicable accounting standards
32 of which: classified as liabilities under applicable accounting standards
33
Amount of qualifying items referred to in Article 484 (4) CRR and the related share premium accounts subject to phase out from AT1 as described in Article 486(3) CRR
1 3 (d)
EU-33a Amount of qualifying items referred to in Article 494a(1) CRR subject to phase out from AT1
EU-33b Amount of qualifying items referred to in Article 494b(1) CRR subject to phase out from AT1
34 Qualifying Tier 1 capital included in consolidated AT1 capital (including minority interests not included in row 5) issued by subsidiaries and held by third parties
35 of which: instruments issued by subsidiaries subject to phase out
36 Additional Tier 1 (AT1) capital before regulatory adjustments
1 3
Additional Tier 1 (AT1) capital: regulatory adjustments
37 Direct, indirect and synthetic holdings by an institution of own AT1 instruments (negative amount)
38
Direct, indirect and synthetic holdings of the AT1 instruments of financial sector entities where those entities have reciprocal cross holdings with the institution designed to inflate artificially the own funds of the institution (negative amount)
- -
39
Direct, indirect and synthetic holdings of the AT1 instruments of financial sector entities where the institution does not have a significant investment in those entities (amount above 10% threshold and net of eligible short positions) (negative amount)
- -
40
Direct, indirect and synthetic holdings by the institution of the AT1 instruments of financial sector entities where the institution has a significant investment in those entities (net of eligible short positions) (negative amount)
- -
42 Qualifying T2 deductions that exceed the T2 items of the institution (negative amount)
42a Other regulatory adjustments to AT1 capital
43 Total regulatory adjustments to Additional Tier 1 (AT1) capital
- -
44 Additional Tier 1 (AT1) capital 1 3
45 Tier 1 capital (T1 = CET1 + AT1) 4,878 7,830
Tier 2 (T2) capital: instruments
46 Capital instruments and the related share premium accounts
1,015 515 (c) (d)

Pillar III Disclosures for June 30, 2021 83
a a b
Source based on reference
numbers/letters of the balance sheet under the regulatory scope of
consolidation
30.6.2021 31.12.2020
47 Amount of qualifying items referred to in Article 484 (5) CRR and the related share premium accounts subject to phase out from T2 as described in Article 486(4) CRR
( 1) ( 3) (d)
EU-47a Amount of qualifying items referred to in Article 494a (2) CRR subject to phase out from T2
- -
EU-47b Amount of qualifying items referred to in Article 494b (2) CRR subject to phase out from T2
- -
48
Qualifying own funds instruments included in consolidated T2 capital (including minority interests and AT1 instruments not included in rows 5 or 34) issued by subsidiaries and held by third parties
49 of which: instruments issued by subsidiaries subject to phase out
50 Credit risk adjustments - -
51 Tier 2 (T2) capital before regulatory adjustments 1,013 512
Tier 2 (T2) capital: regulatory adjustments
52 Direct, indirect and synthetic holdings by an institution of own T2 instruments and subordinated loans (negative amount)
53
Direct, indirect and synthetic goldings of the T2 instruments and subordinated loans of financial sector entities where those entities have reciprocal cross holdings with the institution designed to inflate artificially the own funds of the institution (negative amount)
- -
54
Direct, indirect and synthetic holdings of the T2 instruments and subordinated loans of financial sector entities where the institution does not have a significant investment in those entities (amount above 10% threshold and net of eligible short positions) (negative amount)
- -
55
Direct, indirect and synthetic holdings by the institution of the T2 instruments and subordinated loans of financial sector entities where the institution has a significant investment in those entities (net of eligible short positions) (negative amount)
- -
EU-56a Qualifying eligible liabilities deductions that exceed the eligible liabilities items of the institution (negative amount)
-
EU-56b Other regulatory adjustments to T2 capital
57 Total regulatory adjustments to Tier 2 (T2) capital - -
58 Tier 2 (T2) capital 1,013 512
59 Total capital (TC = T1 + T2) 5,892 8,342
60 Total Risk exposure amount 38,109 45,369
Capital ratios and buffers
61 Common Equity Tier 1 (as a percentage of total risk exposure amount)
12.8% 17.3%

Pillar III Disclosures for June 30, 2021 84
a a b
Source based on reference
numbers/letters of the balance sheet under the regulatory scope of
consolidation
30.6.2021 31.12.2020
62 Tier 1 (as a percentage of total risk exposure amount) 12.8% 17.3%
63 Total capital (as a percentage of total risk exposure amount)
15.5% 18.4%
64
Institution CET1 overall capital requirement (CET1 requirement in accordance with Article 92 (1) CRR, plus additional CET1 requirement which the institution is required to hold in accordance with point (a) of Article 104(1) CRD, plus combined buffer requirement in accordance with Article 128(6) CRD) expressed as a percentage of risk exposure amount)
9.19% 9.19%
65 of which: capital conservation buffer requirement 2.50% 2.50%
66 of which: countercyclical buffer requirement 0.00% 0.00%
67 of which: systemic risk buffer requirement 0.00% 0.00%
EU-67a of which: Global Systemically Important Institution (G-SII) or Other Systemically Important Institution (O-SII) buffer
0.50% 0.50%
EU-67b of which: additional own funds requirements to address the risks other than the risk of excessive leverage
1.69% 1.69%
68 Common Equity Tier 1 available to meet buffers (as a percentage of risk exposure amount)
4.55% 9.00%
Amounts below the thresholds for deduction (before risk weighting)
72
Direct and indirect holdings of own funds and eligible liabilities of financial sector entities where the institution does not have a significant investment in those entities (amount below 10% threshold and net of eligible short positions)
23 21
73
Direct and indirect holdings by the institution of the CET1 instruments of financial sector entities where the institution has a significant investment in those entities (amount below 17.65% thresholds and net of eligible short positions)
94 68
75
Deferred tax assets arising from temporary differences (amount below 17,65% threshold, net of related tax liability where the conditions in Article 38 (3) CRR are met)
504 800
Applicable caps on the inclusion of provisions in Tier 2
76 Credit risk adjustments included in T2 in respect of exposures subject to standardised approach (prior to the application of the cap)
- -
77 Cap on inclusion of credit risk adjustments in T2 under standardised approach
- -
78 Credit risk adjustments included in T2 in respect of exposures subject to internal ratings-based approach (prior to the application of the cap)

Pillar III Disclosures for June 30, 2021 85
a a b
Source based on reference
numbers/letters of the balance sheet under the regulatory scope of
consolidation
30.6.2021 31.12.2020
79 Cap for inclusion of credit risk adjustments in T2 under internal ratings-based approach
- -
Capital instruments subject to phase-out arrangements (only applicable between 1 Jan 2014 and 1 Jan 2022)
80 Current cap on CET1 instruments subject to phase out arrangements
- -
81 Amount excluded from CET1 due to cap (excess over cap after redemptions and maturities)
- -
82 Current cap on AT1 instruments subject to phase out arrangements
- -
83 Amount excluded from AT1 due to cap (excess over cap after redemptions and maturities)
- -
84 Current cap on T2 instruments subject to phase out arrangements
- -
85 Amount excluded from T2 due to cap (excess over cap after redemptions and maturities)
- -


