ALMA observations of the nearby AGB star L2 Puppis - I ... · This spectacular evolution will...
17
A&A 596, A92 (2016) DOI: 10.1051/0004-6361/201629877 c ESO 2016 Astronomy & Astrophysics ALMA observations of the nearby AGB star L 2 Puppis I. Mass of the central star and detection of a candidate planet P. Kervella 1, 2 , W. Homan 3 , A. M. S. Richards 4 , L. Decin 3 , I. McDonald 4 , M. Montargès 5 , and K. Ohnaka 6 1 Unidad Mixta Internacional Franco-Chilena de Astronomía (CNRS UMI 3386), Departamento de Astronomía, Universidad de Chile, Camino El Observatorio 1515, Las Condes, Santiago, Chile e-mail: [email protected]. 2 LESIA (UMR 8109), Observatoire de Paris, PSL Research University, CNRS, UPMC, Univ. Paris-Diderot, 5 place Jules Janssen, 92195 Meudon, France e-mail: [email protected]. 3 Institute of Astronomy, KU Leuven, Celestijnenlaan 200D B2401, 3001 Leuven, Belgium 4 JBCA, Department Physics and Astronomy, University of Manchester, Manchester M13 9PL, UK 5 Institut de Radioastronomie Millimétrique, 300 rue de la Piscine, 38406 Saint-Martin d’Hères, France 6 Universidad Católica del Norte, Instituto de Astronomía, Avenida Angamos 0610, 1280 Casilla, Antofagasta, Chile Received 11 October 2016 / Accepted 27 October 2016 ABSTRACT Six billion years from now, while evolving on the asymptotic giant branch (AGB), the Sun will metamorphose from a red giant into a beautiful planetary nebula. This spectacular evolution will impact the solar system planets, but observational confirmations of the predictions of evolution models are still elusive as no planet orbiting an AGB star has yet been discovered. The nearby AGB red giant L 2 Puppis (d = 64 pc) is surrounded by an almost edge-on circumstellar dust disk. We report new observations with ALMA at very high angular resolution (18 × 15 mas) in band 7 (ν ≈ 350 GHz) that allow us to resolve the velocity profile of the molecular disk. We establish that the gas velocity profile is Keplerian within the central cavity of the dust disk, allowing us to derive the mass of the central star L 2 Pup A, m A = 0.659 ± 0.011 ± 0.041 M (±6.6%). From evolutionary models, we determine that L 2 Pup A had a near-solar main-sequence mass, and is therefore a close analog of the future Sun in 5 to 6 Gyr. The continuum map reveals a secondary source (B) at a radius of 2 AU contributing f B / f A = 1.3 ± 0.1% of the flux of the AGB star. L 2 Pup B is also detected in CO emission lines at a radial velocity of v B = 12.2 ± 1.0 km s -1 . The close coincidence of the center of rotation of the gaseous disk with the position of the continuum emission from the AGB star allows us to constrain the mass of the companion to m B = 12 ± 16 M Jup .L 2 Pup B is most likely a planet or low-mass brown dwarf with an orbital period of about five years. Its continuum brightness and molecular emission suggest that it may be surrounded by an extended molecular atmosphere or an accretion disk. L 2 Pup therefore emerges as a promising vantage point on the distant future of our solar system. Key words. stars: individual: HD 56096 – stars: AGB and post-AGB – circumstellar matter – techniques: high angular resolution – planetary systems – planets and satellites: detection 1. Introduction Planets are ubiquitous at all stages of stellar evolution: from young stellar objects (David et al. 2016), main-sequence stars (Mayor & Queloz 1995; Borucki et al. 2010), red giants (Grunblatt et al. 2016), up to white dwarfs and neutron stars (Wolszczan 1994; Sigurdsson et al. 2003; Maxted et al. 2006). The asymptotic giant branch (AGB) designates the brief phase of the evolution of low- and intermediate-mass stars during which they metamorphose from red giants into compact stellar remnants, experiencing intense mass loss and extreme changes in their brightness and temperature. This directly affects their planetary systems, in the most dramatic way since their forma- tion. Their fate during the final stellar evolution stages has been the subject of several recent works (Veras 2016b; Staff et al. 2016; Veras & Wyatt 2012; Schröder & Connon Smith 2008; Villaver & Livio 2007; see also the review by Veras 2016a). However, as AGB star planets are embedded in complex circum- stellar envelopes and are vastly outshone by their parent star, the observation of this critical phase presents considerable and yet unsolved challenges. As a result, there currently exists only in- direct evidence of planets orbiting AGB stars (Wiesemeyer et al. 2009). At a distance of 64 ± 4 pc (π = 15.61 ± 0.99 mas, van Leeuwen 2007) L 2 Puppis (HD 56096, HIP 34922, HR 2748, 2MASS J07133229-4438233) is the second nearest AGB star behind R Doradus (π = 18.31 ± 0.99 mas), and it is ≈30% closer than Mira. L 2 Pup is a semi-regular pulsating vari- able (P ≈ 140 days, Kholopov et al. 1985; Bedding et al. 2005). An asymmetric resolved environment around L 2 Pup was first identified by Ireland et al. (2004) using aperture masking in the optical and near-infrared. Kervella et al. (2014) observed L 2 Pup in 2013 using the VLT/NACO adaptive optics (AO) between 1.0 and 4.0 μm, detecting an edge-on circumstellar dust disk. As the scattering of the stellar light by the dust is more efficient at shorter wavelengths, the central source appeared obscured by a dark band up to λ ≈ 1.2 μm( J band). At longer wave- lengths, the scattering becomes less efficient and the transparent dust lets the thermal emission from the hot (≈1000 K) inner rim of the dust disk pass. In the L band (λ = 4 μm), the thermal Article published by EDP Sciences A92, page 1 of 17
Transcript of ALMA observations of the nearby AGB star L2 Puppis - I ... · This spectacular evolution will...

A&A 596, A92 (2016)DOI: 10.1051/0004-6361/201629877c© ESO 2016
Astronomy&Astrophysics
ALMA observations of the nearby AGB star L2 Puppis
I. Mass of the central star and detection of a candidate planet
P. Kervella1, 2, W. Homan3, A. M. S. Richards4, L. Decin3, I. McDonald4, M. Montargès5, and K. Ohnaka6
1 Unidad Mixta Internacional Franco-Chilena de Astronomía (CNRS UMI 3386), Departamento de Astronomía,Universidad de Chile, Camino El Observatorio 1515, Las Condes, Santiago, Chilee-mail: [email protected].
2 LESIA (UMR 8109), Observatoire de Paris, PSL Research University, CNRS, UPMC, Univ. Paris-Diderot, 5 place Jules Janssen,92195 Meudon, Francee-mail: [email protected].
3 Institute of Astronomy, KU Leuven, Celestijnenlaan 200D B2401, 3001 Leuven, Belgium4 JBCA, Department Physics and Astronomy, University of Manchester, Manchester M13 9PL, UK5 Institut de Radioastronomie Millimétrique, 300 rue de la Piscine, 38406 Saint-Martin d’Hères, France6 Universidad Católica del Norte, Instituto de Astronomía, Avenida Angamos 0610, 1280 Casilla, Antofagasta, Chile
Received 11 October 2016 / Accepted 27 October 2016
ABSTRACT
Six billion years from now, while evolving on the asymptotic giant branch (AGB), the Sun will metamorphose from a red giant intoa beautiful planetary nebula. This spectacular evolution will impact the solar system planets, but observational confirmations of thepredictions of evolution models are still elusive as no planet orbiting an AGB star has yet been discovered. The nearby AGB red giantL2 Puppis (d = 64 pc) is surrounded by an almost edge-on circumstellar dust disk. We report new observations with ALMA at veryhigh angular resolution (18 × 15 mas) in band 7 (ν ≈ 350 GHz) that allow us to resolve the velocity profile of the molecular disk.We establish that the gas velocity profile is Keplerian within the central cavity of the dust disk, allowing us to derive the mass ofthe central star L2 Pup A, mA = 0.659 ± 0.011 ± 0.041 M� (±6.6%). From evolutionary models, we determine that L2 Pup A had anear-solar main-sequence mass, and is therefore a close analog of the future Sun in 5 to 6 Gyr. The continuum map reveals a secondarysource (B) at a radius of 2 AU contributing fB/ fA = 1.3 ± 0.1% of the flux of the AGB star. L2 Pup B is also detected in CO emissionlines at a radial velocity of vB = 12.2±1.0 km s−1. The close coincidence of the center of rotation of the gaseous disk with the positionof the continuum emission from the AGB star allows us to constrain the mass of the companion to mB = 12 ± 16 MJup. L2 Pup Bis most likely a planet or low-mass brown dwarf with an orbital period of about five years. Its continuum brightness and molecularemission suggest that it may be surrounded by an extended molecular atmosphere or an accretion disk. L2 Pup therefore emerges as apromising vantage point on the distant future of our solar system.
Key words. stars: individual: HD 56096 – stars: AGB and post-AGB – circumstellar matter – techniques: high angular resolution –planetary systems – planets and satellites: detection
1. Introduction
Planets are ubiquitous at all stages of stellar evolution:from young stellar objects (David et al. 2016), main-sequencestars (Mayor & Queloz 1995; Borucki et al. 2010), red giants(Grunblatt et al. 2016), up to white dwarfs and neutron stars(Wolszczan 1994; Sigurdsson et al. 2003; Maxted et al. 2006).The asymptotic giant branch (AGB) designates the brief phaseof the evolution of low- and intermediate-mass stars duringwhich they metamorphose from red giants into compact stellarremnants, experiencing intense mass loss and extreme changesin their brightness and temperature. This directly affects theirplanetary systems, in the most dramatic way since their forma-tion. Their fate during the final stellar evolution stages has beenthe subject of several recent works (Veras 2016b; Staff et al.2016; Veras & Wyatt 2012; Schröder & Connon Smith 2008;Villaver & Livio 2007; see also the review by Veras 2016a).However, as AGB star planets are embedded in complex circum-stellar envelopes and are vastly outshone by their parent star, theobservation of this critical phase presents considerable and yet
unsolved challenges. As a result, there currently exists only in-direct evidence of planets orbiting AGB stars (Wiesemeyer et al.2009).
At a distance of 64 ± 4 pc (π = 15.61 ± 0.99 mas,van Leeuwen 2007) L2 Puppis (HD 56096, HIP 34922,HR 2748, 2MASS J07133229-4438233) is the second nearestAGB star behind R Doradus (π = 18.31 ± 0.99 mas), and it is≈30% closer than Mira. L2 Pup is a semi-regular pulsating vari-able (P ≈ 140 days, Kholopov et al. 1985; Bedding et al. 2005).An asymmetric resolved environment around L2 Pup was firstidentified by Ireland et al. (2004) using aperture masking in theoptical and near-infrared. Kervella et al. (2014) observed L2 Pupin 2013 using the VLT/NACO adaptive optics (AO) between 1.0and 4.0 µm, detecting an edge-on circumstellar dust disk. Asthe scattering of the stellar light by the dust is more efficientat shorter wavelengths, the central source appeared obscuredby a dark band up to λ ≈ 1.2 µm (J band). At longer wave-lengths, the scattering becomes less efficient and the transparentdust lets the thermal emission from the hot (≈1000 K) inner rimof the dust disk pass. In the L band (λ = 4 µm), the thermal
Article published by EDP Sciences A92, page 1 of 17

A&A 596, A92 (2016)
Table 1. Selected ALMA spectral windows (spw).
Baseband Objective Rest ν Sky ν Number of Channel width spw width Velocity res.(GHz) (GHz) channels (MHz) (MHz) (km s−1)
1 12CO 345.79599 345.75793 3840 0.122073 469 0.106
2 29SiO 342.98085 342.94309 960 0.488292 469 0.427HC15N 344.20011 344.16222 480 0.488292 234 0.426
3 13CO 330.58797 330.55158 1920 0.244146 469 0.2224 Continuum 331.60000 331.56350 128 15.625350 2000 14.136
Notes. The sky frequencies assume a source radial velocity of v = 33.0 km s−1.
emission from a loop extending to ≈10 AU was also observed.From NACO aperture masking and long-baseline interferome-try, Lykou et al. (2015a,b) and Ohnaka et al. (2015) confirmedthe overall geometry and extension of the disk. Kervella et al.(2015) identified the polarimetric signature of the circumstellardisk and detected bipolar “hourglass” cones in L2 Pup’s enve-lope using the VLT/SPHERE AO imaging polarimeter. They alsodiscovered streamers in the bipolar cones and two thin, tightlycollimated plumes. These structures make L2 Pup a promisingcandidate for hosting a low-mass companion, as circumstellardisks and bipolar cones are classically predicted by hydrody-namical models of binary objects (Nordhaus & Blackman 2006).Chen et al. (2016) presented the results of a 3D hydrodynamicalsimulation of L2 Pup as a binary object that reproduces the spec-tral energy distribution and morphology of the disk.
Knowing the mass of the central star in L2 Pup is essen-tial to constrain its age and evolutionary state. Indirect esti-mates vary considerably in the literature: from 0.5 ± 0.2 M� byOhnaka (2014), 0.7 M� by Lykou et al. (2015a), and 1.7 M� byDumm & Schild (1998) to 2 M� by Kervella et al. (2014). Withthe goal of precisely determining the mass of the AGB star, weobtained very high angular resolution observations in ALMA’sband 7 (330−360 GHz), covering several molecular lines and thecontinuum (Sect. 2). The simultaneous high spatial and spectralresolution provided by ALMA allows us to map the kinematicsof its molecular envelope and derive its mass (Sect. 3). We alsodetect a secondary source located at a projected separation of2 AU from the primary. We discuss the evolutionary state of theAGB star and the nature of the companion source in Sect. 4.
2. Observations and data reduction
L2 Pup was observed on 5 November 2015 at UT 08:39:25(epoch 2015.8448, MJD = 57 331.361) by ALMA for projectcode 2015.1.00141.S. Forty-five antennas were present for mostof the observations, providing baselines from 0.09 to 16 km andresulting in an angular resolution better than 15 mas. The cover-age of the (u, v) plane inside 350 m is sparse, giving a maximumangular scale of about 200 mas for reliable imaging, which isa good match to the extension of the disk surrounding L2 Pup.The total field of view to the half-power primary beam is ap-proximately 15′′. The observations used spectral windows (spw)placed as described in Table 1. Two identical executions of thehigh-resolution band 7 science goal were performed in succes-sion. The observing frequency of each spw, corrected for theEarth’s motion with respect to the Local Standard of Rest (LSR)and the VLSR of L2 Pup (33.0 km s−1) was calculated for thestart of each execution and then held fixed. The target was ob-served for a total of 84 min, alternating with the phase referencewith a cadence of 90 s/18 s; the total cycle time was 2−3 min
allowing for system temperature and water vapor radiometrymeasurements and occasional scans on the check source. Theprecipitable water vapor was very low during observations, at0.40−0.45 mm. Standard human-steered ALMA data reductionscripts were used (Schnee et al. 2014). The main stages are to ap-ply the instrumental calibration, to flag edge channels and otherbad data, and to use the astrophysical calibrators to derive thebandpass corrections, flux scale and time-dependent phase andamplitude corrections. These were applied to L2 Pup and to thecheck source.
The compact QSOs J0538-4405, J0701-4634 and J0726-4728 were used to establish the flux scale and derive band-pass corrections as the phase reference source and as the checksource, respectively. L2 Pup and J0726-4728 have separationsof 2.85◦ and 4.33◦ from the phase-reference J0701-4634.The flux density of J0538-4405 was taken as 1.04488 Jy at338.994438 GHz, spectral index −0.596, based on fortnightlyALMA flux monitoring derived from planetary standards, with5% accuracy at band 7 frequency. The derived flux densitiesof J0701-4634 and J0726-4728 were 0.396 ± 0.002 Jy and0.145± 0.007 Jy. Assuming that the flux scale transfer to L2 Pupis of similar accuracy to that of the check source, the overall fluxscale accuracy is 7%.
After applying the phase-reference and other calibrations toL2 Pup, the corrected target data were split out and each spec-tral window adjusted to fixed velocity with respect to the LSR.Obvious spectral lines were identified in the visibility data, leav-ing 2.5 GHz of line-free continuum. A copy of the data with allchannels averaged to the coarsest resolution was made to speedup continuum imaging. The continuum image (made with natu-ral weighting) has a synthesized beam size 17.7 × 14.5 mas atposition angle (PA) 73◦.
The position of the continuum peak was located at α =07:13:32.47687, δ = −44:38:17.8443 with an absolute positionuncertainty of ±7 mas. The clean components of this image wereused as a model for phase self-calibration, and iterative cyclesof phase and amplitude self-calibration were performed. Multi-frequency synthesis was used with a linear position-dependentspectral index as a free parameter; although the spectral index isnot reliable except for the brightest emission over the relativelynarrow, unevenly sampled bandwidth, this improves the imagefidelity. A 2.5 mas pixel size and a field of view of 2.56′′ wereused for all images unless otherwise stated.
3. Analysis
3.1. Continuum emission
The ALMA continuum emission map at ν = 338 ± 16 GHz(Fig. 1, left panel) shows thermal emission from the AGB star
A92, page 2 of 17

P. Kervella et al.: Mass and candidate planet of L2 Pup from ALMA
Fig. 1. Left panel: continuum emission from L2 Pup at ν = 338 ± 16 GHz. Right panel: PSF-subtracted continuum emission map. The colorscales are a function of the square root of the intensity in mJy beam−1 km s−1. The white cross marks the position of the secondary source in thePSF-subtracted ALMA image. The triangular symbols are pointers to the inner rim of the dust disk (6 AU, magenta) and of the secondary sourcedetected in the visible by Kervella et al. (2015; cyan), shifted by −0.1′′ in declination. The position of source B from ALMA is marked with awhite cross, and the size of the photosphere of the star is shown as a white circle. The 17.7× 14.5 mas beam is represented in the lower left cornerof the images.
and the dust disk at a resolution corresponding to 0.9 AUat L2 Pup. The east-west elongation of the diffuse emissionis consistent with the major axis of the dust disk observedby Kervella et al. (2014, 2015), Lykou et al. (2015a,b), andOhnaka et al. (2015) at infrared and visible wavelengths. Thevisible image of L2 Pup from Kervella et al. (2015) is shown inFig. 2 at the same scale as the ALMA maps for comparison.
3.1.1. Flux from L2 Pup A
The total flux density at the location of the AGB star includingthe contribution from the dust thermal emission is: fA + fdust =78.6 ± 0.03 mJy beam−1. We estimate the dust emission at thelocation of the AGB star from the mean continuum flux mea-sured in the disk plane away from the stellar emission peak, aswas done by Kervella et al. (2014) in the infrared. We obtainfdust = 1.4 mJy beam−1, for which we adopt an arbitrary un-certainty of ±0.3 mJy beam−1 to account for possible variationsin the local dust emission over the disk. The flux from L2 Pup Ais then
fA = 77.2 ± 0.3 mJy beam−1. (1)
The angular diameter of the photosphere of L2 Pup A has beenmeasured by Kervella et al. (2014) using near-infrared interfer-ometry at θLD = 17.9 ± 1.6 mas (see also Ohnaka et al. 2015).The major axis of the central source in the ALMA continuummap is 20.8 mas at a position angle of 51◦ (N = 0◦, E = 90◦,and the minor axis 18.9 mas. These values are slightly higherthan the ALMA beam size (17.7 × 14.5 mas at PA = 73◦) andconsistent with a partial resolution of the stellar photosphere.
As a consistency check, we verified that the measured fluxfrom the central AGB star fA is close to the emission of f =92 mJy expected for a blackbody at Teff = 3500 K and with anangular diameter of θ = 18 mas. The AAVSO light curve1 of
1 https://www.aavso.org
Fig. 2. Visible image of L2 Pup from Kervella et al. (2015) for compar-ison with the ALMA maps, at the same scale. The beam size is repre-sented by the ellipse in the lower left corner of the image. The radiusof the inner rim (6 AU) and the radius of the companion of L2 Pup areshown with magenta and cyan triangles, respectively.
L2 Pup at visible wavelengths presented in Fig. 3 shows that ourALMA observations were obtained approximately one monthafter the expected maximum light, during the decreasing fluxphase of the cycle of L2 Pup. During this phase, the star is coolerand fainter, which could explain part of the 20% flux deficit com-pared to the expected value. The photometric curve also showsthat L2 Pup went through a particularly long minimum aroundmV = 8.0 during the second half of 2015, including during ourALMA observations. The deficit in flux could also be enhanced
A92, page 3 of 17

A&A 596, A92 (2016)
5.5
6.5
7.5
8.5
9.556800 56900 57000 57100 57200 57300 57400 57500 57600 57700
Mag
nitu
de
Visual
V band
ALMA
SPHERE
Fig. 3. Photometric curve of L2 Pup in the visible from theAAVSO database, from 23 May 2014 to 2 September 2016. The ver-tical color segments represent the epochs of the SPHERE observations(green) by Kervella et al. (2015) and the present ALMA band 7 obser-vation (red).
by this special minimum. The small amplitude peak flux shortlybefore the ALMA epoch could indicate that the obscuration ofthe star by dust became particularly strong and compensated forthe increase in flux of the AGB star. The regular pulsational vari-ability resumed in early 2016, although with a smaller amplitudethan in 2014.
3.1.2. Secondary source L2 Pup B
As shown in Fig. 1 (left panel), the west wing (to the right ofthe image) of the disk emission appears brighter than the eastside. To isolate this asymmetry, we estimated the contribution ofthe central star by fitting a two-dimensional elliptical Gaussianto the central source and we subtracted it from the continuumimage. The result of the PSF subtraction is presented in the rightpanel of Fig. 1. The red wing of the disk (West) clearly gen-erates significantly more flux than the blue wing. A secondarysource (hereafter source B, or L2 Pup B) is observed in the sub-tracted image at a relative position of ∆α = −30.0± 2.5 mas and∆δ = −6.0± 2.5 mas with respect to the central object. Source Bappears superimposed on the emission from the disk, and is un-resolved angularly. The observed position corresponds to a pro-jected separation of ρ = 30.6 ± 2.5 mas, which is equivalentto a linear radius of R0 = 1.96 ± 0.16 AU. The relative posi-tion of source B with respect to A is closely coincident with thatof the companion detected by Kervella et al. (2015) at visiblewavelengths.
The flux density at the location of source B is f = 2.33 ±0.05 mJy beam−1. The uncertainty takes into account the stan-dard deviation of the background noise of the reconstructed im-age and of the PSF subtraction. As for L2 Pup A, the measuredflux includes the emission from B plus the thermal emission ofthe surrounding dust. We estimate the dust contribution from apoint in the disk located symmetrically to B with respect to thecentral star, where we find fdust = 1.34 ± 0.10 mJy beam−1. Theerror bar includes a provision for a possible variability in the lo-cal dust emission in the disk. The net flux from source B is then
fB = 0.99 ± 0.11 mJy beam−1, (2)
and the flux contrast between sources A and B at ν = 338 GHz(λ = 887 µm) is
fB/ fA = 1.28 ± 0.13%. (3)
This relative flux is considerable in absolute terms because ofthe very high brightness of the AGB star. At visible wave-lengths, the contribution of B is even higher in relative terms,
Fig. 4. Continuum-subtracted channel maps of the 29SiO(3 = 0, J =8−7) line. The field of view is 0.2′′ × 0.2′′, and the indicated velocity isin km s−1.
as Kervella et al. (2015) found fB/ fA[V] = 24 ± 10% in theV band (λ = 554 nm) and fB/ fA[NR] = 19 ± 10% in the NR fil-ter (λ = 646 nm). The flux at visible wavelengths is most likelydominated by scattered light above the disk plane, that biases thecolor toward the blue (where scattering is more efficient). More-over, as a result of inhomogeneities in the dust disk, the flux ofthe central star and source B are potentially affected by differen-tial absorption, which is particularly strong in the visible.
3.2. Molecular emission
We focus our analysis on the gas velocity field as derived fromthe 29SiO(3 = 0, J = 8−7) molecular line (Fig. 4). The moleculardisk is centered on the star (which is visible in the continuumimages presented in Fig. 1). The central dark “hole” is due toline absorption by the molecular gas located in front of the star.We also present in Appendices A to E the images and position-velocity diagrams (PVDs) of the detected 12CO, 13CO, SO2, SOand SiS lines that are also observed at high spectral resolutionand high signal-to-noise ratio in the ALMA data. A summary ofthe detected lines is presented in Table 2.
3.2.1. Position velocity diagrams
We computed PVDs for each emission line from the recon-structed ALMA image cubes using a virtual slit of 20 mas ori-ented in the east-west direction (position angle PA = 90◦ with re-spect to north = 0◦), that is, along the plane of the circumstellardisk. To constrain the value of the central mass from the orbitalmotion of the circumstellar gas, we estimated the maximum ve-locity as a function of the radius. Several techniques have beenemployed in the literature to derive masses from PVD veloci-ties (e.g. Seifried et al. 2016; Murillo et al. 2013). We adoptedthe innovative approach to compute the derivative of the PVDalong the radial direction to determine the radius of maximumvariation slope. Compared to the use of a fixed flux detection
A92, page 4 of 17
P. Kervella et al.: Mass and candidate planet of L2 Pup from ALMA
Table 2. Molecular emission lines detected in L2 Puppis.
Molecule Quantum numbers Sky freq. ν Rest freq. ν0 Upper-statevibrational rotational (GHz) (GHz) energy (K)
Unidentified 330.437 330.47713CO 3 = 0 3−2 330.552 330.588 31.732H2O 32 = 2 3(2, 1)−4(1, 4) 331.08 331.1230SiO? 3 = 3 8−7 331.93 331.97Unidentified 331.99 332.03SO2 3 = 0 21(2, 20)−21(1, 21) 332.055 332.091 219.525SO2 3 = 0 34(3, 31)−34(2, 32) 342.724 342.762 581.91929SiO 3 = 0 8−7 342.943 342.981 74.077SiS 3 = 1 19−18 343.063 343.101 1235.828SO 3Σ 3 = 0 8(8)−7(7) 344.272 344.311 87.48212CO 3 = 0 3−2 345.758 345.796 33.192
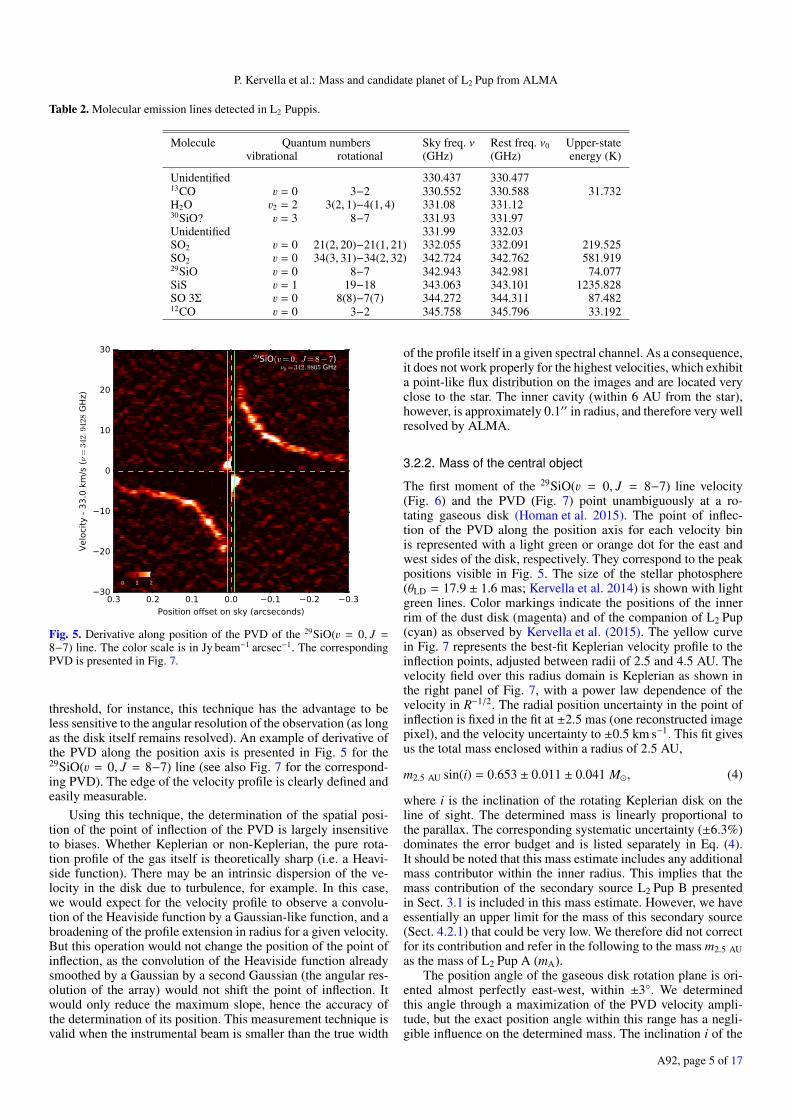
Fig. 5. Derivative along position of the PVD of the 29SiO(3 = 0, J =8−7) line. The color scale is in Jy beam−1 arcsec−1. The correspondingPVD is presented in Fig. 7.
threshold, for instance, this technique has the advantage to beless sensitive to the angular resolution of the observation (as longas the disk itself remains resolved). An example of derivative ofthe PVD along the position axis is presented in Fig. 5 for the29SiO(3 = 0, J = 8−7) line (see also Fig. 7 for the correspond-ing PVD). The edge of the velocity profile is clearly defined andeasily measurable.
Using this technique, the determination of the spatial posi-tion of the point of inflection of the PVD is largely insensitiveto biases. Whether Keplerian or non-Keplerian, the pure rota-tion profile of the gas itself is theoretically sharp (i.e. a Heavi-side function). There may be an intrinsic dispersion of the ve-locity in the disk due to turbulence, for example. In this case,we would expect for the velocity profile to observe a convolu-tion of the Heaviside function by a Gaussian-like function, and abroadening of the profile extension in radius for a given velocity.But this operation would not change the position of the point ofinflection, as the convolution of the Heaviside function alreadysmoothed by a Gaussian by a second Gaussian (the angular res-olution of the array) would not shift the point of inflection. Itwould only reduce the maximum slope, hence the accuracy ofthe determination of its position. This measurement technique isvalid when the instrumental beam is smaller than the true width
of the profile itself in a given spectral channel. As a consequence,it does not work properly for the highest velocities, which exhibita point-like flux distribution on the images and are located veryclose to the star. The inner cavity (within 6 AU from the star),however, is approximately 0.1′′ in radius, and therefore very wellresolved by ALMA.
3.2.2. Mass of the central object
The first moment of the 29SiO(3 = 0, J = 8−7) line velocity(Fig. 6) and the PVD (Fig. 7) point unambiguously at a ro-tating gaseous disk (Homan et al. 2015). The point of inflec-tion of the PVD along the position axis for each velocity binis represented with a light green or orange dot for the east andwest sides of the disk, respectively. They correspond to the peakpositions visible in Fig. 5. The size of the stellar photosphere(θLD = 17.9 ± 1.6 mas; Kervella et al. 2014) is shown with lightgreen lines. Color markings indicate the positions of the innerrim of the dust disk (magenta) and of the companion of L2 Pup(cyan) as observed by Kervella et al. (2015). The yellow curvein Fig. 7 represents the best-fit Keplerian velocity profile to theinflection points, adjusted between radii of 2.5 and 4.5 AU. Thevelocity field over this radius domain is Keplerian as shown inthe right panel of Fig. 7, with a power law dependence of thevelocity in R−1/2. The radial position uncertainty in the point ofinflection is fixed in the fit at ±2.5 mas (one reconstructed imagepixel), and the velocity uncertainty to ±0.5 km s−1. This fit givesus the total mass enclosed within a radius of 2.5 AU,
m2.5 AU sin(i) = 0.653 ± 0.011 ± 0.041 M�, (4)
where i is the inclination of the rotating Keplerian disk on theline of sight. The determined mass is linearly proportional tothe parallax. The corresponding systematic uncertainty (±6.3%)dominates the error budget and is listed separately in Eq. (4).It should be noted that this mass estimate includes any additionalmass contributor within the inner radius. This implies that themass contribution of the secondary source L2 Pup B presentedin Sect. 3.1 is included in this mass estimate. However, we haveessentially an upper limit for the mass of this secondary source(Sect. 4.2.1) that could be very low. We therefore did not correctfor its contribution and refer in the following to the mass m2.5 AUas the mass of L2 Pup A (mA).
The position angle of the gaseous disk rotation plane is ori-ented almost perfectly east-west, within ±3◦. We determinedthis angle through a maximization of the PVD velocity ampli-tude, but the exact position angle within this range has a negli-gible influence on the determined mass. The inclination i of the
A92, page 5 of 17

A&A 596, A92 (2016)
Fig. 6. Left panel: map of the emission from L2 Pup in the 29SiO(3 = 0, J = 8−7) line (left), integrated between radial velocities −30 and +30 km s−1
around the systemic velocity (v0 = 33 km s−1). The pseudo-slit used to compute the position-velocity diagrams is represented with solid whitelines. The linear color scale in Jy beam−1 km s−1 is shown in the lower right corner, and the beam size is represented by the ellipse in the lowerleft corner of the image. The radius of the inner rim (6 AU) and the radius of the companion of L2 Pup are shown with magenta and cyan triangles,respectively. Right panel: map of the first moment emission of the velocity (the color scale is in km s−1). The contours are drawn between 4 and10 km s−1 with a 2 km s−1 step, and the size of the photosphere is shown with a light green disk.
Fig. 7. Position-velocity diagram with Cartesian coordinate axes (left) and with logarithmic coordinates (right) to show the Keplerian and non-Keplerian domains of the disk rotation velocity profile more clearly. The yellow curve is a Keplerian fit to the inner cavity, and the red curve is apower law fit to the non-Keplerian radius domain. The color scale is in mJy beam−1.
circumstellar disk of L2 Pup on the line of sight has been esti-mated by Kervella et al. (2014) to i = 84◦ and slightly revisedby Kervella et al. (2015) to i = 82◦. Ohnaka et al. (2015) alsoconcluded a high inclination from the partial obscuration of thestellar disk by the edge of the dust disk. We therefore adopt avalue of i = 82± 5◦ and obtain the mass enclosed within 2.5 AUin radius, identified as the mass of L2 Pup A,
mA = 0.659 ± 0.043 M� (±6.6%). (5)
3.2.3. Sub-Keplerian disk rotation
Figure 7 shows that the rotation velocity of the gaseous diskchanges from the purely Keplerian regime in the central cavity(v ≈ R−1/2) to a markedly sub-Keplerian regime beyond the innerrim of the dust disk (6 AU). The adjustment of a power law to theobserved profile in the sub-Keplerian domain (6 < R < 20 AU)gives the following radial dependence of the orbital velocity:
v = (40.7 ± 5.5) × R(−0.853±0.059) km s−1 (6)
A92, page 6 of 17
P. Kervella et al.: Mass and candidate planet of L2 Pup from ALMA
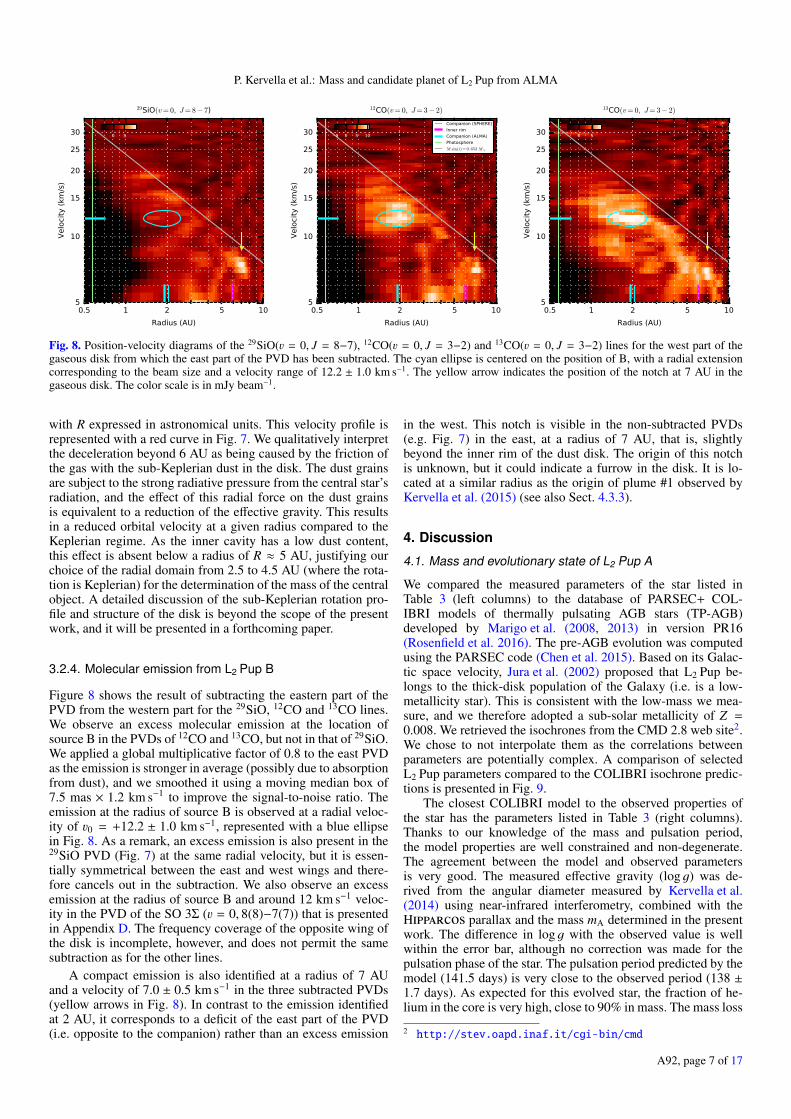
Fig. 8. Position-velocity diagrams of the 29SiO(3 = 0, J = 8−7), 12CO(3 = 0, J = 3−2) and 13CO(3 = 0, J = 3−2) lines for the west part of thegaseous disk from which the east part of the PVD has been subtracted. The cyan ellipse is centered on the position of B, with a radial extensioncorresponding to the beam size and a velocity range of 12.2 ± 1.0 km s−1. The yellow arrow indicates the position of the notch at 7 AU in thegaseous disk. The color scale is in mJy beam−1.
with R expressed in astronomical units. This velocity profile isrepresented with a red curve in Fig. 7. We qualitatively interpretthe deceleration beyond 6 AU as being caused by the friction ofthe gas with the sub-Keplerian dust in the disk. The dust grainsare subject to the strong radiative pressure from the central star’sradiation, and the effect of this radial force on the dust grainsis equivalent to a reduction of the effective gravity. This resultsin a reduced orbital velocity at a given radius compared to theKeplerian regime. As the inner cavity has a low dust content,this effect is absent below a radius of R ≈ 5 AU, justifying ourchoice of the radial domain from 2.5 to 4.5 AU (where the rota-tion is Keplerian) for the determination of the mass of the centralobject. A detailed discussion of the sub-Keplerian rotation pro-file and structure of the disk is beyond the scope of the presentwork, and it will be presented in a forthcoming paper.
3.2.4. Molecular emission from L2 Pup B
Figure 8 shows the result of subtracting the eastern part of thePVD from the western part for the 29SiO, 12CO and 13CO lines.We observe an excess molecular emission at the location ofsource B in the PVDs of 12CO and 13CO, but not in that of 29SiO.We applied a global multiplicative factor of 0.8 to the east PVDas the emission is stronger in average (possibly due to absorptionfrom dust), and we smoothed it using a moving median box of7.5 mas × 1.2 km s−1 to improve the signal-to-noise ratio. Theemission at the radius of source B is observed at a radial veloc-ity of v0 = +12.2 ± 1.0 km s−1, represented with a blue ellipsein Fig. 8. As a remark, an excess emission is also present in the29SiO PVD (Fig. 7) at the same radial velocity, but it is essen-tially symmetrical between the east and west wings and there-fore cancels out in the subtraction. We also observe an excessemission at the radius of source B and around 12 km s−1 veloc-ity in the PVD of the SO 3Σ (3 = 0, 8(8)−7(7)) that is presentedin Appendix D. The frequency coverage of the opposite wing ofthe disk is incomplete, however, and does not permit the samesubtraction as for the other lines.
A compact emission is also identified at a radius of 7 AUand a velocity of 7.0 ± 0.5 km s−1 in the three subtracted PVDs(yellow arrows in Fig. 8). In contrast to the emission identifiedat 2 AU, it corresponds to a deficit of the east part of the PVD(i.e. opposite to the companion) rather than an excess emission
in the west. This notch is visible in the non-subtracted PVDs(e.g. Fig. 7) in the east, at a radius of 7 AU, that is, slightlybeyond the inner rim of the dust disk. The origin of this notchis unknown, but it could indicate a furrow in the disk. It is lo-cated at a similar radius as the origin of plume #1 observed byKervella et al. (2015) (see also Sect. 4.3.3).
4. Discussion
4.1. Mass and evolutionary state of L2 Pup A
We compared the measured parameters of the star listed inTable 3 (left columns) to the database of PARSEC+ COL-IBRI models of thermally pulsating AGB stars (TP-AGB)developed by Marigo et al. (2008, 2013) in version PR16(Rosenfield et al. 2016). The pre-AGB evolution was computedusing the PARSEC code (Chen et al. 2015). Based on its Galac-tic space velocity, Jura et al. (2002) proposed that L2 Pup be-longs to the thick-disk population of the Galaxy (i.e. is a low-metallicity star). This is consistent with the low-mass we mea-sure, and we therefore adopted a sub-solar metallicity of Z =0.008. We retrieved the isochrones from the CMD 2.8 web site2.We chose to not interpolate them as the correlations betweenparameters are potentially complex. A comparison of selectedL2 Pup parameters compared to the COLIBRI isochrone predic-tions is presented in Fig. 9.
The closest COLIBRI model to the observed properties ofthe star has the parameters listed in Table 3 (right columns).Thanks to our knowledge of the mass and pulsation period,the model properties are well constrained and non-degenerate.The agreement between the model and observed parametersis very good. The measured effective gravity (log g) was de-rived from the angular diameter measured by Kervella et al.(2014) using near-infrared interferometry, combined with theHipparcos parallax and the mass mA determined in the presentwork. The difference in log g with the observed value is wellwithin the error bar, although no correction was made for thepulsation phase of the star. The pulsation period predicted by themodel (141.5 days) is very close to the observed period (138 ±1.7 days). As expected for this evolved star, the fraction of he-lium in the core is very high, close to 90% in mass. The mass loss
2 http://stev.oapd.inaf.it/cgi-bin/cmd
A92, page 7 of 17

A&A 596, A92 (2016)
Table 3. Observed properties of L2 Pup and best COLIBRI model parameters.
Parameter Observed Ref. Model ∆[σ]a
Current mass Mact [M�] 0.659 ± 0.043 K16 0.63 −0.6Initial mass Mini [M�] 0.98 –Radius R [R�] 123 ± 14 K14 121 −0.1Effective gravity log g [cgs] 0.078 ± 0.027 K16 0.072 +0.2Luminosity L [L�] 2000 ± 700 K14 2347 +0.6Effective temperature Teff [K] 3500 ± 250 K14 3629 +0.5Pulsation period P [days] 138.3 ± 1.7 B02 141.5 +1.9Pulsation mode order 0 –Metallicity Z 0.008 –Carbon-to-oxygen ratio C/O 0.46 –Mass of helium core MHe [M�] 0.55 –Mass-loss rate M [M� yr−1] 5 × 10⁻⁷ B02 3 × 10⁻⁸ –
Notes. (a) ∆ is the difference between the model and observed values expressed in number of times the error bar of the measurement.References. B02: Bedding et al. (2002); K14: Kervella et al. (2014); K16: present work.
3000 3250 3500 3750 4000Teff [K]
1000
2000
5000
10000
L[L
¯]
0.79 0.75 0.70 0.65 0.60
0.80
0.75
0.70
0.66
0.61
0.57
7.9 Gyr
10.0 Gyr
-0.50 -0.25 0.00 0.25 0.50logg [cgs]
0
100
200
300
400
500
Per
iod
[days
]
0.790.75
0.700.65
0.60
0.80
0.75
0.70
0.66
0.610.57
Fig. 9. Position of L2 Pup compared to isochrones from the evolution-ary models by Marigo et al. (2008, 2013). The mass of the star at theage of the isochrone is indicated as labels of each curve. Top panel:Hertzsprung-Russell diagram. Bottom panel: pulsation period vs. log g.
predicted by the COLIBRI model M = 3×10⁻⁸ M� yr−1 is lowerthan the values estimated by Winters et al. (2002), Bedding et al.(2002) and Jura et al. (2002) by about an order of magnitude.This parameter is particularly difficult to model, and the agree-ment is still relatively satisfactory. To explain the discrepancy,we could speculate that the mass loss of L2 Pup is currentlyenhanced compared to its medium-term average value (over amillenium, for example). In this context, Chen et al. (2016) pro-posed that the formation of the dust disk could be the result of arecent, maybe still ongoing, enhanced mass-loss event. The in-fluence of the companion on the mass loss is also uncertain. Thelifetime of L2 Pup in the TP-AGB phase is expected to be only
on the order of 0.5 Myr (Rosenfield et al. 2014) which is veryshort and makes the proximity of this star particularly remark-able from a statistical point of view.
In summary, L2 Pup’s current evolutionary state is a ther-mally pulsating AGB star, which is a brief stage of its evolution.Its initial mass on the main sequence was very close to solar, andits age is approximately twice that of our star. L2 Pup thus pro-vides a remarkable analog of the Sun when it will enter the finalphases of its evolution, shortly before metamorphosing from ared giant into a planetary nebula and becoming a white dwarf.
4.2. Physical properties of L2 Pup B
4.2.1. Mass from molecular disk dynamics
The velocity profile of the disk and the position of the centralAGB star allow us to estimate the mass of L2 Pup B. As themolecular disk revolves around the barycenter G of the enclosedmass, we can constrain the mass of source B from the differ-ence in position between the AGB star’s photocenter Ph (takenas a proxy of the center of mass of the star) and the geometricalcenter of rotation G of the gaseous disk.
We measured the position of G by matching the Keple-rian velocities on each side of the PVD (east and west) of the29SiO(3 = 0, J = 8−7) line (Fig. 7). Thanks to the very highsignal-to-noise ratio, we measured the position of G with anaccuracy of ±0.2 pix (±0.5 mas). We shifted all images (lineand continuum) to define this position as the zero of the rela-tive coordinate grid. The position Ph of the photocenter of theAGB star is derived from a bidimensional Gaussian fit over thecentral part of the continuum emission. The possibility existsthat a position shift is introduced by an asymmetric maskingof the stellar photosphere by the northern edge of the dust disk(Ohnaka et al. 2015). This photocenter displacement is expectedto be of smaller amplitude at millimeter wavelengths than in thevisible or near-infrared because of the higher transparency ofthe dust, but we conservatively adopt a systematic uncertaintyof ±0.2 pix (±0.5 mas) on the measurement.
We therefore obtain a relative position in right ascension ofPh with respect to G of
∆α[Ph −G] = +0.22 ± 0.30 pix = +0.55 ± 0.75 mas. (7)
This difference is positive as Ph is located slightly to the eastof G. The agreement between the positions of G and Ph is there-fore very good and statistically compatible with zero.
A92, page 8 of 17

P. Kervella et al.: Mass and candidate planet of L2 Pup from ALMA
Considering the observed position offset in right ascension∆α[BA] = +30.0± 2.5 mas between L2 Pup B and the AGB star,we conclude that the mass of B is
mB =∆α[Ph −G]
∆α[BA] − ∆α[Ph −G]× mA (8)
and we therefore derive
mB = 0.019 ± 0.025 × mA (9)= 0.012 ± 0.016 M� (10)= 12 ± 16 MJup. (11)
We assumed in this reasoning that only one companion sourceis present in addition to the central star A. The presence of othersources could induce a different combined shift of the barycenterthat might bias the mass estimate.
4.2.2. Orbital period and radius
For simple geometrical reasons (see e.g. Fig. 11), the observedvelocity v0 of source B is sub-Keplerian at the observed projectedseparation R0 and corresponds to the projected component of theorbital velocity v of source B. Its orbital radius RB is necessarilylarger than its currently observed radius R0 from A, and is givenby the expression:
RB =
(R0
v0
√G mA
)2/3
(12)
where mA = 0.659 ± 0.043 M�, R0 = 1.92 ± 0.12 R� andv0 = 12.2 ± 1.0 km s−1. We assumed that the orbit of B iscircular and coplanar with the disk. This may not be perfectlytrue in reality as the position of source B in the continuum ap-pears slightly south of the plane of the disk. The actual orbitalplane of B may therefore be moderately tilted with respect tothe plane of the disk. Under the assumption that the molecularemission does come from source B, the orbital radius is thereforeRB = 2.43 ± 0.16 AU corresponding to a maximum angular sep-aration of ρB = 38 ± 3 mas. The orbital velocity (circular orbit)is vorb = 15.4 ± 1.0 km s−1. From Kepler’s third law, the orbitalperiod is Porb = 4.69±0.45 yr. As shown in Fig. 11, this period isconsistent with the small observed astrometric displacement ofsource B between the ZIMPOL (2014.93) and ALMA (2015.84)epochs that are separated by 0.91 yr. The two epochs would thencorrespond to almost symmetric phases with respect to the max-imum elongation (−33◦ and +38◦ for ZIMPOL and ALMA, re-spectively). The ephemeris of the separation ∆α[B−A] in right as-cension between source B and L2 Pup A is therefore
∆α[B−A](T ) = −ρB cos[2π φ(T )
](13)
with φ(T ) = (T − T0)/Porb, and the ephemeris of the radial com-ponent v(T ) of the orbital velocity is given by:
v(T ) = vorb cos[2π φ(T )
](14)
where T is the observing date expressed as decimal year andT0 = 2015.1 the epoch of maximum elongation to the west. Ifthe orbital motion ephemeris we determine is correct, the maxi-mum elongation of source B to the east of L2 Pup A should occuraround June 2017. The radial velocity would then be approxi-mately vrad = −15 km s−1.
4.3. Nature of L2 Pup B
Considering our uncertainty domain on the mass of L2 Pup B(mB = 12 ± 16 MJup), we can exclude that it is a very low-massstar at a 4σ level. We are left with three hypotheses, orderedby increasing mass, that we critically discuss in the followingparagraphs:
1. a dense, coreless aggregate of gas and dust,2. a planet (mB ≤ 12 MJup),3. a low-mass brown dwarf (12 MJup < mB < 30 MJup).
For simplification, we address the planet and low-mass browndwarf hypotheses together, using the same “compact body” term.
4.3.1. Continuum and molecular emission
The continuum flux contribution of B is considerable in abso-lute terms ( fB = 1.03 ± 0.05 mJy assuming it is unresolved),and its molecular emission is also very strong in the CO lines.These two characteristics can be explained by the emission of adense aggregate of dust and gas, but the thermal emission of aplanet or brown dwarf is clearly insufficient. However, L2 Pup Bevolves in a particular environment, that is hot, rich in moleculesand possibly also contains refractory dust that condensed in theAGB star wind. Assuming that B is a compact body, it is there-fore located in a very favorable position to accrete material. Theemission from the accreted material, either from an extended at-mosphere or an accretion disk, could strongly outshine the ther-mal emission from the planet itself. An approximate compu-tation using the formulae by Paczynski (1971) shows that theRoche lobe of a 12 MJup companion located at 2.5 AU from a0.65 M� star has a radius of rRoche = 0.3 AU. A detailed modelof the system is beyond the scope of the present work, but wespeculate that the accretion of the AGB wind by source B fillsthe Roche lobe of the companion with a sufficient quantity ofmaterial to produce the observed continuum and line emission.If confirmed, this configuration would provide valuable con-straints for hydrodynamical models of star-planet interactionsat the late stages of stellar evolution (see e.g. Staff et al. 2016;Wang & Willson 2014).
We conclude that the high observed continuum and molec-ular emission of L2 Pup B is compatible with the object beingeither a core-less aggregate or a compact body.
4.3.2. Persistence over time
L2 Pup B has been detected at both the ZIMPOL (2014.93,Kervella et al. 2015) and ALMA (2015.84) epochs separated by0.91 yr. From hydrodynamical simulations, gas clumps in an ide-alized radial outflow typically do not survive for long periods oftime, mainly because of the internal pressure gradient. The pre-dicted lifetimes are on the order of weeks or months (dependingon the size of the clump, temperature gradient, density gradient,etc.). The dust (both small and large grains) is almost unaffected,as it is not subject to internal pressure. The only influence of theoutflow on the dust is a gradual elongation of the clump per-pendicular to the local radial velocity vector field. In a rotatingmedium as observed around L2 Pup, the gas would not survive asa clump because of the intense shear originating from the Keple-rian rotation, and would be quickly dissolved. These predictionsare difficult to reconcile with the observed molecular emissionenhancement in the CO lines (Sect. 3.2.4). Moreover, as a resultof the strong radiative pressure, a fluffy clump of dusty mate-rial would most likely be quickly blown away from the star and
A92, page 9 of 17
A&A 596, A92 (2016)
0.1 0.2 0.3 0.4 0.5
V band pL
BA
Plume 2
5 AU 100 mas
N
E
Plume 1
BA
NACO 4.05 µm
Loop
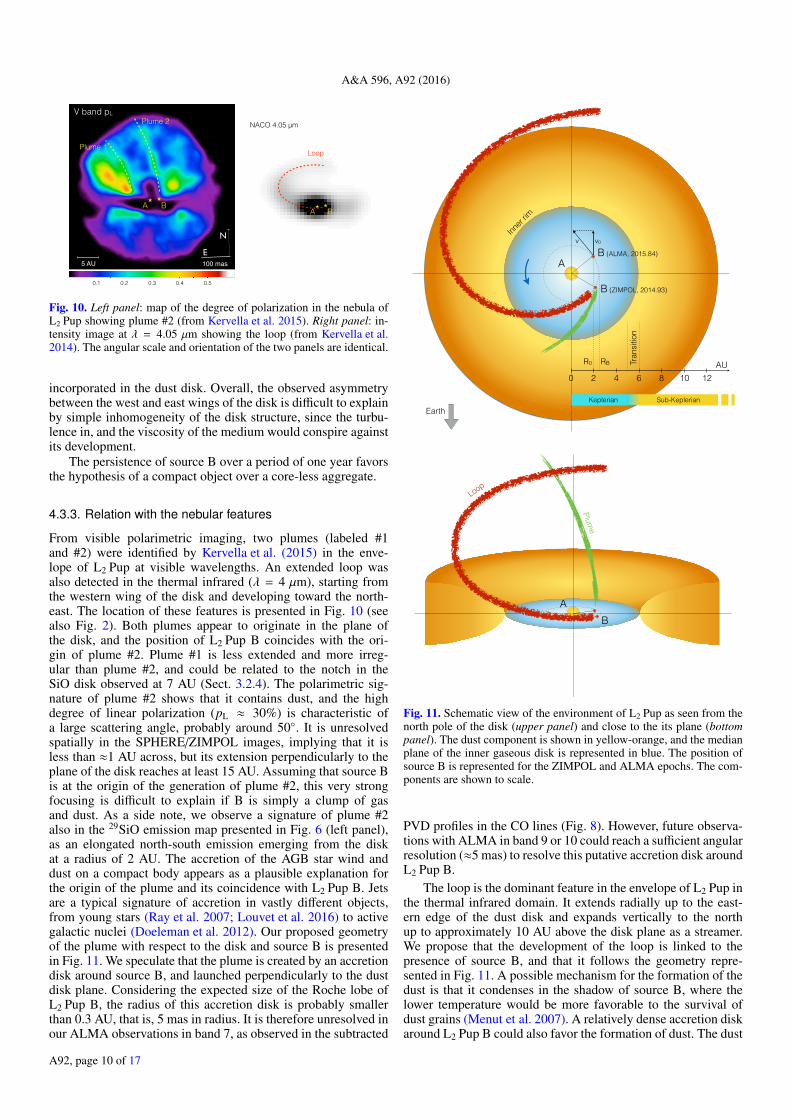
Fig. 10. Left panel: map of the degree of polarization in the nebula ofL2 Pup showing plume #2 (from Kervella et al. 2015). Right panel: in-tensity image at λ = 4.05 µm showing the loop (from Kervella et al.2014). The angular scale and orientation of the two panels are identical.
incorporated in the dust disk. Overall, the observed asymmetrybetween the west and east wings of the disk is difficult to explainby simple inhomogeneity of the disk structure, since the turbu-lence in, and the viscosity of the medium would conspire againstits development.
The persistence of source B over a period of one year favorsthe hypothesis of a compact object over a core-less aggregate.
4.3.3. Relation with the nebular features
From visible polarimetric imaging, two plumes (labeled #1and #2) were identified by Kervella et al. (2015) in the enve-lope of L2 Pup at visible wavelengths. An extended loop wasalso detected in the thermal infrared (λ = 4 µm), starting fromthe western wing of the disk and developing toward the north-east. The location of these features is presented in Fig. 10 (seealso Fig. 2). Both plumes appear to originate in the plane ofthe disk, and the position of L2 Pup B coincides with the ori-gin of plume #2. Plume #1 is less extended and more irreg-ular than plume #2, and could be related to the notch in theSiO disk observed at 7 AU (Sect. 3.2.4). The polarimetric sig-nature of plume #2 shows that it contains dust, and the highdegree of linear polarization (pL ≈ 30%) is characteristic ofa large scattering angle, probably around 50◦. It is unresolvedspatially in the SPHERE/ZIMPOL images, implying that it isless than ≈1 AU across, but its extension perpendicularly to theplane of the disk reaches at least 15 AU. Assuming that source Bis at the origin of the generation of plume #2, this very strongfocusing is difficult to explain if B is simply a clump of gasand dust. As a side note, we observe a signature of plume #2also in the 29SiO emission map presented in Fig. 6 (left panel),as an elongated north-south emission emerging from the diskat a radius of 2 AU. The accretion of the AGB star wind anddust on a compact body appears as a plausible explanation forthe origin of the plume and its coincidence with L2 Pup B. Jetsare a typical signature of accretion in vastly different objects,from young stars (Ray et al. 2007; Louvet et al. 2016) to activegalactic nuclei (Doeleman et al. 2012). Our proposed geometryof the plume with respect to the disk and source B is presentedin Fig. 11. We speculate that the plume is created by an accretiondisk around source B, and launched perpendicularly to the dustdisk plane. Considering the expected size of the Roche lobe ofL2 Pup B, the radius of this accretion disk is probably smallerthan 0.3 AU, that is, 5 mas in radius. It is therefore unresolved inour ALMA observations in band 7, as observed in the subtracted
B (ALMA, 2015.84)
0 2 4 6AU
A
Tran
sitio
n
8 10 12
Keplerian Sub-KeplerianEarth
Inner
rim
v v0
RBR0
B (ZIMPOL, 2014.93)
Loop
Plume
AB
Fig. 11. Schematic view of the environment of L2 Pup as seen from thenorth pole of the disk (upper panel) and close to the its plane (bottompanel). The dust component is shown in yellow-orange, and the medianplane of the inner gaseous disk is represented in blue. The position ofsource B is represented for the ZIMPOL and ALMA epochs. The com-ponents are shown to scale.
PVD profiles in the CO lines (Fig. 8). However, future observa-tions with ALMA in band 9 or 10 could reach a sufficient angularresolution (≈5 mas) to resolve this putative accretion disk aroundL2 Pup B.
The loop is the dominant feature in the envelope of L2 Pup inthe thermal infrared domain. It extends radially up to the east-ern edge of the dust disk and expands vertically to the northup to approximately 10 AU above the disk plane as a streamer.We propose that the development of the loop is linked to thepresence of source B, and that it follows the geometry repre-sented in Fig. 11. A possible mechanism for the formation of thedust is that it condenses in the shadow of source B, where thelower temperature would be more favorable to the survival ofdust grains (Menut et al. 2007). A relatively dense accretion diskaround L2 Pup B could also favor the formation of dust. The dust
A92, page 10 of 17

P. Kervella et al.: Mass and candidate planet of L2 Pup from ALMA
would then be blown away by the wind and radiation pressureof the AGB star, creating a planar spiral. The three-dimensionaldevelopment of the spiral into a streamer may be caused by thefocusing of the wind by the flared disk along the polar axis, orby polar wind emitted by the disk itself.
4.3.4. Relation with the disk and bipolar structure
The overall morphology of the nebula of L2 Pup consists inan equatorial disk and bipolar cones (Kervella et al. 2015).Nordhaus & Blackman (2006) showed that a low-mass com-panion in the envelope of a mass-losing star can lead to theformation of a disk and is likely to generate polar outflows.Mastrodemos & Morris (1999) constructed three-dimensionalhydrodynamical models of the dusty wind geometry in binarysystems. They obtained a range of envelope geometries fromspherical to bipolar, including with internal spiral shock struc-tures created by the orbital motion of the companion. Specifi-cally focused on L2 Pup, the simulations by Chen et al. (2016)also indicate that an orbiting companion can result in the forma-tion of an equatorial disk. Possible traces of the interaction ofthe companion with the disk and bipolar cones can be observedin the visible images of L2 Pup as spirals and streamers (Fig. 2;Kervella et al. 2015). This means that the general morphologyof the envelope of L2 Pup is compatible with the expected signa-tures of a compact companion.
Owing to its near-Keplerian rotation and axial symmetry, thedisk surrounding L2 Pup holds a considerable angular momen-tum. The origin of this momentum cannot be explained by thecurrent rotational velocity of the star, however, which is mostlikely very slow because of its strong inflation on the red giantbranch (RGB; Meibom et al. 2009). As discussed by Chen et al.(2016), a planetary mass or brown dwarf companion can injectangular momentum into the circumstellar disk and shape thewind of the star. The compact body thus provides a simple ex-planation to the angular momentum of the disk, while a fluffyaggregate of gas and dust does not.
4.4. Scenarios for the formation and evolution of L2 Pup B
L2 Pup B could be an old planet that formed together with thestar, or alternatively a second-generation body recently formedin the disk (Ireland et al. 2007). Its uncertain mass is compatiblewith a low-mass rocky object that could have formed relativelyquickly in the circumstellar disk, even though its estimated to-tal dust mass is relatively low (Kervella et al. 2015 estimated afew 10−7 M�). Bonsor et al. (2014, 2013) reported debris disksaround subgiants, which may provide seeds for the formation ofsecond-generation planetary bodies. A circumbinary dust diskand probably also planets orbiting the post-common envelopebinary NN Ser were reported by Hardy et al. (2016; see alsoVeras 2016a). This strengthens the credibility of the scenario ofsecond-generation planet formation.
The dynamical evolution of L2 Pup B is essentially condi-tioned by its mass, the mass of the central star, the stellar mass-loss rate and tidal interactions. An overview of the two-bodymass-loss problem is presented in Veras et al. (2011). If the massof L2 Pup B is in the gaseous giant or brown dwarf regime,the large convective envelope of the AGB star induces strongtidal forces. Mustill & Villaver (2012) predicted that these forceswill pull the planet inside the envelope of the AGB star if theirinitial orbital radius is shorter than 3 AU. This has also beenthe conclusion of Villaver & Livio (2007). The tidal stability
of any exoplanetary system strongly depends on the tidal qual-ity factor Q (McDonald et al. 2014), which is poorly calibratedfor main-sequence-star – Jupiter-mass systems, and essentiallyunconstrained for evolved systems. With a current orbital ra-dius of 2.4 AU, L2 Pup B may currently be migrating towardthe star. Nordhaus et al. (2010) predicted that once engulfed,Jupiter-mass companions will be destroyed during the common-envelope phase and therefore will not remain in orbit around thefinal white dwarf. Lower mass planets are more likely to surviveas their orbital radius will expand as the star loses mass. Accre-tion onto the companion or evaporation (Villaver & Livio 2009),anisotropic mass loss or jets (Veras et al. 2013) and viscous in-teraction with the disk (Lin et al. 1996) will also influence thecompanion’s orbital evolution. While tidal factors should circu-larize the orbit relatively quickly, eccentricity pumping of thecompanion’s orbit through interactions with the disk are likelyto have a destabilizing influence. The signature of such interac-tions may be apparent both in the orbital parameters of L2 Pup B(in particular eccentricity and inclination with respect to the diskplane) and in the disk structure (warp).
Considering L2 Pup as an analog of the future Sun, thepresent properties of L2 Pup indicate that Mercury and Venuswill very likely be engulfed in the Sun’s envelope as they or-bit within or very close to the present radius of the AGB star(0.6 AU). Assuming that the orbital energy of L2 Pup B re-mained constant since its formation, its orbital radius whilecomponent A was on the main sequence (when mA ≈ 1 M�)was around 1.6 AU, that is, comparable to the present orbitof Mars around the Sun. The presence of L2 Pup B is thusconsistent with the minimum radius of 1.15 AU inferred bySchröder & Connon Smith (2008) for the survival of planets or-biting the Sun. The orbital interactions between the planets willplay a major role in determining their survival. For instance, aninward migration of Jupiter would naturally have a major impacton the inner planets. The fate of Earth also strongly depends onthe detail of how the RGB and AGB phases progress, particularlywith regard to asphericities in the stellar wind and the timing andefficiency of RGB/AGB mass loss. Different models prescribedifferent outcomes for the Earth, and L2 Pup could provide im-portant indications to distinguish between its engulfment in thecentral star and its survival as a white dwarf planet.
5. Conclusion
From the Keplerian rotation of 29SiO molecular gas observedwith ALMA, we determined that the mass of the central ob-ject of L2 Pup is mA = 0.659 ± 0.011 ± 0.041 M�. The errorbudget (±6.6%) is fully dominated by the uncertainty of theHipparcos parallax, which will soon be improved by Gaia.This accurate mass combined with the other observed proper-ties of the AGB star (pulsation period, radius luminosity, etc.)allowed us to conclude from evolutionary models that the massof L2 Pup A when it was on the main sequence is close to so-lar, and that its current age is approximately 10 Gyr. This age isconsistent with the Galactic space velocity of the star, which in-dicates that it is probably a member of the thick-disk population.
We also identified a secondary source of continuum andmolecular emission, located at a projected radius of ≈2 AU. Thisposition corresponds to the location of the companion L2 Pup Breported by Kervella et al. (2015). From its estimated mass of12 ± 16 MJup and observed emission, we argue that source B iseither a planet or a low-mass brown dwarf accreting the wind ofthe AGB star. While it could formally be a dense clump of dustand molecules, its persistence over one year, its coincidence with
A92, page 11 of 17

A&A 596, A92 (2016)
remarkable nebular features and the overall morphology of theenvelope of L2 Pup all favor the hypothesis of a compact body.We emphasize, however, that the properties of source B are stilluncertain as we do not have a firm lower limit on its mass. Thehypothesis that it is a dense clump of dust and gas cannot be for-mally excluded. Very high angular resolution observations withALMA at short wavelengths may resolve the putative accretiondisk surrounding L2 Pup B, and allow a more precise measure-ment of its mass. A schematic view of the configuration we pro-pose for the environment of L2 Pup is presented in Fig. 11.
From its observed properties, L2 Pup and its companionemerge as a plausible analog of the solar system at an age ofapproximately 10 Gyr. It provides a view on the complex inter-actions occurring between a solar-type star entering the plan-etary nebula phase and its planetary system. The companioncould also play an important role in the shaping of the bipo-lar envelope of L2 Pup and subsequently of the planetary nebula(Nordhaus & Blackman 2006). Future observations of L2 Pupwith ALMA’s highest angular resolutions and the E-ELT, forinstance, will provide valuable constraints for the modeling ofthese interactions (see e.g. Staff et al. 2016; Chen et al. 2016;Homan et al. 2015; Wang & Willson 2014).
Acknowledgements. This article makes use of the following ALMA data:ADS/JAO.ALMA#2015.1.00141.S. ALMA is a partnership of ESO (represent-ing its member states), NSF (USA) and NINS (Japan), together with NRC(Canada), NSC and ASIAA (Taiwan), and KASI (Republic of Korea), in co-operation with the Republic of Chile. The Joint ALMA Observatory is operatedby ESO, AUI/NRAO and NAOJ. W.H. acknowledges support from the Fondsvoor Wetenschappelijk Onderzoek Vlaanderen (FWO). L.D. acknowledges sup-port from the ERC consolidator grant 646758 AEROSOL and the FWO Re-search Project grant G024112N. I.M. acknowledges support from the UK Sci-ence and Technology Research Council, under grant number ST/L000768/1. Weacknowledge financial support from the “Programme National de Physique Stel-laire” (PNPS) of CNRS/INSU, France. This research received the support ofPHASE, the high angular resolution partnership between ONERA, Observatoirede Paris, CNRS and University Denis Diderot Paris 7. We acknowledge withthanks the variable star observations from the AAVSO International Databasecontributed by observers worldwide and used in this research. This researchmade use of Astropy3, a community-developed core Python package for As-tronomy (Astropy Collaboration et al. 2013). We used the SIMBAD and VIZIERdatabases at the CDS, Strasbourg (France), and NASA’s Astrophysics Data Sys-tem Bibliographic Services.
ReferencesAstropy Collaboration, Robitaille, T. P., Tollerud, E. J., et al. 2013, A&A, 558,
A33Bedding, T. R., Zijlstra, A. A., Jones, A., et al. 2002, MNRAS, 337, 79Bedding, T. R., Kiss, L. L., Kjeldsen, H., et al. 2005, MNRAS, 361, 1375Bonsor, A., Kennedy, G. M., Crepp, J. R., et al. 2013, MNRAS, 431, 3025Bonsor, A., Kennedy, G. M., Wyatt, M. C., Johnson, J. A., & Sibthorpe, B. 2014,
MNRAS, 437, 3288Borucki, W. J., Koch, D., Basri, G., et al. 2010, Science, 327, 977Chen, Y., Bressan, A., Girardi, L., et al. 2015, MNRAS, 452, 1068Chen, Z., Nordhaus, J., Frank, A., Blackman, E. G., & Balick, B. 2016, MNRAS,
460, 4182David, T. J., Hillenbrand, L. A., Petigura, E. A., et al. 2016, Nature, 534, 658Doeleman, S. S., Fish, V. L., Schenck, D. E., et al. 2012, Science, 338, 355Dumm, T., & Schild, H. 1998, New Astron., 3, 137
3 Available at http://www.astropy.org/
Grunblatt, S. K., Huber, D., Gaidos, E. J., et al. 2016, ApJ, accepted[arXiv:1606.05818]
Hardy, A., Schreiber, M. R., Parsons, S. G., et al. 2016, MNRAS, 459, 4518Homan, W., Decin, L., de Koter, A., et al. 2015, A&A, 579, A118Ireland, M. J., Tuthill, P. G., Bedding, T. R., Robertson, J. G., & Jacob, A. P.
2004, MNRAS, 350, 365Ireland, M. J., Monnier, J. D., Tuthill, P. G., et al. 2007, ApJ, 662, 651Jura, M., Chen, C., & Plavchan, P. 2002, ApJ, 569, 964Kerschbaum, F., & Olofsson, H. 1999, A&AS, 138, 299Kervella, P., Montargès, M., Ridgway, S. T., et al. 2014, A&A, 564, A88Kervella, P., Montargès, M., Lagadec, E., et al. 2015, A&A, 578, A77Kholopov, P. N., Samus, N. N., Kazarovets, E. V., & Perova, N. B. 1985,
Information Bulletin on Variable Stars, 2681, 1Lin, D. N. C., Bodenheimer, P., & Richardson, D. C. 1996, Nature, 380, 606Louvet, F., Dougados, C., Cabrit, S., et al. 2016, A&A, in press,
DOI: 10.1051/0004-6361/201628474Lykou, F., Klotz, D., Paladini, C., et al. 2015a, A&A, 576, A46Lykou, F., Klotz, D., Paladini, C., et al. 2015b, A&A, 581, C2Marigo, P., Girardi, L., Bressan, A., et al. 2008, A&A, 482, 883Marigo, P., Bressan, A., Nanni, A., Girardi, L., & Pumo, M. L. 2013, MNRAS,
434, 488Mastrodemos, N., & Morris, M. 1999, ApJ, 523, 357Maxted, P. F. L., Napiwotzki, R., Dobbie, P. D., & Burleigh, M. R. 2006, Nature,
442, 543Mayor, M., & Queloz, D. 1995, Nature, 378, 355McDonald, I., Kerins, E., Penny, M., et al. 2014, MNRAS, 445, 4137Meibom, S., Mathieu, R. D., & Stassun, K. G. 2009, ApJ, 695, 679Menut, J.-L., Gendron, E., Schartmann, M., et al. 2007, MNRAS, 376, L6Murillo, N. M., Lai, S.-P., Bruderer, S., Harsono, D., & van Dishoeck, E. F. 2013,
A&A, 560, A103Mustill, A. J., & Villaver, E. 2012, ApJ, 761, 121Nordhaus, J., & Blackman, E. G. 2006, MNRAS, 370, 2004Nordhaus, J., Spiegel, D. S., Ibgui, L., Goodman, J., & Burrows, A. 2010,
MNRAS, 408, 631Ohnaka, K. 2014, A&A, 561, A47Ohnaka, K., Schertl, D., Hofmann, K.-H., & Weigelt, G. 2015, A&A, 581, A127Paczynski, B. 1971, ARA&A, 9, 183Ray, T., Dougados, C., Bacciotti, F., Eislöffel, J., & Chrysostomou, A. 2007,
Protostars and Planets V, 231Rosenfield, P., Marigo, P., Girardi, L., et al. 2014, ApJ, 790, 22Rosenfield, P., Marigo, P., Girardi, L., et al. 2016, ApJ, 822, 73Schnee, S. L., Brogan, C., Espada, D., et al. 2014, in Observatory Operations:
Strategies, Processes, and Systems V, Proc. SPIE, 9149, 91490Schröder, K.-P., & Connon Smith, R. 2008, MNRAS, 386, 155Seifried, D., Sánchez-Monge, Á., Walch, S., & Banerjee, R. 2016, MNRAS, 459,
1892Sigurdsson, S., Richer, H. B., Hansen, B. M., Stairs, I. H., & Thorsett, S. E. 2003,
Science, 301, 193Staff, J. E., De Marco, O., Wood, P., Galaviz, P., & Passy, J.-C. 2016, MNRAS,
458, 832van Leeuwen, F. 2007, A&A, 474, 653Veras, D. 2016a, Royal Society Open Science, 3, 150571Veras, D. 2016b, MNRAS, 463, 2958Veras, D., & Wyatt, M. C. 2012, MNRAS, 421, 2969Veras, D., Wyatt, M. C., Mustill, A. J., Bonsor, A., & Eldridge, J. J. 2011,
MNRAS, 417, 2104Veras, D., Hadjidemetriou, J. D., & Tout, C. A. 2013, MNRAS, 435, 2416Villaver, E., & Livio, M. 2007, ApJ, 661, 1192Villaver, E., & Livio, M. 2009, ApJ, 705, L81Wang, Q., & Willson, L. A. 2014, in Resolving The Future Of Astronomy With
Long-Baseline Interferometry, eds. M. J. Creech-Eakman, J. A. Guzik, &R. E. Stencel, ASP Conf. Ser., 487, 401
Wiesemeyer, H., Thum, C., Baudry, A., & Herpin, F. 2009, A&A, 498, 801Winters, J. M., Le Bertre, T., Nyman, L.-Å., Omont, A., & Jeong, K. S. 2002,
A&A, 388, 609Wolszczan, A. 1994, Science, 264, 538
A92, page 12 of 17

P. Kervella et al.: Mass and candidate planet of L2 Pup from ALMA
Appendix A: 12CO(3 = 0, J = 3–2) line
The emission of L2 Pup in the 12CO line is presented in Fig. A.1.The total peak intensity is 0.35 to 0.40 Jy beam−1 km s−1 andthe maximum emission is located at a radius of approximately2 AU. The degree of asymmetry is small, although the po-sition angles of the emission peaks are slightly tilted withrespect the position angle of the plane of the disk. We detect12CO(v = 0, J = 3−2) emission between −20 and +20 km s−1
relative to the mean velocity of L2 Pup (+33.0 km s−1).
Within a 0.63 arcsecond aperture, we measure an emission peakof 5.4 Jy, centered close to the stellar velocity. Single-dish ob-servations by Kerschbaum & Olofsson (1999) showed spectralpeaks that are several times higher than ALMA in the sametransition of CO but only close to the stellar velocity. This sug-gests that in addition to the high-velocity CO detected by ALMAclose to the star, there exists an extended, slowly expanding, dif-fuse envelope that is resolved out by the long baselines of theinterferometer.
Fig. A.1. Top left panel: Map of the emission from L2 Pup in the 12CO(3 = 0, J = 3−2) line. Top right panel: first moment of velocity map (colorscale in km s−1). The contours are drawn between 4 and 10 km s−1 with a 2 km s−1 step, and the size of the photosphere is shown with a lightgreen disk. Bottom panels: position-velocity diagram of the 12CO(3 = 0, J = 3−2) emission line. The Keplerian velocity profile corresponding toa central mass of M sin(i) = 0.653 M� (determined from the 29SiO line fit) is shown with gray curves in the two panels.
A92, page 13 of 17
A&A 596, A92 (2016)
Appendix B: 13CO(3 = 0, J = 3–2) line
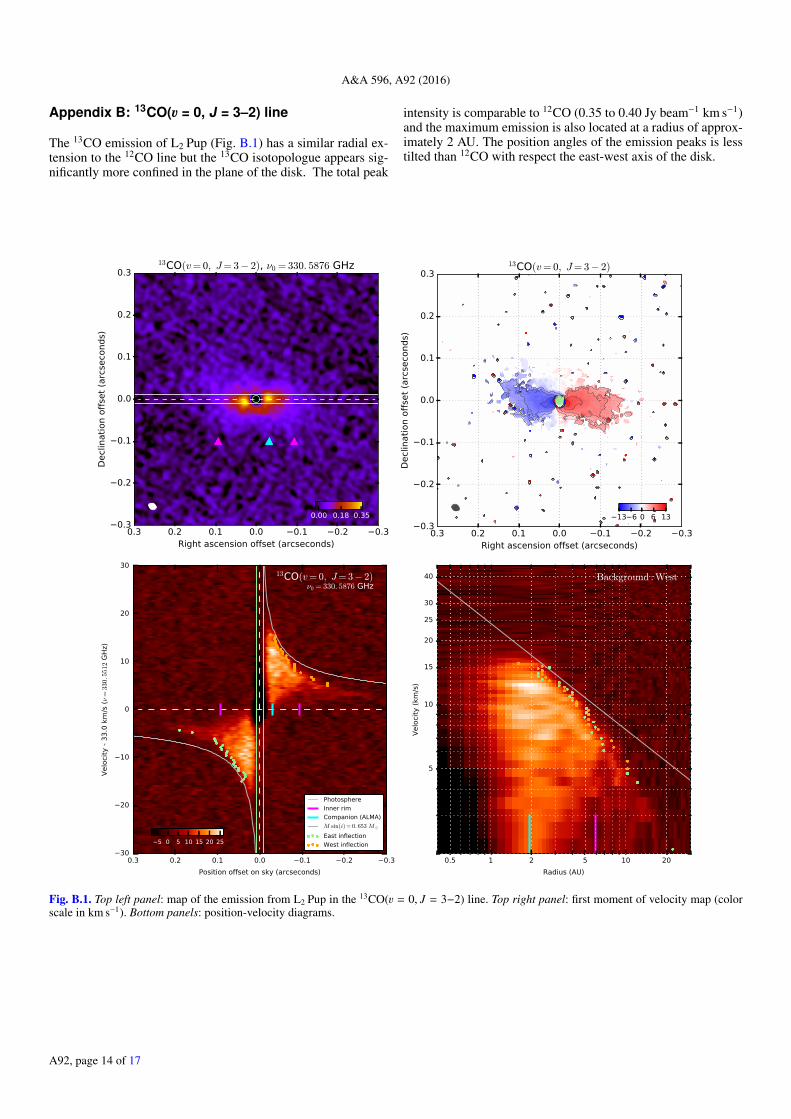
The 13CO emission of L2 Pup (Fig. B.1) has a similar radial ex-tension to the 12CO line but the 13CO isotopologue appears sig-nificantly more confined in the plane of the disk. The total peak
intensity is comparable to 12CO (0.35 to 0.40 Jy beam−1 km s−1)and the maximum emission is also located at a radius of approx-imately 2 AU. The position angles of the emission peaks is lesstilted than 12CO with respect the east-west axis of the disk.
Fig. B.1. Top left panel: map of the emission from L2 Pup in the 13CO(3 = 0, J = 3−2) line. Top right panel: first moment of velocity map (colorscale in km s−1). Bottom panels: position-velocity diagrams.
A92, page 14 of 17

P. Kervella et al.: Mass and candidate planet of L2 Pup from ALMA
Appendix C: SO2(3 = 0, 34(3, 31)–34(2, 32)) line
As shown in Fig. C.1, the sulfur dioxide emission is spreadover a large vertical extension of approximately ±0.1′′ withrespect to the disk plane. The PVD is incomplete as the linewas located close to the edge of the spectral window. In the fluximage, the emission appears stronger on the east side of the disk,
but this is an artifact due to the incompleteness of the coverageof the frequencies showing Doppler shifted emission. The ve-locity profile is sub-Keplerian over the full extent of the detectedemission, but the deviation is smaller as the radius decreases. Ata radius of 3 AU, the deviation from the Keplerian velocity isapproximately ∆v = −2 km s−1.
Fig. C.1. Emission map (top left panel), first moment of velocity map (top right panel) and position-velocity diagram (bottom panels) of theSO2(3 = 0, 34(3, 31)−34(2, 32)) emission line.
A92, page 15 of 17
A&A 596, A92 (2016)
Appendix D: SO 3Σ (3 = 0, 8(8)–7(7)) line
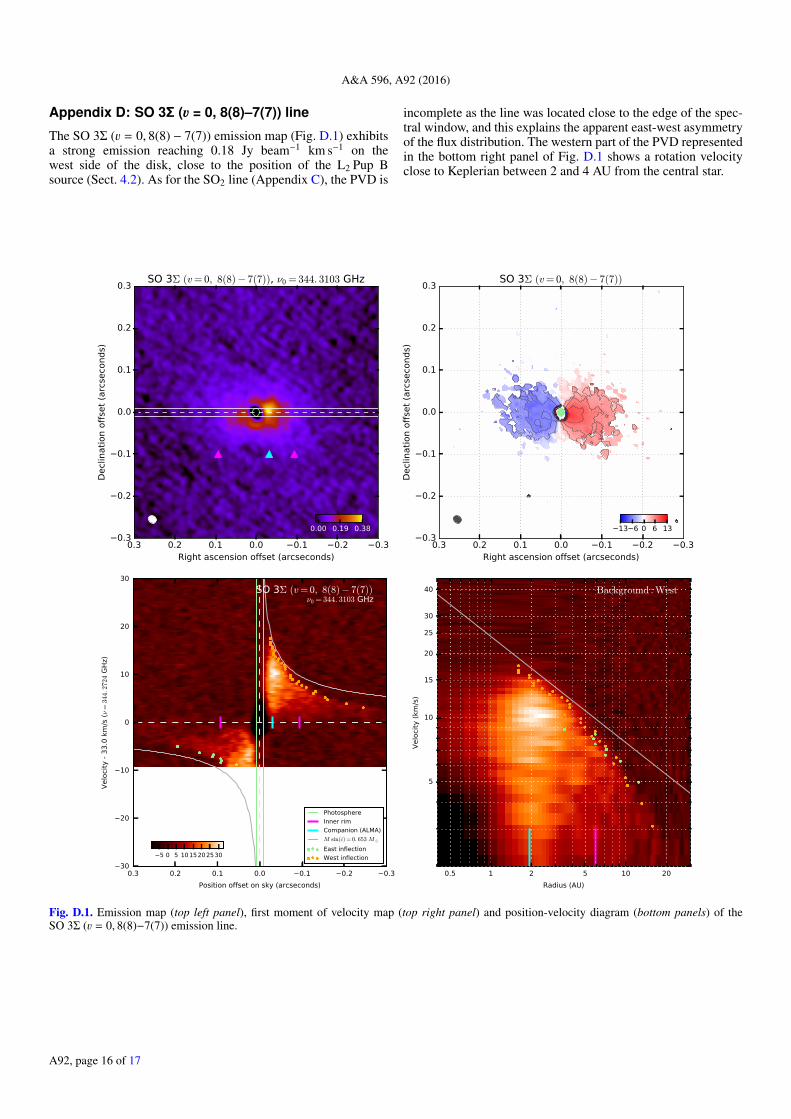
The SO 3Σ (3 = 0, 8(8) − 7(7)) emission map (Fig. D.1) exhibitsa strong emission reaching 0.18 Jy beam−1 km s−1 on thewest side of the disk, close to the position of the L2 Pup Bsource (Sect. 4.2). As for the SO2 line (Appendix C), the PVD is
incomplete as the line was located close to the edge of the spec-tral window, and this explains the apparent east-west asymmetryof the flux distribution. The western part of the PVD representedin the bottom right panel of Fig. D.1 shows a rotation velocityclose to Keplerian between 2 and 4 AU from the central star.
Fig. D.1. Emission map (top left panel), first moment of velocity map (top right panel) and position-velocity diagram (bottom panels) of theSO 3Σ (3 = 0, 8(8)−7(7)) emission line.
A92, page 16 of 17

P. Kervella et al.: Mass and candidate planet of L2 Pup from ALMA
Appendix E: SiS(3 = 1, J = 19–18) line
The emission map in the SiS(3 = 1, J = 19−18) (Fig. E.1) showsthat this line is narrowly contained within the plane of the dustdisk and has a very restricted vertical extension. The PVD indi-cates that the emission is confined to a thin ring located aroundthe inner rim of the dust disk (6 AU), and that its radial extension
is mostly limited to between 4 and 7 AU. No significant emis-sion is detected beyond a radius of approximately 10 AU. ThePVD shows that the rotational velocity is always sub-Keplerian,with an increasing deviation from the M sin(i) = 0.653 M� ve-locity profile with increasing radius. The emission is asymmetricbetween the east and west parts of the disk, with a significantlystronger emission on the west side.
Fig. E.1. Emission map (top left panel), first moment of velocity map (top right panel) and position velocity diagram (bottom panels) of theSiS(3 = 1, J = 19−18) emission line.
A92, page 17 of 17