ALMA OBSERVATIONS OF SPT-DISCOVERED ... - Institute of Physics
11
The Astrophysical Journal, 767:132 (11pp), 2013 April 20 doi:10.1088/0004-637X/767/2/132 C 2013. The American Astronomical Society. All rights reserved. Printed in the U.S.A. ALMA OBSERVATIONS OFSPT-DISCOVERED, STRONGLY LENSED, DUSTY, STAR-FORMING GALAXIES Y. D. Hezaveh 1 , D. P. Marrone 2 , C. D. Fassnacht 3 , J. S. Spilker 2 , J. D. Vieira 4 , J. E. Aguirre 5 , K. A. Aird 6 , M. Aravena 7 , M. L. N. Ashby 8 , M. Bayliss 8 ,9 , B. A. Benson 10 ,11 , L. E. Bleem 10 ,12 , M. Bothwell 2 , M. Brodwin 13 , J. E. Carlstrom 10 ,11 ,12,14,15 , C. L. Chang 10 ,11 ,15 , S. C. Chapman 16 ,17 , T. M. Crawford 10 ,14 , A. T. Crites 10 ,14 , C. De Breuck 7 , T. de Haan 1 , M. A. Dobbs 1 , E. B. Fomalont 18 , E. M. George 19 , M. D. Gladders 10 ,14 , A. H. Gonzalez 20 , T. R. Greve 21 , N. W. Halverson 22 , F. W. High 10 ,14 , G. P. Holder 1 , W. L. Holzapfel 19 , S. Hoover 10 ,11 , J. D. Hrubes 6 , K. Husband 17 , T. R. Hunter 18 , R. Keisler 10 ,12 , A. T. Lee 19 ,23 , E. M. Leitch 10 ,14 , M. Lueker 4 , D. Luong-Van 6 , M. Malkan 24 , V. McIntyre 25 , J. J. McMahon 10 ,11,26 , J. Mehl 10 ,14 , K. M. Menten 27 , S. S. Meyer 10 ,11,12,14 , L. M. Mocanu 10 ,14 , E. J. Murphy 28 , T. Natoli 10 ,12 , S. Padin 4 ,10,14 , T. Plagge 10 ,14 , C. L. Reichardt 19 , A. Rest 29 , J. Ruel 9 , J. E. Ruhl 30 , K. Sharon 10 ,14,31 , K. K. Schaffer 10 ,32 , L. Shaw 1 ,33 , E. Shirokoff 4 , B. Stalder 8 , Z. Staniszewski 4 ,30 , A. A. Stark 8 , K. Story 10 ,12 , K. Vanderlinde 1 , A. Weiß 27 , N. Welikala 34 , and R. Williamson 10 ,14 1 Department of Physics, McGill University, 3600 Rue University, Montreal, Quebec H3A 2T8, Canada 2 Steward Observatory, University of Arizona, 933 North Cherry Avenue, Tucson, AZ 85721, USA 3 Department of Physics, University of California, One Shields Avenue, Davis, CA 95616, USA 4 California Institute of Technology, 1200 E. California Blvd., Pasadena, CA 91125, USA 5 University of Pennsylvania, 209 South 33rd Street, Philadelphia, PA 19104, USA 6 University of Chicago, 5640 South Ellis Avenue, Chicago, IL 60637, USA 7 European Southern Observatory, Karl-Schwarzschild Strasse, D-85748 Garching bei M¨ unchen, Germany 8 Harvard-Smithsonian Center for Astrophysics, 60 Garden Street, Cambridge, MA 02138, USA 9 Department of Physics, Harvard University, 17 Oxford Street, Cambridge, MA 02138, USA 10 Kavli Institute for Cosmological Physics, University of Chicago, 5640 South Ellis Avenue, Chicago, IL 60637, USA 11 Enrico Fermi Institute, University of Chicago, 5640 South Ellis Avenue, Chicago, IL 60637, USA 12 Department of Physics, University of Chicago, 5640 South Ellis Avenue, Chicago, IL 60637, USA 13 Department of Physics and Astronomy, University of Missouri, 5110 Rockhill Road, Kansas City, MO 64110, USA 14 Department of Astronomy and Astrophysics, University of Chicago, 5640 South Ellis Avenue, Chicago, IL 60637, USA 15 Argonne National Laboratory, 9700 S. Cass Avenue, Argonne, IL, USA 60439, USA 16 Department of Physics and Atmospheric Science, Dalhousie University, Halifax, NS B3H 3J5 Canada 17 Institute of Astronomy, University of Cambridge, Madingley Road, Cambridge CB3 0HA, UK 18 National Radio Astronomy Observatory, 520 Edgemont Road, Charlottesville, VA 22903, USA 19 Department of Physics, University of California, Berkeley, CA 94720, USA 20 Department of Astronomy, University of Florida, Gainesville, FL 32611, USA 21 Department of Physics and Astronomy, University College London, Gower Street, London WC1E 6BT, UK 22 Department of Astrophysical and Planetary Sciences and Department of Physics, University of Colorado, Boulder, CO 80309, USA 23 Physics Division, Lawrence Berkeley National Laboratory, Berkeley, CA 94720, USA 24 Department of Physics and Astronomy, University of California, Los Angeles, CA 90095-1547, USA 25 Australia Telescope National Facility, CSIRO, Epping, NSW 1710, Australia 26 Department of Physics, University of Michigan, 450 Church Street, Ann Arbor, MI, 48109, USA 27 Max-Planck-Institut f¨ ur Radioastronomie, Auf dem H ¨ ugel 69 D-53121 Bonn, Germany 28 Observatories of the Carnegie Institution for Science, 813 Santa Barbara Street, Pasadena, CA 91101, USA 29 Space Telescope Science Institute, 3700 San Martin Dr., Baltimore, MD 21218, USA 30 Physics Department, Center for Education and Research in Cosmology and Astrophysics, Case Western Reserve University, Cleveland, OH 44106, USA 31 Department of Astronomy, University of Michigan, 500 Church Street, Ann Arbor, MI, 48109, USA 32 Liberal Arts Department, School of the Art Institute of Chicago, 112 S Michigan Ave, Chicago, IL 60603, USA 33 Department of Physics, Yale University, P.O. Box 208210, New Haven, CT 06520-8120, USA 34 Institut d’Astrophysique Spatiale, Bˆ atiment 121, Universit´ e Paris-Sud XI & CNRS, F-91405 Orsay Cedex, France Received 2012 September 18; accepted 2013 March 1; published 2013 April 4 ABSTRACT We present Atacama Large Millimeter/submillimeter Array (ALMA) 860 μm imaging of four high-redshift (z = 2.8–5.7) dusty sources that were detected using the South Pole Telescope (SPT) at 1.4 mm and are not seen in existing radio to far-infrared catalogs. At 1. 5 resolution, the ALMA data reveal multiple images of each submillimeter source, separated by 1 –3 , consistent with strong lensing by intervening galaxies visible in near-IR imaging of these sources. We describe a gravitational lens modeling procedure that operates on the measured visibilities and incorporates self-calibration-like antenna phase corrections as part of the model optimization, which we use to interpret the source structure. Lens models indicate that SPT0346-52, located at z = 5.7, is one of the most luminous and intensely star-forming sources in the universe with a lensing corrected FIR luminosity of 3.7 × 10 13 L and star formation surface density of 4200 M yr −1 kpc −2 . We find magnification factors of 5 to 22, with lens Einstein radii of 1. 1–2. 0 and Einstein enclosed masses of 1.6–7.2 × 10 11 M . These observations confirm the lensing origin of these objects, allow us to measure their intrinsic sizes and luminosities, and demonstrate the important role that ALMA will play in the interpretation of lensed submillimeter sources. Key words: galaxies: high-redshift – galaxies: starburst – gravitational lensing: strong – techniques: interferometric Online-only material: color figures 1
Transcript of ALMA OBSERVATIONS OF SPT-DISCOVERED ... - Institute of Physics

The Astrophysical Journal, 767:132 (11pp), 2013 April 20 doi:10.1088/0004-637X/767/2/132C© 2013. The American Astronomical Society. All rights reserved. Printed in the U.S.A.
ALMA OBSERVATIONS OF SPT-DISCOVERED, STRONGLY LENSED, DUSTY, STAR-FORMING GALAXIES
Y. D. Hezaveh1, D. P. Marrone2, C. D. Fassnacht3, J. S. Spilker2, J. D. Vieira4, J. E. Aguirre5, K. A. Aird6, M. Aravena7,M. L. N. Ashby8, M. Bayliss8,9, B. A. Benson10,11, L. E. Bleem10,12, M. Bothwell2, M. Brodwin13,
J. E. Carlstrom10,11,12,14,15, C. L. Chang10,11,15, S. C. Chapman16,17, T. M. Crawford10,14, A. T. Crites10,14, C. De Breuck7,T. de Haan1, M. A. Dobbs1, E. B. Fomalont18, E. M. George19, M. D. Gladders10,14, A. H. Gonzalez20, T. R. Greve21,N. W. Halverson22, F. W. High10,14, G. P. Holder1, W. L. Holzapfel19, S. Hoover10,11, J. D. Hrubes6, K. Husband17,
T. R. Hunter18, R. Keisler10,12, A. T. Lee19,23, E. M. Leitch10,14, M. Lueker4, D. Luong-Van6, M. Malkan24,V. McIntyre25, J. J. McMahon10,11,26, J. Mehl10,14, K. M. Menten27, S. S. Meyer10,11,12,14, L. M. Mocanu10,14,
E. J. Murphy28, T. Natoli10,12, S. Padin4,10,14, T. Plagge10,14, C. L. Reichardt19, A. Rest29, J. Ruel9, J. E. Ruhl30,K. Sharon10,14,31, K. K. Schaffer10,32, L. Shaw1,33, E. Shirokoff4, B. Stalder8, Z. Staniszewski4,30, A. A. Stark8,
K. Story10,12, K. Vanderlinde1, A. Weiß27, N. Welikala34, and R. Williamson10,141 Department of Physics, McGill University, 3600 Rue University, Montreal, Quebec H3A 2T8, Canada
2 Steward Observatory, University of Arizona, 933 North Cherry Avenue, Tucson, AZ 85721, USA3 Department of Physics, University of California, One Shields Avenue, Davis, CA 95616, USA
4 California Institute of Technology, 1200 E. California Blvd., Pasadena, CA 91125, USA5 University of Pennsylvania, 209 South 33rd Street, Philadelphia, PA 19104, USA
6 University of Chicago, 5640 South Ellis Avenue, Chicago, IL 60637, USA7 European Southern Observatory, Karl-Schwarzschild Strasse, D-85748 Garching bei Munchen, Germany
8 Harvard-Smithsonian Center for Astrophysics, 60 Garden Street, Cambridge, MA 02138, USA9 Department of Physics, Harvard University, 17 Oxford Street, Cambridge, MA 02138, USA
10 Kavli Institute for Cosmological Physics, University of Chicago, 5640 South Ellis Avenue, Chicago, IL 60637, USA11 Enrico Fermi Institute, University of Chicago, 5640 South Ellis Avenue, Chicago, IL 60637, USA12 Department of Physics, University of Chicago, 5640 South Ellis Avenue, Chicago, IL 60637, USA
13 Department of Physics and Astronomy, University of Missouri, 5110 Rockhill Road, Kansas City, MO 64110, USA14 Department of Astronomy and Astrophysics, University of Chicago, 5640 South Ellis Avenue, Chicago, IL 60637, USA
15 Argonne National Laboratory, 9700 S. Cass Avenue, Argonne, IL, USA 60439, USA16 Department of Physics and Atmospheric Science, Dalhousie University, Halifax, NS B3H 3J5 Canada
17 Institute of Astronomy, University of Cambridge, Madingley Road, Cambridge CB3 0HA, UK18 National Radio Astronomy Observatory, 520 Edgemont Road, Charlottesville, VA 22903, USA
19 Department of Physics, University of California, Berkeley, CA 94720, USA20 Department of Astronomy, University of Florida, Gainesville, FL 32611, USA
21 Department of Physics and Astronomy, University College London, Gower Street, London WC1E 6BT, UK22 Department of Astrophysical and Planetary Sciences and Department of Physics, University of Colorado, Boulder, CO 80309, USA
23 Physics Division, Lawrence Berkeley National Laboratory, Berkeley, CA 94720, USA24 Department of Physics and Astronomy, University of California, Los Angeles, CA 90095-1547, USA
25 Australia Telescope National Facility, CSIRO, Epping, NSW 1710, Australia26 Department of Physics, University of Michigan, 450 Church Street, Ann Arbor, MI, 48109, USA
27 Max-Planck-Institut fur Radioastronomie, Auf dem Hugel 69 D-53121 Bonn, Germany28 Observatories of the Carnegie Institution for Science, 813 Santa Barbara Street, Pasadena, CA 91101, USA
29 Space Telescope Science Institute, 3700 San Martin Dr., Baltimore, MD 21218, USA30 Physics Department, Center for Education and Research in Cosmology and Astrophysics, Case Western Reserve University, Cleveland, OH 44106, USA
31 Department of Astronomy, University of Michigan, 500 Church Street, Ann Arbor, MI, 48109, USA32 Liberal Arts Department, School of the Art Institute of Chicago, 112 S Michigan Ave, Chicago, IL 60603, USA
33 Department of Physics, Yale University, P.O. Box 208210, New Haven, CT 06520-8120, USA34 Institut d’Astrophysique Spatiale, Batiment 121, Universite Paris-Sud XI & CNRS, F-91405 Orsay Cedex, France
Received 2012 September 18; accepted 2013 March 1; published 2013 April 4
ABSTRACT
We present Atacama Large Millimeter/submillimeter Array (ALMA) 860 μm imaging of four high-redshift (z =2.8–5.7) dusty sources that were detected using the South Pole Telescope (SPT) at 1.4 mm and are not seenin existing radio to far-infrared catalogs. At 1.′′5 resolution, the ALMA data reveal multiple images of eachsubmillimeter source, separated by 1′′–3′′, consistent with strong lensing by intervening galaxies visible in near-IRimaging of these sources. We describe a gravitational lens modeling procedure that operates on the measuredvisibilities and incorporates self-calibration-like antenna phase corrections as part of the model optimization, whichwe use to interpret the source structure. Lens models indicate that SPT0346-52, located at z = 5.7, is one ofthe most luminous and intensely star-forming sources in the universe with a lensing corrected FIR luminosity of3.7 × 1013 L and star formation surface density of 4200 M yr−1 kpc−2. We find magnification factors of 5 to 22,with lens Einstein radii of 1.′′1–2.′′0 and Einstein enclosed masses of 1.6–7.2 × 10¹¹ M. These observations confirmthe lensing origin of these objects, allow us to measure their intrinsic sizes and luminosities, and demonstrate theimportant role that ALMA will play in the interpretation of lensed submillimeter sources.
Key words: galaxies: high-redshift – galaxies: starburst – gravitational lensing: strong – techniques: interferometric
Online-only material: color figures
1

The Astrophysical Journal, 767:132 (11pp), 2013 April 20 Hezaveh et al.
1. INTRODUCTION
Half of the energy produced by all objects in the history ofthe universe has been absorbed and reemitted by dust (Doleet al. 2006). The Cosmic Infrared Background, first detectedby the Cosmic Background Explorer satellite (Puget et al. 1996;Hauser et al. 1998; Fixsen et al. 1998), is the aggregate emissionfrom individual dusty galaxies across cosmic time (e.g., Lagacheet al. 2005). The brightest of these dusty star-forming galaxies(DSFGs) were discovered in deep submillimeter-wavelengthimages of the sky (Smail et al. 1997; Hughes et al. 1998;Barger et al. 1998), and have luminosities in excess of 1012 Lemitted primarily at rest wavelength in the far-infrared. With starformation rates >100–1000 M yr−1, this population of DSFGscontributes a significant fraction of the total star formationdensity of the universe at z ∼ 2–3, where their abundance peaks(e.g., Chapman et al. 2005). These objects are the progenitorsof the massive galaxies we observe today.
Despite the enormous total luminosity of the brightestDSFGs, their detection at submillimeter wavelengths requireslengthy exposures for ground-based facilities, and they are gen-erally quite dim at optical/NIR wavelengths due to extinction.Studies of these objects and their extreme star formation ratesare limited by the observational costs of observing all but thebrightest spectral lines and the poor spatial resolution achievablecompared to the typical size of the star-forming regions. Grav-itational lensing provides a solution to both of these problems,as has been demonstrated in a few spectacular cases (e.g., Kneibet al. 2004; Swinbank et al. 2010; Riechers et al. 2011; Fu et al.2012). Lensed starburst galaxies can be examined at high spatialresolution and with a more diverse set of diagnostics than theunmagnified population (Swinbank et al. 2010).
Predictions of a large population of gravitationally lensed,high redshift DSFGs (Blain 1996; Negrello et al. 2007) were re-cently verified by large-area millimeter/submillimeter surveys(Vieira et al. 2010; Negrello et al. 2010; Wardlow et al. 2013).Hezaveh & Holder (2011) also predicted the number countsof bright lensed objects for mm-wavelength surveys using a de-tailed numerical method, with a proper treatment of finite sourceeffects and lens ellipticities, confirming that realistic lens mod-els were able to match the observed number counts of dustysources reported in Vieira et al. (2010). These galaxies have asky density of ∼0.1 deg−2, and therefore can only be found inlarge numbers in extensive surveys. The South Pole Telescope(SPT; Carlstrom et al. 2011), which surveyed 2500 deg2 to ∼mJy depth at wavelengths of 3, 2, and 1.4 mm, has provided asample of about one hundred candidate lensed sources (Vieiraet al. 2010). Initial investigations of these objects have foundthem to have properties consistent with unlensed starbursts, ex-cept for their large apparent luminosities (Greve et al. 2012).Morphological evidence of lensing cannot be discerned in datafrom the SPT survey or the single-aperture followup of Greveet al. (2012), except in rare cases of lensing by clusters of galax-ies, so arcsecond-resolution submillimeter imaging is required.
The Atacama Large Millimeter/submillimeter Array(ALMA; Hills et al. 2010) has begun operation in Chile, provid-ing unprecedented submillimeter sensitivity even in early sci-ence. In this work, we employ ALMA to measure the arcsecond-scale structure of dusty extragalactic SPT sources at millimeterwavelengths, confirming the lensed nature of the four sourcespresented here. The observations reported here represent <10%of our Cycle 0 sample and use only the compact configura-tion data, which was delivered first. Nevertheless, from these
ALMA data, we are able to model the lensing geometry of thesesources and de-magnify them, allowing them to be placed inthe proper context within the high-redshift galaxy population.We are also able to infer the total mass and ellipticity of thelenses, a first step toward using the lensed submillimeter emis-sion to characterize the lensing potential and its substructure. InSection 2, we describe the ALMA observations and supportingdata, and in Section 3 we describe a modeling technique forinterferometric measurements of gravitationally lensed sources.Additional details on the integrated self-calibration step are in-cluded in the Appendix. In Section 4, we discuss the proper-ties of the sources and lenses and present the conclusions inSection 5. Throughout this work, we assume a ΛCDM cosmol-ogy, with WMAP7 parameters, with h = 0.71, ΩM = 0.27, andΩΛ = 0.73 (Komatsu et al. 2011).
2. OBSERVATIONS
2.1. ALMA Imaging
The primary observations for this work were obtained fromALMA under a Cycle 0 program (2011.0.00958.S; PI: D.Marrone) in which 47 sources identified in the SPT surveyare each observed in both the compact and extended arrayconfigurations. The first data release for this program includes20 sources observed in the compact array configuration; here,we focus on the four sources for which these low-resolution datawere sufficient to resolve the targets into multiple components.Of the remaining 16 sources, at least 8 are not point-like at theresolution of these observations, but we defer lens modeling forthese sources until the remaining data are in hand.
The sources were targeted for brief snapshot observationswith the dual-polarization Band 7 (275–373 GHz) receivers ontwo dates, 2011 November 16 and 28. The first local oscillatorwas set to 343.8 GHz, with all four spectral windows configuredin time domain mode with 128 channels of 15.625 MHz widthcentered at 5.125 and 7 GHz IF in each sideband. Therewere 16 and 14 antennas available on these days, respectively,arranged in a compact configuration. The total elapsed time(for all sources, including those not published here) in theobservations was approximately 4.1 hr. The total integrationtime per source was 61 and 91 s in the first and second tracks,respectively, with 6.1-s sampling of the visibility data. The arrayalternately observed the science targets and gain calibrators(30 s), observing the calibrator every three to four minutes.Additional sources with known positions, precisely establishedagainst the International Celestial Reference Frame using verylong baseline interferometry (Ma et al. 1998), were added to thetracks to verify astrometry and calibration and observed withthe same cycle as the science targets.
The flux scale was set with observations of Callisto on the firstday. On the second day, the flux scale was derived by setting theflux of quasar J0403-360 to 1.84 Jy, as reported by the ALMAstaff from adjacent calibration observations. The absolute fluxdensity scale is correct to within 15%. The antenna gains areequalized through gain calibration (amplitude and phase) on themain calibrators in each track. Short-timescale phase correctionis achieved using the ALMA water vapor radiometry (WVR)system. Very little variation is observed in these gain amplitudesthrough the tracks, and there is no evidence for atmosphericdecorrelation on the longest baselines in the phase scatter of thetarget or calibrator visibilities after WVR phase correction. Thedata were processed with the Common Astronomy Software
2
The Astrophysical Journal, 767:132 (11pp), 2013 April 20 Hezaveh et al.
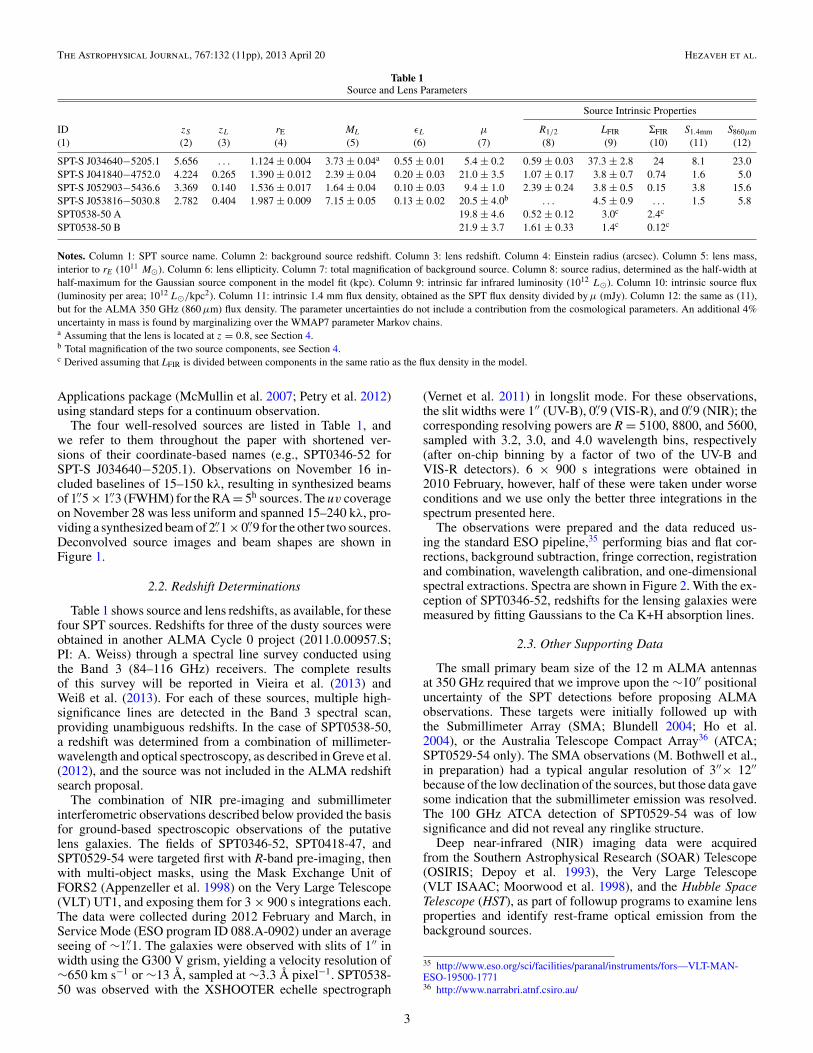
Table 1Source and Lens Parameters
Source Intrinsic Properties
ID zS zL rE ML εL μ R1/2 LFIR ΣFIR S1.4mm S860μm
(1) (2) (3) (4) (5) (6) (7) (8) (9) (10) (11) (12)
SPT-S J034640−5205.1 5.656 . . . 1.124 ± 0.004 3.73 ± 0.04a 0.55 ± 0.01 5.4 ± 0.2 0.59 ± 0.03 37.3 ± 2.8 24 8.1 23.0SPT-S J041840−4752.0 4.224 0.265 1.390 ± 0.012 2.39 ± 0.04 0.20 ± 0.03 21.0 ± 3.5 1.07 ± 0.17 3.8 ± 0.7 0.74 1.6 5.0SPT-S J052903−5436.6 3.369 0.140 1.536 ± 0.017 1.64 ± 0.04 0.10 ± 0.03 9.4 ± 1.0 2.39 ± 0.24 3.8 ± 0.5 0.15 3.8 15.6SPT-S J053816−5030.8 2.782 0.404 1.987 ± 0.009 7.15 ± 0.05 0.13 ± 0.02 20.5 ± 4.0b . . . 4.5 ± 0.9 . . . 1.5 5.8SPT0538-50 A 19.8 ± 4.6 0.52 ± 0.12 3.0c 2.4c
SPT0538-50 B 21.9 ± 3.7 1.61 ± 0.33 1.4c 0.12c
Notes. Column 1: SPT source name. Column 2: background source redshift. Column 3: lens redshift. Column 4: Einstein radius (arcsec). Column 5: lens mass,interior to rE (1011 M). Column 6: lens ellipticity. Column 7: total magnification of background source. Column 8: source radius, determined as the half-width athalf-maximum for the Gaussian source component in the model fit (kpc). Column 9: intrinsic far infrared luminosity (1012 L). Column 10: intrinsic source flux(luminosity per area; 1012 L/kpc2). Column 11: intrinsic 1.4 mm flux density, obtained as the SPT flux density divided by μ (mJy). Column 12: the same as (11),but for the ALMA 350 GHz (860 μm) flux density. The parameter uncertainties do not include a contribution from the cosmological parameters. An additional 4%uncertainty in mass is found by marginalizing over the WMAP7 parameter Markov chains.a Assuming that the lens is located at z = 0.8, see Section 4.b Total magnification of the two source components, see Section 4.c Derived assuming that LFIR is divided between components in the same ratio as the flux density in the model.
Applications package (McMullin et al. 2007; Petry et al. 2012)using standard steps for a continuum observation.
The four well-resolved sources are listed in Table 1, andwe refer to them throughout the paper with shortened ver-sions of their coordinate-based names (e.g., SPT0346-52 forSPT-S J034640−5205.1). Observations on November 16 in-cluded baselines of 15–150 kλ, resulting in synthesized beamsof 1.′′5 × 1.′′3 (FWHM) for the RA = 5h sources. The uv coverageon November 28 was less uniform and spanned 15–240 kλ, pro-viding a synthesized beam of 2.′′1 × 0.′′9 for the other two sources.Deconvolved source images and beam shapes are shown inFigure 1.
2.2. Redshift Determinations
Table 1 shows source and lens redshifts, as available, for thesefour SPT sources. Redshifts for three of the dusty sources wereobtained in another ALMA Cycle 0 project (2011.0.00957.S;PI: A. Weiss) through a spectral line survey conducted usingthe Band 3 (84–116 GHz) receivers. The complete resultsof this survey will be reported in Vieira et al. (2013) andWeiß et al. (2013). For each of these sources, multiple high-significance lines are detected in the Band 3 spectral scan,providing unambiguous redshifts. In the case of SPT0538-50,a redshift was determined from a combination of millimeter-wavelength and optical spectroscopy, as described in Greve et al.(2012), and the source was not included in the ALMA redshiftsearch proposal.
The combination of NIR pre-imaging and submillimeterinterferometric observations described below provided the basisfor ground-based spectroscopic observations of the putativelens galaxies. The fields of SPT0346-52, SPT0418-47, andSPT0529-54 were targeted first with R-band pre-imaging, thenwith multi-object masks, using the Mask Exchange Unit ofFORS2 (Appenzeller et al. 1998) on the Very Large Telescope(VLT) UT1, and exposing them for 3 × 900 s integrations each.The data were collected during 2012 February and March, inService Mode (ESO program ID 088.A-0902) under an averageseeing of ∼1.′′1. The galaxies were observed with slits of 1′′ inwidth using the G300 V grism, yielding a velocity resolution of∼650 km s−1 or ∼13 Å, sampled at ∼3.3 Å pixel−1. SPT0538-50 was observed with the XSHOOTER echelle spectrograph
(Vernet et al. 2011) in longslit mode. For these observations,the slit widths were 1′′ (UV-B), 0.′′9 (VIS-R), and 0.′′9 (NIR); thecorresponding resolving powers are R = 5100, 8800, and 5600,sampled with 3.2, 3.0, and 4.0 wavelength bins, respectively(after on-chip binning by a factor of two of the UV-B andVIS-R detectors). 6 × 900 s integrations were obtained in2010 February, however, half of these were taken under worseconditions and we use only the better three integrations in thespectrum presented here.
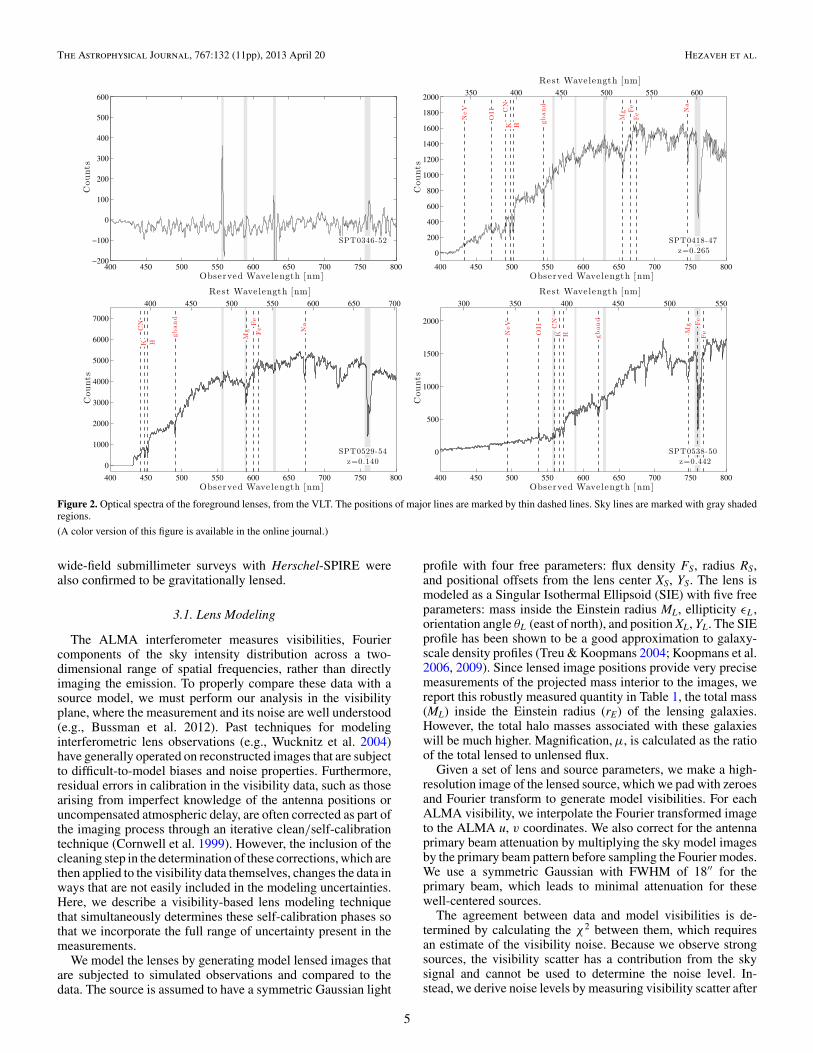
The observations were prepared and the data reduced us-ing the standard ESO pipeline,35 performing bias and flat cor-rections, background subtraction, fringe correction, registrationand combination, wavelength calibration, and one-dimensionalspectral extractions. Spectra are shown in Figure 2. With the ex-ception of SPT0346-52, redshifts for the lensing galaxies weremeasured by fitting Gaussians to the Ca K+H absorption lines.
2.3. Other Supporting Data
The small primary beam size of the 12 m ALMA antennasat 350 GHz required that we improve upon the ∼10′′ positionaluncertainty of the SPT detections before proposing ALMAobservations. These targets were initially followed up withthe Submillimeter Array (SMA; Blundell 2004; Ho et al.2004), or the Australia Telescope Compact Array36 (ATCA;SPT0529-54 only). The SMA observations (M. Bothwell et al.,in preparation) had a typical angular resolution of 3′′× 12′′because of the low declination of the sources, but those data gavesome indication that the submillimeter emission was resolved.The 100 GHz ATCA detection of SPT0529-54 was of lowsignificance and did not reveal any ringlike structure.
Deep near-infrared (NIR) imaging data were acquiredfrom the Southern Astrophysical Research (SOAR) Telescope(OSIRIS; Depoy et al. 1993), the Very Large Telescope(VLT ISAAC; Moorwood et al. 1998), and the Hubble SpaceTelescope (HST), as part of followup programs to examine lensproperties and identify rest-frame optical emission from thebackground sources.
35 http://www.eso.org/sci/facilities/paranal/instruments/fors—VLT-MAN-ESO-19500-177136 http://www.narrabri.atnf.csiro.au/
3
The Astrophysical Journal, 767:132 (11pp), 2013 April 20 Hezaveh et al.
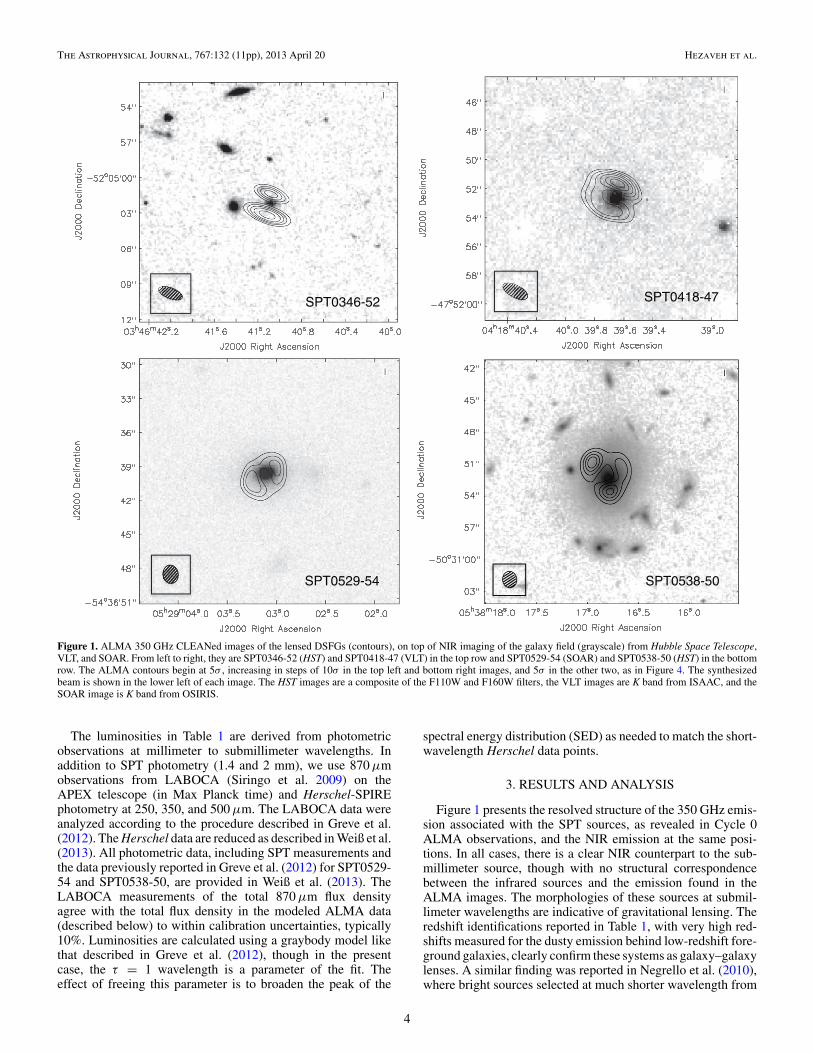
Figure 1. ALMA 350 GHz CLEANed images of the lensed DSFGs (contours), on top of NIR imaging of the galaxy field (grayscale) from Hubble Space Telescope,VLT, and SOAR. From left to right, they are SPT0346-52 (HST) and SPT0418-47 (VLT) in the top row and SPT0529-54 (SOAR) and SPT0538-50 (HST) in the bottomrow. The ALMA contours begin at 5σ , increasing in steps of 10σ in the top left and bottom right images, and 5σ in the other two, as in Figure 4. The synthesizedbeam is shown in the lower left of each image. The HST images are a composite of the F110W and F160W filters, the VLT images are K band from ISAAC, and theSOAR image is K band from OSIRIS.
The luminosities in Table 1 are derived from photometricobservations at millimeter to submillimeter wavelengths. Inaddition to SPT photometry (1.4 and 2 mm), we use 870 μmobservations from LABOCA (Siringo et al. 2009) on theAPEX telescope (in Max Planck time) and Herschel-SPIREphotometry at 250, 350, and 500 μm. The LABOCA data wereanalyzed according to the procedure described in Greve et al.(2012). The Herschel data are reduced as described in Weiß et al.(2013). All photometric data, including SPT measurements andthe data previously reported in Greve et al. (2012) for SPT0529-54 and SPT0538-50, are provided in Weiß et al. (2013). TheLABOCA measurements of the total 870 μm flux densityagree with the total flux density in the modeled ALMA data(described below) to within calibration uncertainties, typically10%. Luminosities are calculated using a graybody model likethat described in Greve et al. (2012), though in the presentcase, the τ = 1 wavelength is a parameter of the fit. Theeffect of freeing this parameter is to broaden the peak of the
spectral energy distribution (SED) as needed to match the short-wavelength Herschel data points.
3. RESULTS AND ANALYSIS
Figure 1 presents the resolved structure of the 350 GHz emis-sion associated with the SPT sources, as revealed in Cycle 0ALMA observations, and the NIR emission at the same posi-tions. In all cases, there is a clear NIR counterpart to the sub-millimeter source, though with no structural correspondencebetween the infrared sources and the emission found in theALMA images. The morphologies of these sources at submil-limeter wavelengths are indicative of gravitational lensing. Theredshift identifications reported in Table 1, with very high red-shifts measured for the dusty emission behind low-redshift fore-ground galaxies, clearly confirm these systems as galaxy–galaxylenses. A similar finding was reported in Negrello et al. (2010),where bright sources selected at much shorter wavelength from
4
The Astrophysical Journal, 767:132 (11pp), 2013 April 20 Hezaveh et al.
Observed Wavelength [nm]
Cou
nts
SPT0346-52
400 450 500 550 600 650 700 750 800−200
−100
0
100
200
300
400
500
600
Observed Wavelength [nm]
Cou
nts
400 450 500 550 600 650 700 750 800
0
200
400
600
800
1000
1200
1400
1600
1800
2000
NeV
OII C
NK H gb
and
Mg F
eFe N
a
Rest Wavelength [nm]
SPT0418-47z=0.265
350 400 450 500 550 600
Observed Wavelength [nm]
Cou
nts
400 450 500 550 600 650 700 750 800
0
1000
2000
3000
4000
5000
6000
7000
CN
K H
gban
d
Mg
Fe
Fe Na
Rest Wavelength [nm]
SPT0529-54z=0.140
400 450 500 550 600 650 700
Observed Wavelength [nm]
Cou
nts
400 450 500 550 600 650 700 750 800
0
500
1000
1500
2000
NeV
OII C
NK H gb
and
Mg F
eFe
Rest Wavelength [nm]
SPT0538-50z=0.442
300 350 400 450 500 550
Figure 2. Optical spectra of the foreground lenses, from the VLT. The positions of major lines are marked by thin dashed lines. Sky lines are marked with gray shadedregions.
(A color version of this figure is available in the online journal.)
wide-field submillimeter surveys with Herschel-SPIRE werealso confirmed to be gravitationally lensed.
3.1. Lens Modeling
The ALMA interferometer measures visibilities, Fouriercomponents of the sky intensity distribution across a two-dimensional range of spatial frequencies, rather than directlyimaging the emission. To properly compare these data with asource model, we must perform our analysis in the visibilityplane, where the measurement and its noise are well understood(e.g., Bussman et al. 2012). Past techniques for modelinginterferometric lens observations (e.g., Wucknitz et al. 2004)have generally operated on reconstructed images that are subjectto difficult-to-model biases and noise properties. Furthermore,residual errors in calibration in the visibility data, such as thosearising from imperfect knowledge of the antenna positions oruncompensated atmospheric delay, are often corrected as part ofthe imaging process through an iterative clean/self-calibrationtechnique (Cornwell et al. 1999). However, the inclusion of thecleaning step in the determination of these corrections, which arethen applied to the visibility data themselves, changes the data inways that are not easily included in the modeling uncertainties.Here, we describe a visibility-based lens modeling techniquethat simultaneously determines these self-calibration phases sothat we incorporate the full range of uncertainty present in themeasurements.
We model the lenses by generating model lensed images thatare subjected to simulated observations and compared to thedata. The source is assumed to have a symmetric Gaussian light
profile with four free parameters: flux density FS, radius RS,and positional offsets from the lens center XS, YS. The lens ismodeled as a Singular Isothermal Ellipsoid (SIE) with five freeparameters: mass inside the Einstein radius ML, ellipticity εL,orientation angle θL (east of north), and position XL, YL. The SIEprofile has been shown to be a good approximation to galaxy-scale density profiles (Treu & Koopmans 2004; Koopmans et al.2006, 2009). Since lensed image positions provide very precisemeasurements of the projected mass interior to the images, wereport this robustly measured quantity in Table 1, the total mass(ML) inside the Einstein radius (rE) of the lensing galaxies.However, the total halo masses associated with these galaxieswill be much higher. Magnification, μ, is calculated as the ratioof the total lensed to unlensed flux.
Given a set of lens and source parameters, we make a high-resolution image of the lensed source, which we pad with zeroesand Fourier transform to generate model visibilities. For eachALMA visibility, we interpolate the Fourier transformed imageto the ALMA u, v coordinates. We also correct for the antennaprimary beam attenuation by multiplying the sky model imagesby the primary beam pattern before sampling the Fourier modes.We use a symmetric Gaussian with FWHM of 18′′ for theprimary beam, which leads to minimal attenuation for thesewell-centered sources.
The agreement between data and model visibilities is de-termined by calculating the χ2 between them, which requiresan estimate of the visibility noise. Because we observe strongsources, the visibility scatter has a contribution from the skysignal and cannot be used to determine the noise level. In-stead, we derive noise levels by measuring visibility scatter after
5

The Astrophysical Journal, 767:132 (11pp), 2013 April 20 Hezaveh et al.
L
0.5
0.55
0.6
θL
[deg
]
86
83.5
81
FS
[mJy]
21
23
25
RS
[arc
sec]
0.08
0.1
XS
[arc
sec]
0.23
0.27
YS
[arc
sec]
−0.3
−0.26
ML [1011 M ]
μ
3.6 3.8
5
5.5
6
L
0.5 0.55 0.6
θL [deg]86 83.581
FS [mJy]21 23 25
RS [arcsec ]0.08 0.1
XS [arcsec ]0.23 0.27
YS [arcsec ]−0.3 −0.25
Figure 3. Parameter degeneracy plot for SPT0346-52, a representative example of the model uncertainties. Some nuisance parameters are not shown. Marginalizeddistributions for each parameter along the bottom axis are shown as histograms on the diagonal. The bottom row shows correlations between μ, which is derived fromthe model and not a fit parameter, and the model parameters. The contours show the 1σ , 2σ , and 3σ confidence regions.
differencing visibilities that are adjacent in time for the samebaseline/polarization/IF, which has the effect of removing allsky signal. This gives results that are identical to those foundby scaling the visibility noise to obtain a reduced χ2 of unityfor the best-fit models. We explore the model parameter spaceusing a Markov Chain Monte Carlo (MCMC) method withMetropolis–Hastings sampling. An example of the parameterdegeneracies in these fits is shown in Figure 3.
An additional complication of the modeling procedure is thepresence of uncorrected antenna-based phase errors in the data.Observations of test sources, quasars with positions referencedto the International Celestial Reference Frame (ICRF), showsignificant residual phase errors after the primary phase cali-bration step. For simple source structures, self-calibration us-ing CLEAN components as input for the phase correction is
a standard procedure to improve image fidelity (e.g., Tayloret al. 1999). However, in this application, it would add sig-nificant complication to model the clean/self-cal process aspart of the fitting, and leaving the phase errors uncorrected cansignificantly bias the model parameters because of the strongsensitivity to image flux ratios in the model. We have there-fore developed a procedure to determine the self-cal phases aspart of the model fitting. We optimize the χ2 for each stepin the Markov chain by adjusting the N − 1 antenna phases.We find that the resulting phases vary little over the chainand closely resemble those found for nearby point sourcesadded to the tracks to test the calibration and astrometry, giv-ing us confidence in this method. Additional details of themethod and simulations of its effectiveness are provided inthe Appendix.
6
The Astrophysical Journal, 767:132 (11pp), 2013 April 20 Hezaveh et al.
DE
CL
INA
TIO
N
3h46m41.60s 41.30s 41.0s 40.7s
54
57
−52°05 00
03
06
09
12
SPT0346-52
0
0.1
0.2
0.3
0.4
0.5
0.5 arcsec
DE
CL
INA
TIO
N
4h18m40s 39.8s 39.5s 39.2s
44
47
50
53
56
59
−47°52 02
SPT0418-47
0.01
0.02
0.03
0.04
0.05
0.06
0.5 arcsec
DE
CL
INA
TIO
N
5h29m3.7s 3.2s 2.7s
30
33
36
39
42
45
−54°36 48
SPT0529-54
0.005
0.01
0.015
0.02
0.025
0.03
0.035
0.5 arcsec
RIGHT ASCENSION (J2000)
DE
CL
INA
TIO
N
5h38m17.50s 17.00s 16.50s
43
46
49
52
55
58
−50°30 01
SPT0538-50
0
0.01
0.02
0.03
0.04
0.05
0.06
0.5 arcsec
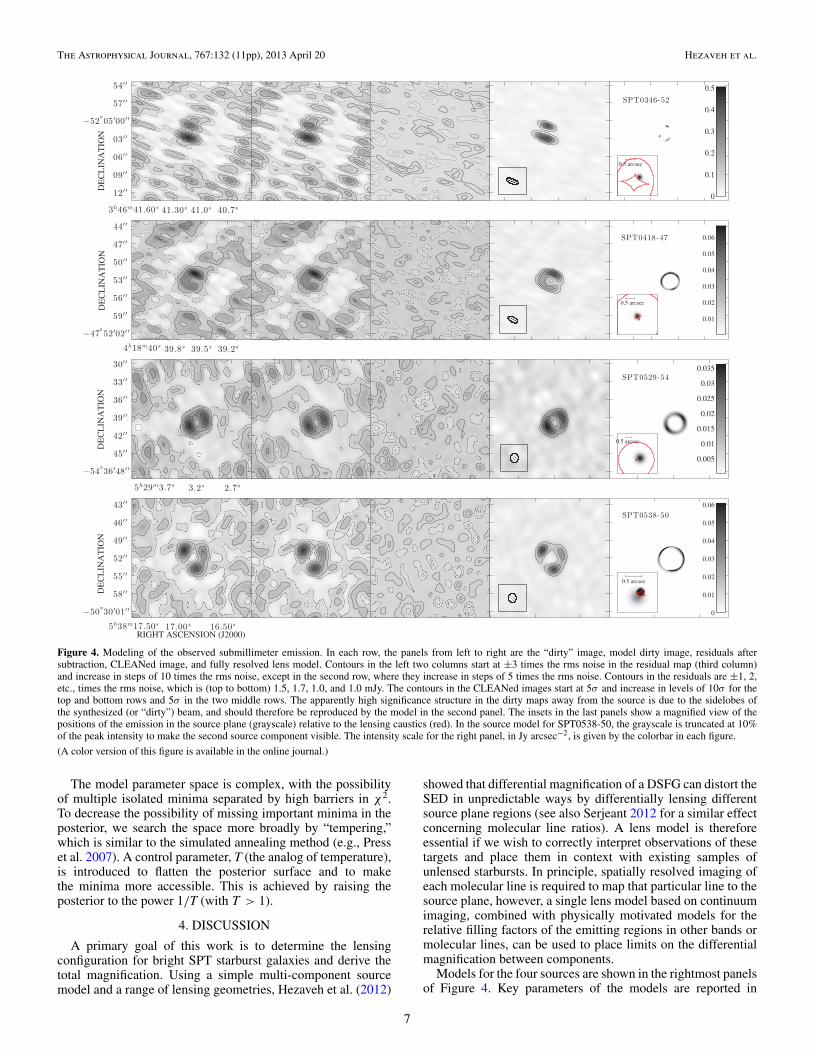
Figure 4. Modeling of the observed submillimeter emission. In each row, the panels from left to right are the “dirty” image, model dirty image, residuals aftersubtraction, CLEANed image, and fully resolved lens model. Contours in the left two columns start at ±3 times the rms noise in the residual map (third column)and increase in steps of 10 times the rms noise, except in the second row, where they increase in steps of 5 times the rms noise. Contours in the residuals are ±1, 2,etc., times the rms noise, which is (top to bottom) 1.5, 1.7, 1.0, and 1.0 mJy. The contours in the CLEANed images start at 5σ and increase in levels of 10σ for thetop and bottom rows and 5σ in the two middle rows. The apparently high significance structure in the dirty maps away from the source is due to the sidelobes ofthe synthesized (or “dirty”) beam, and should therefore be reproduced by the model in the second panel. The insets in the last panels show a magnified view of thepositions of the emission in the source plane (grayscale) relative to the lensing caustics (red). In the source model for SPT0538-50, the grayscale is truncated at 10%of the peak intensity to make the second source component visible. The intensity scale for the right panel, in Jy arcsec−2, is given by the colorbar in each figure.
(A color version of this figure is available in the online journal.)
The model parameter space is complex, with the possibilityof multiple isolated minima separated by high barriers in χ2.To decrease the possibility of missing important minima in theposterior, we search the space more broadly by “tempering,”which is similar to the simulated annealing method (e.g., Presset al. 2007). A control parameter, T (the analog of temperature),is introduced to flatten the posterior surface and to makethe minima more accessible. This is achieved by raising theposterior to the power 1/T (with T > 1).
4. DISCUSSION
A primary goal of this work is to determine the lensingconfiguration for bright SPT starburst galaxies and derive thetotal magnification. Using a simple multi-component sourcemodel and a range of lensing geometries, Hezaveh et al. (2012)
showed that differential magnification of a DSFG can distort theSED in unpredictable ways by differentially lensing differentsource plane regions (see also Serjeant 2012 for a similar effectconcerning molecular line ratios). A lens model is thereforeessential if we wish to correctly interpret observations of thesetargets and place them in context with existing samples ofunlensed starbursts. In principle, spatially resolved imaging ofeach molecular line is required to map that particular line to thesource plane, however, a single lens model based on continuumimaging, combined with physically motivated models for therelative filling factors of the emitting regions in other bands ormolecular lines, can be used to place limits on the differentialmagnification between components.
Models for the four sources are shown in the rightmost panelsof Figure 4. Key parameters of the models are reported in
7
The Astrophysical Journal, 767:132 (11pp), 2013 April 20 Hezaveh et al.
5 10 15 20 25 30 35 400
0.2
0.4
0.6
0.8
1
μ
dP
/dμ
SPT0346-52
SPT0418-47
SPT0529-54
SPT0538-50
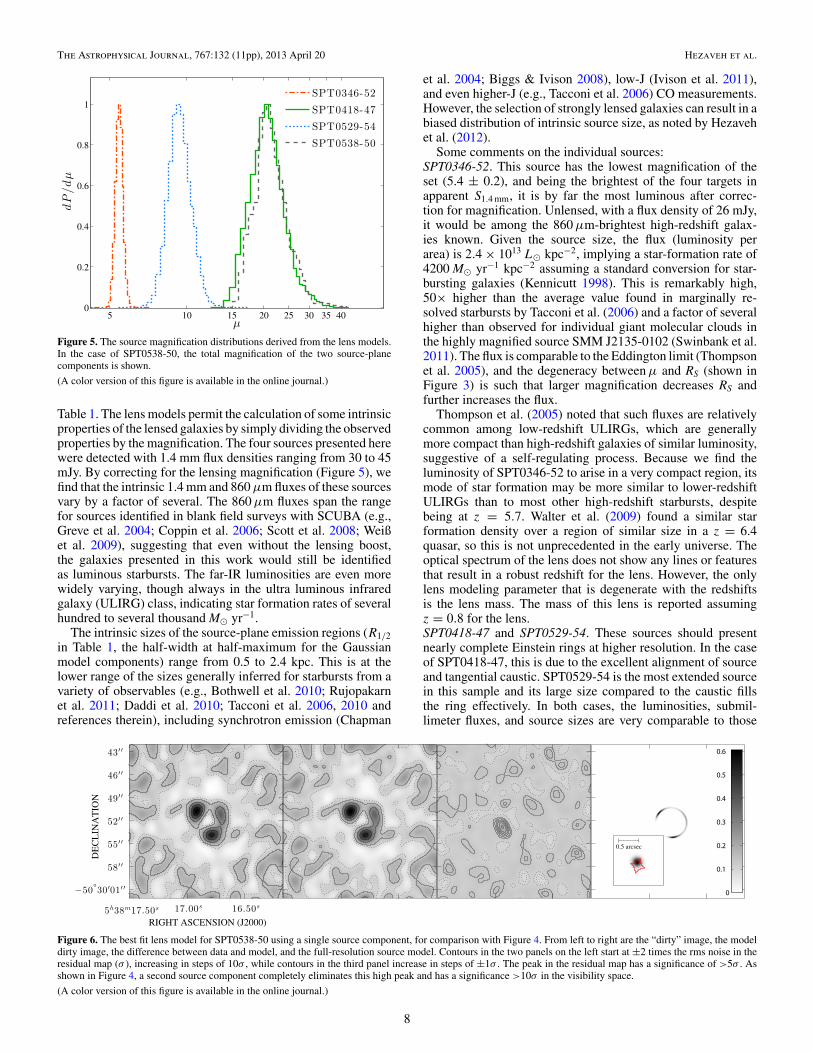
Figure 5. The source magnification distributions derived from the lens models.In the case of SPT0538-50, the total magnification of the two source-planecomponents is shown.
(A color version of this figure is available in the online journal.)
Table 1. The lens models permit the calculation of some intrinsicproperties of the lensed galaxies by simply dividing the observedproperties by the magnification. The four sources presented herewere detected with 1.4 mm flux densities ranging from 30 to 45mJy. By correcting for the lensing magnification (Figure 5), wefind that the intrinsic 1.4 mm and 860 μm fluxes of these sourcesvary by a factor of several. The 860 μm fluxes span the rangefor sources identified in blank field surveys with SCUBA (e.g.,Greve et al. 2004; Coppin et al. 2006; Scott et al. 2008; Weißet al. 2009), suggesting that even without the lensing boost,the galaxies presented in this work would still be identifiedas luminous starbursts. The far-IR luminosities are even morewidely varying, though always in the ultra luminous infraredgalaxy (ULIRG) class, indicating star formation rates of severalhundred to several thousand M yr−1.
The intrinsic sizes of the source-plane emission regions (R1/2in Table 1, the half-width at half-maximum for the Gaussianmodel components) range from 0.5 to 2.4 kpc. This is at thelower range of the sizes generally inferred for starbursts from avariety of observables (e.g., Bothwell et al. 2010; Rujopakarnet al. 2011; Daddi et al. 2010; Tacconi et al. 2006, 2010 andreferences therein), including synchrotron emission (Chapman
et al. 2004; Biggs & Ivison 2008), low-J (Ivison et al. 2011),and even higher-J (e.g., Tacconi et al. 2006) CO measurements.However, the selection of strongly lensed galaxies can result in abiased distribution of intrinsic source size, as noted by Hezavehet al. (2012).
Some comments on the individual sources:SPT0346-52. This source has the lowest magnification of theset (5.4 ± 0.2), and being the brightest of the four targets inapparent S1.4 mm, it is by far the most luminous after correc-tion for magnification. Unlensed, with a flux density of 26 mJy,it would be among the 860 μm-brightest high-redshift galax-ies known. Given the source size, the flux (luminosity perarea) is 2.4 × 10¹³ L kpc−2, implying a star-formation rate of4200 M yr−1 kpc−2 assuming a standard conversion for star-bursting galaxies (Kennicutt 1998). This is remarkably high,50× higher than the average value found in marginally re-solved starbursts by Tacconi et al. (2006) and a factor of severalhigher than observed for individual giant molecular clouds inthe highly magnified source SMM J2135-0102 (Swinbank et al.2011). The flux is comparable to the Eddington limit (Thompsonet al. 2005), and the degeneracy between μ and RS (shown inFigure 3) is such that larger magnification decreases RS andfurther increases the flux.
Thompson et al. (2005) noted that such fluxes are relativelycommon among low-redshift ULIRGs, which are generallymore compact than high-redshift galaxies of similar luminosity,suggestive of a self-regulating process. Because we find theluminosity of SPT0346-52 to arise in a very compact region, itsmode of star formation may be more similar to lower-redshiftULIRGs than to most other high-redshift starbursts, despitebeing at z = 5.7. Walter et al. (2009) found a similar starformation density over a region of similar size in a z = 6.4quasar, so this is not unprecedented in the early universe. Theoptical spectrum of the lens does not show any lines or featuresthat result in a robust redshift for the lens. However, the onlylens modeling parameter that is degenerate with the redshiftsis the lens mass. The mass of this lens is reported assumingz = 0.8 for the lens.SPT0418-47 and SPT0529-54. These sources should presentnearly complete Einstein rings at higher resolution. In the caseof SPT0418-47, this is due to the excellent alignment of sourceand tangential caustic. SPT0529-54 is the most extended sourcein this sample and its large size compared to the caustic fillsthe ring effectively. In both cases, the luminosities, submil-limeter fluxes, and source sizes are very comparable to those
RIGHT ASCENSION (J2000)
DE
CL
INA
TIO
N
5h38m17.50s 17.00s 16.50s
43
46
49
52
55
58
−50°30 01
0.5 arcsec
Figure 6. The best fit lens model for SPT0538-50 using a single source component, for comparison with Figure 4. From left to right are the “dirty” image, the modeldirty image, the difference between data and model, and the full-resolution source model. Contours in the two panels on the left start at ±2 times the rms noise in theresidual map (σ ), increasing in steps of 10σ , while contours in the third panel increase in steps of ±1σ . The peak in the residual map has a significance of >5σ . Asshown in Figure 4, a second source component completely eliminates this high peak and has a significance >10σ in the visibility space.
(A color version of this figure is available in the online journal.)
8

The Astrophysical Journal, 767:132 (11pp), 2013 April 20 Hezaveh et al.
RIGHT ASCENSION (J2000)
DE
CL
INA
TIO
N
4h18m40.5s 40s 39.5s 39.0s
41
44
47
50
53
56
59
−47°52 02
03
2 arcsec
Figure 7. A comparison of image residuals for three different corrections to the antenna phases. The dirty image of SPT0418-47 is shown in grayscale beneath eachpanel. Contours show the image residuals after the source model is subtracted from the dirty image. Left: residual structure after the model that fits the raw data(no self-calibration) best is subtracted from the data. Middle: the same, but for data calibrated using a CLEAN-based self-calibration. Right: the same, but for datacalibrated using the procedure described in this work. The presence of residual structure away from the source, with no corresponding residual at the source position,is a clear sign of imperfectly corrected phase in the left two panels.
observed in other samples of distant starburst galaxies (e.g., Ru-jopakarn et al. 2011). The posterior of the model parameters forSPT0529-54 show two separate peaks in the lens and sourcepositions, but the magnifications of both models are similar.The extended array data on this source can possibly break thisdegeneracy.SPT0538-50. The large angular size of this ring suggests a mas-sive lens, with the models indicating that the lens has a projectedmass of nearly 1012 M within a radius of 10 kpc. Close align-ment between the compact source (labeled component “A” inTable 1) and caustic again leads to a large magnification. Asingle-component source does not provide an adequate fit, leav-ing a significant residual structure to the south east of the lenscenter (Figure 6). A far better match to the data is the modelshown in Figure 4 (bottom), which includes a second sourcecomponent (labeled component “B” in Table 1) offset from andmuch more extended than the first, and representing 30% of thetotal source-plane luminosity.
5. CONCLUSION
We have used ALMA to image the submillimeter emissionfrom four DSFGs discovered by the SPT. We find that theseobjects resolve into ring-like structures expected from gravita-tional lensing, a picture confirmed by the redshift informationwe have for the submillimeter emission and NIR counterparts.We present a visibility modeling procedure to fit gravitationallens models to these data and simultaneously correct the un-known phase errors of the antennas introduced by, e.g., im-perfect antenna positions. From this technique, we are able tocorrect for the magnification of the sources presented in thiswork and derive intrinsic properties, finding the galaxies to betypical high-redshift, DSFGs. The sensitivity of ALMA per-mits these lens models to be constrained in short observations.Longer observations of lensed starbursts in future cycles willtherefore enable studies of ISM structure and lower luminos-ity molecular lines that are otherwise impossible to observe inunlensed systems.
The SPT is supported by the National Science Founda-tion through grant ANT-0638937, with partial support throughPHY-1125897, the Kavli Foundation, and the Gordon and
Betty Moore Foundation. This paper makes use of the fol-lowing ALMA data: ADS/JAO.ALMA #2011.0.00957.S and#2011.0.00958.S. ALMA is a partnership of ESO (representingits member states), NSF (USA) and NINS (Japan), together withNRC (Canada) and NSC and ASIAA (Taiwan), in cooperationwith the Republic of Chile. The Joint ALMA Observatory isoperated by ESO, AUI/NRAO and NAOJ. The National RadioAstronomy Observatory is a facility of the National ScienceFoundation operated under cooperative agreement by Associ-ated Universities, Inc. Partial support for this work was pro-vided by NASA through grant HST-GO-12659 from the SpaceTelescope Science Institute and an award for Herschel analysisissued by JPL/Caltech for OT2_jvieira_5. Work at McGill issupported by NSERC, the CRC program, and CIfAR. Y.D.H.acknowledges the support of FQRNT through InternationalTraining Program and Doctoral Research scholarships. T.R.G.acknowledges support from the Science and TechnologiesFacilities Council.
APPENDIX
A.1. Lens Model Self-Calibration
Interferometric phase calibration procedures generally leavesome residual phase errors due to imperfect baseline solutions,uncompensated atmospheric delays, or other effects. The magni-tude of these errors depends on many factors, such as calibrationinterval and calibrator-source separation, and their importancedepends on the signal to noise ratio in the data and the complex-ity of the imaging task. In the present application, small phaseerrors can redistribute flux between lensed images, and withoutproperly accounting for such effects in our lens modeling, thederived model parameter distributions may be significantly inerror.
A standard procedure to correct antenna-based phase errorsis self-calibration. Using a source model derived from imagesof the corrupted visibilities, phase corrections are derived, thesource is re-imaged, and another iteration can be made using anew source model produced from the phase-corrected visibil-ities. For our present purposes, the most significant disadvan-tage of this phase correction scheme is that the uncertaintiesassociated with the source model against which the data are
9
The Astrophysical Journal, 767:132 (11pp), 2013 April 20 Hezaveh et al.
−20 −15 −10 −5 0 5 10 15 200
5
10
15
20
25
30
phase error[degree ]
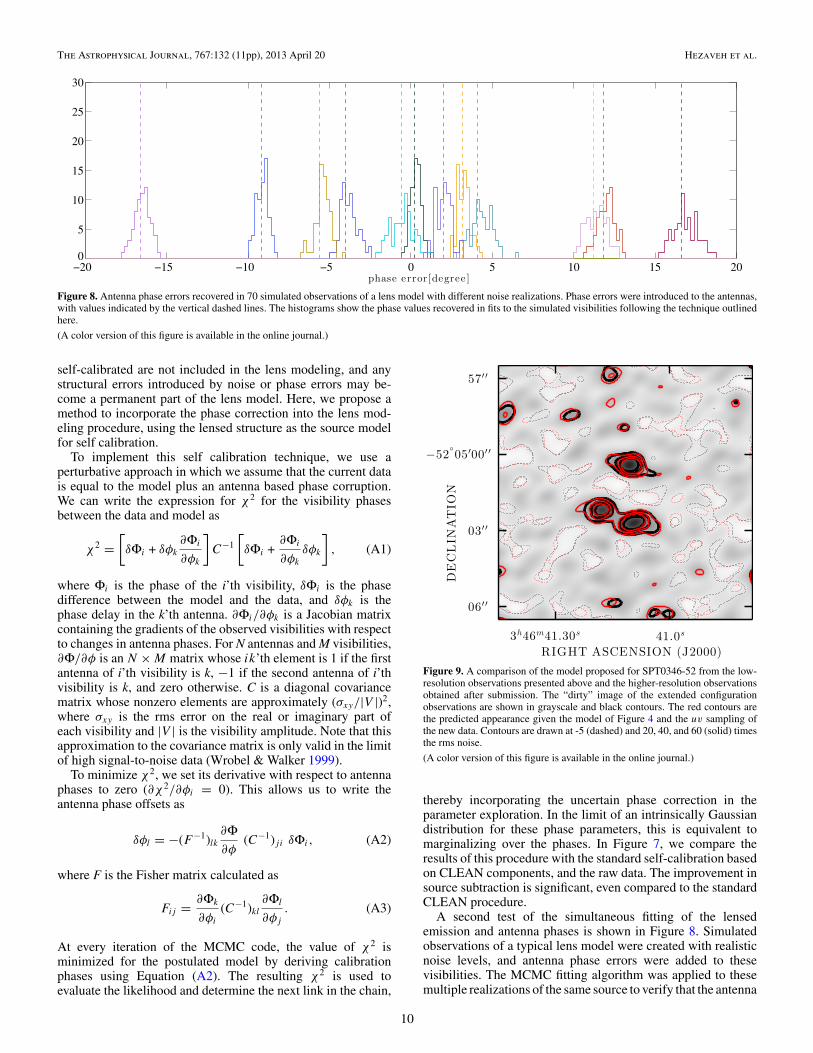
Figure 8. Antenna phase errors recovered in 70 simulated observations of a lens model with different noise realizations. Phase errors were introduced to the antennas,with values indicated by the vertical dashed lines. The histograms show the phase values recovered in fits to the simulated visibilities following the technique outlinedhere.
(A color version of this figure is available in the online journal.)
self-calibrated are not included in the lens modeling, and anystructural errors introduced by noise or phase errors may be-come a permanent part of the lens model. Here, we propose amethod to incorporate the phase correction into the lens mod-eling procedure, using the lensed structure as the source modelfor self calibration.
To implement this self calibration technique, we use aperturbative approach in which we assume that the current datais equal to the model plus an antenna based phase corruption.We can write the expression for χ2 for the visibility phasesbetween the data and model as
χ2 =[δΦi + δφk
∂Φi
∂φk
]C−1
[δΦi +
∂Φi
∂φk
δφk
], (A1)
where Φi is the phase of the i’th visibility, δΦi is the phasedifference between the model and the data, and δφk is thephase delay in the k’th antenna. ∂Φi/∂φk is a Jacobian matrixcontaining the gradients of the observed visibilities with respectto changes in antenna phases. For N antennas and M visibilities,∂Φ/∂φ is an N × M matrix whose ik’th element is 1 if the firstantenna of i’th visibility is k, −1 if the second antenna of i’thvisibility is k, and zero otherwise. C is a diagonal covariancematrix whose nonzero elements are approximately (σxy/|V |)2,where σxy is the rms error on the real or imaginary part ofeach visibility and |V | is the visibility amplitude. Note that thisapproximation to the covariance matrix is only valid in the limitof high signal-to-noise data (Wrobel & Walker 1999).
To minimize χ2, we set its derivative with respect to antennaphases to zero (∂χ2/∂φi = 0). This allows us to write theantenna phase offsets as
δφl = −(F−1)lk∂Φ∂φ
(C−1)ji δΦi , (A2)
where F is the Fisher matrix calculated as
Fij = ∂Φk
∂φi
(C−1)kl
∂Φl
∂φj
. (A3)
At every iteration of the MCMC code, the value of χ2 isminimized for the postulated model by deriving calibrationphases using Equation (A2). The resulting χ2 is used toevaluate the likelihood and determine the next link in the chain,
RIGHT ASCENSION (J2000)
DE
CL
INA
TIO
N
3h46m41.30s 41.0s
57
−52°05 00
03
06
Figure 9. A comparison of the model proposed for SPT0346-52 from the low-resolution observations presented above and the higher-resolution observationsobtained after submission. The “dirty” image of the extended configurationobservations are shown in grayscale and black contours. The red contours arethe predicted appearance given the model of Figure 4 and the uv sampling ofthe new data. Contours are drawn at -5 (dashed) and 20, 40, and 60 (solid) timesthe rms noise.
(A color version of this figure is available in the online journal.)
thereby incorporating the uncertain phase correction in theparameter exploration. In the limit of an intrinsically Gaussiandistribution for these phase parameters, this is equivalent tomarginalizing over the phases. In Figure 7, we compare theresults of this procedure with the standard self-calibration basedon CLEAN components, and the raw data. The improvement insource subtraction is significant, even compared to the standardCLEAN procedure.
A second test of the simultaneous fitting of the lensedemission and antenna phases is shown in Figure 8. Simulatedobservations of a typical lens model were created with realisticnoise levels, and antenna phase errors were added to thesevisibilities. The MCMC fitting algorithm was applied to thesemultiple realizations of the same source to verify that the antenna
10

The Astrophysical Journal, 767:132 (11pp), 2013 April 20 Hezaveh et al.
phase errors are recovered. The excellent agreement betweeninput and recovered phase demonstrates that the simultaneousfitting of the lens model and antenna phases does not bias theantenna phase measurement, despite the complicated sourcestructure of the lens models.
A.2. High Resolution Observations of Spt0346-52
The models in Figure 4 were derived using the compactconfiguration data that were available at the time of submission.Higher resolution data were delivered later, and permit a directcomparison of the model based on the low-resolution data withthe higher resolution observations of SPT0346-52. Figure 9shows the predictions of the best fit model (from fitting to thecompact data, presented earlier in this work) for the uv-coverageof the extended data (red contours). The black contours showthe extended data. The contours demonstrate a high degree ofagreement between the predictions and the new observations.A lens model for the extended configuration data shows aconsistent model, resulting in magnification (from modelingthe extended data alone) of 5.26 ± 0.12 in agreement with themagnification derived from the compact data.
REFERENCES
Appenzeller, I., Fricke, K., Furtig, W., et al. 1998, Msngr, 94, 1Barger, A. J., Cowie, L. L., Sanders, D. B., et al. 1998, Natur, 394, 248Biggs, A. D., & Ivison, R. J. 2008, MNRAS, 385, 893Blain, A. W. 1996, MNRAS, 283, 1340Blundell, R. 2004, in Proc. 15th International Symposium on Space Terahertz
Technology, ed. G. Narayanan (Northampton, MA: Univ. of Massachusetts),3
Bothwell, M. S., Chapman, S. C., Tacconi, L., et al. 2010, MNRAS,405, 219
Bussmann, R. S., Gurwell, M. A., Fu, H., et al. 2012, ApJ, 756, 134Carlstrom, J. E., Ade, P. A. R., Aird, K. A., et al. 2011, PASP, 123, 568Chapman, S. C., Blain, A. W., Smail, I., & Ivison, R. J. 2005, ApJ,
622, 772Chapman, S. C., Smail, I., Windhorst, R., Muxlow, T., & Ivison, R. J. 2004, ApJ,
611, 732Coppin, K., Chapin, E. L., Mortier, A. M. J., et al. 2006, MNRAS, 372, 1621Cornwell, T., Braun, R., & Briggs, D. S. 1999, in ASP Conf. Ser. 180, Synthesis
Imaging in Radio Astronomy II, ed. G. B. Taylor, C. L. Carilli, & R. A.Perley (San Francisco, CA: ASP), 151
Daddi, E., Bournaud, F., Walter, F., et al. 2010, ApJ, 713, 686Depoy, D. L., Atwood, B., Byard, P. L., Frogel, J., & O’Brien, T. P. 1993, Proc.
SPIE, 1946, 667Dole, H., Lagache, G., Puget, J.-L., et al. 2006, A&A, 451, 417Fixsen, D. J., Dwek, E., Mather, J. C., Bennett, C. L., & Shafer, R. A. 1998, ApJ,
508, 123Fu, H., Jullo, E., Cooray, A., et al. 2012, ApJ, 753, 134
Greve, T. R., Ivison, R. J., Bertoldi, F., et al. 2004, MNRAS, 354, 779Greve, T. R., Vieira, J. D., Weiß, A., et al. 2012, ApJ, 756, 101Hauser, M. G., Arendt, R. G., Kelsall, T., et al. 1998, ApJ, 508, 25Hezaveh, Y. D., & Holder, G. P. 2011, ApJ, 734, 52Hezaveh, Y. D., Marrone, D. P., & Holder, G. P. 2012, arXiv:1203.3267Hills, R. E., Kurz, R. J., & Peck, A. B. 2010, Proc. SPIE, 7733, 773317Ho, P. T. P., Moran, J. M., & Lo, K. Y. 2004, ApJL, 616, L1Hughes, D. H., Serjeant, S., Dunlop, J., et al. 1998, Natur, 394, 241Ivison, R. J., Papadopoulos, P. P., Smail, I., et al. 2011, MNRAS, 412, 1913Kennicutt, R. C., Jr. 1998, ARA&A, 36, 189Kneib, J.-P., van der Werf, P. P., Kraiberg Knudsen, K., et al. 2004, MNRAS,
349, 1211Komatsu, E., Smith, K. M., Dunkley, J., et al. 2011, ApJS, 192, 18Koopmans, L. V. E., Bolton, A., Treu, T., et al. 2009, ApJL, 703, L51Koopmans, L. V. E., Treu, T., Bolton, A. S., Burles, S., & Moustakas, L. A.
2006, ApJ, 649, 599Lagache, G., Puget, J.-L., & Dole, H. 2005, ARA&A, 43, 727Ma, C., Arias, E. F., Eubanks, T. M., et al. 1998, AJ, 116, 516McMullin, J. P., Waters, B., Schiebel, D., Young, W., & Golap, K. 2007, in ASP
Conf. Ser. 376, Astronomical Data Analysis Software and Systems XVI, ed.R. A. Shaw, F. Hill, & D. J. Bell (San Francisco, CA: ASP), 127
Moorwood, A., Cuby, J.-G., Biereichel, P., et al. 1998, Msngr, 94, 7Negrello, M., Hopwood, R., De Zotti, G., et al. 2010, Sci, 330, 800Negrello, M., Perrotta, F., Gonzalez-Nuevo, J., et al. 2007, MNRAS, 377, 1557Petry, D., & the CASA Development Team 2012, in ASP Conf. Ser., Vol. 461,
Astronomical Data Analysis Software and Systems XXI, ed. P. Ballester, D.Egret, & N. P. F. Lorente (San Francisco, CA: ASP), 849
Press, W. H., Teukolsky, S. A., Vetterling, W. T., & Flannery, B. P. 2007,Numerical Recipes: The Art of Scientific Computing (3rd ed.; New York:Cambridge Univ. Press)
Puget, J.-L., Abergel, A., Bernard, J.-P., et al. 1996, A&A, 308, L5Riechers, D. A., Cooray, A., Omont, A., et al. 2011, ApJL, 733, L12Rujopakarn, W., Rieke, G. H., Eisenstein, D. J., & Juneau, S. 2011, ApJ,
726, 93Scott, K. S., Austermann, J. E., Perera, T. A., et al. 2008, MNRAS, 385, 2225Serjeant, S. 2012, MNRAS, 424, 2429Siringo, G., Kreysa, E., Kovacs, A., et al. 2009, A&A, 497, 945Smail, I., Ivison, R. J., & Blain, A. W. 1997, ApJL, 490, L5Swinbank, A. M., Papadopoulos, P. P., Cox, P., et al. 2011, ApJ, 742, 11Swinbank, A. M., Smail, I., Longmore, S., et al. 2010, Natur, 464, 733Tacconi, L. J., Genzel, R., Neri, R., et al. 2010, Natur, 463, 781Tacconi, L. J., Neri, R., Chapman, S. C., et al. 2006, ApJ, 640, 228Taylor, G. B., Carilli, C. L., & Perley, R. A. (ed.) 1999, ASP Conf. Ser. 180,
Synthesis Imaging in Radio Astronomy II (San Francisco, CA: ASP)Thompson, T. A., Quataert, E., & Murray, N. 2005, ApJ, 630, 167Treu, T., & Koopmans, L. V. E. 2004, ApJ, 611, 739Vernet, J., Dekker, H., D’Odorico, S., et al. 2011, A&A, 536, A105Vieira, J. D., Crawford, T. M., Switzer, E. R., et al. 2010, ApJ, 719, 763Vieira, J. D., et al. 2013, Natur, 495, 344Walter, F., Riechers, D., Cox, P., et al. 2009, Natur, 457, 699Wardlow, J. L., Cooray, A., De Bernardis, F., et al. 2013, ApJ, 762, 59Weiß, A., De Breuck, C., Marrone, D. P., et al. 2013, ApJ, 767, 88Weiß, A., Kovacs, A., Coppin, K., et al. 2009, ApJ, 707, 1201Wrobel, J. M., & Walker, R. C. 1999, in ASP Conf. Ser. 180, Synthesis Imaging
in Radio Astronomy II, ed. G. B. Taylor, C. L. Carilli, & R. A. Perley (SanFrancisco, CA: ASP), 171
Wucknitz, O., Biggs, A. D., & Browne, I. W. A. 2004, MNRAS, 349, 14
11