ALMA MATER STUDIORUM - UNIVERSITÀ DI...
198
ALMA MATER STUDIORUM - UNIVERSITÀ DI BOLOGNA DOTTORATO IN INGEGNERIA CIVILE E AMBIENTALE Ciclo XXVI Settore Concorsuale di afferenza: 08/B3-TECNICA DELLE COSTRUZIONI Settore Scientifico disciplinare: ICAR/09-TECNICA DELLE COSTRUZIONI The effect of two-dimensional squat elements on the seismic behavior of building structures Michele Palermo COORDINATORE RELATORE: Prof. Alberto Lamberti Prof. Tomaso Trombetti CORRELATORE: Prof. Enrique Hernandez-Montes Prof. Filip Filippou Dr. Stefano Silvestri Esame finale anno 2014
Transcript of ALMA MATER STUDIORUM - UNIVERSITÀ DI...

ALMA MATER STUDIORUM -
UNIVERSITÀ DI BOLOGNA
DOTTORATO IN
INGEGNERIA CIVILE E AMBIENTALE
Ciclo XXVI
Settore Concorsuale di afferenza: 08/B3-TECNICA DELLE COSTRUZIONI
Settore Scientifico disciplinare: ICAR/09-TECNICA DELLE COSTRUZIONI
The effect of two-dimensional squat elements
on the seismic behavior of building structures
Michele Palermo
COORDINATORE RELATORE:
Prof. Alberto Lamberti Prof. Tomaso Trombetti
CORRELATORE:
Prof. Enrique Hernandez-Montes
Prof. Filip Filippou
Dr. Stefano Silvestri
Esame finale anno 2014


Abstract
i
ABSTRACT
This thesis reports a study on the seismic response of two-dimensional squat elements
and their effect on the behavior of building structures. Part A is devoted to the study of
unreinforced masonry infills, while part B is focused on reinforced concrete sandwich
walls.
Part A begins with a comprehensive review of modelling techniques and code
provisions for infilled frame structures. Then state-of-the-practice techniques are
applied for a real case to test the ability of actual modeling techniques to reproduce
observed behaviors. The first developments towards a seismic-resistant masonry infill
system are presented. Preliminary design recommendations for the seismic design of
the seismic-resistant masonry infill are finally provided.
Part B is focused on the seismic behavior of a specific reinforced concrete sandwich
panel system. First, the results of in-plane pseudostatic cyclic tests are described.
Refinements to the conventional modified compression field theory are introduced in
order to better simulate the monotonic envelope of the cyclic response. The refinements
deal with the constitutive model for the shotcrete in tension and the embedded bars.
Then the hysteretic response of the panels is studied according to a continuum damage
model. Damage state limits are identified. Design recommendations for the seismic
design of the studied reinforced concrete sandwich walls are finally provided.
.

Acknowledgements
ii
ACKNOWLEDGMENTS
I am very grateful to my supervisor Prof. Tomaso Trombetti for his continuous
technical guidance and brilliant suggestions during the entire period of my research
work in Bologna.
I would like to thank Prof. Enrique Hernandez-Montes, Prof. Luisa Maria Gil-
Martin, Prof. Filip Filippou and Dr. Tesser for their guidance during my foreign
research periods in Granada and Berkeley.
I am thankful to all my Department colleagues at the University of Bologna
(Giada, Simonetta, Sabina, Stefano, Luca) for providing a congenial working
atmosphere and sharing ideas.
I also want to thank my parents for their inspiration, although far away from
me. Special thanks also to my brother for his constant help and encouragement during
these last three years.

Acknowledgements
iii
To my Parents

Table of contents
iv
Table of contents
ABSTRACT ................................................................................................................................................... i
ACKNOWLEDGMENTS ............................................................................................................................. ii
Table of contents .......................................................................................................................................... iv
List of Figures .............................................................................................................................................. ix
List of Tables .............................................................................................................................................. xiii
1. Foreword .............................................................................................................................................. 1
1.1. Background and Motivations .................................................................................................. 1
1.2. Problem descriptions and objectives .......................................................................................... 2
1.3. Organization of the thesis ........................................................................................................... 3
PART A: Unreinforced Masonry Infills ........................................................................................................ 5
2. Modelling of unreinforced masonry infills and relative code provisions for the design of frame
structures .............................................................................................................................................. 7
2.1. Introduction ................................................................................................................................ 7
2.2. The expected seismic performance of exsting masonry infills ................................................... 8
2.2.1. The mechanical properties of clay brick units ............................................................ 10
2.2.2. The mechanical properties of the mortar .................................................................... 10
2.2.3. The mechanical properties of masonry assemblies ..................................................... 11
2.2.4. Additional observations .............................................................................................. 11
2.3. A review of the analitycal models for infilled frame structures ............................................... 12
2.3.1. Macromodels .............................................................................................................. 12
2.3.2. Micromodels ............................................................................................................... 15

Table of contents
v
2.4. Code prescriptions for the Seismic Design of masonry infills ................................................. 16
2.4.1. ASCE 41-06 approach for the modelling of unreinforced masonry infills ................. 17
2.4.2. EC8 provisions for infilled frame structures ............................................................... 20
2.5. Conclusions .............................................................................................................................. 21
3. The influence of masonry infills on the seismic response of reinforced concrete strucures: the case of
a building in L’Aquila ........................................................................................................................ 23
3.1. Introduction .............................................................................................................................. 23
3.2. Observed damage of reinforced concrete buildings ................................................................. 25
3.3. Case study................................................................................................................................. 28
3.3.1. Building description .................................................................................................... 28
3.3.2. Observed damages ...................................................................................................... 29
3.4. The input at the base ................................................................................................................. 31
3.5. The numerical model of the building ....................................................................................... 34
3.5.1. Column shear failure ................................................................................................... 34
3.5.2. The models of the entire building ............................................................................... 38
3.6. Analyses conducted and main results ....................................................................................... 39
3.6.1. Response History Analysis ......................................................................................... 39
3.6.2. Push-over Analysis ..................................................................................................... 43
3.6.3. Incremental dynamic Analysis .................................................................................... 45
3.7. Conclusions .............................................................................................................................. 49
4. The first developments towards a seismic-resistant masonry infill ................................................... 53
4.1. Introduction .............................................................................................................................. 53
4.2. The expected performance for the innovative masonry infill ................................................... 55

Table of contents
vi
4.3. The first materials characterization .......................................................................................... 59
4.3.1. Experimental characterization of the clay bricks ........................................................ 59
4.3.2. Experimental characterization of the innovative mortar ............................................. 63
4.4. Conclusions .............................................................................................................................. 65
5. The seismic design of the seismic-resistant masonry infill ................................................................ 67
5.1. Introduction .............................................................................................................................. 67
5.2. On The seismic design of the innovative masonry infill .......................................................... 68
5.2.1. On the modelling of the innovative masonry infills ................................................... 68
5.1.1. The strength of the innovative infill ............................................................................ 69
5.3. Conclusions .............................................................................................................................. 70
PART B: Reinforced Concrete Sandwich Panels........................................................................................ 71
6. The behavior of squat reinforced concrete sandwich wall structures: experimental tests ................. 73
6.1. Introduction .............................................................................................................................. 73
6.2. Summary of the experimental tests .......................................................................................... 76
6.2.1. Geometrical and mechanical properties of the specimens .......................................... 77
6.2.2. Test set-up and instrumentation .................................................................................. 79
6.2.3. Summary of the experimental results ......................................................................... 80
6.3. Conclusions .............................................................................................................................. 84
7. Modelling reinforced concrete sandwich walls according to compression field theories .................. 85
7.1. Introduction .............................................................................................................................. 85
7.2. Shear theories for reinforced concrete elements: the Continuum mechanic approach ............. 86
7.3. MCFT and RA-STM predictions of the panels’ response. ....................................................... 88
7.4. Adapting the Refined Compression Field Theory for thin RC sandwich panels ..................... 90

Table of contents
vii
7.4.1. Proposed tension stiffening model for shotcrete and wire mesh embedded in the
shotcrete ...................................................................................................................... 91
7.4.2. The Refined Compression-Field Theory (RCFT) predictions for the tested panel. .... 94
7.5. Design equation according to the RCFT .................................................................................. 95
7.6. Conclusions .............................................................................................................................. 97
8. Modelling of reinforced concrete sandwich walls according to a continuum damage theory ........... 99
8.1. Introduction .............................................................................................................................. 99
8.2. The concrete damage model fundamentals: capabilities and limitations ............................... 101
8.3. The Simulation of the experimental tests of conventional Reinforced concrete shear walls . 106
8.3.1. Experimental program .............................................................................................. 106
8.3.2. Test setup .................................................................................................................. 108
8.3.3. The numerical models ............................................................................................... 109
8.3.4. Results of the numerical simulations ........................................................................ 111
8.3.4.1. Monotonic Pushover Analyses .................................................................................. 112
8.3.4.2. Cyclic Analyses ......................................................................................................... 115
8.4. The simulations of the RC sandwich wall tests ...................................................................... 121
8.4.1. Planar walls ............................................................................................................... 121
8.4.1.1. Monotonic pushover analyses .................................................................................... 122
8.4.1.2. Cyclic analyses .......................................................................................................... 126
8.4.2. HSW specimen ......................................................................................................... 130
8.4.2.1. Cyclic analyses .......................................................................................................... 130
8.4.3. Concluding remarks .................................................................................................. 132
8.5. An insigth into the 3D concrete material model ..................................................................... 133
8.5.1. Behavior in compression .......................................................................................... 133

Table of contents
viii
8.5.1.1. Uniaxial response ....................................................................................................... 133
8.5.1.2. Confinement effect .................................................................................................... 134
8.5.1.3. Biaxial response ......................................................................................................... 136
8.5.2. Behavior in tension ................................................................................................... 137
8.5.2.1. Uniaxial response ....................................................................................................... 137
8.5.2.2. Tension stiffening effects ........................................................................................... 139
8.5.2.3. Biaxial tension and tension-compression ................................................................... 140
8.5.3. Response under a more general load path ................................................................. 141
8.5.4. On the response of RC members .............................................................................. 142
8.5.4.1. Mesh objectivity ........................................................................................................ 142
8.5.4.2. On the Damage State Limits ...................................................................................... 144
8.6. Conclusions ............................................................................................................................ 146
9. The seismic design of reinforced concrete sandwich squat walls .................................................... 148
9.1. Introduction ............................................................................................................................ 148
9.2. On the modelling of reinforced concrete sadwich squat walls ............................................... 148
9.2.1. Design shear strength and damage state limits ......................................................... 150
9.3. Conclusions ............................................................................................................................ 151
10. Conclusions and future developments ............................................................................................. 152
10.1. Main conclusions of Part A .................................................................................................... 152
10.2. Main conclusions of Part B .................................................................................................... 153
10.3. Future developements ............................................................................................................. 154
Appendix 1: Database of experimental tests on masonry specimens from the scientific literature. ......... 156
Appendix 2: The first experimental tests on the innovative masonry infills ............................................. 161
Appendix 3: Equivalent strut equations from litterature. .......................................................................... 167
References ................................................................................................................................................. 171

List of figures
ix
List of Figures
Figure 2.1: (a) Diagonal shear failure; (b) sliding shear failure; (c) corner crushing. .................................... 9
Figure 2.2: Backbone curve representing the non-linear envelope response of the strut ............................. 19
Figure 2.3: (a) Diagonal strut analogy; (b) Forces applied to the columns .................................................. 19
Figure 3.1: Distribution of the macroseismic intensity (MCS scale). Available on
http://www.mi.ingv.it/eq/090406/quest.html. .............................................................................................. 26
Figure 3.2: Global state of damage (left) and particular of damage (right). (a) collapse; (b) repairable; (c)
occupable. ..................................................................................................................................................... 27
Figure 3.3: structural plan of the building (foundation system on the left, typical floor on the right). ........ 28
Figure 3.4: Damages observed for the studied building. (a) Soft/weak story mechanism; (b) Shear failure
in columns; (c) Infills failure. ....................................................................................................................... 30
Figure 3.5: Location of the epicenter (marked in yellow), strong motion stations (marked in green) and site
of the building (marked in red); from Google Earth. ................................................................................... 32
Figure 3.6: Normalized backbone curves for the zero-length element placed at the top column at the
bottom story: (a) brittle model; (b) semi-ductile model. .............................................................................. 36
Figure 3.7: Normalized axial force versus drift relationship for a strut modeling a full panel at the bottom
story with a length of 5.0, height of 2.8 m and equivalent width equal to 46 cm. ....................................... 37
Figure 3.8: Model of the single infilled frame. ............................................................................................ 38
Figure 3.9: Roof displacement Response History (AQV ground motion): a) IF-B model; b) IF-D model. 41
Figure 3.10: Maximum interstorey-drift (AQV ground motion): (a) IF-B model; (b) IF-D model. ............ 41
Figure 3.11: (a) Torsional envelope response of the building from the RHA analysis (AQV ground
motion).; (b) photos of the columns marked as 2 and 15 (and circled) after the earthquake; (c) Torsional
envelope response of the IF-D model from the RHA analysis (AQV ground motion). ............................... 42
Figure 3.12: Normalized Shear force Response History for the zero-length element at the bottom story for
column 2: (a) IF-B model; (b) IF-D model. ................................................................................................. 42
Figure 3.13: Normalized Axial force Response History for strut 2 (strut 2 represents the infill between the
columns indicated as 2 and 3 in Figure 3.3): (a) IF-B model; (b) IF-D model. ........................................... 42
Figure 3.14: Push-over curves for BF, IF-B and IF-D models. .................................................................... 45
Figure 3.15: IDA curves for: (a) BF model; (b) IF-B model; (c) IF-D model. ............................................ 49

List of figures
x
Figure 4.1: plan view (a) and elevation (b) of atypical regular RC frame building. .................................... 56
Figure 4.2: Shear stress vs. story number for the different ag. ..................................................................... 58
Figure 4.3: Comparison between the elastic demand and the inelastic response for two different shear
strength ......................................................................................................................................................... 58
Figure 4.4: Test set up of the bending tests. ................................................................................................. 60
Figure 4.5: stress-deformation response of selected specimens. .................................................................. 62
Figure 4.6: the correlation between strength and density. ............................................................................ 62
Figure 4.7: tests set up: (a) compression test (b) bending test on thin specimens; (c) sliding shear test. .... 64
Figure 4.8: force-displacement response of selected specimens as obtained from the bending tests on the
thin specimens. ............................................................................................................................................. 65
Figure 6.1: (a) Reinforcement layout for the full planar wall; (b) Reinforcement layout for the planar wall
with the central opening ............................................................................................................................... 78
Figure 6.2: Reinforcement layout for the HSW specimen ........................................................................... 78
Figure 6.3: (a) Typical instrumentation for Wall type A; (b) Typical instrumentation for Wall type B. ..... 79
Figure 6.4: Instrumentation for HSW specimen: (a) web plane; (b) flange plane ....................................... 80
Figure 6.5: Base shear vs. story drift experimental response: (a) specimen PW1; (b) specimen PW2; (c)
specimen PW3; (d) specimen PW4; (e) specimen PW5; (f) specimen HSW. ............................................. 82
Figure 6.6: Cracking patterns at the end of the test: (a) specimen PW1; (b) specimen PW4; (c) concrete
spalling at the base, for specimen PW3; (d) concrete corner crushing for specimen PW2. ......................... 83
Figure 6.7: (a) Cracking pattern at the end of the test for HSW specimen; (b) detail of concrete spalling at
the corner of the web panel for HSW specimen. .......................................................................................... 83
Figure 7.1: Mohr’s circle of strains. ............................................................................................................. 87
Figure 7.2: Equilibrium for a section of panel: (a) Free body diagram 1; (b) Free body diagram 2. ........... 87
Figure 7.3: Comparison between the MCFT, RA-STM and test data. (a) test on PW1 (N=50 kN); (b) test
on PW2 (N=100 kN); (c) test on PW3 (N=250 kN). ................................................................................... 89
Figure 7.4: Examples of tension-stiffening equations available in the scientific literature. ........................ 91
Figure 7.5: Constitutive equations for the concrete in tension (a) and for the embedded bars (b) for the
three different applied axial loads. ............................................................................................................... 94
Figure 7.6: The RCFT response compared to the test data. ......................................................................... 95

List of figures
xi
Figure 7.7: The force-displacement response of a full 3m x 3m panel for different reinforcement rations:
(a) applied axial load equal to 100 KN; (b) applied axial load equal to 150 KN. ........................................ 97
Figure 8.1: Initial elastic domain for plane stress state. ............................................................................. 104
Figure 8.2: (a) Boundary element layout; (b) Uniform layout (dimensions in inches) .............................. 107
Figure 8.3: (a) Stress-strain relation for the confined concrete; (b) Stress-strain relation for the unconfined
concrete. ..................................................................................................................................................... 110
Figure 8.4: Model geometry and schematic representation of the applied load. ........................................ 111
Figure 8.5: Pushover curves for specimen PW1, PW2 and PW3 as obtained from numerical simulations.
.................................................................................................................................................................... 113
Figure 8.6: Color contour maps of the damage variable dn for specimen PW1. ........................................ 115
Figure 8.7: Comparison between the experimental and numerical cyclic response. (a) Specimen PW1; (b)
Specimen PW2; (c) Specimen PW3. .......................................................................................................... 117
Figure 8.8: Color contour maps of the damage variable dn for specimen PW1: (a) d=0.5%; (b) d=0.75%;(c)
d=1.0%;(d) d=1.50%. ................................................................................................................................. 120
Figure 8.9: Color contour maps of the damage variable dn for specimen PW3: (a) d=0.5%; (b) d=0.75%;(c)
d=1.0%;(d) d=1.50%. ................................................................................................................................. 120
Figure 8.10: Comparison between the experimental and numerical strain history of the longitudinal
reinforcement at specific locations of the base of the wall for the specimen PW1. (a) East Boundary
element; (b) West Boundary element ......................................................................................................... 121
Figure 8.11: Comparison between the envelope of the experimental response and the numerical
simulations: (a) PW1, PW2 and PW3; (b) PW4 and PW5. ........................................................................ 123
Figure 8.12: Color contour maps of the damage variable dn for the specimen PW1 at each DSL. ............ 124
Figure 8.13: Color contour maps of the damage variable dn for the specimen PW4 at each DSL. ............ 125
Figure 8.14: Comparison between the numerical cyclic simulations (type 1 models) and experimental
response: (a) PW1; (b) PW2; (c) PW3; (d) PW4; (e) PW5. ....................................................................... 127
Figure 8.15:Color ontour maps of the damage variable dn for specimen PW4 at the three peaks at 1.0%
story drift: (a) first cycle; (b) second cycle; (c) third cycle. ....................................................................... 128
Figure 8.16: Comparison between the numerical cyclic simulations (type 2 models) and experimental
response: (a) PW1; (b) PW2; (c) PW3; (d) PW4; (e) PW5. ....................................................................... 129
Figure 8.17: Color contour maps of the damage variable dn at 1% drift for: (a) specimen PW1; (b)
specimen PW4. ........................................................................................................................................... 129

List of figures
xii
Figure 8.18: Comparison between the numerical simulation and the experimental response: (a) entire
cyclic response; (b)last imposed cycles. .................................................................................................... 131
Figure 8.19: Color contour maps of the damage variable dn: (a) 0.2% drift; (b) 0.4% drift; (c) 0.8% drift;
(d) 1.0% drift. ............................................................................................................................................. 131
Figure 8.20: Stress-strain response (a) and damage evolution under uniaxial compression(b). ................ 134
Figure 8.21: Comparison of 3D concrete material model with uniaxial Kent and Park model: (a) ρt =0.2%;
(b) ρt =2.0%. ............................................................................................................................................... 135
Figure 8.22: An and k vs. ρt. ........................................................................................................................ 135
Figure 8.23: Monotonic stress-strain response (a) and damage evolution (b) under uniaxial and biaxial
compression. ............................................................................................................................................... 137
Figure 8.24: Cyclic stress-strain response (a) and damage evolution (b) under uniaxial and biaxial
compression. ............................................................................................................................................... 137
Figure 8.25: Cyclic stress-strain response (a) and damage parameter evolution under uniaxial tension (b).
.................................................................................................................................................................... 138
Figure 8.26: (a) tension stiffening for different M (and corresponding Ap) values ; (b) Ap vs M. ........... 139
Figure 8.27: Monotonic stress-strain response (a) and damage parameter evolution under uniaxial and
biaxial tension(b). ....................................................................................................................................... 140
Figure 8.28: Monotonic stress-strain response (a) and damage evolution under tension-compression (b).
.................................................................................................................................................................... 141
Figure 8.29: Cyclic stress-strain response (a) and damage evolution under uniaxial compression and
tension-compression (b). ............................................................................................................................ 141
Figure 8.30: Concrete stress-strain response (a) and damage evolution (b) under two different load paths.
.................................................................................................................................................................... 142
Figure 8.31: Monotonic Push-over response (a) and cyclic response (b) of the two new models (Double
size mesh A and Double size mesh B) compared with the original model (Original mesh). ..................... 143
Figure 8.32: Contour maps of the damage variable dn at DSL6: (a) Double size mesh A; (b) Double size
mesh B; (c) Original mesh. ........................................................................................................................ 144
Figure 8.33: (a) DSLs superimposed to the concrete stress-strain response at the base of the boundary
element; (b) DSLs superimposed to the steel longitudinal reinforcement stress-strain response at the base
of the boundary element. ............................................................................................................................ 146

List of Tables
xiii
List of Tables
Table 3.1: The highest MCS intensity measure estimated after the 6 April 2009 L’Aquila earthquake in the
L’ Aquila Province. ...................................................................................................................................... 26
Table 3.2: Cross section dimension and reinforcement details for columns and beams. ............................. 30
Table 3.3: Geometrical and mechanical properties of the exterior and interior infills masonry. ................. 31
Table 3.4: Selected strong motion station with site coordinate, soil type classification (NTC-2008),
epicentral distance and PGA recorded. ........................................................................................................ 32
Table 3.5: Values of PGAkB, PGAP,k
B, PGAP,k, corresponding mean value over the four stations and
amplification factor AFk for each station. .................................................................................................... 33
Table 3.6: Range of values of the equivalent strut width, a. ........................................................................ 36
Table 3.7: Comparison of the damages observed from the response history analysis and in situ
observations of the collapsed building. ........................................................................................................ 41
Table 3.8: Base shear (V) roof drift (D) of the significant point and initial stiffness (kin) from the Push-
over curves. ................................................................................................................................................. 43
Table 3.9: Numerical values of base shear and roof drift of the main failure events for the IF-B model. ... 44
Table 3.10: Numerical values of base shear and roof drift of each failure events for the IF-D model. ....... 45
Table 3.11: Values of DL adopted for the three models, based on the push-over responses, expressed in
terms of roof drift (%). ................................................................................................................................. 46
Table 3.12: Values of PGA corresponding to the damage levels obtained from the IDA analysis. ............ 47
Table 4.1: Shear stress for selected values of ag and N from 2 to 10 ........................................................... 57
Table 4.2: main results of the first experimental tests conducted in the laboratory of the “Centro
Ceramico”. ................................................................................................................................................... 61
Table 4.3: Main properties as obtained from the experimental tests performed at the LISG lab. ................ 63
Table 6.1: Summary of the specimen properties .......................................................................................... 77
Table 7.1: Values of α coefficient for the three different applied axial loads. ............................................. 92
Table 7.2: Values of k coefficient for the three different applied axial loads. ............................................. 93
Table 7.3: Reinforcement layout for the examples considered. ................................................................... 95
Table 8.1: Parameters of the 3D Concrete Material model. ....................................................................... 104

List of Tables
xiv
Table 8.2: Design test matrix. .................................................................................................................... 107
Table 8.3: Concrete material properties. .................................................................................................... 108
Table 8.4: Steel material properties. ........................................................................................................... 108
Table 8.5: Material parameter adopted for each specimen ........................................................................ 110
Table 8.6: Parameters for the #4 steel bar for each specimen. ................................................................... 110
Table 8.7: Base shear and drift at each DLS for the specimen PW1. ......................................................... 114
Table 8.8: Base shear and drift at each DLS for the specimen PW3. ......................................................... 114
Table 8.9: Peak Negative Damage Variable dn at each peak drift (first of the three cycle). ..................... 119
Table 8.10: Parameter values for the 3D Concrete Material (PW specimens). .......................................... 122
Table 8.11: Values of drifts at each DLS. .................................................................................................. 123
Table 8.12: Parameter values for the 3D Concrete Material (HS specimen). ............................................ 130
Table 8.13: An and k for different transversal reinforcement ratio. ............................................................ 136
Table 8.14: Values of damage variable dn leading to each DSL. ............................................................... 146
Table 9.1: Values of drifts at each DLS. .................................................................................................... 151
Table 9.2. Values of drifts at each DLS. .................................................................................................... 151

Foreword
1
1. Foreword
1.1. BACKGROUND AND MOTIVATIONS
Squat structural walls (in particular reinforced concrete walls) and infill walls (in
particular unreinforced masonry walls) find wide applications in building structures,
especially for low-rise buildings where they may provide a large contribution in
carrying the lateral loads due to earthquake excitations.
Despite a large research effort has been devoted to the study of reinforced concrete
(RC) slender shear walls since the 1960s with the result of a comprehensive knowledge
of their seismic behavior and in detailed design rule and prescriptions aimed at
obtaining a desired (high) ductile response, less researches has been focused on the
assessment of the seismic behavior of squat walls, which, due to their inherent
geometrical aspect (i.e. low aspect ratios), are characterized by a quite complex
behavior involving the interaction between flexural, shear and sliding mechanisms of
failures due to their inherent aspect ratio. RC squat walls are generally characterized by
a “quasi” brittle behavior (substantially different from that of typical RC slender walls
which are often analyzed as cantilever beams with a plastic hinge at the base.
Moreover, it has been recognized that actual building code equations typically
overestimate the peak shear strength capacity of squat reinforced concrete shear walls
(Whyte and Stojadinovic 2013, Paulay and Priestley 1982) by factors as large as 2
(from test data compiled by Gulec 2005 design equations were shown to over predict,
in the worst cases, the peak shear strength by a factor larger than 3). In fact, in most
design codes the formulations to predict the shear strength are typically based on
flexural mechanisms of failure rather than shear mechanisms of failure which is proved
to be very effective for slender walls. Nonetheless, as already mentioned, squat walls
tend to fail in shear and/or in sliding shear because their geometry restricts them from
bending easily. Both these shear failure modes are undesirable because they constitute

Foreword
2
a quasi-brittle response, such that the structural element loses strength and stiffness
rapidly with small increments of inelastic deformation. During the last decades various
experimental investigations have been carried out in order to assess the seismic
response of squat walls showing a significant scatter not only between experimentally
measured and predicted strength but also within different experiments (see the PEER
report by Orakcal et al. 2006).
Unreinforced masonry is commonly used in frame building structures as infill to either
protect the inside of the structure from the environment or to separate inside spaces.
The seismic behavior of infilled frame structures involves a complex interaction
between the reinforced concrete frame and the unreinforced masonry walls. The topic
arose a lot of interest during the last decades and a number of design rules and
recommendations have been developed based on theoretical and experimental
researches. Nonetheless, recent earthquakes (such as Duzce 1999, L’Aquila 2009,
Darfield 2010) confirmed how the interaction between the infills and the frame plays a
fundamental rule in the seismic performance of those structures and therefore its deep
understanding is crucial for both cases of assessment and retrofitting of existing
structures and also for the design of new constructions.
1.2. PROBLEM DESCRIPTIONS AND OBJECTIVES
Based on the introductory discussion, it appears that the assessment of the seismic
response of squat two-dimensional elements such as masonry infills and reinforced
concrete sandwich walls still represents a challenging task provided that their
geometrical configuration determine a complex interactions between (i) flexural and
shear behavior for the case of reinforced concrete walls and (ii) reinforced concrete
frame and unreinforced masonry infills for the case of infilled frames.
The objectives of the present thesis are to provide insight into the seismic behavior of
unreinforced masonry infills and reinforced concrete shear walls (with special attention
devoted to reinforced concrete sandwich walls). Both experimental and numerical
investigations are necessary for a reliable understanding of the seismic behavior of such
elements.

Foreword
3
1.3. ORGANIZATION OF THE THESIS
The thesis is organized in two parts: part A and part B. Part A is focused on
unreinforced masonry infills and is composed of four chapters (from chapter 2 to
chapter 5), while Part B is focused on reinforced concrete sandwich walls and is also
composed of four chapters (from chapter 6 to chapter 9).
The objective of part A is to assess the performances of a novel seismic-resistant
unreinforced masonry infill system and introduce design recommendations for the
seismic design of unreinforced masonry infills. The objective of part B is to assess the
seismic performances of reinforced concrete sandwich squat walls with the purpose of
introducing design procedures for building structures composed of reinforced concrete
sandwich squat walls.
Chapter 2 deals with existing unreinforced masonry infills. First, the main aspects of
the seismic response of existing unreinforced masonry infills are briefly described.
Then, actual code approaches for the assessment of the seismic response of reinforced
concrete frames with masonry infills are discussed. Finally, the expected mechanical
properties of existing masonry as obtained from a large literature review are
summarized.
State-of-the-practice for the assessment of the seismic response of an existing RC
infilled frame is critically discussed in Chapter 3 through a case study dealing with an
existing building which collapsed after the 2009 L’Aquila earthquake.
Chapter 4 presents the first developments towards an innovative unreinforced masonry
infill of superior energetic and structural properties through the use of traditional
materials (clay bricks and mortar) and innovative technologies (nanoparticles and
innovative additives) within a national research project. Only preliminary results are
presented provided that the research is still under development.
Part A ends with Chapter 5 which provides simple design recommendation for the
seismic design of the innovative masonry infills.

Foreword
4
In Chapter 6 the structural system objective of the entire Part B of the thesis, made of
reinforced concrete sandwich panels and developed during the last two decades by an
Italian Firm (Nidyon Costruzioni Srl, http://www.nidyon.net/) through a large
experimental campaign, is introduced, with special attention on the description of
cyclic tests aimed at assessing the seismic response of both planar panels and of a full-
scale 2-story H-shaped structure. A full description of the experimental tests is beyond
the scope of the present work and has been the objective of a previous Ph.D thesis
(Ricci 2012). Therefore, only the information necessary for a better understanding of
the interpretation of the test results are recalled.
Chapter 7 provides an interpretation of the experimental results described in Chapter 5
according to the conventional shear theories for reinforced concrete members (i.e. the
modified compression field theory, MCFT (Vecchio and Collins 1986), and rotating-
angle softening-truss model, RA-STM (Belarbi and Hsu 1994) and according to the
recently proposed refined compression field theory, RCFT (Gil-Martin et al. 2009)
which has originally proposed for conventional RC walls and is here adapted for the
case of the RC sandwich panels.
Chapter 8 provides an interpretation of the experimental results described in Chapter 5
using a concrete damage model developed for the seismic analyses of RC members by
researchers at the University of Padua (Tesser et al. 2011).
Part B ends with Chapter 9 which provides design recommendations for the seismic
design of the studied reinforced concrete sandwich walls.
Finally, Chapter 10 summarizes the main findings of the previous chapters.
Recommendations for future research topics are finally provided.

5
PART A: Unreinforced Masonry Infills
Part A is focused on unreinforced masonry infills and is composed of four chapters
(from chapter 2 to chapter 5). Its objective is to assess the performances of a novel
seismic-resistant unreinforced masonry infill system and introduce simple design
recommendations for the seismic design of unreinforced masonry infills.


Modelling of unreinforced masonry infills and relative code provisions for the design of frame structures
7
2. Modelling of unreinforced masonry infills and
relative code provisions for the design of frame
structures
2.1. INTRODUCTION
Masonry is one of the oldest construction materials which is worldwide currently in use
for reasons that include accessibility, functionality, and cost. It has been used for
hundreds of years for the constructions of various civil works from simple roadways to
complex monumental buildings. Masonry has also commonly been used in frame
building structures as infill, in order to partition the inside of the structure from the
external environment or to subdivide internal spaces. In both cases, for long time and
still nowadays, it is of common practice to ignore infills during the design and analysis
of frame structures. The reluctance of practical engineers to consider the contribution
of the infills was due to limited knowledge of the complex interaction between the
infills and the frame and lack of practical methods for the prediction of stiffness,
strength, and cyclic behavior of the infills. Moreover, the assumption of neglecting the
frame to masonry interaction was motivated by the brittle behavior of the masonry
panels and was intended to be a conservative assumption.
Extensive research has been done during the last 50 years to determine how the
presence of masonry infills influences the in-plane and the out-of-plane behavior of
frame structures. Experimental researches on single infilled panels include the works of
Benjamin and Williams 1958; Holmes 1963; Stafford-Smith 1968; Moghaddam and
Dowling 1987; Dawe et al. 1989; Mander et al. 1993; Mehrabi et al. 1994; Negro and
Verzeletti 1996; Durrani and Haider 1996; Pires et al. 1998; and Fardis et al. 1999b).
Studies of tests on multi-story multi-bay s can be found in Liauw and Kwan 1985a;
Gergely et al. 1994; Mosalam 1996; Mosalam et al. 1997a, b. Shaking tests on infilled
frame specimens were carried out by Fardis et al 1999a, Zarnic et al. 2001 and Dolce et

Modelling of unreinforced masonry infills and relative code provisions for the design of frame structures
8
al. 2005. These studies provide evaluations of (i) the importance of infill wall
confinement from bounding frames, (ii) the types of failure that can be observed in the
infill and/or in the frame members, (iii) the stiffness and strength of the infilled frames,
(iv) the degradation of strength upon load reversals, (v) the energy dissipated. Based on
experimental tests results, a number of models ranging from simple equivalent strut
models to more complex nonlinear micro-models, have been proposed through the
years for the analyses of infilled frame with masonry infills.
This chapter provides an overview of a number of issues related to masonry infills and
their interaction with the surrounding frames, from material properties to code
provisions. First, a research dealing with the mechanical properties of actual masonry
has been conducted through the analyses of available experimental tests collected from
the scientific literature. The aim is to provide expected values to be used for analysis
purpose or to compare with the performance of other systems. Then, a review of the
fundament analytical models to be used for the analyses of infilled frame structures is
given. Finally, some code approaches to the seismic design of masonry infilled RC
frame structures are described.
2.2. THE EXPECTED SEISMIC PERFORMANCE OF EXSTING
MASONRY INFILLS
The behavior of infilled frames under lateral loadings has been the objective of a
number of researchers (Holmes 1961, Stafford-Smith 1962, 1966, 1967, Mainstone and
Weeks 1970, Dawe and Seah 1989, Flanagan et al. 1992, Mander et al. 1993, Wood
1978, Liauw and Kwan 1985, Fiorato et al. 1970, Klingner and Bertero 1976, Kahn and
Hanson 1979, Bertero and Brokken 1983, Zamic and Tomazevic 1990, Meharabi et al.
1994, Colangelo 2005.
These studies have identified a number of complicated failure mechanisms that can be
possibly caused by the frame-panel interaction, depending by the infill strength and
stiffness relative to the surrounding frame and stiffness. The most typical mechanisms
of failure in the case of a strong frame are broadly summarized in Figure 2.1. In the

Modelling of unreinforced masonry infills and relative code provisions for the design of frame structures
9
case of infills stronger than the surrounding frame, columns shear failure, or beam-to-
column joints failure may be also observed.
The different mechanisms of failure depend on a number of factors including the
geometrical configuration (i.e. the aspect ratio), the mechanical properties of the brick
and mortar, the presence of vertical joints fill with mortar, the masonry-to-infill
strength and stiffness, the brick-to-mortar strength. Therefore, the knowledge of order
of magnitudes of the main mechanical properties for the single components (brick and
mortar) and for the masonry assembly is of fundamental importance in order to have
reliable prediction of the most probable mechanisms of failure either for the assessment
of an existing building or for the design of a new building.
A large literature research has been conducted in order to evaluate expected mechanical
properties of the basic components of unreinforced masonry (i.e. clay masonry bricks
and mortar) and of small masonry assemblies. The next sections provide a summary of
those properties. Most of the data here summarized are available online in the Reluis
web site (in the section MADA:MAsonry Database,
http://www.reluis.it/index.php?option=com_content&view=article&id=255%3Amada-
masonry-database&catid=34%3Anews-reluis&lang=en) and in the master thesis by
Raffa 2012.
(a) (b) (c) Figure 2.1: (a) Diagonal shear failure; (b) sliding shear failure; (c) corner crushing.
Modelling of unreinforced masonry infills and relative code provisions for the design of frame structures
10
2.2.1. The mechanical properties of clay brick units
Experimental tests including compression tests and tensile tests on bricks are
considered. In detail, only full and hollow clay bricks have been considered. The
database containing the list of the references and the data can be found in the Appendix
1. A Large part of the data refers to masonry produced in Italy, either new masonry or
existing masonry extracted from existing buildings.
To sum up, the analysis of the data leads to the following observations:
The average compression strength of hollow clay bricks along the directions of
holes and perpendicular to the direction of the holes is equal to approximately
20 MPa and 5 MPa, respectively. Full clay bricks are characterized by an
average compression strength equal to 70 MPa.
The average elastic modulus of hollow clay brick is equal to 10000 MPa, while
the average Poisson’s ratio is equal to 0.25.
The tensile strength was measured in very few tests and is equal, on average, to
3.5 MPa.
Note that all the data exhibit a large variability and therefore the values above
summarized are only indicative of the order of magnitudes.
2.2.2. The mechanical properties of the mortar
As well known, the mechanical properties of the mortar are strongly dependent on its
composition. Different mortar compositions, including hydraulic mortar, aerial mortar,
cement-based mortar, high-strength mortar, are commonly used to realize the bed joints
of masonry infills. The composition and main properties of the mortar considered in the
present study can be found in the database reported in Appendix 1.
To sum up, the analysis of the data leads to the following observations:
The compression strength of normal mortar (excluding high-strength mortar) is
equal on average to 20 MPa, ranging from 2 MPa to 25 MPa. In some cases
high-strength mortar exhibit the compression strengths of 60 MPa.

Modelling of unreinforced masonry infills and relative code provisions for the design of frame structures
11
The average elastic modulus is around 6000 MPa, while the average Poisson’s
ratio is equal to 0.16.
The average tensile strength is around 1.5 MPa (from results of direct tensile
tests) and 2.2 Mpa (from results of bend test).
2.2.3. The mechanical properties of masonry assemblies
The mechanical properties of masonry assemblies, with special regard to the shear
strength, can be evaluated according to different experimental tests which in general
may lead to substantially different values of strength, due to different mechanisms of
failure which may occur. Actually, two different tests are used to measure the masonry
shear strength: (i) triplet test, performed on a small masonry assembly composed of
three bricks and two mortar joints (UNI EN 772), (ii) diagonal compression test
performed on a small masonry square wall of 1m x 1m dimensions (ASTM E 519).
The works which have been collected in the database reported in Appendix 1 include
both results of triplet tests and diagonal compression tests. Details regarding the
interpretation of the test results can be found in the work of Calderini et al. 2010.
To sum up, the analysis of the data leads to the following observations:
The average compression strength is equal to 5 MPa.
The average elastic modulus is around 5000 MPa, while the average shear
modulus is around 1300 MPa.
The average shear strength as obtained from triplet tests is equal to 0.29 MPa,
while the average shear strength as obtained from diagonal compression test is
equal to 0.33.
2.2.4. Additional observations
The analysis of the data collected in Appendix 1 allows additional observation.
First of all, the main mechanical properties of the masonry assemblies exhibit a large
variability due to a number of factors such as:

Modelling of unreinforced masonry infills and relative code provisions for the design of frame structures
12
Significant variability in the strength and deformation properties of the single
components (i.e. brick and mortar);
thickness of the bed joints;
the water absorption capacity of both bricks and mortar;
the geometrical assemblage of the bricks.
By Comparing the performance of contemporary masonry with ancient masonry
(through the use of in situ experimental test, e.g. Binda et al. 2000) it appears that new
masonry are characterized by higher shear modulus (from 2 to 10 times higher)
although realized with hollow bricks. On the contrary, the presence of hollow bricks
generally leads to a more brittle behavior.
The use of cement-based mortar allows to obtain higher shear strength. The absence of
vertical mortar joints significantly reduces the shear strength of masonry assemblies.
2.3. A REVIEW OF THE ANALITYCAL MODELS FOR INFILLED FRAME
STRUCTURES
Two different modelling approaches can be found in the scientific literature in order to
model the complex interaction between the masonry infill and the surrounding frame:
(i) local or micro models and (ii) global or macro models (Crisafulli et al. 2010).
Micromodels are generally FE models in which the interaction between the infill and
the frame is modelled in details. Macromodels are based on a physical understanding of
the behavior of the unfilled panel and make use of equivalent trusses to model the
effect of the infill with the purpose of reproducing the global effect due to the frame-to-
infill interaction in terms of stiffness, strength and hysteretic response.
2.3.1. Macromodels
Current seismic design codes (like EC8 – Part 1, ASCE 41-06) contain provisions for
the calculation of the infill stiffness and strength based on the equivalent diagonal strut
approach. During the early experimental tests of infilled frame with unreinforced
masonry infills, the development of first diagonal cracks in the center of the panel was

Modelling of unreinforced masonry infills and relative code provisions for the design of frame structures
13
observed, with the formation of gaps formed between the frame and the infill in the
unloaded diagonal corners of the specimens, while full contact was observed in the two
loaded diagonal corners. This behavior, initially observed by Polyakov 1960, led to the
introduction of the equivalent compressive strut model.
According to this approach the masonry is modelled as a diagonal strut working only in
compression. The strut is generally characterized by a thickness equal to the infill
thickness and a width a.
The evaluation of the equivalent width, a, varies from one reference to the other. The
most simple approaches (Holmes 1961, Paulay and Priestley 1992 and Angel et al.
1994) suggest the use of constant values of a between 12.5 to 33 percent of the
diagonal dimension of the infill, with no regard for any infill or frame properties.
Stafford-Smith and Carter 1969, Mainstone 1971 and others, derived more complex
expressions to estimate the equivalent strut width, a, that consider parameters like the
length of contact between the column/beam and the infill, as well as the relative
stiffness of the infill to the frame. Appendix 3 provides details on the most used
formulations to estimate the equivalent strut width, a, actually available in the scientific
literature.
The equations collected in Appendix 3 for the evaluation of the width of the equivalent
strut are to be used for the case of a full infill. In the case of partially infilled frame or
perforated infilled frame appropriate reduction factor should be taken into account (Al-
Chaar 2002). An alternative way to better account for the presence of openings in the
wall makes use of multiple struts which may allow to more accurately account for the
actual stress field within the panel and the actions transferred to the surrounding frame.
Results of experimental tests conducted on infilled frame with various opening can be
found in the work of Asteris et al. 2011.
Other reduction factor can be applied to reduce the width of the equivalent truss
accounting for various effects such as existing damage (Al-Chaar 2002).
The equivalent strut used to model the masonry infill is pin-connected to the frame
elements so that no moment transfer occurs. The stiffness of the strut is governed by

Modelling of unreinforced masonry infills and relative code provisions for the design of frame structures
14
the actual modulus of elasticity of the masonry (Em) and the cross-sectional area (a·tinf,
being tinf the thickness of the infill) although studies demonstrated that, in some cases,
an effective elastic modulus larger than the actual masonry modulus should be adopted
when push-over analyses are performed to better reproduce the experimentally
measured initial stiffness of masonry infills (details and practical examples are
provided by Al-Chaar 2002). The strength of the strut is determined by the minimum
load required to reach either the masonry infill crushing strength (Rcr) or the masonry
infill shear strength (Rshear). The component of these forces in the direction of the
equivalent strut will be used to assign the strut a “compressive” strength.
When the equivalent strut model is used to perform non-linear cyclic analyses (cyclic
push-over analyses) or non-linear dynamic analyses, an appropriate hysteretic behavior
have to be defined, increasing not only the complexity of the analysis but also the
uncertainties of the problem. Various hysteretic models have been proposed. Klingner
and Bertero 1978 proposed three different hysteretic models of increasing complexity.
The envelope curve is composed of a linear elastic branch up to the peak strength
followed by an exponentially decreasing branch. Unloading was assumed to be elastic
with stiffness equal to the initial stiffness, while stiffness degradation was considered in
the reloading phase. The model showed poor agreements against experimental
response. Later, similar models where proposed by Andreaus et al. 1985 and by
Doudomis and Mitsopoulou 1986 assuming slightly different behaviors in the
unloading and reloading phases. A different approach was used by Soroushian et al.
1988 which proposed an hysteretic model based on an exponential function to define
the strength envelope and a polynomial equation to represent the hysteretic loops.
Reinhorn et al. 1995 proposed a complex mathematical model which makes use of nine
parameters in order to provide a smooth force-displacement response and reproduce
strength degradation, stiffness decay and pinching. However, the implementation of the
model does not appear straightforward, requiring the numerical integration of
differential equations. Crisafulli et al. 1997 introduced an analytical model for the
hysteric response of the equivalent truss based on a number of parameters which have
to be experimentally calibrated. More recently, Cavaleri et al. 2005 proposed an
hysteretic model based on the Klingner and Bertero 1978 model. The modifications

Modelling of unreinforced masonry infills and relative code provisions for the design of frame structures
15
introduced by Cavaleri et al. (2005) are: (i) bi-linear slope of the unloading branch
before the restoring force vanishes, (ii) new loading branch characterized by a zero
value of the restoring force before the system begins to exhibit non zero stiffness; (iii)
envelope strength curve for the strut characterized by exponential degrading, according
to the experimental results.
It is worth to note that the nonlinear mechanisms which can be reproduced by using the
equivalent truss are not able to easily account for important phenomena such as the
mechanism of sliding shear or columns shear failure. A detailed description of such
nonlinear mechanisms clearly requires the use of more complex models such as
micromodels.
2.3.2. Micromodels
Finite elements modelling techniques have been extensively adopted to model infilled
frames since the 1960s (Mallick and Severn 1967). The complex interaction between
the infills and the surrounding frame requires the use of different elements: beam
elements for the frame (beams and columns), two-dimensional elements for the
masonry infill and interface elements for the infill-to-frame interaction. Obviously, the
use of a complex two-dimensional mesh of finite elements allows a more accurate
description of the geometry and a better description of local effects such as cracking,
crushing and local interaction, despite an increase in the computational effort.
Generally, two-dimensional membrane elements are enough for in-plane analyses.
Most of the material models proposed for masonry infills are adapted from concrete
material models. They can be grouped in order of increasing complexity.
The simplest models represent the masonry as an equivalent homogenous material
(Danasekar 1984). The presence of the mortar joints is considered in an average or
smeared sense. This class of model is suitable for the analyses of large structures in the
case of a local stress analysis is not required. Homogenization techniques are required
to define the stress-strain behavior of the equivalent homogenous material and
appropriate failure criteria have to be introduced.

Modelling of unreinforced masonry infills and relative code provisions for the design of frame structures
16
In the second class of models, the masonry is represented as a two-phase material.
Bricks and mortar are modelled with specific material models, while interface elements
are used in order to reproduce the brick-to-mortar interface, accounting for debonding,
slip or separation. Interface elements are typically modelled as friction elements
according to the Mohr-Coulomb theory. This approach clearly requires a large number
of elements and a great computational effort and therefore its use is generally restricted
the analyses of small specimens, mainly as a research tool.
A balanced compromise between the two approaches is based on the use of two-
dimensional elements to model the bricks and interface elements to model the
interaction between the mortar joint and the bricks, without explicitly modelling the
mortar (Lofty and Singh 1994, Page 1978, Meharabi and Shing 1994). In the first
proposed model within this class (Page 1978) the brick is assumed to behave
elastically. Later developments considered a more realistic behavior, introducing a non-
linear constitutive laws for the bricks, thus allowing to account for the cracking.
In both cases of homogenous models or more complex two-phases models the cracking
phenomenon is typically treated using the smeared approach. This model does not keep
track of each individual cracks, but rather the effect of cracks is simulated by
modifying the stresses and stiffness of the elements. The approach can be considered
suitable only in the cases where the behavior is not controlled by few cracks. It has
been pointed out (Shing and Mehrabi 2002) that the inclusion of interface elements to
account for the development of discrete cracks allows a significant improvement of the
accuracy of the numerical results. Nonetheless, the a priori knowledge of cracks
location and orientation is required.
2.4. CODE PRESCRIPTIONS FOR THE SEISMIC DESIGN OF MASONRY
INFILLS
In this section a review of seismic code provisions for unreinforced masonry infills is
given. ASCE 41-06 contains detailed provisions for the evaluation of stiffness, strength
and displacement capacity of unreinforced masonry infills. Those provisions are
reviewed in section 2.4.1. EC8 does not provide details relevant to the modeling of

Modelling of unreinforced masonry infills and relative code provisions for the design of frame structures
17
masonry infills; on the contrary, it discusses a number of issues related to the infill-to-
frame interactions providing design considerations for the frame surrounding the infills.
Those specifications are reviewed in section 2.4.2.
2.4.1. ASCE 41-06 approach for the modelling of unreinforced masonry infills
In addition to complex finite element models accounting for the interaction between the
infills and the surrounding frame and for the post-yielding behavior of the frame and
the cracking of the infills, ASCE 41-06 permit the use of the simple approach based on
equivalent struts. The elastic in-plane stiffness of a full unreinforced masonry infill
panel prior to cracking can be represented with an equivalent diagonal compression
strut of width a (Mainstone 1971):
0.4
inf0.175 h cola h D
( 2.1 )
Where λh is given by (Stafford-Smith and Carter 1969):
0.25
inf
inf
sin 2
4
mh
c col
E t
E I h
( 2.2 )
and:
hcol column height
hinf infill height
Em masonry elastic modulus
Ec concrete elastic modulus
Icol column modulus of inertia
Linf infill length
Dinf infill diagonal
θ strut inclination

Modelling of unreinforced masonry infills and relative code provisions for the design of frame structures
18
The equivalent strut is characterized by the same thickness and elastic modulus of the
infill panel it represents. For global structural analysis purposes, the compression struts
representing infill stiffness of solid infill panels may be placed concentrically across the
diagonals of the frame, effectively forming a concentrically braced frame system. In
this configuration, however, the forces imposed on columns (and beams) of the frame
by the infill are not represented. To account for these effects, compression struts may
be placed eccentrically within the frames. If the numerical models incorporate
eccentrically located compression struts, the results should yield infill effects on
columns directly. Alternatively, global analyses may be performed using concentric
braced frame models, and the infill effects on columns (or beams) may be evaluated at
a local level by applying the strut loads onto the columns (or beams).
The expected infill shear strength, Vinf, shall be calculated according to:
inf n vV A f ( 2.3 )
Where An is the net area of the infill cross section and fv is the masonry shear strength.
It has to be noted that Eq. ( 2.3 ) assumes a unique mechanism of failure, i.e. sliding
shear. Therefore, it is recommended to compare the strength as obtained from Eq. ( 2.3
) with the strength associated to the diagonal compression mechanism of failure (Al
Chaar 2002).
The non-linear envelope of the strut suggested by ASCE 41-06 is schematically
represented in Figure 2.2. Values of the ultimate drift, e, are between 0.5% and 1.2 %
depending on the ratio of frame-to-infill strengths, β, and on the aspect ratio (Linf / hinf).
Values of ultimate drifts, e, are given in Table 7-9 of ASCE 41-06.
The expected flexural and shear strengths of columns adjacent to an infill panel shall
exceed the forces resulting from one of the following conditions:
The application of the horizontal component of the expected infill strut force at
a distance / coscl a from the top or bottom of the infill panel.
The shear force resulting from development of expected column flexural
strengths at the top and bottom of a column with a reduced height equal to lc.

Modelling of unreinforced masonry infills and relative code provisions for the design of frame structures
19
The lower-bound of the out-of-plane strength of an infill panel (in pounds per square
foot), Qout, shall be determined according to:
'2
inf inf
0.7144
( / )
mout
fQ
h t
( 2.4 )
Where
f’m masonry compressive strength
λ2 slenderness ratio (values are given in Table 7-11 of ASCE 41-06)
Figure 2.2: Backbone curve representing the non-linear envelope response of the strut
(a) (b)
Figure 2.3: (a) Diagonal strut analogy; (b) Forces applied to the columns

Modelling of unreinforced masonry infills and relative code provisions for the design of frame structures
20
2.4.2. EC8 provisions for infilled frame structures
EC8 does not provide specific indications on the analytical model to be used for infilled
structures, although the use of the equivalent strut model is suggested. On the contrary,
the following issues due to the infill-to-frame interaction are discussed:
Fundamental period of infilled frame structures.
Planar and height irregularities due to an uneven distribution of infills.
Additional design rules for frame members surrounding the infills.
The fundamental period T1 of an infilled frame structure can be estimated according to
the following equation:
3/41 tT C H ( 2.5 )
With:
0.075 /t cC A ( 2.6 )
and
2
wi0.2 ( / )c iA A l H effective area of the masonry infills at the bottom
storey.
lwi effective length of the i-th infill at the bottom
storey.
Ec length of the i-th infill at the bottom storey.
H building height
In the case of severe special irregularities due to an uneven in-plan distribution of
infills it is recommended to use spatial models (i.e. 3D models) for the structural
analysis of the building, explicitly including the presence of the infills. The infills with
significant openings should be neglected in the numerical model. It is also
recommended to perform a sensitivity analysis by varying the location of the infills
(e.g. removing some infills, typically the ones at the perimeter) and their mechanical
properties. Particular attention has to be given to the design of perimeter frames which

Modelling of unreinforced masonry infills and relative code provisions for the design of frame structures
21
can be affected by significant torsional amplifications (especially those located at the
flexible side, the farther from the center of stiffness). To account for these irregularities
it is suggested to double the in-plan accidental eccentricity (from 0.5 to 0.1).
In the case of significant irregularities along the height of the building due to the
absence or significant reduction of infills it is recommended to increase the effects of
the seismic actions. The magnification factor η can be evaluated according to:
1 /Rw EdV V q ( 2.7 )
Where:
∆VRw storey strength reduction with respect to that of adjacent storey.
EdV sum of the seismic force at the considered storey.
q behavior factor.
The local effects on the frame members (beams and columns) due to the infill-to-frame
interaction are considered through specific recommendations. It is recommended to
assume the entire column height as critical length for the column at the ground level.
For the case of partially infilled frame, the following recommendations are given:
the entire column height has to be assumed as critical height for the design of
the stirrups;
verify in shear a length lc=a/cosθ, starting from the beam-column joint, for the
smaller of the two design shear forces given by the horizontal component of the
diagonal force transmitted by the diagonal truss and the shear corresponding to
the column plastic moment (capacity design).
2.5. CONCLUSIONS
This chapter summarizes the main issues related to the seismic behavior of masonry
infills. Average mechanical properties of unreinforced masonry infills have been
identified through an extended research among the scientific literature. The data have

Modelling of unreinforced masonry infills and relative code provisions for the design of frame structures
22
been organized in a database available in Appendix 1. Then, a review of the
fundamental analytical models available for masonry infills has been provided. Finally,
code provisions for infilled frame buildings have been bravely presented. All these
issues will be used in the next chapters which provide an application of the state-of-the-
practice to the analyses of an existing reinforced concrete with unreinforced masonry
infills building which collapsed during the 2009 L’Aquila (Italy) earthquake.

The influence of masonry infills on the seismic response of reinforced concrete structures: the case of a
building in L’Aquila
23
3. The influence of masonry infills on the seismic
response of reinforced concrete structures: the
case of a building in L’Aquila
3.1. INTRODUCTION
This chapter is largely based on a recent work published by the author (Palermo et al.
2013) which provides a summary of the results of a joint research work between
University of Bologna and Degenkolb Engineers (one of the largest earthquake
engineering firm in the United States). The objective of the research work was to study
a complex of seven reinforced concrete with masonry infills buildings located in
Pettino (northwest of the urban center of L’Aquila), that arose a great interest in the
seismic engineering community. Although the seven buildings were built in the mid-
1980s adopting similar structural systems, they exhibited quite different responses to
the 2009 L’Aquila (Italy) earthquake: two collapsed while the remaining five exhibited
moderate to heavy damage.
On April 6, 2009 at 01:32:39 UTC (03:32:39 local time), a magnitude Ml=5.8
(Mw=6.3) earthquake struck a populated area in the Abruzzo region (central Italy). The
epicenter was located within 10 km of the urban center of L’Aquila, capital of the
region with approximately 70,000 inhabitants. The earthquake was the third strongest
recorded in Italy in the last 50 years after the 1976 Friuli (Mw=6.4) and the 1980 Irpinia
(Mw=6.9). Further, it is the strongest event providing strong motion records from
accelerometer stations located very close to the epicenter (approximately 4-6 km, Bursi
et al. 2009).
The earthquake caused a total of 305 deaths and 1500 injuries, destroyed or damaged
an estimated 10000-15000 buildings, prompted the temporary evacuation of 70000-
80000 residents, and left more than 24000 homeless. The building damage extended

The influence of masonry infills on the seismic response of reinforced concrete structures: the case of a
building in L’Aquila
24
over an area of approximately 600 square kilometers, including the urban center of
L’Aquila and several villages of the middle Aterno Valley (approximately 5-10 km to
the epicenter, ERII Special Earthquake Report, 2009).
Methods for the evaluation of the seismic response of existing building have been
proposed since the 1980s (fib Bulletin 24 2003). The most recent international building
codes for the seismic assessment and retrofitting of existing buildings (ASCE 41-06
and EC8) suggest approaches based on the introduction of specific limit states and
knowledge factors (or confidence factors) accounting for the uncertainty related to the
knowledge of the structure. Typically, three different values of the knowledge factor
are admitted indicating whether the level of knowledge is "minimum", "usual", or
"comprehensive”. As far as the method of analysis is concerned, non-linear procedures,
such as non-linear incremental static analyses, e.g. push-over analyses (Chopra and
Goel 2002) or non-linear incremental dynamic analyses (Vamvatisikos and Cornell
2002) are generally adopted rather than linear approaches (such as linear static analysis
or response spectrum analysis), commonly adopted for the design of new buildings. A
detailed benchmark for the modeling of existing reinforced concrete frame building can
be found in Goulet et al. 2007. Performance is quantified in terms of economic losses
and collapse safety. The assessment includes site-specific seismic hazard analyses, non-
linear dynamic structural response simulations to collapse, damage analyses, and loss
estimation. Guidelines for the case of old reinforced buildings designed prior modern
seismic design requirements can be found in Manfredi et al. 2007. When the original
drawings are not available, the fundamental phase of the methodology proposed by
Manfredi et al. 2007 lies in the application of the procedure called “Progetto Simulato”,
aimed at reconstructing the most probable geometrical and mechanical building details
applying the state-of-the-art at the construction time of the building. An application of
the EC8 procedures to an infilled reinforced concrete is detailed in Tanganelli et al.
2013.
The objective of this chapter is to investigate the possible reasons leading to the
collapse of one of the two buildings which collapsed in Pettino. In detail, the state-of-

The influence of masonry infills on the seismic response of reinforced concrete structures: the case of a
building in L’Aquila
25
the-practice is applied in order to verify if common modeling and analyses techniques
are suitable to perform a collapse analysis. The numerical analyses have been
conducted according to the ASCE 41-06 procedures, while material properties have
been determined following the prescription of the Italian building codes at the time of
the design and construction of the studied building.
3.2. OBSERVED DAMAGE OF REINFORCED CONCRETE BUILDINGS
The building damage observed from the L’Aquila earthquake varied substantially
depending on the building type, distance from the epicenter, age of construction,
condition of the structure. In some locations, there was also evidence of local soil
amplification effects (ERII Special Earthquake Report, 2009).
The mainshock caused heavy building damage in the center of L’Aquila, where MCS
(Mercalli-Cancani-Sieberg) intensity varied between VIII and IX. Building damage
was even more significant in some villages located in the middle Aterno Valley where
intensities as high as IX-X were experienced in Castelnuovo and Onna (Table 3.1, from
Galli et al. 2009). The effects of soil amplification with high level of damage (VIII) and
some collapsed buildings were observed in Pettino, an area located in the northwest
area of the center of the city. Figure 3.1 shows the distribution of the MCS intensity in
the area struck by the earthquake (available on the INGV web site,
http://www.mi.ingv.it/eq/090406/quest.html).
Reinforced concrete buildings in the L’Aquila region performed, on average, fairly
well, considering the limited seismic design requirements imposed by the Italian code
prior to 2009, and the severe ground shaking, substantially higher than the original
design level. The most common damage affected the exterior and interior infills
varying from diagonal cracks to out-of-plane failure. However, there were also isolated
cases of collapse like the Hotel Duca degli Abruzzi, the student housing observed in the
historic center of L’Aquila, and three apartments buildings in Pettino (ERII Special
Earthquake Report, 2009).

The influence of masonry infills on the seismic response of reinforced concrete structures: the case of a
building in L’Aquila
26
Figure 3.1: Distribution of the macroseismic intensity (MCS scale). Available on
http://www.mi.ingv.it/eq/090406/quest.html.
Table 3.1: The highest MCS intensity measure estimated after the 6 April 2009 L’Aquila
earthquake in the L’ Aquila Province.
Site City Lat.
[°]
Long.
[°]
MCS
Castelnuovo L’Aquila 42.295 13.628 IX-X
Onna L’Aquila 42.327 13.460 IX-X
San Gregorio L’Aquila 42.327 13.496 IX
Sant’Eusanio
Forconese
Sant’Eusanio
Forconese
42.288 13.525 IX
Villa S. Angelo Villa S. Angelo 42.269 13.538 IX
L’Aquila centro L’Aquila 42.356 13.396 XIII-IX
Paganica L’Aquila 42.358 13.473 XIII
Pettino L’Aquila 42.325 13.355 XIII
Among these, particular interest has been focused on one collapsed building, part of a
residential complex of seven condominiums located in Via Dante Alighieri, Pettino.
The seven structures are reinforced concrete with masonry infills buildings of three to
four stories constructed in the mid-1980s and consisting of 6 to 9 apartments. The plan
is similar for all the buildings including the presence of a porch (pilotis) at the ground
level. Despite these similarities, the seven buildings exhibited three different levels of
Pettino

The influence of masonry infills on the seismic response of reinforced concrete structures: the case of a
building in L’Aquila
27
damage: (A) Collapse; (B) Moderate damage (i.e. Repairable); (C) Minor damage (i.e.
Occupable). Specifically, two buildings collapsed with a soft story mechanism at the
ground level (level of damage A); two buildings had cracks on the exterior infills and
damage to some perimeter columns (level of damage B); three buildings displayed
damage concentrated at the lower levels of the exterior infills with cracks near the
openings (level of damage C). Figure 3.2 shows selected details of the damaged and
collapsed buildings.
(a)
(b)
(c)
Figure 3.2: Global state of damage (left) and particular of damage (right). (a) collapse; (b)
repairable; (c) occupable.

The influence of masonry infills on the seismic response of reinforced concrete structures: the case of a
building in L’Aquila
28
3.3. CASE STUDY
3.3.1. Building description
The studied building is one of the two buildings that collapsed in Via Dante Alighieri.
It is a four-story condominium built between the late 1970s and 1980s and designed
prior to modern day seismic detail requirements. According to the seismic code at the
time of construction (D.M. 3/03/1975), a reinforced concrete building located in
L’Aquila should be designed for a total lateral force (e.g. base shear) equal to Fh
=C·R·I·W (where C=0.07; R=1.0; I=1.0 and W equal to the weight of the building) and
corresponding to a design spectral acceleration equal to 0.07 g.
The external dimensions in plan are 25 m x 28 m. The maximum height of the building
roof ridge is 12.5 m with the 2nd, 3rd and 4th story, respectively, at 2.8 m, 5.8 m and
8.8 m from the ground level. It is to be noted that: (i) a portion of the first story is built
as an open porch; (ii) all the garages are located in the same direction; Figure 3.3 gives
the structural plans of the building (the column numbering is given).
Figure 3.3: structural plan of the building (foundation system on the left, typical floor on the
right).
1 2 3
4 5 6
7 8 10
11 12 14
201918
21 221615 17
9
282726 29 302423 25
363534 37 383231 33
13
50
30
50
30
50
30
50
30
50
30
50
30
50
30
50
30
50
30
50
30
50
30
50
30
50
30
50
30
30
50
30
50
50 50
30
80
30
50
30
50
30
80
30
30
50
30
50
50
30
50
30
80
30
80
30
30
50
30
50
30
50
30
50
30
50
30
50
30
50
30
50
30
50
30
50
39
40
40 2020
40
40
0,80
0,8
0
Foundations.
Structural layout
1 2 3
4 5 6
7 8 10
11 12 14
201918
21 221615 17
9
282726 29 302423 25
363534 37 383231 33
13
50
30
50
30
50
30
50
30
50
30
50
30
50
30
50
30
50
30
50
30
50
30
50
30
50
30
50
30
30
50
30
50
50 50
30
80
30
50
30
50
30
80
30
30
50
30
50
50
30
50
30
80
30
80
30
30
50
30
50
30
50
30
50
30
50
30
50
30
50
30
50
30
50
30
50
H=
16+
4
abita
zion
e
H=
16+
4
H=
16+
4
H=
16+
4
H=
16+
4
H=
16+
4
abita
zion
e
abita
zion
eab
itazi
one
abita
zion
e
abita
zion
e
H=
16+
4
abita
zion
e
H=
16+
4
H=
16+
4
H=
16+
4
H=
16+
4
H=
16+
4
abita
zion
e
abita
zion
eab
itazi
one
abita
zion
e
abita
zion
e
50
20
30
50
H=16+4
abitazione
H=16+4
abitazione
H=16+4
abitazione
H=16+4
abitazione
H=16+4
abitazione
H=16+4
abitazione
H=16+4
abitazione
H=16+4
abitazione
H=1
6+4
abita
zion
e
1520
30
50
50
39
1 2 3
4 5 6
7 8 10
11 12 14
201918 21 221615 17
9
282726 29 302423 25
13
39
363534 37 383231 33
Typical floor.
Structural layout

The influence of masonry infills on the seismic response of reinforced concrete structures: the case of a
building in L’Aquila
29
3.3.2. Observed damages
Observation of the collapsed building revealed that: (i) most of the perimeter columns
at the ground story failed in shear with some evident buckling of the longitudinal bars
(no transverse reinforcement within the joints); (ii) the exterior infills at the ground
story exhibited various failure mechanisms (some panels had evident diagonal cracks
with corner crushing while others failed due to out-of-plane effects).
The observed damages indicate a soft/weak story mechanism of collapse. Furthermore,
it can be observed, from the particular location of the collapsed columns, that the
building experienced a significant torsional response. Figure 3.4 gives selected details
of the observed damages.
(a)
(b)

The influence of masonry infills on the seismic response of reinforced concrete structures: the case of a
building in L’Aquila
30
(c)
Figure 3.4: Damages observed for the studied building. (a) Soft/weak story mechanism; (b) Shear
failure in columns; (c) Infills failure.
The geometric and mechanical properties of the structural elements were partially
obtained from in-situ measurements and estimated based on the building code at the
time of construction (D.M. 26/03/1980, D.M. 3/03/1975). Table 3.2 provides the
dimensions and reinforcement of the structural elements as obtained from the in-situ
reconnaissance. The nominal shear strength of the typical columns (cross section of 50
cm x 30 cm, see Table 3.2), evaluated according to Eq. 6-4 of ASCE 41-06, is around
150-160 kN, and the most probable expected mode of failure is shear failure (condition
iii of Table 6-8 of ASCE 41-06).
Table 3.2: Cross section dimension and reinforcement details for columns and beams.
Structural
element
Cross section
[cm x cm]
Longitudinal bars
[mm]
Ties**
[mm]
ρL***
[%]
ρT***
[%]
Exterior
Columns
50 x 30* deformed -Φ 16 smooth - Φ 8@
15-20 cm
1.0 0.5-0.7
Interior Columns 50 x 30* deformed - Φ 16 smooth - Φ 8@
15-20 cm
1.0 0.5 0.7
Exterior Beams 50 x 30 deformed - Φ 16 smooth - Φ 8@
15-20 cm
1.0 0.5 0.7
Interior Beams 50 x 30- 20 x
50
deformed - Φ 16 Φ 8@ 15-20 cm 1.0 / 1.6 0.5 / 1.0
*Two columns have a cross section of 80 cm x 30 cm.
** Spacing at column boundaries. Spacing at mid-section is approximately 30 cm.
***ρL and ρT are the longitudinal and transversal reinforcement ratios, respectively.
The mean compressive strength of the concrete was measured in situ and resulted equal
to 20 MPa. Other mechanical properties of the RC elements, which could not be
determined experimentally, (i.e. the steel strength/modulus) were evaluated following

The influence of masonry infills on the seismic response of reinforced concrete structures: the case of a
building in L’Aquila
31
the suggestions reported in the work by De Stefano et al. 2013 and the specifications
and prescriptions of the Italian code at the time of the construction (D.M. 26/03/1980,
D.M. 3/03/1975).
The geometric properties of the exterior and interior infills were measured in-situ. The
exterior walls consist of a double wythe brick infill, specifically a 10 cm air gap
between 12 cm and 8 cm wide brick infill. The interior walls are a single layer of 8 cm
wide brick. The bricks are hollow with approximately 60 percent of voids.
The mechanical properties assumed for the masonry are taken from the results of
experimental tests performed in L’Aquila on masonry with age and construction similar
to the case study (Colangelo 2005) and are summarized in Table 3.3.
Table 3.3: Geometrical and mechanical properties of the exterior and interior infills masonry.
Element Masonry total
thickness*
[cm]
Brick dimension
[cm x cm x cm]
Number of layers Em**
[MPa]
fv***
[MPa]
Exterior Infill 34 24x24x12 2 masonry +1 air 3200 0.35
Interior Infill 8 24x24x8 1 masonry 3200 0.35
*total thickness including the middle air gap
**Masonry elastic modulus
*** Masonry shear strength
3.4. THE INPUT AT THE BASE
The mainshock has been recorded by 57 stations belonging to the “Rete
Accelerometrica Nazionale”, RAN (national accelerometric network). Among all the
available records, the accelerograms recorded by four stations (namely AQA, AQV,
AQG, AQK), located at a distance less than 6 km from the epicenter (Mausi and
Chiausi 2009, Iervolino and Chioccarelli 2010, Chioccarelli et al. 2009), have been
selected to perform the numerical analysis. The case study building is approximately 5
km from the epicenter (Figure 3.5). Details of these four selected records are given in
Table 3.4.

The influence of masonry infills on the seismic response of reinforced concrete structures: the case of a
building in L’Aquila
32
Table 3.4: Selected strong motion station with site coordinate, soil type classification (NTC-2008),
epicentral distance and PGA recorded.
Code Name Lat.
[°]
Long.
[°]
Soil type Epicentral
Distance
[Km]
Recorded
PGA
[g]
AQV V. ATERNO-
CENTRO VALLE
42.377 13.344 B 4.8 0.66
AQA V. ATERNO-
F. TERNO
42.376 13.339 B 4.6 0.44
AQG V. ATERNO-
COLLE GRILLI
42.373 13.337 B 4.4 0.48
AQK AQUIL PARKING 42.345 13.401 C 5.6 0.36
Figure 3.5: Location of the epicenter (marked in yellow), strong motion stations (marked in green)
and site of the building (marked in red); from Google Earth.
The four accelerograms were used to obtain an estimate of the base acceleration
experienced by the building according to the simple procedure described hereafter.
For each record, as obtained at the k-th station, the corresponding PGA (referred to as
PGAk) was extrapolated. Then, accounting for the soil characteristic trough a soil
amplification factor (referred to as AFk, from L’aquila microzonation map, available on
line at http://www.protezionecivile.gov.it/), the PGA at bedrock condition (referred as
PGAkB) was estimated by dividing the PGAk by the soil amplification factor AFk. Each
value of dk (epicentral distance of the k-th station) and PGAkB is used to construct an

The influence of masonry infills on the seismic response of reinforced concrete structures: the case of a
building in L’Aquila
33
attenuation curve, assuming the Sabetta- Pugliese (Sabetta and Pugliese 1996)
attenuation relationship. Using the Sabetta-Pugliese attenuation relationship, the
PGAP,kB
(i.e. the PGA at the building epicentral distance) has been estimated.
The mean value of the PGAP,kB over the four stations provides an estimate of the PGA
at the site of the building assuming a bedrock condition (4
B B
P P,kk=1
1PGA = PGA
4 ). The
resulting mean value of PGAP,kB is equal to 0.408 g. Finally, multiplying PGAP,k
B by
the soil amplification factor at the building location, AFP (estimated equal to 1.7 from
the seismic microzonation map of the L’Aquila area available on line on
http://www.protezionecivile.gov.it), a value of PGA equal to 0.695 g (
4 4B B
P P,k P P p P,kk=1 k=1
1 1PGA = PGA FA =PGA FA PGA
4 4 ) gives an estimate of the PGA
experienced by the building considering the actual soil conditions.
Table 3.5 provides the values of dk, PGAkB, PGAP,k
B, PGAP,k (i.e. PGAP,k
B AFk) and
AFk for each station and the corresponding mean value over the four stations.. It can be
noted the mean values of PGAkB and PGAP,k
B are very close (0.412 and 0.408,
respectively) due to small differences between stations epicentral distances and the
building epicentral distance.
Table 3.5: Values of PGAkB, PGAP,k
B, PGAP,k, corresponding mean value over the four stations and
amplification factor AFk for each station.
Station
Epicentral
Distance, dk
[Km]
PGAkB
[g]
PGAP,kB
[g]
PGAP,k
[g]
AFk
AQV 4.8 0.495 0.482 0.819 1.33
AQA 4.6 0.395 0.375 0.637 1.11
AQG 4.4 0.435 0.408 0.694 1.11
AQK 5.6 0.360 0.370 0.629 1.00
Mean / 0.412 0.408 0.695 /

The influence of masonry infills on the seismic response of reinforced concrete structures: the case of a
building in L’Aquila
34
3.5. THE NUMERICAL MODEL OF THE BUILDING
A number of finite element models were developed using the open source software
Opensees, (Mazzoni et al. 2006) in order to: (i) understand the factors that contributed
to the collapse of the building, (ii) determine if a prediction of failure using current
analysis techniques was possible; (iii) evaluate the influence of the column seismic
details (i.e. ductility) on the seismic behavior of the building. Despite the possibility to
use sophisticated models (available in Opensees), common state-of-the-practice
techniques (say for design professionals) have been chosen.
3.5.1. Column shear failure
Columns were modeled using “Beam-Column elements” (Mazzoni et al. 2006) and a
fiber section to better predict the stiffness of the concrete columns and to include the
axial-flexure interaction. “Zero-length elements” (Mazzoni et al. 2006) were added at
each top and bottom column in order to account for the mechanism of shear failure. A
“zero-length element” has two nodes connected by multiple “UniaxialMaterial objects”
(Mazzoni et al. 2006) placed at the same coordinate, thus leading to an element of null
length. A generalized force (i.e. force or moment) vs. displacement (i.e. displacement
or rotation) relationship allows to define the behavior of this element. For the specific
case, the adopted relation is a shear vs. horizontal displacement (V-d), backbone curve.
Two different backbone curves (graphically represented in Figure 3.6) have been
adopted for the zero-length elements:
Brittle model;
Semi-ductile model.
The Brittle backbone curve is representative of a column expected to experience a
shear mechanism (condition iii of Table 6-8 of ASCE 41-06). This behavior is typical
of columns designed prior modern seismic requirements, as in the case of the studied
buildings. The shear strength, Vn, is estimated as per ASCE 41-06 considering the two

The influence of masonry infills on the seismic response of reinforced concrete structures: the case of a
building in L’Aquila
35
contributions of concrete and transverse reinforcement. The initial stiffness of the curve
is equal to the column shear stiffness:
s cs
column
A GK
h ( 3.1 )
where As is equal to Ag/ (where Ag is the gross section area and is the shear factor
equal to 1.2 for rectangular sections); Gc is the shear modulus of concrete and hcolumn is
the length of the columns. A fictitious residual (a numerical artifact) strength Vres is
assumed to be equal to 0.1Vn
The Semi-ductile backbone curve is representative of a column expected to show a
flexure-shear mechanism (condition ii of Table 6-8 of ASCE 41-06). This behavior is
typical of columns with light transverse reinforcement (Elwood and Moehle 2005). In
this case the backbone curve is characterized by a post inelastic branch that follows the
initial elastic behavior, indicating a ductile behavior. The ultimate drift at shear failure
has been estimated according to Elwood and Moehle 2005 using the following
relationship (semi-empirical):
3 1 14 "
100 40 40 ''s
g cc
P
A ff
( 3.2 )
Where ρ” is the transverse steel ratio, ν is the nominal shear stress, f’c is the concrete
compressive strength, P is the axial load on the column. For a transverse steel ratio
between 0.50% and 0.80% (typical at the time of construction of the studied buildings)
Equation ( 3.2 ) predicts values of ultimate drift between 3.0-5.0% depending on the
variation of axial load due to earthquake loading. Note that in Equation ( 3.2 ), δs
represents the displacement of the total column displacement, thus in order to use that
equation for the zero-length element it is necessary to subtract the flexural component
of the horizontal displacement (δflex) from δs.

The influence of masonry infills on the seismic response of reinforced concrete structures: the case of a
building in L’Aquila
36
(a) (b)
Figure 3.6: Normalized backbone curves for the zero-length element placed at the top column at
the bottom story: (a) brittle model; (b) semi-ductile model.
The infills have been modeled using nonlinear equivalent struts following the general
approach proposed by Al-Chaar 2002. It is based on the following steps: (i) evaluation
of the equivalent strut width; (ii) evaluation of the strength of the equivalent strut; (iii)
evaluation of the inelastic behavior of the strut. The equation used to calculate the
equivalent strut width, a, of a full panel is based on the conservative approach by
Mainstone 1971 which establishes a lower bound of the expected elastic stiffness of the
infill (Al-Chaar 2002). For the sake of clearness, Table 3.6 gives the value of the
equivalent width, a, related to three different amount of opening in the infills. To
estimate the effective infill stiffness in a more accurate way, (i.e. less conservatively)
an effective masonry modulus Em,eff has been estimated based on experimental data
from cyclic tests performed on infill panels built using the same type of brick and
technology of those of the studied building (Colangelo 2005). A value of Em,eff equal to
3Em was required to match the experimental data.
Table 3.6: Range of values of the equivalent strut width, a.
Type of opening
No opening Small opening
(i.e. window)
Normal opening
(i.e. door)
Large opening
(i.e. garage)
Equivalent strut
width, a [cm]
50-60 30-40 20-30 10-20
Where the values calculated are referred to the following properties of the frame/masonry infills:
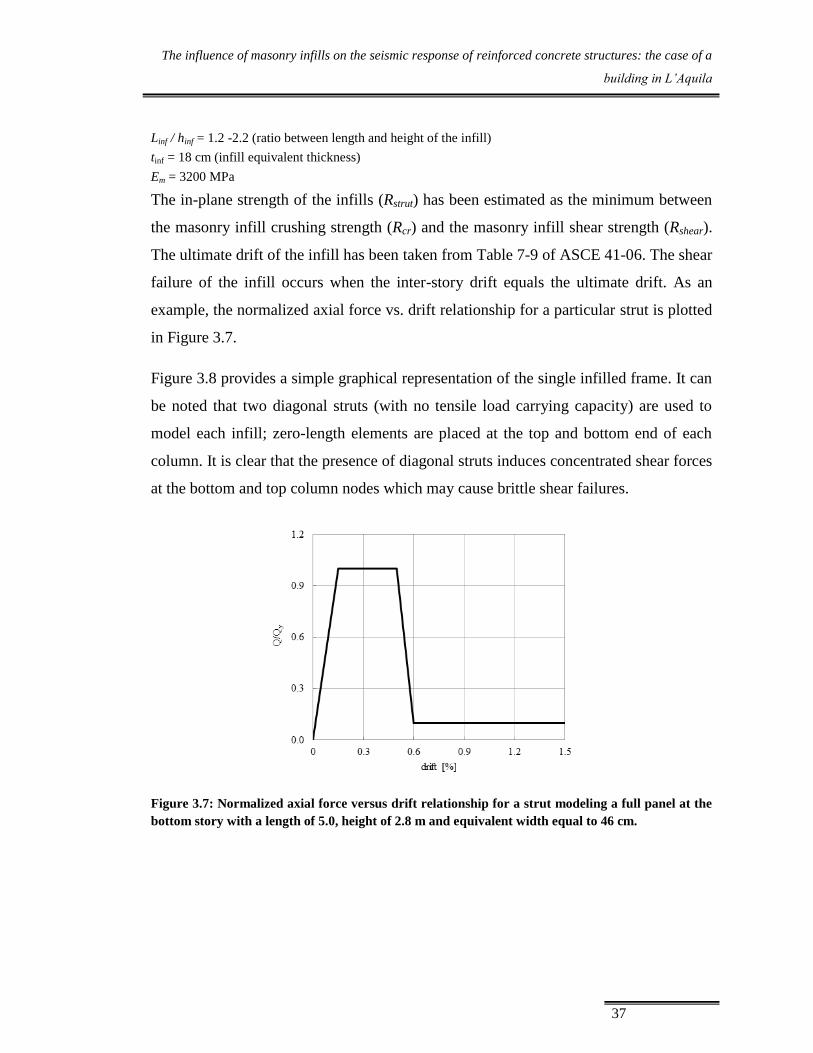
The influence of masonry infills on the seismic response of reinforced concrete structures: the case of a
building in L’Aquila
37
Linf / hinf = 1.2 -2.2 (ratio between length and height of the infill)
tinf = 18 cm (infill equivalent thickness)
Em = 3200 MPa
The in-plane strength of the infills (Rstrut) has been estimated as the minimum between
the masonry infill crushing strength (Rcr) and the masonry infill shear strength (Rshear).
The ultimate drift of the infill has been taken from Table 7-9 of ASCE 41-06. The shear
failure of the infill occurs when the inter-story drift equals the ultimate drift. As an
example, the normalized axial force vs. drift relationship for a particular strut is plotted
in Figure 3.7.
Figure 3.8 provides a simple graphical representation of the single infilled frame. It can
be noted that two diagonal struts (with no tensile load carrying capacity) are used to
model each infill; zero-length elements are placed at the top and bottom end of each
column. It is clear that the presence of diagonal struts induces concentrated shear forces
at the bottom and top column nodes which may cause brittle shear failures.
Figure 3.7: Normalized axial force versus drift relationship for a strut modeling a full panel at the
bottom story with a length of 5.0, height of 2.8 m and equivalent width equal to 46 cm.

The influence of masonry infills on the seismic response of reinforced concrete structures: the case of a
building in L’Aquila
38
Figure 3.8: Model of the single infilled frame.
3.5.2. The models of the entire building
Three different models of the entire building have been developed with the purpose of
investigating the influence of the infills and the influence of the column ductility on the
seismic response of the building:
a. Bare Frame (BF): Columns, beams and foundations were included in the
Opensees (McKenna et al. 2005) model. The infills are not explicitly
modeled; clearly, their contribution in terms of mass was included;
b. Infilled Frame-Brittle (IF-B): Infills are explicitly modeled as equivalent
struts following the procedure described in the previous section. The
backbone curve adopted to represent the column behavior in shear is the
Brittle model introduced in the previous section;
c. Infilled Frame-Semi-ductile (IF-D): Infills are explicitly modeled as
equivalent struts following the procedure described in the previous section.
The backbone curve adopted to represent the column behavior in shear is
the Semi-ductile model introduced in the previous section

The influence of masonry infills on the seismic response of reinforced concrete structures: the case of a
building in L’Aquila
39
It has to be noted that all developed models are not able to reproduce a real building
collapse, (loss of axial load capacity), since no interaction between shear and axial
column strength has been provided. Therefore, the terms “soft/weak story mechanism”
or “collapse”, used in the section Analysis and Results, will indicate the shear failure of
the lateral resisting system (i.e. columns and/or infills).
3.6. ANALYSES CONDUCTED AND MAIN RESULTS
This section presents the main results obtained through the development of: (i)
Response History Analysis; (ii) Push-over analysis; and (iii) Incremental Dynamic
Analysis. These analyses were developed in order to provide meaningful simulations of
what happened in the night of the 6 April 2009. In detail, the two main purposes are:
The evaluation of the effect due to the presence of the exterior infills on the
seismic response of the building.
The evaluation of the effect of different columns ductility on the seismic
response of the building.
3.6.1. Response History Analysis
Response History Analyses (RHA) have been performed on the two infilled models
(IF-B and IF-D) using the selected ground motions scaled at a value of PGA equal to
0.7 g which represents an estimate of the PGA experienced by the building during the
earthquake. Provided the models exhibited a similar response to the different ground
motions, only the response to the AQV record is described.
Figure 3.9 shows the roof displacement response history (i.e. the response of the master
node at the roof) observed for the IF-B model and IF-D model, respectively. The peak
roof displacements are equal to 7.11 cm (corresponding to a roof drift equal to 0.62%)
for IF-D model and 6.16 cm (corresponding to a roof drift of 0.53%) for the IF-B
model. The two responses highlight that, while IF-D displacement response comes to
zero after the end of the ground shaking, the IF-B response history exhibits a residual

The influence of masonry infills on the seismic response of reinforced concrete structures: the case of a
building in L’Aquila
40
displacement on the x-direction equal approximately to 2 cm, indicating a failure
mechanism. A more clear understanding of the different model responses is provided
by the comparison of the maximum inter-story drift response history (i.e. the inter-story
drift at the master node of each story, Figure 3.10). IF-B interstorey-drift response
shows a high concentration of drift at the first story indicating a soft/weak story
mechanism, while IF-D inter-story response shows higher drifts at the upper stories
(less than the maximum value exhibited by the IF-B response at the bottom story)
indicating a more uniform damage distribution along the building stories.
Figure 3.11 (a and c) graphically illustrates the envelope of the maximum first floor
displacement for the IF-B model and IF-D model, respectively. It reveals that the IF-B
model experiences a significant torsional response due to a progressive “asymmetric”
failure of the lateral resisting elements. On the contrary, the envelope of IF-D model
does not reveal a significant torsion of the building. Figure 3.11b shows pictures of
columns 2 and 15 after the earthquake. Figure 3.12 and Figure 3.13 compares the shear
response history of the zero-length elements placed at the top of column 2 and the axial
force in a selected strut (the one representing the infill 2) for the two models,
respectively. It can be first noted that in the IF-B model the column failed in shear (i.e.
the shear in the zero length elements reaches the capacity Vn and then drops to the
residual strength, Vres), while in the IF-D model the column is able to sustain the loads
for all the duration of the ground motion. Moreover it should be highlighted that in the
IF-B model column 2 failed just after the failure of the related infill. Table 3.7 provides
a qualitative comparison of the damage obtained from the response history analysis and
in-situ observation. It can be noted that the IF-B model is able to better simulate the
damages experienced by the collapsed building.

The influence of masonry infills on the seismic response of reinforced concrete structures: the case of a
building in L’Aquila
41
(a) (b)
Figure 3.9: Roof displacement Response History (AQV ground motion): a) IF-B model; b) IF-D
model.
(a) (b)
Figure 3.10: Maximum interstorey-drift (AQV ground motion): (a) IF-B model; (b) IF-D model.
Table 3.7: Comparison of the damages observed from the response history analysis and in situ
observations of the collapsed building.
Damage Type
In-situ observation
RHA
IF-B IF-D
Mechanism of collapse
(global)
Soft/weak mechanism
at 1st story
Soft/weak mechanism
at 1st story
Not observed
Column shear failure At 1st story At 1
st story Not observed
Infill failure At 1st story At 1
st story At 1
st and 3
rd story

The influence of masonry infills on the seismic response of reinforced concrete structures: the case of a
building in L’Aquila
42
(a) (b) (c)
Figure 3.11: (a) Torsional envelope response of the building from the RHA analysis (AQV ground
motion).; (b) photos of the columns marked as 2 and 15 (and circled) after the earthquake; (c)
Torsional envelope response of the IF-D model from the RHA analysis (AQV ground motion).
(a) (b)
Figure 3.12: Normalized Shear force Response History for the zero-length element at the bottom
story for column 2: (a) IF-B model; (b) IF-D model.
(a) (b)
Figure 3.13: Normalized Axial force Response History for strut 2 (strut 2 represents the infill
between the columns indicated as 2 and 3 in Figure 3.3): (a) IF-B model; (b) IF-D model.

The influence of masonry infills on the seismic response of reinforced concrete structures: the case of a
building in L’Aquila
43
3.6.2. Push-over Analysis
Displacement-controlled push-over analyses were performed along both the principal
direction of the building (referred to as x and z), with the purpose of evaluating the
mechanisms of failure for the different models. For the sake of conciseness, the
following discussions focus on the results related to the push-over analyses along the x-
direction only. Similar behavior was observed from the analysis along z-direction. The
results of the analyses are schematically illustrated by the push-over curves of Figure
3.14, in terms of base shear (V) vs. roof drift, D (i.e. the drift of the master node at the
roof level). Critical points (marked with a circle) on the push-over curves are defined as
follows:
Point A (VA, DA): indicates the base shear and roof drift at the initial cracking of
the infills;
Point B (VB, DB): indicates the base shear and roof drift at the first failure of the
infill (where failure occurs when the strut reaches its axial compression
strength);
Point C (VC, DC): indicates the base shear and roof drift at the peak strength of
the building;
Point D (VD, DD): indicates the base shear and drift corresponding to the shear
failure of last lateral resisting elements that failed.
Table 3.8 provides values of the critical points for the three models (kin indicates the
initial stiffness of the building measured at a value of base shear equal to 10% of the
Vp.).
Table 3.8: Base shear (V) roof drift (D) of the significant point and initial stiffness (kin) from the
Push-over curves.
BF IF-B IF-D
Point V [kN] D [%] V [kN] D [%] V [kN] D [%]
A / / 3300 0.04 3300 0.04
B / / 5100 0.20 5100 0.20
C 3500 0.73 5470 0.33 5485 0.44
D 2340 0.73 2850 0.50 2760 0.56
Kin 70000 kN/m 950000 kN/m 950000 kN/m

The influence of masonry infills on the seismic response of reinforced concrete structures: the case of a
building in L’Aquila
44
Inspection of the push-over curves for the BF and IFB models highlights that:
the initial stiffness increases by an order of magnitude;
the peak strength capacity increases by a factor equal to 55% of bare frame
strength (increase);
displacement capacity at peak strength reduces by 50% of that of the bare
frame.
Table 3.9 identifies the progression of significant failure events leading to the failure of
the lateral resisting system for the IF-B model. For each event the base shear, the roof
drift and the description of the element (or elements) that collapsed, is given. All
failures are concentrated at the bottom story indicating a soft/weak story mechanism at
the ground floor.
Table 3.9: Numerical values of base shear and roof drift of the main failure events for the IF-B
model.
Event number Vbase [KN] D [%] Failure
B1 5160 0.20 infills @ 1st story
B2 5470 0.33 columns @ 1st story
B3 5080 0.35 columns @ 1st story
B4 4200 0.38 columns @ 1st story
B5 3380 0.43 infills /columns @ 1st
story
B6 3090 0.49 infills /columns @ 1st
story
B7 2760 0.50 infills @ 1st story
Figure 3.14 compares the response of the two models for the infilled frame (in addition
to that of the bare frame). It can be first noted that both models have a similar global
mechanism of failure: a progressive failure of infills and columns producing a
soft/weak story mechanism at the ground floor. However, although the global strength
capacity of the single elements is the same for both the models, the IF-D response
exhibits an increase of 7% of strength and 14% of displacement. The higher
performance of IF-D model results from a different sequence of failures relative to the
IF-B models due to the more ductile shear elements. For the IF-B model, the failure of
the infill at the 1st story is observed prior to column shear failure.

The influence of masonry infills on the seismic response of reinforced concrete structures: the case of a
building in L’Aquila
45
Figure 3.14: Push-over curves for BF, IF-B and IF-D models.
The IF-D model shows infill failure also at the upper stories before the column shear
failure at the 1st story. Table 3.10 gives a summary of the sequence of main failure
event (vertical drop in the push over curve).
Table 3.10: Numerical values of base shear and roof drift of each failure events for the IF-D model.
Event number V [KN] D [%] Failure
D1 5160 0.20 Infills @ 1st story
D2 5820 0.43 Infills @ upper stories
D3 5110 0.50 Infills @ upper stories
D4 4530 0.52 Infills /Columns @ 1st
story
D5 3290 0.55 Infills /Columns @ 1st
story
D6 2760 0.58 Infills /Columns @ 1st
story
3.6.3. Incremental dynamic Analysis
Incremental Dynamic Analyses (IDAs) have been developed according to
Vamvatisikos and Cornell 2002 aimed at comparing the estimated value of PGA
leading to significant building damage relative to the estimated PGA at the site. Each
model (i.e. BF, IF-B and IF-D) was subjected to selected ground motions that were
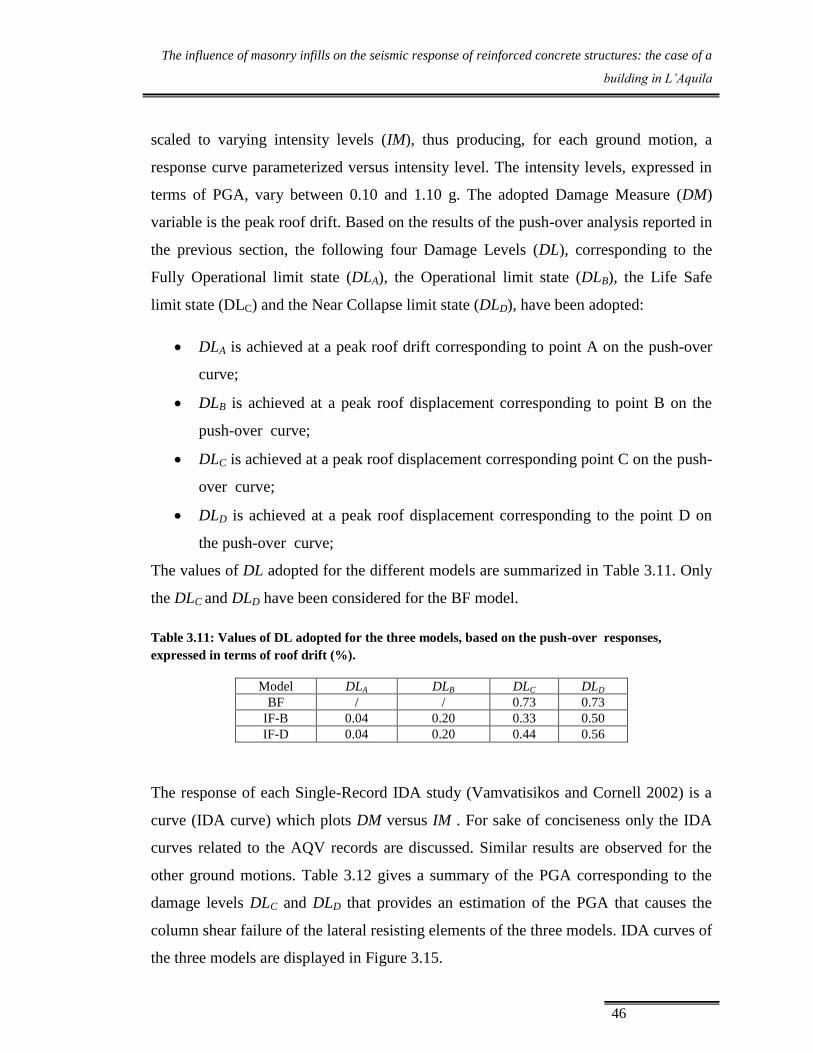
The influence of masonry infills on the seismic response of reinforced concrete structures: the case of a
building in L’Aquila
46
scaled to varying intensity levels (IM), thus producing, for each ground motion, a
response curve parameterized versus intensity level. The intensity levels, expressed in
terms of PGA, vary between 0.10 and 1.10 g. The adopted Damage Measure (DM)
variable is the peak roof drift. Based on the results of the push-over analysis reported in
the previous section, the following four Damage Levels (DL), corresponding to the
Fully Operational limit state (DLA), the Operational limit state (DLB), the Life Safe
limit state (DLC) and the Near Collapse limit state (DLD), have been adopted:
DLA is achieved at a peak roof drift corresponding to point A on the push-over
curve;
DLB is achieved at a peak roof displacement corresponding to point B on the
push-over curve;
DLC is achieved at a peak roof displacement corresponding point C on the push-
over curve;
DLD is achieved at a peak roof displacement corresponding to the point D on
the push-over curve;
The values of DL adopted for the different models are summarized in Table 3.11. Only
the DLC and DLD have been considered for the BF model.
Table 3.11: Values of DL adopted for the three models, based on the push-over responses,
expressed in terms of roof drift (%).
Model DLA DLB DLC DLD
BF / / 0.73 0.73
IF-B 0.04 0.20 0.33 0.50
IF-D 0.04 0.20 0.44 0.56
The response of each Single-Record IDA study (Vamvatisikos and Cornell 2002) is a
curve (IDA curve) which plots DM versus IM . For sake of conciseness only the IDA
curves related to the AQV records are discussed. Similar results are observed for the
other ground motions. Table 3.12 gives a summary of the PGA corresponding to the
damage levels DLC and DLD that provides an estimation of the PGA that causes the
column shear failure of the lateral resisting elements of the three models. IDA curves of
the three models are displayed in Figure 3.15.

The influence of masonry infills on the seismic response of reinforced concrete structures: the case of a
building in L’Aquila
47
Table 3.12: Values of PGA corresponding to the damage levels obtained from the IDA analysis.
Model DLC DLD
BF 0.38g 0.38g
IF-B 0.62g 0.82g
IF-D 0.78g 0.90g
IDA curve of the BF model shows that the BF model reaches the damage levels DLC
and DLD for a PGA less than 0.40 g. This is an expected behavior for a reinforced
concrete building designed prior to modern day seismic requirements.
Inspection of the IDA curve of the IF-B model allows the following observations:
The first damage level (DLA), corresponding to the failure of the first infill is
reached for a PGA approximately equal to 0.18 g. This indicates that the
exterior infills are able to remain in the elastic range up to a level of PGA
corresponding to a design PGA which is typical for a low seismic region.
The second limit state (DLB) is achieved at a PGA equal approximately to 0.50
g, that is higher than the actual design PGA for common building adopted in
Italy (i.e. an earthquake with a return period equal to 476 years)
The third and fourth damage levels are achieved at a PGA approximately equal
to 0.60 g and 0.80 g. In other words according to the IF-F model the building
should collapse for a PGA between 0.6 g and 0.8 g. This result is an agreement
with the value of PGA that has been estimated at the site of the collapsed
building.
Inspection of the IDA curve of the IF-D model allows the following observations:
The first two damage levels (DLA and DLB) are reached at the same PGA of
model IF-B. This is an expected behavior because the columns are within the
elastic range;
The third and fourth damage levels are achieved at a PGA equal approximately
to 0.80 g and 0.90 g, respectively. This result confirms the significant influence
of ductile detailing on the seismic response of the building. Furthermore it can
suggest a preliminary possible explanation of the different behavior observed

The influence of masonry infills on the seismic response of reinforced concrete structures: the case of a
building in L’Aquila
48
for the other similar buildings at the site that did not collapse: the presence of
possibly more ductile column detailing may have prevented the collapse of the
other buildings.
(a)
(b)

The influence of masonry infills on the seismic response of reinforced concrete structures: the case of a
building in L’Aquila
49
(c)
Figure 3.15: IDA curves for: (a) BF model; (b) IF-B model; (c) IF-D model.
3.7. CONCLUSIONS
This chapter focused on the study of an existing infilled frame with unreinforced
masonry building which collapsed after the 2009 L’Aquila earthquake. The building
belong to a group of similar seven buildings, two of them collapsed, while the
remaining five experienced from low to moderate damage. The main purpose is to
investigate the reasons leading to such a different seismic behavior by applying the
state of-the-practice techniques related to the analysis of infilled frame buildings. Based
on this case study, we can make the following conclusions:
1. The estimated peak ground at the site, based on the application of currently
accepted attenuation relationships, along with consideration of the effects soil
amplification, was approximately 0.70g (note that this value of ground
acceleration is quite larger than the current design acceleration for a reinforced
concrete building located in an high seismicity region in Italy, approximately
equal to 0.50 g considering the maximum soil amplification factor as per Italian
building code). The high value of PGA at the site of the studied building is
mainly due to a local soil amplification effect due to the presence of a soft

The influence of masonry infills on the seismic response of reinforced concrete structures: the case of a
building in L’Aquila
50
alluvial layer of soil (as documented from the INGV investigation leading to the
microzonation map of the L’Aquila region)
2. Based on the response of the IDAs with a Brittle model (representative of a
nonductile shear-controlled column with poor confinement detailing), and based
on the in-situ measured details on the collapsed building, we could have
predicted that the building reached the Near Collapse limit state at a peak
ground acceleration of 0.60g. On the contrary performing the IDAs with a Semi-
ductile model (representative of a less nonductile shear-controlled column with
slightly better confinement detailing), we would have predicted that the
building reached the Near Collapse limit state at a PGA between 0.80 g and
0.90 g, thus greater than the estimated PGA at the site of the building.
Therefore, it is likely that the buildings that collapsed had poorer confinement
detailing relative to the buildings that did not collapse.
3. The results of time history analysis performed using the recorded accelerograms
scaled at the PGA experienced by the building highlighted that: (i) the Brittle
model showed a mechanism of failure characterized by a severe torsional
response that caused shear failure at select perimeter infill walls followed by
column shear failure ending in collapse; (ii) on the contrary, the Semi-ductile
model showed a mechanism of damage at the exterior infills without the shear
failure of the columns.
4. Push-over analyses (as well as IDAs) have been useful in order to confirm two
aspects already well known in literature:
i. Infill panels influence stiffness, strength and global ductility of the
building and should not be neglected in the evaluation and retrofit of
these types of buildings. As such, an asymmetrical distribution of infill
walls will result in a torsional effect that will have an adverse effect on
the bare frame response. In detail, for the studied building the overall
effect of the infills may be considered as positive provided that it led to
a not negligible increase of the strength capacity of the building, if
compared to the bare structure which most probably should have

The influence of masonry infills on the seismic response of reinforced concrete structures: the case of a
building in L’Aquila
51
collapsed for a much lower seismic intensity; however, the asymmetric
collapse of the perimeter infills most probably contributed to the
observed weak/soft story mechanism of collapse.
ii. In the case of light reinforced columns, a slight variation in columns
details (e.g. deformed transverse ties versus smooth bars, 90° or 135°
hooks, etc.) or also the level of axial load acting during the earthquake
will significantly affect the seismic response of the building.
5. Using the most current analysis techniques readily available to the design
professional (i.e. a non-linear diagonal strut model for the exterior infills and an
appropriate backbone curve for columns shear failure), we were able to predict
the building performance that correlated to the observed building damage. In
this regard, special care should be taken to use the correct shear failure model
(i.e. Brittle or Semi-ductile) to correctly predict building behavior.


The first developments towards a seismic-resistant masonry infill
53
4. The first developments towards a seismic-
resistant masonry infill
4.1. INTRODUCTION
Masonry structures and reinforced concrete frame structures with masonry infills
represent a large part of the Italian building heritage. The most severe earthquakes
which struck the Italian Peninsula during the last decades (Molise 2002, L’Aquila
2009, Emilia Romagna 2012) caused severe damages to infilled RC frame buildings
designed prior modern seismic design requirements, thus confirming the brittle nature
of the response of unreinforced masonry infills and their adverse influence in the
response of the entire building, especially in the case of irregular distributions in plan
or height (as previously discussed in Chapter 2).
Nevertheless, although the inherent brittle nature of the masonry response was well
known from decades (Hendry et al. 2003), the recent tragic failure of RC frame with
masonry infills raised awareness among the community, and contributed to the
development of national research projects focused on the innovation of the technology
of masonry infills, aimed at obtaining superior seismic performances. One of the actual
largest national projects (namely “Italici”, 2012-105) focused on the innovation of
masonry infill is founded by the Ministry of the Economic Development and includes,
among several construction firms, the contribution of the Department of civil Engineer
at the University of Bologna and in particular of my research group. The research
project (still in progress) aims at innovating the entire industrial process, from the
product itself (by enhancing selected mechanical properties of the single components,
i.e. the clay bricks and the mortar), to the manufacturing plant, to the in-situ installation
techniques. The global objectives are ambitious and manifold: (i) reduction of the CO2
emissions during the industrial process; (ii) superior insulation properties; (iii) superior
seismic performances.

The first developments towards a seismic-resistant masonry infill
54
Two innovative technologies are to be used in order to accomplish the proposed
objectives: (i) the use of nanoparticles mixed in the clay mixture in order to improve
the mechanical properties of the clay bricks and to reduce the CO2 emissions during the
industrial process; (ii) the use of a special “additivated” mortar to enhance the seismic
behavior of masonry units. The development of each technology is in charge of a
specific partner (namely “Nanosurface” for the nanotechnologies and “Litokol” for the
additivated mortar).
The expected contributions of the University of Bologna are:
1. identification of the average mechanical properties of traditional masonry
infills;
2. identification of the seismic performances of traditional masonry infills;
3. identification of the target seismic performances for the innovative masonry
infill;
4. identification of the expected mechanical properties of the single components of
the masonry unit (clay bricks and mortar);
5. interpretation of the results of the experimental tests (compression tests, flexure
tests, triplets tests) conducted at the single component level on both clay bricks
and mortar;
6. interpretation of experimental test results on small masonry wall assemblies
(diagonal compression tests) and on full scale masonry infill walls (cyclic shear
tests) ;
7. design recommendations for the seismic design of the innovative masonry infill.
Points 1 and 2 have been already discussed in chapter 2 (section 2.2). In the present
chapter, first the seismic demand for a typical masonry infill of a typical reinforced
concrete frame building is estimated based on a simplified model, by varying the
seismic intensity and the number of stories. Then, an overview of the preliminary
results of the mechanical characterization of the innovative materials (clay bricks and
mortar) is presented. It has to be noted that a detailed description of the material
characterization is beyond the scope of present work, provided that the research project
is still in progress. Clearly, the final aim of the project is to provide design guidelines

The first developments towards a seismic-resistant masonry infill
55
for the innovative infill. On this regard, some design indications will be provided in the
next chapter.
4.2. THE EXPECTED PERFORMANCE FOR THE INNOVATIVE
MASONRY INFILL
Let us consider an N-story reinforce concrete regular frame structure, as the one
schematically displayed in Figure 4.1. It is assumed that the structure is regular in plan
and in elevation. It is also assumed that the building present full strong masonry infills
along the perimeter (the presence of opening is neglected). It is assumed,
conservatively, that the horizontal actions due to earthquake excitations are primarily
absorbed by the external masonry. Under those conservative assumptions, the total
shear forces at the base of each masonry wall along one side (namely side A and B
along the x and y direction. respectively) of the building, Vbase,A (or equivalently Vbase,B)
is simply equal to half of the whole base shear, Vbase:
, ,B 00.5 0.5 (T) 0.5base A base base E a E gV V V W S W F S a ( 4.1 )
Where:
WE=N∙Wstory building seismic weigth;
Wstory=w∙Lx∙Ly seismic story weight (w is the seismic weight per unit area, Lx and Ly are
the building dimensions);
Sa(T) spectral acceleration at period T;
F0 dynamic amplification factor;
S soil amplification coefficient;
ag peak ground acceleration on bedrock;
After simple manipulations of Eq.( 4.1 ), the shear per unit length at the base of each
external masonry infill can be estimated as follows:

The first developments towards a seismic-resistant masonry infill
56
, 0
,B 0
0.5
0.5
base A y g
base y g
v N L q a S F
v N L q a S F
( 4.2 )
By assuming a constant masonry infill thickness tinf, the shear stress at the base of the
external masonry infill can be estimated as follows:
, 0 inf
,B 0 inf
0.5 /
0.5 /
base A y g
base x g
N L q a S F t
N L q a S F t
( 4.3 )
For the sake of clearness, in order to provide reasonable values for the shear stress at
the base of the masonry infills, the following values of the quantities of Eq. ( 4.3 ) are
assumed:
Lx=Ly=20m;
ix=iy=5m;
q=1200 kg/m2
F0=2.5
S=1.3
tinf=45 cm
(a) (b)
Figure 4.1: plan view (a) and elevation (b) of atypical regular RC frame building.

The first developments towards a seismic-resistant masonry infill
57
Table 4.1 and Figure 4.2 gives the values of the shear stresses (Eq. ( 4.3 )) related to
four selected values of ag (0.05g, 0.15g, 0.25g and 0.35g) corresponding to low,
moderate, high and very high seismicity for the Italian regions, respectively, and
number of storey N varying from 2 to 8.
Table 4.1: Shear stress for selected values of ag and N from 2 to 10
N 2 3 4 5 6 7 8 9 10
ag=0.05g 0.09 0.13 0.17 0.22 0.26 0.30 0.35 0.39 0.43
ag=0.15g 0.26 0.39 0.52 0.65 0.78 0.91 1.04 1.17 1.30
ag=0.25g 0.43 0.65 0.87 1.08 1.30 1.52 1.73 1.95 2.17
ag=0.35g 0.61 0.91 1.21 1.52 1.82 2.12 2.43 2.73 3.03
Inspections of Table 4.1 and Figure 4.2 allows the following observations:
In low seismic regions (ag=0.05g), the shear stress remains below the average
shear strength of traditional infills (which can be estimated around 0.35 MPa,
see section 2.2) up to 8-story buildings;
In moderate seismic regions (ag=0.15g), the shear stress remains below the
average shear strength of traditional infills only up to 2-story buildings;
In high and very high seismic regions (ag=0.25-0.35g) the shear stress always
exceeds the average shear strength of traditional infills.
Based on the results here discussed, two objectives may be identified for the innovative
masonry:
Increase the shear strength of the masonry assembly. An optimum result could
be a shear strength of 1.0 MPa;
Provide a certain ductility for the masonry assembly. A good result could be a
ductility around 2.0
Figure 4.3 schematically compares the elastic (seismic) demand in term of shear
stresses with the ductility demand of two equivalents elastic-perfectly plastic systems,
with a shear strength of 0.35MPa (representative of a traditional infill) and a shear
strength of 1.0 MPa (representative of the innovative infill). Points A, B, D, E represent
the following situations:

The first developments towards a seismic-resistant masonry infill
58
Figure 4.2: Shear stress vs. story number for the different ag.
Point A: 8-story building in a low-seismicity region;
Point B: 7-story building in a moderate-seismicity region;
Point C: 5-story building in a very high-seismicity region;
Point D: 8-story building in a very high-seismicity region;
Figure 4.3: Comparison between the elastic demand and the inelastic response for two different
shear strength
The first developments towards a seismic-resistant masonry infill
59
It should be noted that, also for the innovative infill, a quite ductile capacities (larger
than 2) are necessary in order to satisfy the largest seismic demands (say points D and
E of Figure 4.3).
4.3. THE FIRST MATERIALS CHARACTERIZATION
During the first two years of the research project experimental material tests has been
performed in order to obtain the expected mechanical properties of the single materials
(clay bricks and mortar).
Experimental tests on clay bricks include compression tests on small cubes and three
point bending tests on small beams. Three different basic formulations (whose
chemical mixture has been developed by the research centre “Centro Ceramico”) were
tested to quantify the effect of: (i) sawdust which is added to increase the material
thermal performances (to the detriment of mechanical properties), (ii) alumina-based
nanoparticles.
A more complex experimental campaign has been conducted by the partner producing
the mortar (Litokol) in order to characterize the innovative mortar mixture. The main
purpose is to obtain a ductile mortar. The first candidate for the optimum mixture has
been obtained using Design of Experiments (DoE) techniques.
After the characterization of the individual materials, tests on small masonry
assemblies (diagonal shear tests) and on full scale infill walls (cyclic shear tests) are to
be conducted at the laboratory of Structural and Geotechnical Engineering (LISG) at
the University of Bologna.
4.3.1. Experimental characterization of the clay bricks
A first mechanical characterization of the clay bricks has been conducted in the
laboratory of the research centre Centro Ceramico. In detail three point bending tests
has been performed on small full clay bricks (with dimension of 14x14x60 mm, see
Figure 4.4) to measure the material tensile strength and Young’s modulus. In addition,

The first developments towards a seismic-resistant masonry infill
60
the material densities were measured. A total of 15 different formulations have been
analysed. They can be classified into three main groups:
Type A: Standard
Type B: Standard + sawdust
Type C: Standard + nanoparticles
A detailed description of each formulation is beyond the scope of the present thesis.
Results of the experimental tests are summarized in Table 4.2. As an illustrative
example the stress-deformation response of selected specimens is represented in Figure
4.5. The following observations can be made:
As expected, the addition of the sawdust (formulation type B) to the standard
mixture determines a strength reduction of around 20% and a reduction of the
Young’s modulus around 30%.
The inclusion of the nanoparticles (formulation type C) to the standard mixture
tends to increase both the strength and the Young’s modulus.
As expected, the strength appears quite correlated to the density (see the graph
of Figure 4.6)
Figure 4.4: Test set up of the bending tests.

The first developments towards a seismic-resistant masonry infill
61
Table 4.2: main results of the first experimental tests conducted in the laboratory of the “Centro
Ceramico”.
Code Description Mean ft
[MPa]
ft (std)
[MPa]
Mean E
[GPa]
E (std)
[MPa].
[g/cm3]
12/042/C10 A (old lime – essic) n.d.
12/042/C10 A (old lime – cook) 11.62 0.68 2.75 0.19 1.60
12/042/C13 B (old lime + 3% sawdust – dry) 6.35 - 1.37 -
12/042/C13 B (old lime + 3% sawdust – cook) 10.49 0.40 2.50 0.21 1.45
12/042/C12 B (old lime + 0.75% nano1 – dry) 6.95 0.40 1.80 0.21
12/042/C12 B (old lime + 0.75% nano1 – cook) 12.19 0.66 3.05 0.22 1.59
12/071/C10 A (new lime – dry) 6.95 0.52 1.62 0.30
12/071/C10 A (new lime – cook) 13.91 0.75 3.25 0.35 1.59
12/071/C11 A (new lime +5% sawdust – dry) 6.65 0.74 1.35 0.15
12/071/C11 A (new lime +5% sawdust – cook) 11.49 0.99 2.44 0.29 1.40
12/071/C12 B (new lime +3% nanoA – dry) 5.18 0.45 1.56 0.46
12/071/C12 B (new lime +3% nanoA – cook) 13.09 1.17 4.00 0.21 1.57
12/071/C13 C (new lime +3% nanoB – dry) 4.49 0.47 1.25 0.41
12/071/C13 C (new lime +3% nanoB – cook) 12.67 1.46 3.59 0.54 1.59
12/071/C14 C (new lime +3% nanoC – dry) 5.92 0.80 1.63 0.30
12/071/C14 C (new lime +3% nanoC – cook) 15.73 1.28 4.08 0.57 1.61
12/071/C15 C (new lime +3% nanoC – dry) 6.06 0.75 1.57 0.30
12/071/C15 C (new lime +3% nanoC – cook) 15.75 0.90 4.44 0.60 1.62
After the preliminary tests conducted by the Centro Ceramico further experimental
tests were carried out in the laboratory of Structural and Geotechnical Engineering
(LISG) at the University of Bologna. Experimental tests include compression tests on
small cubes (nominal dimensions of 3x3x3 cm) and three point bending tests on small
beams (nominal dimensions of 3x3x10 cm). The tests were performed on three selected
formulations:
Standard (with new lime)
Standard (with new lime) + 5% sawdust

The first developments towards a seismic-resistant masonry infill
62
Figure 4.5: stress-deformation response of selected specimens.
Figure 4.6: the correlation between strength and density.
Standard (with new lime) + 5% sawdust+ 6% nanoparticles
A total of 10 specimens of each formulation have been tested. Further details are given
in Appendix 2. The mean values and coefficient of variations (COV) of the
compression and tensile strength as obtained from the tests are collected in Table 4.3. It
can be noted that the presence of the sawdust determine a substantial reduction of both
the compression strength (around 30%) and the tensile strength (around 45%). The

The first developments towards a seismic-resistant masonry infill
63
addition of the nanoparticles (together with the sawdust) does not seem to provide
significant benefit to the main mechanical properties.
Table 4.3: Main properties as obtained from the experimental tests performed at the LISG lab.
Mixture Mean fc
[MPa]
COV fc
[MPa
Mean ft
[MPa]
COV ft
[MPa
1 58.6 0.20 26.8 0.11 0.26
2 38.1 0.13 14.2 0.12 0.78
3 34.4 0.11 15.2 0.11 1.30
4.3.2. Experimental characterization of the innovative mortar
A large experimental campaign has been conducted in the laboratory of “Litokol” in
order to provide the optimum mixture of the innovative mortar.
The optimal mixture of the innovative mortar has been designed by using the Design of
Experiments (DoE) techniques, which enables the designers to determine
simultaneously the individual and interactive effects of many factors that could affect
the output results in any design. DOE also provides a full insight of interaction between
design elements; therefore, it helps turn any standard design into a robust one. The
factors considered in the present study (and the related variability ranges) are:
Cement (variability 25 – 35%).
Sand (variability depending on the other factors).
Limestone. (constant at 5%).
Other additives (details of the individual mixtures will be divulgated at the end
of the research project).
A total of 25 different mixtures have been analysed. Experimental tests includes
compression tests (6 specimens for each mixtures) on small cubes (4x4x4 cm), three
point bending tests (3 specimens for each mixture) on small beams (4x4x16 cm),
bending tests on thin (3mm thickness) specimens and sliding-shear tests on small brick-
mortar assemblies. Photos of the different test set up are displayed in Figure 4.7. The

The first developments towards a seismic-resistant masonry infill
64
following quantities have been considered to obtain the “best candidate” of the
optimum mixture:
Compression strength
Tensile strength
Sliding shear strength
Ductility ratio (calculated by evaluating the equivalent bi-linear response from
the experimental tests on the thin specimens)
A detailed description of the results of the experimental tests is beyond the scope of the
present thesis and will be presented at the end of the research program.
The most promising prototype formulations exhibit the following (average) properties:
Compression strength around 7-8 MPa
Tensile strength around 3-4 MPa
Shear strength around 1.2-1.7 Mpa
Ductility ratios around 1.5-2.5
(a) (b) (c)
Figure 4.7: tests set up: (a) compression test (b) bending test on thin specimens; (c) sliding shear
test.

The first developments towards a seismic-resistant masonry infill
65
Figure 4.8 displays the force-deformation response of selected specimens as obtained
from the bending tests on the thin specimens. In general an increase of ductility is
coincident with a decrease in strength, as showed by the graph of Figure 4.8.
The results obtained from the first experimental tests seems to be promising and in line
with the objectives of the project. Actually a second experimental campaign is under
development in order to further refine the preliminary formulation.
4.4. CONCLUSIONS
In this chapter the first results of the research project “Italici” focused on the
development of innovative (seismic resistant) infills have been presented . The research
project involves the practical contributions of various partners from the industry world
and the scientific contribution of the Department of Civil Engineer of the University of
Bologna. In this context the main contribution of the Department of Civil Engineer of
the University of Bologna is to provide the necessary scientific knowledge to direct and
coordinate the development of the innovative materials (clay bricks with alumina-based
nanoparticles and additivated mortar) as well as to carry out part of the experimental
tests.
Figure 4.8: force-displacement response of selected specimens as obtained from the bending tests
on the thin specimens.

The first developments towards a seismic-resistant masonry infill
66
The first step was related to the identification of seismic performances for the
innovative infills. A good target for the infill shear strength has been identified around
1.0 MPa, while a good ductility could be around 2.0. Then a large experimental
campaign has been scheduled. At the present moment, only the first part of the
experimental campaign has been completed. The main results can be summarized as
follows:
The presence of the sawdust in the mixture of the clay bricks (necessary to
satisfy the thermal requirements) provides a consistent reduction of the
mechanical properties (-30% compressive strength, -40% tensile strength).
However, due to the high intrinsic mechanical properties of the base mixture
(around 60MPa compressive strength and 20 MPa tensile strength), those
detrimental effect could not affect (in a significant amount) the seismic
response of the masonry assemblies provided that the overall response could be
mainly governed by the mortar properties.
The inclusion of the alumina-based nanoparticles in the mixture of the clay
bricks has a limited influence on the main mechanical properties (it seems to
slightly increase the tensile strength). Additional tests are necessary to further
understand if the addition of alumina-based nanoparticles should be considered
in the final mixture of the clay bricks.
A first attempt for the development of the optimum mixture for the innovative
mortar has been conducted using DoE techniques. The results of first tests
allowed to identify some promising prototype formulations able to accomplish
with the proposed objectives. The obtained shear strength is around 1.2-1.7
Mpa, while the ductility ratios are around 1.5-2.5. Those values could be an
indication of the masonry shear strength.
The results of the next experimental tests which will be carried out on small
masonry assemblies and on full scale masonry walls will provide more precise
values of the strength and indications of the ultimate drifts to be adopted for the
seismic design.

The seismic design of the seismic-resistant masonry infills
67
5. The seismic design of the seismic-resistant
masonry infill
5.1. INTRODUCTION
The actual Italian building code (NTC 08) does not allow to consider unreinforced
masonry infills as primary structural elements, i.e. structural elements designed in order
to sustain lateral loads. However their contribution in term of mass has to be
considered. They are treated as secondary structural elements, i.e. their stiffness and
strength is ignored in the seismic analysis of the structure, whilst they have to be
designed in order to have deformation capacities compatible with the seismic demand.
In order to accomplish this requirement the primary structural elements (typically
columns, beams and RC walls) are designed in order to satisfy precise interstorey drift
limits (in the case of RC frame with unreinforced masonry infill the prescribed drift
limit is equal to 0.5% of the story height). In light of above, no specific analytical
models are recommended for unreinforced masonry infills and strength and
deformation capacity are not provided. The effects of the seismic loads on the infills
can be evaluated by applying a lateral force equal to the weight times the spectral
acceleration which accounts, in a simplified way, for the dynamic amplification along
the building height. A limited ductility can be accounted through a behavior factor qa
which is set equal to 2.0. The horizontal action applied at the top of the wall is used to
check the out-of-plane capacity.
Nonetheless, the detrimental effects due to the presence of the infills have to be
considered. In the case of an in-plan asymmetric distribution of infill the accidental
eccentricity has to be doubled. In the case of irregular distribution infills in elevation,
the design actions for the vertical structural elements (typically columns and walls) in a
weak story have to be amplified by a factor equal to 1.4.

The seismic design of the seismic-resistant masonry infills
68
In this chapter, which concludes the part A of the thesis, considerations for the seismic
design of the innovative unreinforced masonry infills are provided, based on the first
results presented in the previous chapter.
5.2. ON THE SEISMIC DESIGN OF THE INNOVATIVE MASONRY
INFILL
In this section simple design consideration for the seismic design of the innovative
unreinforced masonry infill presented in the previous are provided. Clearly, as stated in
chapter 4, the study of the innovative infill (and specifically its mechanical
characterization) is still in progress. Nonetheless, it seems important to conclude the
first part of the thesis with some (although preliminary) design recommendations.
5.2.1. On the modelling of the innovative masonry infills
In chapter 3 a detailed review of the modelling approaches which are actually available
for the seismic analyses of frame structures with masonry infills has been provided. It
has been noted that the two fundamental approaches (i.e. macromodels based on
equivalent struts approaches, or micromodels based on the continuum mechanics
approach) are characterized by a substantially different level of sophistication and
therefore appears suitable for different uses. Micromodels may allow for a detailed
representation of the stress-strain response of the infills, and can represent the complex
damage mechanisms and interactions between walls and surrounding frames. On the
other hand, their correct use requires notable expertise of the user and computational
effort. Moreover only few commercial software actually includes modulus which are
specifically dedicated to masonry infills, and therefore the use of micromodels appears
restricted mainly to research purposes. The use of simple equivalent nonlinear strut
models may allow to reasonably represent the stiffness, strength and ultimate
deformation of unreinforced masonry infills and therefore its use may appear actually
more appropriate for professional engineers.
In chapter 3 the use of the equivalent nolinear strut model together with an appropriate
model to account for the shear failure of reinforced concrete columns, has been

The seismic design of the seismic-resistant masonry infills
69
satisfactory applied to reproduce the observed mechanisms of collapse of a real RC
frame building which collapsed after the 2009 l’Aquila Earthquake. The analyses
showed that the capacity models suggested by ASCE41-06 for the evaluation of the
strength and ultimate deformation of existing unreinforced masonry infills seems to
provide reasonable results.
From all the above considerations it appears that, at the moment, the nonlinear
equivalent strut model could be suggested for design purposes. The equivalent strut is
characterized by the same thickness of the infill, tinf, and by a width a equal to
(Maistone 1971):
0.4
inf
0.3
inf
0.25
inf
inf
0.175 for 4 5
0.16 for 5
sin 2
4
h col h
h col h
mh
c col
a h D
a h D
E t
E I h
( 5.1 )
The elastic modulus of the equivalent strut Estrut can be assumed equal to 3Em with Em
the masonry elastic modulus.
5.1.1. The strength of the innovative infill
Based on the results of the first experimental tests the expected masonry shear strength
fv can be reasonably estimated around 1.0 MPa. By assuming a sliding shear
mechanism of failure the infill shear strength can be eastimated with the following
formula:
inf n vV A f ( 5.2 )
Where An is the net area of the infill cross section.

The seismic design of the seismic-resistant masonry infills
70
5.3. CONCLUSIONS
In the present chapter code-like design recommendations for the seismic design of the
innovative infills studied in the previous chapter are provided. They can be summarized
as follows:
The use of the equivalent nonlinear strut model appears suitable for the design
of the innovative infills.
The strut width can be evaluated according to the well-known Mainstone
approach. A strut elastic modulus around 3 times the masonry elastic modulus
is suggested.
The expected infill strength can be evaluated assuming a sliding shear
mechanism of failure and a shear stress of 1 MPa (as the result of the first
experimental tests).
Estimations of the ultimate drifts could be obtained from the next experimental
tests on the full-scale infill walls.
PART B: Reinforced Concrete Sandwich
Panels
Part B is focused on a specific reinforced concrete sandwich panel system and is
composed of four chapters (from chapter 6 to chapter 9). Its main objective is to assess
the seismic performances of a specific reinforced concrete sandwich squat panel system
with the purpose of introducing design procedure for building structures composed of
reinforced concrete sandwich squat walls.


The behavior of reinforced concrete sandwich wall structures: experimental tests
73
6. The behavior of squat reinforced concrete
sandwich wall structures: experimental tests
6.1. INTRODUCTION
The seismic behavior of slender RC shear walls has been the objective of extensive
researches since the 1960s. Early studies by Beck 1962 and Rosman 1968 identified the
fundamental features of the behavior of RC shear walls and coupled walls and provided
simplified analysis methods. Their works prepared the ground for all the further
studies. Paulay and Priestely in their book (Paulay and Priestely 1992) dedicated a
chapter to the design of RC slender walls. The chapter collects the fundamental results
of previous studies and provides detailed design specifications for the design of ductile
slender shear walls and coupled walls.
Less research effort has been devoted to the study of the seismic behavior of squat wall,
whose response under lateral loads is characterised by larger uncertainty due to the
complex interaction between shear and flexural behavior as the result of their
geometrical configuration (small aspect ratios). Experimental tests of squat shear walls
conducted by Hidalgo et al. 2002 indicated that the aspect ratio significantly affects the
deformation capacity and the strength deterioration due to loading reversal after the
peak strength is reached. Comparison of wall response to code-based predictive
equations showed that these equations overpredict the peak shear strength of these
squat rectangular walls by factors as large as 2 (Whyte and Stojadinovic 2013), thus
indicating the need of improved code provisions for the design of squat RC walls.
Indications on the fundamental mechanisms of shear resistance in squat wall are given
by Paulay and Priestely 1992. First of all, because of relative dimensions, the
mechanisms of shear resistance appropriate to RC beams and columns (and often
extended to slender shear walls) are not generally applicable to squat RC walls. In the

The behavior of reinforced concrete sandwich wall structures: experimental tests
74
cases of insufficient horizontal reinforcement a corner-to-corner tension failure plane
may develop. A tie beam at the top of the wall may prevent from this mechanism of
failure. If adequate horizontal reinforcement has been provided, average shear stress
may become large and lead to concrete crushing under diagonal compression, before
the wall reach its flexural strength. This mechanism is quite common in walls with
flanged sections which may have large flexural strength. Diagonal compression failure
is characterized by a significant loss of strength and should be avoided, by limiting the
values of the maximum shear stress at the flexural strength. In the case of maximum
shear stress are limited and an adequate horizontal reinforcement is provided, a
mechanism of sliding shear at the base due to progressive yielding of the vertical
reinforcement at the base, may develop. Such sliding displacements are responsible of a
significant stiffness reduction. Tests of squat walls showed that excessive sliding shear
has severe detrimental effects (strength and stiffness deterioration) and the use of
diagonal reinforcement crossing the sliding plane may consistently reduce the
phenomenon. Also the use of boundary elements may significantly increase the
performance of RC squat walls as demonstrated by the experimental investigation
conducted by Lowes et al. 2011.
Precast sandwich panels (PSPs) are composed of two concrete wythes separated by a
layer of insulation. Once in place, the sandwich wall panels provide the dual function
of load carrying capacity and insulation. PSPs may be used solely for cladding (i.e.
non-structural components), or they may act as bearing walls, or shear walls. PSPs are
commonly used as exterior and interior walls for many types of structures, from low
rise residential buildings (see http://www.nidyon.net) to high rise complex buildings
(see http://www.highconcrete.com). These panels may be connected to any type of
structural frame, e.g., structural steel, reinforced concrete, pre-engineered metal and
precast/prestressed concrete (PCI, 1997).
The panels are typically precast at a manufacturing plant, trucked to the construction
site and erected by cranes. Sometimes only the formworks are precast at manufacturing
plants, and the structural concrete is cast in situ after that formworks and additional
reinforcements are positioned. Panels generally span vertically between foundations

The behavior of reinforced concrete sandwich wall structures: experimental tests
75
and floors or roofs to provide the permanent wall system, but may also span
horizontally between columns. Regarding to design, detailing, manufacturing,
handling, shipping and erection the sandwich panels are similar to other precast
concrete members; nonetheless, because of the presence of an intermediate layer of
insulation, they do exhibit some features and distinctive behaviors (PCI, 1997).
The interest in sandwich panels has increased in the past few years because they are
characterized by desirable characteristics of durability, economical convenience, fire
resistance, vertical and horizontal load bearing capacity as well as excellent insulation
properties providing superior energy performance as compared to many other walls
(Losch 2005). However, a limited number of research works are available in the
scientific literature partially due to the need of full scale testing (characterized by high
costs) and partially due to the hesitancy of the construction firms to shear their know-
how with the competitors. Holmberg and Pelm 1986 investigated the load bearing
capacity of sandwich panel structure under static loadings. Einea et al. 1994 proposed
the use of plastic materials as shear connector to increasing the insulation of properties
of the panels. The out-of-plane response (out of plane shear and flexure) of sandwich
panels has been investigated by Kabir 2005 through of static tests and numerical
investigations. Results of an experimental investigation on the ultimate strength
behavior of precast concrete sandwich panels with steel truss shear connectors are
reported in Benayoune et al. 2006, 2007, 2008. Recently, Rezaifar et al. 2008
investigated the dynamic response of a full-scale single storey building composed of
precast sandwich panels through shaking-table tests.
A large research program aimed at studying the structural behavior of building
structures composed of precast sandwich panels produced by an Italian firm (Nydion
Costruzioni) has been developed at the University of Bologna through a number of
experimental tests including:
Materials tests.
Uniaxial compression tests (with and without eccentricity).
Diagonal compression tests.
Slip tests (in order to evaluate the capacity of the transversal connections).

The behavior of reinforced concrete sandwich wall structures: experimental tests
76
Out of plane tests.
Connections tests (orthogonal walls and foundations).
In plane reversed cyclic tests on single panels (with and without opening).
In plane reversed cyclic test on a full scale H shaped structure.
Dynamic tests with vibrodina.
Shacking table tests on a full scale three stories building.
The large amount of acquired data allowed to appropriately characterize the in-plane
and out-of plane behavior of the structural system aimed at providing engineering
design procedures consistent with the current code provisions (EC2 and EC8). A
detailed description of all the experimental results may be found in a Ph.D thesis (Ricci
2012), while a summary of the results of the in plane reversed cyclic tests on single
panels (with and without opening) is available in Ricci et al. 2013.
A full description of the experimental tests is beyond the scope of the present work.
Therefore, only the information necessary for a better understanding of the
interpretation of the test results (representing the object of the next two chapters) are
recalled.
6.2. SUMMARY OF THE EXPERIMENTAL TESTS
Intending to assess the seismic performance of PSPs wall assemblies, the University of
Bologna and the EUCENTRE laboratory of Pavia (Italy) jointly carried out an
experimental campaign. A total of six full-scale tests were performed: the first five on
planar wall specimens (namely PW1, PW2, PW3, PW4 and PW5); the last one on a
two-story H-shaped structure (namely HSW). Each specimen underwent cyclic
horizontal displacements with load reversals and a constant vertical load. In order to
investigate their influence, different vertical loads were applied to different specimens.
This paragraph contains a brief summary of the experimental results. Additional details
are available in Ricci et al. 2013.

The behavior of reinforced concrete sandwich wall structures: experimental tests
77
6.2.1. Geometrical and mechanical properties of the specimens
The following specimens were tested: three planar walls with no openings (PW1, PW2
and PW3, also referred to as type A), two planar walls with a central square opening
(PW4 and PW5, also referred to as type B), a two story H-shaped wall (HSW). The
first five specimens are composed by a single square PSP each while the H-shaped wall
is composed by six square PSPs and two 0.2 m thick reinforced concrete slabs. All the
PSP have side length 3.0 m and the openings have side length 1.0 m.
The basic PSP panel is 18 cm thick with a central 10 cm expanded polystyrene
corrugated layer and two external 4 cm RC layers. The representative drawings of each
wall assembly are given in Figure 6.1 and Figure 6.2. The basic reinforcement is a ϕ
2.5 mm smooth mesh grid spaced 50 mm resulting in a reinforcement ratio equal to
0.245%. Additional horizontal and vertical bars (ϕ 12 mm) were located at the edges
and around the openings of the planar walls in order to prevent local failures. The
connection between the two RC layers is realized through ϕ 3 mm transversal
connectors spaced 30 cm. The connections between the orthogonal walls of the HSW
specimen were realized with 2 ϕ 12 mm vertical bars and ϕ 6mm horizontal bars spaced
30 cm. The connections between the walls and the foundations are realized through ϕ 8
mm anchor rods. A summary of the main characteristics of each specimen is presented
in
.
Table 6.1: Summary of the specimen properties
ID Wall type Dimensions
[m] x [m]
Opening
dimensions
[m] x [m]
Self-weight
[kN]
Vertical
load
[kN]
Vertical
load ratio
PW1 plane 3.0 x 3.0 - 19.9 50 0.87%
PW2 plane 3.0 x 3.0 - 19.9 100 1.73%
PW3 plane 3.0 x 3.0 - 19.9 250 4.35%
PW4 plane 3.0 x 3.0 1.0 x 1.0 17.9 50 0.87%
PW5 plane 3.0 x 3.0 1.0 x 1.0 17.9 100 1.73%
HSW H-shaped 3.0 x 6.0 - 93.5 200 1.60%

The behavior of reinforced concrete sandwich wall structures: experimental tests
78
(a) (b)
Figure 6.1: (a) Reinforcement layout for the full planar wall; (b) Reinforcement layout for the
planar wall with the central opening
Figure 6.2: Reinforcement layout for the HSW specimen.
Nominal concrete strength was 30 MPa, while the steel yield strength was 450 MPa.
The vertical load ratio is defined as N/(Ac fc), where N is the applied vertical load, Ac is
the concrete gross section, fc is the concrete compressive strength.
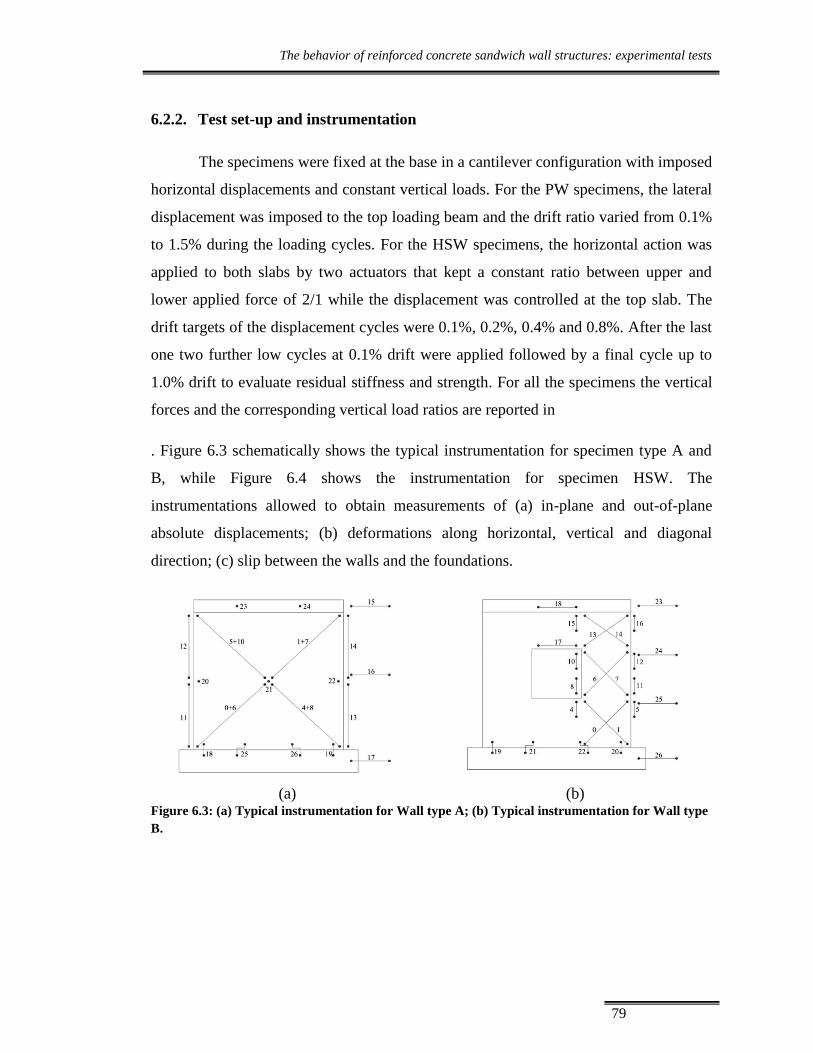
The behavior of reinforced concrete sandwich wall structures: experimental tests
79
6.2.2. Test set-up and instrumentation
The specimens were fixed at the base in a cantilever configuration with imposed
horizontal displacements and constant vertical loads. For the PW specimens, the lateral
displacement was imposed to the top loading beam and the drift ratio varied from 0.1%
to 1.5% during the loading cycles. For the HSW specimens, the horizontal action was
applied to both slabs by two actuators that kept a constant ratio between upper and
lower applied force of 2/1 while the displacement was controlled at the top slab. The
drift targets of the displacement cycles were 0.1%, 0.2%, 0.4% and 0.8%. After the last
one two further low cycles at 0.1% drift were applied followed by a final cycle up to
1.0% drift to evaluate residual stiffness and strength. For all the specimens the vertical
forces and the corresponding vertical load ratios are reported in
. Figure 6.3 schematically shows the typical instrumentation for specimen type A and
B, while Figure 6.4 shows the instrumentation for specimen HSW. The
instrumentations allowed to obtain measurements of (a) in-plane and out-of-plane
absolute displacements; (b) deformations along horizontal, vertical and diagonal
direction; (c) slip between the walls and the foundations.
(a) (b) Figure 6.3: (a) Typical instrumentation for Wall type A; (b) Typical instrumentation for Wall type
B.
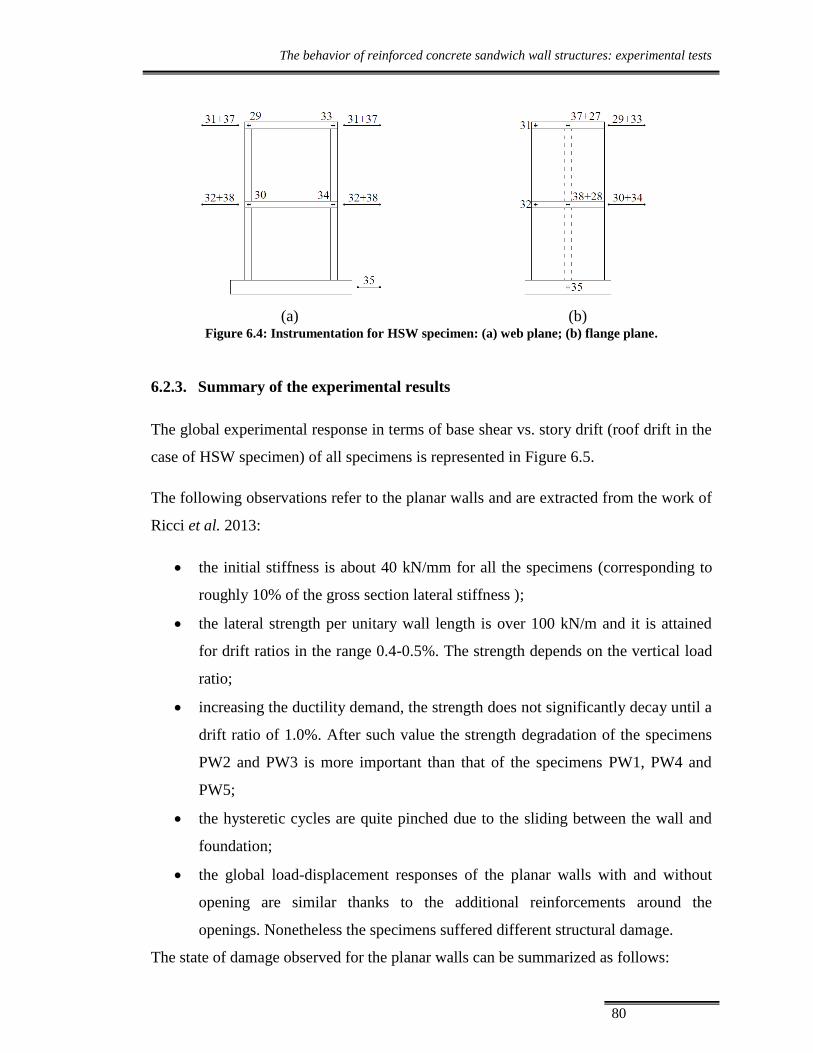
The behavior of reinforced concrete sandwich wall structures: experimental tests
80
(a) (b) Figure 6.4: Instrumentation for HSW specimen: (a) web plane; (b) flange plane.
6.2.3. Summary of the experimental results
The global experimental response in terms of base shear vs. story drift (roof drift in the
case of HSW specimen) of all specimens is represented in Figure 6.5.
The following observations refer to the planar walls and are extracted from the work of
Ricci et al. 2013:
the initial stiffness is about 40 kN/mm for all the specimens (corresponding to
roughly 10% of the gross section lateral stiffness );
the lateral strength per unitary wall length is over 100 kN/m and it is attained
for drift ratios in the range 0.4-0.5%. The strength depends on the vertical load
ratio;
increasing the ductility demand, the strength does not significantly decay until a
drift ratio of 1.0%. After such value the strength degradation of the specimens
PW2 and PW3 is more important than that of the specimens PW1, PW4 and
PW5;
the hysteretic cycles are quite pinched due to the sliding between the wall and
foundation;
the global load-displacement responses of the planar walls with and without
opening are similar thanks to the additional reinforcements around the
openings. Nonetheless the specimens suffered different structural damage.
The state of damage observed for the planar walls can be summarized as follows:

The behavior of reinforced concrete sandwich wall structures: experimental tests
81
flexural horizontal cracks appear at the base of the specimens for a drift ratio of
about 0.1%;
shear diagonal cracks progress on the web for drift ratios around 0.4%;
vertical cracks, long 10 cm and spaced about 50 cm, start from the base of the
wall for drift ratios in the range 0.6%-0.7%. They indicate the deterioration of
bond between the anchor bars at the base and the concrete;
concrete cover flacks from the surface and crushes at the bottom corners
starting at about 0.8% drift;
after the debonding of the anchor bars a significant base sliding takes place
while the crack pattern of the rest of the wall do not significantly change;
as expected, in wall type B the shear cracks are concentred around the central
opening. Nonetheless, due to the presence of adequate additional reinforcement
around the openings, the progression of cracks for wall type A and B is quite
similar.
The following observations come from the HSW specimen:
the peak lateral strength is approximately equal to 500 kN;
a strength drop happens at about 0.5% drift;
a residual strength of about 80% of the peak strength is maintained up to 1.0%
drift;
the global load-displacement response of the HSW specimen is less pinched
than that of the planar walls.
The damage state of the HSW can be summarized as follows:
diagonal shear cracks on the web and horizontal flexural cracks at the bottom of
the flanges appear at about 0.1% drift and progressively widen;
the spalling of the concrete cover happens at about 0.8 % on the corner between
web and flanges;
no significant slip between the wall and the foundation takes place. The reasons
are the less spacing of the anchor rods (30 cm for HSW versus 50 cm for the
PW) and the additional strength offered by the flanges.

The behavior of reinforced concrete sandwich wall structures: experimental tests
82
Figure 6.6 and Figure 6.7 provide the crack patterns of some PW specimen and of the
HSW specimen, respectively.
(a) (b)
(c) (d)
(e) (f)
Figure 6.5: Base shear vs. story drift experimental response: (a) specimen PW1; (b) specimen
PW2; (c) specimen PW3; (d) specimen PW4; (e) specimen PW5; (f) specimen HSW.

The behavior of reinforced concrete sandwich wall structures: experimental tests
83
(a) (b)
(c) (d)
Figure 6.6: Cracking patterns at the end of the test: (a) specimen PW1; (b) specimen PW4; (c)
concrete spalling at the base, for specimen PW3; (d) concrete corner crushing for specimen PW2.
(a) (b)
Figure 6.7: (a) Cracking pattern at the end of the test for HSW specimen; (b) detail of concrete
spalling at the corner of the web panel for HSW specimen.

The behavior of reinforced concrete sandwich wall structures: experimental tests
84
6.3. CONCLUSIONS
In this chapter the results of experimental cyclic tests conducted on RC sandwich
planar walls and on an H-shaped wall have been briefly summarized with the purpose
of provide information for their interpretation. It has been showed that the tested walls
are characterized by a ductile seismic behavior which can be compared to that of
conventional RC shear wall with similar geometry and reinforcements, and designed
according to current seismic design specifications (Hidalgo et al. 2002). The interested
reader may find details in Ricci et al. 2013.

Modelling of reinforced concrete sandwich walls according to compression field theories
85
7. Modelling reinforced concrete sandwich walls
according to compression field theories
7.1. INTRODUCTION
The two current most noteworthy theories for conventional reinforced concrete
members subjected to shear and torsion (i.e. the Modified Compression field Theory,
MCFT, proposed by Vecchio and Collins at the University of Toronto (Vecchio and
Collins 1986) and the rotating-Angle Softened-Truss Model, RA-STM, developed by
Hsu and his co-workers at the University of Huston, (Belarbi and Hsu 1994)) are both
grounded on the continuum mechanics approach. The external forces are in equilibrium
with the internal forces; average strains are in geometric compatibility with the
displacements and average (or “smeared”) stresses are related to average (or
“smeared”) strains via appropriate constitutive equations. Refinements to the MCFT
have been recently proposed by Gil-Martin et al. 2009 leading to the so-called Refined
Compression Field Theory, RCFT. These refinements deals with an introduction of a
smeared constitutive model for the reinforcement embedded in the concrete, which
account for the tension stiffening in the concrete. Those refinements allows to
overcame the local checks of the shear stresses at cracks locations which are required
by the MCFT and at the same time allows to more accurately reproduce the
experimental response of conventional RC panels, especially in the regions close to the
peak strength (Gil-Martin et al. 2009). Nonetheless, the calibration of additional
parameters is necessary.
In this chapter, the fundamentals of the conventional shear theories for RC members
(MCFT and RA-STM) are briefly recalled. The theories are applied in order to predict
the force-deformation response of the RC sandwich panels described in the previous
chapter. The predictions of the theories are compared with the envelope response as
obtained from the pseudo-static tests. Then, the RCFT is used to obtain the force-
deformation response of the panel. Appropriate constitutive equations based on the
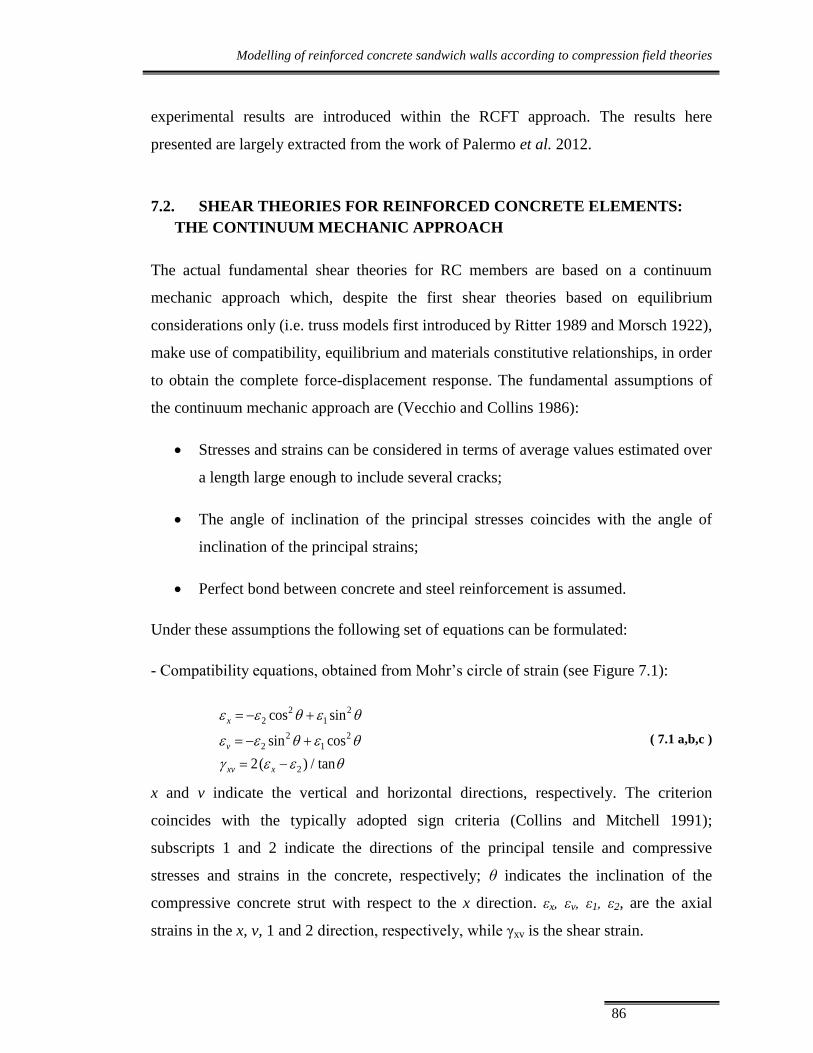
Modelling of reinforced concrete sandwich walls according to compression field theories
86
experimental results are introduced within the RCFT approach. The results here
presented are largely extracted from the work of Palermo et al. 2012.
7.2. SHEAR THEORIES FOR REINFORCED CONCRETE ELEMENTS:
THE CONTINUUM MECHANIC APPROACH
The actual fundamental shear theories for RC members are based on a continuum
mechanic approach which, despite the first shear theories based on equilibrium
considerations only (i.e. truss models first introduced by Ritter 1989 and Morsch 1922),
make use of compatibility, equilibrium and materials constitutive relationships, in order
to obtain the complete force-displacement response. The fundamental assumptions of
the continuum mechanic approach are (Vecchio and Collins 1986):
Stresses and strains can be considered in terms of average values estimated over
a length large enough to include several cracks;
The angle of inclination of the principal stresses coincides with the angle of
inclination of the principal strains;
Perfect bond between concrete and steel reinforcement is assumed.
Under these assumptions the following set of equations can be formulated:
- Compatibility equations, obtained from Mohr’s circle of strain (see Figure 7.1):
2 22 1
2 22 1
2
cos sin
sin cos
2( ) / tan
x
v
xv x
( 7.1 a,b,c )
x and v indicate the vertical and horizontal directions, respectively. The criterion
coincides with the typically adopted sign criteria (Collins and Mitchell 1991);
subscripts 1 and 2 indicate the directions of the principal tensile and compressive
stresses and strains in the concrete, respectively; θ indicates the inclination of the
compressive concrete strut with respect to the x direction. εx, εv, ε1, ε2, are the axial
strains in the x, v, 1 and 2 direction, respectively, while γxv is the shear strain.
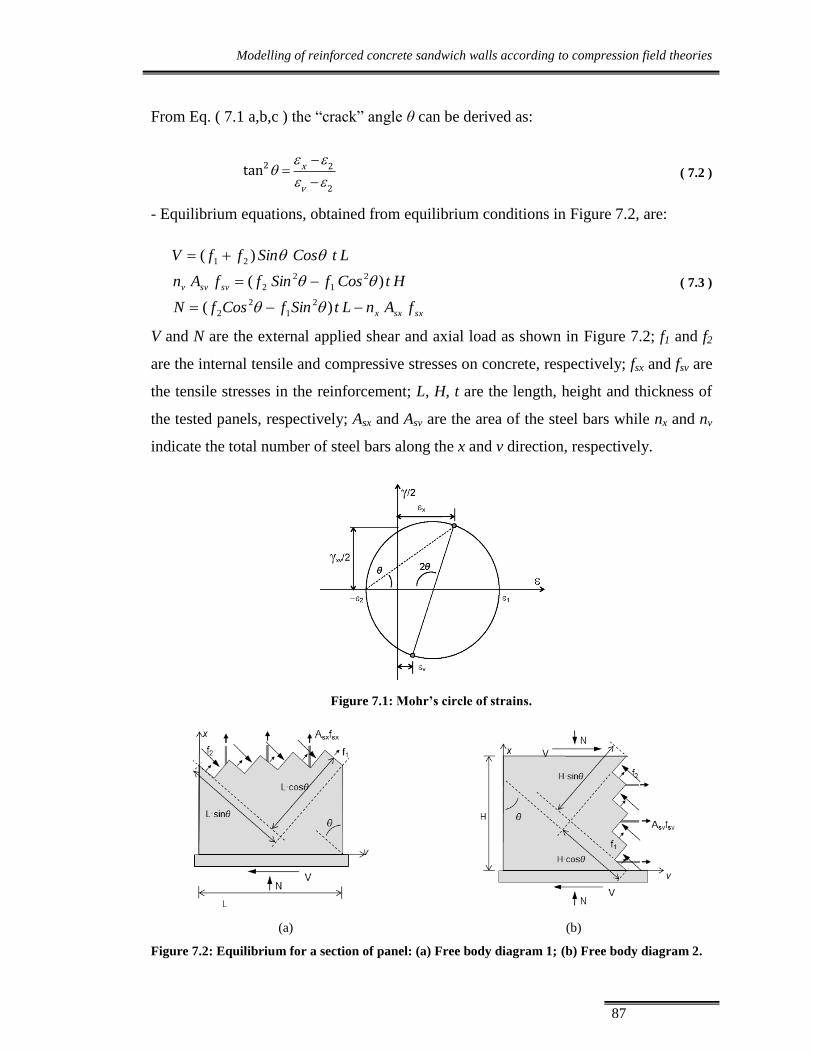
Modelling of reinforced concrete sandwich walls according to compression field theories
87
From Eq. ( 7.1 a,b,c ) the “crack” angle θ can be derived as:
2 2
2
tan x
v
( 7.2 )
- Equilibrium equations, obtained from equilibrium conditions in Figure 7.2, are:
sxsxx
svsvv
fAnLtSinfCosfN
HtCosfSinffAn
LtCosSinffV
)(
)(
)(
2
1
2
2
2
1
2
2
21
( 7.3 )
V and N are the external applied shear and axial load as shown in Figure 7.2; f1 and f2
are the internal tensile and compressive stresses on concrete, respectively; fsx and fsv are
the tensile stresses in the reinforcement; L, H, t are the length, height and thickness of
the tested panels, respectively; Asx and Asv are the area of the steel bars while nx and nv
indicate the total number of steel bars along the x and v direction, respectively.
Figure 7.1: Mohr’s circle of strains.
(a) (b)
Figure 7.2: Equilibrium for a section of panel: (a) Free body diagram 1; (b) Free body diagram 2.

Modelling of reinforced concrete sandwich walls according to compression field theories
88
The fundamental assumptions adopted by the MCFT and RA-STM theories are the
same. The discrepancies observed in the predictions to the test responses are due to the
different constitutive laws used to characterize the stress-strain materials behavior. The
constitutive laws for softened concrete in compression and concrete in tension (i.e.
tension stiffening) for MCFT and RA-STM can be found in (ASCE-ACI 1998). In both
theories, laws were obtained from experimental tests on reinforced concrete panels
subjected to in-plane shear. The main difference between the two aforementioned
approaches, that yields different responses, lies on the constitutive law adopted for the
reinforcement bars: while MCFT assumes the constitutive law of a bare bar, RA-STM
theory introduces an average stress-strain curve for the mild steel bars embedded in
concrete.
7.3. MCFT AND RA-STM PREDICTIONS OF THE PANELS’ RESPONSE.
Figures 13a, b and c show the prediction of shear-deformation response of panels PW1,
PW2 and PW3 as given by the MCFT and the RA-STM. MCFT predictions were
obtained using the software Membrane 2000, RA-STM predictions were obtained by
direct implementation of the original formulation (Belarbi and Hsu 1994). It is to be
noted that during the tests panels behaves as deep cantilever. Therefore, in order to
compute the experimental shear strain, the imposed horizontal displacement has been
depurated from the flexural component assuming a cantilever schematization with the
inertial properties of the cracked section. From these schematizations, the flexural
deformation results to be from 10 to 15% of the total deformation.
Inspection of the graphs clearly shows that, while both theories are able to accurately
predict the shear response at high level of drift (i.e. for shear corresponding to an
ultimate state), the predictions at lower drifts are much higher than the experimental
ones. The reason for this large overestimation lies in the post-cracking concrete
contribution due to the tension stiffening, that from test evidence appear to be
considerably less than that predicted by tension stiffening models (Bentz 2005).

Modelling of reinforced concrete sandwich walls according to compression field theories
89
(a)
(b)
(c)
Figure 7.3: Comparison between the MCFT, RA-STM and test data. (a) test on PW1 (N=50 kN);
(b) test on PW2 (N=100 kN); (c) test on PW3 (N=250 kN).

Modelling of reinforced concrete sandwich walls according to compression field theories
90
7.4. ADAPTING THE REFINED COMPRESSION FIELD THEORY FOR
THIN RC SANDWICH PANELS
The previous section showed that both MCFT and RA-STM are not able to accurately
predict the experimental observed shear-deformation response of the tested thin
shotcrete panels due to an overestimation of the so-called “concrete contribution”
(depending on the tension stiffening model) at low drifts. Over the years many different
concrete tension stiffening curves have been proposed (Bentz 2005) in order to account
for the average post-cracking concrete tensile strength, physically related to the bond–
slip actions that occur along the anchored reinforcement.
Because of the current adopted models for tension stiffening, they are not explicitly
formulated in terms of bond characteristics (Martin-Perez and Pantazopoulou 2001)
and their predictions are strongly dependent on the specific experimental data used to
calibrate the model, that, in turn is strongly affected by the specific characteristics of
the specimens (e.g. bar typology -i.e. smooth or deformed, and size-, reinforcement
ratio and concrete aggregate size). Figure 7.4 compares some available models for
tension stiffening showing relevant post-cracking tensile strength differences. In light
of the geometrical and mechanical characteristics of the tested panels, it clearly appears
that the values of the parameters influencing the post-cracking concrete stress behavior
of the tested panels are quite far from the panels tested so far. More specifically, the
main differences showed by the investigated panel are: (i) higher ratio between the
panel dimension (3x3 m) and little panel thickness (two layers of 4 cm of concrete), (ii)
smaller bar diameter (i.e. 2.5 mm), (iii) smaller reinforcement ratio (i.e. 0.245 %); (iv)
use of sprayed concrete with small aggregate size. Moreover, it has been observed from
the tests that the applied axial load contributed to a sudden degradation of the concrete
strength in tension, in such a way that reminds us of the bursting effect in concrete
under punctual loading.
For all these reasons, the adoption of a proper calibrated relationship for concrete in
tension appears necessary. Clearly, based on the influence that tension stiffening
provides to the reinforced steel model (Gil-Martin et al. 2009), a new constitutive
equation for the steel bars embedded in concrete is also required.

Modelling of reinforced concrete sandwich walls according to compression field theories
91
Figure 7.4: Examples of tension-stiffening equations available in the scientific literature.
7.4.1. Proposed tension stiffening model for shotcrete and wire mesh embedded
in the shotcrete
The assumed stress-strain relationship of concrete in compression is the one proposed
by Collins and Mitchell 1991:
2
2 22 2 2max
1 1
2max
1
( ) 2
0.8 170
c c
cmcm
f f
fwhere f f
( 7.4 )
εc1 is the strain at the maximum value of stress, given by EC2 and fcm is the mean value
of the concrete strength.
An average tension stiffening model, based on the conceptual approach by Bentz 2005
and calibrated in order to fit the experimental data, is here proposed:
1 1
1 1 1
1
( )
120
c cr
crcr
E for
ff for
M
( 7.5 )
Where ,c efA
M
is a parameter depending on the bar diameter .

Modelling of reinforced concrete sandwich walls according to compression field theories
92
fcr is the mean concrete tensile strength estimated according to Eurocode 2 (
3/23.0 ckcr ff , where fck is the characteristic strength of concrete); εcr is the concrete
strain at fcr; M is the bond parameter in mm, introduced by Bentz 2005, which accounts
for the area of concrete effectively contributing to tension stiffening. Ac,ef is area of
concrete effectively bonded to the bar (i.e. the rectangular area of concrete tributary to
the bar extending over a distance of 7.5 bar diameters transversely to the bar), and is
the diameter of the bar in concrete stiffened area. The coefficient is responsible for
the sudden drop of the tension stiffening after cracking. The coefficient has been
obtained through a numerical procedure adjusting (squared least) the tension stiffening
model (Eq. ( 7.5 )) in order to fit the envelope response of the experimental data (i.e.
the force-deformation shear response, see test data in Figure 6.5). The obtained values
of coefficient as function of the applied axial load N are summarized in Table 7.1.
Inspection of Table 7.1 clearly shows that decreases almost linearly as N increases.
For intermediate values of N, linear interpolation can be used.
Table 7.1: Values of α coefficient for the three different applied axial loads.
N= 50 kN N= 100 kN N= 250 kN
α 0.30 0.175 0.00
The constitutive model of the reinforcement proposed by RCFT (Gil-Martin et al.
2009) has been adapted to the new tension stiffening model proposed in this chapter
(Eq. ( 7.5 )), leading to the following formulation:
,
,
,( )
120
s s s y av
c ef crs s y s y av
s s
E for
A ff f for
A M
( 7.6 )
fs and s indicates the average stress and strain in the reinforcement with s equal to x for
longitudinal (i.e. vertical) bars and equal to v for transversal (i.e. horizontal) bars. εy,av
is the apparent yield strain, i.e. the average strain when yielding occurs at a crack
location; εy,av is calculated imposing the equilibrium between a cracked section and the
average section between two consecutive cracked sections and the requirement that the

Modelling of reinforced concrete sandwich walls according to compression field theories
93
strain of the reinforcement at the crack location is equal to the steel strain at yielding
(εy=fy /Es):
,
, , 1 , , 1 ,( ) ( )c ef
y s s y av s c ef y av y av y y av
s s
k Af A E A A f f
A E ( 7.7 )
where k was originally introduced in Gil-Martin et al. 2009 to account for the change of
the area of concrete participating in tension stiffening, Ac,ef (Bentz et al. 2005). In
previous studies, the area Ac,ef of concrete contributing to tension stiffening has been
assumed to be constant (Bentz 2005), being Ac,ef the rectangular area of concrete
tributary to the bar extending over a distance of 7.5 bar diameters transversely to the
bar –value that is insufficient for the studied panels-; however, this area decreases as
long as crack spacing decreases or the tensile strain increases. Further investigations
are needed to clarify the relevance of this and other possible explanations. In this paper,
k has been estimated through a numerical procedure (squared least) in order to fit the
“monotonic” curve corresponding to the envelope of the cyclic behavior of the
specimens. The obtained values of k associated with the maximum shear strength as a
function of the applied axial loads N has been summarized in Table 7.2. It clearly
appears that k strongly decreases as N increases.
Table 7.2: Values of k coefficient for the three different applied axial loads.
N= 50 kN N= 100 kN N= 250 kN
k 1.40 0.70 0.00
Figure 7.5 displays the tension stiffening model for concrete and the model of the
embedded steel bars proposed for thin low reinforced concrete panels, for the values of
α and k given in Table 7.1 and Table 7.2, respectively.
As mentioned before, the fitting problem is performed by adjusting and k, computing
the shear-deformation response, from Eqs. ( 7.1 a,b,c ) to ( 7.7 ), obtaining the curves
shown in Figure 7.5. These curves are the solution to the fitting problem (square least)
to the test data, once and κ are adjusted.

Modelling of reinforced concrete sandwich walls according to compression field theories
94
7.4.2. The Refined Compression-Field Theory (RCFT) predictions for the tested
panel.
As shown earlier, the previous equations were calibrated on the tests results. Figure 7.6
shows the shear stress versus shear strain deformation response of the tested panels
obtained from the adjusted RCFT using the above proposed constitutive equations for
concrete in tension and for steel bars embedded in concrete (Eqs ( 7.5 ) to ( 7.7 )). Only
the post-cracking behavior is displayed. Figure 7.6 clearly shows that the proposed
RCFT leads to a very accurate fitting of the experimental data and thus it is able to
predict the full load-deformation response of the specimens. On the contrary, as shown
above, MCFT and RA-STM are only able to predict the ultimate shear strength.
(a) (b)
Figure 7.5: Constitutive equations for the concrete in tension (a) and for the embedded bars (b) for
the three different applied axial loads.

Modelling of reinforced concrete sandwich walls according to compression field theories
95
Figure 7.6: The RCFT response compared to the test data.
7.5. DESIGN EQUATION ACCORDING TO THE RCFT
This section provides an application of the RCFT for designing of “Nydion” panels. Let
us consider a square full panel having dimensions of 3.00 m x 3.00 m with two layers
of 4 cm shotcrete (fck=26 MPa), reinforced with an electro-welded wire mesh.
Continuous lines in Figure 7.7a provide the shear-displacement curves after concrete
cracks, obtained via RCFT for an axial load of 100 kN of three panels reinforced with a
wire mesh of a different diameter. Figure 7.7b shows the same panels for an axial load
of 150kN (values of and k have been obtained by linear interpolation from Table 7.1
and Table 7.2). Table 7.3 gives the details of the reinforcement layout.
Table 7.3: Reinforcement layout for the examples considered.
ρx [%] (*) ρv [%] (*) Diameter [mm] mesh size [cm x cm] fyk [MPa]
0.245 0.245 2.5 5 cm x 5cm 450
0.353 0.353 3 5 cm x 5cm 450
0.628 0.628 4 5 cm x 5cm 450
*ρx and ρv are the geometrical reinforcement ratio of the vertical and horizontal reinforcement, respectively
(ρx=Asx/t s; ρv=Asv/t s).

Modelling of reinforced concrete sandwich walls according to compression field theories
96
These shear displacement curves shown in Figure 7.7 can be used as design tools for a
simple strength design or for a more complex seismic design.
As far as the strength design approach is concerned, the panel shear strength, Vd, can be
evaluated with the following simplified formula:
1 /d s yd m
LV A f
s ( 7.8 )
where L is the length of the panel, s is the size of the mesh grid, fyd is the steel design
stress )15.1/( ykyd ff , v is the non-dimensional parameter defined as ( cdftLN ),
N is the axial load applied to the panel, t is the thickness of the panel, fcd is the concrete
design strength )5.1/( ckcd ff and ρm is the mechanical reinforcement ratio (ρm =As
∙fyd /(t∙ s∙ fcd) ). It should be noted that in this case As = Asx = Asv, fck=26 MPa and
fyk=450 MPa.
Eq. ( 7.8 ) has been derived combining the three equilibrium equations (i.e. Eqs. ( 7.3 ))
and neglecting the contribution of the concrete tensile stress (the assumption is based
on the experiment observations commented on above), thus leading to a slightly
conservative estimation of the panel strength. Values obtained from Eq. ( 7.8 ) for the
three analyzed panels are represented by three horizontal dashed lines in Figure 7.7.
(a)

Modelling of reinforced concrete sandwich walls according to compression field theories
97
(b)
Figure 7.7: The force-displacement response of a full 3m x 3m panel for different reinforcement
rations: (a) applied axial load equal to 100 KN; (b) applied axial load equal to 150 KN.
7.6. CONCLUSIONS
In the present chapters, refinements to the MCFT have been proposed in order to
accurately predict the response of thin low reinforced RC sandwich panels subjected to
in-plane shear and axial load. Experiments showed that the panel response cannot be
fully described by the actual and most relevant shear theories, i.e. MCFT and RA-STM.
The proposed refinements deal with the average concrete tensile stress-strain
relationship which, from test results, appears to suddenly degrade after reaching
cracking condition. This degradation depends on the applied axial load. Also a
refinement for the model of the embedded bar has been introduced on the base of the
proposed tension stiffening model for concrete. The introduced refinements, calibrated
on the tests results, allow the RCFT to accurately fit the experimental data after
concrete cracks and thus to predict the load-deformation behavior of the tested thin
low-reinforced concrete panels. The preliminary numerical validations seem promising.
However, additional experimental test data are required in order to fully calibrate the
model parameters and further validate the obtained results.


Modelling of reinforced concrete sandwich walls according to a continuum damage theory
99
8. Modelling of reinforced concrete sandwich
walls according to a continuum damage theory
8.1. INTRODUCTION
The modeling of crack initiation and propagation is one of the most important aspects
in the failure analysis of concrete structures. The cracking process in concrete is
different from cracking of other materials, such as metal or glass, in that it is not a
sudden onset of new free surfaces but a continuous forming and connecting of
microcracks (Mehta and Monteiro 1993). From a macroscopic point of view, the
formation of microcracks is represented as a softening effect on the behavior of the
material, which causes the localization and redistribution of strain in a structure. This
phenomenological behavior may be modelled using several different approaches. They
can be subdivided into two main categories: (i) sophisticated models based on the
continuum mechanics framework, which are aimed at describing the concrete behavior
under a general state of stresses and strains, and (ii) simplified models typically
calibrated on experimental data, such as those reducing the uniaxial compressive
strength as a function of: the transverse tensile strain (Vecchio and Collins 1986,
Belarbi and Hsu 1998), the anisotropic reinforcement producing a crack rotation
(Mansour and Hsu 2005b), the maximum occurred compression (Mansour and Hsu
2005b).
As far as the first category of model is concerned, the following main contributions can
be mentioned. First, the phenomenological behavior of cracking at the macroscopic
level has been modeled using the framework of classical plasticity (Chen and Saleeb
1982). Nevertheless, this approach hardly reproduces the stiffness degradation due to
cyclic loading also caused by the microcracking process (Gopalaratnam and Shah

Modelling of reinforced concrete sandwich walls according to a continuum damage theory
100
1985). In continuum damage mechanics, the degradation can be modeled by defining
the relationship between the Cauchy stress tensor and the effective stress tensor.
Comprehensive reviews on continuum damage mechanics are given by Kachanov 1986
and Lemaitre and Chaboche 1990. In this regard, several models for concrete have been
proposed in the past (Mazars 1986; Mazars and Pijaudier-Cabot 1989; Cervera et al.
1995). However, without the introduction of inelastic (or plastic) strains the continuum
damage mechanics theory cannot provide an appropriate dilatancy control, which may
become important for simulating plain and reinforced concrete structures under
multiaxial loading. In the plastic-damage approach, stiffness degradation is embedded
in a plasticity model (Simo and Ju 1987; Ju 1989; Lubliner et al. 1989; Yazdani and
Schreyer 1990). In the coupled elastoplastic-damage model (Simo and Ju 1987; Ju
1989), the effective-stress concept in continuum damage mechanics is introduced to
represent stiffness degradation.
A two scalar damage variables model has been proposed by Faria and his co-workers
(Faria et al. 1998, Wu et al. 2006). The two damage variables (called positive and
negative) are related to the degradation mechanisms occurring under tensile or
compressive stress conditions (assumed as independent), respectively. Appropriate
evolution laws are introduced for the damage variables and for the plastic strain tensor.
Taking into consideration relevant thermodynamic principles, dissipation is checked
and an intuitive constitutive law is proposed. Refinements to the model developed by
Faria and others (Faria et al. 1998, Wu et al. 2006) has been recently proposed by
Tesser and others (University of Padua) leading to a computationally efficient material
model suitable for the seismic analyses of large RC structures.
In this chapter the fundamentals of the material model proposed by Tesser et al. 2011
are summarized and its main capabilities and limitations are briefly discussed. The
model is first applied for the simulation of recent experimental tests of conventional
RC shear walls (Lowes et al. 2011) designed according to modern seismic
requirements. Then, the model is used to simulate the response of the RC sandwich
panels analysed in the two previous chapters. Finally, an insight into specific aspects of
the material model relevant for practical applications is conducted with the purpose of

Modelling of reinforced concrete sandwich walls according to a continuum damage theory
101
providing advices for a proficient use of the model. The numerical analyses are carried
out by means of the software OpenSees, an open source platform for the earthquake
engineering simulations developed at the University of California Berkeley. In
particular the software was enhanced by Tesser and his co-workers with the
development of some modules for cyclic nonlinear analysis of reinforced concrete
structures which are not yet included in the official release of OpenSees. The modules
includes: a three dimensional concrete material model, a reinforced concrete membrane
for plane stress finite elements and a reinforced concrete plate for plate/shell finite
elements (Tesser et al. 2011).
8.2. THE CONCRETE DAMAGE MODEL FUNDAMENTALS:
CAPABILITIES AND LIMITATIONS
The damage concrete model which is here adopted belongs to the class of energy-based
isotropic continuum damage models and will be referred to as 3D Concrete Material
(Tesser et al. 2011). The model is able to represent both tensile and compressive
concrete failure modes, by means of two damage parameters, and also the microcracks
opening and closing, by considering the spectral decomposition of the stress tensor.
The complete theoretical formulation of the model and several validation examples are
available in the works of Tesser et al. 2011. In this section, for the sake of clearness,
the fundamentals of the model are briefly recalled.
The damage and plastic unloading processes are assumed to be elastic (Ju 1989). The
split of the total strain tensor into “elastic-damage” and “plastic-damage” parts is
assumed:
e p ( 8.1 )
The free energy potential Ψ has been postulated according to the work of Faria et al.
1998. By imposing the Clausius-Duhem inequality that holds for any admissible
process the damage and the plastic dissipation inequalities may be obtained (Faria et al.
1998):

Modelling of reinforced concrete sandwich walls according to a continuum damage theory
102
: : : 0
: 0p
p
d d ddd d
( 8.2 a,b )
Where d+ and d
- are the positive and negative damage parameter respectively; ε
p is the
plastic strain vector. The fourth-order damage tensor D can be defined by the following
expression:
d d D P P ( 8.3 )
with P+ and P
- standing for the fourth-order projection tensors (Wu et al. 2006): In
order to be able to characterize the damage evolution, damage energy release rate
functions need to be introduced. The thermodynamic force Y, also called damage
energy released rate, is expressed as:
Yd
( 8.4 )
With:
0 0
1 2
: :
3
Y E C
Y KI J
( 8.5 a,b )
the two components of Y. I1 and J2 are the first invariant of the effective stress tensor
and the second invariant of the deviatoric effective stress tensor), E0 is the concrete
initial Young modulus, while K is a material property that accounts for the increase of
compressive strength due to biaxial compression (Wu et al. 2006).
The following unique expression of the damage criterion can adequately account for
the interaction between tensile and compressive damage evolutions:

Modelling of reinforced concrete sandwich walls according to a continuum damage theory
103
2 2
1 0Y Y
gr r
( 8.6 )
0
0
0
0
32
3
ctr f f
r K f
( 8.7 a, b )
variables r+ and r
- monitor the size of the expanding damage surface, while
0
r and 0
r
are the initial elastic damage thresholds for uniaxial tension and compression loadings
respectively .
In addition to the damage criterion the evolution of the damage threshold is determined
by the following flow rule:
,g Y rr
Y
( 8.8 )
Where is the damage consistency parameter. The related Khun-Tucker conditions
give:
, 0 0 , 0g Y r g Y r ( 8.9 )
while the consistency condition is:
, 0g Y r ( 8.10 )
The new damage threshold variables r can be computed with the Newton-Raphson
method assuring the quadratic convergence of the material state determination.
Four parameters are necessary to determine the initial damage surface: 0
r and 0
r , K
and the Poisson ratio ν. Three common lab tests are sufficient to compute the value of
those parameters: an uniaxial tension experiment allows to determine the tensile
strength fct , an uniaxial compression test allows to obtain the uniaxial elastic limit 0
f
and the Young modulus E0 , while a biaxial compression test allows to obtain the
biaxial elastic limit 0,2
df .
The damage criterion of Eq. ( 8.6 ), that constitutes the damage surface, is displayed in
Figure 8.1, which provides a 2-D representation for this surface, when 2 =0.

Modelling of reinforced concrete sandwich walls according to a continuum damage theory
104
Figure 8.1: Initial elastic domain for plane stress state.
It can be easily verified that, in the compression field (Y+=0), the damage criterion is
equivalent to the modified Drucker-Pruger criterion. The elliptical shape of the damage
criteria assures independent evolution of the positive and negative damage threshold
for uniaxial tensile and compressive tests respectively. The damage parameter
evolution laws are those proposed by Wu et al. 2006. The present constitutive model
assumes that the damage criterion describes also the plastic surface so that the
development of material damaging is simultaneous to the accumulation of irreversible
strains for all the stress states. Recalling the work by Faria et al. 1998 the following
plastic evolution law is adopted:
10 0
::
:p E C
( 8.11 )
having introduced β for the plastic strain coefficient.
The parameters of the material model are summarized in Table 8.1.
Table 8.1: Parameters of the 3D Concrete Material model.
0f 0,2
df fct E0 ν β An Bn Ap
elastic
limit
(1d)
elastic
limit
(2d)
tensile
strength
Elastic
modulus
Poisson’s
ratio
Plastic
strain
ratio
Damage
parameter in
compression
Damage
parameter in
compression
Damage
parameter
in tension

Modelling of reinforced concrete sandwich walls according to a continuum damage theory
105
The above described concrete damage model can be efficiently used for the analysis of
reinforced concrete structures. For in-plane analysis of 2-D planar walls a simple four-
node lagrangian membrane element is suitable. The reinforcement can be modelled by
using a smeared approach (Tesser et al. 2011) which implies that perfect bond between
the concrete and the rebars. For 3-D analyse the four-node MITC shell element
proposed by Dvorkin and Bathe 1984 is preferred.
The concrete damage model here presented has been mainly introduced for large-scale
earthquake simulations of RC structures and therefore its computational efficiency is a
fundamental issue. With this in mind, the authors of the model proposed a plastic strain
evolution which introduces several simplifications with respect to the “effective stress
space plasticity” (Ju 1989) used to couple the damage evolution and the plastic flows.
The proposed law boosts the efficiency of the model, provided that the plastic strain
rate remains parallel to the total strain rate and no additional iterations are required at
the level of material state determinations. On the other hand, the assumption leads to a
lower accuracy in predicting the concrete dilatancy.
Another important limitation of the proposed model for RC members is related to the
assumed perfect bond between concrete and reinforcement, which may lead to less
accurate local responses, such as stresses and strains at particular locations (e.g. where
concrete spalling is more extended).
Moreover, at the present stage, no steel failure (such as steel fracture, buckling or low
cycle fatigue failure) has been included; nonetheless the issue could be overcome by
assuming a more complex constitutive models for the steel at the price of less
computational efficiency.

Modelling of reinforced concrete sandwich walls according to a continuum damage theory
106
8.3. THE SIMULATION OF THE EXPERIMENTAL TESTS OF
CONVENTIONAL REINFORCED CONCRETE SHEAR WALLS
8.3.1. Experimental program
The assessment of the seismic behavior of conventional RC planar shear walls and
coupled walls has been the objective of a recent research program at the NEES MUST-
SIM (Multi-Axial Full-Scale Sub-Structured Testing and Simulation) facility at the
University of Illinois in Champaign-Urbana.
Four test specimens are designed in order to be representative of a ten-story prototype
wall of 36.6 m height, 9.1 m length and 46 cm thick. Due to limitation of the facility
the specimens are one-third scale of the first three stories of the prototype. The
following parameters vary among the specimens: (i) the lateral load distribution; (ii) the
reinforcement layout; (iii) the presence of splice at the base.
Two reinforcement layouts are adopted, one with longitudinal reinforcement
concentrated in the confined boundary region (referred to as Boundary Element (BE)
layout) and the other with a uniform distribution of longitudinal reinforcement (referred
to as Uniform layout). Figure 8.2 shows the two reinforcement layouts. The
longitudinal reinforcement ratio in the boundary elements is equal to 0.0341, while it is
equal to 0.0157 for the uniform layout.
The horizontal reinforcement ratio is equal to 0.0027 for both layouts. Three specimens
present spliced longitudinal reinforcement at the base, while one specimen present
continuous bars from the base to the top of the wall. Table 8.2 provides the design test
matrix parameters for every specimen. Additional details related to the design of the
specimens can be found in the report of the project (Lowes et al. 2011).

Modelling of reinforced concrete sandwich walls according to a continuum damage theory
107
(a) (b)
Figure 8.2: (a) Boundary element layout; (b) Uniform layout (dimensions in inches)
Table 8.2: Design test matrix.
Specimen Lateral Load
distribution
Reinforcement layout Presence of splice
PW1 ASCE 7 BE Yes
PW2 Uniform BE Yes
PW3 ASCE 7 Uniform Yes
PW4 ASCE 7 BE No
The wall specimens were designed using a nominal concrete strength of 34.5 MPa and
a nominal yield stress of 414 MPa. Table 8.3 summarizes the main properties of the
concrete as obtained from cylinder tests. f’c indicates the measured compressive
strength, εc0 is the strain at the peak compressive strength, Ec is the elastic modulus
(estimated as 57,000 f’c 0.5
psi and then converted in MPa), ft is the tensile strength as
determined from MOR tests.
The primary longitudinal reinforcement was standard #4 Grade 60 deformed bars.
Specimens PW1 and PW2 were built using the same batch of steel. The # 2 rebars were
subjected to a special thermal treatment in order to augment the deformation properties

Modelling of reinforced concrete sandwich walls according to a continuum damage theory
108
of the not treated bars, which exhibited quite low ultimate strains (of the order of 0.05).
The main experimental properties of the steel bars are summarized in Table 8.4.
Table 8.3: Concrete material properties.
Specimen f’c [MPa] εc0 [∙10-3
] Ec [MPa] ft [MPa]
PW1 36 2.27 28380 7.1
PW2 40 2.51 30000 7.3
PW3 34 2.85 27680 7.0
PW4 29 2.07 25640 6.0
Table 8.4: Steel material properties.
Specimen fy [MPa] εy [*10-3] fmax [MPa] εu [*10-3]
PW1 & PW2 #4 578 2.9 694 12
PW3 #4 353 1.8 483 20
PW4 #4 462 2.3 753 13
All #2 520 2.6 582 5.8*
*the value is referred to the not-treated bars
8.3.2. Test setup
Loads are applied using the Load and Boundary Condition Boxes (LBCBs) allowing
the control of all the six degrees of freedom. In order to reach the peak strengths, the
use of two LBCBs was required. Applied loads consist of a constant axial load equal to
10% of the nominal axial capacity of the wall (1601 kN) and reversed cyclic lateral
forces and overturning moments. The ratio between the applied overturning moment
and lateral force (which is kept constant during each test) varies from specimen to
specimen according to the lateral load distribution. The tests were displacement
controlled with the control point located at the mid span of the top of the wall. The load
history is composed of complete cycles of increasing amplitude up to a story drift of
1.5% of the height. A total of nine increasing drifts, each one composed of three
complete cycles, were intended to be applied.
The instrumentation used to collect data from the experimental tests is composed of
traditional measurement systems (strain gauges and LVDTs) and advanced
measurement systems including an optical measuring machine (CMM), able to record

Modelling of reinforced concrete sandwich walls according to a continuum damage theory
109
the motion of the specimen during the test (data are acquired at approximately 1 Hz)
and high-resolution cameras. Additional details on the test set up and measurement
instrumentation are available in the in the report of the project (Lowes et al. 2011).
8.3.3. The numerical models
The numerical models and the simulations of the experimental tests have been
developed using the software OpenSees (Mazzoni et al. 2006). Because of the planar
geometry of the wall specimens and the in-plain loading, 2D membrane elements are
used (i.e. the out of plane stresses are condensed out). The smeared approach is adopted
to model the vertical and longitudinal reinforcement, thus allowing a significant
reduction in the computational effort. In the present work the Giuffrè-Menegotto-Pinto
law with the isotropic hardening introduced by Filippou et al. 1983 is used.
The effect of the concrete confinement (which cannot be directly captured by the
model) has been computed according to the model of Kent and Park 1971. In more
details, the following procedure is applied: (i) the constitutive laws for the unconfined
material are obtained according to the results of the experimental tests; (ii) the stress-
strain relation for the confined concrete is estimated using the Kent and Park model;
(iii) the model parameters 0f , 0,2
df and An are adjusted (with a fitting procedure) in
order to match the Kent and Park 1971 stress-strain relationship. Table 8.5 and Table
8.6 give the values of the parameters adopted for the concrete and steel model. Figure
8.3 displays the stress-strain relations for the unconfined and confined concrete adopted
for the specimens PW1. Similar curves are obtained for the other specimens. Zero
concrete tensile strength is assumed as a result of the comparison between numerical
simulations and experimental results at low drift values.
The mesh of the reinforced concrete wall is composed of 12x14 square elements having
25 cm side length.

Modelling of reinforced concrete sandwich walls according to a continuum damage theory
110
Table 8.5: Material parameter adopted for each specimen
Specimen 'cf [Mpa] Ec [Mpa]
0f [Mpa]
β An Bn
PW1 36 28380 21.6 0.5 1.5 0.75
PW2 40 30000 24 0.5 1.5 0.75
PW3 34 27680 20.4 0.5 1.5 0.75
PW4 29 25640 17.4 0.5 1.5 0.75
Table 8.6: Parameters for the #4 steel bar for each specimen.
Specimen yf [Mpa] Es [Gpa] R0[Mpa]
B CR1 CR2 a1 a2
PW1 578 198 21.6 0.5 1.5 0.75 0.04 1.0
PW2 578 198 24 0.5 1.5 0.75 0.04 1.0
PW3 353 198 20.4 0.5 1.5 0.75 0.04 1.0
PW4 462 198 17.4 0.5 1.5 0.75 0.04 1.0
(a) (b)
Figure 8.3: (a) Stress-strain relation for the confined concrete; (b) Stress-strain relation for the
unconfined concrete.
The foundation and the wall cap are included in the model as linear elastic elements
with the same elastic modulus of the non-linear concrete model. Figure 8.4 shows the
mesh of the model. Loads are applied at the mid height of the wall cap. The vertical
load is applied under force control, while the horizontal in-plane load is applied under
displacement control according to the prescribed protocol.

Modelling of reinforced concrete sandwich walls according to a continuum damage theory
111
Figure 8.4: Model geometry and schematic representation of the applied load.
In order to reproduce the actual loading protocol and the boundary conditions at the top
wall, the effect of the applied top moment My is simulated by imposing a double
triangle distribution of vertical displacement at the nodes located at the mid-depth of
the wall cap (see Figure 8.4).
8.3.4. Results of the numerical simulations
This section provides a summary of the main results obtained from the numerical
simulations as well as comparisons between numerical and experimental results. In the
test report (Lowes et al. 2011) it is highlighted that the specimen PW4 experienced a
non-negligible out-of-plane displacement which reduced the in-plane theoretical
capacity. For this reason, the following discussions are limited to the specimen PW1,
PW2 and PW3.
First, monotonic pushover analyses are carried out to obtain the capacity curve of each
specimen. Using the contour plots of the damage variable dn Damage State Limits

Modelling of reinforced concrete sandwich walls according to a continuum damage theory
112
(DSLs) are defined (details are available in section 7.5). These values should be useful
for design purposes. Then, cyclic analyses are performed and the results are compared
with the experimental ones: both global responses, in terms of load-displacement
behavior and damage evolutions, and local responses are analysed.
8.3.4.1. Monotonic Pushover Analyses
The lateral capacity curves of the studied specimens are displayed in Figure 8.5 in
terms of base shear vs. story drift. The models of PW2 and PW3 exhibit the same initial
linear response up to a drift around 0.1%, while the initial response of the model of
PW1 is slightly less stiff. The more flexible initial response of the model of PW1 is due
to the different boundary conditions imposed at the top beam resulting from the
different applied lateral loads distribution (triangular vs. uniform). The peak strength
exhibited by the model of PW1 is approximately equal to 760 kN and is reached around
0.5% drift. The peak strength is maintained quite constant between 0.75% and 1.50%
drift, thus providing a good ductile response. The peak strength of the model of PW2 is
approximately equal to 1000 kN and is reached at approximately 0.7% drift. After the
peak strength, strength decay is observed (10% decay from 0.7% to 2% drift). The
model of PW3 shows a peak strength of 810 kN. After the peak, a similar strength
decay of PW2 model is observed. The significant increases in strength showed by PW2
model has to be attributed to the presence of the boundary elements and partially to the
higher concrete strength. It has to be noted that the pushover curves are obtained
neglecting the tensile strength of the concrete, thus providing a conservative estimation
of the specimen shear strength (i.e. peak base shear).
The contour plots of the damage variable dn is used to identify the achievement of
specific Damage State Limits (DSLs). In this study, the DSLs are defined as follows:

Modelling of reinforced concrete sandwich walls according to a continuum damage theory
113
Figure 8.5: Pushover curves for specimen PW1, PW2 and PW3 as obtained from numerical
simulations.
DSL1 is reached when dn approaches 0.6. At this damage level the longitudinal
rebars start yielding and therefore it can be considered as the “yielding point”;
DSL2 is reached when dn approaches 0.7. At this level the concrete locally
approaches its peak strength;
DSL3 is reached when dn approaches 0.8. At this level of damage concrete
strength starts to degrade and initial spallling could be observed;
DSL4 is reached when dn approaches 0.9. The concrete residual strength is
approximately equal to 0.8 of the peak strength; spalling could be observed.
DSL5 is reached when dn approaches 0.95. At this level of damage concrete
residual strength is approximately equal to 0.1 of the peak strength; concrete
approaches crushing;
DSL6 is reached when dn approaches 1.0. At this level of damage concrete has
no residual strength and stiffness and crushing could be observed. Typically at
this state of damage also the rebars may fail due to buckling (or due to low-
cycle fatigue in the case of cyclic loads) ;
Further details are provided in section 7.5. The values of the base shear and
leading to each DSLs are collected in Table 8.7 and
Table 8.8. It can be noted that PW1 model is characterized by a higher ductility
with respect to PW3 (the drift at DSL6 for the model of PW1 is 60% higher than
that for specimen PW3), despite a small increase in the peak strength (7%). This
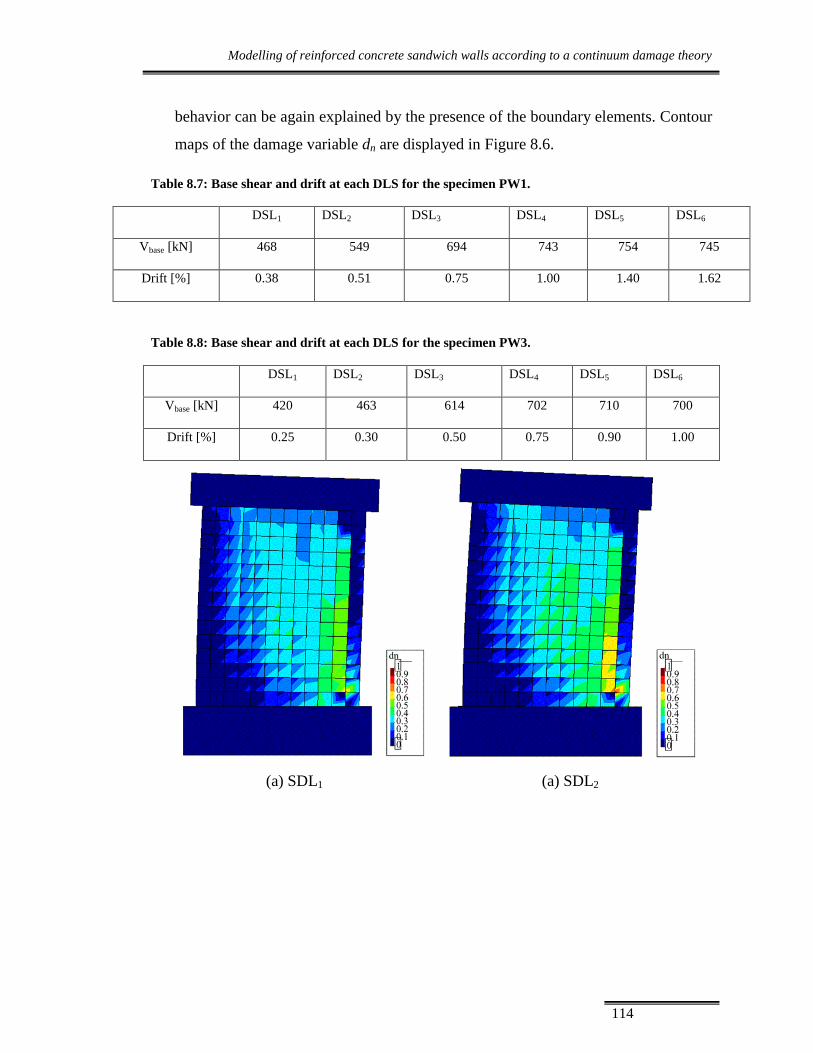
Modelling of reinforced concrete sandwich walls according to a continuum damage theory
114
behavior can be again explained by the presence of the boundary elements. Contour
maps of the damage variable dn are displayed in Figure 8.6.
Table 8.7: Base shear and drift at each DLS for the specimen PW1.
DSL1 DSL2 DSL3 DSL4 DSL5 DSL6
Vbase [kN] 468 549 694 743 754 745
Drift [%] 0.38 0.51 0.75 1.00 1.40 1.62
Table 8.8: Base shear and drift at each DLS for the specimen PW3.
DSL1 DSL2 DSL3 DSL4 DSL5 DSL6
Vbase [kN] 420 463 614 702 710 700
Drift [%] 0.25 0.30 0.50 0.75 0.90 1.00
(a) SDL1 (a) SDL2
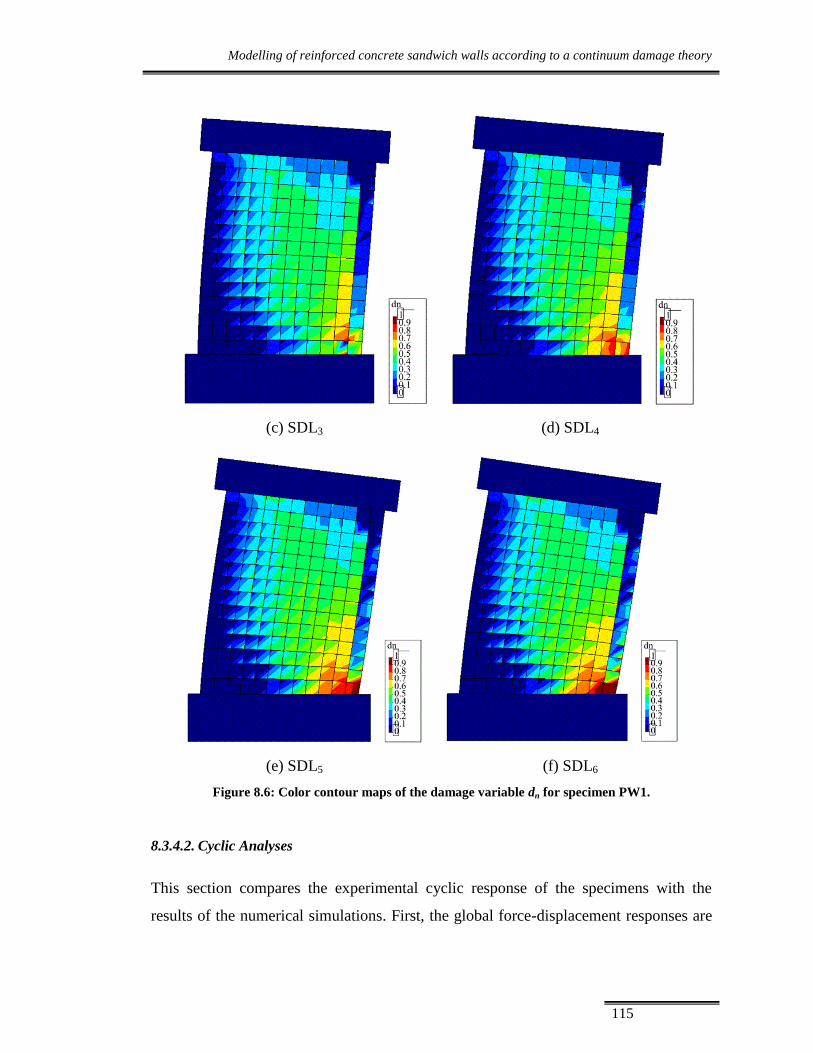
Modelling of reinforced concrete sandwich walls according to a continuum damage theory
115
(c) SDL3 (d) SDL4
(e) SDL5 (f) SDL6
Figure 8.6: Color contour maps of the damage variable dn for specimen PW1.
8.3.4.2. Cyclic Analyses
This section compares the experimental cyclic response of the specimens with the
results of the numerical simulations. First, the global force-displacement responses are

Modelling of reinforced concrete sandwich walls according to a continuum damage theory
116
analysed. Then, the damage evolution is discussed. Finally, local responses (stress-
strain response histories) are investigated.
The experimental and numerical hysteretic responses in term of base shear vs. story
drift are represented in Figure 8.7. The numerical model is able to well simulate the
main features of the global experimental cyclic behavior in terms of peak strength,
envelope response and hysteretic behavior. Contour maps of the damage variable dn at
selected drifts are displayed in Figure 8.8 and Figure 8.9.
(a)
(b)

Modelling of reinforced concrete sandwich walls according to a continuum damage theory
117
(c)
Figure 8.7: Comparison between the experimental and numerical cyclic response. (a) Specimen
PW1; (b) Specimen PW2; (c) Specimen PW3.
Table 8.9 provides the peak values of dn at each imposed drift. The evolution of the
damage obtained from the numerical analysis appears consistent with the damages
observed during the test which can be summarized as follows (extracted from Lowes et
al. 2011):
Horizontal cracking initiated at 0.10% drift.
Diagonal cracking initiated at 0.10% drift.
Vertical cracks initiated at 0.35% drift.
Compressive yield of the extreme vertical reinforcing bars was indicated by
strain gauges at 0.20% drift.
Tensile yield of extreme vertical reinforcing bars was indicated by strain
gauges at 0.42% drift.
Cover spalling initiated above the splice during the first cycle at 0.75%.
Longitudinal reinforcement was exposed above the splice during the third cycle
to 0.75% drift.
Damage (crushing) of the confined core of the boundary element was observed
above the splice during the first half cycle (ER+) to 1.5% drift.
Failure occurred due to extensive bar buckling and core crushing in the west
(left) boundary element above the splice at 1.05% drift in the first WL- cycle to
1.05% drift.

Modelling of reinforced concrete sandwich walls according to a continuum damage theory
118
The overall damage evolution of PW2 model obtained from the numerical
simulations is similar to that of PW1 model: DSL1 is reached approximately at
0.5% drift, while the last DSL (i.e. DSL6) is reached between 1.0% and 1.5% drift.
Nonetheless, the DSLs are reached at slightly less drift, meaning a less ductile
behavior of the numerical model.
The damage evolution for PW3 as obtained from the numerical simulation is quite
different than that of PW1 and PW2: the DSL1 is approached at 0.347% drift; the
DSL2 is reached around 0.5% drift, DSL3 and DSL4 are reached between 0.5% and
0.75%, DSL5 is reached at 0.75%, DSL6 is reached at 1.0% drift. The progression
of damage obtained for PW3 appears consistent with the experimental observation,
which can be summarized as follows (extracted from Lowes et al. 2011):
Tensile yield of extreme vertical reinforcing bars was indicated by strain
gauges at 0.17% drift.
Compressive yield of extreme vertical reinforcing bars was indicated by strain
gauges at 0.32% drift.
Cover spalling initiated above the splice at 0.52% drift.
Web crushing was observed at 0.75% drift.
Bar buckling was observed above the splice during the first cycle to 1.0% drift.
Damage (crushing) of the confined core of the boundary element was observed
above the splice during the second (and final) cycle to 1.0% drift.
Failure occurred due to extensive bar buckling and core crushing in the east
(right) boundary element above the splice at 1.28% drift during the first ER+
half cycle to 1.5% drift.
For the sake of clearness, color contour maps of the damage variable dn for the
models of PW1 and PW3 are provided in Figure 8.8 and Figure 8.9, respectively.
For PW1 model the damage remains more concentrated in the boundary elements,
while for specimen PW3 the damage is spread also in the web. The results are
consistent with the experimental observations.

Modelling of reinforced concrete sandwich walls according to a continuum damage theory
119
Table 8.9: Peak Negative Damage Variable dn at each peak drift (first of the three cycle).
Specimen d=0.1% d=0.347% d=0.5%
d=0.75% d=1.0% d=1.5%
PW1 0.33 0.44 0.57 0.79 0.96 1.00
PW2 0.39 0.54 0.65 0.85 0.98 1.00
PW3 0.45 0.57 0.75 0.95 1.0 1.00
(a) (b)
(c) (d)
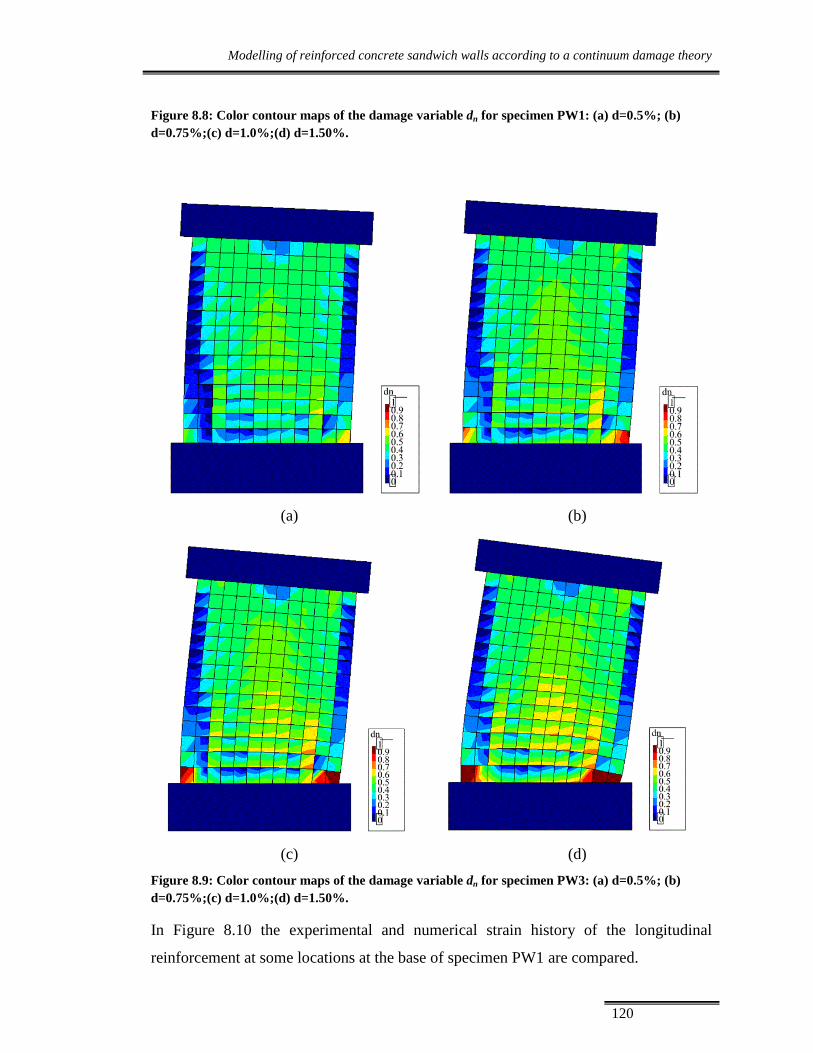
Modelling of reinforced concrete sandwich walls according to a continuum damage theory
120
Figure 8.8: Color contour maps of the damage variable dn for specimen PW1: (a) d=0.5%; (b)
d=0.75%;(c) d=1.0%;(d) d=1.50%.
(a) (b)
(c) (d)
Figure 8.9: Color contour maps of the damage variable dn for specimen PW3: (a) d=0.5%; (b)
d=0.75%;(c) d=1.0%;(d) d=1.50%.
In Figure 8.10 the experimental and numerical strain history of the longitudinal
reinforcement at some locations at the base of specimen PW1 are compared.

Modelling of reinforced concrete sandwich walls according to a continuum damage theory
121
(a) (b)
Figure 8.10: Comparison between the experimental and numerical strain history of the
longitudinal reinforcement at specific locations of the base of the wall for the specimen PW1. (a)
East Boundary element; (b) West Boundary element
The strain response provided by the numerical simulations seems to be quite accurate.
It should be recalled that perfect bound between concrete and reinforcement is
assumed. Clearly, this assumption may affect the accuracy of the local stress-strain
results.
8.4. THE SIMULATIONS OF THE RC SANDWICH WALL TESTS
8.4.1. Planar walls
The mesh geometry of each PW is made of four-node membrane elements with side
length of 25 cm. The foundation and the loading beam are modelled as linear-elastic
elements. The parameter of the 3D Concrete Material are partially obtained from
results of material tests (i.e. 0
f , E0, An) and partially assumed (all the rest). The
concrete tensile strength of the model has been reduced to account for pre-cracking due
to constrained shrinkage. The numerical values of the parameters are summarized in
Table 8.10. The Giuffrè-Menegotto-Pinto model with isotropic hardening introduced
by Filippou et al. 1984 has been used for the reinforcement. Steel yield strength of 450
MPa has been adopted, based on the results of material tests.

Modelling of reinforced concrete sandwich walls according to a continuum damage theory
122
Table 8.10: Parameter values for the 3D Concrete Material (PW specimens).
0f
[MPa]
0,2
df
[MPa]
fct
[MPa]
E0
[MPa] ν β An Bn Ap
15 18 0.1 28000 0.0 0.5 2.0 0.75 0.1
For each planar wall, two different models are developed:
Type A models: perfect bound between the wall and the foundation is
assumed. This model is used to evaluate the capacity of the wall assuming no
slip at the base;
Type B models: slips between the wall and foundation are included through
the insertion of zero-length elements (Mazzoni et al. 2006) between the wall
and foundation. The zero-length elements are active along the horizontal
direction and their hysteretic response is modelled using the Scott and
Filippou pinching model available in the OpenSees library (see Mazzoni et al.
2006).
Both monotonic pushover and reversed cyclic pushover analyses have been carried out.
The former are performed only on the type A models with the purpose of estimating the
capacity curve of the model and the evolution of damage under monotonic loadings
(i.e. Damage State Limits, DSLs) assuming no slip between the wall and the
foundation; the latter are performed on both type A and type B models in order to
evaluate the effect of the relative slips between wall and foundation on the seismic
response of the wall.
8.4.1.1. Monotonic pushover analyses
Figure 8.11 displays the monotonic pushover curves for all planar specimens together
with the corresponding envelopes as obtained from the experimental data. Contour
maps of the damage variable dn for a full panel (specimen PW1) and a perforated panel
(specimen PW4) are given in Figure 8.12 and Figure 8.13, respectively. Each map
corresponds to a specific DSL (i.e. peak damage variable dn equal to 0.6, 0.7, 0.8, 0.9,
0.95, 1.0, respectively). Values of inter-story drift leading to each DSL are collected in
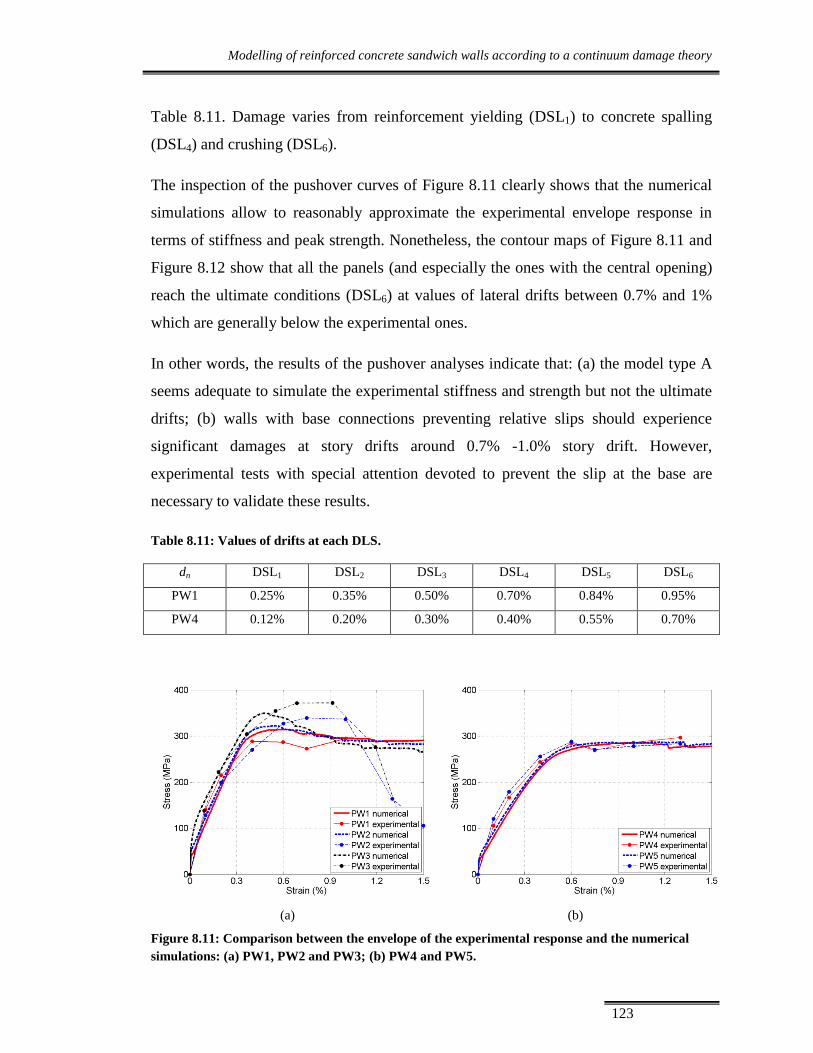
Modelling of reinforced concrete sandwich walls according to a continuum damage theory
123
Table 8.11. Damage varies from reinforcement yielding (DSL1) to concrete spalling
(DSL4) and crushing (DSL6).
The inspection of the pushover curves of Figure 8.11 clearly shows that the numerical
simulations allow to reasonably approximate the experimental envelope response in
terms of stiffness and peak strength. Nonetheless, the contour maps of Figure 8.11 and
Figure 8.12 show that all the panels (and especially the ones with the central opening)
reach the ultimate conditions (DSL6) at values of lateral drifts between 0.7% and 1%
which are generally below the experimental ones.
In other words, the results of the pushover analyses indicate that: (a) the model type A
seems adequate to simulate the experimental stiffness and strength but not the ultimate
drifts; (b) walls with base connections preventing relative slips should experience
significant damages at story drifts around 0.7% -1.0% story drift. However,
experimental tests with special attention devoted to prevent the slip at the base are
necessary to validate these results.
Table 8.11: Values of drifts at each DLS.
dn DSL1 DSL2 DSL3 DSL4 DSL5 DSL6
PW1 0.25% 0.35% 0.50% 0.70% 0.84% 0.95%
PW4 0.12% 0.20% 0.30% 0.40% 0.55% 0.70%
(a) (b)
Figure 8.11: Comparison between the envelope of the experimental response and the numerical
simulations: (a) PW1, PW2 and PW3; (b) PW4 and PW5.
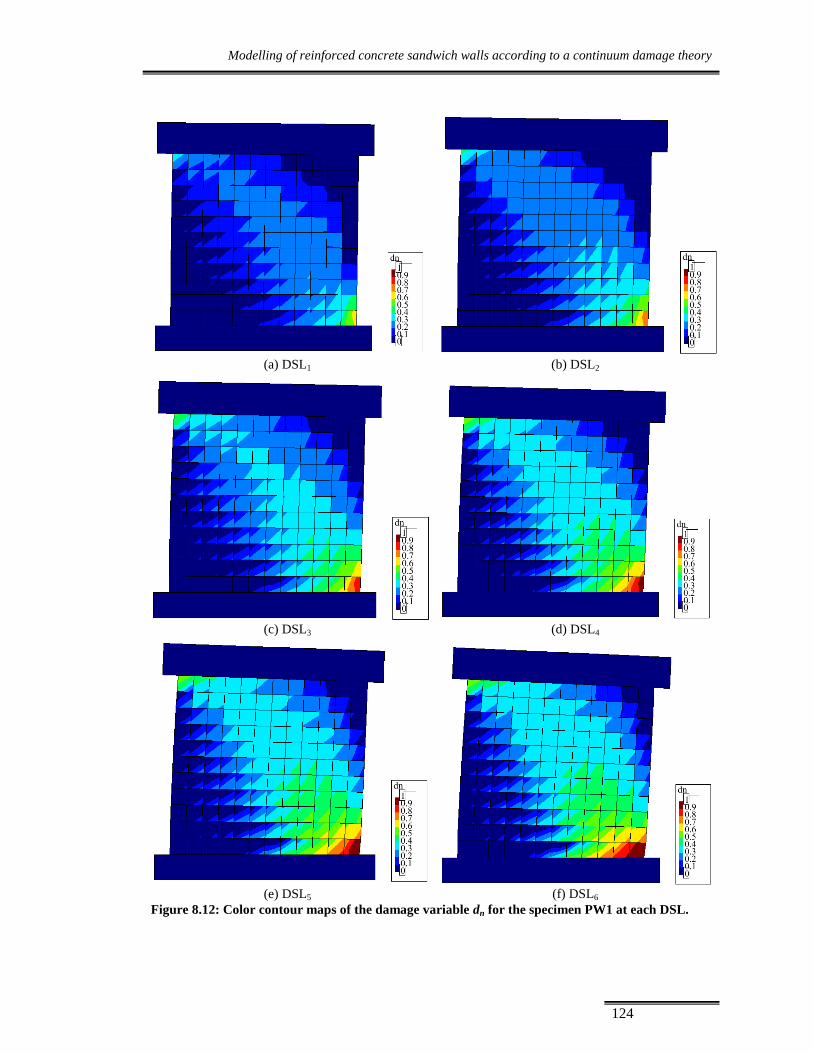
Modelling of reinforced concrete sandwich walls according to a continuum damage theory
124
(a) DSL1 (b) DSL2
(c) DSL3 (d) DSL4
(e) DSL5 (f) DSL6
Figure 8.12: Color contour maps of the damage variable dn for the specimen PW1 at each DSL.

Modelling of reinforced concrete sandwich walls according to a continuum damage theory
125
(a) DSL1 (b) DSL2
(c) DSL3 (d) DSL4
(e) DSL5 (f) DSL6
Figure 8.13: Color contour maps of the damage variable dn for the specimen PW4 at each DSL.

Modelling of reinforced concrete sandwich walls according to a continuum damage theory
126
8.4.1.2. Cyclic analyses
The cyclic response as obtained from the numerical simulations on type A models is
represented in Figure 8.14 together with the experimental response in terms of base
shear vs. story drift. First, it can be observed that all numerical responses overestimate
the experimental peak strength. The pinching is poorly captured by the model.
Moreover, the significant strength deterioration experienced by specimens PW2 and
PW3 after a story drift of approximately 0.75% is not captured by the models. On the
contrary, the numerical response of the models PW4 and PW5 (the ones with the
central opening) is characterized by a fast strength degradation at large drift which is
not shown by the experimental responses. The numerical response of model PW5 at the
last imposed inter-story drift is characterized by practically null strength. The fast
strength decay observed by the numerical simulation (PW4 and PW5) is explained by a
damage localization at base of the opening leading to a sort of sliding shear failure as
shown by the contour maps of the damage variable dn for PW4 (Figure 8.14). During
the experimental tests no signs of such a mechanism of damage were observed. On the
contrary, as already mentioned, significant sliding at the base of the walls characterized
the experimental behavior.
(a) (b)

Modelling of reinforced concrete sandwich walls according to a continuum damage theory
127
(c) (d)
(e)
Figure 8.14: Comparison between the numerical cyclic simulations (type 1 models) and
experimental response: (a) PW1; (b) PW2; (c) PW3; (d) PW4; (e) PW5.
(a) (b)

Modelling of reinforced concrete sandwich walls according to a continuum damage theory
128
(c)
Figure 8.15:Color ontour maps of the damage variable dn for specimen PW4 at the three peaks at
1.0% story drift: (a) first cycle; (b) second cycle; (c) third cycle.
The numerical simulations of the experimental tests (type B models) are represented in
Figure 8.16 in terms of base shear vs. story drift together with the experimental
responses. The presence of the zero-length elements allows to better reproduce the
pinched shape of the experimental response and at the same time determines a
reduction of the panel damage, particularly at the bottom. Contour maps of the damage
variable dn at a drift equal to 1% are displayed in Figure 8.17. The numerical response
of type B models well correlate with the experimental evidences: the presence of base
connectors, allowing a relative slips between the walls and the foundations, leads to a
remarkable damage reduction and has to be considered in the design phase.
(a) (b)

Modelling of reinforced concrete sandwich walls according to a continuum damage theory
129
(c) (d)
(e)
Figure 8.16: Comparison between the numerical cyclic simulations (type 2 models) and
experimental response: (a) PW1; (b) PW2; (c) PW3; (d) PW4; (e) PW5.
(a) (b)
Figure 8.17: Color contour maps of the damage variable dn at 1% drift for: (a) specimen PW1; (b)
specimen PW4.

Modelling of reinforced concrete sandwich walls according to a continuum damage theory
130
8.4.2. HSW specimen
The mesh geometry is made up four-node MITC shell elements (Dvorkin and Bathe
1984), allowing to account for the out-of-plane behavior, having dimensions of 50 cm.
The slabs and the foundations are modelled as linear-elastic elements. The parameter
values used for the 3D concrete Material are collected in Table 4. Steel yield strength
of 450 MPa is used. It should be noted that linear-elastic out-of plane behavior is
assumed. The assumption leads to a considerable reduction of the computational time
(almost 10 times) and can be considered reasonable when no significant out of plane
stresses are expected. Moreover, no zero-length elements are inserted between the
walls and the foundations provided that no significant slips were observed during the
experimental test.
Table 8.12: Parameter values for the 3D Concrete Material (HS specimen).
0f
[MPa]
0,2
df
[MPa]
fct
[MPa]
E0
[MPa] ν β An Bn Ap
15 18 0.1 28000 0.0 0.5 3.0 0.75 0.1
8.4.2.1. Cyclic analyses
The comparison between the numerical simulation and the experimental response is
displayed in Figure 8.18a in terms of base shear vs. roof drift. For the sake of clearness,
the last cycles are isolated and displayed in Figure 8.18b. The numerical model can
reasonably simulate the main features of the experimental cyclic response such as the
peak strength, stiffness and strength at different drifts, permanent (plastic) deformations
during the reloading phases. Nonetheless, residual stiffness after high drifts is quite
overestimated and strength degradation is not properly captured. Contour maps of the
damage variable dn are displayed in Figure 8.19. The peak of the negative damage dn
approaches to 0.85 at the corner base (the damage may correspond to initial concrete
spalling) and seems to slightly underestimate the state of damage as obtained from
experimental evidence. This may lead to the superior residual stiffness and less strength
decay in the numerical simulations.

Modelling of reinforced concrete sandwich walls according to a continuum damage theory
131
(a) (b)
Figure 8.18: Comparison between the numerical simulation and the experimental response: (a)
entire cyclic response; (b)last imposed cycles.
(a) (b)
(c) (d)
Figure 8.19: Color contour maps of the damage variable dn: (a) 0.2% drift; (b) 0.4% drift; (c)
0.8% drift; (d) 1.0% drift.

Modelling of reinforced concrete sandwich walls according to a continuum damage theory
132
The inclusion of the non-linear out-of-plane behavior of the flanges may increase the
response accuracy at the prize of additional computational effort.
8.4.3. Concluding remarks
A wide experimental campaign has been developed through the last decades aimed at
assessing the static and seismic response of reinforced concrete sandwich panels.
Experimental tests included pseudo-static tests of both full-scale planar panels and a
more complex full-scale I-shaped two-story structure. As the last step of the research
work, a concrete damage model, recently proposed by some of the authors for the
seismic analysis of reinforced concrete members, has been adopted in order to simulate
the results of the experimental tests with the purpose of investigate the suitability of the
model for the design of PSP structures under earthquake actions.
Based on the results of the numerical simulations the following conclusion can be
drawn:
The concrete damage model appears suitable for the seismic analyses of PSPs
structures.
The numerical models without connectors at the base (type 1 models) are not
able to well reproduce the experimental cyclic response of the specimens: the
wall peak strength is overestimated, while the ultimate displacement capacity
is underestimated. Nonetheless, these models could be useful to evaluate the
bearing capacity of the walls in the presence of connections which prevent
from slips at the base.
Results of the pushover analyses on the type 1 models indicate that the
ultimate drift capacity of the tested panels is between 0.70% and 0.95%.
However, additional experimental tests are necessary to validate these
preliminary results.
The connections between the wall base and the foundation largely affect the
seismic response of walls and therefore have to be included in the model of
the structure; the models including the connections (type 2 models) at the base

Modelling of reinforced concrete sandwich walls according to a continuum damage theory
133
are able to well simulate the global experimental response in terms of base
shear vs. story drift and the damage state.
The connections at the base can be efficiently modelled thought simple non-
linear elements as the zerolength elements available in the Opensees library
once the appropriate hysteretic properties (i.e. the parameters governing the
shape of the envelope response and the cyclic response) are assigned.
Additional experimental results are necessary in order to further asses these
parameters.
8.5. AN INSIGTH INTO THE 3D CONCRETE MATERIAL MODEL
The present section provides further insight into the 3D Concrete Material model. First,
the response of a single plane concrete membrane element under different stress states
is investigated with the purpose of underlining the capabilities and limitations of the
model and of providing recommendations for the selection of the numerical values of
the parameters. Then, specific aspects related to modelling of an entire RC wall (the
same of section 7.3) are discussed with reference to the planar walls analysed in section
7.3.
8.5.1. Behavior in compression
8.5.1.1. Uniaxial response
The numerical response under cyclic uniaxial compression is represented in Figure 8.20
and compared with the experimental results from Sinha et al. 1964. The model
parameters which are able to fit the experimental response are: An=6.0; Bn=0.75; β=0.6;
'0 0.6 cf f (fc
’ being the peak experimental strength). When the initial elastic limit is
passed, the plastic strain and the damage parameter increase. Clearly, the hysteresis of
the reloading loop cannot be simulated by the model provided that the unloading
process is assumed to be elastic.

Modelling of reinforced concrete sandwich walls according to a continuum damage theory
134
(a) (b)
Figure 8.20: Stress-strain response (a) and damage evolution under uniaxial compression(b).
The progression of the damage variable dn is displayed in Figure 8.20. It can be noted
that for this specific case the negative damage parameter is around 0.2 when the
compressive peak strength is achieved. After a strength decay of about 25%, the
damage parameter approaches 0.7. A value of dn equal to 1.0 implies that the strength
and stiffness of the material are completely lost. It should be underlined that the
damage variable dn monotonically increases since it depends on the maximum recorded
damage threshold. This implies that the damage variable remains constant during an
unloading/reloading cycle until the maximum effective stress is exceeded again.
8.5.1.2. Confinement effect
The 3D Concrete Material model is not able to directly account for the effect of the
confinement due to the presence of transversal response (note that in a solid element
the model would be able to capture the confinement effect). Nevertheless, as well
known, the confinement plays a significant rule in the response of reinforced concrete
structures. In this study, the effects due to the confinement on the material strength and
ductility has been accounted based on the well-known confinement model proposed by
Kent and Park 1971 by adjusting the values of parameters 0f , 0,2
df and An . The
following procedure is adopted: (i) the constitutive laws for the unconfined material are
obtained according to the results of the experimental tests. (ii) the stress-strain relation
for the confined concrete is estimated using the Kent and Park model. (iii) the model

Modelling of reinforced concrete sandwich walls according to a continuum damage theory
135
parameters 0f , 0,2
df and An are adjusted (with a fitting procedure) in order to match the
Kent and Park 1971 stress-strain relationship.Table 8.13 gives the numerical values of
An and k (k is the parameter of the Kent and Park model which multiplies the
compressive strength in order to obtain f01d) for transversal reinforcement ratios
between 0.2% and 2.0%. For the sake of clearness, Figure 8.21 compares the stress-
strain relations as suggested by Park and Kent 1971 with the corresponding one as
obtained from the proposed model, for two specific values of transversal reinforcement
ratios. Linear interpolation of the values of Table 8.13 is admitted for reinforcement
ratios in the range of 0.2 to 2.0% (Figure 8.22).
(a) (b)
Figure 8.21: Comparison of 3D concrete material model with uniaxial Kent and Park model: (a) ρt
=0.2%; (b) ρt =2.0%.
Figure 8.22: An and k vs. ρt.

Modelling of reinforced concrete sandwich walls according to a continuum damage theory
136
Table 8.13: An and k for different transversal reinforcement ratio.
ρt [%] An K
0.2 5.0 0.55
0.5 3.0 0.60
1.0 2.0 0.62
1.5 1.5 0.65
2.0 1.4 0.7
8.5.1.3. Biaxial response
Figure 8.23 and Figure 8.24 display the numerical response for different states of
biaxial compression. The following parameter values have been adopted for the
simulations: An=2.0; Bn=0.75; β=0.6; 0f =0.6 fc
’; 0
f =1.2 0,2
df . From Figure 8.23 it
appears that for the case of biaxial isotropic compression the peak strength increases by
20% with respect to the case of uniaxial compression. At the same time the ductility
decreases. This is consistent with the response of concrete under biaxial isotropic
compression (Kupfer 1969). The progression of the damage variable dn is also
displayed in Figure 8.23. The damage variable dn initially grows faster than the
corresponding ones for uniaxial compression. After the peak strength is reached, the
two damage curves grow at the same rate. The other curves of Figure 8.23 and Figure
8.24 (blue curves) represent the stress-strain response under biaxial compression for of
a constant compression in one direction. It can be noted that: (a) as the constant
compression increases, the peak strength also increases. (b) as the constant
compression increases the ductility decreases. Moreover, the evolution of the damage
in compression is the same as for the case of uniaxial compression. Figure 8.24 shows
the numerical cyclic response for different cases of biaxial compression. Observations
similar to those given for the monotonic response arise.
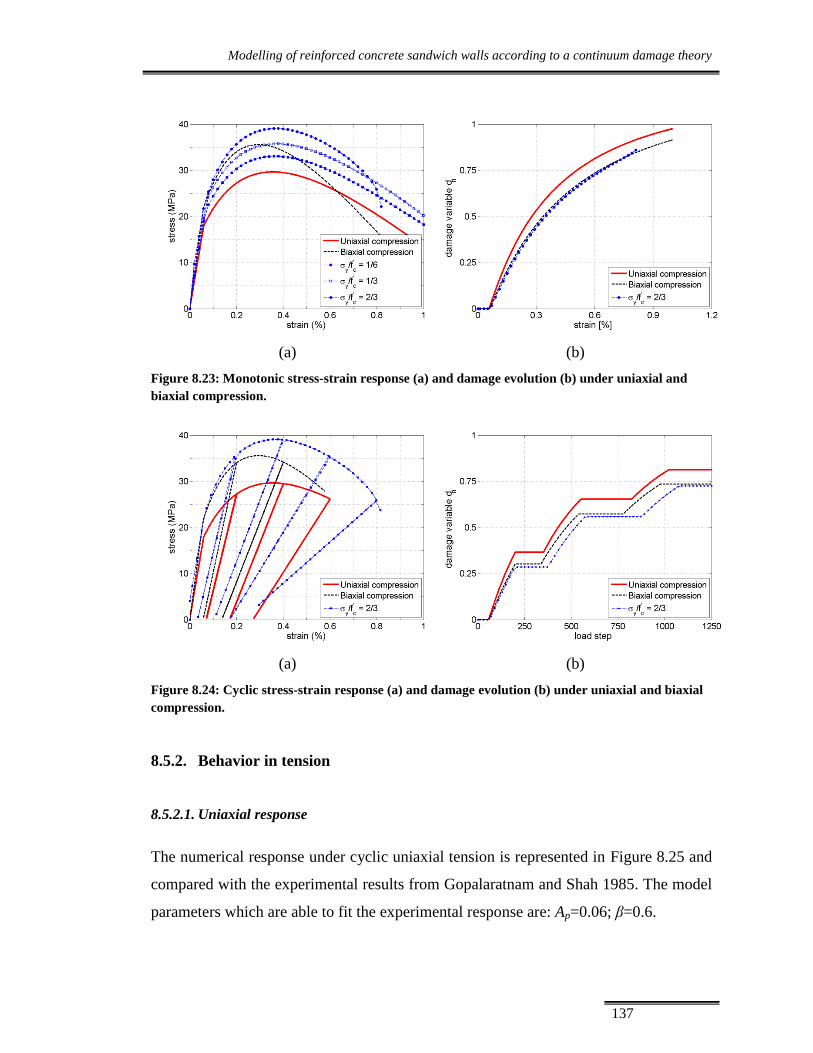
Modelling of reinforced concrete sandwich walls according to a continuum damage theory
137
(a) (b)
Figure 8.23: Monotonic stress-strain response (a) and damage evolution (b) under uniaxial and
biaxial compression.
(a) (b)
Figure 8.24: Cyclic stress-strain response (a) and damage evolution (b) under uniaxial and biaxial
compression.
8.5.2. Behavior in tension
8.5.2.1. Uniaxial response
The numerical response under cyclic uniaxial tension is represented in Figure 8.25 and
compared with the experimental results from Gopalaratnam and Shah 1985. The model
parameters which are able to fit the experimental response are: Ap=0.06; β=0.6.

Modelling of reinforced concrete sandwich walls according to a continuum damage theory
138
(a) (b)
Figure 8.25: Cyclic stress-strain response (a) and damage parameter evolution under uniaxial
tension (b).
It can be noted that the model is capable to capture the softening response after that the
tensile strength is reached. Also the stiffness degradation is well captured in an average
sense. Clearly, as already observed for the case of the cyclic compression, the
hysteretic loops of the unloading/reloading phase cannot be simulated by the present
model.
Attention should be focused on the residual strain after complete unloading: they
consistently increase even for relatively high strain and very low residual tensile
concrete strength. The numerical model can capture very effectively this effect through
the plasticity extended also for tensile stresses. The residual strains in tension are quite
important because they affect crack closure state at loading reversals and they become
particularly evident for cyclic shear tests of reinforced concrete membranes.
On the contrary, the gap between the experimental curve and the numerical one
immediately after the peak strength does not preclude the effectiveness of the model for
the purposes of the present work because of two reasons: the difference of the two
curves is relatively insignificant in terms of dissipated energy having the concrete
material a very low tensile peak strength compared to the compressive one; the post
crack behavior for reinforced concrete elements subjected to tension is characterized by
the steel response and by the narrow tension stiffening effect.

Modelling of reinforced concrete sandwich walls according to a continuum damage theory
139
The evolution of the damage variable dp is also shown in Figure 8.25. The damage
parameter increases drastically at the beginning of the softening branch and then it
approaches the unit asymptotically since the depletion of the fracture energy takes
place at strains much larger than the elastic limit.
8.5.2.2. Tension stiffening effects
As well known, the analyses of reinforced and prestressed concrete structures based on
a smeared crack approach generally include a tension stiffening relationship to estimate
the average post-cracking concrete response. Many such equations have been
developed over the years showing significant differences between each other (see
Bentz 2005). A simple way to include the tension stiffening effect in the 3D concrete
material model is to adjust the parameter Ap in order to match the desired tension-
stiffening equations. In this study the formulation introduced by Bentz 2005 is chosen
because it explicitly accounts for area reinforcement through the M parameter, defined
as the ratio between the area of concrete participating in tension stiffening and the bar
diameter. Figure 8.26 provides the comparison between the formulation proposed by
Bentz 2005 and the response of the present model for three different amount of
reinforcement (corresponding to M between 50 and 500). Ap decreases almost linearly
as M increase.
(a) (b)
Figure 8.26: (a) tension stiffening for different M (and corresponding Ap) values ; (b) Ap vs M.

Modelling of reinforced concrete sandwich walls according to a continuum damage theory
140
8.5.2.3. Biaxial tension and tension-compression
The numerical response for a biaxial isotropic tension stress state is represented in
Figure 8.27 and compared with the response in uniaxial tension. The parameters
adopted for the numerical simulations are: Ap=0.2, β=0.6. The peak strength in the case
of isotropic biaxial tension is reduced and the positive damage variable grows faster
with respect to the case of uniaxial tension.
Figure 8.27 and Figure 8.28 display the monotonic and cyclic responses in biaxial
tension-compression for the case of a constant tension in one direction (between 1/10 ft
and 0.5 ft).
The graphs show that the presence of tensile stresses strongly reduces the compression
peak strength. Furthermore, the ductility is strongly reduced.
The progression of the damage variables is also represented in Figure 8.27. It can be
noted that both positive damage and negative damage increase and that the negative
damage is higher with respect to case of uniaxial compression.
(a) (b)
Figure 8.27: Monotonic stress-strain response (a) and damage parameter evolution under uniaxial
and biaxial tension(b).

Modelling of reinforced concrete sandwich walls according to a continuum damage theory
141
(a) (b)
Figure 8.28: Monotonic stress-strain response (a) and damage evolution under tension-
compression (b).
(a) (b)
Figure 8.29: Cyclic stress-strain response (a) and damage evolution under uniaxial compression
and tension-compression (b).
8.5.3. Response under a more general load path
In order to highlight other features of the 3D Concrete Material model, the stress-strain
response under two slightly different load paths, namely load Path A and load Path B,
are displayed in Figure 8.30. The two load paths are characterized by an initial
incursion into tensile field up to the initial inelastic threshold leading to damage in
tension, followed by several cycles of compression-tension.
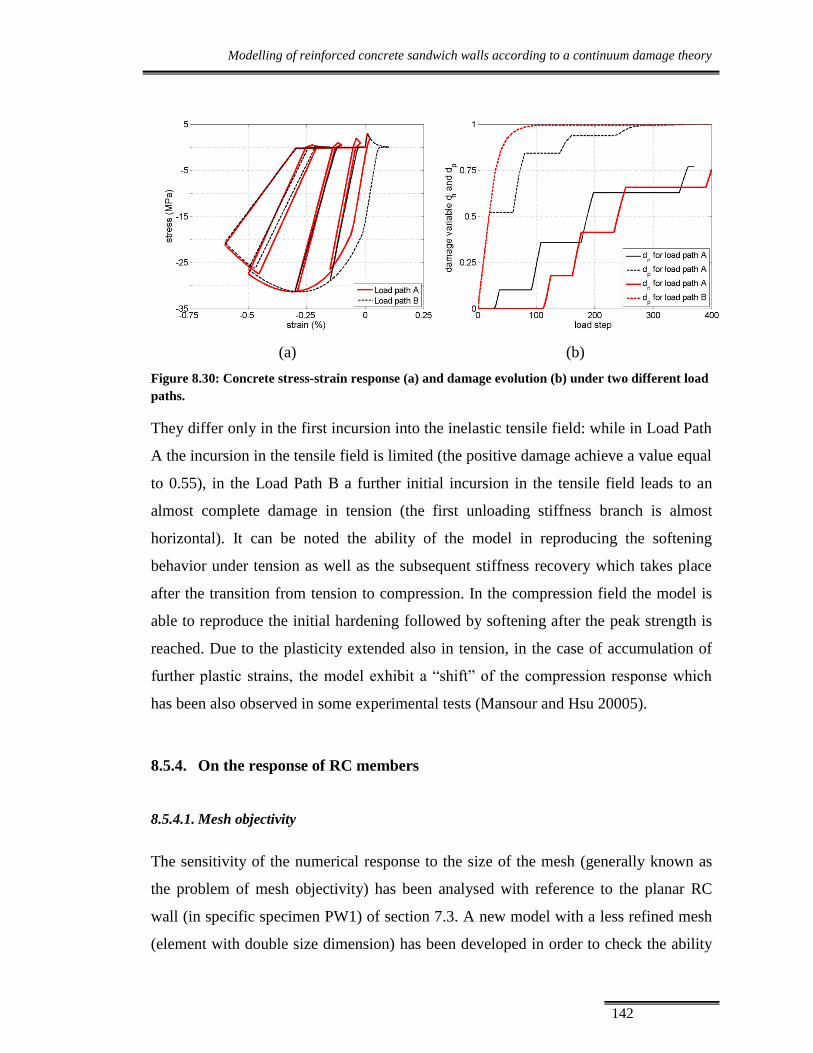
Modelling of reinforced concrete sandwich walls according to a continuum damage theory
142
(a) (b)
Figure 8.30: Concrete stress-strain response (a) and damage evolution (b) under two different load
paths.
They differ only in the first incursion into the inelastic tensile field: while in Load Path
A the incursion in the tensile field is limited (the positive damage achieve a value equal
to 0.55), in the Load Path B a further initial incursion in the tensile field leads to an
almost complete damage in tension (the first unloading stiffness branch is almost
horizontal). It can be noted the ability of the model in reproducing the softening
behavior under tension as well as the subsequent stiffness recovery which takes place
after the transition from tension to compression. In the compression field the model is
able to reproduce the initial hardening followed by softening after the peak strength is
reached. Due to the plasticity extended also in tension, in the case of accumulation of
further plastic strains, the model exhibit a “shift” of the compression response which
has been also observed in some experimental tests (Mansour and Hsu 20005).
8.5.4. On the response of RC members
8.5.4.1. Mesh objectivity
The sensitivity of the numerical response to the size of the mesh (generally known as
the problem of mesh objectivity) has been analysed with reference to the planar RC
wall (in specific specimen PW1) of section 7.3. A new model with a less refined mesh
(element with double size dimension) has been developed in order to check the ability

Modelling of reinforced concrete sandwich walls according to a continuum damage theory
143
of the characteristic length (Oliver 1989) to provide mesh objectivity. The values of the
3D concrete material parameters adopted for the new model are the same as those used
for the original model (see Table 8.5), excluding parameter An whose values is
determined in order to satisfy the equality of energy of fracture (in compression) for the
two models. A value of An equal to 2.0 is adopted for the new model. In order to
appreciate the ability of the model to provide mesh-independent results, two new
models are developed:
Model Double size mesh A (An=1.5 as the original model).
Model Double size mesh B (An=2.0).
Figure 8.31 compares the monotonic push-over response and the cyclic response of the
original model and the two new models. Both pushover response and cyclic response
shows that if the material parameters are adjusted on the base of the mesh dimension,
the model is able to effectively provide mesh-independent results. The contour maps of
the damage variable dn leading to DSL6 (i.e. dn approaches to 1.0) are displayed in
Figure 8.32. It can be noted that all the three damage patterns are qualitatively similar.
However, for the model Double size mesh A the DSL6 is reached at 2.5% drift, while
for the other two models it is reached at 1.6% drift. Therefore the model Double size
mesh A is much more ductile and is not consistent with the experimental observations.
(a) (b)
Figure 8.31: Monotonic Push-over response (a) and cyclic response (b) of the two new models
(Double size mesh A and Double size mesh B) compared with the original model (Original mesh).
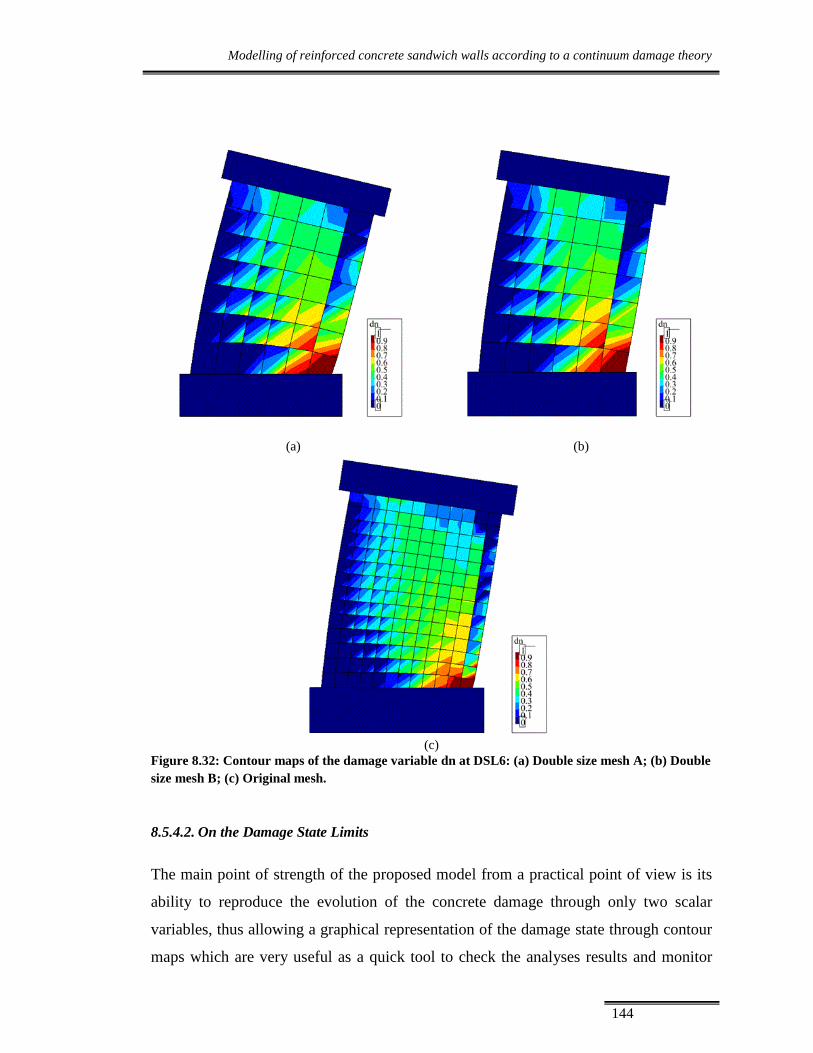
Modelling of reinforced concrete sandwich walls according to a continuum damage theory
144
(a) (b)
(c)
Figure 8.32: Contour maps of the damage variable dn at DSL6: (a) Double size mesh A; (b) Double
size mesh B; (c) Original mesh.
8.5.4.2. On the Damage State Limits
The main point of strength of the proposed model from a practical point of view is its
ability to reproduce the evolution of the concrete damage through only two scalar
variables, thus allowing a graphical representation of the damage state through contour
maps which are very useful as a quick tool to check the analyses results and monitor

Modelling of reinforced concrete sandwich walls according to a continuum damage theory
145
the evolution of damage. Moreover, within the framework of performance based
design, most of the current seismic design codes prescribe the achievement of multiple
performance levels under different seismic design earthquakes (i.e. multiple
performance objectives). Thus, the possibility of checking the reaching of code limit
states through the use of contour maps appears really appealing. On the other hand, the
simple representation of the contour maps of the damage variables does not allow the
practitioner to a simple evaluation of the state of damage. Correlations between specific
values of damage variables and physical damage mechanisms are necessary. For the
case of common structures made of reinforced concrete walls the negative damage
variable is the most significant variable (note that in the cases of cracks prevention or
limitation is required the variable dp plays an important rule).
In this section a simple approach to provide Damage State Limits (DSLs) for reinforced
concrete walls based on the use of the contour maps of the damage variable dn is
proposed. Values of the negative damage dn are correlated to the local stress-strain
responses of concrete and steel. In this study, the following six DSLs are introduced:
DSL1. At this damage level the longitudinal rebars approach to the yielding and
therefore can be considered as the “yielding point”;
DSL2. At this level the concrete approaches its peak strength;
DSL3. At this level the concrete strength starts to decay and initial spallling
could be observed;
DSL4. At this level the concrete residual strength is approximately equal to 0.8
the peak strength; spalling could be observed.
DSL5. At this level the concrete residual strength is approximately equal to 0.1
the peak strength; concrete approaches crushing;
DSL6. At this level the concrete has no residual strength. Typically also the
rebars may fail due to buckling (or due to low-cycle fatigue in the case of cyclic
loads).

Modelling of reinforced concrete sandwich walls according to a continuum damage theory
146
(a) (b)
Figure 8.33: (a) DSLs superimposed to the concrete stress-strain response at the base of the
boundary element; (b) DSLs superimposed to the steel longitudinal reinforcement stress-strain
response at the base of the boundary element.
It has to be noted that the values of the damage variable leading to each DSLs are in
general dependent on geometrical aspects, reinforcement layouts, materials mechanical
properties. Values of dn leading to each DSL for the studied RC walls are collected in
Table 8.14.
Table 8.14: Values of damage variable dn leading to each DSL.
DSL 1 2 3 4 5 6
dn 0.6 0.7 0.8 0.9 0.95 1.0
A more general and rigorous approach to obtain a global damage index (in a integral
form) is actually under developments based on the approach by Scotta et al. 2009
proposed for beam elements.
8.6. CONCLUSIONS
In this chapter a 3D Concrete Material model has been used to simulate the seismic
response of RC shear walls. The model has been developed by Tesser (University of
Padua) and his co-workers (Tesser et al. 2011) and actually is not still completely
validated. For this reason before applying the model for the simulation of the

Modelling of reinforced concrete sandwich walls according to a continuum damage theory
147
experimental tests on the RC sandwich panel walls introduced in chapter 5, numerical
simulations of conventional RC shear walls has been conducted. Results show that the
model allows to accurately simulate the cyclic response of RC shear walls. Then the
model has been used to simulate the cyclic tests performed on the sandwich walls. It
has been pointed out that the introduction of additional elements to simulate the sliding
at the base of the panels has been necessary to appropriately reproduce the hysteretic
response of the panel. The results highlights that special attention has to be devoted in
the design of the connections at the base provided that they play a significant rule in the
seismic response of the studied RC sandwich wall.

The seismic design of reinforced concrete sandwich squat walls
148
9. The seismic design of reinforced concrete
sandwich squat walls
9.1. INTRODUCTION
The actual Italian building code (NTC08) does not provide specific design provisions
for the seismic design of reinforced concrete sandwich walls. Recommendations are
given to for the seismic design of RC shear walls. First of all, the recommended
behavior factor q (in the CDB class of ductility) is around 3 for uncoupled wall
structures and around 3-4 for coupled shear wall structures.
Modifications to the actions (as obtained from linear analyses) to be applied along the
height of the wall are suggested in order to account for the shear-flexural interaction.
Shear strength can be estimate based on classical strut and tie mechanism, i.e.
following the approach for slender elements. However, it is explicitly recommended to
account for the potential of sliding shear mechanisms. Moreover special attention
should be devoted in order to prevent from brittle sliding shear failure at the connection
between consecutive vertical walls.
In this chapter, which concludes the part B of the thesis, considerations for the seismic
design of the studied reinforced concrete sandwich walls are provided.
9.2. ON THE MODELLING OF REINFORCED CONCRETE SADWICH
SQUAT WALLS
The results of experimental tests and numerical simulations presented in the Part B of
the thesis showed that the studied reinforced concrete squat sandwich walls exhibit a
seismic behavior similar to that of conventional reinforced concrete shear walls
designed with modern seismic details.

The seismic design of reinforced concrete sandwich squat walls
149
First of all, in the case of simple linear analyses a cracked inertia equal to 0.15 of the
gross section inertia should be adopted to account for the sudden section partialization.
A behavior factors equal to 4.0 (the value is conservative) can be adopted. The
suggestions are based on both experimental results and numerical simulations.
In chapter 7 it has shown that conventional shear theories for reinforced concrete shear
panels (MCFT and RA-STM) are able to reasonably estimate the shear strength of the
full panels. If appropriate material constitutive equations are introduced (RCFT) the
whole shear envelope response can be well reproduced. It has to be noted that the
shotcrete of the tested walls exhibited a sudden degradation after that the peak tensile
strength is reached, thus its contribution to the shear strength of the panel may be
ignored for design purposes. A design simple formulation for the evaluation of the
shear strength has been proposed. The formula can be used in the case of simple
strength-based design. In the case of more complex seismic design (e.g. pushover
analyses) the adjusted Refined Compression Field theory can be used to obtain the
complete non-linear backbone curve representative of the shear behavior of the panel.
In chapter 8 it has shown that the continuum damage approach for conventional
reinforced concrete elements can be successfully used to accurately reproduce the
hysteretic behavior of the studied panels. The approach allows to well reproduce the
damage progression and can be used when nonlinear time history analyses are required.
Moreover, it has been noted that the connection at the base may have a significant
influence on the seismic behavior of the walls and they have to be designed in an
appropriate way. In more detail, a prior yielding of the connectors at the base may
induce some sliding at the base which may prevent from large wall damages and
therefore increase the ductility of the system. Details have to be included in order to
hallow for the sliding at the base.
The results obtained through the numerical analyses also allowed to introduce damage
limit states (in terms of interstorey drift).

The seismic design of reinforced concrete sandwich squat walls
150
9.2.1. Design shear strength and damage state limits
In this sections the design formula for the studied panels has obtained from the results
of the experimental tests and numerical simulations presented in the chapters 7 and 8
are here summarized. The results have been already reported in the previous chapters
but they are here summarized for the sake of clearness.
The design shear strength of a full panel is given by the following relations, based on
the continuum mechanic approach and on the experimental evidence of negligible
concrete contribution in tension:
1 /d s yd m
LV A f
s
( 9.1 )
Where As is area of the cross section of the mesh grid, L is the length of the panel, s is
the size of the mesh grid, fyd is the steel design stress )15.1/( ykyd ff , v is the non-
dimensional parameter defined as ( cdftLN ), N is the axial load applied to the
panel, t is the thickness of the panel, fcd is the concrete design strength )5.1/( ckcd ff
and ρm is the mechanical reinforcement ratio (ρm =As ∙fyd /(t∙ s∙ fcd) ). Note that the
equation is valid for a square mesh grid.
Damage state limits were obtained from both experimental tests and numerical
simulations according to the continuum damage approach. They are expressed in terms
of intersory drift. Table 9.1 reports the values (conservative) of the DSLs which can be
assumed as the code Immediate Occupancy (IO), Occupancy (O), Life Safety (LS), and
Near Collapse (NC) limit states for the case of base connections allowing sliding at the
base.
If the base connections do not allow for the sliding at the base the results of numerical
analyses indicate a less ductile behavior. In this case the values collected in Table 9.2
appear more reasonable. Note that the values are not yet supported by experimental
verification and therefore less reliable of the ones supported by experimental results.
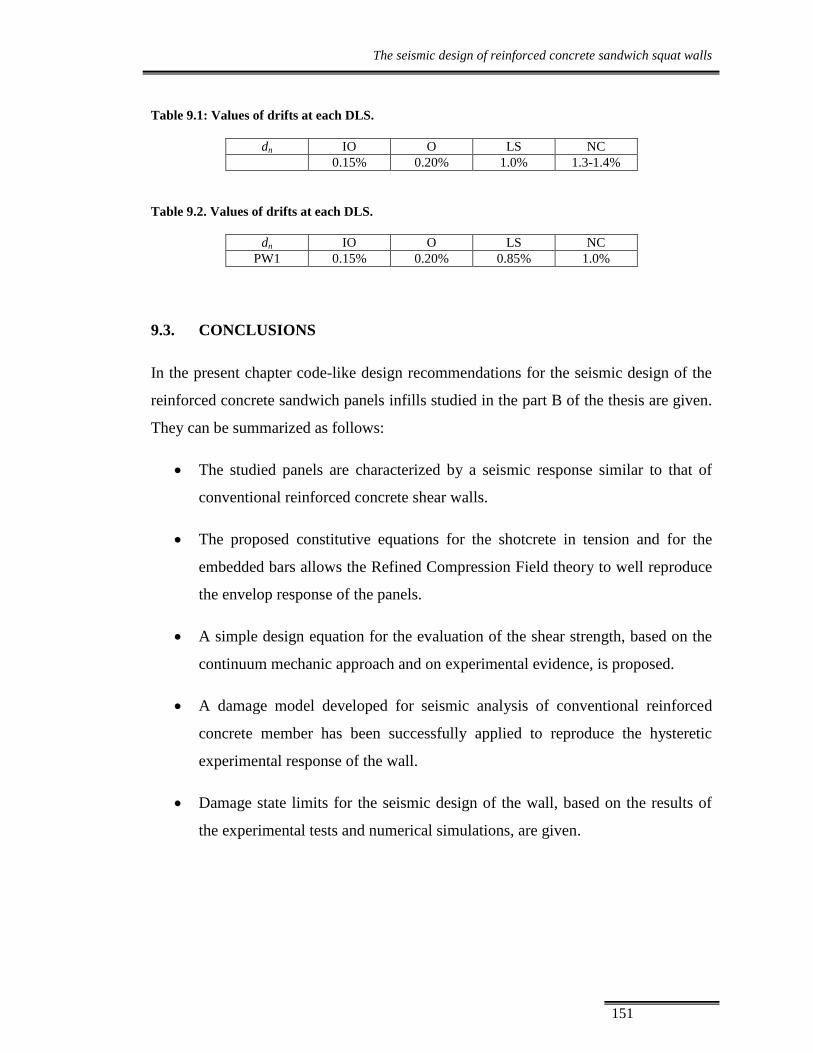
The seismic design of reinforced concrete sandwich squat walls
151
Table 9.1: Values of drifts at each DLS.
dn IO O LS NC
0.15% 0.20% 1.0% 1.3-1.4%
Table 9.2. Values of drifts at each DLS.
dn IO O LS NC
PW1 0.15% 0.20% 0.85% 1.0%
9.3. CONCLUSIONS
In the present chapter code-like design recommendations for the seismic design of the
reinforced concrete sandwich panels infills studied in the part B of the thesis are given.
They can be summarized as follows:
The studied panels are characterized by a seismic response similar to that of
conventional reinforced concrete shear walls.
The proposed constitutive equations for the shotcrete in tension and for the
embedded bars allows the Refined Compression Field theory to well reproduce
the envelop response of the panels.
A simple design equation for the evaluation of the shear strength, based on the
continuum mechanic approach and on experimental evidence, is proposed.
A damage model developed for seismic analysis of conventional reinforced
concrete member has been successfully applied to reproduce the hysteretic
experimental response of the wall.
Damage state limits for the seismic design of the wall, based on the results of
the experimental tests and numerical simulations, are given.

Conclusions and future developments
152
10. Conclusions and future developments
The study presented in this dissertation is focused on the analysis of the seismic
response of two-dimensional squat elements and their effects to the behavior of
building structures. Part A has been devoted to unreinforced masonry infills and in
detail to the first developments toward a seismic-resistant unreinforced masonry infill
system of superior seismic performances. Part B has been devoted to a specific
reinforced concrete sandwich wall system. Summary and detailed discussions have
been taken up at the end of the relevant chapters. The purpose of this chapter is to
recapitulate the main findings, and to suggest some further research directions.
10.1. MAIN CONCLUSIONS OF PART A
Part A begins with a comprehensive review of modelling techniques and code
provisions for infilled frame structures. Then state-of-the-practice techniques are
applied for a real case to test the ability of actual modeling techniques to reproduce
observed behaviors. The first developments toward a seismic-resistant unreinforced
masonry infill system are presented. Design recommendations for the seismic design of
the seismic-resistant masonry infills are finally provided. In summary, the following
conclusions are drawn:
The nonlinear equivalent strut model appears appropriate for the seismic
analyses of infilled frame structures and the actual best candidate to be
suggested for code-like analyses.
The preliminary results of the experimental tests on the single innovative
materials (clay bricks with alumina-based nanoparticles and additivated mortar)
show that the masonry assembly could potentially be characterized by superior
seismic performances.

Conclusions and future developments
153
Design recommendations for the seismic design of the innovative infill are
proposed. In detail the use of the nonlinear equivalent strut model is suggested.
Infill expected strengths have been identified through the results of the
preliminary experimental tests.
10.2. MAIN CONCLUSIONS OF PART B
Part B is focused on the study of the seismic behavior of a specific reinforced concrete
sandwich panel system. First, the results of in-plane psuudostatic cyclic tests are
described. Conventional compression field theories are then applied to study the
monotonic shear response of the panels, while the panel hysteretic response is studied
according to a continuum damage model. Design recommendations for the seismic
design of the studied reinforced concrete sandwich walls are provided. In summary, the
following conclusions are drawn:
The studied RC sandwich squat walls are characterized by seismic
performances (in terms of strength and dissipation properties) comparable to
that of conventional reinforced concrete shear walls of similar geometrical
(aspect ratio) and mechanical (reinforcement ratios) properties.
Refinements to the compression field theories have been introduced in order to
better simulate the monotonic envelope response of the panels. The refinements
deal with the introduction of a new constitutive model for the shotcrete in
tension and for the embedded bars. A simple formula for the estimation of the
shear strength is proposed.
The hysteretic response of the walls has been studied through a continuum
damage model. Damage state limits have been identified.
Design recommendations for the seismic design of the innovative infill are
proposed. In detail: (i) cracked stiffness and behavior factors to be used for
linear analyses; (ii) design equations for the shear strength; (iii) damage state
limits to be used for nonlinear analyses.

Conclusions and future developments
154
10.3. FUTURE DEVELOPEMENTS
A list of future developments releted to the research works presented in this thesis are
here summarized.
In the Part A of the thesis, presenting the first development toward a seismic-resistant
infill system, only preliminary results have been presented. Therefore a number of
issues are still to be addressed:
The complete mechanical characterization of the single components (masonry
bricks and additivated mortar). The first formulation of the “nano-additivated”
clay brick mixture should be refined by further investigation on the influence of
others alumina-based nanoparticles.
The experimental characterization of the innovative masonry assembly. In more
details:
o triplet tests and diagonal compression tests will be carried out on small
assemblies. These experimental tests should allow to evaluate the
expected (design) shear strength of the masonry.
o Cyclic tests on full-scale masonry infills. These tests will be useful in
order to evaluate the actual mechanisms of failure of the innovative
infills and therefore to verify the effectiveness of the design strength
formula. Moreover the experimental tests will also allow to evaluate
ultimate deformation capacities.
As far as Part B of the thesis, dealing with the seismic response of specific RC
sandwich panels, is concerned, additional studies related to the damage model used to
develop the numerical simulations should be carried out:
the 3D damage model could be used in order to simulate recent shake table tests
performed on a full-scale three-storey building made entirely of RC sandwich
panels. The simulations could be useful in order to:
Conclusions and future developments
155
o check the ability of the model in reproducing the response of more
complex 3D structures.
o try to better interprete some local responses obtained from the
experimental tests (i.e. comparisons of stress.-strain responses at critical
locations, damage evolution at critical locations, …)
Additional parameteric analyses could be developed (at the material level) to
further evaluate the effect of the single model parameters in order to provide a
guide to easly select their values. This phase should be of fundamental
importance to allow practical engineers to use the model for design purposes.

15
6
Appendix 1: Database of experimental tests on masonry specimens
from the scientific literature.
Table A1.1: Bricks database.
Author/Product Brick type Brick
geometry[cm] strength
Elastic
modulus
Poisson
ratio
Compression [MPa] Tensile [MPa] [MPa]
perpendicular parallel indirect shear direct
Braga et al. full clay 25x5.5x12
4.13
Jukes and Riddington full clay 21.5x6.5x10.25
Jukes and Riddington hallow clay 21.5x6.5x10.25
67.9
Jukes and Riddington hallow clay 21.5x6.5x10.25
18.3
Meli hallow clay
19.62
Meli hallow clay
21.09
Meli hallow clay
14.71
Laner hallow clay 40x20x20
27.2
Laner hallow clay
25x12x12
59
Laner hallow clay
30x15x25
33.3
Page concrete brick 39x19x14
32
Unipor full clay
36.5x23.8x24.7
2.3
Porotherm full clay
38x24x19.9 2

15
7
Author/Product Brick type Brick
geometry[cm] strength
Elastic
modulus
Poisson
ratio
Compression [MPa] Tensile [MPa] [MPa]
perpendicular parallel indirect shear direct
Perlater full clay
38x25x19 1.5 6
Thermo plan full clay
36.5x24.7x24.9
7.5
Gabor et al. full clay
13000 0.2
Atkinson 19.3x9.2x5.5
67.8 3.14
14701 0.22
Capozucca et al. hallow clay
30x24x19
21
Capozucca et al. hallow clay
30x27x19
24
MURATURA PORTANTE
IN ZONA SISMICA, andil hallow clay
6.81 20.42
MURATURA PORTANTE
IN ZONA SISMICA, andil hallow clay
9.1 20.96
MURATURA PORTANTE
IN ZONA SISMICA, andil hallow clay
7.95 20.43
Da Porto et al. hallow clay
24.9x29.8x24.1 5.94
3547 0.21
Da Porto et al. hallow clay
24.4x29.1x25.2
18.26
7368 0.38
Valluzzi et al. hallow clay
24.5x30.2x22.8
17.3
Valluzzi et al. hallow clay
24.5x29.3x19.7
16.1
Valluzzi et al. hallow clay
25.4x30x25
17.2
Beconcini et al. hallow clay
30x25x25
10
0.68

15
8
Table A1.2: Mortar database.
Authors/product Mortar type specimen strength Elastic
modulus
Poisso
n
ratio
Compression [MPa] Tensile [MPa] [MPa]
brasilian direct flexure
Cantalupi aerea
0.2
Cantalupi idraulica
2
Cantalupi cementizia
2.2
Clericetti aerea
0.2
Clericetti idraulica
0.6
Clericetti cementizia
1.5
Russo aerea con calce
0.2
Russo aerea con
calce+pozzolanica
0.8
Russo cementizia
1.3
Fabbrichesi malta a presa lenta
2.2
Fabbrichesi malta a presa
rapida
1
Marcari pozzolanica
4.5
1.57
Vermeltfoort preconfezionata 23
5.5
Anzani et al. idraulica
9
1.9
Mayorca and Meguro cementizia
8.2
0.7
8600 0.2
Valluzzi idraulica
1.58 0.11 0 0.63 2590
Capozucca 24.5
4.6 0
Bernardini et al. pozzolanica
1.1
Tubi et al. bastarda
2.67

15
9
Augenti and Romano pozzolanica
0 1000
Ferrier et al. cementizia
0 6000 0.2
Atkinson cilindro 4.7 0.76
0 1050 0.06
Authors/product Mortar type specimen strength Elastic
modulus
Poisso
n
ratio
Atkinson cubo 9.22 0.94
0 2109 0.05
Capozucca et al. M1 as per UNI EN
1015 24.5
4.6
MURATURA PORTANTE
IN ZONA SISMICA, andil
UNI EN 1015 14
4 8500
Da Porto et al. cubo 9.22
4.28 9984 0.1
Valluzzi et al. calce cemento M2 cubo 8.2
3.02 8809 0.28
Valluzzi et al. fibrorinforzata cubo 22
5 7000 0.14 –
0.21
Laboratorio prove materiali
Pietro Pisa malta indurita 4x4x15.8 cm 62
5.8

16
0
Table A1.3: Masonry database.
Authors/product Compression strength
[MPa]
Elastic modulus
[MPa]
Shear
Diagonal compression
[MPa]
Triplets
[MPa]
Friction
coefficient Poisson
Borri et al. 0.85 2000 0.2
Corradi et al.
0.05
Brignola et al.
0.05
Brignola et al.
0.185
Brignola et al.
0.318
Brignola et al.
0.411
Da Porto et al. 6.95 4424 0.206
0.45
Da Porto et al.
5.5 4300 0.35
0.25 -
0.36
Capozucca et al.
0.95
Capozzucca et al.
0.39
Beconcini et al. 2.9 6000 0.2
Da Porto et al. 5.2 6500 0.15 0.4 0.77 - 1.9
Da Porto et al. 4 5000 0.7 0.2 0.7 - 1.61
Rotunno.
0.1 0.044
Rotunno.
0.12 0.531
Rotunno.
0.2 0.212

16
1
Appendix 2: The first experimental tests on the innovative masonry
infills
Table A2.1: Compression tests on standard specimens (S).
Specimen Frupture ft a1 a2 a mean h1 h2 h mean w1 w2 w mean Area* Weight
[daN] [MPa] [mm] [mm] [mm] [mm] [mm] [mm] [mm] [mm] [mm] [mm
2] [g]
S1 4420 53.35 29.12 29.23 29.175 27.77 27.79 27.78 28.42 28.37 28.40 828.4 38.4
S2 4625 55.29 29.27 28.88 29.075 27.94 27.8 27.87 28.74 28.8 28.77 836.5 38.3
S3 4350 52.81 28.55 29.15 28.85 28.01 27.89 27.95 28.68 28.42 28.55 823.7 37.9
S4 6478 78.60 29.12 29.03 29.075 27.76 27.8 27.78 28.35 28.34 28.35 824.1 38.4
S5 4275 51.08 29.31 29.17 29.24 27.69 27.68 27.69 28.7 28.54 28.62 836.8 38.1
S6 5567 66.81 29.34 29.07 29.205 27.43 27.53 27.48 28.55 28.51 28.53 833.2 37.7
S7 6912 83.25 29.32 29.26 29.29 27.89 27.82 27.86 28.37 28.32 28.35 830.2 38.8
S8 4305 51.58 29.11 29.17 29.14 27.89 27.87 27.88 28.78 28.5 28.64 834.6 38.4
S9 5018 60.21 29.21 29.13 29.17 27.87 27.87 27.87 28.6 28.54 28.57 833.4 38.2
S10 4850 57.96 29.44 29.45 29.445 27.98 27.97 27.98 28.46 28.38 28.42 836.8 39.1
S11 4083 48.32 29.47 29.12 29.295 28.03 28.02 28.03 28.86 28.83 28.85 845 38.6
S12 3670 43.32 29.45 29.53 29.49 28.07 28.05 28.06 28.73 28.73 28.73 847.2 38.6

16
2
Table A2.2: Bending tests on standard specimens (S).
Specimen Fu ft l h1 h2 h3 h mean w1 w2 w3 w mean Area* weight
[daN] [MPa] [mm] [mm] [mm] [mm] [mm] [mm] [mm] [mm] [mm] [mm
2] [g]
S1 199.3 22.68 105.87 27.88 28.06 28.07 28.00 28.34 28.92 28.47 28.58 800.2 140.8
S2 211.5 24.13 106.06 28.02 27.97 27.97 27.99 28.34 28.88 28.37 28.53 798.5 140.5
S3 210 23.86 105.97 27.94 28.02 28.08 28.01 28.37 28.88 28.55 28.60 801.2 141.5
S4 238.5 27.87 105.93 27.61 27.63 27.63 27.62 28.44 28.86 28.51 28.60 790.1 140.5
S5 291.8 31.84 105.29 28.31 28.6 28.73 28.55 28.51 29.05 28.47 28.68 818.6 147.4
S6 275.3 29.63 105.05 28.61 28.66 28.89 28.72 28.42 29.17 28.58 28.72 824.9 148.1
S7 257.5 28.25 105.27 28.47 28.48 28.37 28.44 28.25 29.22 28.74 28.74 817.3 146
S8 247.5 28.45 104.99 27.62 27.84 27.95 27.80 28.38 29.39 28.32 28.70 797.9 144
S9 237.3 26.60 105.08 28.06 28.15 28.13 28.11 28.32 29.45 28.59 28.79 809.3 145.3
S10 219.8 24.83 105.14 28.04 28.05 28.04 28.04 28.3 29.31 28.51 28.71 805 145.2

16
3
Table A2.3: Compression tests on standard+ sawdust specimens (P).
Specimen Frupture ft a1 a2 a mean h1 h2 h mean w1 w2 w mean Area* Weight
[daN] [MPa] [mm] [mm] [mm] [mm] [mm] [mm] [mm] [mm] [mm] [mm
2] [g]
P1 3015 36.32 29.05 29.25 29.15 27.96 27.99 27.98 28.24 28.72 28.48 830.2 35.1
P2 3090 36.13 29.53 29.61 29.57 28.02 28.01 28.02 28.94 28.9 28.92 855.2 36.4
P3 3965 48.10 28.91 29.11 29.01 28.03 28.03 28.03 28.51 28.32 28.42 824.3 35.4
P4 3090 37.27 29.04 29.12 29.08 28.02 28.03 28.03 28.3 28.72 28.51 829.1 35.6
P5 2993 35.41 29.3 29.17 29.235 28.01 28.02 28.02 28.91 28.91 28.91 845.2 36.5
P6 2758 33.11 29.17 29.3 29.235 28.02 28.02 28.02 28.46 28.53 28.50 833.1 35.7
P7 2750 33.22 28.91 28.32 28.615 28.02 27.97 28.00 29.33 28.53 28.93 827.8 35.4
P8 3115 36.96 29.17 29.11 29.14 29.91 27.99 28.95 29.1 28.75 28.93 842.9 36.4
P9 3585 43.47 28.87 28.95 28.91 27.89 27.96 27.93 28.52 28.53 28.53 824.7 35.4
P10 3013 36.36 29.04 29.13 29.085 28.02 28 28.01 28.76 28.22 28.49 828.6 35.4
P11 2845 34.38 28.77 28.87 28.82 27.97 27.98 27.98 28.94 28.48 28.71 827.4 35.9
P12 3820 46.20 28.98 29.02 29 27.94 27.99 27.97 28.5 28.52 28.51 826.8 35.6

16
4
Table A2.4: Bending tests on standard + sawdust specimens (P).
Specimen Fu
[daN] ft l h1 h2 h3 h mean w1 w2 w3 w mean Area* weight
* MPa mm mm mm mm mm mm mm mm mm mm
2 g
P1 115.8 13.53 106.5 27.59 27.65 27.68 27.64 28.5 28.91 28.27 28.56 789.4 128.9
P2 133.3 15.17 106.57 28.02 28.04 27.88 27.98 28.51 29.03 28.34 28.63 801.0 130.1
P3 138.8 15.70 106.74 28.05 28.02 27.97 28.01 28.57 29.2 28.42 28.73 804.8 131
P4 151.8 17.09 106.63 27.85 28.07 28.17 28.03 28.63 29.32 28.54 28.83 808.1 131.8
P5 124 14.03 106.38 27.95 27.99 27.98 27.97 28.52 29.33 28.53 28.79 805.4 130.5
P6 124.8 14.18 106.53 28.02 27.97 27.96 27.98 28.41 29.23 28.32 28.65 801.8 130.2
P7 119.3 13.58 106.35 27.93 27.97 27.96 27.95 28.43 29.25 28.3 28.66 801.1 130.1
P8 93.5 10.63 106.44 27.95 27.95 28.02 27.97 28.43 29.27 28.31 28.67 802.0 130.1
P9 130.3 15.05 106.44 27.77 27.77 27.65 27.73 28.46 29.23 28.46 28.72 796.3 128.9
P10 117.5 13.20 106.56 28.01 27.95 27.98 27.98 28.41 29.29 29.29 29.00 811.3 129.9

16
5
Table A2.5: Compression tests on standard+ sawdust + nanoparticles specimens (N).
Specimen Frupture ft a1 a2 a mean h1 h2 h mean w1 w2 w mean Area* Weight
daN MPa mm mm mm mm mm mm mm mm mm mm
2 g
N1 2483 31.06 28.42 27.94 28.18 28.01 28.14 28.08 28.35 28.39 28.37 799.5 33.9
N2 2255 27.44 28.77 28.61 28.69 27.95 28 27.98 28.4 28.89 28.65 821.8 34.5
N3 2593 32.26 28.6 27.96 28.28 27.7 27.76 27.73 28.46 28.38 28.42 803.7 33.7
N4 2663 31.84 29.17 29.09 29.13 27.95 27.96 27.96 28.68 28.75 28.72 836.5 35.2
N5 2535 30.41 29.1 29.1 29.1 27.97 28.01 27.99 28.92 28.37 28.65 833.6 35.2
N6 3245 39.27 29.2 29.18 29.19 27.97 27.89 27.93 28.36 28.26 28.31 826.4 35.1
N7 2813 33.81 29.2 29.05 29.125 27.97 27.97 27.97 28.49 28.65 28.57 832.1 35.1
N8 2835 33.85 29.13 29.07 29.1 27.97 27.98 27.98 28.67 28.89 28.78 837.5 35.3
N9 3450 41.72 29.14 29.18 29.16 27.97 27.99 27.98 28.49 28.23 28.36 827.0 35.1
N10 2883 34.87 29.14 29.23 29.185 27.96 27.85 27.91 28.38 28.28 28.33 826.8 35
N11 2988 36.25 29.04 29 29.02 28.01 27.99 28.00 28.48 28.32 28.40 824.2 35
N12 3158 39.90 29.19 29.06 27.94 27.94 27.96 27.95 28.3 28.35 28.33 791.4 35
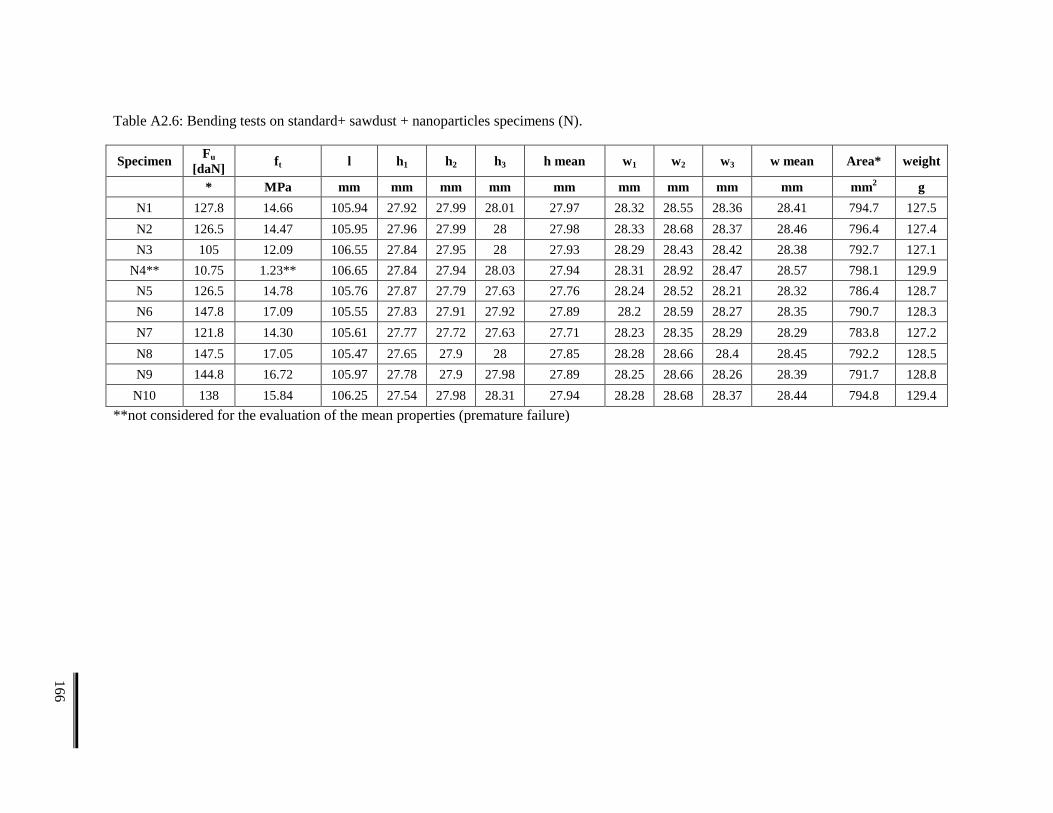
16
6
Table A2.6: Bending tests on standard+ sawdust + nanoparticles specimens (N).
Specimen Fu
[daN] ft l h1 h2 h3 h mean w1 w2 w3 w mean Area* weight
* MPa mm mm mm mm mm mm mm mm mm mm
2 g
N1 127.8 14.66 105.94 27.92 27.99 28.01 27.97 28.32 28.55 28.36 28.41 794.7 127.5
N2 126.5 14.47 105.95 27.96 27.99 28 27.98 28.33 28.68 28.37 28.46 796.4 127.4
N3 105 12.09 106.55 27.84 27.95 28 27.93 28.29 28.43 28.42 28.38 792.7 127.1
N4** 10.75 1.23** 106.65 27.84 27.94 28.03 27.94 28.31 28.92 28.47 28.57 798.1 129.9
N5 126.5 14.78 105.76 27.87 27.79 27.63 27.76 28.24 28.52 28.21 28.32 786.4 128.7
N6 147.8 17.09 105.55 27.83 27.91 27.92 27.89 28.2 28.59 28.27 28.35 790.7 128.3
N7 121.8 14.30 105.61 27.77 27.72 27.63 27.71 28.23 28.35 28.29 28.29 783.8 127.2
N8 147.5 17.05 105.47 27.65 27.9 28 27.85 28.28 28.66 28.4 28.45 792.2 128.5
N9 144.8 16.72 105.97 27.78 27.9 27.98 27.89 28.25 28.66 28.26 28.39 791.7 128.8
N10 138 15.84 106.25 27.54 27.98 28.31 27.94 28.28 28.68 28.37 28.44 794.8 129.4
**not considered for the evaluation of the mean properties (premature failure)
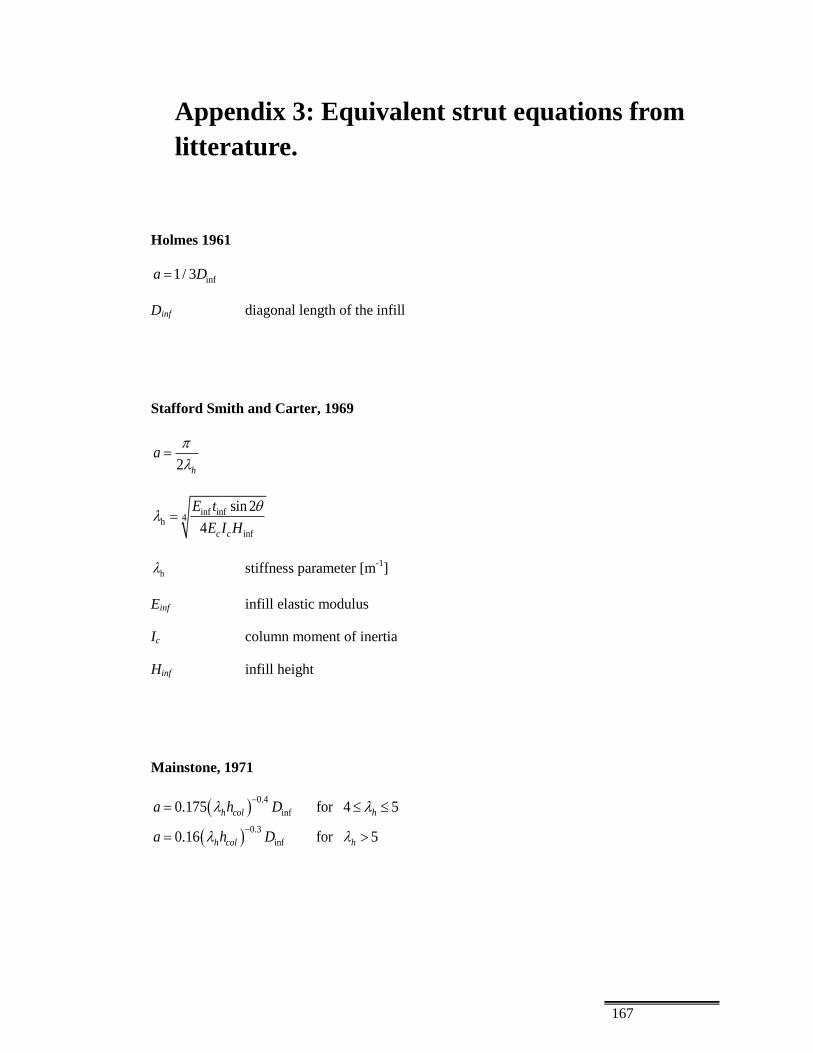
167
Appendix 3: Equivalent strut equations from
litterature.
Holmes 1961
inf1/ 3a D
Dinf diagonal length of the infill
Stafford Smith and Carter, 1969
2 h
a
inf inf4h
inf
sin 2
4 c c
E t
E I H
h stiffness parameter [m-1
]
Einf infill elastic modulus
Ic column moment of inertia
Hinf infill height
Mainstone, 1971
0.4
inf
0.3
inf
0.175 for 4 5
0.16 for 5
h col h
h col h
a h D
a h D

168
Liauw and Kwan, 1984
inf inf0.95 cos / ha H H
θ strut inclination
Decanni and Fantin, 1986
Two sets of equations:
1. Uncracked conditions
inf
inf
inf
inf
0.7480.085 for 7.85
0.3930.130 for 7.85
h
h
h
h
a DH
a DH
2. Cracked conditions
inf
inf
inf
inf
0.7010.010 for 7.85
0.4700.040 for 7.85
h
h
h
h
a DH
a DH
Moghaddam and Dowling, 1988
inf1/ 6 a D
Paulay and Priesteley, 1992
inf0.25 a D

169
Durrani and Luo, 1994
inf
0.14
inf
inf
sin 2
0.32 sin 2
6 tan
6 1
c c
b b
c c
a D
H Et
mE I b
E I Ha
E I Lm
effective width factor
Eb beam elastic modulus
Ec column elastic modulus
H interstorey heigth
Bennet et al. 1996
cosh
aC
C empirical constant based on infill damage
Al-Chaar, 2002
inf inf inf
inf
inf
inf
inf inf inf
inf
2.5740.083 1 for L /H 1.5
0.3905 0.7829
6.0270.1106 1 for L /H 1.0
h
h
a CDH
LC
H
a DH
Linear interpolation is required for aspect ratios between 1.0 and 1.5

170
Papia et al. 2003
*inf
2
' '2inf*
'2
1/
0.249 0.0116 0.567
'1
4 '
f c
f c b
ca D
z
c
E t h A lh
E A A hl
Ef elastic modulus of the frame
Ac column cross section
Ab beam cross section
l’ length of the frame
h’ height of frame to mid-height of beam

References
171
References
Al-Chaar, G.K., 2002. Evaluating Strength and Stiffness of Unreinforced Masonry
Infill Structures, US Army Corps of Engineering.
Altin, S., Ersoy, U., Tamkut, T., 1992. Hysteretic Response of Reinforced‐Concrete
Infilled Frames. J. Struct. Eng.
Amato, G., Cavaleri, L., Fossetti, M., & Papia, M. (2008). Infilled frames: influence of
vertical loads on the equivalent diagonal strut model. Procedings of 14th WCEE,
Beijing, China. CD-ROM, Paper, 05-01.
Asteris, P., 2008. Finite element micro-modeling of infilled frames. Electron. J. Struct.
Eng. 1–11.
Asteris, P.G., Antoniou, S.T., Sophianopoulos, D.S., Chrysostomou, C.Z., 2011.
Mathematical Macromodeling of Infilled Frames: State of the Art. J. Struct. Eng.
Asteris, P.G., Chrysostomou, C.Z., Giannopoulos, I.P., Smyrou, E., 2011. Masonry
infilled reinforced concrete frames with openings, COMPDYN 2011, III
ECCOMAS Thematic Conference on Computational Methods in Structural
Dynamics and Earthquake Engineering, Corfu, Greece, May 26-28, 2011.
ASCE/SEI 41 (2007) Seismic Rehabilitation of Existing Buildings, American Society
of Civil Engineers, Reston, Virginia.
ASCE-ACI Committee 445 on Shear and Torsion, 1998. Recent approaches to shear
design of structural concrete. J Struct Eng 124:1375–1417.
ASTM E 519-81 1981. Standard Test Method for Diagonal Tension (Shear) in
Masonry Assemblages, American Society for Testing Materials.
Beck H., 1962 Contribution to the analysis of coupled shear walls. Proc J Am Concr
Inst ;59:1055–70.
Bathe, K.-J., Dvorkin, E.N., 1985. Short Communication A Four-Node Plate Bending
Element Based On Mindlin/Reissner Plate Theory And A Mixed Interpolation.
Internarional J. Numer. Methods Eng. 21, 367–383.
Bazzurro, P., Alexander, D., Clemente, P., 2009a. The MW 6.3 Abruzzo, Italy,
Earthquake of April 6, 2009. EERI Special Earthquake Report. Earthq. Eng.

References
172
Belarbi, A., Hsu, T.T.C., 1994. Constitutive laws of concrete in tension and reinforcing
bars stiffened by concrete. ACI Struct. J. 91, 465–474.
Benayoune, A., Samad, A.A.A., Abang Ali, A.A., Trikha, D.N., 2007. Response of pre-
cast reinforced composite sandwich panels to axial loading. Constr. Build. Mater.
Benayoune, A., Samad, A.A.A., Trikha, D.N., Abang Ali, A.A., Ashrabov, A.A., 2006.
Structural behavior of eccentrically loaded precast sandwich panels. Constr. Build.
Mater.
Benayoune, A., Samad, A.A.A., Trikha, D.N., Ali, A.A.A., Ellinna, S.H.M., 2008.
Flexural behavior of pre-cast concrete sandwich composite panel – Experimental
and theoretical investigations. Constr. Build. Mater.
Benjamin, J., Williams, H., 1958. The behavior of one-story brick shear walls.
Bentz, E., 2005. Explaining the riddle of tension stiffening models for shear panel
experiments. J. Struct. Eng.
Bertero, V., Brokken, S., 1983. Infills in Seismic Resistant Building. J. Struct. Eng.
Brignola, A., Frumento, S., Lagomarsino, S., Podestà, S., 2008. Identification of Shear
Parameters of Masonry Panels Through the In-Situ Diagonal Compression Test.
Int. J. Archit. Herit.
Bush, T., Stine, G., 1994. Flexural behavior of composite precast concrete sandwich
panels with continuous truss connectors. PCI J.
Calderini, C., Cattari, S., Lagomarsino, S., 2010. The use of the diagonal compression
test to identify the shear mechanical parameters of masonry. Constr. Build. Mater.
Calderini, C., Lagomarsino, S., 2008. Continuum model for in-plane anisotropic
inelastic behavior of masonry. J. Struct. Eng.
Calvi, G.M., Bolognini, D., Penna, A., 2004. Seismic performance of masonry-infilled
R.C. Frames: Benefits of slight reinforcements, in: 6th Portoguese Congress on
Seismology and Earthquake Engineering.
Cavaleri, L., Fossetti, M., and Papia, M., 2005. Infilled frames: developments in the
evaluation of cyclic behavior under lateral loads. Structural Engineering and
Mechanics. 21:4, 469-494.
CEN., 2003a. Eurocode 8: Design of structures for earthquake resistance - Part 1:
General rules, seismic actions and rules for buildings, prEN 1998-1, December
2003, Brussels.

References
173
Cervera, M., Oliver, J., Faria, R., 1995. Seismic evaluation of concrete dams via
continuum damage models. Earthq. Eng. Struct. Dyn., 24(9), 1225-1245.
Chen, W. F., Saleeb, A. F., 1982. Constitutive equations for engineering materials (Vol.
1, p. 580). New York: Wiley.
Chioccarelli, E., Iervolino, I., 2010. Near-source seismic demand and pulse-like
records : A discussion for L ’ Aquila earthquake. Earthq. Eng. Struct. Dyn. 39,
1039–1062.
Chopra, A.K., Goel, R.K., 2002. A modal pushover analysis procedure for estimating
seismic demands for buildings. Earthq. Eng. Struct. Dyn. 31, 561–582.
Colangelo, F., 2005. Pseudo-dynamic seismic response of reinforced concrete frames
infilled with non-structural brick masonry. Earthq. Eng. Struct. Dyn. 34, 1219–
1241.
Collins, M.P., Mitchell, D., 1991. Prestressed concrete structures. Prentice Hall,
Englewood Cliffs
Crisafulli, F.J., 1997. Seismic behavior of reinforced concrete structures with masonry
infills. Civ. Eng.
Crisafulli, F.J., Carr, A.J., 2007. Proposed macro-model for the analysis of infilled
frame structures. Bull. New Zeal. Soc. Earthq. Eng. 40, 69–77.
Crisafulli, F., Carr, A., Park, R., 2000. Analytical modelling of infilled frame
structures-a general review. Bull. New Zeal. Soc. Earthq. Eng.
Das, D., Murty, C.V.R., 2004. Brick masonry infills in seismic design of RC framed
buildings : Part 1 — Cost implications 39–44.
Dawe, J.L., Seah, C.K., 1989. Behavior of masonry infilled steel frames. Can. J. Civ.
Eng.
Decreto Ministeriale 26-03-1980 (1980), Norme tecniche per l'esecuzione delle opere
in cemento armato normale, precompresso e per le strutture metalliche, Gazzetta
Ufficiale 28-06-1980 n.176 (in Italian)
Decreto Ministeriale 3-03-1975 N. 40 (1975), Disposizioni concernenti l'applicazione
delle norme tecniche per le costruzioni in zone sismiche, Gazzetta Ufficiale 8-4-
1975, n. 93 - suppl, Italy (in Italian)
Dhanasekhar, M., Page, A., 1986. The influence of brick masonry infill properties on
the behavior of infilled frames. ICE Proc.

References
174
Dolce, M., Cardone, D., Ponzo, F. C., Valente, C. 2005. Shaking table tests on
reinforced concrete frames without and with passive control systems. Earthquake
engineering & structural dynamics, 34(14), 1687-1717.
Durrani, A., Haider, S., 1996. Seismic response of RC frames with unreinforced
masonry infills. 14th World Conf. Earthq. Eng.
Dvorkin, E. N., & Bathe, K. J., 1984. A continuum mechanics based four-node shell
element for general non-linear analysis. Engineering computations, 1(1), 77-88.
Einea, A., Salmon, D., Tadros, M., Culp, T., 1994. A new structurally and thermally
efficient precast sandwich panel system. PCI J.
Fib Bulletin 24, 2003. Seismic assessment and retrofit of reinforced concrete buildings,
International Federation du Beton, Lausanne, Switzerland.
Kachanov, L., 1986. Introduction to continuum damage mechanics. Vol. 10. Springer,
1986.
Kappos, A. J., Ellul, F. 2000. Seismic design and performance assessment of masonry
infilled RC frames. In Proceedings of the 12th World Conference on Earthquake
Engineering, Paper (No. 989).
Klingner, R. E., Bertero, V. V., 1978. Earthquake resistance of infilled frames. Journal
of the structural division, 104(6), 973-989.
Fardis, M.N., Bousias, S.N., Franchioni, G., Panagiotakos, T.B., 1999. Seismic
response and design of RC structures with plan-eccentric masonry infills. Earthq.
Eng. Struct. Dyn. 28, 173–191.
Fardis, M.N., Panagiotakos, T.B., 1997a. Seismic design and response of bare and
masonry-infilled reinforced concrete buildings. Part II: Infilled Structures. J.
Earthq. Eng.
Fardis, M.N., Panagiotakos, T.B., 1997b. Seismic design and response of bare and
masonry-infilled reinforced concrete buildings. Part I: Bare Structures. J. Earthq.
Eng.
Faria, R., Oliver, J., Cervera, M., 1998a. A strain-based plastic viscous-damage model
for massive concrete structures. Int. J. Solids Struct. 35, 1533–1558.
Faria, R., Oliver, J., Cervera, M., 1998b. A strain-based plastic viscous-damage model
for massive concrete structures. Int. J. Solids Struct.

References
175
Filippou, F., Popov, E., Bertero, V., 1983. Effects of bond deterioration on hysteretic
behavior of reinforced concrete joints.
Flanagan, R., Bennett, R., 1999. In-plane behavior of structural clay tile infilled frames.
J. Struct. Eng.
Flanagan, R., Bennett, R., Barclay, G., 1992. Experimental testing of hollow clay tile
infilled frames.
Gambarotta, L., Lagomarsino, S., 1997. Damage model for the seismic response of
brick masonry shear walls. Part I: the mortar joint model and its applications.
Earthq. Eng. Struct. Dyn. 26, 423–439.
Gil-Martín, L., 2009. Refinements to compression field theory, with application to
wall-type structures. ACI Special Publication, 265
Gopalaratnam, V., Shah, S., 1985. Softening response of plain concrete in direct
tension. ACI J. Proc.
Goulet, C. A., Haselton, C. B., Mitrani‐Reiser, J., Beck, J. L., Deierlein, G. G., Porter,
K. A., Stewart, J. P., 2007. Evaluation of the seismic performance of a
code‐conforming reinforced‐concrete frame building—from seismic hazard to
collapse safety and economic losses. Earthquake Engineering & Structural
Dynamics, 36(13), 1973-1997.
Gulec, C., 2005. Ultimate shear strength of squat rectangular reinforced concrete walls.
Gulec, C., Whittaker, A., Stojadinovic, B., 2008. Shear strength of squat rectangular
reinforced concrete walls. ACI Struct. J.
Hashemi, S. A., and K. M. Mosalam. 2007. Seismic Evaluation of Reinforced Concrete
Buildings Including Effects of Infill Masonry Walls. Pacific Earthquake
Engineering Research Center.
Hashemi, A., Mosalam, K. M. 2006. Shake‐table experiment on reinforced concrete
structure containing masonry infill wall. Earthquake engineering & structural
dynamics, 35(14), 1827-1852.
Hashemi, A., Mosalam, K.M., 2006. Shake-table experiment on reinforced concrete
structure containing masonry infill wall 1827–1852.
Hendry, Arnold W., Bhek Pati Sinha, and S. R. Davies, eds. Design of masonry
structures. CRC Press, 2003.

References
176
Hidalgo, P. a., Ledezma, C. a., Jordan, R.M., 2002. Seismic Behavior of Squat
Reinforced Concrete Shear Walls. Earthq. Spectra 18, 287–308.
Holmberg A, Pelm E., 1986. Behavior of load bearing sandwich type structures
Handout 49, State institute for construction research Lund (Sweden).
Holmes, M., 1961. Steel frames with brickwork and concrete infilling. ICE Proc.
Institut canadien du béton précontraint, Mitchell, D. 1987. Prestressed concrete basics.
Canadian Prestressed Concrete Institute.
Ju, J., 1989. Energy-based coupled elastoplastic damage models at finite strains. J. Eng.
Mech.
Kabir, M., Hasheminasab, M., 2002. Mechanical properties of 3D wall panels under
shear and flexural loading. CSCE Conf.
Kakaletsis, D.J., Karayannis, C.G., 2008. Influence of Masonry Strength and Openings
on Infilled R/C Frames Under Cycling Loading. J. Earthq. Eng.
Karsan, I. D., & Jirsa, J. O., 1969. Behavior of concrete under compressive loadings.
Journal of the Structural Division.
Kaushik, H.B., Rai, D.C., Jain, S.K., 2006. Code Approaches to Seismic Design of
Masonry-Infilled Reinforced ConcreteFrames: A State-of-the-Art Review. Earthq.
Spectra 22, 961–983.
Kent, D., Park, R., 1971. Flexural members with confined concrete. J. Struct. Div.
97(7), 1969-1990.
Koutromanos, I., Stavridis, A., Shing, P.B., Willam, K., 2011. Numerical modeling of
masonry-infilled RC frames subjected to seismic loads. Comput. Struct. 89(11),
1026-1037.
Kupfer, H., Hilsdorf, H., Rusch, H., 1969. Behavior of concrete under biaxial stresses.
ACI J. Proc.
Lee, B.-J., Pessiki, S., 2006. Thermal performance evaluation of precast concrete three-
wythe sandwich wall panels. Energy Build.
Lee, J., Fenves, G.L., 1998. Plastic-Damage Model for Cyclic Loading of Concrete
Structures. J. Eng. Mech. 124(8), 892-900.
Lemaitre, J., 1985. A Continuous Damage Mechanics Model for Ductile Fracture. J.
Eng. Mater. Technol.

References
177
Lemaitre, J., 1994. Mechanics of solid materials.
Lemaitre, J., Chaboche, J. L. Mechanics of solid materials, 1990.
Liauw, T., Kwan, K., 1985a. Unified plastic analysis for infilled frames. J. Struct. Eng.
Liauw, T., Kwan, K., 1985b. Static and cyclic behaviors of multistorey infilled frames
with different interface conditions. J. Sound Vib.
Lowes, L.N., Lehman, D.E., Birely, A.C., Kuchma, D.A., Hart, C.R., Marley, K.P.,
2010. Behavior , Analysis , and Design of Complex Wall Systems.
Lubliner, J., Oliver, J., Oller, S., Oñate, E., 1989. A plastic-damage model for concrete.
Int. J. Solids Struct.
Madan, A., Reinhorn, A.M., Mander, J.B., Valles, R.E., 1997. Modeling of Masonry
Infill Panels for Structural Analysis. J. Struct. Eng.
Magenes, G., Pampanin, S., 2004. Seismic response of gravity-load designed frame
systems with masonry infills.
Mainstone, R., Weeks, G., 1972. The influence of a bounding frame on the racking
stiffness and strengths of brick walls.
Mander, J., Nair, B., Wojtkowski, K., Ma, J., 1993. An experimental study on the
seismic performance of brick-infilled steel frames with and without retrofit. Tech.
Rep.
Manfredi, G., Masi, A., Pinho, R., Verderame,G.And Vona, M., 2007. Valutazione
degli edifici esistenti in Cemento Armato,IUSS Press, Pavia, Italy. (in Italian)
Mazars, J., 1986 A model of unilateral elastic damageable material and its application
to concrete. Fracture Toughness and Fracture Energy of Concrete, Elsevier, New
York (1986): 61-71.
Mazars, J., Pijaudier-Cabot, G., 1989. Continuum damage theory-application to
concrete. Journal of Engineering Mechanics, 115(2), 345-365.
Mansour, M., Hsu, T., 2005a. Behavior of reinforced concrete elements under cyclic
shear. I: Experiments. J. Struct. Eng.
Mansour, M., Hsu, T., 2005b. Behavior of reinforced concrete elements under cyclic
shear. II: Theoretical model. J. Struct. Eng.

References
178
Mart n-Pérez, B., Pantazopoulou, S.J., 2001. Effect of bond, aggregate interlock and
dowel action on the shear strength degradation of reinforced concrete. Eng. Struct.
Massone, L., 2009. Modelling of Squat Structural Walls Controlled by Shear. ACI
Struct. J.
Massone, L., Orakcal, K., Wallace, J., 2006. Shear-flexure interaction for structural
walls. ACI Spec. Publ.
Mazzoni, S., McKenna, F., Scott, M. H., Fenves, G. L. 2006. OpenSees command
language manual. Pacific Earthquake Engineering Research (PEER) Center.
Mehrabi, A., Shing, P., 1997. Finite element modeling of masonry-infilled RC frames.
J. Struct. Eng.
Mehrabi, A., Shing, P., Schuller, M., Noland, J., 1994. Performance of masonry-infilled
R/C frames under in-plane lateral loads.
Mehrabi, A. B., Benson Shing, P., Schuller, M. P., Noland, J. L. 1996. Experimental
evaluation of masonry-infilled RC frames. Journal of Structural engineering,
122(3), 228-237.
Mehta, P. K., Monteiro, P. J., 1993. Concrete. Structure, Properties, and Materials. 2nd
ed. Englewood Cliffs: Pretince.
Moghaddam, H. A., & Dowling, P. J. 1987. The state of the art in infilled frames.
Imperial College of Science and Technology, Civil Engineering Department.
Mohamad, N., Muhammad, H.M., 2011. Testing of Precast Lightweight Foamed
Concrete Sandwich Panel with Single and Double Symmetrical Shear Truss
Connectors under Eccentric Loading. Adv. Mater. Res.
Mörsch, E., 1922. Der, Eisenbetonbau (Reinforced concrete construction). Verlag von
Konrad Wittwer, Stuttgart.
Mosalam, K., 1996. Experimental and computational strategies for the seismic behavior
evaluation of frames with infill walls.
Mosalam, K. M., Ayala, G., White, R. N., Roth, C. 1997. Seismic fragility of LRC
frames with and without masonry infill walls. Journal of Earthquake Engineering,
1(4), 693-720.
Mosalam, K. M., White, R. N., Gergely, P. 1997. Static response of infilled frames
using quasi-static experimentation. Journal of Structural Engineering, 123(11),
1462-4169..

References
179
Naito, C., Hoemann, J., Beacraft, M., Bewick, B., 2012. Performance and
Characterization of Shear Ties for Use in Insulated Precast Concrete Sandwich
Wall Panels. J. Struct. Eng.
Negro, P., Colombo, A., 1997. Irregularities induced by nonstructural masonry panels
in framed buildings. Eng. Struct.
Negro, P., Verzeletti, G. 1996. Effect of infills on the global behavior of R/C frames:
energy considerations from pseudodynamic tests. Earthquake engineering &
structural dynamics, 25(8), 753-773.
Orakcal, K., Sanchez, L., Wallace, J., 2006. Analytical modeling of reinforced concrete
walls for predicting flexural and coupled-shear-flexural responses. Pacific
Earthquake Engineering Research Center, College of Engineering, University of
California, Berkeley.
Orakcal, K., Wallace, J., 2006. Flexural modeling of reinforced concrete walls-
experimental verification. ACI Struct. J.
Page, A. W., 1978. Finite Element Model for Masonry, Journal Str. Div., Proc. ASCE,
Vol. 104, No ST8, 1978, pp. 1267-1285.
Palermo, M., Gil-Martín, L.M., Trombetti, T., Hernández-Montes, E., 2012. In-plane
shear behavior of thin low reinforced concrete panels for earthquake re-
construction. Mater. Struct. 46, 841–856.
Paredes, J.A., Barbat, A.H., Oller, S., 2011. A compression–tension concrete damage
model, applied to a wind turbine reinforced concrete tower. Eng. Struct.
Paulay, T., Priestley, M., Synge, A., 1982. Ductility in earthquake resisting squat
shearwalls. ACI J. Proc.
Paulay, T., Priestley, M.J.N., 1992. Seismic Design of Reinforced Concrete and
Masonry Buildings, Structural Safety.
PCI Committee on Precast Concrete Sandwich Wall Panels, 1997. State of the art of
precast/prestresses sandwich wall panels. PCI J 1997;42(2):92–133.
Pessiki, S., Mlynarczyk, A., 2003. Experimental Evaluation of the Composite Behavior
of Precast Concrete Sandwich Wall Panels. PCI J. 48, 54–71.
Polyakov, S., 1960. On the interaction between masonry filler walls and enclosing
frame when loaded in the plane of the wall. Transl. Earthq. Eng.

References
180
Pramono, E., Willam, K., 1989. Fracture energy-based plasticity formulation of plain
concrete. Journal of engineering mechanics, 115(6), 1183-1204.
Raffa, A. 2012. Primi sviluppi per la concezione di tamponamenti in laterizio
“antisismici”. Master thesis, Department DICAM, University of Bologna,
Bologna.
Ramirez, J.A., Dilger, W.H., 2000. ACI 445R-99 Recent Approaches to Shear Design
of Structural Concrete Reported by Joint ACI-ASCE Committee 445 1–55.
Rezaifar, O., Kabir, M., Taribakhsh, M., Tehranian, A., 2008. Dynamic behavior of
3D-panel single-storey system using shaking table testing. Eng. Struct.
Ricci, I., Palermo, M., Gasparini, G., Silvestri, S., Trombetti, T., 2013. Results of
pseudo-static tests with cyclic horizontal load on cast in situ sandwich squat
concrete walls. Engineering Structures, 54, 131-149.
Ricci, I., 2012. Sistemi strutturali cellulari a pareti portanti in cemento armato gettato in
opera realizzate con la tecnologia del pannello di supporto in polistirene, Ph.D
Thesis, Department DICAM, University of Bologna;
Bologna.http://amsdottorato.cib.unibo.it/4886/.
Rosman R., 1964. Approximate analysis of shear walls subjected to lateral loads. Proc J
Am Concr Inst;61:717–33.
Ritter, K., Engineer, S., 1899. Die bauweise hennebique.
Sabetta, F., Pugliese, A., 1996. Estimation of Response Spectra and Simulation of
Nonstationary Earthquake Ground Motions. Bull. Seismol. Soc. Am. 86, 337–352.
Salmon, D., Einea, A., Tadros, M., Culp, T., 1997. Full scale testing of precast concrete
sandwich panels. ACI Struct. J.
Scotta, R., Tesser, L., Vitaliani, R., & Saetta, A. (2009). Global damage indexes for the
seismic performance assessement of RC structures. Earthquake Engineering &
Structural Dynamics, 38(8), 1027-1049.
Scotta, R., Vitaliani, R., Saetta, A., Oñate, E., Hanganu, A., 2001. A scalar damage
model with a shear retention factor for the analysis of reinforced concrete
structures: theory and validation. Comput. Struct. 79, 737–755.
Sezen, H., Moehle, J.P., 2004. Strength and Deformation Capacity of Reinforced
Concrete columns with Limited Ductility, in: Proceedings of the 13th World
Conference on Earthquake Engineering.

References
181
Shing, P.B., Mehrabi, A.B., 2002. Behavior and analysis of masonry-infilled frames.
Prog. Struct. Eng. Mater. 4, 320–331.
Simo, J.C., Ju, J.W., 1989a. Strain- and stress-based continuum damage models—II.
Computational aspects. Math. Comput. Model.
Simo, J.C., Ju, J.W., 1989b. Strain- and stress-based continuum damage models—I.
Formulation. Math. Comput. Model.
Smith, B., Carter, C., 1969. A method of analysis for infilled frames. ICE Proc.
Smith, B.S., 1962a. Lateral stiffness of infilled frames. J. Struct. Div., ASCE.
Smith, B.S., 1962b. Lateral stiffness of infilled frames. J. Struct. Div., ASCE.
Smith, B.S., 1967. Methods for predicting the lateral stiffness and strength of multi-
storey infilled frames. Build. Sci.
Stafford Smith, B., 1967. Methods for predicting the lateral stiffness and strength of
multi-storey infilled frames. Build. Sci.
Stafford-Smith, B., 1966. Behavior of square infilled frames. ASCE J. Struct. Div.
Stefano, M. De, Tanganelli, M., Viti, S., 2013. On the variability of concrete strength
as a source of irregularity in elevation for existing RC buildings: a case study.
Bull. Earthq. Eng.
Tamai, S., 1988. Average stress-strain relationship in post yield range of steel bar in
concrete. Concr. Lib. JSCE.
Tanganelli, M., Viti, S., De Stefano, M., Reinhorn, A. M. 2013. Influence of Infill
Panels on the Seismic Response of Existing RC Buildings: A Case Study. In
Seismic Behavior and Design of Irregular and Complex Civil Structures (pp. 119-
133). Springer Netherlands.
Tesser, L., Filippou, F. C., Talledo, D. A., Scotta, R., & Vitaliani, R. (2011). Nonlinear
analysis of R/C panels by a two parameter concrete damage model. In III
ECCOMAS Thematic Conference on Computational Methods in Structural
Dynamics and Earthquake Engineering (pp. 25-28).
Trombetti, T., Silvestri, S., Gasparini, G., 2012. Results of Pseudo-Static Tests with
Cyclic Horizontal Load on Concrete/Polystyrene Sandwich Bearing Panels with
and without Openings, in: Strategi Di Sviluppo Sostenibile per Le Costruzioni in
Cina, in Europa, E in Italia. pp. 509–518.

References
182
Tzmatzis, A., Asteris, P., 2003. Finite element analysis of masonry structures: Part I:
Review of previous work. 9th North Am. Mason. Conf. 101–111.
UNI, EN. 772-1:(2002), 2002. Tests guidelines for masonry members–Compressive
strength.
Vamvatsikos, D., Cornell, C.A., 2002. Incremental dynamic analysis. Earthq. Eng.
Struct. Dyn. 31, 491–514.
Vecchio, F.J., Collins, M.P., 1986. The Modified Compression Field Theory for
reinforced concrete elements subjected to shear. ACI Struct. J. 83, 925–933.
Verderame, G.M, Iervolino, I., Ricci, P. , 2009. Report on the damages on buildings
following the seismic event of 6th of april 2009, V1.20 available on
http://www.reluis.it
Whyte, C.A., Stojadinovic, B., 2013. Hybrid Simulation of the Seismic Response of
Squat Reinforced Concrete Shear Walls. Pacific Earthquake Engineering.
Wood, R., 1978. Plasticity, composite action and collapse design of unreinforced shear
wall panels in frames. ICE Proc.
Wu, J.Y., Li, J., Faria, R., 2006. An energy release rate-based plastic-damage model for
concrete. Int. J. Solids Struct. 43, 583–612.
Yazdani, S., and H. L. Schreyer. "Combined plasticity and damage mechanics model
for plain concrete." Journal of engineering mechanics 116.7 (1990): 1435-1450.
Žarnić, R., Gostič, S., Crewe, A. J., Taylor, C. A. 2001. Shaking table tests of 1: 4
reduced‐scale models of masonry infilled reinforced concrete frame buildings.
Earthquake engineering & structural dynamics, 30(6), 819-834.
Zarnic, R., Tomazevic, M., 1990. Behavior of Repaired Masonry Infilled R/C Frames.
A Rep. to US-Yugoslav Jt. Board Sci.