Allergenic protein and epitope recognition in food allergy: a new...
193
Allergenic protein and epitope recognition in food allergy: a new perspective for the molecular and clinical characterization of shellfish and lipid transfer protein allergy. Reconeixement de proteïnes i epítops al·lergènics en al·lèrgia alimentària: una nova perspectiva per la caracterització clínica i molecular de l’al·lèrgia al marisc i a les proteïnes de transferència de lípids. Mariona Pascal i Capdevila ADVERTIMENT. La consulta d’aquesta tesi queda condicionada a l’acceptació de les següents condicions d'ús: La difusió d’aquesta tesi per mitjà del servei TDX (www.tdx.cat) ha estat autoritzada pels titulars dels drets de propietat intel·lectual únicament per a usos privats emmarcats en activitats d’investigació i docència. No s’autoritza la seva reproducció amb finalitats de lucre ni la seva difusió i posada a disposició des d’un lloc aliè al servei TDX. No s’autoritza la presentació del seu contingut en una finestra o marc aliè a TDX (framing). Aquesta reserva de drets afecta tant al resum de presentació de la tesi com als seus continguts. En la utilització o cita de parts de la tesi és obligat indicar el nom de la persona autora. ADVERTENCIA. La consulta de esta tesis queda condicionada a la aceptación de las siguientes condiciones de uso: La difusión de esta tesis por medio del servicio TDR (www.tdx.cat) ha sido autorizada por los titulares de los derechos de propiedad intelectual únicamente para usos privados enmarcados en actividades de investigación y docencia. No se autoriza su reproducción con finalidades de lucro ni su difusión y puesta a disposición desde un sitio ajeno al servicio TDR. No se autoriza la presentación de su contenido en una ventana o marco ajeno a TDR (framing). Esta reserva de derechos afecta tanto al resumen de presentación de la tesis como a sus contenidos. En la utilización o cita de partes de la tesis es obligado indicar el nombre de la persona autora. WARNING. On having consulted this thesis you’re accepting the following use conditions: Spreading this thesis by the TDX (www.tdx.cat) service has been authorized by the titular of the intellectual property rights only for private uses placed in investigation and teaching activities. Reproduction with lucrative aims is not authorized neither its spreading and availability from a site foreign to the TDX service. Introducing its content in a window or frame foreign to the TDX service is not authorized (framing). This rights affect to the presentation summary of the thesis as well as to its contents. In the using or citation of parts of the thesis it’s obliged to indicate the name of the author.
Transcript of Allergenic protein and epitope recognition in food allergy: a new...
Allergenic protein and epitope recognition in food allergy: a new perspective for the molecular
and clinical characterization of shellfish and lipid transfer protein allergy.
Reconeixement de proteïnes i epítops al·lergènics en al·lèrgia alimentària: una nova perspectiva per la caracterització clínica i molecular de
l’al·lèrgia al marisc i a les proteïnes de transferència de lípids.
Mariona Pascal i Capdevila
ADVERTIMENT. La consulta d’aquesta tesi queda condicionada a l’acceptació de les següents condicions d'ús: La difusió d’aquesta tesi per mitjà del servei TDX (www.tdx.cat) ha estat autoritzada pels titulars dels drets de propietat intel·lectual únicament per a usos privats emmarcats en activitats d’investigació i docència. No s’autoritza la seva reproducció amb finalitats de lucre ni la seva difusió i posada a disposició des d’un lloc aliè al servei TDX. No s’autoritza la presentació delseu contingut en una finestra o marc aliè a TDX (framing). Aquesta reserva de drets afecta tant al resum de presentació de la tesi com als seus continguts. En la utilització o cita de parts de la tesi és obligat indicar el nom de la persona autora.
ADVERTENCIA. La consulta de esta tesis queda condicionada a la aceptación de las siguientes condiciones de uso: La difusión de esta tesis por medio del servicio TDR (www.tdx.cat) ha sido autorizada por los titulares de los derechos de propiedad intelectual únicamente para usos privados enmarcados en actividades de investigación y docencia. No se autoriza su reproducción con finalidades de lucro ni su difusión y puesta a disposición desde un sitio ajeno al servicio TDR. No se autoriza la presentación de su contenido en una ventana o marco ajeno a TDR (framing). Esta reserva de derechos afecta tanto al resumen de presentación de la tesis como a sus contenidos. En la utilización o cita de partes de la tesis es obligado indicar el nombre de la persona autora.
WARNING. On having consulted this thesis you’re accepting the following use conditions: Spreading this thesis by the TDX (www.tdx.cat) service has been authorized by the titular of the intellectual property rights only for private uses placed in investigation and teaching activities. Reproduction with lucrative aims is not authorized neither its spreading and availability from a site foreign to the TDX service. Introducing its content in a window or frame foreign to the TDX service isnot authorized (framing). This rights affect to the presentation summary of the thesis as well as to its contents. In the usingor citation of parts of the thesis it’s obliged to indicate the name of the author.

Allergenic protein and epitope recognition in food allergy: a new perspective for the molecular and clinical characterization of shellfish
and lipid transfer protein allergy.
Reconeixement de proteïnes i epítops al·lergènics en al·lèrgia alimentària: una nova
perspectiva per la caracterització clínica i molecular de l’al·lèrgia al marisc i a les
proteïnes de transferència de lípids.
Doctoral Thesis in Biomedicine
Universitat de Barcelona, 2011
Mariona Pascal i Capdevila
Directors:
Manel Juan Otero, MD, PhD.
Servei d’Immunologia, Centre de Diagnòstic Biomèdic (CDB), Hospital Clínic, Institut d'Investigacions Biomèdiques August Pi i Sunyer
(IDIBAPS), Barcelona.
Rosalia Ayuso Caballero, MD, PhD. The Jaffe Food Allergy Institute, Division of Allergy and Immunology, Department of
Pediatrics, Mount Sinai School of Medicine, New York.


Als meus pares i a en Xavi.


" La nostra recompensa es troba en l'esforç i no en el
resultat. Un esforç total és una victòria completa."
Mahatma Gandhi
(1869-1948)


AGRAÏMENTS
Ara que arriba el moment de posar punt i final a aquesta Tesi, voldria fer arribar
el meu agraïment a totes les persones que, d’una manera o altre, m’heu ajudat en
aquest camí. S’acaba una etapa que ha estat molt important i positiva per a mi, i
que ha resultat una experiència enriquidora en molts sentits... I tot això ha
estat possible perquè he estat envoltada de gent que m’ha recolzat i animat en
tot moment. Miro enrere i m’adono que totes les pedres que m’he anat trobant al
llarg d’aquest camí s’han fet petites i insignificants, mentre que només queden
els bons records i la satisfacció de l’esforç que he compartit amb tots
vosaltres.
En primer lloc, vull fer constar el meu especial agraïment als directors de la Tesi,
la Dra. Rosalia Ayuso i el Dr. Manel Juan, per haver-me donat l’oportunitat de dur
a terme la meva Tesi i per la seva dedicació en el desenvolupament d’aquest
projecte i en tota la meva formació. Molt especialment vull agrair al Dr. Jordi
Yagüe el seu suport incondicional, per creure que podria tirar endavant el meu
projecte, pel seu ajut i paciència en els moments més difícils, però sobretot per
ensenyar-me uns valors que van més enllà d’aquesta Tesi, que m’han fet créixer
com a persona i que segur que m’ajudaran al llarg de tota la meva vida
professional.
A tots els membres del Servei d’Immunologia de l’Hospital Clínic, per tots els
moments que hem compartit junts des de que vaig entrar de R1, per tot el que
amb paciència i sempre de bona gana m’heu ensenyat, pels esmorzars compartits,
les nits de guàrdia i mil anècdotes més... Al Dr. Ramon Vilella, a en Jordi Milà i a
la Luchy vull fer una menció especial, perquè amb ells vaig començar aquesta
aventura de l’al·lèrgia… A la Mercè li he d’agrair la seva incondicional disposició a
donar-me un cop de mà, sense ella, la “paperassa” hauria estat impossible.
Aquest projecte no hauria estat possible sense els meus companys del “zulo”,
als quals vull agrair la confiança dipositada en mi, tot el que m’han ensenyat, les
sessions que hem compartit i sempre obrir-me les portes als vostres projectes.
He agrair molt especialment al Dr. Joan Bartra haver estat el meu “al·lergòleg de
capçalera” durant tot aquest camí. Joan, és molt llarga la llista de totes les
coses que t’he d’agrair, però per mi el més important ha estat la teva il·lusió per
tirar endavant, sense deixar-me mai sola en aquesta aventura i sempre al peu del
canó quan t’he necessitat, dedicant-me un temps que de ben segur no tenies…
A la Dra. Maria Luisa Sanz, per la meva mini-estada al seu laboratori de la Clínica
Universitària de Navarra, que em va permetre iniciar aquesta aventura i fer créixer
el meu interès per l’al·lèrgia.

Al Dr. Hugh Sampson he d’agrair molt especialment l’oportunitat d’entrar a
formar part del seu grup d’investigació i desenvolupar bona part d’aquesta Tesi al
seu laboratori, pel seu suport i la seva reflexió sobre molts aspectes de la vida
professional. A tots els membres del laboratori del Mount Sinai, però en especial
a la Dra. Mirna Chehade i a la Galina Grishina, per la seva inoblidable acollida i
companyia durant la meva estada a Nova York i per tot el que m’han ensenyat a
nivell personal i professional. Encara que sembli estrany vull agrair també a la
ciutat de Nova York tots els racons que tenen quelcom especial que t’ajuden a
créixer com a persona i a tirar endavant dia a dia, pas a pas.
A les meves amigues, Maria R., Laura E. Maria T. i Núria C., per fer.me costat
durant tot aquest camí, però especialment per recolzar-me en les decisions i els
moments més difícils, quan tot semblava una bogeria…
A tu Xavi, t’ho he d’agrair tot. Ets la persona que més ha “patit” aquesta Tesi i
et vull donar les gràcies per tot l’esforç que ens ha suposat arribar fins aquí,
per la teva comprensió, per sempre donar prioritat als meus interessos per davant
dels teus, per la teva paciència i recolzament en els moments més difícils, per
haver-te robat tantes hores i per haver omplert la meva vida de bons moments i
fer que aquests anys hagin estat tant especials per a nosaltres. I perquè sé que
passi el que passi sempre ets al meu costat.
Als meus pares, perquè ho sou tot i us ho dec tot. Per donar-me l’oportunitat
de formar-me i poder arribar fins aquí, però molt especialment per haver-me
ensenyat des de petita el valor de la responsabilitat, l’esforç i la dedicació com a
claus per aconseguir allò que vols a la vida. Gràcies per “aguantar” tant bé les
meves absències d’aquests últims anys, per tots els bons i mals moments que
no hem pogut compartir i que ens han unit més que mai.
I a la resta de la meva família, pel seu suport incondicional. A la Marta, la
Rosalia i l’Enric, per acompanyar-me en tot aquest viatge i per ser valents quan
les coses no han sigut del tot fàcils. A les meves Àvies, per sempre fer-me
costat, de manera senzilla, alegrant-se del meus avanços i desitjant el millor per
mi, encara que la meva feina sovint no és fàcil d’entendre… A en Raúl i a la Irene
per preocupar-se per mi i animar-me durant tot aquest temps.
A tots aquells que d’una manera o altra m’han ajudat, encara que el seu nom no
figuri de forma explícita en aquestes línies, sense ells tampoc hauria estat
possible. A tots, el meu més sincer agraïment.

CONTENTS
LIST OF FIGURES������������������������� i
LIST OF TABLES������������������������..� iii
LIST OF ABBREVIATIONS���������������������. iv
1. INTRODUCTION
1.1. Allergy���������������������������. 3
1.1.1. Definition������.�����������������. 3
1.1.2. Effector cells: mast cells and basophils�..��������� 4
1.1.2.1. Mast cells�������������������� 5
1.1.2.2. Basophils����������..���������.. 5
1.1.3. Antigens������������������������ 6
1.1.3.1. Allergen nomenclature����..���������� 8
1.1.4. Development of the allergic response�����������. 8
1.1.4.1. Priming Th2 cells that drive IgE responses..�����. 8
1.1.4.2. Class switching to IgE���������������9
1.1.4.3. IgE receptors and allergen presentation..������..11
1.1.4.4. Mast cell activation pathways�����������.. 13
1.1.4.4.1. FcεRI-mediated mast cell activation�����13
1.1.4.5. Inflammatory responses after mast cell activation���16
1.1.5. Clinical manifestations of the allergic response�������. 18
1.2. Food Allergy�����������������������.�.. 19
1.2.1. Definitions����������������������� 20
1.2.2. Prevalence and epidemiology��������������.. 20
1.2.3. Natural history of food allergy��������������.. 20
1.2.4. Routes of sensitization�����������������.. 21
1.2.4.1. Oral tolerance������������������. 22
1.2.4.2. Potential role of non-inherently tolerogenic routes��.. 24
1.2.4.3. Food allergens activate the innate immunity����� 24
1.2.5. Food allergens��������������������� 25
1.2.6. Pathophysiologic mechanisms��������������.26
1.2.6.1. IgE-mediated food hypersensitivity�.���.����.. 26
1.2.6.2. Non-IgE mediated food hypersensitivity������� 27
1.2.7. Clinical manifestations�����������������.. 28
1.2.7.1. Local manifestations.�..�������������.. 28
1.2.7.2. Generalized manifestations��..�..........������ 29

1.2.8. Role of cofactors�������������������� 31
1.2.9. Food allergy diagnosis�����������������.. 32
1.2.9.1. Clinical history and physical examination������.. 32
1.2.9.2. Detection of food specific IgE�����������.. 32
1.2.9.2.1. Skin Prick Test��������������32
1.2.9.2.2. Serum specific IgE������������ 34
1.2.9.3. Oral food challenges���������������. 35
1.2.9.4. Other tests�������������������.. 36
1.2.10. A therapy for food allergy����������������37
1.3. Molecular Diagnosis of Food Allergy��������������. 37
1.3.1. Component-resolved diagnosis������.�������.. 37
1.3.2. Component-resolved immunotherapy��.��������� 39
1.3.3. Epitope mapping��������������������.40
1.4. Shellfish Allergy�����..����������������.�..42
1.4.1. Prevalence and clinical characteristics..����������. 42
1.4.2. Shellfish allergens and cross-reactivity����������.. 43
1.4.3. Diagnosis of shellfish allergy��������������� 44
1.5. Plant-Food Allergy�����.���������������.�.. 45
1.5.1. Main culprit foods and allergen families�.��������� 45
1.5.2. Non-specific lipid transfer proteins������������.. 46
1.5.3. The LTP-syndrome������������������� 47
2. HYPOTHESIS AND OBJECTIVES
2.1. Hypothesis�������������������������. 51
2.2. Objectives�������������������������.. 51
3. MATERIAL AND METHODS
3.1. Patient selection�..���.�.���������������.�.. 55
3.1.1. Shrimp sensitized subjects���.���.���������. 55
3.1.2. Multiple plant-food allergic subjects.���.��������.. 56
3.2. Skin Prick Test�..���.�.�����������������.. 56
3.3. Oral food challenge��.�.������������������.57
3.4. Specific IgE detection by ImmunoCAP system���������� 57
3.5. Specific IgE detection by microarray��������������..59
3.6. Enzyme-linked immuno-sorbent assay (ELISA)���������.. 62

3.7. Boiled and raw shrimp western blotting��.�.���������.. 64
3.7.1. Preparation of boiled and raw shrimp extracts.�������. 64
3.7.2. Protein separation and western blotting�.��������� 64
3.8. Purification of recombinant proteins���������������67
3.8.1. Overview�������..���.���.���������. 67
3.8.2. Crustacean recombinant allergens���.���������.69
3.8.3. Expression of recombinant protein���.���������. 69
3.8.4. Purification of recombinant protein���.���������. 71
3.8.4.1. His·60 Ni Superflow resin and gravity columns���.... 71
3.8.4.2. BugBuster Ni-NTA His·Bind purification kit�.����.. 73
3.8.5. Protein analysis��������.���.��������� 76
3.8.6. Protein dialysis��������.���.���������. 76
3.8.7. Determination of protein concentration�..���������.77
3.9. Dot blot printing and immunolabelling�������������� 78
3.9.1. Dot blotting���.���..���.���.���������. 78
3.9.2. Immunolabelling����..���.���.���������. 79
3.10. Epitope mapping���������..�������������80
3.10.1. Synthetic overlapping peptides and printing conditions���. 80
3.10.2. Immunolabelling���.��..���.���.�������..81
3.10.3. Microarray data analysis�����..���.�������..82
3.11. Basophil activation test�.�����..�������������83
3.11. Statistical analysis���.�����..�������������86
3.11.1. CRD and epitope recognition in shellfish allergy������ 86
3.11.2. LTP-syndrome: clinical pattern and molecular sensitization..�87
4. RESULTS
4.1. CRD and epitope recognition in shellfish allergy���..����.�.. 91
4.1.1. Study profile: patient characterization�...�����.���� 91
4.1.2. IgE recognition of recombinant allergens����������94
4.1.3. Component-resolved diagnosis��������������96
4.1.3.1. Allergens that can help differentiate challenge result�.. 96
4.1.3.2. Arginine kinase, hemocyanin: cross-reactive allergens.. 97
4.1.3.3. No major differences between children and adults�..� 97
4.1.4. Properties of recombinant allergens as diagnostic tests���. 97
4.1.5. Epitope mapping: IgE and IgG4 binding sites����.���.. 98 4.1.6. Differential binding sites between groups������.���. 100

4.1.7. Diversity of peptides bound by IgE and IgG4�.���.���..102 4.1.8. Comparison of current results with previous studies��..��. 104
4.1.9. Properties of epitopes as diagnostic tests�����.���.. 105
4.2. LTP-syndrome: clinical pattern and molecular sensitization profile
to plant-foods and pollens�����.��������������..� 107
4.2.1. Demographics and culprit plant-foods involved�������.107
4.2.2. Clinical symptoms�������������������.. 107
4.2.3. Cofactor effect�.�.������������������.. 107
4.2.4. Plant-foods sensitization�.�.����������.���� 110
4.2.5. Pollen sensitization�.�.����������������.. 113
4.2.6. NSAID cofactor effect on basophil degranulation in vitro��� 115
5. DISCUSSION
5.1. CRD and epitope recognition in shellfish allergy���..����.�.. 119
5.2. LTP-syndrome: clinical pattern and molecular sensitization profile
to plant-foods and pollens�����.����������..����� 125
6. CONCLUSIONS
6.1. CRD and epitope recognition in shellfish allergy���..����.�.. 131
6.2. LTP-syndrome: clinical pattern and molecular sensitization profile
to plant-foods and pollens�����.���������������.. 131
7. REFERENCES References���������������������������. 135
8. SUMMARY IN CATALAN
Summary in Catalan�����������������������. 149
APPENDIX 1. PUBLICATION
Appendix 1. Publications���������������������. 173

i
LIST OF FIGURES
1. INTRODUCTION
Figure 1.1. Classification of hypersensitivity reactions .......................................4
Figure 1.2. Mast cell and basophil.......................................................................6
Figure 1.3. T/B cell interactions leading to IgE isotype switching........................10
Figure 1.4. IgE receptors�������������......................................11
Figure 1.5. Allergen acts in pump priming of the allergic response.....................12
Figure 1.6. FcεRI-mediated mast cell activation..................................................14
Figure 1.7. Signaling cascade in activated mast cells.........................................16
Figure 1.8. Mediators released from mast cells upon IgE-mediated activation...18
Figure 1.9. Classification of food hypersensitivity reactions................................19
Figure 1.10. Mechanisms of oral tolerance..........................................................23
Figure 1.11. Food allergens activate the innate immunity...................................24
Figure 1.12. Major food allergen sources������...................................... 25
Figure 1.13. Skin prick test.................................................................................. 33
Figure 1.14. Molecular content of extracts�����........................................ 35
Figure 1.15. Production of recombinant allergens and selection for vaccine......40
Figure 1.16. Plant-food proteins described as allergens.....................................46
3. MATERIAL AND METHODS
Figure 3.1. Main components of the ImmunoCAP system���������...58
Figure 3.2. ImmunoCAP ISAC test principle�����...���������...60
Figure 3.3. ELISA assay���������������..��������..63
Figure 3.4. Protein electrophoresis���������...���������...65
Figure 3.5. Western blotting procedure�����������������...66
Figure 3.6. Overview of the production of recombinant proteins..���...��...68
Figure 3.7. Overview of protein purification with His·60 Ni Superflow Resin....... 73

ii
Figure 3.8. SDS-PAGE analysis of elution fractions��..���������...76
Figure 3.9. Protein dialysis using the Slide-A-Lyzer Dyalisis cassette����...77
Figure 3.10. The Minifold Dot Blotter������������������...78
Figure 3.11. Nitrocellulose strips with printed recombinant allergens.����...79
Figure 3.12. Overview of the general procedure of peptide microarray����.83
Figure 3.13. Basophil activation test���������.���������...84
4. RESULTS
Figure 4.1. Study profile: subjects recruited���������..������.91
Figure 4.2. IgE recognition of recombinant allergens�����..������. 94
Figure 4.3. Heatmap representing IgE binding in the peptide microarray���.99
Figure 4.4. Heatmap representing IgG4 binding in the peptide microarray..��.100
Figure 4.5. TileMap analyisis������������������...���.101
Figure 4.6. Correlation between IgE and IgG4 binding�����������. 103
Figure 4.7. Schematic representation of component specific-IgE detection by microarray������..���������������............ 112
Figure 4.8. Estimation of proportion of positive to pollens������..���. 115
Figure 4.9. Basophil activation test with Pru p 3 and L-ASA�����..���. 116

iii
LIST OF TABLES
3. MATERIAL AND METHODS
Table 3.1. Panel of allergenic components included in the microarray..��.....62
Table 3.2. Summary of the conditions for recombinant allergens expression� 70
Table 3.3. Sequence of the synthetic peptides tested in the microarray..�...... 81
4. RESULTS
Table 4.1. Characteristics of subjects recruited for the study����.....�......92
Table 4.2. Comparison of shrimp-, dust mite-, cockroach-specific IgE levels....92
Table 4.3. Detailed description of the subjects recruited��...��.....�......... 93
Table 4.4. Frequency of IgE recognition and differences between groups........ 96
Table 4.5. Properties of recombinant allergens as diagnostic tests�............... 98
Table 4.6. Summary of differential binding sites identified between groups�...102
Table 4.7. Number of peptides bound by IgE, IgG4 and both per allergen��. 103
Table 4.8. Comparison of results with previous studies��.����.....�......104
Table 4.9. Properties of epitopes as diagnostic tests���.����.....�......106
Table 4.10. Demographics, clinical characteristics and sensitization�.....��.108
Table 4.11. Clinical symptoms�����������������.....�......109
Table 4.12. Sensitization to peach components and Tri a 14�...��.....�......111
Table 4.13. Summary of pollen sensitization������...����.....�......113
Table 4.14. Pollen sensitization detected by each diagnostic test����...� 114

iv
LIST OF ABBREVIATIONS
AK Arginine kinase
APC Antigen presenting cell
BAT Basophil activation test
BcR B cell receptor
BSA Bovine serum albumin
CD40L CD40 ligand
CRD Component-Resolved Diagnosis
CRIT Component-Resolved Immunotherapy
DBPCFC Double blind placebo controlled food challenge
DC Dendritic cell
DMSO Dimethyl sulfoxide
DP Dermatophagoides pteronyssinus
EDTA Ethylenediamine tetra-acetic acid
Eff. Efficiency
e.g. exempli gratia = for example
ELISA Enzyme linked immuno-sorbent assay
FABP Fatty-acid binding protein
FAP Facilitated antigen presentation
FcεRI High affinity IgE receptor
FcεRII Low affinity IgE receptor, also known as CD23
FDR False discovery rate
fMLP N-formyl-methionyl-leucyl-phenylalanine
FN False negative
FP False positive
GI Gastrointestinal
GID Gastrointestinal disorders
HDM House dust mite
Hemo Hemocyanin
HRF Histamine-releasing factor
HAS Human serum albumin
i.e. id est = that is, which means�
Ig Immunoglobulin (E, G4�)
IL Interleukin (-3,-4,-5,-13�)
v
IPTG Isopropyl-beta-D-thiogalactopyranoside
ISU ISAC standardized unit
IT Immunotherapy
ITAM Immunoreceptor tyrosine-based activation motif
kDa KiloDalton
L-ASA L-acetyl salicylic acid
LB Lysogeny or Luria Broth
LT Leukotrien (-C4, -D4, -E4�)
LTP Lipid transfer protein
MLC Myosin Light Chain
NGS Normal Goat Serum
NPV Negative predictive value
NSAID Non-steroidal anti-inflammatory drug
nsLTP Non-specific lipid transfer proteins
OAS Oral allergy syndrome
OD Optical density
OFC Oral food challenge
OIT Oral immunotherapy
O/N Overnight
OU Optical units
PAF Platelet activating factor
PBS Phosphate buffer saline
PBS-T Phosphate buffer saline containing Tween 20
PCR Polymerase chain reaction
PG Prostaglandin
PPV Positive predictive value
RAST Radioimmunoassay test
SCP Sarcoplasmic calcium-binding protein
SDS Sodium dodecyl sulfate
SDS-PAGE Sodium dodecyl sulfate polyacrylamide gel electrophoresis
SE Sensitivity
SP Specificity
SPT Skin prick test
Th0 Naïve CD4+ T cell
Th1 / Th2 T helper type 1 / type 2

vi
TM Tropomyosin
TN True negatives
TP True positives
TpC Troponin C
TSLP Thymic stromal lymphopoietin

1
CHAPTER 1. INTRODUCTION

CHAPTER 1. INTRODUCTION
2

CHAPTER 1. INTRODUCTION
3
INTRODUCTION
1.1. Allergy
1.1.1. Definitions
Clemens Von Pirquet introduced the term allergy in 1906 as “an altered
capacity of the body to react to a foreign substance” [1]. That was an extremely broad
definition that included in fact all immunological reactions. Nowadays the definition is
restricted to “disease following a response by the immune system to an otherwise
innocuous antigen” [2].
In 1920, Prausnitz and Küstner demonstrated the involvement of
immunoglobulins in the allergic response by injecting Küstner’s (fish allergic) sera into
Prausnitz’s (not allergic) forearm and with that transferring him the sensitivity to the fish
extract. However, it was not until 1967 that the responsible molecule was characterized
and termed Immunoglobulin E (IgE) by Ishizaka (confirmed with experiments of
Johannson and Bennich) [3].
Allergy is one of a class of harmful immune system responses that are termed
hypersensitivity reactions that produce tissue injury and can cause serious disease. In
1963, Gell and Coombs classified them in four groups (Types I-IV) based on the
immune reactant, the antigen and the effector mechanism involved [2,4]. Allergy is
often equated with type I hypersensitivity (immediate-type hypersensitivity reactions
mediated by IgE that lead to mast cell activation) (Figure 1.1).
The World Health Organization (WHO) has classified the common allergic
diseases, which include asthma induced by aeroallergens, allergic rhinitis, atopic
dermatitis, drug allergy and food allergy, as one of the six more frequent pathologies
that affect the world population. Prevalence of these diseases in Europe is estimated
around 25-30% of the population. Apparently their prevalence is increasing and they
are a frequent cause of disability in the developed world [5].
Atopy is the term used to describe an exaggerated tendency to mount IgE
responses to a wide variety of common environmental allergens. It is considered that
20% of the worldwide population is atopic. This state has a strong familial basis and is
influenced by several genetic loci. Atopic individuals have higher total levels of IgE and

CHAPTER 1. INTRODUCTION
4
eosinophils in the circulation than their normal counterparts. They are more susceptible
to allergic diseases such as hay fever and asthma [2].
Figure 1.1. Classification of hypersensitivity reactions. Schematic representation of the main
characteristics of each type of hypersensitivity reaction. From: [4].
1.1.2. Effector cells: mast cells and basophils
Mast cells and basophils are considered critical components of the allergic
response. They express the high-affinity IgE receptor (FcϵRI) and, in response to
aggregation of this receptor by antigens acting through bound IgE, secrete
inflammatory mediators (contained in basophilic plasma granules) known to be
responsible for the symptoms and pathology of allergic diseases [6]. The state when
allergen specific IgE antibodies arm tissue mast cells and blood basophils by binding to
its receptors is called sensitization.
Moreover, both cell types are known to express other receptors that also induce
secretion of mediators responsible for allergic symptoms. Some of these receptors are
now considered part of the innate immune response and mast cells have been
implicated in mediating several non-allergic diseases (e.g., inflammatory diseases,
neurological diseases and functional diseases) thanks to their responsiveness to these
other types of stimulation (e.g., adenosine, complement component 3a, chemokines,
cytokines, pathogen-associated molecular patterns (PAMPs), sphingosine 1-phosphate

CHAPTER 1. INTRODUCTION
5
and stem-cell factor/KIT ligand). Nevertheless, secretion from mast cells and basophils
and their participation in diseases is not restricted to IgE-mediated reactions [6].
Human mast cells have been traditionally described as the tissue equivalents of
basophil granulocytes, which have been seen for long as a surrogate with which to
study the mast cell [5, 6]. This view, however, may no longer be valid, since there is
substantial developmental and physiological evidence that these two cell types differ
from one another more than they are alike [6].
1.1.2.1. Mast cells Mast cells (mastocytes) are potent tissular effector cells of hematopoietic origin,
closely related to monocytes and macrophages. Development of these cells involves
the release of intermediate precursors from the bone marrow that are capable of
targeting specific tissue sites for maturation. Mast cell survival on specific tissue sites
has been estimated on the order of months. They are particularly abundant in a
perivascular distribution in connective tissues and at mucosal surfaces, at sites in the
body that are exposed to the external environment, such as the skin. In these
locations, they are found in close proximity to blood vessels, where they can regulate
vascular permeability and effector-cell recruitment. Although not having direct cell–cell
contact with local populations of antigen-presenting cells (e.g., Langerhans cells in the
skin), they can modulate the behavior of these and other neighboring effector cells
through the release of mediators. In addition to their role in allergy, they regulate many
tissue functions and they have a central role in innate immunity to bacterial and
parasitic infections [7].
1.1.2.2. Basophils Basophils develop from pluripotent stem cell precursors found in the bone
marrow and share properties mainly with eosinophils. While the exact factors important
in their differentiation remain unknown, the cytokine interleukin (IL) -3, likely plays a
critical role, as well as in the survival and activation of mature basophils.
Upon release from the bone marrow as mature cells, basophils have very little
capacity for further development and are thought to survive only for days in the blood
circulation.

CHAPTER 1. INTRODUCTION
6
It was first thought that their function was restricted to histamine and leukotriene
(LT) C4 secretion, but now, there is firm evidence that basophils are the predominant
cellular source of IL-4 and IL-13, perhaps the two most important cytokines having a
role in the pathogenesis of allergic disease. This fact, together with the evidence that
these cells infiltrate allergic lesions and are capable of responding to variety of stimuli,
has launched a renewed interest in them and in their role in allergic inflammation and
disease [8,9].
Figure 1.2. Mast cell and basophil. a) Mast cells are a type of leukocyte found in connective
tissue. The large oval (pink and brown) is the cell's nucleus and within the cell's cytoplasm
(purple) there are granules (dark purple) containing chemical mediators. b) Basophils are the
least common of the white blood cells. The nucleus is shown in brown and granules in the cell
cytoplasm in purple. Cell sections, colored transmission electron micrograph (TEM).
Magnification: x5000 when printed at 10 centimeters wide. From Science Photo Library.
1.1.3. Antigens
Allergen is the specific term used to describe the antigen that has the capacity
to stimulate the production of IgE by selectively triggering a T helper type 2 (Th2)
response in a genetically disposed individual and to develop an allergic reaction in the
individual that has previously been sensitized to it (i.e., induce allergic symptoms in an
individual to whom IgE production has been already induced due to a prior exposure to
the allergen). If the antigen is only able to induce the allergic reaction, but not to
sensitize is known as an incomplete allergen, whereas antigens with full capacity to
sensitize and induce symptoms are known as complete allergens [5].
a b

CHAPTER 1. INTRODUCTION
7
There is currently not known structure or feature that makes a substance an
allergen or not. However, size, solubility, molecular compactness and stability seem to
be traits that influence notably in allergenicity. Most allergens are common, innocuous
small proteins or glycoproteins with a molecular weight of 5-100 kilo Dalton (kDa).
Major allergen sources include: herbaceous dicotyledons, tree and grass pollens, fungi,
animal dander, house-dust mites, cockroaches and foods such as fresh fruits,
vegetables, nuts, fish and shellfish. Noteworthy, several of the clinically relevant
allergens possess biochemical properties that may facilitate the actual sensitization
process (e.g., the protease activity can enhance epithelial permeability or stimulate
proinflammatory cytokine release) [5].
Allergen exposure may occur within and outside home as well as in the
workplace. Allergens enter the body at very low doses via a number of routes such as
the respiratory (the most clinically important) and gastrointestinal tracts, but they may
also be injected (e.g., venoms, drugs).
IgE is usually produced against the protein part. Although some data suggest
that the glycan part of a glycoprotein may be also allergenic (e.g., that associated with
Cupressus arizonica pollen allergens [10]). IgE production to allergen glycan moieties
may contribute to cross-reactivity (i.e., phenomenon that occurs when the antibody
reacts not only with the original allergen that has caused sensitization, but also with a
similar allergen) [5, 10].
The number of proteins from any given allergenic source that may be allergenic
vary and sensitized patients producing IgE to a source usually recognize more than
one allergenic protein. Those allergens in a source recognized by more than 50% of
allergic individuals are usually termed ‘major’ but some of those considered ‘minor’ on
a population basis may, of course, be of clinical significance at an individual level [5].
The impact of molecular biology and genomics on understanding of allergen
structure and function over the past 25 years has been enormous. The majority of
clinically significant allergens have now been sequenced and their endogenous
biochemical activities determined. These advances have facilitated the determination
of the three-dimensional structures of a significant number of allergens, the
determination of allergen T cell- and B cell-reactive epitopes and the construction of
hypoallergenic variants for use in the treatment of allergic disease (protein or DNA
vaccines). However, questions regarding what is unusual about the proteins that are
common allergens, as well as why only some of the people who are exposed make IgE
antibodies against them, are not clearly answered yet [5].

CHAPTER 1. INTRODUCTION
8
1.1.3.1. Allergen Nomenclature
Before the arrival of detailed sequence information, the World Health
Organization and International Union of Immunological Societies (WHO/IUIS) Allergen
Nomenclature Sub-committee introduced guidelines to facilitate the consistent naming
of purified allergens from complex sources [6].
The naming procedure is based on using the first three letters (although four
are sometimes used to avoid confusion e.g., ‘Cand’ and ‘Can’ for Candida and Canis,
respectively) of the genus source (e.g., Dermatophagoides) and combining it with the
first one or two letters of the species name (e.g., pteronyssinus) followed by an Arabic
numeral reflecting either the order in which the allergen was isolated or its clinical
importance, or both.
Allergens from different species within a genus or across phylogenetically
related genera but similar on the basis of sequence identity use the same numbering
arrangement. For example, the related house-dust mite cysteine protease allergens
from mites such as Dermatophagoides pteronyssinus, D. farinae, Euroglyphus maynei
and Blomia tropicalis are individually referred to as Der p 1, Der f 1, Eur m 1 and Blo t 1
respectively, or collectively as the Group 1 mite allergens.
Isoallergens from the same species (>67% sequence identity) are given a suffix
(00–99) (e.g., Amb a 1.01, Amb a 1.02). For allergens from the same species that differ
by only a few residues, an additional two digits are used to differentiate them (e.g.,
Amb a 1.0101) [6].
1.1.4. Development of the allergic reaction
The allergic reaction involves two important phases, a first encounter with the
allergen that leads to asymptomatic production of allergen-specific IgE (sensitization);
and a second phase that occurs on re-exposure to the allergen that causes the allergic
reaction and the clinical symptoms.
1.1.4.1. Priming Th2 cells that drive IgE responses
The destiny of a naïve CD4+ T (Th0) cell responding to a peptide presented by
a dendritic cell (DC) is determined by: the cytokines that it is exposed to (before and
during this response) and the intrinsic properties of the antigen (dose and the route of

CHAPTER 1. INTRODUCTION
9
presentation). The DCs at these sites of entry take up the antigen, efficiently process it
(at the same time that they become activated) and migrate to regional lymph nodes,
where differentiated into professional antigen-presenting cells (APCs) with co-
stimulatory activity, they interact with Th0 cells driving them to become effector Th2
cells, the T cell type that allows IgE class switching. It is not fully understood how DCs
induce the differentiation Th2 versus Th1, Th17 or even iTreg response (accessory
signals and cytokines (including some chemokines) produced by activated accessory
immune cells, like monocytes, that avoid the activation of some key transcription
factors T-bet (Th1), RORγt (Th17) or Foxp3 (iTreg) seem to be key elements in this
polarization) [2,9, 11].
Exposure to IL-4 induces the development of Th2 cells that express the
transcription factor GATA-3 and produce IL-4, IL-5, IL-6 IL-9, IL-10, IL-13 and GM-
CSF. These cells express cell surface receptors, which target their trafficking to allergic
sites and trigger activation in settings of allergic inflammation, including the chemokine
receptors CCR3, CCR4, CRTH2, CCR8 and the IL-33 receptor, T1/ST2 [9,11].
Transmucosal antigen presentation at very low doses seems also to be a particularly
efficient way of inducing Th2-driven IgE responses.
Apart from their role in allergic diseases, IgE antibodies are important in host
defense against infection with multicellular parasites. Therefore, this defense system is
anatomically distributed mainly at the sites of potential entry of such parasites (i.e.,
under the skin, under the epithelial surfaces of the airways (the mucosal-associated
lymphoid tissues) and in the submucosal of the gut (the gut-associated lymphoid
tissues)). At these sites, cells of the innate and adaptive immune systems are
specialized to secrete predominantly cytokines that drive Th2 responses and IgE
production, and also amplify the polarization of the response [9, 12, 13].
1.1.4.2. Class switching to IgE
There are two main components of the immune response leading to IgE
production. The first consists of signals that favor the differentiation of Th0 cells to a
Th2 phenotype. The second comprises the action of cytokines and co-stimulatory
signals from Th2 cells that stimulate B cells to switch to producing IgE antibodies
(Figure 1.3) [6].
IL-4 and IL-13 activate the kinases Jak1 and Jak3 leading to the
phosphorylation of the transcriptional regulator Stat6 present in T- and B-lymphocytes.

CHAPTER 1. INTRODUCTION
10
Mice lacking functional either IL-4, IL-13 or Stat6 have impaired Th2 responses and
impaired IgE switching, therefore their role is crucial in signaling for the heavy chain
class switching from IgM to IgE. The other key signal for IgE production consists on the
co-stimulatory interaction between CD40 ligand (CD40L or CD154) on T-cell surface
and CD40 on the B cell surface, which is actually required for all antibody class
switching.
Mast cells and basophils can also amplify the already initiated IgE response.
Once activated by antigen cross-linking of their FcϵRI-bound IgE, these cells express
CD40L on their surface and secrete IL-4 and IL-13. All of them bind to their receptors
on activated B cells. Thus, they can provide both required signals for IgE synthesis.
Importantly, this interaction can occur at the site of the allergic reaction, since B cells
are observed to form germinal centers at inflammatory foci [6, 11, 13].
Figure 1.3. T/B cell interactions leading to IgE isotype switching. The signals
required for isotype switching are provided to the B cell through a complex series of interactions
with an allergen-specific T cell. A B cell that expresses IgM specific for the allergen (1) binds the
allergen via surface immunoglobulins (sIgM), processes it and presents it to an allergen-specific
Th2-like T cell (2). Engagement of the T cell receptor/CD3 complex by MHC class II molecules
results in the rapid expression of CD154 (CD40L) (3), which engages CD40 on B cells (4). T/B
cell interactions mediated via CD40/CD154 are amplified by interactions between the co-
stimulatory molecules (CD28/CD80-CD86). Engagement of CD40 upregulates CD80-CD86
expression on B cells (5). CD80-CD86 engage CD28 (6) inducing high-rate transcription (7) and
secretion (8) of IL-4 and/or IL-13 that will bind their heterodimeric receptors (9). At this stage, the
B cell is receiving both signals required for IgE switching: IL-4 triggers ε germline transcription
(10), thereby targeting the ε switch region for recombination. Cross-linking of CD40 by CD40L
activates DNA recombination to the targeted ε S region (11), leading to IgE isotype switching and
IgE secretion. From [6].

CHAPTER 1. INTRODUCTION
11
1.1.4.3. IgE receptors and allergen presentation
After class switching, IgE secreted by plasma cells binds to its receptors on cell
surfaces (state termed sensitization, condition sine qua non for an allergic reaction to
occur on reexposure to the allergen). Two receptors have been described for IgE: a
high-affinity receptor (FcεRI) present on mast cells, basophils and APCs (these are
Langerhans cells and interdigitating epithelial dendritic cells); and a low-affinity
receptor (FcεRII or CD23) on lymphocytes, Langerhans cells, follicular dendritic cells,
macrophages, monocytes, eosinophils and platelets (Figure 1.4) [6,11].
Figure 1.4. IgE receptors. a) Schematic representation of the entire IgE molecule bound to the
extracellular domains of the FcεRI α-chain, according to the structural information from the FcεRI
complex and the bent IgE-Fc structure. The β- and γ-chains of FcεRI, with their immunoreceptor
tyrosine-based activation motifs (ITAMs), are also shown. b) A schematic representation of
membrane-bound CD23 showing the extracellular trimeric α-helical coiled-coil ‘stalk’, the three C-
type lectin domain ‘heads’ and the C-terminal ‘tails’. N-linked glycosylation sites near the base of
the stalk are also shown. Adapted from [11].
On re-exposure, allergen binding to the IgE of FcεRI on the surface of APCs
leads to the presentation of allergenic peptides to Th2 cells, either after migrating to
local lymph nodes or on site.
Similarly in the mucosa, allergen binds IgE bound to CD23 that is expressed by
allergen-activated B cells. This process facilitates allergen presentation to T cells
(termed Facilitated Antigen Presentation (FAP)). The interaction between CD23 and
HLA-DR in the cell membrane is involved in the trafficking of the allergen–IgE–CD23
a b

CHAPTER 1. INTRODUCTION
12
complex to endosomes. In the endosomes, allergens are processed and derived
peptides are loaded onto HLA-DR molecules for B cell presentation. Antigen
presentation through the membrane bound B-cell receptor (BcR, a surface Ig) involves
the interaction of cognate B cells with Th cells (thus the number of cognate B cells is a
limitation). However, FAP may overcome this limitation, as all antigen-activated B cells
(that is, CD23-expressing) are able to present a variety of peptides, even from totally
unrelated allergens, to cognate T cells, regardless of the specificity of the own BcR.
This is important for the phenomenon of ‘epitope spreading’, not only within a
single allergen, but also to unrelated allergens. Thus, an antigen activated B cell
expressing CD23 can in effect behave as a ‘professional’ APC (i.e., dendritic cell),
which can simultaneously process unrelated antigens through FcγRs and cause
epitope spreading to other antigens. Actually, CD23-mediated FAP is known to be as
efficient as FcγR-mediated antigen presentation by dendritic cells, orders of magnitude
more efficient than B-cell internalization via BcR. IL-4, IL-13 and CD40L also
participate in the process by stimulating the expression of CD23 and its release [11].
Figure 1.5. Allergen acts in pump priming of the allergic response. IgE is synthesized and
secreted by B cells, binds to FcεRI on mast cells and APCs (a) and sensitizes these cells to
allergens. Omalizumab inhibits this binding (b). Allergen binding to IgE triggers mast-cell

CHAPTER 1. INTRODUCTION
13
degranulation (c). Allergen binding to the APC leads to the presentation of allergenic peptides to
Th2 cells (d), which secrete IL-4 (e) to maintain the Th2 cell lineage and recruit more Th cells into
this lineage (e). Also they secrete IL-13 and express CD40L, which together with IL-4 stimulates
class switching to IgE (f). Allergen-activated mast cells contribute to the production of IL-4 and IL-
13 (and express CD40L), which may also stimulate class switching to IgE (g). IL-4, IL-13 and
CD40L also stimulate the expression of CD23 and the release of soluble CD23 (h). In humans,
soluble trimeric CD23 upregulates IgE synthesis and secretion through CD21 (i). From [11].
The allergen binding to IgE of FcεRI on the surface of mast cells causes cross-
linking of the receptors leading to cell activation that through the corresponding
signaling pathways ends up with degranulation and mediators release. Moreover, upon
activation by allergens, mast cells secrete IL-4, IL-13 and CD40L that maintain Th2 cell
lineage and recruit more Th cells into this lineage [12,13]. Also with IL-4 the IgE class
switching is favored. Thus, the actual allergen acts in pump priming of the allergic
response (Figure 1.5) [11].
1.1.4.4. Mast-cell activation pathways
Despite the fact that mast cells and basophils only share some attributes,
signaling transduction pathways following FcεRI aggregation or other forms of
stimulation are frequently discussed as if the mechanisms were the same for both cell
types and are mainly referred to mast cells. The manifestations of allergic reactions are considered to be mainly a
consequence of the release of pro-inflammatory mediators following antigen-induced
aggregation of IgE-bound to FcεRIs expressed at the mast-cell surface (Figure 1.6).
However, there is increasing evidence that receptors for other ligands might markedly
influence mast-cell activation in a physiological context [6].
1.1.4.4.1 FcεRI-mediated mast-cell activation
Antigen-dependent mast-cell activation is regulated by a complex series of
intracellular signaling processes that are initiated following FcεRI aggregation. FcεRI is
a multimeric receptor that comprises an α-chain (responsible for IgE binding), a β-chain
and a disulphide-linked γ-chain homo dimer, which perform critical signal transduction
functions and their intracellular domains contain immunoreceptor tyrosine-based
activation motifs (ITAMs) that act as docking sites for SH2 domain containing signaling
proteins.

CHAPTER 1. INTRODUCTION
14
Figure 1.6. FcεRI-mediated mast-cell activation. Subjects sensitized to specific allergens, such
as the cat allergen Fel d1, produce IgE antibodies specific to these allergens, which bind to high-
affinity receptors (FcεRI) on the surface of mast cells and basophils. Aggregation of FcεRI,
typically by the binding of di- or multivalent allergen recognized by the IgE, induces mast cell and
basophil activation. Adapted from [14].
In mast cells, the main SRC family kinase that is involved in initial stages is
LYN, which mainly resides in lipid rafts. The association of aggregated FcεRI, typically
caused by the binding of di- or multivalent allergen recognized by the IgE, with
activated LYN might be sufficient to shift the equilibrium of FcεRI from a
nonphosphorylated state to a phosphorylated state, thereby initiating FcεRI-mediated
degranulation.
The tyrosine residues that are phosphorylated by LYN are present in the ITAMs
of the FcεRI β- and γ-chains. When phosphorylated, they provide high-affinity docking
sites for the SH2 domains of LYN and for the SH2 domains of the ZAP70 (ζ-chain-
associated protein kinase of 70 kDa)-related tyrosine kinase SYK (spleen tyrosine
kinase), respectively. The subsequent SYK- and/or LYN-mediated tyrosine
phosphorylation of the transmembrane adaptor molecule LAT (linker for activation of T
cells) is crucial for coordination of the downstream signaling pathways.

CHAPTER 1. INTRODUCTION
15
Phosphorylation of LAT results in the recruitment of several types of molecules:
cytosolic adaptor molecules, such as GRB2 (growth-factor-receptor-bound protein 2),
GADS (GRB2-related adaptor protein), SHC (SH2-domain-containing transforming
protein C) and SLP76 (SH2-domain-containing leukocyte protein of 65 kDa); guanine-
nucleotide-exchange factors and adaptor molecules, such as SOS (son of sevenless
homologue) and VAV; and signaling enzymes, such as phospholipase Cγ1 (PLCγ1).
These interactions with LAT result in the formation of a macromolecular signaling
complex. The four terminal tyrosine residues in LAT (Y132, Y171, Y191 and Y226) are
crucial and sufficient for the ability of LAT to regulate signaling in mast cells and
ultimately their degranulation.
The main signaling enzyme regulated by both direct and indirect interactions
with these tyrosine residues is PLCγ. When activated, it catalyzes the hydrolysis of
phosphatidylinositol-4,5-bisphosphate (PtdIns(4,5)P2) in the plasma membrane. The
resulting products, inositol-1,4,5-trisphosphate (InsP3) and diacylglycerol (DAG),
induce mobilization of cytosolic calcium and activation of protein kinase C (PKC),
respectively. Since the calcium signal induced by InsP3 is transient, it is the calcium
sequestered from extracellular stores by capacitive entry, as a consequence of
depletion of intracellular stores, which allows the signal to be sustained. The PLCγ-
dependent increases in both cytosolic free calcium and PKC activation are essential
signals for degranulation to proceed.
The sequence of events that leads from LAT to cytokine production has not
been as clearly defined as the sequence that leads to degranulation. However, the
pathways that lead to cytokine-gene expression require the guanine-nucleotide-
exchange factors VAV and SOS to activate RAS. After it has been activated, RAS
positively regulates the RAF-dependent pathway that leads to phosphorylation and, in
part, activation of the mitogen-activated protein kinases (MAPKs) extracellular-signal-
regulated kinase 1 (ERK1) and ERK2.
The MAPKs JUN amino terminal kinase (JNK) and p38 are similarly activated in
a LAT-dependent manner in mast cells, but the mechanism(s) that regulates these
responses is less well-defined. These molecules (ERK1, ERK2, p38 and JNK), in turn,
activate transcription factors (including the activator protein 1 (AP1) components (FOS
and JUN), nuclear factor of activated T cells (NFAT) and nuclear factor-κB (NF-κB))
leading to cytokine generation (Figure 1.7) [6, 14-17].

CHAPTER 1. INTRODUCTION
16
Figure 1.7. Signaling cascade in activated mast cells. For clarity, only one high-affinity
receptor for IgE (FcεRI) is shown. DAG, diacylglycerol; InsP3, inositol-1,4,5-trisphospha-te; PLA2,
phospholipase A2; PtdIns(4,5)P2, phosphatidylinosi-tol 4,5-bisphosphate. From [16].
1.1.4.5. Inflammatory responses after mast cell activation
Classically, mediator secretion is considered the measured outcome of cell
activation and leads to inflammatory reactions.
For mast cells, it is possible to define three types of secretion, each one with
characteristic mediators: (1) rapid from pre-formed pools stored in the secretory
granules (e.g. histamine, neutral proteases, preformed cytokines and proteoglycans),
(2) rapid but newly synthesized lipid mediators that are the products of endogenous
arachidonic acid metabolism (e.g. PGD2, LT-B4 and -C4, the parent molecule of the
cysteinyl-LTs) and (3) slow but newly synthesized proteins (e.g., proinflammatory
cytokines, chemokines and growth factors) [6].
In basophils, at least two major non-cytotoxic degranulation patterns have been
described depending on the type of stimulus used: 1) anaphylactic degranulation, a
very rapid and explosive event that is characterized by a regulated granule extrusion
by exocytosis that can ultimately result in an intact cell that is completely degranulated.
As expected, this pattern is common with IgE-mediated degranulation resulting from

CHAPTER 1. INTRODUCTION
17
the binding of specific antigen or anti-IgE antibody; 2) piecemeal degranulation, initially
used to describe the pattern of degranulation observed in basophils found in certain
cell-mediated pathological conditions, including contact dermatitis, skin graft rejection,
Crohn's disease, ulcerative colitis and irritable bowel syndrome. It is characterized by
an induced vesicular transport of granular content that does not involve direct granule
extrusion. Various cytokines and chemokines that modulate basophil activity are
believed to induce this type of degranulation [18].
The net result of the mediators release process includes: first, an immediate
(starting within seconds) allergic reaction, mainly due to the activity of histamine, PGs
and other preformed or rapidly synthesized mediators that cause the rapid increase in
vascular permeability (plasma extravasation, tissue edema) and the contraction of
smooth muscle (bronchoconstriction). Second, after 8-12 hours, a more sustained
inflammation process, known as the late phase response, that takes place and is
caused by the induced synthesis and release of mediators including PGs, LTs,
chemokines and cytokines from the activated mast cells.
This late response involves the recruitment of other effector cells, notably Th2
lymphocytes, eosinophils and basophils, which contribute significantly to the
immunopathology of the allergic response. Moreover, a second phase of smooth
muscle contraction mediated by T cells occurs, with persistent inflammation, sustained
edema and tissue remodeling. The late-phase reaction and its long-term sequel,
chronic allergic inflammation, contribute to a much serious long-term illness, as, for
example, chronic asthma (Figure 1.8) [6].

CHAPTER 1. INTRODUCTION
18
Figure 1.8. Mediators released from mast cells upon IgE-mediated activation. Upon cross-
linking of FcεRI-IgE by allergen, mast cells immediately release preformed mediators from
storage in secretory granules via exocytosis. Concomitantly, leukotrienes and PGD2 are
generated from arachidonic acid, and cytokine and chemokine production is induced. From
[6].
1.1.5. Clinical manifestations of the allergic response The consequences of the IgE mediated mast-cell activation depend on the dose
of antigen and its route of entry.
There are two main anatomical distributions of mast cells, those associated with
vascularized connective tissues (connective tissue mast cells) and those found in
submucosal layers of the gut and the respiratory tract (mucosal mast cells). The overall
response to an allergen depends on which mast cells are activated. Allergen in the
bloodstream activates connective tissue mast cells throughout the body, resulting in
the systemic release of histamine and other mediators. Whereas, subcutaneous
administration of allergen activates only local connective tissue mast cells, leading to a
local inflammatory reaction. Inhaled allergen, penetrating across epithelia, activates
mainly mucosal mast cells, causing smooth muscle contraction in the lower airways,
leading to bronchoconstriction and difficulty in expelling inhaled air. Similarly, ingested
allergen penetrates across gut epithelia, causing vomiting due to intestinal smooth
muscle contraction and diarrhea due to outflow of fluid across the gut epithelium. Food
allergens can also be disseminated in the bloodstream, causing urticaria (hives) when
the food allergen reaches the skin or generalized systemic reactions (anaphylaxis) [6].

CHAPTER 1. INTRODUCTION
19
1.2. Food Allergy
1.2.1. Definitions
A food allergy is defined as “an adverse health effect arising from a specific
immune response that occurs reproducibly on exposure to a given food” [19]. In 2001,
the European Academy of Allergy and Clinical Immunology (EAACI) Nomenclature
Committee revised the definitions of adverse reactions to food and proposed a new
nomenclature that was reassured by the World Allergy Organization (WAO)
Nomenclature Committee in 2003. Briefly, they propose that any adverse reaction to
food should be defined as food hypersensitivity; among these, the reactions mediated
by immune mechanisms are defined as food allergy, whereas the ones without an
immune mechanism are considered together as non-allergic food hypersensitivity
(previously known as intolerance). Food allergy is further classified as IgE- or non-IgE
mediated (Figure 1.9). The IgE-mediated are the most frequent and account for the
majority of well-characterized food allergic disorders, although a number of non-IgE-
mediated immune reactions, especially in the gastrointestinal tract, have been
delineated [5].
Figure 1.9. Classification of food hypersensitivity reactions. Adapted from [5].
Importantly, food allergy must be distinguished from a variety of adverse
reactions to foods that do not have an immune basis but may resemble it in clinical
manifestations. They comprise the majority of adverse reactions to foods and may be
due to factors inherent in food ingested, such as toxic contaminants, pharmacologic
properties of the food, metabolic disorders and/or idiosyncratic responses of the host.
Food aversions may mimic adverse food reactions, but typically cannot be reproduced

CHAPTER 1. INTRODUCTION
20
when the patient ingests the food in a blinded fashion. Examples of non-allergic
adverse reactions to food are: lactose intolerance, pancreatic insufficiency, food
poisoning, caffeine and panic disorder among others.
1.2.2. Prevalence and epidemiology
Food allergy is common and might be increasing in prevalence representing an
important public health problem. Food allergy significantly affects quality of life,
especially due to the difficulties associated with food avoidance, which is the primary
treatment of food allergy [20, 21]. Epidemiologic studies based on food challenges
indicate that 1 to 10.8% of the general population have immune-mediated nontoxic
food hypersensitivity [22]. However, the actual prevalence is difficult to determine,
mainly due to a lack of accurate controlled population-based studies using the gold
standard procedure for food allergy diagnosis, the double blind placebo controlled food
challenge (DBPCFCs), but also because of innumerable factors such as
misclassification, biased participation, lack of simple diagnostic tests, rapid evolution of
disease, large numbers of potential triggers and varied clinical phenotypes [20].
Studies to address the reasons for the increased prevalence and persistence of
food allergies have included the hygiene hypothesis, changes in the components of the
diet, the use of antiacids (resulting in exposure to more intact protein), food processing
and/or extensive delay of oral exposure [23].
1.2.3. Natural history of food allergy
Natural history of food allergy refers to the evolution of this disease from the
very beginning with the allergen sensitization to the potential lost of this sensitization. It
needs to be taken into account not only the development or not of tolerance to the
allergenic source causing the first allergy, but also the potential development of new
sensitizations to food allergens and/or aeroallergens [5].
The prevalence of food hypersensitivity is greatest in the first few years of life.
Food allergy in early infancy is generally transient, however, several studies have
shown that is also one of the first manifestations of the process known as “atopic
progression”, in which the first manifestation would be the atopic dermatitis and, after a
food allergy, the respiratory allergy would be developed [5]. Most young children
allergic to cow’s milk and egg ‘outgrow’ their food allergy (become tolerant) within a few

CHAPTER 1. INTRODUCTION
21
years, except in the majority of cases of peanut, tree nut and seafood allergy that
persist into adulthood. Eighty-five percent of milk allergic children and 66% of egg
allergic children become food tolerant by age 5 years. In contrast, only approximately
20% of all children with peanut allergy become peanut tolerant. It appears that the
natural history of allergy to seeds, fish and shellfish are similar to peanut [24]. Although
younger children are more likely to ‘outgrow’ their food allergies, it is apparent that
older children and adults also may lose their reactivity if the responsible food allergen
is identified and eliminated from the diet. Approximately one-third of children and adults
will lose their clinical reactivity after 1-2 years of allergen avoidance [25]. Puncture skin
test and serum specific IgE results typically remain positive and do not predict which
patients will lose their clinical reactivity.
Most non-IgE-mediated gastrointestinal food allergies occur in infants and are
outgrown in the first 2–3 years of life. However, allergic eosinophilic gastroenteritis is
frequently seen in adults and the number of cases developing in young children and
adolescents appears to be increasing. Long-term studies have not been completed, so
the prognosis of this disorder remains to be determined. No formal studies on the
natural history of non-IgE-mediated cutaneous or respiratory disorders have been
undertaken, but these sensitivities are believed to be long lasting.
Food allergy in young children may be viewed as a marker of an atopic
predisposition. In many children, food allergy coexists with other atopic conditions,
such as atopic dermatitis, asthma and allergic rhinitis. Sensitization to egg white in
children with atopic dermatitis and a family history of atopy is associated with a 70%
risk for respiratory allergic disease (asthma or allergic rhinitis) at 5 years of age [26].
Therefore, subjects with past and current food allergy should be considered at high risk
for asthma and environmental allergy.
1.2.4. Routes of sensitization Sensitization to specific proteins within food allergens may occur in the
gastrointestinal tract (oral route) or as a consequence of a primary allergic sensitization
to inhalant allergens. The immunologic mechanisms responsible for the development
of allergic sensitization rather than tolerance to foods are not well understood, although
there have been a number of recent advances in the understanding of why some foods
are inherently allergenic [5].

CHAPTER 1. INTRODUCTION
22
In 2000, Breiteneder and Ebner suggested a classification of food allergy based
on the immunological mechanisms involved, the sensitization route and the pattern of
allergens implicated [27]. Class I food allergy (also viewed as “traditional”) is the one
that occurs due to sensitization through the oral route and is due to class I allergens,
which are hidrosoluble glycoproteins of 10-70kDa, very stable and resistant to heat,
acid and proteases (gastric digestion). Typical allergens of this class are: egg proteins,
milk proteins, fish parvalbumin, shellfish tropomyosin, lipid transfer proteins in plant-
foods, etc. Class II food allergy occurs as a consequence of a primary allergic
sensitization to inhalant allergens, given the existence of common epitopes between
the food allergen and the aeroallergen. Thus, the food allergen is able to cause an
allergic reaction but not to induce sensitization (i.e., incomplete allergens). Most class II
allergens are thermolabile proteins, susceptible to enzymatic degradation. Examples
are: raw carrot, apple, melon secondary to birch or ragweed pollen sensitivity,
respectively [5].
1.2.4.1. Oral tolerance
Despite the large extent of dietary antigenic exposure, only a small percentage
of individuals have food allergy. This is due to development of oral tolerance to dietary
proteins, which refers to a state of active inhibition of immune responses to an antigen
by means of prior exposure to that antigen through the oral route [28]. However, in a
susceptible host, a failure to develop or a breakdown in the process of oral tolerance
may result in hypersensitivity responses to ingested food antigens. Thus, once food
enters the gastrointestinal tract, three distinct immune responses may occur: a)
systemic tolerance for cellular and humoral immunity, which constitutes the normal
response; b) local immune reaction at the mucosa with IgA production; or c) systemic
activation that can affect both arms of immunity, humoral and cellular (food
hypersensitivity). Several factors affect the induction of oral tolerance to a dietary
antigen. Some are antigen related, namely the dose and nature of the antigen. Other
factors are inherent to the host, including age, genetics and intestinal flora [5].
Briefly, oral tolerance can be divided into two forms, each with a distinct
mechanism. One due to exposure of high doses of oral antigen (in which T-cell
receptor cross-linking can occur in the absence of costimulation or in the presence of
inhibitory ligands (CD95 and CD95 ligand), leading to anergy or deletion, respectively)
and the other one due to exposure to low doses of oral antigen leading to the activation
CHAPTER 1. INTRODUCTION
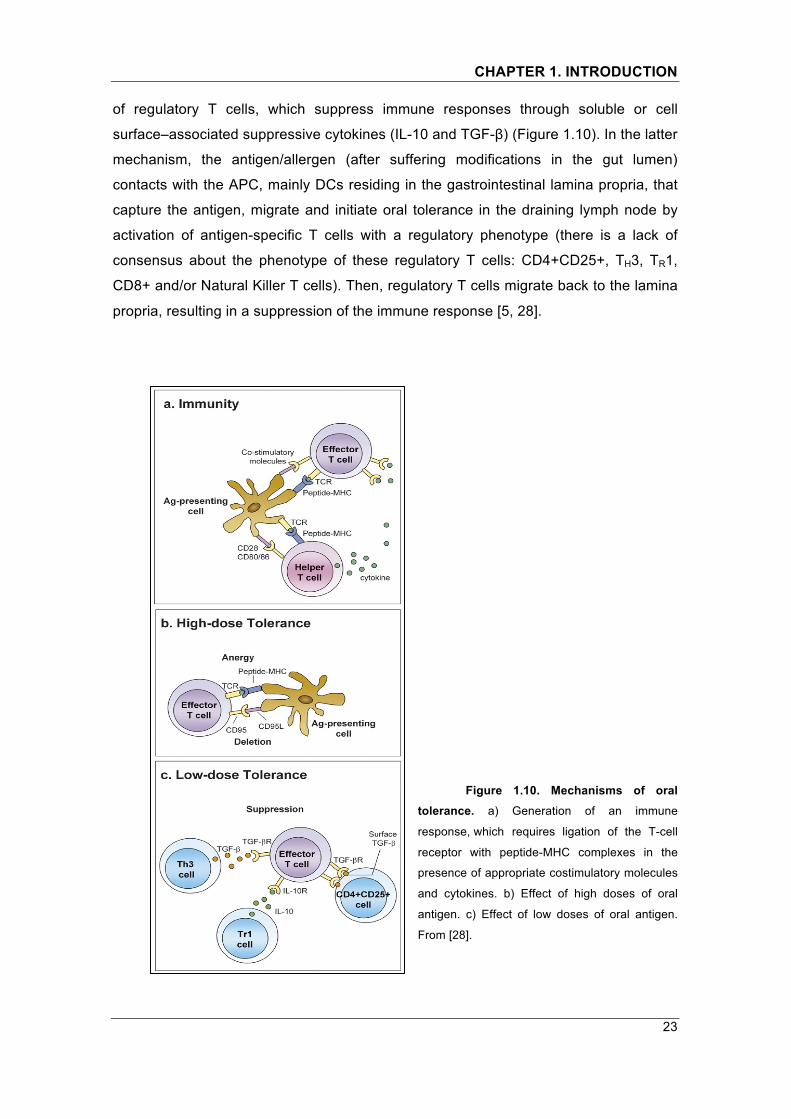
23
of regulatory T cells, which suppress immune responses through soluble or cell
surface–associated suppressive cytokines (IL-10 and TGF-β) (Figure 1.10). In the latter
mechanism, the antigen/allergen (after suffering modifications in the gut lumen)
contacts with the APC, mainly DCs residing in the gastrointestinal lamina propria, that
capture the antigen, migrate and initiate oral tolerance in the draining lymph node by
activation of antigen-specific T cells with a regulatory phenotype (there is a lack of
consensus about the phenotype of these regulatory T cells: CD4+CD25+, TH3, TR1,
CD8+ and/or Natural Killer T cells). Then, regulatory T cells migrate back to the lamina
propria, resulting in a suppression of the immune response [5, 28].
Figure 1.10. Mechanisms of oral tolerance. a) Generation of an immune
response, which requires ligation of the T-cell
receptor with peptide-MHC complexes in the
presence of appropriate costimulatory molecules
and cytokines. b) Effect of high doses of oral
antigen. c) Effect of low doses of oral antigen.
From [28].

CHAPTER 1. INTRODUCTION
24
1.2.4.2. Potential role of non-inherently tolerogenic routes Emerging data suggest that allergic sensitization may occur if the primary route
of exposure is not the naturally tolerogenic oral route. The observation that it is
possible to sensitize mice to food allergens through the skin without an adjuvant
suggests that the skin may be an important route of sensitization. In humans,
household exposure to peanut has been shown to be associated with allergic
sensitization to peanut in children, independent of maternal ingestion. However, the
assumption that the skin is inherently allergenic cannot be made, since tolerance can
also be induced via skin exposure [29, 30].
1.2.4.3. Food allergens activate the innate immunity
Several food allergens have been shown to directly activate various
components of the innate immunity that may influence the adaptive immune response
to food allergens, promoting or suppressing allergic sensitization. One example of such
effect are soy isoflavones, which directly suppress gastrointestinal DCs [31]. This fact
has been proposed as an explanation for soy being a weaker food allergen than
peanut allergens despite the homology between them (Figure 1.11).
Figure. 1.11. Food allergens activate the innate immunity. Nut extracts activate complement,
leading to macrophage activation and release of platelet activating factor (PAF). Allergens with
different glycosylation patterns can bind to innate receptors: SIGNR1 on dendritic cells (DCs)
promotes the generation of regulatory T cells and DC-SIGN or the scavenger receptor-alpha type
I or II (SR-AI/II) alters the phenotype of the DC to promote the generation of Th2 cells.
Isoflavones from soy suppress DC activation. Sphingolipids found in milk can directly act on
CHAPTER 1. INTRODUCTION
25
invariant NKT (iNKT) cells, leading to preferential release of the Th2 cytokines (IL-4 and IL-13).
From [29].
Innate activity of allergens does not explain why only some individuals become
sensitized to foods. Gastrointestinal epithelial cells at the interface between the
gastrointestinal contents and the mucosal immune system are host factors that likely
determine the immune response to foods. Supporting evidence for this hypothesis in
humans is that epithelial cells from food allergic subjects express higher levels of
galectin-9 that can act on DCs to promote allergic sensitization. In mice, the epithelial
cytokine thymic stromal lymphopoietin (TSLP) has been described critical for
gastrointestinal but not systemic manifestations of food allergy. Indeed, mutations
upregulating TSLP expression are associated with eosinophilic esophagitis but the
relationship to IgE-mediated food allergy has not yet been addressed in humans [29].
1.2.5. Food allergens Food allergens are defined as “those specific components of food or ingredients
within food (typically proteins, but sometimes also chemical haptens) that are
recognized by allergen specific immune cells and elicit specific immunologic reactions,
resulting in characteristic symptoms” [19]. Although an allergy can be triggered by
virtually any food, major allergens sources responsible for most significant reactions
include milk, egg, peanut, tree nuts, fresh fruits, shellfish, fish, wheat and soy. Allergy
to additives and preservatives is generally uncommon [23] (Figure 1.12).
Figure 1.12. Major food allergen sources. From: http://freeblogspot.org/blog/food-allergy-and-
intolerances/

CHAPTER 1. INTRODUCTION
26
In food allergy, cross-reactivity occurs when a food allergen shares structural or
sequence similarity with a different food allergen or aeroallergen, which may then
trigger an adverse reaction similar to that triggered by the original food allergen. This
phenomenon rarely occurs between allergens that have an identity below 50% and in
most cases it requires an identity above 70%. It is common, for example, between
plant-foods and pollens (Bet v 1 homologues), among different shellfish and among
different tree nuts [5].
Some allergens (most often from fruits and vegetables) cause allergic reactions
primarily if eaten when raw. However, most food allergens can still cause reactions
even after they have been cooked or have undergone digestion in the stomach and
intestines. It has been shown that allergens that are stable to heat and digestion are
more likely to cause a severe clinical reaction, whereas heat and digestion labile
allergens are more likely to be tolerated or only cause milder/local symptoms. Food
preparation can also affect allergenicity. For instance, the high temperature of roasting
(180ºC) peanuts leads to a Maillard reaction or the emulsification procedure to obtain
(peanut butter) appears to increase stability and allergenicity [23].
Additional characteristics of the manner in which foods are ingested might be
relevant. For example, recent studies suggest that 70% to 80% of young children
allergic to milk or eggs can tolerate baked (heat-denatured) forms of the protein but not
the unbaked form. It is suggested that these children make IgE antibodies primarily to
conformational epitopes on the food proteins and represent the children who will
naturally outgrow their food allergies [32].
1.2.6. Pathophysiologic mechanisms Generally, food allergic disorders involve more than one of the classic
mechanisms of hypersensitivity reactions described by Gell and Coombs. Therefore, it
is conceptually and diagnostically helpful to categorize food-induced allergic disorders
based on immunopathology among those that are mediated or not mediated by IgE
antibodies [23].
1.2.6.1. IgE-mediated food hypersensitivity
The best characterized food allergic reactions involve IgE-mediated responses.
After a first phase of sensitization that implies IgE production, an effector phase is

CHAPTER 1. INTRODUCTION
27
going to happen on reexposure to the culprit allergen. The effector phase is
characterized by an acute phase (with an immediate onset after ingestion) a potential
late phase and a chronic phase.
Briefly, when food allergens penetrate mucosal barriers and reach IgE
antibodies bound to mast cells or basophils, mediators are released within seconds to
minutes and vasodilatation, smooth muscle contraction and mucus secretion is
induced, resulting in symptoms of immediate hypersensitivity (acute phase). The
activated mast cells also may release a variety of cytokines, which may contribute to
the IgE-mediated late-phase response. During the initial 4-8 hours, primarily
neutrophils and eosinophils are recruited to the site of response. These first infiltrating
cells are activated and release a variety of mediators including PAF, peroxidases,
eosinophil major basic protein and eosinophil cationic protein. In the subsequent 24-48
hours, lymphocytes and monocytes infiltrate the area and an inflammation is
established. Successive repetitions of late-phase responses contribute to the
establishment of a chronic allergic inflammation (chronic phase). Moreover, repeated
ingestion of a food allergen stimulates mononuclear cells to secrete histamine-
releasing factor (HRF), a cytokine that interacts with IgE molecules bound to the
surface of basophils (and perhaps mast cells) and increases their releasability. The
‘spontaneous’ generation of HRF by activated mononuclear cells in vitro has been
associated with increased bronchial hyperreactivity in patients with asthma and
increased cutaneous irritability in children with atopic dermatitis [6].
1.2.6.2. Non-IgE mediated food hypersensitivity
Type II antigen-antibody dependent cytotoxic reactions occur when specific
antibody binds to a surface tissue antigen or hapten associated with a cell and induces
a direct effect (such as complement activation, where complement activation products
promote the generation of various inflammatory mediators that lead to subsequent
tissue damage). This effect is defined by the specificity of the recognition of the
antibody. A few reports have implicated an antibody-dependent thrombocytopenia
secondary to the ingestion of milk. However, little evidence supports any significant
role for type II hypersensitivity in food allergic disorders [6].
Type III antigen-antibody complex-mediated hypersensitivity has been
implicated in patients with a variety of complaints and elevated serum food antigen-
antibody complexes. However, food antigen-antibody complexes have been

CHAPTER 1. INTRODUCTION
28
demonstrated in the sera of normal individuals as well as patients with suspected food
hypersensitivity. For instance, the complexes formed by the interaction of IgG, IgA or
IgM antibodies to β-lactoglobulin are found 1–3 hours after ingesting milk in normal
children and adults [6].
Type IV and extended type IV cell-mediated hypersensitivity has been
implicated in food allergic disorders with a delayed onset of clinical symptoms (several
hours after ingestion). Ingestion of the sensitizing antigen may provoke mucosal
lesions. In humans, a few investigators have found increased lymphocyte proliferation
to food antigens in food allergic individuals, but increased proliferation is found in many
asymptomatic subjects as well. Cell-mediated hypersensitivity reactions contribute to a
number of gastrointestinal disorders, such as allergic eosinophilic esophagitis and
gastroenteritis, atopic dermatitis and celiac disease [6].
1.2.7. Clinical manifestations of food allergy
Unfortunately, there is no pathognomonic symptom of food allergy, since the
patient may present a wide range of allergic symptoms, from very mild (not even
perceptible as pathologic) to death [5].
A variety of symptoms have been associated with IgE-mediated allergic
reactions involving the skin, the gastrointestinal (GI) and/or respiratory tracts, and/or
the cardiovascular system. Reactions can be either generalized (urticaria, angioedema,
hypotension, shock, anaphylaxis or food-dependent exercise-induced anaphylaxis); or
restricted to the skin (flushing, pruritus, rash, acute contact urticaria), to the respiratory
tract (ocular pruritus and tearing, nasal congestion, pharyngeal edema and wheezing,
rhinoconjunctivitis and acute bronchospasm) and/or to the GI tract (lip, tongue, and
palatal pruritus and swelling, laryngeal edema, vomiting and diarrhea). It is not known
why foods provoke different constellations of symptoms in different individuals. Atopic
dermatitis and chronic airway hyperreactivity (asthma) involve activation of other cell
types through IgE-mediated mechanisms [5, 6].
1.2.7.1. Local manifestations
Local gastrointestinal food allergic disorders mainly include: Immediate GI
allergic reactions (acute GI hypersensitivity) and Pollen-Food Allergy Syndrome (or
Oral Allergy Syndrome, OAS).

CHAPTER 1. INTRODUCTION
29
In acute GI hypersensitivity, symptoms generally develop within minutes to two
hours of consuming the responsible food allergen and consist of nausea, abdominal
pain, cramps, emesis and/or diarrhea (typically in conjunction with cutaneous and/or
respiratory symptoms). It is shown at any age and the prognosis is variable depending
on the allergen. Local vasodilation, edema, mucus secretion and petechial
hemorrhaging have been observed by endoscopy. After adverse food reactions leading
to diarrhea, increased stool and serum PGE2 and PGF2 have been detected.
The OAS is elicited by a variety of plant-food allergens cross-reacting with their
homolog proteins in pollens (aeroallergens). Symptoms are limited almost exclusively
to the oropharynx (pruritus, tingling, erythema and/or angioedema), rarely involving
other target organs, after ingestion of raw fresh fruits and vegetables (usually cooked
forms are well-tolerated since the allergens causing these reactions are labile). Any
age group can suffer from OAS, although it is most common in young adults. It is
estimated that it affects up to 50-70% of adults suffering from pollen allergy (especially,
birch, ragweed and mugwort pollens) with exacerbated symptomatology during the
pollen season.
Short of breathiness due to glottis edema, bronchospasm or both, are
infrequent as isolated presentation of food allergy and are usually associated to severe
generalized reaction; however they may occur. Moreover, food can also induce
respiratory symptoms by inhalation of volatile allergens (e.g., cooking steam,
pulverization, etc.) at home, at work (occupational food allergy) or due to environmental
contamination. Thus, respiratory symptoms need to be also considered in food allergy
[5,6].
1.2.7.2. Generalized manifestations
Anaphylaxis is currently defined as “a serious allergic reaction that is rapid in
onset and might cause death” [33].
Food-induced anaphylaxis is the leading single cause of anaphylaxis treated in
emergency departments in the USA, especially in childhood [34,35]. It usually
manifests within one hour of exposure, but the onset of symptoms may also occur a
few hours afterwards, possibly related to a less severe reaction or delayed absorption
of the food. Symptoms are most commonly seen in the skin (urticaria, angioedema,
pruritus, flushing) and respiratory tract (cough, difficulty breathing, wheezing), whereas
the cardiovascular system is less often affected compared to anaphylaxis of other

CHAPTER 1. INTRODUCTION
30
causes, especially in children. Importantly, the clinical presentation (onset of
symptoms, clinical severity and sequence of symptom progression) can differ between
individuals and between reactions in the same individual and is likely dependent on
concomitant factors, such as the amount of food ingested, consumption to an empty
versus full stomach, concurrent illness, exercise, alcohol, medications, menstruation,
among others. Asthmatics, adolescents and those with a prior reaction are at increased
risk for more severe reactions. However, also patients without a known allergy may be
at risk for food-induced anaphylaxis. Most of the anaphylactic reactions occur to
ingested food allergens; however, anaphylaxis to inhaled food allergens have also
been reported including fish, shellfish, seeds, soybeans, cereal grains, egg, milk, and
other foods in the form of allergen flour in the air and vapors during cooking or roasting.
Currently, total tryptase level is the most commonly measured marker to
establish a diagnosis of anaphylaxis. Tryptase levels increase immediately, peak at 1–
2 hours and return to baseline 24 hours after complete resolution of symptoms. Levels
are ideally obtained within 3 hours of onset of symptoms and serial measurements may
help establish the diagnosis. However, lack of tryptase elevation is also commonly
seen probably due to a slow onset of reactions or because mucosal mast cells and
basophils, the major players in food-induced anaphylaxis, contain less to no tryptase
as compared with skin mast cells.
The mainstay of treatment of any anaphylactic reaction is the timely
intramuscular administration of epinephrine into the lateral thigh. Adjunctive therapies
include H1-antihistamine, which may relieve skin symptoms and rhinorrhea, H2
blockers, oxygen, bronchodilators, and corticosteroids, given with the goal of
preventing or ameliorating a late phase reaction, although their role here has not been
proven [36].
The skin is one of the more frequent targets in food allergy. Acute urticaria is
characterized by transient pruritus and erythema lesions distributed to any part of the
skin with less than 24 hours of evolution. Sometimes, urticaria can be presented with
localized edemas, generally in the face, eyes, lips and limbs, cursing as angioedema.
Both are frequently observed in food allergy, but they are unspecific symptoms and
with multiple potential triggers [5].

CHAPTER 1. INTRODUCTION
31
1.2.8. Role of cofactors in food allergy
The severity with which the food allergy is expressed, or even more, its clinical
manifestation in a sensitized patient after exposure to the culprit allergen, depends on
several factors either related to the food or to other concomitant ones, such as exercise
or the previous intake of a non-steroidal anti-inflammatory drug (NSAID).
Both have been described as risk factors for developing a severe episode of
food-induced anaphylaxis. Recently, it has been published that NSAIDs intake is
present in 22% of the food allergy induced anaphylactic shocks, representing a risk
factor with an odds ratio >11 [37]. Thus, if the drug and the food intake temporarily
coincide, the drug can exacerbate the allergic response towards the food, leading to an
anaphylactic episode or, even more, the drug may be a required cofactor for such
clinical manifestation of the food allergy. This clinical event is known as anaphylaxis in
the context of NSAIDs-induced food allergy or Food-Dependent Aspirin-Induced
Anaphylaxis, FDAIA). However, this role as a cofactor is not universal in all food allergy
patients, since a severe anaphylactic reaction can be induced without a previous intake
of NSAID, as well as, these drugs not always exacerbate a mild symptomatology
manifested by the food allergic patient.
Limited studies in the literature demonstrate this synergistic effect and even
less go into detail on the physiopathogenesis. Currently, two main hypotheses are
intended to explain the reason of this clinical event. Briefly, on one hand it is stated that
the NSAID increases the permeability of the intestinal membrane causing a major
absorption of the culprit allergen [38]. On the other hand, there is the hypothesis that
NSAIDs have a direct effect on the mast cell and the basophil amplifying its
degranulation response [39]. A recent study supports the latter, showing in mice that
NSAIDs are capable of increasing the IgE-mediated degranulation of mast cells after a
specific IgE stimulus [40]. Also, an increase of the membrane permeability could not be
caused only by the effect of NSAIDs, but also by the degranulation of mast cells and
basophils [41], which would lead to a “mix-hypothesis”. Therefore, the ones raised are
not contrary hypothesis, allowing the mast cell and the basophil to be the common
denominator in both of them.

CHAPTER 1. INTRODUCTION
32
1.2.9. Food allergy diagnosis
1.2.9.1. Clinical history and physical examination The evaluation requires a thorough history and physical examination to
consider a broad differential diagnosis, to ascertain possible trigger foods, and to
determine a likely general pathophysiologic basis, specifically whether the food-
induced allergic disorder is likely IgE-mediated or not, which will guide testing.
The clinical history should determine the possible causal food(s), quantity
ingested, time course of reaction, concomitant factors (exercise, drugs and alcohol)
and reaction consistency. Moreover, it also focuses on details that might contribute to
estimating the prior probability of an allergic reaction to a specific food. For example,
reasoning dictates that a food ingested infrequently is more likely responsible for an
acute reaction than one previously tolerated; that contamination of a meal by a
previously diagnosed allergen should be considered ahead of a less likely explanation,
such as development of a new allergy to a previously tolerated food; and that major
allergens are inherently more likely to be triggers than other foods.
To arrive at a diagnosis, the clinician should consider the epidemiologic aspects
of the disease (i.e., common triggers and common associations) and the details of the
specific history. Afterwards, and in the context of these prior observations, the
appropriate testing has to be considered [23, 42].
1.2.9.2. Detection of food specific IgE
1.2.9.2.1. Skin prick test The skin prick test (SPT) introduces a tiny amount of allergen into the skin to
detect presence or absence of allergen-specific IgE in the surface of mast cells.
Therefore it only applies for the diagnosis of IgE mediated allergic reactions. The
procedure is quick, inexpensive and considered generally safe, although anaphylactic
reactions due to testing have occasionally been reported. The test can be carried out
on all age groups including babies, although the response will be considerably smaller
than in an adult.
Allergens tested are selected in accordance with the patient's clinical history. A
drop of the allergen (extract) solution is placed in the inner forearm and the skin is then

CHAPTER 1. INTRODUCTION
33
pricked through the drop using the tip of a lancet (Figure 1.13). Puncture allows
penetration of the extract on the superficial layers of the skin. With a positive test to an
allergen (defined as a mean wheal diameter 3 mm above the negative control [43]), the
skin becomes itchy within a few minutes and then becomes red and swollen with a
"wheal" in the center. Importantly, the size of the wheal does not indicate the severity of
symptoms. Negative SPT responses essentially confirm the absence of IgE-mediated
allergic reactivity (negative predictive accuracy, >90%). However, a positive test
response does not necessarily prove that the food is causal (specificity, <100%) and
merely shows sensitization.
Figure 1.13. Skin Prick Test. A drop of the allergen (extract) solution is placed in the inner
forearm and the skin is then pricked through the drop using the tip of a lancet. From:
Sciencephoto.com.
The negative control is a saline (salt-water) solution to which a response is not
expected. If a patient reacts to the negative control, then this will indicate that the skin
is, for whatever reason, extremely sensitive and that the results need to be interpreted
accordingly. The positive control solution contains histamine, to which everyone is
expected to react. Failure to do so could mean that medicines the patient is taking
might be blocking the response. It is recommended to avoid taking some
antihistamines about 6 weeks prior to the test.
When evaluating allergy to many fruits and vegetables, the fact that
commercially prepared crude extracts are often inadequate because of the lability of
the responsible allergen needs to be considered when the SPT result is negative and
the clinical history strongly suggests a particular sensitization. In these cases, the fresh
food might be used directly for testing (prick by prick test).

CHAPTER 1. INTRODUCTION
34
1.2.9.2.2. Serum specific IgE
Serum immunoassays to determine food-specific IgE antibodies in serum
provide another modality to evaluate IgE-mediated food allergy. The first in vitro test to
detect specific IgE antibodies to suspected or known allergen was a
radioimmunoassay test (RAST) in which the amount of radioactivity was proportional to
the serum IgE for the allergen. However, this method is no longer used and the
extensively validated ImmunoCAP system (or similar non-radioactive immunoassays)
is the one now used by primary care physicians and specialists in the routine
evaluation of food allergies due to the test ease, good performance and availability [6].
Similar to SPTs, many published studies have attempted to correlate serum-
specific IgE levels with results of food challenges and therefore to provide the clinician
with IgE levels that can predict the likelihood that a patient will react on ingestion of the
food [44]. Unfortunately, data from these studies are not always consistent and have
not been able to assign one specific cutoff value that provides optimum specificity and
sensitivity for any single food across all populations. However, in all studies, a direct
correlation has been reported between increasing concentrations of food-specific
serum IgE and the probability that an individual will react to an ingested food.
Importantly, undetectable serum food-specific IgE might be associated with clinical
reactions for 10% to 25%. Consequently, if there is a suspicion of possible allergic
reactivity, a negative SPT response and/or negative physician-supervised food
challenge result, are necessary to confirm the absence of clinical allergy [42].
Whole extracts from different allergenic sources (e.g., foods, pollens) have
been traditionally used for serum specific IgE detection. These extracts contain
mixtures of allergenic and non-allergenic components and are difficult to standardize
for their major allergens. Among the allergenic proteins, there are unique allergen
molecules, which are markers for a genuine sensitization for an allergen source, and
cross-reactive molecules (allergens that are present in many different allergen sources
and induce cross-reactivity between allergen extracts). Thus, the use of whole extracts
for diagnosis implies that a positive test does not clarify if there is a genuine
sensitization to a particular allergen source or it is only a cross-reactivity phenomenon
[45, 46].

CHAPTER 1. INTRODUCTION
35
Figure 1.14. Molecular content of extracts. Extracts made of biological allergen sources
contain allergenic as well as non-allergenic compounds and are hard to standardize. Pan-allergens are
molecules present in many different allergen sources and capable of inducing cross-reactivity between
allergen extracts of different allergenic sources [47]. Unique allergens are markers for a genuine
sensitization for an allergen source. From: Phadia website.
To overcome this problem, detection of specific IgE to individual components of
the allergenic source has recently been introduced in the clinical practice, allowing the
identification of the “real” culprit causing the allergic reaction. Not only a more accurate
diagnosis is achieved but also it has permitted to associate IgE responses to specific
proteins in foods with particular clinical outcomes. This novel approach is termed
Component-Resolved Diagnosis (CRD) [45] and is further discussed below.
1.2.9.3. Oral food challenges
Accurate diagnosis of food allergy and appropriate treatment options depend on
the verification of clinically relevant allergen specific IgE antibodies, as well as on the
identification of the responsible allergenic molecule(s). Importantly, a positive test (i.e.,
SPT, serum specific IgE) result merely identifies sensitization to a particular allergen
and does not permit definitive differentiation between clinically relevant and non-
relevant IgE reactivity.

CHAPTER 1. INTRODUCTION
36
The oral food challenge (OFC) consists on a gradual feeding of a possible
allergen under medical supervision to determine tolerance or clinical reactivity [42].
Since severe reactions could be elicited, the procedure has to be undertaken by
properly trained personnel with medications and equipment to treat anaphylaxis on
hand. Feeding is generally stopped when objective or persistent subjective symptoms
are elicited. For chronic disorders, in which an ingested food is currently a part of the
diet, diagnosis typically includes a period of elimination of the possible trigger food(s) to
determine whether symptoms resolve before an OFC. Caution is advised because
acute severe reactions are sometimes noted after reintroduction of a potential allergen
after prolonged dietary elimination.
Open or single blind OFCs are often used to screen for reactions. However, the
Double-Blind Placebo-Controlled Food Challenge (DBPCFC) is considered the gold
standard for diagnosis because bias is minimized. If the blinded challenge result is
negative, it must be confirmed by means of an open supervised feeding of a typical
serving of the food in its natural form to rule out a false-negative challenge result
(approximately 1% to 3%) [42].
1.2.9.4. Other tests The basophil activation test (BAT) is an in vitro assessment of allergic response
that requires only a small amount of whole blood and allows for a measurement of a
functional response beyond just the presence of IgE. The assay currently uses flow
cytometry to detect upregulation of certain cell surface markers (e.g., CD63) after
antigen stimulation in order to identify activated basophils. To date, some studies have
validated this method using mainly drug allergens, but its role in food allergy diagnosis
has yet to be defined in the clinical setting [42].
Food-specific IgG and IgG4 antibody levels do not have a role in the diagnosis
of food allergy. They are both likely to be positive in food allergic individuals as well as
healthy controls simply due to exposure [48].
Although not commercially available, determination of specific IgE-binding
epitopes on an allergen might provide increased diagnostic utility. The specific profiles
of epitopes bound might reflect distinctions in binding to areas of an allergen that are
dependent on protein folding (conformational epitopes) and are a feature of
mild/transient allergy versus areas that represent linear binding regions (sequential
epitopes) that are stable, reflecting a severe persistent allergy.
CHAPTER 1. INTRODUCTION
37
1.2.10. A therapy for food allergy
Despite food allergy is an increasingly prevalent problem in westernized
countries, there is currently no effective treatment than strict avoidance of the causal
food(s) [49]. While symptoms of the reaction can be reduced by pharmacological
treatment, allergen-specific immunotherapy (IT), based on the administration of
increasing doses of allergens to induce a state of allergen-specific non-responsiveness
[50], probably represents the only causative allergy treatment.
Several therapeutic strategies, both foods allergen-specific and nonspecific, are
under investigation targeting foods that most frequently provoke severe IgE-mediated
anaphylactic reactions (peanut, tree nuts and shellfish) or are most common in
children, such as cow’s milk and hen’s egg.
Allergen-specific approaches include oral (OIT), sublingual (SLIT) and
epicutaneous (EPIT) immunotherapy (desensitization) with native food allergens and
mutated recombinant proteins of decreased IgE-binding activity coadministered within
heat-killed Escherichia coli (HKE) to generate the maximum immune response. Diets
containing extensively heated (baked) milk and egg represent an alternative approach
to food OIT and are already changing the paradigm of strict dietary avoidance for
patients with food allergy [32, 51, 52].
Nonspecific approaches include monoclonal anti-IgE antibodies (e.g.,
Omalizumab), which might increase the threshold dose for food allergen in patients
with food allergy, and a Chinese herbal formulation (FAHF-2), which prevented peanut-
induced anaphylaxis in a murine model [53] and is currently being investigated in
clinical trials [49].
1.3. Molecular Diagnosis of Food Allergy
1.3.1. Component-Resolved Diagnosis
Diagnosis and specific IT have been traditionally performed with extracts
obtained from natural allergen sources. Attempts to isolate and purify the disease-
eliciting allergens from the natural allergen sources have been found too difficult and
expensive for routine application on diagnosis and therapeutic purposes. However,
advances in biochemistry and molecular biology in the last two decades allowed the

CHAPTER 1. INTRODUCTION
38
introduction of recombinant DNA technology in the field of allergen characterization,
providing an increasing number of recombinant allergens that in most cases have
immunological properties comparable with their natural counterparts. Actually,
molecular biology was initially applied in the field of allergy to study the primary
structure and molecular identity of allergens rather than to produce recombinant
allergens for diagnostic and therapeutic purposes. Nevertheless, the idea to produce
panels of recombinant allergens for clinical applications gained support after several
observations [45, 46].
First, sequence analysis of allergens indicated that structurally related allergens
exist in taxonomically related and unrelated species and that these cross-reactive
molecules are often not strictly discriminated by the patient’s immune system [54].
Second, immunological and biological investigations have shown that many, not all
[55], recombinant allergens behave similar to their natural counterparts [56]. Third, it is
possible to produce recombinant allergens which display most of the IgE epitopes
present in natural allergen extracts; and finally, the observation that diagnosis of most
patients with tree and grass pollen allergy was possible using only a limited number of
recombinant allergens [57, 58].
For the concept of using defined allergens (molecules) as opposed to allergen
extracts for diagnosis of Type I allergy, the term Component-Resolved Diagnosis
(CRD) was proposed [45]. Thus, CRD uses single allergenic molecules (components),
either recombinant or naturally purified, to precisely determine the individual patient’s
humoral reactivity profile (mainly IgE) with the aim of identifying the disease eliciting
molecule(s), i.e., the real triggers of the allergic reaction.
CRD generates valuable information relating to the clinical significance of
particular IgE reactivity profiles to allergens, eventually leading to the design of
diagnostic tests for more precise clinical questions or with enhanced diagnostic or
prognostic value. For instance, a positive reaction to an allergenic component with
cross-reactive potential may predict allergic reactions to all those allergen sources,
which contain immunologically related molecules. The remarkable increase in
knowledge of allergen components of a wide range of allergenic sources and their
applicability in allergy diagnosis and food allergy in particular has launched to their
acceptation in routine allergy diagnosis as a useful tool [46].
Moreover, the application of the microarray technology on CRD enables sIgE
testing in a multiplex format and allows for the simultaneous measurement of many IgE
clones with different specificities only using minute amounts of sera and antigens [59].
Component-resolved diagnostics using a commercially available microarray format

CHAPTER 1. INTRODUCTION
39
(ImmunoCAP ISAC™, Phadia ThermoFisher Scientific ®, Sweden) has recently been
introduced into the clinical allergy practice.
Although, microarrays with large numbers of allergenic components can be very
helpful in epidemiological and basic research studies, the clinical practice probably
requires a simplified diagnostic tool with limited set of well-validated sensitization
markers that can facilitate the diagnosis and predict potential cross-reactivity and
clinical symptoms, which actually aims to solve a diagnostic problem. Thus, a careful
selection of the allergens included based on their diagnostic value and not on their
availability is needed [60].
1.3.2. Component-Resolved Immunotherapy Although a great progress has been achieved on the standardization of allergen
extracts by using monoclonal antibodies, current forms of extract-based treatment still
cannot be individualized to include relevant allergens only. Rather, all patients showing
allergic reactions to proteins present in a particular allergen source are treated with the
same complex extract regardless of their individual sensitization profiles.
The allergen extract is commonly administered with an adjuvant and may
therefore induce immune reactions against extract components not recognized before
treatment. Such immunotherapy-induced sensitization has been reported to grass
pollen allergens [61], for instance.
CRD is very important not only because it allows a more reliable diagnosis of
the allergic patient, but also because it helps in the identification of better candidates
for therapeutic purposes. Components identified as real triggers of the allergic
response to a particular allergen can be genetically engineered or serve as templates
for the design of synthetic hypoallergenic allergen derivatives with reduced
anaphylactic activity for use in patient-tailored treatment. This concept is known as
Component-Resolved Immunotherapy (CRIT) [45] and it opens new perspectives for
food allergy therapy [62] (Figure 1.15).

CHAPTER 1. INTRODUCTION
40
Figure 1.15. Production of recombinant allergens and selection for vaccine formulation. From [62].
1.3.3. Epitope mapping
The group of amino acids within allergenic proteins that is bound by IgE
antibodies is called IgE binding epitope or B-cell epitope [63]. Each allergen source
contains many different allergenic components and each of them has several epitopes.
Importantly, every species contain species-specific allergen epitopes and antibodies
formed to these structures bind only to the allergen epitopes in this particular species.
However, since proteins with similar structures are often also present in biologically
related species, epitopes can be shared between them, leading to cross-reactivity
phenomena.
There are two types of IgE-binding epitopes in allergens, sequential and
conformational [64]. A sequential (or linear) epitope is a sequence of contiguous amino

CHAPTER 1. INTRODUCTION
41
acids in the primary structure of the protein, whereas a conformational epitope
comprises amino acids that line up because of the tertiary structure of the protein.
Sequential epitopes have been suggested to be more important in food allergens,
which are usually consumed once cooked and go through digestion in the
gastrointestinal tract (heat and acid conditions cause denaturation and alteration in
tertiary structure before reacting with the immune system). In contrast, conformational
epitopes are described more relevant in respiratory allergens and patients with oral
allergy syndrome (due to cross-reactivity between conformational epitopes of food
allergens and homologous pollen-related allergens).
However, the relevance of IgE binding to short peptides has also been
challenged [65]. Recently, IgE binding to short peptides of Pen a 1 (shrimp
tropomyosin) and Ara h 2 (peanut seed storage protein) was found to contribute little to
the IgE binding particularly in fluid phase antibody/target interaction, suggesting that
conformational epitopes are more important.
Methodology to determine IgE sequential epitopes has developed over the last
few years. The conventional method, the fragmentation approach, involved partial
protease digestion or chemical cleavage at sites of specific amino acids of the food
allergen, followed by western blotting using patients’ sera and amino acid sequencing
of IgE-binding fragments. This method was restricted by the position of the cleavage
sites of the allergens. Next a more flexible system, the SPOT membrane-based
immunoassay technology, was introduced. On that, overlapping peptides covering the
primary amino acid sequence were synthesized in situ on a nitrocellulose membrane,
incubated with the patient’s sera and peptides bound by IgE antibodies were detected
using antihuman-IgE antibody labeled with peroxidase, followed by the addition of a
chemoiluminescent substrate and exposure to radiographic film. Several
disadvantages of the SPOT-membrane technique (e.g., large volumes of patient sera
required, time-consuming peptide synthesis, expensive and error prone) called for the
development of a novel immunoassay that utilizes the high throughput microarray
platform and commercially synthesized peptides [66]. The microarray allows the
screening of thousands of target peptides in parallel using microliter quantities of
serum. The peptide spots bound by human IgE antibodies are detected using
fluorescent labeled secondary antibodies followed by scanning with a microarray
scanner, which is much more convenient than radiographic film development, providing
quantitative data rather than semi-quantitative or qualitative results such as the
previous methods. Moreover, its redundancy allows more robust replication and
statistical approaches [67].

CHAPTER 1. INTRODUCTION
42
IgE epitope-mapping with peptide microarrays have been shown to provide an
additional tool for allergy diagnosis and prognosis [63]. Informative IgE-binding
epitopes have been identified as biomarkers of clinical severity, persistence or both in
patients’ with some food allergies. For peanut allergy, clinical sensitivity determined by
means of DBPCFC has been positively related to broader epitope recognition [68].
Also, patients with persistent milk allergy showed increased epitope diversity and
stronger IgE affinity binding compared to patients with transient milk allergy or
tolerance to extensively heated milk [69].
Studies of conformational epitopes are far behind those of sequential epitopes
due to the limitation of available three-dimensional structures of food allergens and the
difficulty of maintaining protein stability. The recently developed mimotope mapping
technique is another option for mapping conformational epitopes [70]. Briefly, using
random peptide phage-display libraries, peptides are generated and screened with
purified allergen specific IgE. The selected peptides that mimic the binding sites of the
allergen but do not correspond to its sequential sequence are known as mimotopes.
The resulting mimotope can be mapped onto the three dimensional structure of the
allergen using computational biological techniques. Using this technique, IgE
conformational epitopes of important major allergens, such as fish parvalbumin [71]
and the peach LTP (Pru p 3) [72], have been identified.
For all described so far, IgE epitope mapping of allergens is considered a
further step in developing molecular allergy diagnosis with attractive perspectives.
1.4. Shellfish Allergy
1.4.1. Prevalence and clinical characteristics
Shellfish allergy is common among children and adults in western countries
such as Europe, United States and Australia, but seems to be even more prevalent in
Asian countries where allergic reactions to seafood and particularly shellfish are very
common, probably due to their dietary habits [73]. In fact, the actual prevalence is
difficult to determine due to a lack of accurate controlled population-based studies
incorporating DBPCFCs. Reported rates of shellfish allergy vary among countries:
Canada, 1.42%; USA, 2%; and Singapore, 5.2% (14-16 years-olds) [20]. In a
prospective Spanish study, Alergológica 2005, shellfish was the offending food in 22%

CHAPTER 1. INTRODUCTION
43
of the subjects diagnosed with food allergy, being the third most common food allergy
culprit, after fruits and tree nuts [74].
The pattern of allergic symptoms after ingestion of shellfish appears similar to
the symptoms experienced due to other allergenic foods. Reactions are usually
immediate (reported mostly within 2 hours), but late-phase reactions have also been
reported up to 8 hours after ingestion. Respiratory reactions are often seen. In
particular, crustacean allergic subjects often experience OAS, within minutes after
ingestion they suffer itching and angioedema of the lips, mouth and pharynx. Patients
may have a single symptom but often there is multi-organ involvement and reactions
are severe, with frequent anaphylaxis. Noteworthy, one of the first clinical reports
highlighting the existence of exercise-induced anaphylaxis due to food was presented
by Maulitz et al. [75] after the ingestion of oysters. Similar findings have subsequently
been reported for other shellfish species [73]. According to the National Electronic
Injury Surveillance System (NEISS) in the United States, shellfish may account for up
to 24% of the emergency department visits for food-allergic events [76, 77]. Recent
studies estimated the frequency of United Stated emergency department visits/year at
203,000 for food-related acute allergic reactions and 90,000 for those with anaphylaxis
[78].
Allergic symptoms occur not only from ingestion, but can also be triggered by
inhaling cooking vapors and handling shellfish in the domestic and/or occupational
environment. In this case, symptoms manifest mainly as upper and lower airway
respiratory symptoms and dermatitis, while systemic anaphylaxis is rarely seen with
this type of exposure [73].
Despite the high prevalence and severity of these food-allergic reactions, there
is still no cure and accurate diagnosis and avoidance are the only recommended
options [79]. Shellfish allergic patients usually avoid all types of shellfish for life after
diagnosis [80].
1.4.2. Shellfish allergens and cross-reactivity
Shellfish includes both crustaceans and mollusks. However, most species
provoking allergic reactions belong to the class Crustacea, which includes shrimp, by
far the most frequently involved. It is noteworthy that crustacean and mollusk allergens
do not cross-react with fish allergens and no reactivity between known allergens or
homologous proteins has currently been demonstrated [73].

CHAPTER 1. INTRODUCTION
44
Tropomyosin (TM) is considered to be responsible for most of the allergenic
activity of shrimp [73, 81], but other allergens have been identified and characterized in
crustaceans: Arginine kinase (AK) [82, 83], Myosin Light Chain (MLC) [84],
Sarcoplasmic Calcium-binding Protein (SCP) [85], as well as, three new allergenic
shrimp proteins that have been identified, although not fully characterized
(hemocyanin, fatty-acid binding protein and troponin C) [86].
In shrimp, tropomyosin represents 20% of soluble proteins and it is really
abundant in the cooking broth. Its thermostability permits its vehiculation on cooking
steam and therefore sensitization or allergic reactions can occur through inhalation
(respiratory exposure). Over 85% of shrimp allergic patients are sensitized to
tropomyosin and the IgE response towards this allergen represents the 80% of the IgE
response to the whole extract of shrimp [5].
Tropomyosins represent a family of highly conserved proteins, present in
muscle and non-muscle cells of vertebrates and invertebrates, but only the ones of
invertebrates are allergenic. Tropomyosin is the main panallergen in the animal world
and sensitization to it accounts for the cross-reactivity between shellfish and other
invertebrates, such as arthropods (dust mites (Der p 10, Der f 10) and cockroach (Per
a 7, Bla g 7), nematodes parasites and mollusks [73, 79 and 87].
To date, there is limited information about the clinical relevance of sensitization
to particular shrimp allergens as well as the role of allergens other than tropomyosin in
cross-reactivity phenomenon, despite the improvement on knowledge of shellfish
allergens in the last years, when important allergens have been cloned and
characterized.
1.4.3. Diagnosis of shellfish allergy
Shellfish allergy diagnosis is aided by clinical history, SPT and quantification of
sera specific IgE. However, positive test results, alike other food allergies, are not
necessarily proof of clinical reactivity, basically due to the high cross-reactivity that
exists with other arthropods [79].
Therefore, DBPCFC is still the most reliable method to confirm the clinical
relevance and to identify putative species. However, as mentioned earlier on this
chapter, they are not entirely practical considering time requirements and the risk of
inducing potential severe reactions. Thus, research is focusing on the development of

CHAPTER 1. INTRODUCTION
45
diagnostic methodology that may eliminate the need for oral food challenges. However,
a limited number of studies are published trying to address this issue.
The relevance of sensitization to tropomyosin has recently been studied in dust
mite-allergic subjects sensitized to shrimp. Tropomyosin-specific IgE (Pen a 1, Phadia)
was found to have greater diagnostic efficiency compared to whole shrimp-specific IgE
or SPT (88.5%, 74.2% and 65.7% respectively) [88]. A panel of six allergens
(tropomyosin, arginine-kinase, sarcoplasmic calcium-binding protein, a novel myosin
light chain, troponin C and triosephosphate-isomerase) of the North Sea shrimp
(Crangon crangon) has been very recently suggested to develop a more sophisticated
and clinically adequate methods of diagnosis and treatment of shrimp allergy [89].
Ayuso R et al. identified the IgE-binding epitopes of four shrimp allergens (Lit v
1-4) in 2010 [90]. However, no attempt was then made to correlate epitope or allergen
recognition with different clinical profiles. Just recently, Ayuso R et al. identified some
of these epitopes as clinically relevant in a pilot study [91].
1.5. Plant-Food Allergy
1.5.1. Main culprit foods and allergen families
Plant food allergy is the most common food allergy among older children and
adults [92-95]. Peanut, followed by tree nuts, are the plant foods most commonly
involved in allergic reactions in the United States and United Kingdom. However, in
Central and Northern Europe (especially in birch trees rich areas), and in the
Mediterranean, the prevalence of peanut allergy decreases but tree nuts (mainly
hazelnut, followed by walnut) and fruits – especially those belonging to the Rosaceae
family (including apple, peach and pear) and kiwi – emerge as important food allergies
[96]. A meta-analyses on published studies including food challenge tests for diagnosis
showed prevalence ranging from 0.1% to 4.3% each for fruits and tree nuts, 0.1% to
1.4% for vegetables, and <1% each for wheat, soy and sesame [97]. Fresh fruits,
mainly Rosaceae, were found responsible for 33.3% of the diagnosed food allergies
(7.4% of 4991 patients) in Spain [74].
Remarkably, only 4 protein families contain nearly 60% of all plant-food
allergens. This indicates that conserved structures and biological activities play a role
in determining or promoting allergenic properties. These families are the prolamin

CHAPTER 1. INTRODUCTION
46
superfamily (includes 2S-albumin seed storage proteins and the non-specific lipid
transfer proteins among others), the cupin superfamily (contains the vicilin and the
legumin-type seed storage globulins), the profilins and proteins related to the major
birch pollen allergen Bet v 1 [98-100]. Figure 1.16 shows a classification of these plant
food proteins based on their function in plants [5].
Figure 1.16. Plant-food proteins described as allergens. Adapted from [5].
Fruit allergy has a remarkable different picture across Europe [101-104]. In the
Northern and Center, it represents an important cross-reactivity phenomenon involving
homologous allergens in both pollens and plant-foods, mainly Bet v 1 homologues
[105] and profilins [106], usually expressed as OAS. In contrast, in the South, both fruit
allergy with and without (>20%) [107, 108] pollen sensitization is observed. Non-
specific lipid transfer proteins (nsLTPs) are mainly involved and, despite OAS is also
present, higher frequency of allergic systemic reactions are reported [109]. Apple is the
most frequent culprit in Northern- and Central-Europe, whereas peach is definitely the
one in the South, where clinically relevant peach allergy is mainly related to Pru p 3
(peach lipid transfer protein, LTP), its major allergen [108].
1.5.2. Non-specific lipid transfer proteins
NsLTPs, usually referred as LTPs (Lipid transfer proteins) only, are important
allergens in fruits, vegetables, nuts, pollen and latex. Despite their wide distribution
throughout the plant kingdom, their clinical relevance is largely confined to the
Mediterranean area, but the reasons for this fact are not clearly understood yet [110].
They belong to the prolamin superfamily, which includes a range of important
plant allergens. Their small structure is characterized by a highly conserved pattern of

CHAPTER 1. INTRODUCTION
47
six to eight cysteines forming three to four disulfide bridges. They have low molecular
mass (around 9 kDa), basic character and they are highly expressed in the epidermal
or peripheral layers of cutinized organs. Importantly, they are stable at low pH and
resistant to proteolysis and temperature [111]. Thanks to these peculiar molecular
characteristics, nsLTPs have been proposed as a model allergen for true food allergy
(food allergy class I). They reach the intestinal immune system in an immunogenic way
allowing them a direct sensitization and in the following expositions to induce severe
systemic reactions [112].
1.5.3. The LTP-syndrome
Sensitization to LTP can be clinically presented through a range of mild to
severe, sometimes life-threatening, symptoms. In most cases, the ingestion of plant
food LTPs causes symptoms in the oral cavity. However, it became evident from very
early reports on these allergens that they are also capable of eliciting severe
generalized reactions. Unlike other allergen groups (e.g., Bet v 1-related food allergens
or profilins), LTPs can be responsible for severe reactions upon the ingestion of fresh
as well as processed foods [109].
Clinically relevant cross-reactivity among LTPs from taxonomically related and
unrelated plants has been demonstrated, especially when the amino acid sequence
identity is quite high [110]. The widely documented extensive cross-reactivity, in vivo
and in vitro, is probably due to the ubiquitous distribution of LTPs in the plant kingdom,
which makes sensitization to multiple foods very common in these patients, commonly
referred to LTP Syndrome [109].
Although sensitization to Pru p 3 can be found with and without associated
pollinosis, the majority of patients allergic to peach present an associated pollen allergy
as well as other food allergies, mainly to other Rosaceae, but also to other non-
Rosaceae vegetable foods. Actually in 2007, Zuidmeer and Van Ree [113], reported
that there is possibly more than one LTP-Syndrome: (1) primary sensitization to food
LTP without concomitant pollen allergy; (2) primary sensitization to a food allergen
against a background of existing pollen allergy, (3) primary sensitization to a pollen
allergen.
Given all this peculiar characteristics of LTPs, the clinician encounters with a
clinically complex patient with sensitization to multiple plant-food allergens and with
multiple clinical manifestations of variable severity that in some occasions can in
addition be exacerbated by cofactors. Variability of severity of symptoms may

CHAPTER 1. INTRODUCTION
48
represent distinct patterns of allergen sensitization. The large number of allergenic
members of plant food allergens described, brings up the need of accurate diagnostic
tools to determine the allergen sensitization profile of these patients.
Despite substantial advances have been achieved in the last years regarding
allergy characterization, there is still a need to further study the elements involved in
the allergic response, not only with the aim to improve diagnosis and treatment, but to
clarify the underlying mechanisms involved that lead to the diversity of clinical and
molecular profiles observed in allergy, and food allergy in particular.

49
CHAPTER 2. HYPOTHESIS AND OBJECTIVES

CHAPTER 2. HYPOTHESIS AND OBJECTIVES
50

CHAPTER 2. HYPOTHESIS AND OBJECTIVES
51
HYPOTHESIS AND OBJECTIVES
2.1. Hypothesis
All described above encourages the use of panels of allergenic molecules
(components) as well as synthetic sequential peptides for an elaborate molecular
analysis of sensitization patterns in patients with food allergy. The hypothesis of this
thesis was that CRD and epitope mapping improve the clinical and molecular
characterization of shellfish allergy and LTP-syndrome.
2.2. Objectives
Thus, the whole aim of this thesis is to characterize shellfish allergy and LTP-
syndrome at a clinical and molecular level by CRD and epitope mapping.
Specific objectives:
Part 1. Component-Resolved Diagnostics and epitope recognition in shellfish
allergy
1. To determine profiles of shellfish allergen sensitization resulting into clinical
reactivity.
Part 2. Lipid Transfer Protein syndrome: clinical pattern and molecular
sensitization profile to plant-foods and pollens
1. To clinically characterize LTP-syndrome in patients from our area.
2. To determine the utility of CRD in a microarray format as a tool in the diagnostic
work-up of patients with multiple plant-food allergies who present a broad
diversity of clinical symptoms that do not reveal a particular pattern of
sensitization.

52

53
CHAPTER 3. MATERIAL AND METHODS

CHAPTER 3. MATERIAL AND METHODS
54____ 5454
CHAPTER 3. MATERIAL AND METHODS
55____ 5555
MATERIAL AND METHODS
3.1. Patient selection 3.1.1. Shrimp sensitized subjects This was a multicenter study with participation of the Allergy Clinic of Mount
Sinai Medical Center, New York, USA; the Division of Clinical Immunology and Allergy,
University of São Paulo School of Medicine, São Paulo, Brazil; and the Allergy Clinic of
Hospital Infantil Universitario Niño Jesús, Madrid, Spain. Subjects were recruited from
2008 to 2011. Inclusion criterion was positive shrimp SPT and/or shrimp-specific serum
IgE.
Subjects were divided into two groups based on whether histories of immediate
allergic reactions following shrimp ingestion were reported. DBPCFC was performed to
all the individuals, except those reporting an anaphylaxis episode within the previous 3
months. When DBPCFC was negative, an oral open challenge with shrimp was
performed to reassure tolerance.
Two group controls were included, one of subjects sensitized to house-dust
mite (HDM) and/or cockroach with no sensitization to shrimp and no reported histories
of immediate allergic reactions after ingestion, and one of non-atopic individuals.
3.1.2. Multiple plant-food allergic subjects
Patients diagnosed of multiple plant-food allergy with at least two of the different
plant-foods involved (peach and an other plant-food not taxonomically related to
Rosaceae), sensitized to LTP and other inhalant and food allergens were selected from
the Allergy Unit – Department of Pneumology and Allergy, Hospital Clínic, Barcelona,
Spain, for further analysis. Diagnosis on these patients had been established on the
basis of symptoms compatible with IgE-mediated food allergy: urticaria, oral allergy
syndrome (OAS), gastrointestinal disorders (GID), anaphylaxis; positive skin prick test
(SPT) and specific IgE determination. All subjects recruited were inhabitants of the
Barcelona area (Catalonia, Spain). Written informed consent was obtained and the
Local Ethics Committee approved the study.

CHAPTER 3. MATERIAL AND METHODS
56____ 5656
For both groups (shrimp and plant-food allergic subjects), clinical history of each
patient was reviewed looking for symptoms, culprit foods, cofactors and other
epidemiological relevant data. The local ethical committees approved the studies and
informed consent was obtained from all patients.
3.2. Skin Prick Test
As described above (section 1.2.9.2.1), SPTs with commercial extracts are
used to detect the presence of allergen specific IgE on the surface of human mast cells
(state termed sensitization). Prick-by-prick tests are performed by direct contact with
the allergenic source.
For detection of sensitization to shrimp prick-by-prick tests with raw shrimp
obtained from a local market were performed.
For the evaluation of the sensitization to plant-food and pollen allergenic
sources SPTs were performed using whole extracts commercially available (ALK-
Abelló, Madrid, Spain). The same standard panels of common allergens and pollens
tested in the Allergy Unit of Department of Pneumology and Allergy, Hospital Clínic,
Barcelona for routine diagnosis were used for the present study.
The plant-food allergens panel includes: peach peel, maize, wheat, hazelnut,
mustard, lettuce, kiwi; and the aeroallergens panel consists of: grass, mugwort
(Artemisia vulgaris), wall pellitory (Parietaria judaica), olive (Olea europaea), cypress
(Cupressus sempervivens), plane tree (Platanus acerifolia), dust mites, alternaria,
aspergillus, cat- and dog-dander.
The tests were performed following standard procedures for SPTs [43] to all
subjects, except for three that rejected being tested. Briefly, on the forearm area
comprised between 5 cm above the wrist and 3 cm below the elbow, the spots where
each extract would be applied were conveniently labeled with a pen and separated by
at least 2 cm. On each spot, a drop of the corresponding extract was applied and the
center was punctured with a lancet (single use) with a 90º angle to the skin. Read-out
of the reaction was done usually after 15-20 minutes of test performance that coincides
with the maximal reaction point of extracts, although them maximal response to
histamine is usually achieved after 10-15 minutes. The wheal produced by the allergen
was measured and compared to the negative control. Histamine dihydrochloride (10
mg/mL) and PBS buffer/glycerol solution were positive and negative controls,

CHAPTER 3. MATERIAL AND METHODS
57____ 5757
respectively. A mean wheal diameter of ≥ 3mm compared to negative control was
considered positive.
3.3. Oral food challenge
All the subjects and controls recruited for the shellfish allergy characterization
study were submitted to oral food challenge (DBPCFC) to evaluate their clinical
reactivity, except those with a moderate – severe anaphylactic reaction following
shrimp ingestion within the previous 3 months. A cold pudding was made of chocolate
and vanilla ice cream, vanilla aroma and cacao powder. The active meal contained
also grinded boiled shrimp obtained from a local market. The maximum amount of
shrimp in a given blinded challenge was 24 grams (12 peeled shrimp tails). Five
investigators confirmed that preparation was adequately blinded. None of the subjects
were lactose intolerant or allergic to any compound in the pudding. In case of a
negative DBPCFC, the subject received an open challenge with shrimp.
Subjects diagnosed of multiple plant-food allergy were not challenged after
recruitment for the present study.
3.4. Specific IgE detection by ImmunoCAP System
The ImmunoCAP System (Phadia Thermo Fisher Scientific, Uppsala, Sweden)
is an automated system based on the fluorescent enzyme immunoassay (FEIA) that
measures allergen-specific IgE in serum or plasma samples. Over 650 different
allergens (extracts) and 70 allergen components are commercially available to date
(Figure 3.1). The ImmunoCAP solid phase consists of a cellulose derivative enclosed
in a capsule to which the allergen is covalently attached after being activated with
cyanogen bromide. The hydrophilic, highly branched polymer provides an ideal
microenvironment for allergens, binding them irreversibly while maintaining their native
structure. The test is designed as a sandwich immunoassay. This technology ensures
binding of all relevant antibodies, regardless of antibody affinity, still giving low non-
specific binding.
ImmunoCAP specific IgE detects IgE antibodies in the range 0 to 100 kUA/L,
where A represents allergen-specific antibodies. The result is reported quantitatively. In
clinical practice, 0.35 kUA/L has commonly been used as a cut-off, although 0.1 kUA/L

CHAPTER 3. MATERIAL AND METHODS
58____ 5858
has been also suggested. A large number of studies have evaluated the clinical
performance of this test in allergy diagnosis. Thus, sensitivity and specificity have been
reported from multi-center studies including several hundred patients tested for a range
of different allergens and they have been estimated of 84-95% and 85-94%,
respectively. Moreover, the system includes standard reagents for a calibration curve
as well as the corresponding quality controls for the procedure.
Briefly, first the serum is incubated with the CAP System containing the allergen
and following a washing step is performed to clear the non-specific IgE present in the
sample. Afterwards, incubation with a secondary antibody (IgG monoclonal anti-IgE
antibody) labeled with an enzyme (beta-galactosidase) is performed. If allergen specific
IgE is present on the patient serum, an immunocomplex is formed (allergen > serum
allergen-specific IgE > anti-IgE-enzyme). Incubation is followed by another washing
step to clear not bound secondary antibody. After, a developing solution (4-metil-
umbeliferil-beta-D-galactoside) is added to the system that acts as a substrate for the
enzyme, resulting in a fluorescent product. Finally the fluorescent reaction is
interrupted with a stop solution (calcium carbonate). Fluorescence is measured with a
fluorometer, which extrapolates the values obtained for the patient sample to a
calibration curve set with the standard reagents and the controls. The change in
fluorescence of the sample is directly proportional to the IgE content of the serum.
Using the ImmunoCAP system it is also possible to determine the total content
of IgE in a sample. However, in this case a monoclonal anti-IgE is attached to the solid
phase instead of a specific allergen [114].
Figure 3.1. Main components of the ImmunoCAP System. The cellulose discs coated with the
allergen are placed inside capsules. Capsules are presented inside cylinders (resembling a pen)
containing usually 10-12 units. Auto analyzers are able to identify both the sample and the
allergen through barcode or sample identification. There are several auto analyzers available
depending on the amount of samples that can be processed in one run (e.g., ImmunoCAP 100,
250, 1000, etc.). Adapted from [114].

CHAPTER 3. MATERIAL AND METHODS
59____ 5959
The ImmunoCAP System with the auto analyzer ImmunoCAP 250 (Phadia
Thermo Fisher Scientific®, Uppsala, Sweden) was used to detect total IgE and specific
IgE to commercially available extracts and specific components (Phadia Thermo Fisher
Scientific®, Uppsala, Sweden).
In multiple plant-food allergic subjects, available data on total and specific IgE
to peach (f95, Prunus persica), mugwort (w6, Artemisia vulgaris), plane tree (t11,
Platanus acerifolia), and the components Pru p 3, Pru p 1, Pru p 4 (f420, peach LTP;
f419, PR-10/Bet v 1 homolog and f421, profilin; respectively) determined by
ImmunoCAP (Phadia, Thermo Fisher Scientific®), was collected from patients’ clinical
history. Specific IgE antibodies > 0.35 kUA/L (ImmunoCAP) were considered positive.
In the shellfish allergic group and the corresponding controls of the study,
specific IgE to shrimp (f24, which is a mixture of 4 different species of shrimp:
Pandalus borealis, Penaeus monodon, Metapenaeopsis barbata and Metapenaeus
joyneri), dust mite (d1, Dermatophagoides pteronyssinus) and cockroach (i6, Blatella
germanica) extracts were measured.
Specific IgE antibodies > 0.35 kUA/L were considered positive for all of them.
3. 5. Specific IgE detection by microarray
ImmunoCAP ISAC (Phadia Thermo Fisher Scientific®, Uppsala, Sweden) is an
advanced in vitro diagnostic test including biochip technology that allows simultaneous
measurement of specific IgE antibodies to a broad spectrum of allergen components in
a single test, using a minute amount of sample.
The panel of allergen components includes genuine markers of sensitization
(species specific) as well as cross-reactive ones. The version used for this study
includes 103 components of over 50 different allergenic sources (Table 3.1). Allergen
components are immobilized on the biochip in triplicates. The system is available for
IgE and IgG4 antibodies detection.
Its use is especially indicated for complex cases such as those with inconsistent
case history, unsatisfactory response to treatment or polysensitized patients.
Briefly, 20μL of serum are added to the microarray and incubated for two hours
at room temperature. Successive washes are done prior to one-hour incubation with an
anti-human IgE secondary antibody-fluorescence-labeled at room temperature
protected from light. After washes and drying, fluorescence signal is detected using a
laser scanner (Perkin Elmer). Analysis of corresponding digitized microarray image

CHAPTER 3. MATERIAL AND METHODS
60____ 6060
data is performed with the Phadia MIA software to obtain numerical data according to
calibration sera of known IgE content (Figure 3.2). ImmunoCAP ISAC is a semi-
quantitative test and results are reported in ISAC Standardized Units for specific IgE
(ISU) [114].
Figure 3.2. ImmunoCAP ISAC test principle. Schematic representation of ImmunoCAP ISAC
test performance. From [114].
The ImmunoCAP ISAC was used following the manufacturer’s protocol briefly
described above to evaluate the presence and absence of specific IgE towards the
components present in the array in the cohort of patients diagnosed of multiple plant-
food allergy.
Specific IgE antibodies > 0.3 ISU were considered positive for all of them.
ALLERGEN COMPONENT ALLERGEN SOURCE PANALLERGEN Plants, Specific Markers Act d 1 Kiwi Actinidia deliciosa Act d 2 Kiwi Actinidia deliciosa Act d 5 Kiwi Actinidia deliciosa Act d 8 Kiwi Actinidia deliciosa PR-10 Aln g 1 Alder Alnus glutinosa PR-10 Amb a 1 Ragweed Ambrosia artemisiifolia Ana o 2 Cashew nut Anacardium occidentale Api g 1 Celery Apium graveolens PR-10 Ara h 1 Peanut Arachis hypogaea Ara h 2 Peanut Arachis hypogaea Ara h 3 Peanut Arachis hypogaea Ara h 8 Peanut Arachis hypogaea PR-10 Art v 1 Mugwort Artemisia vulgaris Art v 3 Mugwort Artemisia vulgaris LTP Ber e 1 Brazil nut Bertholletia excelsa Bet v 1 Birch Betula verrucosa PR-10 Cor a 1.0101 Hazel pollen Corylus avellana PR-10 Cor a 1.0401 Hazelnut Corylus avellana PR-10 Cor a 8 Hazelnut Corylus avellana LTP

CHAPTER 3. MATERIAL AND METHODS
61____ 6161
Cor a 9 Hazelnut Corylus avellana Cry j 1 Japanese cedar Cryptomeria japonica Cup a 1 Cypress Cupressus arizonica Cyn d 1 Bermuda grass Cynodon dactylon ALLERGEN COMPONENT ALLERGEN SOURCE PANALLERGEN Dau c 1 Carrot Daucus carota PR-10 Gly m 4 Soybean Glycine max PR-10 Gly m b-conglycinin Soybean Glycine max Gly m glycin Soybean Glycine max Hev b 1 Latex Hevea brasiliensis Hev b 3 Latex Hevea brasiliensis Hev b 5 Latex Hevea brasiliensis Hev b 6 Latex Hevea brasiliensis Mal d 1 Apple Malus domestica PR-10 Ole e 1 Olive Olea europaea Par j 2 Wall pellitory Parietaria judaica LTP Pla a 1 Plane tree Platanus acerifolia Pla a 2 Plane tree Platanus acerifolia Phl p 1 Timothy Phleum pratense Phl p 2 Timothy Phleum pratense Phl p 4 Timothy Phleum pratense Phl p 5 Timothy Phleum pratense Phl p 6 Timothy Phleum pratense Phl p 11 Timothy Phleum pratense Pru p 1 Peach Prunus persica PR-10 Pru p 3 Peach Prunus persica LTP Sal k 1 Saltwort Salsola kali Ses i 1 Sesame seed Sesamum indicum Tri a 18 Wheat Triticum aestivum Tri a 19 crude gliadin Wheat Triticum aestivum Tri a a 19 Omega 5 Gliadin Wheat Triticum aestivum Tri a aA_TI Wheat Triticum aestivum Plants, Cross Reactive Markers Ana c 2 Bromelin Ananas comosus CCD marker Bet v 2 Birch Betula verrucosa Profilin Bet v 4 Birch Betula verrucosa CBP Hev b 8 Latex Hevea brasiliensis Profilin Mer a 1 Annual mercury Mercurialis annua Profilin Ole e 2 Olive Olea europaea Profilin Phl p 7 Timothy Phleum pratense CBP Phl p 12 Timothy Phleum pratense Profilin
Non-Plants, Specific Markers Alt a 1 Alternaria Alternaria alternata Alt a 6 Alternaria Alternaria alternata Ani s 1 Anisakis Anisakis simplex Api m 1 Honey bee venom Apis mellifera Api m 4 Honey bee venom Apis mellifera Asp f 1 Aspergillus Aspergillus fumigatus Asp f 2 Aspergillus Aspergillus fumigatus Asp f 3 Aspergillus Aspergillus fumigatus Asp f 4 Aspergillus Aspergillus fumigatus Asp f 6 Aspergillus Aspergillus fumigatus Bla g 1 Cockroach Blattella germanica Bla g 2 Cockroach Blattella germanica Bla g 4 Cockroach Blattella germanica Bla g 5 Cockroach Blattella germanica Bos d 4 Milk, α-lactalbumin Bos domesticus Bos d 5 Milk,β-lactoglobulin Bos domesticus Bos d 6 BSA Bos domesticus Bos d 8 Milk, Caseins Bos domesticus Bos d lactoferrin Milk, Lactoferrin Bos domesticus Can f 1 Dog Canis familiaris Can f 2 Dog Canis familiaris Can f 3 Dog Canis familiaris Cla h 8 Cladosporium Cladosporium herbarum
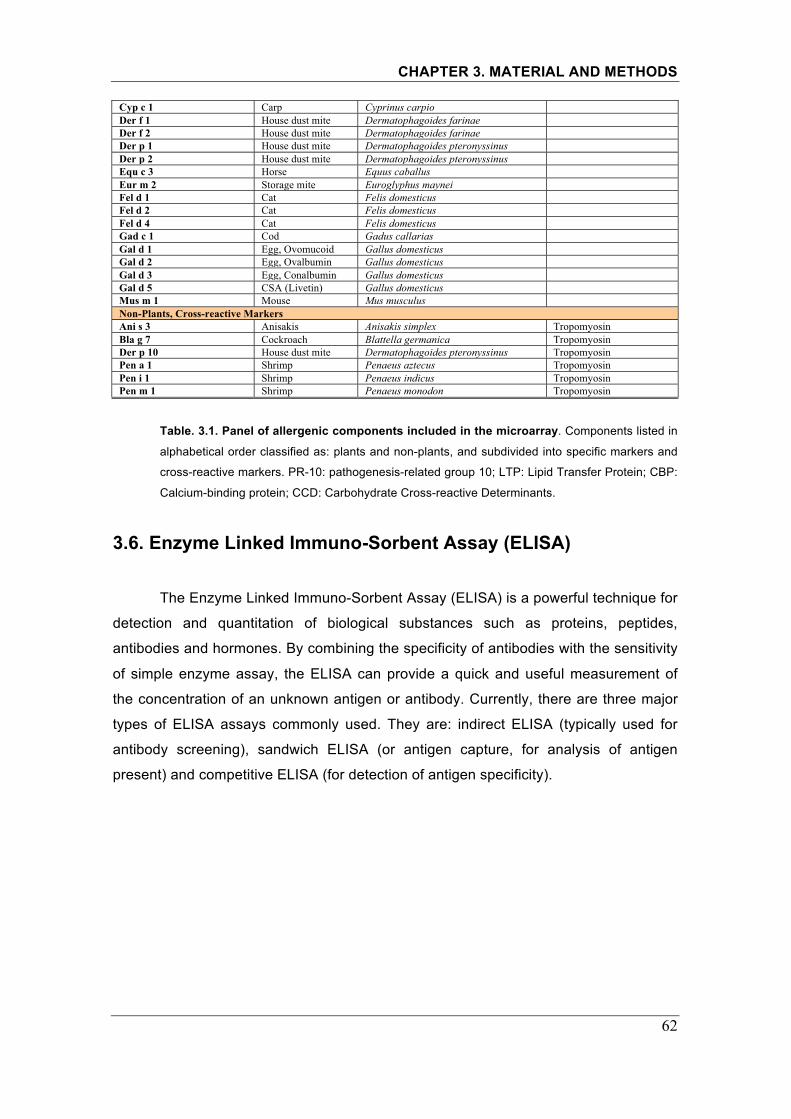
CHAPTER 3. MATERIAL AND METHODS
62____ 6262
Cyp c 1 Carp Cyprinus carpio Der f 1 House dust mite Dermatophagoides farinae Der f 2 House dust mite Dermatophagoides farinae Der p 1 House dust mite Dermatophagoides pteronyssinus Der p 2 House dust mite Dermatophagoides pteronyssinus Equ c 3 Horse Equus caballus Eur m 2 Storage mite Euroglyphus maynei Fel d 1 Cat Felis domesticus Fel d 2 Cat Felis domesticus Fel d 4 Cat Felis domesticus Gad c 1 Cod Gadus callarias Gal d 1 Egg, Ovomucoid Gallus domesticus Gal d 2 Egg, Ovalbumin Gallus domesticus Gal d 3 Egg, Conalbumin Gallus domesticus Gal d 5 CSA (Livetin) Gallus domesticus Mus m 1 Mouse Mus musculus Non-Plants, Cross-reactive Markers Ani s 3 Anisakis Anisakis simplex Tropomyosin Bla g 7 Cockroach Blattella germanica Tropomyosin Der p 10 House dust mite Dermatophagoides pteronyssinus Tropomyosin Pen a 1 Shrimp Penaeus aztecus Tropomyosin Pen i 1 Shrimp Penaeus indicus Tropomyosin Pen m 1 Shrimp Penaeus monodon Tropomyosin
Table. 3.1. Panel of allergenic components included in the microarray. Components listed in
alphabetical order classified as: plants and non-plants, and subdivided into specific markers and
cross-reactive markers. PR-10: pathogenesis-related group 10; LTP: Lipid Transfer Protein; CBP:
Calcium-binding protein; CCD: Carbohydrate Cross-reactive Determinants.
3.6. Enzyme Linked Immuno-Sorbent Assay (ELISA)
The Enzyme Linked Immuno-Sorbent Assay (ELISA) is a powerful technique for
detection and quantitation of biological substances such as proteins, peptides,
antibodies and hormones. By combining the specificity of antibodies with the sensitivity
of simple enzyme assay, the ELISA can provide a quick and useful measurement of
the concentration of an unknown antigen or antibody. Currently, there are three major
types of ELISA assays commonly used. They are: indirect ELISA (typically used for
antibody screening), sandwich ELISA (or antigen capture, for analysis of antigen
present) and competitive ELISA (for detection of antigen specificity).
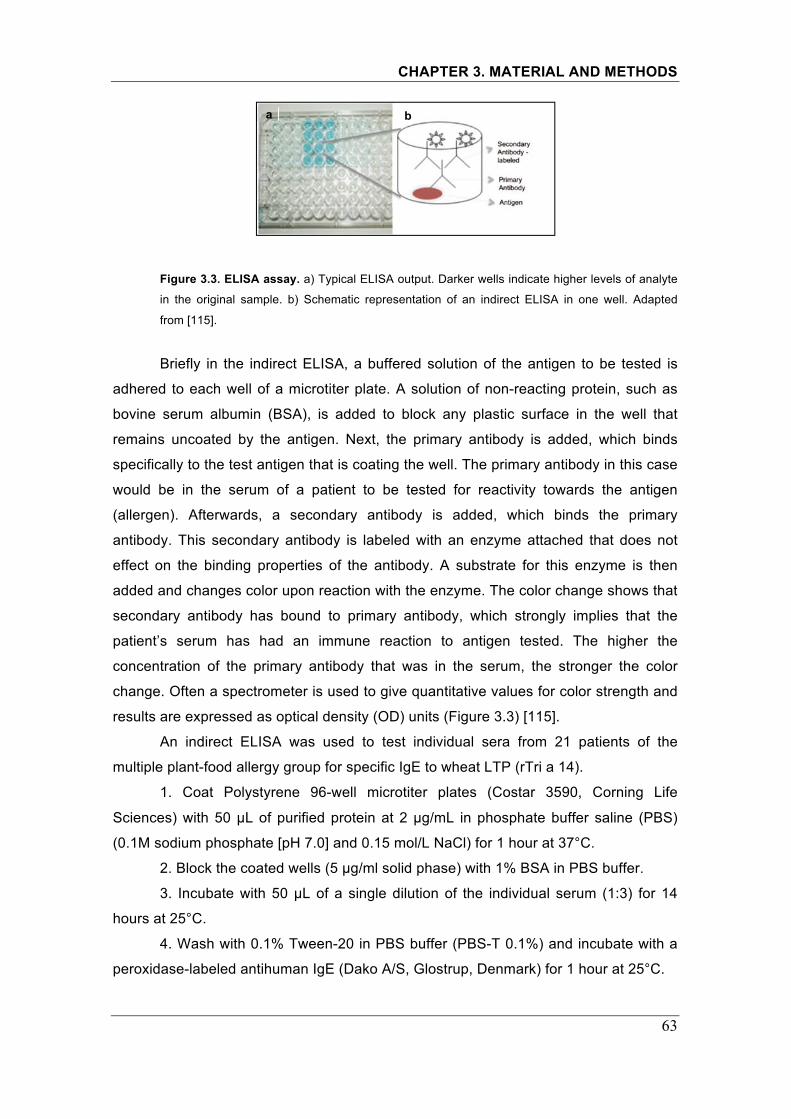
CHAPTER 3. MATERIAL AND METHODS
63____ 6363
Figure 3.3. ELISA assay. a) Typical ELISA output. Darker wells indicate higher levels of analyte
in the original sample. b) Schematic representation of an indirect ELISA in one well. Adapted
from [115].
Briefly in the indirect ELISA, a buffered solution of the antigen to be tested is
adhered to each well of a microtiter plate. A solution of non-reacting protein, such as
bovine serum albumin (BSA), is added to block any plastic surface in the well that
remains uncoated by the antigen. Next, the primary antibody is added, which binds
specifically to the test antigen that is coating the well. The primary antibody in this case
would be in the serum of a patient to be tested for reactivity towards the antigen
(allergen). Afterwards, a secondary antibody is added, which binds the primary
antibody. This secondary antibody is labeled with an enzyme attached that does not
effect on the binding properties of the antibody. A substrate for this enzyme is then
added and changes color upon reaction with the enzyme. The color change shows that
secondary antibody has bound to primary antibody, which strongly implies that the
patient’s serum has had an immune reaction to antigen tested. The higher the
concentration of the primary antibody that was in the serum, the stronger the color
change. Often a spectrometer is used to give quantitative values for color strength and
results are expressed as optical density (OD) units (Figure 3.3) [115].
An indirect ELISA was used to test individual sera from 21 patients of the
multiple plant-food allergy group for specific IgE to wheat LTP (rTri a 14).
1. Coat Polystyrene 96-well microtiter plates (Costar 3590, Corning Life
Sciences) with 50 μL of purified protein at 2 μg/mL in phosphate buffer saline (PBS)
(0.1M sodium phosphate [pH 7.0] and 0.15 mol/L NaCl) for 1 hour at 37°C.
2. Block the coated wells (5 μg/ml solid phase) with 1% BSA in PBS buffer.
3. Incubate with 50 μL of a single dilution of the individual serum (1:3) for 14
hours at 25°C.
4. Wash with 0.1% Tween-20 in PBS buffer (PBS-T 0.1%) and incubate with a
peroxidase-labeled antihuman IgE (Dako A/S, Glostrup, Denmark) for 1 hour at 25°C.
a b

CHAPTER 3. MATERIAL AND METHODS
64____ 6464
5. Wash again and then develop with 50 μL of peroxidase substrate buffer
(code S2045, Dako).
6. After 30 minutes, stop the reaction with 50 μL of 4N H2SO4 and measure OD
at 492 nm.
PBS buffer with 1% BSA was tested as a negative control for each solid phase.
Additionally, blocking solution without solid phase was used as negative control. Tests
were performed in triplicate. A read out (λ 492 nm) above 0.11 OD units was
considered positive [116].
3.7. Boiled and raw shrimp western blotting
3.7.1. Preparation of boiled and raw shrimp extracts
Extracts from boiled and raw pacific white shrimp (Litopenaeus vannamei) were
obtained from the Mount Sinai Food Allergen Repository. Extracts had been prepared
from raw shrimp tail muscles manually homogenized in a mortar to achieve a smooth
paste. Protein extraction had been made by agitation in PBS with a protease inhibitor
cocktail, without ethylenediamine tetra-acetic acid (EDTA, Roche, Indianapolis, Ind),
and sodium azide (NaN2) 1:400) as preservative and incubated overnight at 4ºC. The
mixture was centrifuged at 3000 rpm for 10 minutes at 4ºC and then at 15000 rpm for 5
minutes at 4ºC. The boiled extract was prepared the same way but previously boiling
the peeled tails for 5 minutes in distilled water [84].
3.7.2. Protein separation and western blotting
First, Sodium Dodecyl Sulfate PolyAcrylamide Gel Electrophoresis (SDS-
PAGE) was used to separate proteins contained in whole extracts. The SDS-PAGE
uses a highly cross-linked gel of polyacrylamide as the inert matrix through which the
proteins migrate. The proteins themselves are not in a single aqueous solution but in
one that includes a powerful negatively charged detergent, sodium dodecyl sulfate
(SDS) (Figure 3.4). This detergent binds to hydrophobic regions of the protein
molecules and with the treatment of strong reducing agents to remove secondary and
tertiary structure (e.g. disulfide bonds [S-S] to sulfhydryl groups [SH and SH]), the
protein is unfolded into extended polypeptide chains (denaturation).

CHAPTER 3. MATERIAL AND METHODS
65____ 6565
Proteins of the sample become covered in the negatively charged SDS and
move to the positively charged electrode through the mesh of the gel that is packed on
cassettes. Smaller proteins migrate faster, thus proteins are separated according to
size (usually measured in kDa). The concentration of acrylamide determines the
resolution of the gel. The greater the acrylamide concentration, the better the resolution
of lower molecular weight proteins. The lower the acrylamide concentration the better
the resolution of higher molecular weight proteins.
Samples are loaded into wells in the gel. One lane is usually reserved for a
marker or ladder, a commercially available mixture of proteins having defined
molecular weights, typically stained so as to form visible, colored bands (e.g.,
SeeBlue®Plus 2 Molecular Weight, Invitrogen). When voltage is applied along the gel,
proteins migrate into it at different speeds. These different rates of advancement
(known as different electrophoretic mobility) separate into bands within each lane [117].
Figure 3.4. Protein electrophoresis. By far the most common type of gel electrophoresis
employs polyacrylamide gels and buffers loaded with sodium dodecyl sulfate. Source: [118].
Second, western blotting was used to test IgE reactivity of patient’s sera to the
proteins contained in the shrimp extract.
Western blotting is an extension of protein electrophoresis. Sometimes called
Immunoblotting, it is a reliable method for investigating any sample (tissue or cells that
are homogenized in a buffer) for the presence of a specific antigen. After protein
separation with SDS-PAGE, proteins are transferred to a membrane (typically
nitrocellulose or polyvinylidene fluoride (PVDF)) for detection, based on molecular
weight, with primary and secondary antibodies (Figure 3.5).
In the particular case of allergy, proteins from allergenic sources are
immobilized on membranes and are detected with antibodies in a two-step process:
1. First, the primary antibody, which corresponds to the IgE directed against the
allergenic protein in question that is present in the sera of the subject.

CHAPTER 3. MATERIAL AND METHODS
66____ 6666
2. Then, a secondary antibody (an antihuman IgE antibody). Two approaches
are common: a secondary antibody conjugated with the enzyme horseradish
peroxidase (HRP) that catalyzes a chemiluminescent reaction (oxidation of luminol to
3-aminophthalate accompanied by emission of low-intensity light that can be enhanced
in the presence of certain chemicals (modified phenols) increasing the sensitivity of the
reaction (enhanced chemiluminescence, ECL), or a secondary antibody labeled with
iodine 125 isotope. Both reactions are visualized through exposure of X-ray film, but
the radioactive one is more sensitive and shows less background on proceeding [118].
Figure 3.5. Western blotting procedure. Source: http://www.leinco.com/general_wb
Hereby, for SDS-PAGE analyses, samples were heated at 70ºC for 10 minutes
with Nupage sample buffer® (Invitrogen, Carlsbad, CA) in the presence of 0.05M
dithiothreitol (DTT). The proteins of the extract were then separated by means of SDS-
PAGE using Nupage 4-12% Zoom Gels® (Invitrogen, Carlsbad, Calif), according to the
manufacturer’s instructions and as described earlier on this chapter.
After gel separation, proteins were transferred onto Immobilon-P membrane®
(Millipore®, Bedford, Mass) for immunoblot detection of IgE binding (western blot),
according to manufacturer instructions. Membranes were cut on strips of 4mm wide
with a razor blade to test individual sera from all patients and controls recruited for the
shellfish study. Sera dilutions ranged from 1:5 to 1:20 (in PBS-T 0.05%, 1% BSA and
10% normal goat serum (NGS)) depending on the shrimp specific IgE levels (f24,
Phadia, Sweden) of the individual. The membrane was incubated with diluted sera for
1 hour. After rinsing with PBS (four quick rinses), the membranes were incubated for 1
hour at room temperature with a secondary antibody (iodine 125–labeled goat anti-
human IgE, DiaMed, Windham, Me) diluted as per the manufacturer’s instructions,
washed (four quick rinses with PBS) and exposed to Kodak Imaging Film (Carestream

CHAPTER 3. MATERIAL AND METHODS
67____ 6767
Health Inc.®, Rochester, NY) for a short period (2-4 days) and a long one (12-15 days).
As a negative control, serum from a nonatopic subject was used.
3.8. Purification of recombinant proteins 3.8.1. Overview
Recombinant DNA technology consists of isolating a target DNA sequence and
transferring it to a cloning vector that has the ability to self-reproduce. The DNA of the
cloning vector interacts with the target DNA and produces a new blueprint of gene
information called recombinant DNA that is transferred to RNA, which in turn produces
a recombinant protein [119].
Thanks to molecular biology, recombinant allergens can be produced as
defined molecules in consistent quality and unlimited amounts according to the
corresponding DNA template that exactly mimic the properties of the natural allergens
(i.e., recombinant wild-type allergens), but also as modified variants with advantageous
properties for therapeutic purposes (i.e., reduced allergenic activity or increased
immunogenicity) [62].
The most widely used expression systems are those using Escherichia coli (E.
coli) as the host cell. However, there are also several eukaryotic cell–based expression
systems available: insect cells infected with recombinant baculovirus, yeast (e.g.,
Saccharomyces cerevisiae and Pichia pastoris) and mammalian cells. The choice of
protein expression system depends on the intended use and characteristics of the
protein. If a protein can be expressed in E. coli in a soluble state either directly into the
cytoplasm or by secretion into the periplasm, then it may be possible to isolate large
amounts of correctly folded and active protein. On the other hand, if the protein’s full
biological activity requires posttranslational modification (i.e., glycosylation or
phosphorylation), then an eukaryotic expression system must be used.
The basic approach used to express foreign genes in E. coli begins with
insertion of the gene into an expression vector, usually a plasmid. The next step
involves transforming a suitable E. coli host strain with the construct, for example, by
electroporation or thermic shock. Transformed cells are then subjected to evaluation of
plasmid stability and foreign protein expression after induction. Once small-scale
shaker flask experiments have identified successful expression systems of the

CHAPTER 3. MATERIAL AND METHODS
68____ 6868
controllable transcriptional promoter present in the expression vector, the transformed
E. coli strain can be used in large-scale growth systems. Production is followed by
protein purification and characterization (Figure 3.6) [120].
An essential component of typical E. coli expression vectors is the promoter,
which when induced, can direct the production of large amounts of mRNA from the
cloned gene. One of the most common routinely used is the lac promoter system,
which utilizes the transcriptional control elements from the E. coli β-galactosidase
gene. The Lac repressor controls this promoter by binding to an operator sequence in
the promoter region. Induction of the promoter is generally accomplished by the
addition of isopropyl-β-D-thiogalactopyranoside (IPTG), a lactose analog that binds to
the lac repressor and prohibits its binding to the lac operator. Moreover, a translation
initiation sequence (Shine and Dalgarno sequence or ribosome binding site (RBS)) is
required in close proximity to an initiator methionine for the initiation of translation on
mRNAs [120].
Figure 3.6. Overview of the production of recombinant proteins. Source: Galina Grishina,
Mount Sinai School of Medicine, New York.
Recombinant proteins can be expressed in soluble or insoluble (as inclusion
bodies) forms in the periplasmic space or in the cytoplasm of the bacteria. Inclusion
bodies are composed of densely packed denatured protein molecules in the form of
particles that require additional steps of solubilization and refolding [120].
Therefore, strategies for protein purification depend on the localization of the
protein and its solubility. Probably, the most significant advancements for protein
purification have been the development of fusion proteins and the fusion tag
expression and purification techniques, resulting in a more consistent production of
Prepare Insert DNA
(PCR, restriction, gel purification)
Clone Insert into Vector, verify the sequence
Transform into Expression Host
Solubility test to determine purification conditions
Induce and Optimize Expression of Target Protein
Purify target protein ( Affinity chromatography purification)
Choose a Restriction Enzyme, Primer design
Prepare Vector
(restriction, gel purification)

CHAPTER 3. MATERIAL AND METHODS
69____ 6969
soluble and active protein, and allowing for simple and efficient purification and/or
detection of the proteins from bacterial lysates [120].
3.8.2. Crustacean recombinant allergens
Ten recombinant (r) crustacean proteins were considered for this study:
Tropomyosin (TM, Lit v 1), Arginine Kinase (AK, Lit v 2), Myosin Light Chain (MLC, Lit
v 3), Sarcoplasmic-Calcium-Binding protein (Lit v 4, SCP isoform alpha), Hemocyanin
(Hemo), Fatty-Acid Binding Protein (FABP) (all from pacific white shrimp, Litopenaeus
vannamei), lobster-Sarcoplasmic-Calcium-Binding protein (SCP, isoform beta), and 3
different Troponin C proteins [TpC, 2 from lobster (Homarus americanus) GenBank
Acc. FE535729 (=TpCB5) and FD699849 (=TpCC10) (FE and FD amino acid
sequences: 42.2% identity; 55% similarity), 1 from green shore crab (Carcinus
maenas) GenBank Acc. DN634859, =TpCA2) (FD and DN: 44% identity/ 58.4%
similarity; FE535729 and GC: 75% identity/ 84% similarity. TpCA2, TpCB5 and TpCC10
are arbitrary names derived from the process of cloning (A, B, C: name of the
Lysogeny or Luria Broth (LB) agar plate used and the number corresponds to the
colony peaked and grown).
3.8.3. Expression of recombinant protein
Clones had already been constructed and were obtained from the Mount Sinai
Food Allergen Repository, except for Troponin C clones that were kindly provided by
Mount Desert Island Biological Laboratory (MDIBL, Salsbury Cove, ME, USA).
Briefly, the cDNAs of interest were amplified by means of polymerase chain
reaction (PCR) and ligated into pET24b vector using the Rapid Ligation Kit (Roche®)
and introduced into XL1-Blue E.coli strain (Agilent Technologies®) following
manufacturer’s protocol. Next, the size of the cloned DNA inserts and their orientation
in the vector were confirmed by PCR of individual colonies off a transformation plate.
Plasmid purification from the positive colonies was performed using the miniprep
plasmid extraction kit (Qiagen®). The nucleotide sequence of the cDNA insert and the
adjacent vector fragments was verified by direct sequencing. For protein production
each construct was introduced into expression E. coli strains - BL21 (Agilent
Technologies® or Rosetta strains (Novagen®), if experiencing difficulties for protein
expression.

CHAPTER 3. MATERIAL AND METHODS
70____ 7070
Protein expression was performed as follows. Transformed cells had been
grown overnight (O/N) at 37ºC on LB agar plates containing 30μg/μl kanamycin. The
next day, a new O/N culture (in 3mL LB 30μg/μl kanamycin) was inoculated with a
single colony and grown at 37ºC with mild shaker agitation overnight. Next morning,
the culture optical density was checked at 600nm (1:10 dilution in LB) and a new
culture was started by inoculating 6 mL LB medium with volume of the overnight
culture containing ~0.12 optical units (O.U) at 600nm, total. The culture was grown at
either 37ºC or 30ºC until it reached 0.4-1 O.U. at 600nm. Then, protein expression was
induced by adding IPTG at 1mM final concentration. The optimal induction time was
determined by Western blot analysis of the expressed protein at different time points –
typically at 2, 4, 6 and 16 hours post-induction. At each time point, culture optical
density was measured as above and cells from the culture aliquot (~0.2 O.U. at
600nm) were collected for analysis In order to optimize the purification conditions the
aggregate state of the expressed protein was determined by solubility test employing
SDS-PAGE/Western blot analysis.
For this project, all recombinant proteins were expressed after induction of
bacterial cultures (45 mL LB-kanamycin) with IPTG at the chosen conditions
(summarized in Table 3.2). After induction, cell pellets were obtained from cultures by
centrifugation at 5,000 g for 15 minutes using pre-weighed centrifuge tubes and stored
at -80ºC until purification.
Table 3.2. Summary of the conditions for recombinant allergens expression.

CHAPTER 3. MATERIAL AND METHODS
71____ 7171
3.8.4. Purification of recombinant protein
Affinity purification is based on the specific interaction of a target molecule with
an immobilized ligand. For recombinant proteins, the addition of fusion tags using
appropriate expression vectors enables affinity purification by a number of strategies.
Briefly, fusion tags are small stretches of amino acids added to the N-terminal
or C-terminal end of a protein. Not usually helping to increase expression levels or
protein solubility, they can be advantageous in protein purification and detection. The
tags are generally chosen either because they encode an epitope that can be later
detected and purified using an antibody that binds to it, or because the tag amino acids
provide a physical characteristic that can be exploited for easy and specific protein
purification. As an example is the polyhistidine tag (His Tag), usually a stretch of six
consecutive histidine residues added to either the N- or C-terminus of a protein that
provides specific binding to metal chelate resins. There are a number of polyhistidine
vectors on the market.
Several commercially available products have been specifically designed for the
purification or detection of fusion proteins tag sequences. These products are
optimized for purification of proteins expressed in bacterial, yeast, insect, or
mammalian systems. For maximal recovery of intact target proteins from cell cultures,
a first step in purification should be an efficient, gentle extraction. For this project, all recombinant allergens were purified under native conditions
using the His·60 Ni Buffer Set (Clontech®, Cat. No. 635665), except for the
recombinant Hemocyanin and AK that were purified under denatured conditions using
the BugBuster Ni-NTA His•Bind Purification Kit (Novagen®).
The main difference between working under denatured or native conditions
resides on the sample preparation to obtain the recombinant protein (i.e., cultured cells
preparation using different buffers). Both methods are based on affinity purification
using nickel (Ni) charged resin columns, to which the His-tag of the recombinant
protein binds. Later on, this binding is disrupted and the protein of interest is eluted.
3.8.4.1. His·60 Ni Superflow™ resin and gravity columns
The His·60 Ni Superflow™ Resin (Clontech®) is a high-capacity Ni-IDA resin
that has been optimized for the efficient purification of expressed his-tagged proteins
from bacterial, mammalian and baculovirus-infected cells. His-tagged proteins are

CHAPTER 3. MATERIAL AND METHODS
72____ 7272
purified from total soluble protein extract utilizing a high capacity His60 Ni resin
charged with Ni immobilized onto Superflow™ agarose beads. The combination of the
high density of Ni (2+) ion and high flow rates allow the efficient capture of target his-
tagged proteins (Figure 3.7) [121]. The manufacturer’s protocol was followed, briefly
described hereby:
A. Sample Preparation
1. Add 2 mL of His60 Ni x Tractor Buffer per 100 mg of cell pellet. Gently pipet
up and down until the cell pellet is fully resuspended.
2. To the resuspended pellet, add 1 μL of Benzonase® for every 2 mL of extract
(i.e., every 100 mg of cell pellet) and mix gently.
3. Incubate on ice, with intermittent mixing, for 15 min. Centrifuge for 20 min at
10,000 g at 4°C.
4. Carefully collect the clear supernatant, which is the starting sample.
B. Gravity-Flow Column Purification (1 mL pre-packed resin)
1. Equilibrate the column and all buffers to room temperature.
2. Wash the column with 5-10 column volumes of His·60 Ni Equilibration Buffer.
Put the bottom stopper on the outlet of the column.
3. Add the clarified sample (supernatant) to the column and carefully connect
the top stopper to the top of the column. Allow target protein to bind by slowly inverting
the column for 1 hour (preferably at 4°C).
5. Install the column in a vertical position and let the resin settle at the bottom of
the column.
6. Put a stand containing clean empty tubes under the outlet of the column.
7. Carefully remove the top stopper. Remove the bottom stopper and start
collecting 1 mL fractions.
8. Wash the column with 10 column volumes of His·60 Ni Equilibration Buffer
followed by 10 column volumes of His·60 Ni Wash Buffer (prepared by mixing 710 μL
of His·60 Ni Elution Buffer with 9.29 mL of His·60 Ni Equilibration Buffer)
9. Elute the target protein with approximately 10 column volumes of Elution
Buffer and collect 1 mL fractions.

CHAPTER 3. MATERIAL AND METHODS
73____ 7373
Figure 3.7 Overview of protein purification with His·60 Ni Superflow™ resin. Source: [121].
Collect all washes and elutes into separate tubes for the analysis on the gel
(SDS-PAGE) or performing a Bradford protein assay to identify the elution fraction that
has a major content of the protein of interest.
The His60 Ni Gravity Column can be quickly regenerated by adding 20 mL of
His60 Ni Equilibration Buffer or by washing with 10 column volumes of 20 mM MES,
0.3 M NaCl; pH 5.0 buffer. Regeneration allows the column to be reused to purify the
same protein multiple times without significant loss of binding capacity. For extended
storage (over 1 week), wash the column with five column volumes of water after each
use and store in 20% ethanol. Attach supplied bottom stopper, followed by the top
stopper. Store the column at 4°C.
3.8.4.2. BugBuster Ni-NTA His·Bind purification kit
The BugBuster Ni-NTA His·Bind Purification Kit (Cat. No. 70751, Novagen,
Merck4Biosciences®) combines the Ni-NTA His·Bind Resin and BugBuster Protein
Extraction Reagent for convenient preparation of soluble cell extracts and affinity
purification of His·Tag fusion proteins. The BugBuster Protein Extraction Reagent is a
ready to use solution formulated for the gentle disruption of the cell wall of E. coli
resulting in the liberation of soluble protein. The kit includes Benzonase® Nuclease for
viscosity reduction and removal of nucleic acids from protein preparations. Cells are
harvested by centrifugation as usual, followed by suspension in BugBuster reagent.
During a brief incubation, soluble proteins are released without denaturation. The
CHAPTER 3. MATERIAL AND METHODS
74____ 7474
extract is clarified by centrifugation, which removes cell debris and insoluble proteins.
The clarified extract is ready to apply to the Ni-NTA His·Bind Resin.
Ni-NTA His·Bind Resin is used for rapid one-step purification of proteins
containing a His·Tag® sequence by metal chelation chromatography. The His·Tag
sequence binds to Ni2+ cations, which are immobilized on the Ni-NTA His·Bind Resin.
After unbound proteins are washed away, the target protein is recovered by elution
with imidazole. The versatile system allows proteins to be purified under gentle, non-
denaturing conditions or in the presence of either 6 M guanidine or urea.
With the His·Tag/His·Bind technology, purification is based on the affinity
between the 6-10 neighboring histidines of the His·Tag sequence and an immobilized
metal ion (usually Ni2+). The metal is held by chelation with reactive groups covalently
attached to a solid support. The Ni-NTA His·Bind Resins use nitriloacetic acid (NTA) as
the chelator, which has four sites available for interaction with metal ions [122].
A. Sample preparation
1. Completely resuspend the cell pellet in room temperature the BugBuster
reagent by pipetting or gentle vortexing (using 5 mL reagent per gram of wet cell paste
(1.2mL)).
2. Add 1 μL (25 units) of Benzonase per mL of BugBuster reagent used for
resuspension.
3. Incubate the cell suspension on a shaking platform or rotating mixer at a slow
setting for 30 min at room temperature.
4. Remove insoluble cell debris by centrifugation at 16,000 g for 20 min at 4°C.
5. Transfer the supernatant to a fresh tube. Save the pellet for inclusion body
purification.
Inclusion body purification
1. Resuspend the pellet in the same volume of BugBuster reagent used to
suspend the original cell pellet. Pipette up and down and vortex to obtain an even
suspension.
2. Add 3 μL of rlysozyme™ (1:10 diluted from the stock). Mix by vortex and
incubate at room temperature for 5 min.
3. Add 6 volumes of 1:10 diluted BugBuster reagent (in deionized water) to the
suspension and vortex for 1 min.

CHAPTER 3. MATERIAL AND METHODS
75____ 7575
4. Centrifuge the suspension at 16,000 g for 15 min at 4°C to collect the
inclusion bodies.
5. Remove the supernatant with a pipette. Resuspend the inclusion bodies in
one half the original culture volume of 1:10 diluted BugBuster, mix by vortexing, and
centrifuge again at 16,000 g for 15 min at 4°C. Repeat this wash step 2 more times.
6. Resuspend the final pellet of purified inclusion bodies in 1 mL Binding Buffer
“B”.
7. Rotate the tube for 25 min at room temperature.
8. Centrifuge 5 min at 10,000g and load the supernatant on the already
prepared column.
Column preparation
1. Use 4 mL/column of 50% Ni-NTA His-Bind slurry (1V= 2mL resin column)
2. Wash column with 5V (10mL) H2O
3. Equilibrate column with 3V of Binding buffer (B)
B. Column purification
1. Once sample is loaded, wash two times with Binding buffer “B” (2V= 4mL).
2. Wash three times with Wash Buffer “C” (2V= 4mL).
3. Elute two times with Elution buffer “D” (1V = 2mL).
4. Elute four times with Elution buffer “E” (1V = 2 mL).
Collect all washes and elutes into separate tubes for the analysis on the gel
(SDS-PAGE) or protein concentration determination. The fraction that contains the
desired protein needs to be dialyzed to reduce the concentration of urea to 2M before
protein storage or blotting use.
Buffers for purification under denaturing conditions
Denaturing binding buffer
Buffer B: 8 M urea; 0.1 M NaH2PO4; 0.01 Tris-Cl, pH 8.0
Denaturing washing buffer
Buffer C: 8 M urea; 0.1 M NaH2PO4; 0.01 M Tris-Cl pH 6.9
Denaturing elution buffers
Buffer D: 8 M urea; 0.1 M NaH2PO4; 0.01 M Tris-Cl pH 5.9
Buffer E: 8 M urea; 0.1 M NaH2PO4; 0.01 M Tris-Cl pH 4.5

CHAPTER 3. MATERIAL AND METHODS
76____ 7676
Note: Due to the dissociation of urea, the pH of Buffers B, C, D and E should be
adjusted immediately prior to use. Do not autoclave these buffers.
3.8.5. Protein analysis
Purified proteins were analyzed on SDS-PAGE, as described above, and
stained with Simply Blue SafeStain® reagent (Invitrogen®).
The Simply Blue SafeStain® reagent is a fast and easy staining protocol for
visualizing protein bands on polyacrylamide gels. The gel is rinsed with three 5-minute
washes with distilled water and then the already prepared reagent is added
(approximately 20 mL per gel) to the gel in a cuvette, which is kept in a stirring plate
until bands develop.
Bands begin to develop immediately in the stain (1 µg of protein can be
detected after just 5 minutes in the stain). Destaining with distilled water is not required,
but it is recommended to achieve maximum sensitivity and minimal background (Figure
3.8) [123].
Figure 3.8. SDS-PAGE analysis of elution fractions. Example: purification of SCP using
Clontech purification columns. Each lane represents an elution fraction. E2 and E3 contain
the protein. PE represents pre-elution protein and MW is the molecular weight.
3.8.6. Protein dialysis
Dialysis consists on the removal of buffer salts (desalting) and small
contaminants from proteins and other macromolecules. It can also be used for sample
concentration. Slide-A-Lyzer Dialysis Cassettes® (Pierce Protein Research®, Thermo
Scientific) facilitate this process compared to the traditional dialysis tubing, since they
provide faster buffer exchange and better sample recovery. There are three different
cassette sizes to accommodate sample volumes between 0.1 and 12 mL.

CHAPTER 3. MATERIAL AND METHODS
77____ 7777
Briefly, cassettes are constructed from two sheets of low binding, regenerated-
cellulose dialysis membrane that are hermetically sealed on either side of an inert
plastic frame. The membrane and cassette materials are compatible with most
common laboratory chemicals and buffers. Liquid samples are easily added and
removed by penetrating the self-sealing gasket with a hypodermic needle attached to a
syringe. No knots, clips or caps are needed to seal the units and prevent leaking and
sample-loss during the dialysis procedure (Figure 3.9) [124].
Figure 3.9. Protein dialysis using the Slide-A-Lyzer Dialysis Cassettes. Source: [124].
Native proteins were dialyzed against PBS and denatured proteins were
dialyzed against a buffer containing urea 4M and 2M for Hemo and AK, respectively.
3.8.7. Determination of protein concentration
Protein concentration was determined by Coomassie Plus (Bradford) Protein
Assay® (Pierce Protein Research®, Thermo Scientific, Rockford, Ill).
The Pierce Coomassie Plus Assay Reagent® is a single, ready-to-use solution
for measuring protein concentration in a colorimetric assay at room temperature.
Simply, the reagent is added to equal volumes of samples and standards, mixed by
gentle pipetting and the absorbance is measured straightforward on a standard
spectrophotometer or plate reader at 595 nm. The assay can be performed in either
test tubes or in a microplate. Protein detection range is 1 to 1500 µg/mL.
Briefly, in the acidic environment of the reagent, protein binds to the Coomassie
dye. This results in a spectral shift from the reddish/brown form of the dye (absorbance
maximum at 465 nm) to the blue form of the dye (absorbance maximum at 610 nm).
The difference between the two forms of the dye is greatest at 595 nm, so that is the
optimal wavelength to measure. Development of color has been associated with the
presence of certain basic amino acids (primarily arginine, lysine and histidine). The

CHAPTER 3. MATERIAL AND METHODS
78____ 7878
reagent is compatible with most salts, solvents, buffers, thiols, reducing substances
and metal chelating agents encountered in protein samples [124].
3.9. Dot blot printing and immunolabelling
3.9.1. Dot blotting
The Minifold I manifold® (Schleicher & Schuell, Inc. ®, Keene, NH, USA) is a
96-well filtration/incubation unit for processing dot-blot assays of nucleic acids or
proteins. The unique design of the device eliminates cross-lateral flow of reagents
across the solid phase and forms discrete, uniform test dots for easy isolation and
quantitation of results.
The system includes a sample well plate with metal clamping plate and silicone
O-rings, a filter support plate and a vacuum plenum. The Minifold is easily adjusted for
use with many different types of transfer matrices for optimal sample retention and
biological activity. The manifold is available in either a standard acrylic unit or in a
chemically resistant model (Delrin®), recommended for sterile procedure as it
withstands autoclaving [125].
Figure 3.10. The Minifold Dot Blotter. a) Diagram of Minifold I system assembly. Source:
[125]; b) Pictures of the Minifold I system used for this project.
Briefly, set up Minifold I system to vacuum source. Wet 2 filter sheets and one
membrane (e.g., nitrocellulose) in PBS and place them on the filter support plate on top

CHAPTER 3. MATERIAL AND METHODS
79____ 7979
of the vacuum plenum, previously aligned with the registration pins on either corner.
Place the sample well plate, with O-rings facing down, on the top of the filter. Be sure
each O-ring is fully seated to prevent lateral flow. Again, registration pins ensure proper
alignment. Place the clamping plate on top of the sample well plate. Clamp the
“sandwich” together with the adjustable stainless steel latches. The clamping plate
ensures that even pressure is applied to all sides of the plate. Apply sample material,
generally in a 200 μL volume, carefully not to puncture the membrane with the tip (for
this project, proteins were disposed as depicted in Figure 3.11). Turn on vacuum
source and make sure all sample has pulled through well. Wash each well with 200 μL
of PBS under vacuum. Tap the device on bench top to release bubbles. Shut vacuum
off after all wash buffer has gone through. Release clamps and carefully remove the
membrane with the dotted samples. Wash the membrane with PBS-T 0.05% for five
minutes in a stirring plate, avoid drying until use (wrap the membrane with plastic wrap)
(Figure 3.10).
IgE-reactivity to all crustacean recombinant allergens was tested by dot blotting
immunoanalysis using individual sera from all subjects recruited for the shellfish allergy
study. One microgram of protein was dotted on nitrocellulose membrane (Trans-Blot®
Transfer medium, Bio-Rad Laboratories) using The Minifold I Dot Blotter® described
above. Proteins were displayed as it is shown in Figure 3.11. The manufacturer’s
protocol was followed [125]. After printing, the membrane was kept frozen at -20ºC until
next day.
3.9.2. Immunolabelling
Before immunolabelling the membrane was defrosted at room temperature and
cut into strips, using a razor blade, in a way that two strips contained all ten
recombinant proteins (2 strips/ individual) (Figure 3.11).
Figure 3.11. Nitrocellulose strips with printed recombinant allergens

CHAPTER 3. MATERIAL AND METHODS
80____ 8080
The membrane was blocked with 1% BSA, 10% NGS in PBS-T 0.05% and
afterwards incubated with diluted sera for one hour at room temperature. Iodine 125-
labeled goat anti-human IgE (DiaMed, Windham, Me) was used as secondary
antibody, also for one hour at room temperature. Membranes were exposed to Kodak
Imaging Film (Carestream Health Inc, Rochester, NY) for both a short (2-4 days) and a
long exposure (16-20 days). Three investigators qualitatively evaluated outcome
results independently (positive/negative IgE binding compared to the background).
Read outs were pooled together for agreement and analysis of frequencies of IgE
recognition.
3.10. Epitope mapping 3.10.1. Synthetic overlapping peptides and printing conditions
Overlapping peptides (15-mers, overlapping by 10 amino acids) corresponding
to the primary sequence of the 5 shrimp allergens: Lit v 1 (TM), Lit v 2 (AK), Lit v 3
(MLC), and Lit v 4 (SCP)) and TpC were commercially synthesized (JPT Peptide
Technologies, Berlin, Germany).
Peptides were re-suspended in Dimethyl Sulfoxide (DMSO) - 99.7% Extra Dry
Over Molecular Sieve, AcroSeal™ (Acros Organics®, Geel, Belgium) at 4 mg/mL,
diluted 1:2 in dH2O to a final concentration of 2 mg/mL. Using a NanoPrint60 (ArrayIt
Corporation®, Sunnyvale California), diluted peptides were printed on epoxy-
derivatized glass slides (3D Expoxy; JPT Peptide Technologies GmbH®) in 2 sets of
triplicates to improve precision and to determine intra-assay variation. Each printed
array also included spots from a 50:50 mixture of DMSO / dH2O, used as solvent
control and for background normalization, and fluorochrome-labeled BSA, for the
purpose of grid alignment during analysis.

CHAPTER 3. MATERIAL AND METHODS
81____ 8181
Table 3.3. Sequences of the synthetic overlapping peptides tested in the microarray.
3.10.2. Immunolabelling
The slides were blocked with 400 μL of 1% human serum albumin (HSA) in
PBS-T for 60 minutes at room temperature, followed by incubation with 250 μL of
patient serum diluted 1:5 in PBS-T/HSA for 24 hours at 4ºC. Slides were then washed
with PBS-T and incubated for 24 hours at 4ºC with a cocktail of 3 biotinylated
Pp # Sequence Pp # Sequence Pp # Sequence Pp # Sequence Pp # SequenceAK-01 MADAAVIEKLEAGFK TM-01 MDAIKKKMQAMKLEK SCP-01 MAYSWDNRVKYVVRY MLC-01 MSRKSGSRSSSKRSK TpC-01 MDSLDEEQIETLRKAAK-02 VIEKLEAGFKKLEAA TM-02 KKMQAMKLEKDNAMD SCP-02 DNRVKYVVRYMYDID MLC-02 GSRSSSKRSKKSGGG TpC-02 EEQIETLRKAFDSFDAK-03 EAGFKKLEAATDCKS TM-03 MKLEKDNAMDRADTL SCP-03 YVVRYMYDIDNNGFL MLC-03 SKRSKKSGGGSNVFD TpC-03 TLRKAFDSFDTEKTGAK-04 KLEAATDCKSLLKKY TM-04 DNAMDRADTLEQQNK SCP-04 MYDIDNNGFLDKNDF MLC-04 KSGGGSNVFDMFTQR TpC-04 FDSFDTEKTGSITAEAK-05 TDCKSLLKKYLTKEV TM-05 RADTLEQQNKEANNR SCP-05 NNGFLDKNDFECLAV MLC-05 SNVFDMFTQRQVAEF TpC-05 TEKTGSITAETIATIAK-06 LLKKYLTKEVFDKLK TM-06 EQQNKEANNRAEKSE SCP-06 DKNDFECLAVRNTLI MLC-06 MFTQRQVAEFKEGFQ TpC-06 SITAETIATIMRMMGAK-07 LTKEVFDKLKDKKTS TM-07 EANNRAEKSEEEVHN SCP-07 ECLAVRNTLIEGRGE MLC-07 QVAEFKEGFQLMDRD TpC-07 TIATIMRMMGVKISEAK-08 FDKLKDKKTSLGATL TM-08 AEKSEEEVHNLQKRM SCP-08 RNTLIEGRGEFSADA MLC-08 KEGFQLMDRDKDGVI TpC-08 MRMMGVKISEKNLQEAK-09 DKKTSLGATLLDVIQ TM-09 EEVHNLQKRMQQLEN SCP-09 EGRGEFSADAYANNQ MLC-09 LMDRDKDGVIGKTDL TpC-09 VKISEKNLQEAIAETAK-10 LGATLLDVIQSGVEN TM-10 LQKRMQQLENDLDQV SCP-10 FSADAYANNQKIMRN MLC-10 KDGVIGKTDLRGTFD TpC-10 KNLQEAIAETDEDGSAK-11 LDVIQSGVENLDSGV TM-11 QQLENDLDQVQESLL SCP-11 YANNQKIMRNLWNEI MLC-11 GKTDLRGTFDEIGRI TpC-11 AIAETDEDGSGLLEFAK-12 SGVENLDSGVGIYAP TM-12 DLDQVQESLLKANIQ SCP-12 KIMRNLWNEIAELAD MLC-12 RGTFDEIGRIATDQE TpC-12 DEDGSGLLEFEEFVEAK-13 LDSGVGIYAPDAEAY TM-13 QESLLKANIQLVEKD SCP-13 LWNEIAELADFNKDG MLC-13 EIGRIATDQELDEML TpC-13 GLLEFEEFVELSAKFAK-14 GIYAPDAEAYTLFAP TM-14 KANIQLVEKDKALSN SCP-14 AELADFNKDGEVTVD MLC-14 ATDQELDEMLADAPA TpC-14 EEFVELSAKFLIEEDAK-15 DAEAYTLFAPLFDPI TM-15 LVEKDKALSNAEGEV SCP-15 FNKDGEVTVDEFKQA MLC-15 LDEMLADAPAPINFT TpC-15 LSAKFLIEEDEEALKAK-16 TLFAPLFDPIIEDYH TM-16 KALSNAEGEVAALNR SCP-16 EVTVDEFKQAVQKHC MLC-16 ADAPAPINFTMLLNM TpC-16 LIEEDEEALKAELREAK-17 LFDPIIEDYHVGFKQ TM-17 AEGEVAALNRRIQLL SCP-17 EFKQAVQKHCQGKKY MLC-17 PINFTMLLNMFAERQ TpC-17 EEALKAELREAFRIYAK-18 IEDYHVGFKQTDKHP TM-18 AALNRRIQLLEEDLE SCP-18 VQKHCQGKKYGDFPG MLC-18 MLLNMFAERQTGESD TpC-18 AELREAFRIYDKEGNAK-19 VGFKQTDKHPNKDFG TM-19 RIQLLEEDLERSEER SCP-19 QGKKYGDFPGAFKVF MLC-19 FAERQTGESDDDDVV TpC-19 AFRIYDKEGNGFITTAK-20 TDKHPNKDFGDVNSF TM-20 EEDLERSEERLNTAT SCP-20 GDFPGAFKVFIANQF MLC-20 TGESDDDDVVAKAFL TpC-20 DKEGNGFITTDVLKEAK-21 NKDFGDVNSFVNVDP TM-21 RSEERLNTATTKLAE SCP-21 AFKVFIANQFKAIDV MLC-21 DDDVVAKAFLAFADE TpC-21 GFITTDVLKEILAELAK-22 DVNSFVNVDPEGKFV TM-22 LNTATTKLAEASQAA SCP-22 IANQFKAIDVNGDGK MLC-22 AKAFLAFADEEGNID TpC-22 DVLKEILAELDPRLTAK-23 VNVDPEGKFVISTRV TM-23 TKLAEASQAADESER SCP-23 KAIDVNGDGKVGLDE MLC-23 AFADEEGNIDCDTFR TpC-23 ILAELDPRLTPADLEAK-24 EGKFVISTRVRCGRS TM-24 ASQAADESERMRKVL SCP-24 NGDGKVGLDEYRLDC MLC-24 EGNIDCDTFRHALMT TpC-24 DPRLTPADLENIIEEAK-25 ISTRVRCGRSMQGYP TM-25 DESERMRKVLENRSL SCP-25 VGLDEYRLDCITRSA MLC-25 CDTFRHALMTWGDKF TpC-25 PADLENIIEEVDEDGAK-26 RCGRSMQGYPFNPCL TM-26 MRKVLENRSLSDEER SCP-26 YRLDCITRSAFAEVK MLC-26 HALMTWGDKFSSQEA TpC-26 NIIEEVDEDGSGTLDAK-27 MQGYPFNPCLTESQY TM-27 ENRSLSDEERMDALE SCP-27 ITRSAFAEVKEIDDA MLC-27 WGDKFSSQEADDALD TpC-27 VDEDGSGTLDFDEFMAK-28 FNPCLTESQYKEMEA TM-28 SDEERMDALENQLKE SCP-28 FAEVKEIDDAYNKLT MLC-28 SSQEADDALDQMDID TpC-28 SGTLDFDEFMEMMNGAK-29 TESQYKEMEAKVSST TM-29 MDALENQLKEARFLA SCP-29 EIDDAYNKLTTEDDR MLC-29 DDALDQMDIDDGGKIAK-30 KEMEAKVSSTLSSLE TM-30 NQLKEARFLAEEADR SCP-30 YNKLTTEDDRKAGGL MLC-30 QMDIDDGGKIDVQGVAK-31 KVSSTLSSLEGELKG TM-31 ARFLAEEADRKYDEV SCP-31 TEDDRKAGGLTLERY MLC-31 DGGKIDVQGVIQMLTAK-32 LSSLEGELKGTYYPL TM-32 EEADRKYDEVARKLA SCP-32 KAGGLTLERYQDLYA MLC-32 DVQGVIQMLTAGGGDAK-33 GELKGTYYPLTGMSK TM-33 KYDEVARKLAMVEAD SCP-33 TLERYQDLYAQFISN MLC-33 IQMLTAGGGDDAAAEAK-34 TYYPLTGMSKEVQQK TM-34 ARKLAMVEADLERAE SCP-34 QDLYAQFISNPDESC MLC-34 AGGGDDAAAEEAAK-35 TGMSKEVQQKLIDDH TM-35 MVEADLERAEERAET SCP-35 QFISNPDESCSACYLAK-36 EVQQKLIDDHFLFKE TM-36 LERAEERAETGESKI SCP-36 PDESCSACYLFGPLKAK-37 LIDDHFLFKEGDRFL TM-37 ERAETGESKIVELEE SCP-37 SACYLFGPLKVVQAK-38 FLFKEGDRFLQAANA TM-38 GESKIVELEEELRVVAK-39 GDRFLQAANACRYWP TM-39 VELEEELRVVGNNLKAK-40 QAANACRYWPAGRGI TM-40 ELRVVGNNLKSLEVSAK-41 CRYWPAGRGIYHNDN TM-41 GNNLKSLEVSEEKANAK-42 AGRGIYHNDNKTFLV TM-42 SLEVSEEKANQREEAAK-43 YHNDNKTFLVWVNEE TM-43 EEKANQREEAYKEQIAK-44 KTFLVWVNEEDHLRI TM-44 QREEAYKEQIKTLTNAK-45 WVNEEDHLRIISMQM TM-45 YKEQIKTLTNKLKAAAK-46 DHLRIISMQMGGDLG TM-46 KTLTNKLKAAEARAEAK-47 ISMQMGGDLGQVFRR TM-47 KLKAAEARAEFAERSAK-48 GGDLGQVFRRLTSAV TM-48 EARAEFAERSVQKLQAK-49 QVFRRLTSAVNEIEK TM-49 FAERSVQKLQKEVDRAK-50 LTSAVNEIEKRIPFS TM-50 VQKLQKEVDRLEDELAK-51 NEIEKRIPFSHHDRL TM-51 KEVDRLEDELVNEKEAK-52 RIPFSHHDRLGFLTF TM-52 LEDELVNEKEKYKSIAK-53 HHDRLGFLTFCPTNL TM-53 VNEKEKYKSITDELDAK-54 GFLTFCPTNLGTTVR TM-54 KYKSITDELDQTFSEAK-55 CPTNLGTTVRASVHI TM-55 TDELDQTFSELSGYAK-56 GTTVRASVHIKLPKLAK-57 ASVHIKLPKLAANREAK-58 KLPKLAANREKLEEVAK-59 AANREKLEEVAGKYNAK-60 KLEEVAGKYNLQVRGAK-61 AGKYNLQVRGTRGEHAK-62 LQVRGTRGEHTEAEGAK-63 TRGEHTEAEGGIYDIAK-64 TEAEGGIYDISNKRRAK-65 GIYDISNKRRMGLTEAK-66 SNKRRMGLTEFQAVKAK-67 MGLTEFQAVKEMQDGAK-68 FQAVKEMQDGILELIAK-69 EMQDGILELIKIEKE
ARGININE KINASE TROPOMYOSIN SARCOPLASMIC MYOSIN LIGHT CHAIN TROPONIN C

CHAPTER 3. MATERIAL AND METHODS
82____ 8282
monoclonal anti-human IgE antibodies, one from Invitrogen® (Carlsbad, CA) diluted
1:250, one from BD Biosciences Pharmingen® (San Jose, CA) diluted 1:250, and one
from Phadia® (Uppsala, Sweden) diluted 1:1000, and one monoclonal anti-human
IgG4-fluorescein isothiocyanate (SouthernBiotech®, Birmingham, AL) diluted 1:1000 in
PBS-T/HSA.
After incubation with secondary antibodies, slides were incubated for 3 hours at
31ºC with a cocktail of Anti-Biotin Dendrimer Oyster 550 (350; Genisphere®, Hatfield,
MN) and Anti-Fluorescein Isothiocyanate Dendrimer Oyster 650 (350; Genisphere®) in
Dendrimer Buffer (Genisphere®), both at 0.6 μg/mL, with the addition of 0.02 mg/mL
salmon sperm DNA (Invitrogen®). Afterwards, several successive washing steps were
performed with PBS-T, 15 mmol/L Tris, 0.1X PBS, and 0.05X PBS. Slides were
centrifuge dried and scanned with a ScanArrayGx (PerkinElmer®, Waltham, MA).
Images were saved in TIFF format (Figure 3.12).
3.10.3. Microarray data analysis
Fluorescence signal of each spot was digitized with the program Scan Array
Express (Perkin Elmer®) and data were exported as comma-delimited text files and
analyzed with R programming language. Briefly, the read out for each spot, including
all replicates and the spots for background control, is the median fluorescent signal of
the spot divided by the local background and log2 transformed. Thus, a z score value is
calculated for each spot using background control values within the same array. The
total z score value for each peptide is the median of the z-scores of the six replicated
spots [63, 67]. An individual peptide sample was considered positive if its z score
exceeded the value of 3, meaning that the signal was significantly above the
background (P < 0.003).
TileMap, a tool for tiling array analysis, based on a hierarchical empirical Bayes
model with moving average method [126], was applied to identify IgE and IgG4 binding
sites with statistical differences between groups. As hundreds of peptides were
analyzed simultaneous, the false discovery rate (FDR) was calculated to adjust for
multiple comparisons. A p value of less than 0.01 and FDR of less than 0.05 were
considered as significant.

CHAPTER 3. MATERIAL AND METHODS
83____ 8383
Figure 3.12. Overview of the general procedure of peptide microarray. Source: The Jaffe
Food Allergy Institute, Mount Sinai School of Medicine, NY.
3.11. Basophil activation test The basophil activation test (BAT), as briefly described in chapter 1, is an in
vitro assessment of the allergic response that requires only a small amount of whole
blood and allows for a measurement of a functional response of basophils beyond just
the presence of IgE antibody bound to its receptor on the surface of such cells.
Allergen stimulation causes changes in the basophil cell membrane that can be
detected by flow cytometry using the BAT. Thus, this assay uses flow cytometry to
detect the upregulation of certain cell surface markers that in resting basophils are
either anchored to intracellular basophilic granules (CD63) or are present in smaller
quantities on the basophil cell membrane (CD203c) (Figure 3.13).

CHAPTER 3. MATERIAL AND METHODS
84____ 8484
Figure 3.13. Basophil activation test. Basophils upon encounter with specific allergen
recognized by surface receptor FcεRI-bound IgE, not only secrete and generate quantifiable
bioactive mediators but also up-regulate the expression of different markers (CD45, CD63, CD69,
CD203c) which can be detected by multicolor flow cytometry using specific monoclonal
antibodies. Source: [18].
Twenty-four patients diagnosed of peach allergy, according to clinical history,
positive SPT and serum specific IgE to Pru p 3 (the peach LTP) > 0.75 kUA/L,
presenting clinical exacerbation when NSAIDs intake were selected (Group A). All of
them were NSAIDs tolerant. A cohort of 7 peach allergic patients, positive SPT and
serum specific IgE to Pru p 3 > 0.75 kUA/L, not clinically exacerbated by NSAIDs
(Group B) and a cohort of 5 healthy subjects (Group C) were also included.
The basophil activation protocol using CD63 and CCR3 (Flow2CASTTM kit,
Bühlmann®, Schönenbuch, Switzerland) was the cellular test of choice to develop an
in vitro model for the cofactor effect of NSAIDs on plant-food allergy. The
manufacturer’s protocol was carefully followed. Briefly, the fresh within 1 hour of blood
sampling in 4 mL EDTA tubes (BD VacutainerTM) blood samples were gently
homogenized by inverting several times. For each patient polystyrene tubes were
prepared with 50μL of allergen at the required concentrations diluted in stimulation
buffer. As positive controls, both a monoclonal anti-FcεRI antibody and N-formyl-
methionyl-leucyl-phenylalanine (fMLP) (2 mM) were used. In order to evaluate basal
degranulation values without stimulation, 50 μL of stimulation buffer were applied to
separate tubes (negative control).
Stimulation with allergens was performed in 2 separate phases, with the
shortest delay between them and using the same blood sample:
- Phase 1: Pru p 3 alone at 2, 1, 0.5, 0.250, 0.125 and 0.0625 ng/mL.

CHAPTER 3. MATERIAL AND METHODS
85____ 8585
- Phase 2: Pru p 3 (single concentration) in combination with different
concentrations of L-acetyl salicylic acid (L-ASA, 3mM, 1mM, 0.3mM and
0.1mM). The concentration of Pru p 3 used for this phase was selected
based on the following criterion: the concentration inducing a % of CD63+
cells equivalent to half of the ones achieved when stimulating with the
monoclonal anti-FcεRI antibody (positive control) in the first phase. For
example, if in the first phase for the positive control 68% of CD63+ cells
were observed, the concentration of Pru p 3 inducing around 34% of CD63+
cells was selected. This criterion was strictly followed in all the patients and
the rationale was to use a concentration of Pru p 3 that did not induce a
maximal degranulation so we can observe if the L-ASA is increasing or not
the number of CD63+ cells.
To each tube containing the appropriate allergen/s, 100 μL of stimulation buffer
(containing calcium, heparin and IL-3 (2 ng/mL)), 50 μL of patients blood and 20 μL
staining reagent containing a mix of anti-CD63-FITC and anti-CCR3-PE monoclonal
antibodies were added. The tubes were covered with an adhesive plastic sheet and
incubated at 37ºC for 15 min in a water bath. The stimulation was stopped by addition
of 2 mL of lysing buffer and the tubes were left at room temperature for 5 min. After
centrifugation for 5 min at 1600 rpm, the supernatant was decanted and 300 μL of
washing buffer was added to each tube. The cells were resuspended by gently vortex
before flow cytometric analysis.
Flow cytometric analysis of the cells was performed using a FACS-CantoTM flow
cytometer (Becton-Dickinson Immunocytometry System®, Heidelberg, Germany),
using FACS-Diva™ software. Basophilic cells were selected out of the lymphocyte
population using anti-CCR3. At least 300 basophils were assessed in each assay to
consider it valid. Basophil response was evaluated through the expression of the
basophil activation marker CD63. The upregulation of the CD63 activation marker was
calculated as the percentage of the CD63-positive cells within the total identified
basophils. A high percentage of CD63+ cells in the negative control tubes (>5%,
following the manufacturer’s recommendations) or a lack of stimulation when using the
monoclonal anti-FcεRI antibody and the fMLP as stimuli where considered a criteria for
excluding the sample from the study.

CHAPTER 3. MATERIAL AND METHODS
86____ 8686
3.12. Statistical analysis
3.12.1. CRD and epitope recognition in shellfish allergy
Quantitative variables were described by median, range, interquartile range and
qualitative variables with absolute frequencies and percentages using GraphPad
PrismTM version 4.0c for Macintosh (GraphPad Software, Inc. ®, La Jolla, CA, USA). The analysis of differences in IgE levels between groups was assessed using the non-
parametrical Kruskal-Wallis test.
The Fisher exact probability test was applied to assess statistically significant
differences between the frequencies of IgE reactivity of each group to individual
recombinant proteins.
Properties of recombinant allergens and shrimp extract as diagnostic tests to
discriminate between shrimp allergic (DBPCFC positive: group 1, n=58) and shrimp
tolerant (DBPCFC negative: groups 2a, 2b and C1, n=40) individuals were evaluated.
Sensitivity (SE, defined as the proportion of true-positive results/tests among all shrimp
allergic subjects) and specificity (SP, defined as the proportion of true-negative
results/tests detected among all shrimp tolerant subjects) of each recombinant allergen
were calculated according to the method of Goldman [127] with the following formulas:
SE = TP/(TP + FN) and SP = TN/(TN + FP), where TP is the number of true positives
(patients with positive DBPCFC and positive recombinant allergen). FP is the
number of false positives (patients with negative DBPCFC and positive recombinant
allergen). TN is the number of true negatives (patients with negative DBPCFC and
negative recombinant allergen) and FN is the number of false negatives (patients with
positive DBPCFC and negative recombinant allergen).
Furthermore, the positive predictive value (PPV), negative predictive value
(NPV) and efficiency of each recombinant allergen were calculated using two-by-two
contingency tables. PPV describes the proportion of positive challenge subjects among
those having a positive test result (recognition of a recombinant allergen; PPV=
TP/TP+FP), whereas NPV describes the proportion of the negative challenge subjects
among those having a negative test result (NPV= TN/TN+FN). Efficiency (Eff., also
known as Accuracy) was defined as the proportion of true positive and true negative
results detected among the total number of tests (Eff. = TP+TN/TP+TN+FP+FN).

CHAPTER 3. MATERIAL AND METHODS
87____ 8787
The Mann Whitney t-test non-parametric was appropriately used for comparison
of number of peptides bound by IgE, IgG4 and both. All tests were two sided.
3.12.2. Lipid transfer protein syndrome: clinical pattern and molecular sensitization profile to plant-foods and pollens
Quantitative variables were described by median, range, interquartile range and
qualitative variables with absolute frequencies and percentages using GraphPad
PrismTM version 4.0c for Macintosh (GraphPad Software, Inc. ®, La Jolla, CA, USA).
Estimation of proportion of positive tests to plane tree, mugwort, wall-pellitory,
cypress, grass pollen or olea in a subject was analyzed using logistic regression
models utilizing the Generalized Estimating Equations methodology with an
unstructured matrix to account for intra-subject correlations. A Type I Error: 0.05 was
considered.
For the basophil activation test in vitro model, differences upon the number of
CD63+ cells induced by each stimulus were analyzed with the Wilcoxon Matched Pairs
test.

88

89
CHAPTER 4. RESULTS

CHAPTER 4. RESULTS
90

CHAPTER 4. RESULTS
91
RESULTS
4.1. CRD and epitope recognition in shellfish allergy 4.1.1. Study profile: patient characterization
A total of 86 individuals with a positive shrimp SPT and/or shrimp-specific
serum IgE were recruited. Seventy-four (86%) reported history of immediate allergic
reactions following shrimp ingestion and 12 (14%) did not. Of these 74, 58 (78%) had a
positive Double-Blind Placebo-Controlled Food Challenge (DBPCFC) to shrimp (Group
1) and 16 (22%) a negative one (Group 2a). The 12 (14%) subjects with positive
shrimp test but not reported history of shrimp immediate allergic reactions were also
challenged, with negative result in all cases (100%) (Group 2b). All negative DBPCFC
were confirmed with an oral open challenge with shrimp. Twelve control subjects
sensitized to HDM and/or cockroach allergic but not sensitized to shrimp were also
recruited. These subjects had no history of reactions to shrimp and a shrimp challenge
was negative in all cases (Group Control 1). Five non-atopic individuals were included
(Group Control 2). The study profile is shown in Figure 4.1.
Figure 4.1. Study profile: subjects recruited. sIgE: specific IgE, SPT: Skin prick test, DM:
Dust mite.
Gender, age, frequency of sensitization to shrimp, dust mite
(Dermatophagoides pteronyssinus, DP) and cockroach, specific IgE levels to these
allergens, as well as history of allergic reactions to shrimp and DBPCFC outcome for

CHAPTER 4. RESULTS
92
each group are summarized in Table 4.1. A detailed description of the subjects
recruited for each group is presented in Table 4.3.
Table 4.1. Characteristics of the subjects recruited for the study. DP: Dermatophagoides
pteronyssinus; DBPCFC: Double Blind Placebo Controlled Food Challenge; “+”: positive, “-“:
negative.
Table 4.2. Comparison of shrimp-, dust mite- and cockroach-specific IgE levels. KW:
Kruskal Wallis test for statistical comparison of IgE levels. “ns”: not significant, p value >0.05.
Comparison of medians of shrimp-, DP- and cockroach-specific IgE levels
showed statistically significant differences among groups, summarized in Table 4.2.
Regarding shrimp-specific IgE levels, group 1 had higher levels than all other groups
(statistically significant), whereas there were no statistically significant differences
between groups with negative DBPCFC. Frequency of DP sensitization was high in all
groups (93.8-100%), with similar DP-specific IgE levels (only statistically significant
differences between 2a and 2b (n=16 and n=12, respectively)). Frequency of
cockroach sensitization varied among groups and cockroach-specific IgE levels of
group 1 were statistically significantly higher than those of 2b and C1.
� �������� ������� �������� �������� ��������� ��� ��� ��� ���
�� ��������������
��������� �������� �������� ��������
��������� �����
��� !���� ����!"��� ���� !"��� ������!����
#�$�%�&�%���� � � � �
!�#' ��(� ��������)���� ��������)���� ��������)���� �����)����
!�*+$%���%��*,�� �"������ )���� � �������)���� ��������)���� ��������)����
!�-�./ ��.'� �������"�)���� "�����)���� � ������)���� ��������)����
� � � � �
#(.�0�.�1�2�/3�)4������� �����
� � � �
!�#' ��(� ������5�� �!6����� �����5�� �!������ ��� �5�� �!����� 5�� ��
!�*+$%���%��*,�� �"���5�� �!6����� ���"�5�� �!������ �"�������!6����� �� ��5�� �!6�����
!�-�./ ��.'� ����5�� �!6����� �����5�� �! ���� 5�� ��5�� �!������ 5�� ��5�� �!��� ��
� � � � �
7�$%� 8�#' ��(�
9�.%����:� :� !� !�
*;,-<-� :� !� !� !�
� ������������ ������������� ����������� ����������������� ������� ������ �������
������������������ � � �
�������� ������ ��� ���
��������� ����� ��� �����
��������� ������ ��� ������
��������� ��� ����� ���
��������� ��� ��� ���
���������� ��� ��� ���

CHAPTER 4. RESULTS
93
Table 4.3. Detailed description of the
subjects recruited. Gender: M: male, F:
female; Age in years; Symptoms of allergic
reactions to shrimp: AE: angioedema, A:
anaphylaxis, Asth: asthma, C: cough, GI:
gastrointestinal disorders, OAS: oral allergy
syndrome, RC: rhinoconjunctivitis, U: urticaria;
DBPCFC: Double Blind Placebo Controlled
Food Challenge: “+”: positive, “-“: negative;
Shrimp, Dermatophagoides pteronyssinus
(DP) and cockroach specific IgE levels
expressed as kUA/L; NA: not available; SPT:
Skin Prick Test.
Subject GeNAer Age Symptoms DBPCFC Shrimp DP Cockroach1 M 10 U, A + 49.5 9.5 122 M 17 AE,A, C + 52.1 9.7 123 M 13 Asth, AE + 82.4 22.4 324 F 12 C,Asth + 74.2 12.1 0.45 F 3 U A + 100 >100 746 M 8 GI,RC, U + 100 23 307 F 8 AE, U, A + 30 7 428 F 38 AE, U + >100 >100 179 M 34 AE, U, RC + >100 >100 <0.35
10 M 16 A + >100 >100 8.911 M 33 A + 65 40.3 22.612 F 22 AE, RC + 47.83 59.4 12.113 F 40 AE, A, RC + 14 8.96 3.214 F 34 A + 1.07 1.15 2.415 M 30 AE, U + 15 24 3516 M 40 AE, U, A + 30.3 NA NA17 M 6 A + >100 9.3 NA18 M 19 U, AE, A, GI + 8 0.5 0.519 M 5 AE + >100 27 3320 M 22 OAS, GI + 78 >100 3721 M 12 U + >100 >100 NA22 F 34 AE,C,A + 21 3.8 1.723 F 10 U,C,A + >100 51 NA24 F 16 AE,U,A + 21 7 325 M 15 A + 13 <0.35 <0.3526 M 9 A + >100 25 NA27 F 9 U, AE, GI + 96.8 24 NA28 F 33 A, Asth + 100 46 46.229 M 8 A + 100 14.1 25.330 F 7 A + 100 11.1 18.131 F 15 U, RC + 96.7 18.7 30.332 M 5 U + 50.4 10.3 14.833 M 14 U, A + 24.2 10.5 10.234 M 3 A + 13.7 0.86 1.4435 M 9 U, AE + 11.7 5.75 5.7336 F 29 A, Asth + 7.03 NA NA37 M 33 A + 6.15 2.27 1.8838 F 27 A + 5.6 <0.35 <0.3539 M 9 U, A, GI + 5.5 2.15 1.0240 F 16 GI + 5.24 26.7 2.2741 M 33 OAS, GI + 2.72 13.9 1.3542 M 48 OAS, GI + 2.47 0.82 2.343 F 12 U,Asth + 5.9 1.56 0.9944 M 8 AE + 14.4 1.94 3.0445 F 27 U, AE + 58.6 22.6 0.4846 F 37 AE, C,Asth + 52.4 NA(SPT+) NA(SPT-)47 F 16 U + 0.6 NA(SPT+) NA(SPT-)48 M 39 U + 0.81 NA(SPT-) NA(SPT-)49 M 17 A + > 100 34.5 <0.3550 F 25 A + 2.02 3.79 <0.3551 F 17 AE, U + 0.92 NA(SPT+) NA(SPT-)52 F 12 A + 4.66 67.8 0.8253 F 18 A + 41.8 24.6 <0.3554 F 39 U, GI + 0.74 73.9 <0.3555 M 18 OAS, AE + 5.53 8.32 <0.35(SPT+)56 F 28 AE, U + < 0,35(SPT+) 27.2 <0.3557 F 50 AE, C + 15.1 8.97 <0.3558 F 52 U + 0.75 44.3 NA(SPT+)1 M 10 U - 0.37 14.1 NA(SPT-)2 F 20 U - < 0.35(SPT+) NA(SPT+) NA(SPT-)3 F 34 OAS, C - < 0.35(SPT+) 2.24 <0.354 F 28 U - < 0.35(SPT+) NA(SPT+) NA(SPT-)5 F 45 OAS - 0.44 4.05 <0.356 M 15 AE - < 0.35(SPT+) NA(SPT+) NA(SPT-)7 F 29 U - 0.44 0.75 <0.358 M 31 U,AE,A - 0.62 0.46 2.769 F 18 OAS - 0.55 1.26 <0.3510 F 41 RC - 0.48 9.75 <0.3511 M 22 OAS - 2.32 4.13 2.3712 M 31 U - 5.58 12.2 3.1913 F 29 U - 1.45 60.2 1.2414 M 7 GI - 0.6 <0.35 NA15 M 7 RC - 16.5 2 3.5616 M 5 U,GI - 0.81 0.68 0.791 F 32 - - <0.35(SPT+) 80.5 <0.35(SPT+)2 F 21 - - 1.54 57.7 <0.35(SPT+)3 M 13 - - 1.19 50.4 <0.35(SPT+)4 M 19 - - 1.53 3.26 0.955 F 47 - - 2.45 22.9 0.886 M 40 - - <0.35(SPT+) >100 <0.357 F 31 - - 1.09 >100 <0.358 F 47 - - <0.35(SPT+) 1.89 <0.359 M 25 - - 1.98 >100 <0.35
10 M 27 - - 5.7 NA(SPT+) 0.4711 M 15 - - 2.7 8.56 1.2912 F 45 - - NA(SPT+) NA(SPT+) NA1 F 28 - - <0.35(SPT-) 2.36 <0.352 F 52 - - <0.35(SPT-) 0.41 <0.353 F 60 - - <0.35(SPT-) 4.3 <0.354 M 42 - - <0.35(SPT-) <0.35 (SPT+) <0.355 F 25 - - <0.35(SPT-) >100 0.536 F 17 - - <0.35(SPT-) 2.22 <0.357 F 39 - - <0.35(SPT-) 12.4 <0.358 F 37 - - <0.35(SPT-) 2.71 <0.359 F 17 - - <0.35(SPT-) 13.8 <0.35
10 M 37 - - <0.35(SPT-) >100 <0.35(SPT+)11 F 16 - - <0.35(SPT-) 21.9 <0.3512 F 25 - - <0.35(SPT-) 52.6 <0.35
Gro
up 1
Gro
up 2
aG
roup
2b
Con
trol
gro
up 1
(C1)

CHAPTER 4. RESULTS
94
Noteworthy, there were no statistically significant differences between groups
2a and 2b and C1 in terms of DP- and cockroach-specific IgE levels (Table 4.2.).
4.1.2. IgE recognition of recombinant allergens by the different
groups Frequencies of IgE reactivity to each recombinant allergen per group are shown
in Figure 4.2.
Figure 4.2. IgE recognition of recombinant allergens. A) Histogram showing frequency of
IgE recognition per protein and per group, expressed as percentages (%). B) Example of dot
blot immunolabelling for one subject. SCP: Sarcoplasmic calcium-binding protein, -alpha and
–beta; TM: Tropomyosin; Hemo: Hemocyanin; FABP: Fatty acid binding protein; MLC:
Myosin Light Chain; AK: Arginine-kinase; TpC: Troponin C (-A2, -B5, -C10).
Different profiles of IgE recognition were observed between groups. Subjects
with a positive challenge (group 1) showed more diversity of allergen recognition (i.e.,
total number of recombinant allergens recognized by each subject) than the negative
challenge groups. The median [range] of allergens recognized by each group and p-
values corresponding to the comparison between the median of group 1 and the
median of other groups were as follows: group 1, 3[0-9]; group 2a, 1.5 [0-5], p<0.05;
group 2b, 2[0-3], not significant; group control 1: 1.5 [0-2], p<0.01.
A)
B)

CHAPTER 4. RESULTS
95
Recombinant proteins recognized by each group of patients as well as
statistically significant differences of frequencies of IgE recognition are presented in
Table 4.4 (Fisher’s exact probability test).
Among patients with positive challenge (group 1), eight subjects (8/58, 13.8%)
recognized a single protein, which was TM for seven subjects and SCP (both isoforms)
for one subject. In-group 1, 18 (31%) subjects recognized simultaneously TM and
SCP-alpha and/or -beta, while only one subject from those with challenge negative
(groups 2a, 2b and C1, 1/40 (2.5%)) recognized both proteins. Of note, in general both
SCPs were recognized simultaneously except for 3 patients in group 1 that recognized
SCP beta, but not alpha. In-group 2a, TM, MLC and AK were the allergens more
frequently recognized (31-37.5%), whereas in-group 2b, AK and Hemo were the most
frequent ones (66.7% and 75%, respectively). No subject of group 2b recognized MLC
or SCPs, and only one recognized TM. Group control 1 recognized only Hemo and AK.
In each group, certain patients did not show IgE binding to any recombinant
protein by dot blot (3/58 (5.2%) in group 1; 5/16 (31.3%) in group 2a; 2/12 (16.7%) in
group 2b and 4/12 (33.3%) in group control 1). However when we tested their IgE
reactivity on boiled and/or raw shrimp extracts by immunoblotting, we observed that all
patients of group 1 showed IgE binding, whereas only 3 of the 5 of group 2a, 1 of the 2
of group 2b and 2 of the 4 of group control C1 did so. The non-atopic individuals (group
control 2) tested did not recognize any recombinant protein by dot blot, nor any protein
in boiled and raw shrimp extracts by Western blot.

CHAPTER 4. RESULTS
96
Table 4.4. Frequency of IgE recognition and statistically significant differences between groups. The Fisher exact probability test was applied to assess statistically significant
differences between the frequencies of IgE reactivity of each group to individual recombinant
proteins. SCP: Sarcoplasmic calcium-binding protein, -alpha and –beta; TM: Tropomyosin;
Hemo: Hemocyanin; FABP: Fatty acid binding protein; MLC: Myosin Light Chain; AK: Arginine-
kinase; TpC: Troponin C (-A2, -B5, -C10).
4.1.3. Component-resolved diagnosis
4.1.3.1. Allergens that can help differentiate challenge outcome
IgE binding to SCP-alpha, SCP-beta and TM was statistically significantly more
frequent in patients with a positive shrimp challenge (group 1) than in subjects
sensitized to shrimp but tolerant (negative DBPCFC, 2a and 2b). When comparing
Allergen Group 1 n=58
Group 2a n=16
Group 2b n=12
Control 1 n=12
SCP-alpha 17 (29.3%) 1 (6.3%) - - SCP-beta 20 (34.5%) 1 (6.3%) - - TM 48 (82.8%) 6 (37.5%) 1 (8.3%) - Hemo 17 (29.3%) 3 (18.8%) 8 (66.7%) 7 (58.3%) FABP 6 (10.3%) - 1 (8.3%) - MLC 22 (37.9%) 5 (31.3%) - - AK 28 (48.3%) 6 (37.5%) 9 (75.0%) 7 (58.3%) Tpc A2 10 (17.2%) 3 (18.8%) 1 (8.3%) - TpC B5 9 (15.5%) 2 (12.5%) - - TpC C10 7 (12.1%) 2 (12.5%) - -
Comparisons Proteins with Statistically Significant Difference
p value Fischer’s
test 1 vs 2a SCP-beta 0.0298 TM 0.008 1 vs 2b SCP-alpha 0.031 SCP-beta 0.0145 TM <0.0001 Hemo 0.0209 MLC 0.0133 1 vs C1 SCP-alpha 0.031 SCP-beta 0.0145 TM <0.0001 MLC 0.0133 1 vs (2a+2b) SCP-alpha 0.0049 SCP-beta 0.0012 TM <0.0001 1 vs (2a+2b+C1) SCP-alpha 0.0005 SCP-beta <0.0001 TM <0.0001 MLC 0.006 2a vs 2b Hemo 0.0189 (2a+2b) vs C1 - -

CHAPTER 4. RESULTS
97
group 1 with all the negative shrimp challenge/ arthropod positive groups (2a, 2b and
C1), MLC was also statistically significant different.
If groups 2a and 2b were considered separately, and compared to group 1, also
statistically significant differences were observed in terms of recognition of certain
proteins. For 1 versus 2a, only two allergens, SCP-beta and TM. For 1 versus 2b, more
proteins, both SCPs, TM (the most significant), Hemo and MLC. Group 2a and 2b only
differed in binding to Hemo (Table 4.4).
4.1.3.2. Arginine kinase and hemocyanin as cross-reactive allergens
Shrimp proteins recognized by group control 1 were exclusively Hemo and/or
AK (6/8 (75%) both proteins). Together, groups 2a and 2b did not show any statistically
significant difference in protein recognition compared to the group control 1.
Considered separately, group 2b showed no statistically significant differences with this
control group, whereas 2a showed statistically significant differences for TM (p=0.0237)
and a trend for Hemo (p=0.0497). The comparison of group 1 with control 1 showed
the same proteins with statistically significant differences as the comparison 1 versus
2a, 2b and C1, but with higher p values (Table 4.4).
4.1.3.3. No major differences between children and adults
Within group 1, the only statistically significant difference observed in the IgE
reactivity profile between children (n=33) and adults (n=25) was a higher frequency of
SCP-beta in children (p=0.0128). The same analysis among all challenge negative
subjects (groups 2a, 2b and C1, 10 children/ 30 adults) showed no statistically
significant differences.
4.1.4. Properties of recombinant allergens as diagnostic tests
Properties of recombinant allergens and shrimp extract as diagnostic tests were
described using sensitivity, specificity, positive predictive value (PPV), negative
predictive value (NPV) and efficiency. Results are shown in Table 4.5. Only those tests
that showed statistically significant differences between positive and negative
challenge subjects (p value Fisher’s test < 0.05: SCP-alpha, -beta, TM, MLC and

CHAPTER 4. RESULTS
98
shrimp extract) could be considered candidates for a diagnostic test to differentiate
challenge outcome.
Table 4.5. Properties of recombinant allergens as diagnostic tests. SE: sensitivity, SP:
specificity, PPV: positive predictive value, NPV: negative predictive value, Eff.: efficiency. All
expressed as percentages (%). SCP: Sarcoplasmic calcium-binding protein, -alpha and -beta;
TM: Tropomyosin; Hemo: Hemocyanin; FABP: Fatty acid binding protein; MLC: Myosin Light
Chain; AK: Arginine-kinase; TpC: Troponin C (-A2, -B5, -C10). Shrimp extract (f94,
ImmunoCAP, Phadia). Statistically significant values shown in bold.
Tropomyosin showed the highest values for all 5 parameters, whereas SCPs
showed very high values for specificity (~ 95%) and PPV (97.5%), but low ones for
sensitivity (29-35%) and NPV (~ 50%). Similarly, MLC showed high values for
specificity (87.5%) and PPV (81.5%), but low ones for sensitivity (38%) and NPV
(49%). The shrimp extract was the most sensitive (98%) and with the highest NPV
(95%), however it had the lowest specificity (49%) and PPV (74%). Efficiency for SCPs
and MLC was around 60%, lower than shrimp extract (f94, ImmunoCAP) (78%) and
TM (87%, the highest).
4.1.5. Epitope mapping: IgE and IgG4 binding sites
A subset of subjects recruited for the study (group 1, n=21; group 2a, n=16,
group 2b, n=12) were analyzed for IgE and IgG4 binding to synthetic overlapping
peptides spanning the whole sequence of five shrimp allergens: TM, SCP, AK, MLC
and TpC. IgE and IgG4 binding to the different peptides from all 5 proteins by each
patient are shown as heat maps in figures 4.3 and 4.4, respectively. All peptides from
the 5 allergens are represented in rows. The recognition of peptides by each patient is
Allergen P value Fischer’s test SE (%) SP (%) PPV (%) NPV (%) Eff. (%)
SCP alpha 0.0005 29.3 97.5 94.4 48.8 57.1 SCP beta <0.0001 34.5 97.5 95.2 50.7 60.2 TM <0.0001 82.8 82.5 87.3 76.7 86.6 Hemo 0.1355 29.3 55.0 48.6 34.9 39.8 FABP 0.2348 10.3 97.5 85.7 42.9 45.9 MLC 0.006 37.9 87.5 81.5 49.3 58.2 AK 0.5434 48.3 45.0 56.0 37.5 46.9 TpC A2 0.3879 17.2 90.0 71.4 42.9 46.9 TpC B5 0.1911 15.5 95.0 81.8 43.7 48 TpC C10 0.3024 12.1 95.0 77.8 42.7 45.9 Shrimp Extract <0.0001 98.3 48.7 74.0 95.0 77.6
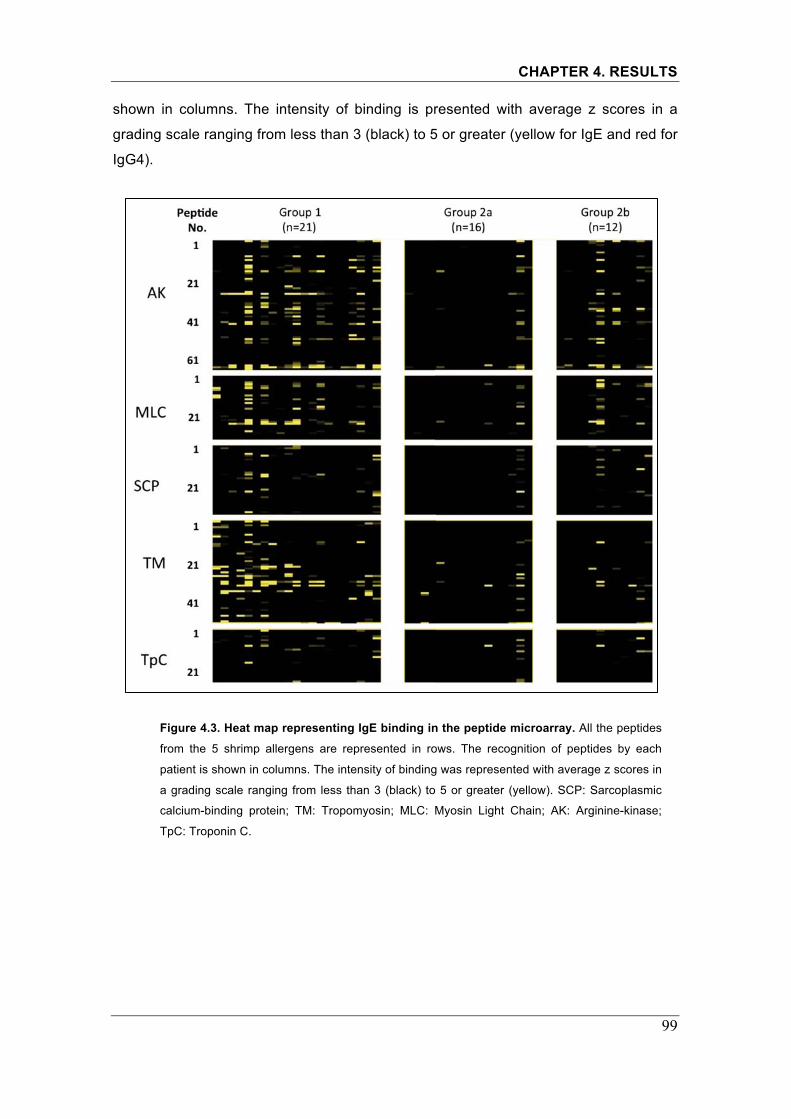
CHAPTER 4. RESULTS
99
shown in columns. The intensity of binding is presented with average z scores in a
grading scale ranging from less than 3 (black) to 5 or greater (yellow for IgE and red for
IgG4).
Figure 4.3. Heat map representing IgE binding in the peptide microarray. All the peptides
from the 5 shrimp allergens are represented in rows. The recognition of peptides by each
patient is shown in columns. The intensity of binding was represented with average z scores in
a grading scale ranging from less than 3 (black) to 5 or greater (yellow). SCP: Sarcoplasmic
calcium-binding protein; TM: Tropomyosin; MLC: Myosin Light Chain; AK: Arginine-kinase;
TpC: Troponin C.

CHAPTER 4. RESULTS
100
Figure 4.4. Heat map representing IgG4 binding in the peptide microarray. All the
peptides from the 5 shrimp allergens are represented in rows. The recognition of peptides by
each patient is shown in columns. The intensity of binding was represented with average z
scores in a grading scale ranging from less than 3 (black) to 5 or greater (red). SCP:
Sarcoplasmic calcium-binding protein; TM: Tropomyosin; MLC: Myosin Light Chain; AK:
Arginine-kinase; TpC: Troponin C.
4.1.6. Differential binding sites between groups
TileMap, a tool for tiling array analysis, was applied to identify IgE and IgG4
binding sites with statistical differences between groups (1 versus 2(2a+2b), 1 versus
2a, 1 versus 2b, and 2b versus 2a). As hundreds of peptides were analyzed
simultaneously, the false discovery rate (FDR) was calculated to adjust for multiple
comparisons. A p value of less than 0.01 and FDR of less than 0.05 were considered
as significant. Figure 4.5 and Table 4.6 summarize the binding sites showing
statistically significant differences between the groups compared.

CHAPTER 4. RESULTS
101
Figure 4.5. TileMap analysis. Lines are showing average binding intensity per group (1, red;
2a, blue; 2b, green). Dots represent binding sites with statistically significant differences
between the groups compared (1 vs 2 (2a+2b), red; 1 vs 2a, blue; 1 vs 2b, yellow; 2b vs 2a,
green). On the x-axis, the protein and the peptide number is shown (AK: arginine kinase, MLC:
myosin light chain, SCP: sarcoplasmic calcium-binding protein, TM: tropomyosin and TpC:
troponin C). Significant binding sites have p<0.01, FDR<0.05. The top half of each graph
corresponds to IgE binding, whereas the other half corresponds to IgG4.
IgE and IgG4 binding sites coincided largely. Minor differences in terms of
peptide recognition were observed between groups 2b and 2a. Therefore,
Aver
age b
indi
ng in
tens
ity
IgE
IgG4
Arginine kinase (AK)
Myosin Light Chain (MLC) Sarcoplasmic Calcium-Binding Protein (SCP)
Tropomyosin (MLC) Troponin C�(TpC)

CHAPTER 4. RESULTS
102
challenge negative subjects were pooled (group 2 =2a+2b) for comparison with
group 1 and for further analysis. Regarding IgE binding, tropomyosin was the
protein with the largest number of differential binding sites between groups,
whereas for IgG4, that was for AK. For SCP, differential binding sites were mainly
observed for IgG4 rather IgE. Almost no difference was observed for TpC.
Table 4.6. Summary of the differential binding sites identified between groups. “2” refers
to the pool of subjects from 2a and 2b. Numbers in the table refer to the number of the peptide
for each allergen (peptide ID). SCP: Sarcoplasmic calcium-binding protein; TM: Tropomyosin;
MLC: Myosin Light Chain; AK: Arginine-kinase; TpC: Troponin C.
4.1.7. Diversity of peptides bound by IgE and IgG4 For each allergen, the number of positive peptides (i.e., z score above 3) bound
by IgE, IgG4 and both in each subject was analyzed. Medians of number of positive
peptides bound by each immunoglobulin were compared between allergic (challenge
positive, group 1) and tolerant (challenge negative, group 2=2a+2b) individuals (non-
parametric t-test: Mann Whitney, p value <0.05 considered significant; Table 4.7).
Subjects of group 1 (shrimp allergic individuals) had more peptides recognized
by IgE than group 2 (shrimp tolerant individuals) for all 5 allergens; the difference
between the medians was more statistically significant for TM, MLC and AK. Similarly,
subjects of group 1 also had more peptides bound by both IgE and IgG4 than subjects
of group 2 for all allergens, being the difference between the medians more statistically
��������� ����� ������ ������ ������
��� ���� ��� ���� ��� ���� ��� ����
��� ������ ������ ������ ������ ������ ������ ������ ������
� ���� ���� ���� ���� ���� ���� ������ �
� ������ ����� ������ ����� ����� ����� � �
� ������ ������ ����� ������ ������ ������ � �
� ����� ������ ������ ������ � ����� � �
� ������ ������ � ����� � ������ � �
� � ����� � ������ � ����� � �
� � ������ � � � ������ � �
���� ���� ���� ���� ���� ���� ���� ���� �
� ���� � � � � � � �
���� ������ ���� ������ ���� � ���� � �
� � ���� � ���� � ���� � �
� � ������ � ������ � ������ � �
��� ���� ��� ���� ��� ���� ��� ����� �
� ����� ����� ������ ����� ����� ����� � �
� ���� ������ ���� ������ ���� ���� � �
� ����� ������ ����� ������ ����� ������ � �
� ������ � ������ � ������ ������ � �
� ������ � ������ � ������ � � �
� ����� � ����� � ������ � � �
� ������ � ������ � � � � �
� �� � ������ � � � � � �

CHAPTER 4. RESULTS
103
significant for TM and AK. Regarding the number of peptides bound by IgG4, the
difference between the median number of peptides bound by allergic and tolerant
individuals was only statistically significant for 3 allergens, TM, MLC and AK.
Table 4.7. Number of peptides bound by IgE, IgG4 and both per allergen. A peptide is
positive if z score is greater than 3. T test non-parametric analysis: Mann Whitney.
Comparison of 2 groups: challenge positive 1 versus challenge negative (2=2a+2b). IQ:
interquartile range, ns: not significant. SCP: Sarcoplasmic calcium-binding protein; TM:
Tropomyosin; MLC: Myosin Light Chain; AK: Arginine-kinase; TpC: Troponin C.
Furthermore, the existence of any correlation between IgE and IgG4 binding
was evaluated with scatter plots (Figure 4.6), but no correlation could be found
between these two variables neither in shrimp allergic individuals or tolerant ones.
Figure 4.6. Correlation between IgE and IgG4 binding. Scatter plot showing the correlation
of IgE and IgG4 binding (expressed as z score values, a peptide is positive if z score is greater
than 3) in shrimp allergic (blue squares) and tolerant (red squares) individuals.
AK MLC SCP TM TpC 1 2 1 2 1 2 1 2 1 2 No. peptides bound by IgE Median 8 3 4 1 3 2 6 0.5 2 1 Range 1-30 0-20 1-14 0-14 2-11 1-12 0-20 0-9 0-7 0-8 IQ range (25% to 75%) 4-15.5 1-7 1.5-6.5 1-3 2-6 2-3 2.5-9 0-2 1-4 0-2 Mann Whitney p value 0.0021 0.0036 0.0148 <0.0001 0.0145 No. peptides bound by IgG4 Median 9 2 2 1 6 2.5 4 0 2 0 Range 2-31 0-26 0-13 0-6 2-14 0-12 0-16 0-9 0-6 0-7 IQ range (25% to 75%) 5.5-22 1-8.5 1-7.5 0-2 2-7.5 2-6.5 0-8 0-2 0-4 0-3 Mann Whitney p value 0.0006 0.0021 0.1111 0.0048 0.2056 No. peptides bound by IgE and IgG4 Median 3 1 1 1 3 2 2 0 1 0 Range 1-25 0-6 0-11 0-2 2-7 0-7 0-10 0-2 0-5 0-2 IQ range (25% to 75%) 2-8 1 1-3.5 0-1 2-4 2 0-4.5 0 0-2 0 Mann Whitney p value <0.0001 0.0088 0.0113 0.0006 0.0269

CHAPTER 4. RESULTS
104
4.1.8. Comparison of current results with previous studies
IgE binding sites identified in the current study were compared with the shrimp
epitopes defined earlier [90] and with the epitopes found as clinically relevant in a
recent pilot study by our group [91] (Table 4.8). IgG4 binding was not assessed in
former studies. Subjects included in the present study were recruited from a population
similar to previous studies, but now the sample size provided is larger (especially the
challenge negative group) and includes subjects from different countries.
Table 4.8. Comparison of results with previous studies. Epitopes described by Ayuso R et
al. JACI 2010 [90]. “Peptide #” refers to the peptide number/ID in the current study, “Aa #”
refers to the corresponding amino acid sequence, and the “Described Epitope (Aa #)” shows
the ID of the epitope previously identified and in brackets the corresponding amino acid
sequence for that epitope. “*”: Epitope also found statistically significant different
between allergic and tolerant individuals in Ayuso R et al. CEA 2011 [91]. SCP: Sarcoplasmic
calcium-binding protein; TM: Tropomyosin; MLC: Myosin Light Chain; AK: Arginine-kinase;
TpC: Troponin C.
Almost all the binding sites identified in the current study corresponded to
previously described epitopes for that allergen, only for AK and SCP certain
binding sites did not correspond to a previously described epitope.
��������� ��������� � ������������
�������� ����
��� ������ ������ ����������
� � ���� �������� � �����������
�������������
� ������ �������� ��
� ������ �������� ��
� ������ �������� ��
� ���� � ������!� �����������"�
� � � �
#$%� �� � ������ ������� ��"�
� ������ � ����� ������"�
&%�� ���� � ����!!� ��
� � � �
'#� ���� ����� ���������"�
� ������ ������ ������ ���
� ������ ������!� � ��������!��"�
� ����!� ������!� �������������"�
� ������ ����� �� ��������� ���"�
� � ���� � ���!�� �����!���!��
� ������ ������!��������� ���"�
� ������ ����� ��
'�%� �� � �

CHAPTER 4. RESULTS
105
A recent pilot study by our group [91] identified some epitopes as clinically
relevant (for AK epitopes 6 and 7; for MLC, epitopes 1, 2, 4a, 4b, 5; for SCP,
epitope 1; for TM, epitopes 1, 2, 5a, 5b, 5c and 7), that is with statistically
significant differences between patients with challenge positive (n=15) and
challenge negative (n=11) (also by TileMap analysis, FDR <0.05 and p<0.01).
In the present study, including 21 patients with challenge positive (group 1)
and 28 with challenge negative (group 2=2a+2b), almost the same epitopes were
identified for TM (5/6), with two more epitopes: 3 and 6, but this was not the case
for the other allergens. For MLC, only two of the five epitopes described as
clinically relevant in the pilot study are found in the present study (epitopes 2 and
5). For SCP, a binding site along amino acids 76-100 (from now on, n) was found
in the present study and it had not been described in the pilot study. For AK, only
epitope 7 coincided with the epitopes previously stated as clinically relevant (6 and
7) [91], however additional statistically significant differences between groups not
detected in the pilot study were found in three other epitopes of this allergen (3, 4a
and 4b). Epitopes found as statistically significant different between allergic and
tolerant individuals by both the current study and Ayuso R et al. CEA 2011 [91] are
shown as asterisks in Table 4.8.
4.1.9. Properties of epitopes as diagnostic tests
Frequencies of IgE recognition for each epitope per group and properties of
epitopes as diagnostic tests (described by sensitivity, specificity, positive predictive
value (PPV), negative predictive value (NPV) and efficiency) are shown in Table
4.9. A statistical analysis of the frequencies of IgE reactivity of each group to
individual epitopes was performed. Challenge positive individuals recognized more
frequently all epitopes than challenge negative subjects, except for epitope 2 of
MLC (p=0.146). Thus, this epitope cannot be considered for the analysis of its
properties as a diagnostic test.

CHAPTER 4. RESULTS
106
Table 4.9. Properties of epitopes as diagnostic tests. Frequencies (expressed as
percentages (%)) of epitope recognition per group (Ch+: positive challenge, group 1; Ch-:
negative challenge, group 2=2a+2b). The Fisher exact probability test was applied to assess
statistically significant differences between the frequencies of IgE reactivity of each group to
individual epitopes. SE: sensitivity, SP: specificity, PPV: positive predictive value, NPV:
negative predictive value, Eff.: efficiency. All expressed as percentages (%). SCP:
Sarcoplasmic calcium-binding protein; TM: Tropomyosin; MLC: Myosin Light Chain; AK:
Arginine-kinase; TpC: Troponin C.
Tropomyosin epitopes showed very high (>90%, epitopes 1, 5a, 5b and 6) or
high (>75%, epitopes 3 and 7) specificity. Epitope n of SCP allergen also showed
very high specificity, but for the other epitopes this parameter ranged from 57 to
71%. Similarly, the highest values of PPV were observed for TM and SCP (>90%,
epitopes 1 and 5b of TM; >75%, epitopes 3, 5a, 5b, 6 and 7 for TM and epitope n
for SCP). Sensitivity varied largely for TM epitopes, while epitope 7 showed the
highest value of all epitopes analyzed, the others had values from 38 to 71%.
Similarly, sensitivity for epitope 7 of AK was 81%, but the other 2 epitopes of the
same allergen had lower values. Epitope n of SCP showed the lowest sensitivity
(33%). In parallel, the highest NPV were observed for certain epitopes of TM (76-
88%) and epitope 7 of AK (80%). Tropomyosin epitopes showed higher efficiency
values (76-82%) than the epitopes of the other allergens (63-69%). Epitope 7 of
tropomyosin was the only one with high values for all 5 parameters.
��������� �� ���� ������������� ������������� ����������������������� �� ���� �� ����� ��!���� "�!���� ##�
�� � ���� ��� ��� ���� ���� �� ��� ������� ���� ��� ���� ���� ���� ���� ���� ����� ��� ��� ��� ��� ��� ��� �� ����
��� ��� ��� ���� ��� ���� ���� �� ���� ���� ��� ��� ���� ���� �� ��� ��
��� � ���� ��� ��� ���� ��� ���� � � ����
�� � ��� � �� ��� �� �� �� � � � ���� ���� �� ���� � �� ��� � � � � � ���� ��� �� ���� ��� �� ���� �� � ���� ��� �� ���� ���� ��� ���� � � � ���� ��� ��� ���� ���� �� ��� ��� ���� ��� �� ���� ��� �� ���� ��� � �� ��� ��� � �� ���� � � ��� ����

CHAPTER 4. RESULTS
107
4.2. Lipid transfer protein syndrome: clinical pattern and molecular sensitization profile to plant-foods and pollens
4.2.1. Demographics and culprit plant-foods involved
The 45 patients recruited were mainly adults (median [range]: 33 [14-47] years-
old), 28 females (62.2%), all previously diagnosed with multiple-plant food allergy due
to LTP-sensitization. Culprit foods involved in reactions (recorded in clinical history and
with confirmed sensitization) were taxonomically related and unrelated fruits,
vegetables and nuts (number of plant-foods involved, median [range]: 4 [2-18]). In
some cases, the same plant-food was reported to cause symptoms of different severity
in the same individual in different episodes (only the most severe episodes are
depicted in Table 4.10).
4.2.2. Clinical symptoms
A heterogeneous pattern of symptoms was observed: OAS (34/45, 75.6%),
urticaria (30/45, 66.7%), contact urticaria (5/45, 11.1%), GID (25/45, 55.6%) and
anaphylaxis (rapid onset of two or more symptoms affecting: skin, gastrointestinal tract,
respiratory system and cardiovascular system) (34/45, 75.6%). Most subjects reported
multiple symptoms, depending on the food involved. Isolated episodes of OAS were
not observed in our cohort. Only one patient had repeated isolated episodes of
anaphylaxis with several plant-foods involved (Table 4.11). Some patients reported
episodes of acute urticaria, GID or anaphylaxis suggestive of food allergy but they
were unable to identify any potential culprit food (Table 4.10). In patients reporting GID,
the existence of a digestive disease potentially responsible for the reported symptoms
was ruled-out.
4.2.3. Cofactor effect
Eighteen patients (40%) reported the involvement of cofactors: non-steroidal
anti-inflammatory drugs (NSAIDs) (15 patients), exercise (2) or both (1) (Table 4.10).
Of the 34 (75.6%) that suffered anaphylaxis, in 11 (32.4%) the presence of the cofactor
was mandatory. In cofactor-dependent anaphylaxis, it was very difficult to identify the
culprit food by means of the clinical history (Table 4.10).
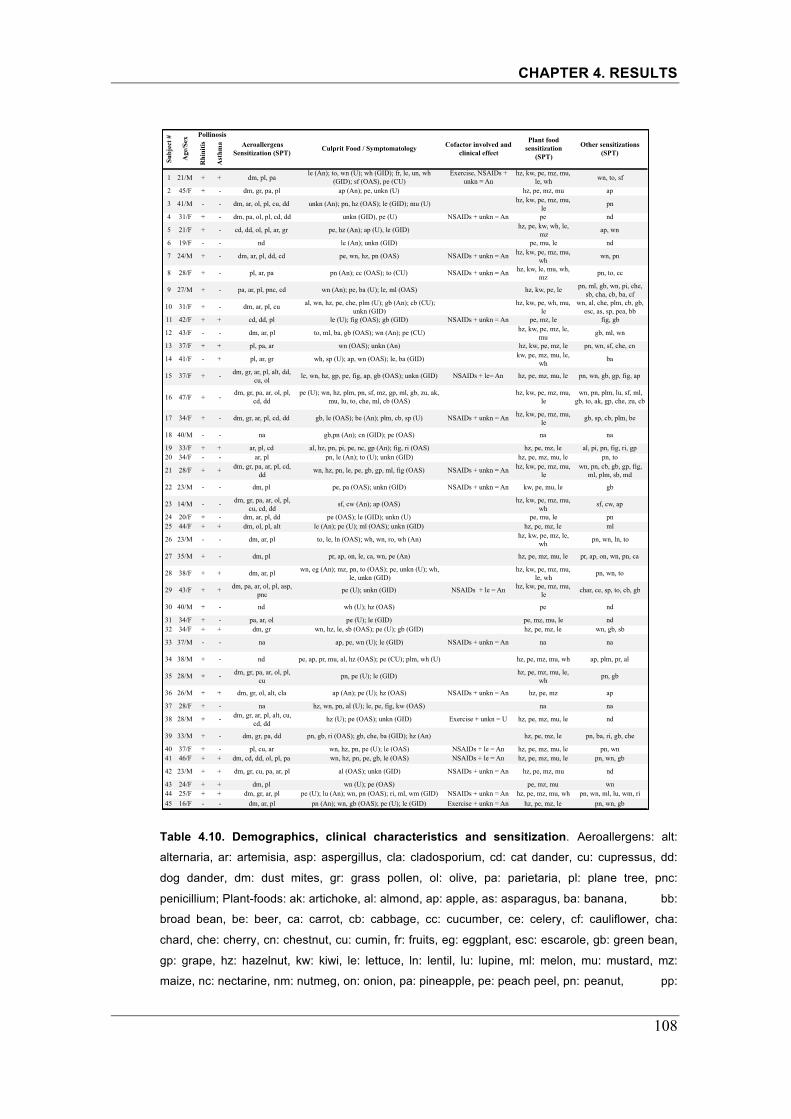
CHAPTER 4. RESULTS
108
Table 4.10. Demographics, clinical characteristics and sensitization. Aeroallergens: alt:
alternaria, ar: artemisia, asp: aspergillus, cla: cladosporium, cd: cat dander, cu: cupressus, dd:
dog dander, dm: dust mites, gr: grass pollen, ol: olive, pa: parietaria, pl: plane tree, pnc:
penicillium; Plant-foods: ak: artichoke, al: almond, ap: apple, as: asparagus, ba: banana, bb:
broad bean, be: beer, ca: carrot, cb: cabbage, cc: cucumber, ce: celery, cf: cauliflower, cha:
chard, che: cherry, cn: chestnut, cu: cumin, fr: fruits, eg: eggplant, esc: escarole, gb: green bean,
gp: grape, hz: hazelnut, kw: kiwi, le: lettuce, ln: lentil, lu: lupine, ml: melon, mu: mustard, mz:
maize, nc: nectarine, nm: nutmeg, on: onion, pa: pineapple, pe: peach peel, pn: peanut, pp:
Rhi
nitis
Ast
hma
1 21/M + + dm, pl, pale (An); to, wn (U); wh (GID); fr, le, un, wh
(GID); sf (OAS), pe (CU)Exercise, NSAIDs +
unkn = Anhz, kw, pe, mz, mu,
le, wh wn, to, sf
2 45/F + - dm, gr, pa, pl ap (An); pe, unkn (U) hz, pe, mz, mu ap
3 41/M - - dm, ar, ol, pl, cu, dd unkn (An); pn, hz (OAS); le (GID); mu (U) hz, kw, pe, mz, mu, le
pn
4 31/F + - dm, pa, ol, pl, cd, dd unkn (GID), pe (U) NSAIDs + unkn = An pe nd
5 21/F + - cd, dd, ol, pl, ar, gr pe, hz (An); ap (U), le (GID) hz, pe, kw, wh, le, mz
ap, wn
6 19/F - - nd le (An); unkn (GID) pe, mu, le nd
7 24/M + - dm, ar, pl, dd, cd pe, wn, hz, pn (OAS) NSAIDs + unkn = An hz, kw, pe, mz, mu, wh
wn, pn
8 28/F + - pl, ar, pa pn (An); cc (OAS); to (CU) NSAIDs + unkn = An hz, kw, le, mu, wh, mz
pn, to, cc
9 27/M + - pa, ar, pl, pnc, cd wn (An); pe, ba (U); le, ml (OAS) hz, kw, pe, le pn, ml, gb, wn, pi, che, sb, cha, cb, ba, cf
10 31/F + - dm, ar, pl, cu al, wn, hz, pe, che, plm (U); gb (An); cb (CU); unkn (GID)
hz, kw, pe, wh, mu, le
wn, al, che, plm, cb, gb, esc, as, sp, pea, bb
11 42/F + + cd, dd, pl le (U); fig (OAS); gb (GID) NSAIDs + unkn = An pe, mz, le fig, gb
12 43/F - - dm, ar, pl to, ml, ba, gb (OAS); wn (An); pe (CU) hz, kw, pe, mz, le, mu
gb, ml, wn
13 37/F + + pl, pa, ar wn (OAS); unkn (An) hz, kw, pe, mz, le pn, wn, sf, che, cn
14 41/F - + pl, ar, gr wh, sp (U); ap, wn (OAS); le, ba (GID) kw, pe, mz, mu, le, wh
ba
15 37/F + - dm, gr, ar, pl, alt, dd, cu, ol
le, wn, hz, gp, pe, fig, ap, gb (OAS); unkn (GID) NSAIDs + le= An hz, pe, mz, mu, le pn, wn, gb, gp, fig, ap
16 47/F + -dm, gr, pa, ar, ol, pl,
cd, ddpe (U); wn, hz, plm, pn, sf, mz, gp, ml, gb, zu, ak,
mu, lu, to, che, ml, cb (OAS)hz, kw, pe, mz, mu,
lewn, pn, plm, lu, sf, ml,
gb, to, ak, gp, che, zu, cb
17 34/F + - dm, gr, ar, pl, cd, dd gb, le (OAS); be (An); plm, cb, sp (U) NSAIDs + unkn = An hz, kw, pe, mz, mu, le
gb, sp, cb, plm, be
18 40/M - - na gb,pn (An); cn (GID); pe (OAS) na na
19 33/F + + ar, pl, cd al, hz, pn, pi, pe, nc, gp (An); fig, ri (OAS) hz, pe, mz, le al, pi, pn, fig, ri, gp 20 34/F - - ar, pl pn, le (An); to (U); unkn (GID) hz, pe, mz, mu, le pn, to
21 28/F + + dm, gr, pa, ar, pl, cd, dd
wn, hz, pn, le, pe, gb, gp, ml, fig (OAS) NSAIDs + unkn = An hz, kw, pe, mz, mu, le
wn, pn, cb, gb, gp, fig, ml, plm, sb, md
22 23/M - - dm, pl pe, pa (OAS); unkn (GID) NSAIDs + unkn = An kw, pe, mu, le gb
23 14/M - - dm, gr, pa, ar, ol, pl, cu, cd, dd
sf, cw (An); ap (OAS) hz, kw, pe, mz, mu, wh
sf, cw, ap
24 20/F + - dm, ar, pl, dd pe (OAS); le (GID); unkn (U) pe, mu, le pn25 44/F + + dm, ol, pl, alt le (An); pe (U); ml (OAS); unkn (GID) hz, pe, mz, le ml
26 23/M - - dm, ar, pl to, le, ln (OAS); wh, wn, ro, wh (An) hz, kw, pe, mz, le, wh
pn, wn, ln, to
27 35/M + - dm, pl pr, ap, on, le, ca, wn, pe (An) hz, pe, mz, mu, le pr, ap, on, wn, pn, ca
28 38/F + + dm, ar, pl wn, eg (An); mz, pn, to (OAS); pe, unkn (U); wh, le, unkn (GID)
hz, kw, pe, mz, mu, le, wh
pn, wn, to
29 43/F + + dm, pa, ar, ol, pl, asp, pnc
pe (U); unkn (GID) NSAIDs + le = An hz, kw, pe, mz, mu, le
char, ce, sp, to, cb, gb
30 40/M + - nd wh (U); hz (OAS) pe nd
31 34/F + - pa, ar, ol pe (U); le (GID) pe, mz, mu, le nd32 34/F + + dm, gr wn, hz, le, sb (OAS); pe (U); gb (GID) hz, pe, mz, le wn, gb, sb
33 37/M - - na ap, pe, wn (U); le (GID) NSAIDs + unkn = An na na
34 38/M + - nd pe, ap, pr, mu, al, hz (OAS); pe (CU); plm, wh (U) hz, pe, mz, mu, wh ap, plm, pr, al
35 28/M + - dm, gr, pa, ar, ol, pl, cu
pn, pe (U); le (GID) hz, pe, mz, mu, le, wh
pn, gb
36 26/M + + dm, gr, ol, alt, cla ap (An); pe (U); hz (OAS) NSAIDs + unkn = An hz, pe, mz ap
37 28/F + - na hz, wn, pn, al (U); le, pe, fig, kw (OAS) na na
38 28/M + - dm, gr, ar, pl, alt, cu, cd, dd
hz (U); pe (OAS); unkn (GID) Exercise + unkn = U hz, pe, mz, mu, le nd
39 33/M + - dm, gr, pa, dd pn, gb, ri (OAS); gb, che, ba (GID); hz (An) hz, pe, mz, le pn, ba, ri, gb, che
40 37/F + - pl, cu, ar wn, hz, pn, pe (U); le (OAS) NSAIDs + le = An hz, pe, mz, mu, le pn, wn41 46/F + + dm, cd, dd, ol, pl, pa wn, hz, pn, pe, gb, le (OAS) NSAIDs + le = An hz, pe, mz, mu, le pn, wn, gb
42 23/M + + dm, gr, cu, pa, ar, pl al (OAS); unkn (GID) NSAIDs + unkn = An hz, pe, mz, mu nd
43 24/F + + dm, pl wn (U); pe (OAS) pe, mz, mu wn44 25/F + + dm, gr, ar, pl pe (U); lu (An); wn, pn (OAS); ri, ml, wm (GID) NSAIDs + unkn = An hz, pe, mz, mu, wh pn, wn, ml, lu, wm, ri45 16/F - - dm, ar, pl pn (An); wn, gb (OAS); pe (U); le (GID) Exercise + unkn = An hz, pe, mz, le pn, wn, gb
Plant food sensitization
(SPT)
Other sensitizations (SPT)
Subj
ect #
Age
/Sex
PollinosisAeroallergens
Sensitization (SPT) Culprit Food / Symptomatology Cofactor involved and clinical effect
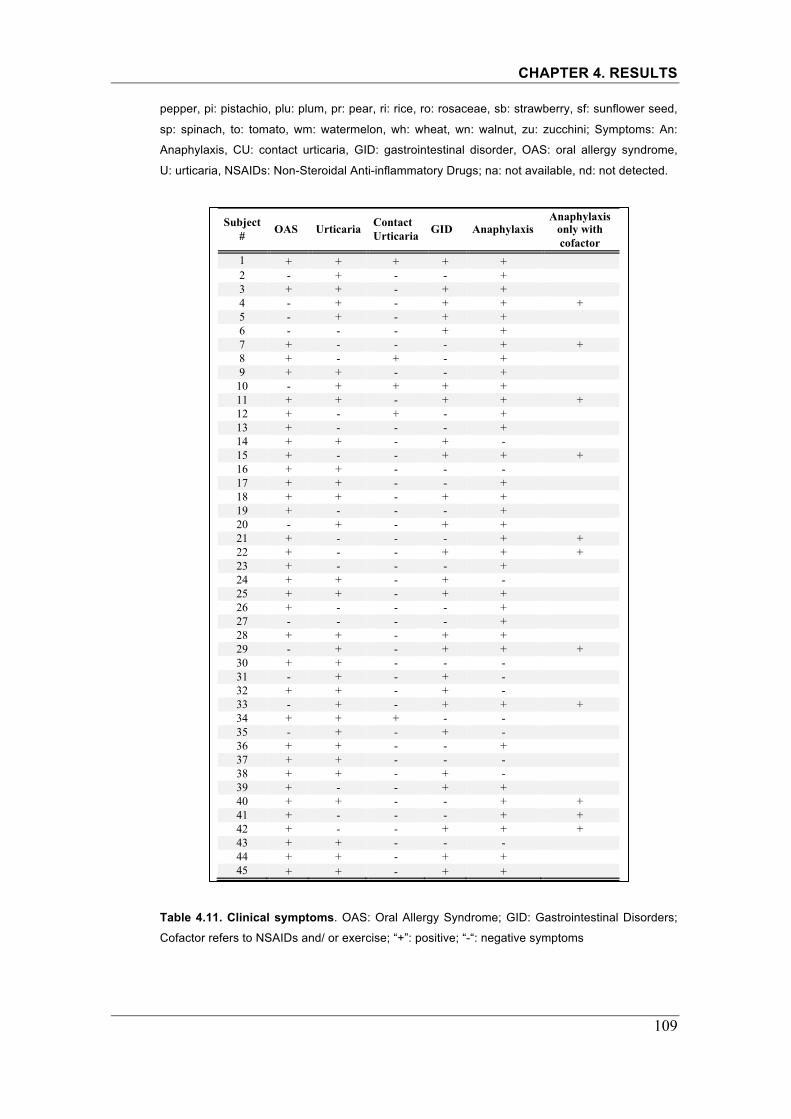
CHAPTER 4. RESULTS
109
pepper, pi: pistachio, plu: plum, pr: pear, ri: rice, ro: rosaceae, sb: strawberry, sf: sunflower seed,
sp: spinach, to: tomato, wm: watermelon, wh: wheat, wn: walnut, zu: zucchini; Symptoms: An:
Anaphylaxis, CU: contact urticaria, GID: gastrointestinal disorder, OAS: oral allergy syndrome,
U: urticaria, NSAIDs: Non-Steroidal Anti-inflammatory Drugs; na: not available, nd: not detected.
Table 4.11. Clinical symptoms. OAS: Oral Allergy Syndrome; GID: Gastrointestinal Disorders;
Cofactor refers to NSAIDs and/ or exercise; “+”: positive; “-“: negative symptoms
Subject # OAS Urticaria Contact
Urticaria GID Anaphylaxis Anaphylaxis
only with cofactor
1 + + + + + 2 - + - - + 3 + + - + + 4 - + - + + + 5 - + - + + 6 - - - + + 7 + - - - + + 8 + - + - + 9 + + - - + 10 - + + + + 11 + + - + + + 12 + - + - + 13 + - - - + 14 + + - + - 15 + - - + + + 16 + + - - - 17 + + - - + 18 + + - + + 19 + - - - + 20 - + - + + 21 + - - - + + 22 + - - + + + 23 + - - - + 24 + + - + - 25 + + - + + 26 + - - - + 27 - - - - + 28 + + - + + 29 - + - + + + 30 + + - - - 31 - + - + - 32 + + - + - 33 - + - + + + 34 + + + - - 35 - + - + - 36 + + - - + 37 + + - - - 38 + + - + - 39 + - - + + 40 + + - - + + 41 + - - - + + 42 + - - + + + 43 + + - - - 44 + + - + + 45 + + - + +

CHAPTER 4. RESULTS
110
4.2.4. Plant-foods sensitization
Sensitization to almost all plant-food allergenic sources included in the SPT
standard battery was observed in most patients (median [range]: 5 [1-7] positive
extracts). Further sensitizations were detected when SPTs were expanded to include
other plant-foods reported by individual patients, to confirm sensitization. All patients
that underwent SPT (42/45, 93.3%) had a positive test to peach peel, except one
(41/42, 97.6%); 35 (83.3%) were positive to maize, 33 (78.6%) to hazelnut, 32 (76.2%)
to lettuce, 29 (69.1%) to mustard, 18 (42.9%) to kiwi, and 12 (28.6%) to wheat (Table
4.10).
All patients with available sera were positive to whole peach extract (40/40,
100%; median [range] kUA/L: 3.49 [0.38-43.1]), 44/45 (97.8%) to Pru p 3 (5.03 [0.11-
36.7]), and none to Pru p 1 (0 [0-0.11]) or Pru p 4 (0 [0-0.07]), by ImmunoCAP™.
Specific IgE to rTri a 14 by ELISA was also positive for all patients tested (21/21,
100%) (Table 4.12).
Results from the microarray are shown in Figure 4.7. Sensitization to all the
LTPs included in the panel (Pru p 3, Art v 3, Cor a 8 and Par j 2) was observed; the
distribution of frequencies is shown in Table 4.13. No sensitization to any other plant-
food allergen included in the microarray panel (profilin, Bet-v1 homologues, taumatin,
Calcium-binding protein, vicilin, 2s-albumin, 11-s albumin, gliadin, papain-like cistein
protease and expansine) was detected.

CHAPTER 4. RESULTS
111
Table 4.12. Sensitization to peach components and Tri a 14. Total and specific IgE levels
determined by ImmunoCAP™ (Phadia®), expressed as kUA/L units, cutoff >0.35; Tri a 14
specific IgE by ELISA (OD 492 nm), cutoff >0.11. “na”: not available.
Peach CRD and Tri a 14
# Su
bjec
t
Tota
l IgE
Extr
act
LTP
PR10
Prof
ilin
Tri a
14
1 132 13.3 13.2 0 0.02 0.30 2 85.5 2.25 5.03 0 0.02 0.27 3 123 4.83 6.58 0 0.01 na 4 265 0.74 0.11 0 0 0.29 5 148 23.4 25.6 0 0 0.29 6 41.4 0.93 1.28 0 0 na 7 205 14.9 20.9 0 0.01 0.23 8 49.6 na 19.6 0 0.02 0.21 9 35.6 na 1.76 0 0.02 0.18 10 34.9 3.2 4.64 0 0 0.18 11 39.3 0.84 1.51 0 0 na 12 na 4.54 5.57 0 0 0.17 13 51.2 4.47 6.35 0 0 na 14 706 1.14 0.89 0 0.02 0.20 15 196 4.64 1.23 0 0.03 0.28 16 50.4 2.18 3.05 0 0 na 17 153 4.89 6.66 0 0.03 na 18 23.5 5.05 7.44 0 0 na 19 103 2.02 2.84 0 0 na 20 367 16.2 21.3 0.11 0.07 na 21 64.8 3.23 3.63 0 0 na 22 83.9 1.77 2.55 0 0 na 23 306 14.4 6.11 0 0 0.34 24 236 6.22 10.2 0 0 na 25 231 0.39 1.65 0 0.07 na 26 72 43.1 35.4 0 0.01 0.27 27 na na 5.22 0 0 na 28 39.5 1.56 1.64 0 0 0.25 29 111 na 10.8 0 0 0.23 30 196 2.89 3.24 0 0 0.19 31 220 0.89 0.82 0 0 na 32 49.2 0.65 0.89 0 0 na 33 202 4.55 5.63 0 0 na 34 14 0.95 1.27 0 0 0.20 35 138 3.75 5.24 0 0 0.19 36 472 2.35 4.05 0 0 na 37 131 9.51 9.52 0 0 na 38 174 12.3 31.9 0 0 0.20 39 121 2.43 3.35 0 0 na 40 192 31.1 36.7 0 0 0.19 41 55.9 0.38 0.42 0 0 na 42 150 na 14.7 0 0 na 43 78.7 3.85 4.98 0 0 na 44 729 16.7 18.8 0 0 0.18 45 42.2 0.62 0.43 0 0 na

CHAPTER 4. RESULTS
112
Figure 4.7. Schematic representation of component specific-IgE detection by microarray. A column represents a subject and rows each allergenic component. Levels expressed as ISU
�

CHAPTER 4. RESULTS
113
units. Color code: grey, levels below the cutoff 0.3 ISU units; yellow (0.3-5), orange (5-20) and red
>20 ISU. In bold the LTPs included in the panel.
4.2.5. Pollen sensitization
Thirty-four (75.6%) subjects were also diagnosed with pollinosis, while all of
them had rhinitis, in 14 cases (31.1%) associated with asthma (Table 4.10).
Frequencies of pollen sensitization detected by each method are summarized in
Table 4.13. A detailed description of each subject is provided in Table 4.14. By SPT
and/or specific IgE, sensitization to some of the pollens tested with a known LTP
(mugwort, wall-pellitory, plane tree, cypress and olea) occurred in 43 (95.6%) subjects.
Sensitization to plane tree was detected in 42 (93.3%) patients, to mugwort in 33
(73.3%), to wall-pellitory in 16 (35.6%), to olea in 14 (31.1%) and to cypress in 12
(26.7%).
Table 4.13. Summary of pollen sensitization. Frequencies refer to all subjects of the cohort
(n=45) unless specified. Specific IgE median [range] expressed as kUA/L for ImmunoCAP™
(Phadia) test and ISU units for ImmunoCAP ISAC™ (Phadia®). SPT: Skin Prick Test.
Sensitization N (%) Specific IgE median [range]
Peach Peel SPT 41/42 (97.6%) - - Peach Extract ImmunoCAP 45 (100%) 3.49 [0.38-43.1] - Pru p 3 ImmunoCAP 45 (100%) 5.03 [0.11-36.7] - Pru p 3 ISAC 45 (100%) 3 [0.3-15.3] Cor a 8 ISAC 26 (57.8%) 0.5 [0.0-5.5] Plane Tree SPT 35/42 (83.3%) - - Plane tree ImmunoCAP 36/42 (85.7%) 1.41 [0-61] - Pla a 1 ISAC 7 (15.6%) 0 [0-39] - Pla a 2 ISAC 31 (68.9%) 0.8 [0-61.6] Mugwort SPT 27/42 (64.3%) - - Mugwort ImmunoCAP 27/43 (63.0%) 0.6 [0-7.0] - Art v 1 ISAC 1 (2.2%) - - Art v 3 ISAC 29 (64.4%) 0.6 [0-4.9] Wall-Pellitory SPT 15/42 (35.7%) - - Par j 2 ISAC 13 (28.9%) 0 [0-81] Olea SPT 12 (28.6%) - - Ole e 1 ISAC 8 (17.8%) 0 [0-16.8] - Ole e 2 ISAC 0 - Cypress SPT 9 (21.4%) - Cup a 1 ISAC 10 (22.2%) 0 [0-30.4] Grass pollen SPT 12/42 (28.6%) - -Phl p 1 ISAC 7 (15.6%) 0 [0-9.4] -Phl p 2 ISAC 1 (2.2%) - -Phl p 4 ISAC 5 (11.1%) 0 [0-2.3] -Phl p 5 ISAC 3 (6.7%) 0 [0-0.6] -Phl p 6 ISAC 1 (2.2%) - -Phl p 7 ISAC - - -Phl p 11 ISAC - - -Phl p 12 ISAC - -

CHAPTER 4. RESULTS
114
Table 4.14. Detail of pollen sensitization detected by each diagnostic test. Specific IgE to
allergen components by microarray in ISU units, cutoff > 0.3; Specific IgE to whole extracts by
POLLEN SENSITIZATION
Subj
ect #
Art
v 1
Art
v 3
M
ugw
ort
Imm
unoC
AP
Mug
wor
t SPT
Cup
a 1
Cyp
ress
Ole
e 1
Ole
e 2
Oliv
e po
llen
SPT
Par
j 2
Pari
etar
ia S
PT
Phl p
1
Phl p
11
Phl p
12
Phl p
2
Phl p
4
Phl p
5
Phl p
6
Phl p
7
Gra
ss S
PT
Pla
a 1
Pla
a 2
Plan
e T
ree
Imm
unoC
AP
Plan
e T
ree
SPT
1 0.0 2.3 3.61 - 0 - 0 0 - 24.8 + 0 0 0 0 0 0 0 0 - 0 1.5 6.04 +
2 0.0 0 0.06 - 0 - 0 0 - 1.5 + 0 0 0 0 0 0 0 0 - 0 0.5 0.11 +
3 0.0 0.3 0.72 + 5.9 + 1.4 0 + 0 - 0 0 0 0 0 0 0 0 - 0 0.5 0.67 +
4 0.0 0 0 - 30.4 - 4.1 0 + 81 + 0 0 0 0 0 0 0 0 - 0 2.7 1.97 +
5 0.0 1.8 6.97 + 0 - 0 0 + 0 - 2.8 0 0 0 0 0 0 0 - 0 0.6 7.34 +
6 0.0 0 0.44 - 0 - 0 0 - 0 - 0 0 0 0 0 0 0 0 - 0 0 0.53 -
7 0.0 3.8 6.04 + 0 - 0 0 - 0 - 0 0 0 0 0 0 0 0 - 0 0.8 8.68 +
8 0.0 4.9 2.85 + 0 - 0 0 - 0 + 0 0 0 0 0 0 0 0 - 0 0 4.85 +
9 0.0 1.1 0.2 + 0 - 0 0 - 31 + 0 0 0 0 0 0 0 0 - 3.6 1.9 1.88 +
10 0.0 1.7 0.22 + 0 + 0 0 - 0 - 0 0 0 0 0 0.5 0 0 - 0 0 1.41 +
11 0.0 0 0.04 - 0 - 0 0 - 0 - 0 0 0 0 0 0 0 0 - 11 16 21.2 +
12 0.0 0.3 1.22 + 0 - 0 0 - 0 - 0 0 0 0 0 0 0 0 - 0 0.9 0.84 +
13 0.0 4.8 0.73 + 0 - 0 0 - 0 + 0 0 0 0 0 0 0 0 - 0 0 0.27 +
14 0.0 1.2 0.6 + 0 - 0 0 - 0 - 0 0 0 0 2.3 0 0 0 + 0 0.9 0.99 +
15 0.0 4.5 2.69 + 1.5 + 0 0 + 0 - 0 0 0 0 0 0 0 0 - 39 61.6 61 +
16 0.0 1.5 0.48 + 0 - 0 0 + 10 + 0 0 0 0 0 0 0 0 + 0 1.5 0.46 +
17 0.0 0.7 1.16 + 0 - 0 0 - 0 - 0 0 0 0 0 0 0 0 + 0 0.7 2.3 +
18 0.0 0 0.4 na 0 na 0 0 na 0 na 0 0 0 0 0 0 0 0 na 0 2.3 0.22 na
19 0.0 0.6 0.45 + 0 - 0 0 - 0 - 0 0 0 0 0 0 0 0 - 0 0.8 0.81 +
20 0.0 2 2.04 + 0 - 0 0 - 0 - 0 0 0 0 0 0 0 0 - 0 3.2 7.13 +
21 0.0 0.9 0 + 0 + 0 0 - 12.1 + 8.8 0 0 0 0 0 0 0 + 0 0 0 +
22 0.0 0 0.02 - 0 - 0 0 - 0 - 0 0 0 0 0 0 0 0 - 0 0.7 0.39 +
23 0.0 1.2 1.14 + 3.6 + 0 0 + 29.1 + 9.3 0 0 0 0.9 0 0 0 + 0 1.6 16.7 +
24 0.0 0.4 1.27 + 0 - 0 0 - 0 - 0 0 0 0 0 0 0 0 - 0 0 1.28 +
25 0.0 0 0.18 - 0 - 2.7 0 + 0 - 0 0 0 0 0 0 0 0 - 5 3.7 26.6 +
26 0.0 2.7 2.3 + 0 - 0 0 - 0 - 0 0 0 0 0 0 0 0 - 0 3 1.9 +
27 0.0 0 0.64 - 0 - 0 0 - 0 - 0 0 0 0 0 0 0 0 - 0 1.3 1.99 +
28 0.0 0.5 0.46 + 0 - 0 0 - 0 - 0 0 0 0 0 0 0 0 - 0 0 0.35 +
29 0.4 0.7 3.46 + 0 - 0 0 + 15 + 0 0 0 0 0 0 0 0 - 0 0.7 6.6 +
30 0.0 0 0.11 - 0 - 0 0 - 0 - 0 0 0 0 0 0 0 0 - 0 0.5 0.06 -
31 0.0 0 0.04 + 0 - 1.6 0 + 10.2 + 0 0 0 0 0 0 0 0 - 0 0 0.04 -
32 0.0 0 0 - 0 - 0 0 - 0 - 0 0 0 0 0 0 0 0 + 0 0 0 -
33 0.0 0.6 1.16 na 3.7 na 0 0 na 0 na 5.4 0 0 5.9 0.3 0 0 0 na 0 0.3 1.46 na
34 0.0 0 0 - 0 - 0 0 - 0 - 0 0 0 0 0 0 0 0 - 0 0 0.03 -
35 0.0 0.8 1.12 + 0.3 + 16.8 0 + 6.2 + 0 0 0 0 0.4 0 0 0 + 1.4 1.2 4.49 +
36 0.0 0 0.04 - 0 - 5 0 + 0 - 9.4 0 0 0 0 0 0 0 + 0 0 0.65 -
37 0.0 0.8 0.19 na 0 na 0 0 na 15.7 na 0 0 0 0 0 0 0 0 na 0 1.3 0.55 na
38 0.0 1.8 3.09 + 8.9 + 0 0 - 0 - 7 0 0 0 0.5 0 0 0 + 0 0 1.3 +
39 0.0 0 - - 0 - 0 0 - 4.5 + 0 0 0 0 0 0 0 0 + 0 0 0.35 -
40 0.0 2 5.82 + 8.7 + 0 0 - 0 - 0 0 0 0 0 0 0 0 - 0 1.8 5.16 +
41 0.0 0 0.07 - 0 - 0 0 + 0 + 0 0 0 0 0 0 0 0 - 8 1.6 6.36 +
42 0.0 0.7 3.07 + 0.6 + 0 0 - 2.3 + 0 0 0 0 0 0.6 0 0 + 2.1 6.9 10.3 +
43 0.0 0 - - 0 - 0 0 - 0 - 0 0 0 0 0 0 0 0 - 0 2.6 2.19 +
44 0.0 4 3.42 + 4.3 - 7.7 0 - 0 - 5 0 0 0 0 0.3 0.4 0 + 0 8.4 4.75 +
45 0.0 0.3 0.21 + 0 - 1.9 0 - 0 - 0 0 0 0 0 0 0 0 - 0 0 0.13 +

CHAPTER 4. RESULTS
115
ImmunoCAP™ (Phadia®) in kUA/L, cutoff >0.35; SPT results: positive (+), negative (-) or not
available (na).
The proportion of patients positive to plane tree (0.91, 95% CI [0.83-0.99]) and
mugwort (0.69, 95% CI [0.55-0.82]) was higher than that of other tested pollens
(cypress, olea, wall-pellitory and grass) and this difference was statistically significant
(Figure 4.8).
Figure 4.8. Estimation of proportion of positive to pollens. Estimation of proportion of
positive tests to plane tree, mugwort, wall-pellitory, cypress, grass pollen or olea in a subject was
analyzed using logistic regression models.
4.2.6. NSAID cofactor effect on basophil degranulation in vitro To investigate the effect of NSAID as a cofactor we wanted to establish a model
in vitro to reproduce the clinical observations. Thus, we designed a basophil activation
test based on two stimulation phases, a first phase with only the food allergen (Pru p 3)
and a second one with the combination of the drug and the food allergen (L-ASA + Pru
p 3). The test was performed to all individuals recruited for this pilot study (Group A: 24
peach allergic patients, presenting clinical exacerbation when NSAIDs intake; Group B:
7 peach allergic patients, not clinically exacerbated by NSAIDs; and Group C: 5 healthy
non-atopic subjects) under the same conditions. Tolerance to L-ASA was confirmed in
all patients by negative results on basophil activation tests performed at several
concentrations of L-ASA (3 mM, 1 mM, 0.3 mM and 0.1 mM).

CHAPTER 4. RESULTS
116
With this in vitro model, a statistically significant increase in basophil activation
(measured as expression of CD63) when stimulation was performed with Pru p 3
together with L-ASA at different concentrations (3 mM, 0.3 mM and 0.1 mM) compared
to the activation induced by Pru p 3 alone (Wilcoxon Matched Pairs test: at 3mM,
p<0.0001; at 0.3 mM, p=0.0117 and at 0.1 mM p=0.0085) could be observed. The L-
ASA 1 mM did not show such effect. The percentage of CD63+ cells was very similar
to stimulation with L-ASA alone (negative test).
The increase on degranulation upon stimulation with both Pru p 3 and L-ASA
was not observed for group B (Figure 4.9). Group C showed no degranulation with any
of the stimuli.
Figure 4.9. Basophil activation test with Pru p 3 and L-ASA. Percentage of CD63+ cells
induced by each stimulus in groups A and B.

117
CHAPTER 5. DISCUSSION

CHAPTER 5. DISCUSSION
118

CHAPTER 5. DISCUSSION
119
DISCUSSION
5.1. CRD and epitope recognition in shellfish allergy
Despite the high prevalence of shellfish allergy, its diagnosis is still too often a
challenge for clinicians, particularly in patients with mild subjective symptoms,
inconsistent reactions, or no prior history of reaction on shrimp ingestion but with a
positive test result to shrimp (skin prick test and/or specific IgE in serum) obtained
during routine workup for allergies. Frequently sensitization to allergens occurs but the
clinical repercussion of it is not clear, especially when several potential culprit foods are
involved and there is sensitization to allergenic components of all of them. Thus, the
double-blind placebo controlled food challenge still remains the gold standard for
shellfish allergy diagnosis, despite its limitations considering time requirements and the
potential risk of inducing severe reactions.
Component resolved diagnostics, with recombinant or purified allergens, and
epitope mapping have been applied to a wide range of food and environmental
allergies, allowing the elucidation of distinct sensitization profiles for different clinical
pictures [46]. For instance, specific IgE to Ara h 2 is more accurate in predicting clinical
peanut allergy than other peanut allergens [128]. In addition, sensitization to particular
epitopes of milk [129], egg [130], or peanut [68] has been used as biomarkers for
severity and persistence of disease. Furthermore, these new diagnostic tools have
allowed the development of new types of immunotherapy, some of which have shown
efficacy in human trials [131].
Several shrimp allergens have been cloned and characterized during the last
decades [79], as well as their IgE epitopes identified [90]. However, despite the
improvement on knowledge of shellfish allergens in the last years, there is limited
information about the clinical relevance of sensitization to particular shrimp allergens.
Two recent studies aimed to improve the diagnostic approach to shellfish allergy. Yang
A et al. [88] studied the relevance of sensitization to tropomyosin in dust mite-allergic
subjects sensitized to shrimp. Tropomyosin-specific IgE was found to have greater
diagnostic efficiency compared to whole shrimp-specific IgE or SPT (88.5%, 74.2%,
and 65.7% respectively). Bauermeister K et al. [89] suggested a panel of six allergens
(tropomyosin, arginine-kinase, sarcoplasmic calcium-binding protein, a novel myosin
light chain, troponin C and triosephosphate-isomerase) of the North Sea shrimp

CHAPTER 5. DISCUSSION
120
(Crangon crangon) to develop a more sophisticated and clinically adequate method of
shrimp allergy diagnosis and treatment.
The present study aimed to identify profiles of allergen sensitization and
significant epitopes in shrimp allergens resulting in clinical reactivity to shrimp. To our
knowledge, this is the largest study providing a molecular diagnosis of shrimp allergy,
with 86 subjects sensitized to shrimp recruited and challenged, a control group of
subjects sensitized to dust-mite and/or cockroach but not to shrimp and including all
described crustacean allergens described so far (except triosephosphate-isomerase).
Furthermore, IgG4 reactivity at epitope level with five shrimp allergens is assessed for
the first time.
The initial recruitment criteria was a positive test with shrimp extract (SPT
and/or serum specific IgE), then subjects were subdivided according to their history of
allergic reactions with shrimp. A DBPCFC was performed in all cases, except those
reporting an episode of anaphylaxis with shrimp within the previous 3 months. An
extensive cross-reactivity has been described among crustaceans and dust mite and/or
cockroach [79, 132]. Fernandes J et al. reported that house dust mite and cockroach
tropomyosins could account for the presence of detectable IgE to shrimp, even in
unexposed subjects [133]. Thus, an additional control group allergic to dust-mites
and/or cockroach but not sensitized to shrimp was also included. Frequency of
sensitization to dust mite (D. pteronyssinus, DP) was very high in all groups (94-100%)
and no statistically significant differences in the levels of DP-specific IgE were found.
Sensitization to cockroach was lower, probably because it is less prevalent in some of
the areas where the subjects were recruited. Dust mite and/or cockroach sensitization
in groups 1, 2a and 2b could be not only due to a primary sensitization, but also
secondary to a cross-reactivity phenomenon with homologue proteins of shrimp and
dust mite or cockroach. Thus, both the grade of homology between the same proteins
in different species and the frequency of exposure to dust mite, cockroach or both
could influence sensitization. Wang et al. suggested recently that shrimp IgE levels
might need to be interpreted in the context of environmental exposures after finding
that shrimp IgE levels were correlated with cockroach IgE levels and exposure to
cockroach allergen at home, but not to dust mite exposure [134].
In terms of recombinant allergen recognition, we observed that shrimp allergic
individuals showed more diversity of allergen recognition (i.e., recognized more
allergens) than shrimp tolerant subjects; dust mite and/or cockroach allergic subjects
not sensitized to shrimp (control group C1) only recognized arginine kinase and

CHAPTER 5. DISCUSSION
121
hemocyanin; and arthropod-allergic subjects sensitized to shrimp but tolerant that had
been separated depending on their history of allergic reactions on shrimp ingestion
(groups 2a and 2b) showed no differences in allergen recognition among them (except
for hemocyanin being more frequently recognized 2a, p=0.0189). Thus, the clinical
relevance of the differences between these two groups (2a and 2b) is not entirely clear,
maybe they are not really different and we do not know to what they may have reacted
in the past, especially the group 2a that once had allergic symptoms after shrimp
ingestion. Subjects sensitized to shrimp extract (2a and 2b) may recognize other
allergens than arginine kinase and hemocyanin, including tropomyosin and others,
however no statistically significant differences in frequencies of allergen recognition
were found between these two groups (2a+2b) and control group 1. Therefore, all
three, regardless of the shrimp sensitization, were considered together as shrimp
tolerant for comparative analysis with shrimp allergic subjects.
Statistically significant differences in the frequency of IgE recognition of
tropomyosin, sarcoplasmic calcium-binding protein- alpha and/or -beta and myosin
light chain were found between shrimp allergic and tolerant subjects. Tropomyosin had
the strongest statistically significant difference (p <0.0001). Thus, sensitization to these
components, and to tropomyosin in particular, seems to be useful to differentiate
clinical reactivity to shrimp (i.e., predictive/associated with positive challenge).
Moreover, the analysis of their properties as diagnostic tests showed that tropomyosin
had the highest values for all 5 parameters (sensitivity, specificity, PPV, NPV and
efficiency). Whereas SCPs and MLC showed high values for specificity (~ 95% and
87.5%, respectively) as well as PPV (97.5% and 81.5%, respectively), but low ones for
sensitivity (29-35% and 38%, respectively) and NPV (~ 50%). Efficiency for SCPs and
MLC was around 60%, lower than shrimp extract tested by ImmunoCAP (78%) and TM
(87%). The shrimp extract was the most sensitive (98%) and with the highest NPV
(95%), however it had the lowest specificity (49%) and PPV (74%).
IgE reactivity to whole food extracts on skin prick test and/or ImmunoCAP
without clinical correlation has been attributed to sensitization to cross-reacting
allergens in other foods or as a result of primary exposure to allergens on sites
different from the gastrointestinal tract [101]. In this line, the whole shrimp extract is
very sensitive but poorly specific, with a high number of positive tests without clinical
relevance. Thus, it could be hypothesized that a great number of positive tests not
clinically relevant are due to cross-reactive responses to tropomyosin (described as an
invertebrate panallergen [87]), arginine kinase or hemocyanin. Such sensitization could

CHAPTER 5. DISCUSSION
122
have been acquired through exposure to these allergens present in foods other than
shrimp, parasites, or mites and cockroach through the inhalant route [135]. Yang et al.
[88] described that in their group of patients with mite allergy and a high frequency of
sensitization to shrimp (SPT and ImmunoCAP) without clinical correlation, sensitization
to shrimp tropomyosin was found only in a small proportion of them. In our study, we
have also found that only a few subjects with this profile (groups 2a and 2b) recognize
tropomyosin. In addition we have observed that they mainly recognize arginine kinase
and hemocyanin (allergens not tested by Yang et al. [88]) alike the control group C1.
This observation should be confirmed with larger groups of subjects. Thus, from the
present study, we identify not only clinically relevant components (SCPs, TM and MLC)
in shrimp allergy, but also arginine kinase and hemocyanin as likely markers of cross-
reactivity in arthropods, a role that has mainly been attributed to tropomyosin [79, 87,
133]. Only a few subjects in this study, with no statistically significant differences
between groups, recognize troponin C allergen.
Many recombinant allergens, such as tropomyosin, have been shown to behave
similar to their native counterparts [56, 136]. However this is not universal. This might
explain why some subjects were found not to recognize any recombinant protein on
dot-blot immunolabelling but then they showed IgE binding to proteins of boiled and
raw shrimp extracts by Western blot. Similarly, the low sensitivity observed by the
recombinant allergens may be due to post-transcriptional modifications of the native
allergens that may differ from the recombinant counterparts.
Although sarcoplasmic calcium-binding protein and myosin light chain were
reported to be particularly important in children in prior publications [84, 85, 90], no
strong trend on that point was observed in this study. No major differences were found
between children and adults IgE recognition within each group. Stronger differences
observed in previous studies might be due to the fact that subjects were not challenged
and more adults with negative challenges might have been included in the study.
Ayuso R et al. previously identified the IgE-binding epitopes of four shrimp
allergens (shrimp TM, AK, MLC and SCP, Lit v 1 to 4, respectively) [90]. In the present
study we include another shrimp allergen, Troponin C, as well as IgG4 binding data.
The fact that IgE and IgG4 binding areas coincide largely has also been described in
peanut and milk microarray studies [68, 69, 137]. TileMap analysis was intended to
identify IgE and IgG4 binding sites with statistical differences between groups (FDR
<0.05, p <0.01). Groups 2a and 2b showed minor differences in binding sites, therefore
for the analysis they were considered together (2=2a+2b) as tolerant to compare with

CHAPTER 5. DISCUSSION
123
the positive challenge individuals (group 1). Several informative epitopes/binding areas
were identified through multiple comparisons between groups that might be useful in
predicting clinical reactivity. Interestingly, more differential binding sites for IgE were
observed for tropomyosin, a protein associated with positive challenge outcome;
whereas for IgG4 more different binding sites were observed for arginine kinase, an
allergen that from the part of this study dealing with whole recombinant allergens (dot
blot) seems to be more involved in cross-reactivity phenomena. However, we have to
keep in mind that for arginine kinase we have also identified some epitopes that differ
between challenge positive subjects and challenge negative.
The IgE antigenic areas recognized in the present study for the 4 allergens
corresponded well to previously identified epitopes [90]. Moreover, if we compare the
results of the current study with the results of a recent pilot study of our group (with
smaller sample size) that also aimed to identify clinically relevant epitopes [91], we
observe that almost the same epitopes were identified for TM, with two additional ones
(epitopes 3 and 6). This was not the case for the other allergens. For MLC, only two
epitopes of the five described before as clinically relevant [91] were also found in the
current study (epitopes 2 and 5). For SCP, a different binding site not previously
reported was identified and the epitope described as clinically relevant by the pilot
study could not be reproduced. For AK, only epitope 7 coincided with the results of the
pilot study, however statistically significant differences between allergic and tolerant
individuals were found in three additional epitopes (3, 4a and 4b) already described by
Ayuso et al. [90] but not identified as clinically relevant in the pilot study.
Challenge positive individuals recognized more frequently all epitopes than
challenge negative subjects, except for epitope 2 of MLC. Tropomyosin and SCP
epitopes showed high specificity (>90%, epitopes 1, 5a, 5b and 6 of TM and n of SCP;
>75%, epitopes 3 and 7 of TM) and PPV (>90%, epitopes 1 and 5b of TM; >75%,
epitopes 3, 5a, 5b, 6 and 7 for TM and epitope n for SCP), alike TM and SCP complete
recombinant allergens. However, the epitopes of the other allergens had lower values
for these parameters. Sensitivity varied largely between allergens, as well as, for
epitopes of the same allergen. For instance, while epitope 7 of TM showed the highest
specificity of all epitopes analyzed, the others had values from 38 to 71%. Epitope n of
SCP showed the lowest sensitivity (33%). In parallel, the highest NPV were observed
for certain epitopes of TM (76-88%) and epitope 7 of AK (80%). Tropomyosin epitopes
showed in general higher efficiency values (76-82%) than the epitopes of the other
allergens (63-69%). Epitope 7 of tropomyosin was the only one with high values for all

CHAPTER 5. DISCUSSION
124
5 parameters and may be a good candidate to be included in a panel of epitopes to
predict clinical reactivity.
In peanut allergy, clinical sensitivity, determined by means of DBPCFC, seemed
to be positively related to IgE broader epitope recognition [68]. For milk allergy, peptide
microarray studies showed that patients with persistent milk allergy had increased
epitope diversity and stronger IgE affinity binding compared to patients with transient
milk allergy or tolerance to extensively heated milk [69]. In our study, the number of
peptides bound by IgE and both IgE and IgG4 (i.e. epitope diversity) in shrimp allergic
subjects was larger for all five allergens than in tolerant subjects. Similarly to peanut
and milk allergy, clinical reactivity would be associated to IgE broader epitope
recognition of shrimp allergens. Interestingly, for TM, MLC and AK we observed IgG4
broader epitope recognition in allergic individuals (group 1) than tolerant ones (group
2). The role of IgG4 in these differences is hard to address, since this antibody has
been related to chronic antigen exposure and it has been shown in other contexts to
inhibit the activity of IgE by competing for binding sites becoming somehow protective
[138-140]. So one would have expected that the diversity of IgG4 binding would be
superior for shrimp tolerant individuals than for allergic ones. However, for milk allergy,
it was reported that subjects who were heated-milk tolerant had IgE-binding patterns
similar to those of subjects who had outgrown their milk allergy but IgG4-binding
patterns that were more similar to those of the allergic group [69]. Then, it was
speculated that since strict avoidance is currently the mainstay of treatment of milk
allergy, it could be possible that IgG4 binding might increase as the heated milk
tolerant group incorporates certain heated milk products into their diets. Alternatively
they proposed that as tolerance to milk develops, subjects might lose IgG4 to some
epitopes and develop IgG4 to other areas of the milk proteins [69]. In our case, the
presence of IgG4 even in shrimp allergic individuals could be due to exposure to other
shellfish that they might tolerate, or to chronic exposure to environmental allergens
(i.e., dust-mites and/or cockroach) that could cross-react with shrimp allergens having
similar sequential epitopes (although conformational epitopes seem to be more
relevant than sequential epitopes for environmental allergens [63,67]). An alternative
hypothesis maybe that shrimp allergic individuals produce both IgE and IgG4
antibodies and clinical reactivity depends on antibody levels, antibody affinity or other
factors. In the present study, affinity of binding was not analyzed, however this would
be an interesting point to considerate for future studies intended to identify more
differences between subjects with and without clinical reactivity to shrimp, or to identify
CHAPTER 5. DISCUSSION
125
sequential epitopes associated with clinical severity and persistence of shrimp allergy.
The relevance of these findings of IgG4 in shrimp allergy needs to be further
investigated.
In conclusion, sensitization to tropomyosin, sarcoplasmic calcium-binding
protein and myosin light chain is associated with clinical reactivity to shrimp. Arginine
kinase and hemocyanin are important cross-reactivity markers in arthropods, but still
some arginine kinase epitopes may be clinically significant. Detection of specific IgE of
these allergenic components should be included in the routine workup of shellfish
allergy diagnosis. In addition, the identification of differential binding sites/epitopes with
good properties as diagnostic tests to discriminate between allergic and tolerant
individuals (e.g., epitope 7 of tropomyosin) opens new perspectives for diagnosis and
treatment of shellfish allergy.
5.2. Lipid Transfer Protein syndrome: clinical pattern and molecular sensitization profile to plant-foods and pollens
As expected in a Mediterranean country, our cohort was sensitized to LTPs
present in plant-food allergenic sources. More importantly, no sensitization to any other
plant-food panallergen was detected by using the microarrayed-CRD system, which
allowed us to clinically characterize patients from our area with LTP-syndrome.
In our hands, CRD is a valuable tool for unmasking the diagnosis of LTP-
syndrome in patients with a complex clinical pattern and multiple sensitizations to
plant-foods and pollens. Specifically, it permits the identification of the components
triggering the allergic responses that may help patients avoid severe episodes of
anaphylaxis. Furthermore, we have found that CRD is useful for identifying those
patients who present only mild IgE-mediated symptoms resulting from isolated LTP
sensitization. This study shows that mild symptoms, which are usually associated with
other plant-food allergens such as profilins or Bet v 1-like proteins, can also be induced
by LTPs.
Since other allergenic components could be responsible for the symptoms
described by the subjects in this study, it is necessary to perform a complete protein
screening to thoroughly evaluate other sensitizations. The simultaneous testing of
multiple allergenic components from different allergenic protein families with the
biochip provides valuable information about the overall picture of each patient’s

CHAPTER 5. DISCUSSION
126
positive and negative sensitizations. Thus, the greater the number and diversity of
validated allergen components in the array panel, the more accurate the diagnosis.
In our group of patients, as previously described in Southern Europe [74, 108,
141, 142], peach is also the main Rosaceae fruit involved, and Pru p 3 the major
allergen (100% positive). Sensitization to other peach allergens was not detected.
Thirty-four (75.6%) patients reported peach allergy, while the remaining eleven were
individuals who spontaneously avoided eating peach peel and luckily had never been
accidentally exposed to it. Clinical practice reveals that many food-allergic patients
avoid eating a particular food while apparently unaware that they are sensitized to it.
Our patients suffered immediate allergic reactions to an extremely diverse panel
of plant-foods related with LTP-allergy, including Rosaceae and non-Rosaceae fruits,
such as tree nuts, peanut, green bean, wheat and lettuce. Some patients also reacted
to foods previously described as generally safe for LTP-sensitized patients (e.g.,
banana and melon [143]. In some reactions, the culprit food could not be identified and
although this is often observed in food allergy, this phenomenon appears to be more
frequent in LTP-sensitized patients. This broad diversity of offending foods is due to the
wide distribution of LTPs and their high cross-reactivity demonstrated in vivo and in
vitro, especially when sequence identity is high [110].
A broad spectrum of clinical symptoms has been observed in our study. The
high frequency of severe and systemic reactions, in parallel with OAS observed in LTP-
sensitized subjects, is consistent with the first description of the clinical picture of LTP-
sensitization [144, 145]. In our patients, OAS was found to be very frequent (75%), but
almost never as an isolated clinical presentation of LTP allergy. We report that GID
were frequently detected (55.6%). As patients with food allergy often do not
spontaneously relate abdominal discomfort with foods intake, this observation
highlights the need to carefully check digestive symptoms in these patients. In addition,
we need to take into account that GID and/or OAS were present in 32/34 (94%) of the
patients affected by anaphylaxis in other non-anaphylaxis food allergic episodes and in
12/34 (35%) were the unique other symptoms related with food allergy.
It is well established that in some cases exposure to a food allergen and a
concomitant or sequential exposure to physical exercise and/or medication are needed
to provoke the reaction. In our group of patients, cofactors were frequently involved
(40%) in the clinical expression of allergic symptoms and also influenced their severity,
i.e., some subjects tolerated a plant-food and only experienced the allergic reaction
with the cofactor, or they suffered a marked worsening of symptoms when the food and

CHAPTER 5. DISCUSSION
127
cofactor temporarily coincided. The contribution of a cofactor to the precipitation of
episodes of anaphylaxis was mandatory in 11 of the 34 (32.4%) patients. This data
emphasizes the need to carefully investigate the presence of more than one trigger in
episodes of anaphylaxis, particularly in its most severe forms [37]. Interestingly
enough, 55% our patients with anaphylaxis associated with cofactors suffered GID
and/or OAS as unique symptoms when exposed only to food allergens. Both clinicians
and patients may consider these episodes of food allergy a mild and almost irrelevant
process, when in fact it may represent a serious risk of developing severe or even fatal
anaphylactic episodes, if cofactors are not detected and the temporary association of
food and cofactors is not prevented.
The pathogenic mechanism of cofactors in food allergy remains to be clarified.
One theory suggests that changes in mucosal permeability induced by NSAIDs,
exercise or a combination of both can enhance allergen absorption, resulting in a more
intense exposure of mast cells to allergens [38, 146]. This could partially explain the
lack of correlation between LTP-specific IgE levels and severity of symptoms [147].
Although anaphylaxis induced by food allergen associated with cofactor has mainly
been described in patients allergic to omega-5 gliadin, our study shows, for the first
time, that cofactor-dependent anaphylaxis is also frequent in the LTP-syndrome.
With the basophil activation test developed for an in vitro model of the cofactor
effect in LTP-syndrome, we are by now able to report that the clinical effect seen in
vivo were also observed in vitro. NSAIDs affected somehow on basophil IgE-mediated
responses and this might explain the exacerbation of the clinical symptoms. However,
the concentration of L-ASA 1 mM did not show such effect and the percentage of
CD63+ cells was very similar to stimulation with L-ASA alone, as if Pru p 3 was
somehow blocked to induce degranulation. Further investigations are required to clarify
the mechanism of the cofactor effect on basophils and the role of cofactor
concentration on basophils behaviour. Moreover, it cannot be ruled out that the effect
of L-ASA is caused directly on basophils and not indirectly through other cells present
in the sample tested (i.e., monocytes, neutrophils, etc.). Future perspectives for this
study include the analysis of the behavior of other cell populations upon stimulation.
Traditionally, LTP-allergy has not been described in association with pollinosis,
but this paradigm has changed after recent reports of high rates of co-sensitization to
LTPs from pollens from the Mediterranean basin and plant-foods. The link between the
two means of sensitization and the potential influence of pollen-LTPs on LTP-food
allergy are still subject to debate. Although the IgE cross-reactivity between mugwort

CHAPTER 5. DISCUSSION
128
pollen and plant-food LTPs and Rosaceae LTPs is only partial [148], peach-allergic
patients highly exposed to mugwort pollen showed a significant pattern of sensitization
to both Pru p 3 and Art v 3 by SPT, in contrast to areas with less pollen exposure [149].
Art v 3 sensitization has been described not only as a potential epiphenomenon of Pru
p 3 sensitization without clinical relevance [150], but also as a major mugwort allergen
with the ability to act as a primary sensitizer [151]. The finding that all Spanish
hazelnut-allergic patients, with Cor a 8 (LTP) as major allergen [102], are also allergic
to Platanus acerifolia pollen [152], together with a previous description of the clinical
association between plane tree pollinosis and plant-derived food allergy (specially
hazelnut) [153], highlighted the potential role of plane tree pollen LTP as a primary
sensitizer through the inhalation route and a subsequent cross-reaction with Cor a 8.
Subsequently, the plane tree LTP was identified as Pla a 3 and defined as a major
allergen in patients with both plane-pollen and peach allergy [154].
In our group of patients, pollinosis was diagnosed in 75.6% of patients.
Interestingly, plane tree and mugwort were the most frequent pollens involved and both
were found associated with Pru p 3 sensitization, especially in the case of plane tree.
The low sequence identity of Pru p 3 with Par j 1 (28%) and Ole e 7 (19%) could
explain why sensitization to these pollens was lower in our cohort [110, 155]. With the
microarray, it was found that 69% of patients sensitized to plane tree were sensitized to
Pla a 2 and 15.6% to Pla a 1, confirming that there is a primary sensitization to plane-
tree pollen. This finding is consistent with a geographical area with high levels of this
pollen [153]. It is possible that plane-tree pollen may have a dual role in our cohort: as
a primary sensitizer or as a co-sensitizer that modulates the spectrum of LTP-
sensitization. Accordingly, it is interesting to note that all patients sensitized to Pla a 1
and/or Pla a 2 were also sensitized to Cor a 8. Given that in our geographical area,
mugwort pollen levels are not particularly relevant [156], and only 1 patient was
positive for Art v 1, considered a major mugwort allergen, we assume that mugwort
sensitization resulted from the cross-reactivity with other LTP-sensitizations rather than
being a primary sensitization or co-sensitization.
In conclusion, multiple plant-foods not taxonomically related besides peach are
involved in LTP-syndrome in our area, as whole allergenic plant-food extract and
molecular sensitization profile shows. Local symptoms (OAS, GID) should be
evaluated as a risk factor for anaphylaxis because they are frequently associated,
especially with cofactor-dependent anaphylaxis. Its association with pollinosis,
especially with plane tree, could be part of this syndrome in our area.

129
CHAPTER 6. CONCLUSIONS

CHAPTER 6. CONCLUSIONS
130

CHAPTER 6. CONCLUSIONS
131
CONCLUSIONS
From the first part of this thesis (paper in progress) we have been able to derive
four main conclusions:
1.- Tropomyosin (in particular), sarcoplasmic calcium-binding protein and myosin
light chain seem to be the relevant allergens associated with clinical reactivity
to shrimp, that could be good candidates to diagnostic tests for shrimp allergy,
since they can help predicting challenge outcome.
2.- Arginine kinase and hemocyanin seem to be important cross-reactive allergens
between shrimp, dust-mite and cockroach, although some arginine kinase
epitopes have been identified as clinically significant.
3.- Several IgE and IgG4 binding sites, have been identified between challenge
positive and negative subjects. These epitopes, especially epitope 7 of
tropomyosin, could be good candidates to be included in a panel of epitopes
to predict clinical reactivity.
4.- Shrimp allergic subjects show more diversity of peptide binding (IgE and IgG4)
than shrimp tolerant subjects.
From the second part of this project (paper submitted) we have been able to
derive six main conclusions about LTP-syndrome:
1.- A broad diversity of plant-foods are involved besides peach, including plant-
foods of the Rosaceae family and others taxonomically non-related.
2.- Clinical symptoms are largely diverse. Remarkably, there is a high
prevalence of gastrointestinal disorders, the oral allergy syndrome as an
isolated presentation is absent and a high frequency of cofactor-dependent
anaphylaxis exists.

CHAPTER 6. CONCLUSIONS
132
3.- Anaphylaxis as a single clinical manifestation of the LTP-syndrome is rare.
Usually, it is preceded by local symptoms that must be taken into
consideration as risk factors to develop anaphylaxis, especially if a cofactor
becomes involved.
4.- Association with pollens exists, with a broad spectrum of pollen and pollen-
allergen sensitization, especially that of the plane tree
5.- Component-resolved diagnostics, especially in the microarray format, is a
valuable tool for unmasking the diagnosis of LTP-syndrome in patients with
multiple sensitizations to plant-foods and/or pollens and a complex clinical
pattern, with diverse symptoms that resemble those triggered by plant-food
allergens other than LTP.
6.- The clinical observation that NSAIDs precipitate or exacerbate allergic
symptoms in certain patients with LTP allergy has been reproduced in vitro
with a basophil activation test model. L-ASA seems to affect somehow the
basophil IgE-mediated response. An increase of basophil degranulation is
observed when stimulation is performed with L-ASA and Pru p 3 compared
to Pru p 3 alone in these patients.

133
CHAPTER 7. REFERENCES

CHAPTER 7. REFERENCES
134

CHAPTER 7. REFERENCES
135135
REFERENCES
1. Wagner R. Clemens Von Pirquet, discoverer of the concept of allergy. Bull N Y Acad Med 1964;
40(3): 229-35.
2. Janeway CA Jr, Travers P, Walport M, Shlomchik M (eds). Immunobiology: the immune system in
health and disease. Garland Science 2005, 6th edition.
3. Ishizaka K, Ishizaka T. Identification of gamma-E-antibodies as a carrier of reaginic activity. J
Immunol 1967; 99:1187-1198.
4. Pichler WJ, Adam J, Daubner B, Gentinatta T, Keller M, Yerly D. Drug hypersensitivity reactions:
pathomechanism and clinical symptoms. Med Clin N America 2010; 94: 645-64.
5. Peláez A, Dávila I (eds). Tratado de alergología. Tomo I y II. Ergon, Madrid, 2007.
6. Adkinson NF, Busse WW, Bochner BS, Holgate ST, Simons ER, Lemanske RF (eds). Middleton's
Allergy: Principles and Practice, Elsevier 2009, 7th edition.
7. Bischoff SC. Role of mast cells in allergic and non-allergic immune responses: comparison of human
and murine data. Nat Rev Immunol 2007; 7:93-104.
8. Mukai K, Obata K, Tsujimura Y, Karasuyama H. New insights roles basophils. Allergologia
international 2009; 58: 11-9.
9. Sokol C, Medzhitov R. Role of basophils in the initiation of Th2 responses. Curr Opin Immunol 2010;
22:73-7.
10. Afferni C, Iacovacci P, Barletta B, Di Felice G, Tinghino R, Mari A et al. Role of carbohydrate
moieties in IgE binding to allergenic components of Cupressus arizonica pollen extract. Clin Exp
Allergy 1999; 29:1087-94.
11. Gould HJ and Sutton BJ. IgE in allergy and asthma today. Nat Rev Immunol 2008; 8:205-17.
12. Galli SJ. Complexity and redundancy in the pathogenesis of asthma: reassessing the roles of mast
cells and T cells. J Exp Med 1997; 186: 343-7.
13. Toru H, Pawankar R, Ra C, Yata J, Nakahata T. Human mast cells produce IL-13 by high-affinity
IgE receptor cross-linking: enhanced IL-13 production by IL-4-primed human mast cells. J Allergy
Clin Immunol 1998; 102: 491-502.
14. Kalesnikoff J, Galli SJ. Nipping cat allergy with fusion proteins. Nat Med 2005; 11:381-2.
15. Leung DM, Sampson HA, Geha R, Szefler SJ. Pediatric Allergy: Principles and Practice. Elsevier
2010, 2nd edition.

CHAPTER 7. REFERENCES
136136
16. Gilfillan AM, Tkaczyk C. Integrated signaling pathways for mast-cell activation. Nat Rev Immunol
2006; 6: 218-30.
17. Rivera J, Gilfillan AM. Molecular regulation of mast cell activation. J Allergy Clin Immunol. 2006;
117:1214-25.
18. Ebo DG, Sainte-Laudy J, Bridts CH, Mertens CH, Hagendorens MM, Schuerwegh AJ et al. Flow-
assisted allergy diagnosis: current applications and future perspectives. Allergy 2006; 61: 1028-39.
19. NIAID-Sponsored Expert Panel, Boyce JA, Assa'ad A, Burks AW, Jones SM, Sampson HA, Wood
RA et al. Guidelines for the diagnosis and management of food allergy in the United States: report
of the NIAID-sponsored expert panel. J Allergy Clin Immunol 2010; 126 (6 Suppl): S1-58.
20. Sicherer SH. Epidemiology of food allergy. J Allergy Clin Immunol 2011; 127: 594-602.
21. Kim JS, Sicherer SH. Living with food allergy: allergen avoidance. Pediatr Clin North Am 2011; 58:
459-70.
22. Rona RJ, Keil T, Summers C, Gislason D, Zuidmeer L, Sodergren E et al. The prevalence of food
allergy: a meta-analysis. J Allergy Clin Immunol 2007; 120: 638-46.
23. Sicherer SH, Sampson HA. Food Allergy. J Allergy Clin Immunol 2010; 125: S116-25.
24. Wood RA. The natural history of food allergy. Pediatrics 2003; 111:1631-7.
25. Pastorello EA, Stocchi L, Pravettoni V, Bigi A, Schilke ML, Incorvaia C et al. Role of the elimination
diet in adults with food allergy. J Allergy Clin Immunol 1989; 84: 475-83.
26. Nickel R, Kulig M, Forster J, Bergmann R, Bauer CP, Lau S et al. Sensitization to hen's egg at the
age of twelve months is predictive for allergic sensitization to common indoor and outdoor allergens
at the age of three years. J Allergy Clin Immunol 1997; 99: 613-7.
27. Breiteneder H, Ebner C. Molecular and biochemical classification of plant-derived food allergens. J
Allergy Clin Immunol 2000; 106: 27-36.
28. Chehade M, Mayer L. Oral tolerance and its relation to food hypersensitivities. J Allergy Clin
Immunol 2005; 115: 3-12.
29. Berin MC, Sicherer S. Food allergy: mechanisms and therapeutics. Curr Opin Immunol 2011 Sep
21. [Epub ahead of print].
30. Dunkin D, Berin MC, Mayer L. Allergic sensitization can be induced via multiple physiologic routes
in an adjuvant-dependent manner. J Allergy Clin Immunol 2011; 128: 1251-8.
31. Masilamani M, Wei J, Bhatt S, Paul M, Yakir S, Sampson HA. Soybean isoflavones regulate
dendritic cell function and suppress allergic sensitization to peanut. J Allergy Clin Immunol 2011;
128: 1242-50.

CHAPTER 7. REFERENCES
137137
32. Kim JS, Nowak-Węgrzyn A, Sicherer SH, Noone S, Moshier EL, Sampson HA. Dietary baked milk
accelerates the resolution of cow's milk allergy in children. J Allergy Clin Immunol 2011; 128: 125-
31.
33. Sampson HA, Muñoz-Furlong A, Campbell RL, Adkinson NF Jr, Bock SA, Branum A, et al. Second
symposium on the definition and management of anaphylaxis: summary report--Second National
Institute of Allergy and Infectious Disease/Food Allergy and Anaphylaxis Network symposium. J
Allergy Clin Immunol 2006; 117: 391-7.
34. Webb LM, Lieberman P. Anaphylaxis: a review of 601 cases. Ann Allergy Asthma Immunol 2006;
97: 39-43.
35. Sampson HA. Anaphylaxis and emergency treatment. Pediatrics. 2003; 111: 1601-8.
36. Järvinen KM. Food-induced anaphylaxis. Curr Opin Allergy Clin Immunol 2011; 11: 255-61.
37. Moneret-Vautrin DA, Latarche C. Drugs as risk factors of food anaphylaxis in adults: a case-control
study. Bull Acad Natl Med 2009; 193: 351-62.
38. Matsuo H, Morimoto K, Akaki T, Kaneko S, Kusatake K, Kuroda T et al. Exercise and aspirin
increase levels of circulating gliadin peptides in patients with wheat-dependent exercise-induced
anaphylaxis. Clin Exp Allergy 2005; 35: 461-6.
39. Aihara M, Miyazawa M, Osuna H, Tsubaki K, Ikebe T, Aihara Y et al. Food-dependent exercise-
induced anaphylaxis: influence of concurrent aspirin administration on skin testing and provocation.
Br J Dermatol 2002; 146: 466-72.
40. Suzuki Y, Ra C. Analysis of the mechanism for the development of allergic skin inflammation and
the application for its treatment: aspirin modulation of IgE-dependent mast cell activation: role of
aspirin-induced exacerbation of immediate allergy.J Pharmacol Sci 2009;110: 237-44.
41. Minai-Fleminger Y, Levi-Schaffer F. Mast cells and eosinophils: the two key effector cells in allergic
inflammation. Inflamm Res 2009; 58:631–38.
42. Lieberman JA and Sicherer SH. Diagnosis of Food Allergy: Epicutaneous Skin Tests, In Vitro
Tests, and Oral Food Challenge. Curr Allergy Asthma Rep 2011; 11(1): 58-64.
43. EAACI Subcommittee on Skin Tests. Allergen standardization and skin tests. Allergy 1993; 48:48-
82.
44. Sampson HA. Utility of food-specific IgE concentrations in predicting symptomatic food allergy. J
Allergy Clin Immunol 2001; 107: 891-6.

CHAPTER 7. REFERENCES
138138
45. Valenta R, Lidholm J, Niederberger V, Hayek B, Kraft D, Grönlund H. The recombinant allergen-
based concept of component-resolved diagnostics and immunotherapy (CRD and CRIT). Clin Exp
Allergy 1999; 29: 896-904.
46. Sastre J. Molecular diagnosis in allergy. Clin Exp Allergy 2010; 40: 1442-60.
47. Hauser M, Roulias A, Ferreira F, Egger M. Panallergens and their impact on the allergic patient.
Allergy Asthma Clin Immunol. 2010; 6: 1.
48. Stapel SO, Asero R, Ballmer-Weber BK, Knol EF, Strobel S, Vieths S et al. Testing for IgG4
against foods is not recommended as a diagnostic tool: EAACI Task Force Report. Allergy 2008;
63: 793-6.
49. Nowak-Węgrzyn A, Sampson HA. Future therapies for food allergies. J Allergy Clin Immunol 2011;
127: 558-73.
50. Ring J, Gutermuth J. 100 years of hyposensitization: history of allergen-specific immunotherapy
(ASIT). Allergy 2011; 66: 713-24.
51. Nowak-Wegrzyn A, Bloom KA, Sicherer SH, Shreffler WG, Noone S, Wanich N et al. Tolerance to
extensively heated milk in children with cow's milk allergy. J Allergy Clin Immunol 2008; 122: 342-7.
52. Lemon-Mulé H, Sampson HA, Sicherer SH, Shreffler WG, Noone S, Nowak-Wegrzyn A.
Immunologic changes in children with egg allergy ingesting extensively heated egg. J Allergy Clin
Immunol 2008; 122: 977-83.
53. Srivastava KD, Kattan JD, Zou ZM, Li JH, Zhang L, Wallenstein S et al. The Chinese herbal
medicine formula FAHF-2 completely blocks anaphylactic reactions in a murine model of peanut
allergy. J Allergy Clin Immunol 2005; 115: 171-8.
54. Valenta R, Steinberger P, Duchene M, Kraft D. Immunological and structural similarities among
allergens: Prerequisite for a specific and component-based therapy of allergy. Immunol Cell Biol
1996; 74:187–94.
55. Pokoj S, Lauer I, Fötisch K, Himly M, Mari A, Enrique E, Miguel-Moncin Mdel M, Lidholm J, Vieths
S, Scheurer S. Pichia pastoris is superior to E. coli for the production of recombinant allergenic
non-specific lipid-transfer proteins. Protein Expr Purif 2010; 69: 68-75.
56. Valenta R, Vrtala S, Laffer S, Spitzauer S, Kraft D. Recombinant allergens. Allergy 1998; 53: 552–
61.
57. Valenta R, Duchene M, Vrtala S et al. Recombinant allergens for immunoblot diagnosis of tree-
pollen allergy. J Allergy Clin Immunol 1991; 88: 889-94.

CHAPTER 7. REFERENCES
139139
58. Laffer S, Vrtala S, Ducheˆne M et al. IgE binding capacity of recombinant timothy grass (Phleum
pratense) pollen allergens. J Allergy Clin Immunol 1994; 94: 88-94.
59. Shreffler WG. Microarrayed recombinant allergens for diagnostic testing. J Allergy Clin Immunol
2011; 127: 843-9.
60. Salcedo G, Diaz-Perales A. Component-resolved diagnosis of allergy: more is better? Clin Exp
Allergy 2010; 40: 836-8.
61. Van Ree R, van Leeuwen WA, Dieges PH et al. Measurement of IgE antibodies against purified
grass pollen allergens (Lol p 1, 2, 3 and 5) during immunotherapy. Clin Exp Allergy 1997; 27: 68-
74.
62. Valenta R, Niederberger V. Recombinant allergens for immunotherapy. J Allergy Clin Immunol
2007; 119: 826-30.
63. Lin J and Sampson HA. The role of immunoglobulin E-binding epitopes in the characterization of
food allergy. Curr Opin Allergy Clin Immunol 2009; 9: 357-63.
64. Steckelbroeck S, Ballmer-Weber BK, Vieths S. Potential, pitfalls, and prospects of food allergy
diagnostics with recombinant allergens or synthetic sequential epitopes. J Allergy Clin Immunol
2008; 121: 1323-30.
65. Albrecht M, Kühne Y, Ballmer-Weber BK, Becker WM, Holzhauser T, Lauer I et al. Relevance of
IgE binding to short peptides for the allergenic activity of food allergens. J Allergy Clin Immunol
2009; 124: 328-36.
66. Shreffler WG, Beyer K, Chu THT, et al. Microarray immunoassay: association of clinical history, in
vitro IgE function, and heterogeneity of allergenic peanut epitopes. J Allergy Clin Immunol 2004;
113: 776-82.
67. Lin J, Bardina L, Shreffler WG, Andreae DA, Ge Y, Wang J et al. Development of a novel peptide
microarray for large-scale epitope mapping of food allergens. J Allergy Clin Immunol 2009;
124:315-22.
68. Flinterman AE, Knol EF, Lencer DA, Bardina L, den Hartog Jager CF, Lin J et al. Peanut epitopes
for IgE and IgG4 in peanut-sensitized children in relation to severity of peanut allergy. J Allergy Clin
Immunol 2008; 121 (3): 737-43.
69. Wang J, Lin J, Bardina L, Goldis M, Nowak-Wegrzyn A, Shreffler WG et al. Correlation of IgE/IgG4
milk epitopes and affinity of milk-specific IgE antibodies with different phenotypes of clinical milk
allergy. J Allergy Clin Immunol 2010; 125: 695-702.
70. Riemer A, Scheiner O, Jensen-Jarolim E. Allergen mimotopes. Methods 2004; 32:321–327.

CHAPTER 7. REFERENCES
140140
71. Untersmayr E, Szalai K, Riemer AB, Hemmer W, Swoboda I, Hantusch B et al. Mimotopes identify
conformational epitopes on parvalbumin, the major fish allergen. Mol Immunol 2006; 43:1454-61.
72. Pacios LF, Tordesillas L, Cuesta-Herranz J, Compes E, Sánchez-Monge R, Palacín A et al.
Mimotope mapping as a complementary strategy to define allergen IgE-epitopes: peach Pru p 3
allergen as a model. Mol Immunol 2008; 45: 2269-76.
73. Lopata AL, O'Hehir RE, Lehrer SB. Shellfish allergy. Clin Exp Allergy 2010; 40: 850-8.
74. Fernández Rivas M. Food Allergy in Alergológica-2005. J Investig Allergol Clin Immunol 2009; 19:
S2: 37-44.
75. Maulitz RM, Pratt DS, Schocket AL. Exercise-induced anaphylactic reaction to shellfish. J Allergy
Clin Immunol 1979; 63:433–4.
76. Clark S, Bock SA, Gaeta TJ, Brenner BE, Cydulka RK, Camargo CA et al. Multicenter study of
emergency department visits for food allergies. J Allergy Clin Immunol 2004; 113: 347-52.
77. Ross MP, Ferguson M, Street D, Klontz K, Schroeder T, Luccioli S. Analysis of food-allergic and
anaphylactic events in the National Electronic Injury Surveillance System. J Allergy Clin Immunol
2008; 121:166-71.
78. Clark S, Espinola J, Rudder SA, Banerji A, Camargo CA. Frequency of US emergency department
visits for food-related acute allergic reactions. J Allergy Clin Immunol 2011; 127: 682-3.
79. Ayuso R. Update on the diagnosis and treatment of shellfish allergy. Curr Allergy Asthma Rep
2011; 11: 309-16.
80. How to Read a Label for A Shellfish Free Diet. The Food Allergy & Anaphylaxis Network (FAAN),
2010. Available from: https://www.foodallergy.org/files/media/downloads/HTRLsheet2010.pdf
81. Shanti KN, Martin BM, Nagpal S, Metcalfe DD, Rao PV. Identification of tropomyosin as the major
shrimp allergen and characterization of its IgE-binding epitopes. J Immunol 1993; 151: 5354-63.
82. Yu CJ, Lin YF, Chiang BL, Chow LP. Proteomics and immunological analysis of a novel shrimp
allergen, pen m 2. J Immunol 2003; 170 (1): 445-53.
83. García-Orozco KD, Aispuro-Hernández E, Yepiz-Plascencia G, Calderón-de-la-Barca AM, Sotelo-
Mundo RR.Molecular characterization of arginine kinase, an allergen from the shrimp Litopenaeus
vannamei. Int Arch Allergy Immunol. 2007; 144: 23-8.
84. Ayuso R, Grishina G, Bardina L, Carrillo T, Blanco C, Ibañez MD et al. Myosin light chain is a novel
shrimp allergen, Lit v 3. J Allergy Clin Immunol 2008; 122 (4): 795–802.
CHAPTER 7. REFERENCES
141141
85. Ayuso R, Grishina G, Ibáñez MD, Blanco C, Carrillo T, Bencharitiwong R et al. Sarcoplasmic
calcium-binding protein is an EF-hand-type protein identified as a new shrimp allergen. J Allergy
Clin Immunol 2009; 124 (1): 114-20.
86. Ayuso R, Grishina G, Pascal M, Towle D, Smith C, S. Sanchez-Garcia et al. Poster presentation:
Hemocyanin, Troponin C and Fatty Acid-binding Protein (FABP) May be Cross-reactive Allergens
between Crustaceans, Cockroach and Dust Mites. AAAAI Meeting March 2011.
87. Reese G, Ayuso R, Lehrer SB. Tropomyosin: an invertebrate panallergen. Int Arch Allergy Immunol
1999; 119: 247-58.
88. Yang AC, Arruda LK, Santos AB, Barbosa MC, Chapman MD, Galvão CE et al. Measurement of
IgE antibodies to shrimp tropomyosin is superior to skin prick testing with commercial extract and
measurement of IgE to shrimp for predicting clinically relevant allergic reactions after shrimp
ingestion. J Allergy Clin Immunol 2010; 125: 872-8.
89. Bauermeister K, Wangorsch A, Garoffo LP, Reuter A, Conti A, Taylor SL et al. Generation of a
comprehensive panel of crustacean allergens from the North Sea Shrimp Crangon crangon. Mol
Immunol 2011; 48: 1983-92.
90. Ayuso R, Sánchez-Garcia S, Lin J, Fu Z, Ibáñez MD, Carrillo T et al. Greater epitope recognition of
shrimp allergens by children than by adults suggests that shrimp sensitization decreases with age.
J Allergy Clin Immunol 2010; 125: 1286-93.
91. Ayuso R, Sánchez-Garcia S, Pascal M, Lin J, Grishina G, Fu Z, Ibáñez MD et al. Is epitope
recognition of shrimp allergens useful to predict clinical reactivity? Clin Exp Allergy 2011 Dec 22.
(Epub ahead of print).
92. Eriksson NE, Formgren H, Svenonius E. Food hypersensitivity in patients with pollen allergy.
Allergy 1982; 37:437-43.
93. Ortolani C, Ispano M, Pastorello EA, Bigi A, Ansaloni R. The oral allergy syndrome. Ann Allergy
1988; 61: 47-52.
94. Cuesta Herranz J, Lázaro M, Figueredo E, Igea JM, Umpierrez A, de las Heras M. Allergy to plant
derived fresh foods in a birch and ragweed free area. Clin Exp Allergy 2000; 30:1411-6.
95. Ma S, Sicherer SH, Nowak-Wegrzyn A. A survey on the management of pollen-food allergy
syndrome in allergy practices. J Allergy Clin Immunol 2003; 112: 784-8.
96. Fernández-Rivas M, Benito C, González-Mancebo E, de Durana DA. Allergies to fruits and
vegetables. Pediatr Allergy Immunol 2008: 19: 675-81.

CHAPTER 7. REFERENCES
142142
97. Zuidmeer L, Goldhahn K, Rona RJ, Gislason D, Madsen C, Summers C et al. The prevalence of
plant food allergies: A systematic review. J Allergy Clin Immunol 2008; 121: 1210-8.
98. Radauer and Breiteneder. Pollen allergens are restricted to few proteins. J Allergy Clin Immunol
2006; 117: 141-7.
99. Radauer C, Breiteneder H. Evolutionary biology of plant food allergens. J Allergy Clin Immunol
2007; 120: 518-25.
100. Radauer C, Bublin M, Wagner S, Mari A, Breiteneder H. Allergens are distributed into few protein
families and possess a restricted number of biochemical functions. J Allergy Clin Immunol 2008;
121:847-52.
101. Fernandez-Rivas M, Bolhaar S, Gonzalez-Mancebo E, Asero R, van Leeuwen A, Bohle B, Ma Y
et al. Apple allergy across Europe: how allergen sensitization profiles determine the clinical
expression of allergies to plant foods. J Allergy Clin Immunol 2006; 118:481-88.
102. Hansen KS et al. Component-resolved in vitro diagnosis of hazelnut allergy in Europe. J Allergy
Clin Immunol 2009; 123: 1134-41.
103. Ballmer-Weber BK et al. Cherry allergy across Europe. J Allergy Clin Immunol 2002; 110: 167-73.
104. Andersen MB, Hall S, Dragsted LO: Identification of European Allergy Patterns to the Allergen
Families PR-10, LTP, and Profilin from Rosaceae Fruits. Clin Rev Allergy Immunol 2011; 41: 1-16.
105. Ebner C, Hirschwehr R, Bauer L, Breiteneder H, Valenta R, Ebner H, Kraft D, Scheiner O.
Identification of allergens in fruits and vegetables: IgE cross-reactivities with the important birch
pollen allergens Bet v 1 and Bet v 2 (birch profilin). J Allergy Clin Immunol 1995; 95: 962-69.
106. Asero R, Monsalve R, Barber D. Profilin sensitization detected in the office by skin prick test: a
study of prevalence and clinical relevance of profilin as a plant food allergen. Clin Exp All 2008; 38:
1033-7.
107. Fernández-Rivas M, van Ree R, Cuevas M. Allergy to Rosaceae fruits without related pollinosis. J
Allergy Clin Immunol 1997; 100: 728-33.
108. Fernández-Rivas M, González-Mancebo E, Rodríguez-Pérez R, Benito C, Sánchez-Monge R,
Salcedo G, Alonso MD et al. Clinically relevant peach allergy is related to peach lipid transfer
protein, Pru p 3, in the spanish population. J Allergy Clin Immunol 2003; 112: 789-95.
109. Pastorello EA, Robino AM. Clinical role of lipid transfer proteins in food allergy. Mol Nutr Food
Res 2004; 48: 356-62.
110. Salcedo G, Sanchez-Monge R, Diaz-Perales A. Plant non-specific lipid transfer proteins as food
and pollen allergens. Clin Exp Allergy 2004; 34: 1336-41.

CHAPTER 7. REFERENCES
143143
111. Breiteneder H, Mills C. Nonspecific lipid-transfer proteins in plant foods and pollens: an important
allergen class. Curr Opin Allergy Clin Immunol 2005; 5:275-9.
112. van Ree R. Clinical importance of non-specific lipid transfer proteins as food allergens. Biochem
Soc Trans 2002; 30: 910-3.
113. Zuidmeer L, Van Ree R. Lipid transfer protein allergy: primary food allergy or pollen/food
syndrome in some cases. Curr Opin Allergy Clin Immunol 2007; 7:269–73.
114. http://www.phadia.com/ (ImmunoCAP Specific-IgE/ImmunoCAP-ISAC-Technical-brochure.pdf)
115. http://www.abdserotec.com/support/an_introduction_to_elisa-1137.html
116. Palacin A, Varela J, Quirce S, del Pozo V, Tordesillas L, Barranco P et al. Recombinant lipid
transfer protein Tri a 14: a novel heat and proteolytic resistant tool for the diagnosis of baker’s
asthma. Clin Exp Allergy 2009; 39: 1267–76.
117. Coligan JE, Dunn BM, Speicher DW, Wingfield PT (eds) Current Protocols in Protein Science
2007. Chapter ps1001. John Wiley & Sons, New York.
118. Wikipedia – Western blot: http://en.wikipedia.org/wiki/western-blot
119. Berg JM, Tymoczko JL, Stryer L. Biochemistry. 2010. 7th ed. W.H. Freeman & Company.
120. Coligan JE, Dunn BM, Speicher DW, Wingfield PT (eds) Current Protocols in Protein Science
2007. John Wiley & Sons, New York.
121. Clontech_His·60 Ni Superflow Resin and gravity column user manual. Protocol # PT-5017-1
version # PR03521 (www.clontech.com).
122. Novagen pET System Manual. Version TB055, 11th Edition, 2006 (www.novagen.com).
123. Invitrogen website, www.invitrogen.com
124. Piercenet website, www.piercenet.com
125. Schleicher-schnell website, www.scleicher-schnell.com
126. Ji H and Wong WH. TileMap: create chromosomal map of tiling array hybridizations.
Bioinformatics 2005; 21: 3629-36.
127. Goldman L. Quantitative aspects of clinical reasoning. In: Principles of internal medicine. New
York: McGraw-Hill; 1987. p. 5-11.
128. Nicolaou N, Poorafshar M, Murray C, Simpson A, Winell H, Kerry G et al. Allergy or tolerance in
children sensitized to peanut: prevalence and differentiation using component-resolved diagnostics.
J Allergy Clin Immunol 2010,125:191–197.
129. Järvinen KM, Beyer K, Vila L, Chatchatee P, Busse PJ, Sampson HA. B-cell epitopes as a
screening instrument for persistent cow's milk allergy. J Allergy Clin Immunol 2002; 110: 293-7.

CHAPTER 7. REFERENCES
144144
130. Järvinen KM, Beyer K, Vila L, Bardina L, Mishoe M, Sampson HA. Specificity of IgE antibodies to
sequential epitopes of hen's egg ovomucoid as a marker for persistence of egg allergy. Allergy
2007; 62: 758-65.
131. Vrtala S. From allergen genes to new forms of allergy diagnosis and treatment. Allergy 2008; 63:
299-309.
132. Ayuso R, Reese G, Leong-Kee S, Plante M and Lehrer SB. Molecular basis of arthropod cross-
reactivity: IgE-binding cross-reactive epitopes of shrimp, house dust mite and cockroach
tropomyosins. Int Arch Allergy Immunol. 2002; 129: 38-48
133. Fernandes J, Reshef A, Patton L, Ayuso R, Reese G, Lehrer SB. Immunoglobulin E antibody
reactivity to the major shrimp allergen, tropomyosin, in unexposed Orthodox Jews. Clin Exp Allergy
2003;33:956-61.
134. Wang J, Calatroni A, Visness CM, Sampson HA. Correlation of specific IgE to shrimp with
cockroach and dust mite exposure and sensitization in an inner-city population. J Allergy Clin
Immunol 2011; 128: 834-7.
135. Santos AB, Rocha GM, Oliver C, Ferriani VP, Lima RC, Palma MS, et al. Crossreactive IgE
antibody responses to tropomyosins from Ascaris lumbricoides and cockroach. J Allergy Clin
Immunol 2008; 121: 1040-6.
136. Reese G, Schicktanz S, Lauer I, et al. Structural, immunological and functional properties of
natural recombinant Pen a 1, the major allergen of brown shrimp, Penaeus aztecus. Clin Exp
Allergy 2006; 36: 517-24.
137. Shreffler WG, Lencer DA, Bardina L, Sampson HA. IgE and IgG4 epitope mapping by microarray
immunoassay reveals the diversity of immune response to the peanut allergen, Ara h 2. J Allergy
Clin Immunol 2005; 116: 893-9.
138. Platts-Mills TA, Vaughan JW, Blumenthal K, Pollart Squillace S, Sporik RB. Serum IgG and IgG4
antibodies to Fel d 1 among children exposed to 20 microg Fel d 1 at home: relevance of a
nonallergic modified Th2 response. Int Arch Allergy Immunol 2001; 124: 126-9.
139. Hussain R, Poindexter RW, Ottesen EA. Control of allergic reactivity in human filariasis.
Predominant localization of blocking antibody to the IgG4 subclass. J Immunol 1992; 148: 2731-7.
140. Van Neerven RJ, Knol EF, Ejrnaes A, Wurtzen PA. IgE-mediated allergen presentation and
blocking antibodies: regulation of T-cell activation in allergy. Int Arch Allergy Immunol 2006; 141:
119-29.

CHAPTER 7. REFERENCES
145145
141. Rodrigues-Alves R, Lopez A, Pereira-Santos MC, Lopes-Silva S, Spínola-Santos A, Costa C et al.
Clinical, anamnestic and serological features of peach allergy in Portugal. Int Arch Allergy Immunol
2009; 149: 65-73.
142. Asero R, Antonicelli L, Arena A, Bommarito L, Caruso B, Crivellaro M et al. EpidemAAITO:
features of food allergy in Italian adults attending allergy clinics: a multicentre study. Clin Exp
Allergy 2009; 39: 547-55.
143. Asero R, Mistrello G, Roncarolo D, Amato S. Detection of some safe plant-derived foods for LTP-
allergic patients. Int Arch Allergy Immunol 2007; 144: 57-63.
144. Sánchez-Monge R, Lombardero M, García-Sellés FJ, Barber D, Salcedo G. Lipid-transfer proteins
are relevant allergens in fruit allergy. J Allergy Clin Immunol 1999; 103: 514-9.
145. Pastorello EA, Farioli L, Pravettoni V, Ortolani C, Ispano M, Monza M et al. The major allergen of
peach (Prunus persica) is a lipid transfer protein. J Allergy Clin Immunol 1999; 103: 520-6.
146. Lambert GP, Boylan M, Laventure JP, Bull A, Lanspa S. Effect of aspirin and ibuprofen on GI
permeability during exercise. Int J Sports Med 2007; 28: 722-6.
147. Asero R, Arena A, Cecchi L, Conte ME, Crivellaro M, Emiliani F et al. Are IgE levels to foods other
than rosaceae predictive of allergy in lipid transfer protein-hypersensitive patients? Int Arch Allergy
Immunol 2011; 155: 149-54.
148. Díaz-Perales A, Lombardero M, Sánchez-Monge R, García-Selles FJ, Pernas M, Fernández-
Rivas M et al. Lipid transfer proteins as potential plant panallergens: cross-reactivity among
proteins of Artemisia pollen, Castanea nut and Rosaceae fruits, with different IgE-binding
capacities. Clin Exp Allergy 2000; 30:1403-10.
149. García-Sellés FJ, Díaz-Perales A, Sánchez-Monge R, Alcántara M, Lombardero M, Barber D et
al. Patterns of reactivity to lipid transfer proteins of plant foods and Artemisia pollen: an in vivo
study. Int Arch Allergy Immunol 2002; 128: 115-22.
150. Pastorello EA, Pravettoni V, Farioli L, Rivolta F, Conti A, Ispano M et al. Hypersensitivity to
mugwort (Artemisia vulgaris) in patients with peach allergy is due to a common lipid transfer protein
allergen and is often without clinical expression. J Allergy Clin Immunol 2002; 110: 310-7.
151. Lombardero M, García-Sellés FJ, Polo F, Jimeno L, Chamorro MJ, García-Casado G et al.
Prevalence of sensitization to Artemisia allergens Art v 1, Art v 3 and Art v 60 kDa. Cross-reactivity
among Art v 3 and other relevant lipid-transfer protein allergens. Clin Exp Allergy 2004; 34:1415-21.

CHAPTER 7. REFERENCES
146146
152. Schocker F, Lüttkopf D, Scheurer S, Petersen A, Cisteró-Bahima A, Enrique E et al. Recombinant
lipid transfer protein Cor a 8 from hazelnut: a new tool for in vitro diagnosis of potentially severe
hazelnut allergy. J Allergy Clin Immunol 2004; 113: 141-7.
153. Enrique E, Cistero-Bahima A, Bartolome B, Alonso R, San Miguel-Moncin MM, Bartra J et al.
Platanus acerifolia pollinosis and food allergy. Allergy 2002; 57: 351-6.
154. Lauer I, Miguel-Moncin MS, Abel T, Foetisch K, Hartz C, Fortunato D et al. Identification of a
plane pollen lipid transfer protein (Pla a 3) and its immunological relation to the peach lipid-transfer
protein, Pru p 3. Clin Exp Allergy 2007; 37: 261-9.
155. Tordesillas L, Sirvent S, Díaz-Perales A, Villalba M, Cuesta-Herranz J, Rodríguez R et al. Plant
Lipid Transfer Protein Allergens: No Cross-Reactivity between Those from Foods and Olive and
Parietaria Pollen. Int Arch Allergy Immunol 2011; 156: 291-6.
156. Historical pollens and spores data of Barcelona – Point of Information on Aerobiology (PIA). From:
http://lap.uab.cat/aerobiologia/en/historical/barcelona

147
CHAPTER 8. SUMMARY IN CATALAN

148

CHAPTER 8. SUMMARY IN CATALAN
149
Reconeixement de proteïnes i epítops al·lergènics en al·lèrgia
alimentària: una nova perspectiva per la caracterització clínica i
molecular de l’al·lèrgia al marisc i a les proteïnes de
transferència de lípids.
1. INTRODUCCIÓ
La resposta al·lèrgica s’origina arrel del reconeixement d’un element innocu
com a estrany i/o nociu per part del sistema immunitari de l’individu. Les reaccions
al·lèrgiques es defineixen com a reaccions d’hipersensibilitat i en funció del
mecanisme implicat es classifiquen en tipus I-IV d’acord amb la classificació de Gell i
Coombs (Figura 1.1). L’al·lèrgia mitjançada per IgE és la més freqüent, i en
conseqüència la més estudiada, i es classifica com a reacció d’hipersensibilitat de
tipus I o immediata [2]. Els antígens en la resposta al·lèrgica reben el nom d’al·lèrgens
i es caracteritzen per desencadenar específicament respostes de tipus Th 2 que
portaran a la producció d’ IgE. Es desconeix quines són les característiques concretes
que confereixen a una molècula la seva capacitat al·lergènica [5]. Els al·lèrgens són
captats i processats per les cèl·lules dendrítiques i es produeix una diferenciació de les
cèl·lules Th0 a cèl·lules Th2, que gràcies al perfil de citocines secretat i altres factors
concomitants desencadenaran un canvi d’isotip en el limfòcit B, que començarà a
produir i secretar IgE (Figura 1.3) [2]. Aquesta immunoglobulina s’uneix principalment
al seu receptor d’alta afinitat (FcεRI, estat de sensibilització) que es troba a la
superfície dels mastòcits i els basòfils, cèl·lules claus en la resposta al·lèrgica (Figures
1.2 i 1.4). Quan l’organisme entra de nou en contacte amb l’al·lergen, aquest és
reconegut i captat per les IgE de la superfície dels mastòcits i basòfils. La unió de la
IgE al corresponent al·lergen suposa l’activació del receptor, que a través d’una
complexa cascada de senyalització provocarà l’activació de les cèl·lules (Figures 1.6 i
1.7). L’activació dels mastòcits suposa l’alliberació ràpida de mediadors pro-
inflamatoris preformats (e.g., histamina, leucotriens i prostaglandines) que es troben
continguts en grànuls dins del seu citoplasma, així com la producció de nous
mediadors en les hores que segueixen a l’activació cel·lular. Aquests mediadors són

CHAPTER 8. SUMMARY IN CATALAN
150
els responsables de l’aparició immediata de les manifestacions clíniques de l’al·lèrgia
(Figura 1.8). Breument, el resultat net del procés d’alliberació de mediadors inclou: en
primer lloc, una reacció al·lèrgica immediata (s’inicia en qüestió de segons),
principalment deguda a l’activitat de la histamina, prostaglandines i altres mediadors
preformats o sintetitzats ràpidament que causen un ràpid increment de la permeabilitat
vascular (extravasació plasmàtica, edema tissular) i la contracció del teixit muscular
llis. En segon lloc, després de 8-12 hores, es dóna un procés inflamatori més
sostingut, conegut com a resposta de fase tardana, que es produeix per la síntesi
induïda i posterior alliberació de més mediadors pro inflamatoris: prostaglandines,
leucotriens, quimiocines i citocines per part dels mastòcits activats. Aquesta fase
tardana implica el reclutament d’altres cèl·lules efectores, principalment limfòcits Th2,
eosinòfils i basòfils que contribueixen de forma significativa en la immunopatologia de
la resposta al·lèrgica. A més, es dóna una segona fase de contracció del múscul llis
per part de les cèl·lules T, amb inflamació persistent, edema sostingut i remodelació
tissular. La reacció de fase tardana i la seva seqüela a llarg termini, la inflamació
al·lèrgica crònica, contribueixen a una patologia crònica més seriosa, com per
exemple, l’asma crònic [6].
La simptomatologia de la reacció al·lèrgica és molt variada i depèn del tipus
d’al·lergen i de la seva via d’entrada a l’organisme, la qual condicionarà quins són els
mastòcits que s’activaran (mastòcits de teixit connectiu vascularitzat o mastòcits de
mucosa). Així doncs, l’activació dels mastòcits de forma generalitzada, amb una
alliberació sistèmica d’histamina i altres mediadors, o bé a nivell local, com per
exemple a nivell de mucosa respiratòria o digestiva, marcarà la simptomatologia que
presenti l’individu (e.g., mucosa digestiva: diarrea, vòmits, etc.; mucosa respiratòria:
broncoconstricció i dificultat respiratòria, rinitis, etc.; reaccions generalitzades: urticària
amb o sense angioedema i anafilaxis) [5,6].
Les proves diagnòstiques es basen en la detecció de IgE específica per un
determinat al·lergen (orientat en funció de la història clínica) a la superfície dels
mastòcits (proves cutànies o prick test), lliure en el sèrum (immunoassaig automatitzat
ImmunoCAP) o en la superfície dels basòfils (test d’activació dels basòfils). No
obstant, aquestes proves només ens indiquen sensibilització del pacient vers a un
determinat al·lergen però no ens informen de la seva reactivitat clínica. Així doncs, les
proves de provocació, especialment les realitzades a doble-cec i controlades per
placebo, són d’elecció per confirmar el diagnòstic de l’al·lèrgia, malgrat el seus

CHAPTER 8. SUMMARY IN CATALAN
151
inconvenients logístics i el risc de desencadenar reaccions severes en el pacient [6,
42].
Tradicionalment el diagnòstic de l’al·lèrgia i la immunoteràpia s’ha realitzat
utilitzant extractes complets d’aliments difícils d’estandarditzar i que contenen múltiples
molècules al·lergèniques i no al·lergèniques. Els extractes ens permeten identificar de
forma “grollera” una sensibilització vers a un determinat al·lergen que ens pot explicar
la simptomatologia clínica del pacient, però que no ens donen informació de la
naturalesa del principal agent responsable, ni ens permeten la previsió de reactivitats
creuades amb altres fonts al·lergèniques [5].
L’aplicació dels avenços de les últimes dècades en bioquímica i biologia
molecular al camp de l’al·lèrgia, han permès anar més enllà i poder caracteritzar a
nivell molecular les proteïnes responsables de la resposta al·lèrgica. Múltiples estudis
han permès adoptar el concepte que una font al·lergènica (per exemple en al·lèrgia
alimentària, l’aliment) ha de ser interpretada com una mescla de diferents
“components” al·lergènics (proteïnes) que a nivell individual poden tenir més o menys
rellevància clínica. Així el terme “component” es defineix com l’autèntic agent
responsable de la sensibilització i és la base del Diagnòstic Molecular o Diagnòstic
Basat en Components (Component-Resolved Diagnosis, CRD) que pretén detectar i
quantificar els nivells d’anticossos IgE específics per a un determinat component i no
per l’extracte complet, proporcionant no només un diagnòstic molt més acurat del
pacient al·lèrgic sinó també la possibilitat d’identificar els millors candidats per
propòsits terapèutics (disseny d’immunoteràpia al·lergen-específica) [45, 46].
Addicionalment, gràcies a l’aplicació de noves tecnologies com el microarray, s’ha
desenvolupat una nova tècnica pel mapatge d’epítops en els al·lèrgens a partir de
pèptids seqüencials sintètics que representen tota la seqüència de la proteïna
al·lergènica. L’estudi dels epítops B sembla obre noves perspectives pel diagnòstic i
tractament de l’al·lèrgia [63, 67].
L’al·lèrgia alimentària es defineix com a un “efecte de salut advers que es
desencadena arrel d’una resposta immunològica específica que es dóna de forma
reproduïble en l’exposició a un aliment” [19]. La nomenclatura actual proposa que
qualsevol reacció adversa a un aliment es defineixi com a hipersensibilitat alimentària,
si en el mecanisme intervé un procés immunològic parlem d’al·lèrgia alimentària, la
qual al seu torn pot ser classificada com a mitjançada per IgE (més freqüent i millor
caracteritzada) o no mitjançada per IgE (especialment descrites a nivell

CHAPTER 8. SUMMARY IN CATALAN
152
gastrointestinal) (Figura 1.9) [5]. Essencialment qualsevol aliment pot ser un al·lergen,
però els més freqüents són l’ou, la llet, el peix, el marisc i els aliments vegetals (els
fruits secs, fruites fresques i verdures) [23]. La sensibilització a proteïnes específiques
dels al·lèrgens alimentaris es pot donar a través de la via gastrointestinal (via oral) o
com a conseqüència d’una sensibilització al·lèrgica primària a un al·lergen inhalat. Així
doncs, es distingeixen dues classes d’al·lèrgia alimentària, en funció del mecanisme
immunològic implicat, la via de sensibilització i el patró d’al·lèrgens implicat [27]. En la
classe I, la sensibilització es produeix directament a través de la ingesta de l’aliment i
els al·lèrgens es caracteritzen per ser glicoproteïnes hidrosolubles molt estables,
resistents a la temperatura i a la digestió gàstrica amb capacitat de provocar reaccions
al·lèrgiques severes (e.g., proteïnes de la llet, l’ou, la parvalbúmina del peix, la
tropomiosina del marisc i les proteïnes de transferència de lípids dels aliments
vegetals, etc.). En canvi, en la classe II, la sensibilització es produeix secundària a una
sensibilització a un al·lergen inhalat (sensibilització primària) per reconeixement
d’epítops comuns entre al·lèrgens. Són al·lèrgens termolàbils i susceptibles a la
digestió gàstrica, es caracteritzen per provocar símptomes al·lèrgics restringits a la
cavitat oral (e.g., pastanaga, meló o poma crua i el bedoll) [27].
Tot i la gran exposició a proteïnes de la dieta, només un petit percentatge dels
individus desenvolupa una al·lèrgia alimentària. Això és gràcies a la tolerància oral que
desenvolupa el sistema immunitari vers a les proteïnes de la dieta (estat actiu
d’inhibició de les respostes immunològiques a determinats antígens a través de la
prèvia exposició a aquest mateix antigen per la via oral). No obstant això, en individus
susceptibles, el mecanisme de desenvolupament de la tolerància oral fallaria
desencadenant una resposta d’hipersensibilitat als antígens dels aliments ingerits [28].
Desafortunadament, no hi ha cap símptoma patognomònic de l’al·lèrgia
alimentària, ja que el pacient pot presentar una àmplia varietat de símptomes al·lèrgica
de severitat molt variable, des de molt lleus (o fins i tot imperceptibles com a patològics
per part del pacient) fins a la mort [5]. Breument, els símptomes que més s’han
associat a les reaccions al·lèrgiques mitjançades per IgE inclouen la pell, els tractes
respiratori i/o gastrointestinal, i/o el sistema cardiovascular. Les reaccions poden ser
generalitzades (urticària, angioedema, hipotensió, anafilaxis) o restringides a la pell
(vermellor, picor, urticaria aguda per contacte), al tracte respiratori (pruïja ocular i
llagrimeig, congestió nasal, edema de laringe, sibilàncies, rinoconjuntivitis i
broncospasme agut) i/o al tracte gastrointestinal (pruïja labial, lingual i palatal, inflor,
edema de laringe, vòmit, dolor abdominal, distensió abdominal i diarrea). Es desconeix

CHAPTER 8. SUMMARY IN CATALAN
153
perquè els aliments provoquen diferents símptomes en els individus i perquè la seva
severitat pot variar entre episodis [5, 6]. L’anafilaxis és una reacció sistèmica greu
d’inici ràpid, que pot comportar la mort, amb una incidència i prevalença en augment.
L’únic tractament disponible actualment és l’administració ràpida d’adrenalina a nivell
intramuscular [36]. S’han descrit factors concomitants o cofactors, com la presa
d’AINEs o l’exercici, que poden modular la severitat de la reacció al·lèrgica a un
aliment o fins i tot la poden desencadenar [37]. És a dir, en alguns individus els
al·lèrgens alimentaris o la ingesta d’un AINE per si sols no són capaços d’induir una
resposta al·lèrgica, però si l’exposició simultània a ambdós. Se sospita que l’AINE
“desbloqueja” algun mecanisme de control de la degranulació dels mastòcits i basòfils,
però són escassos els estudis que demostrin aquest efecte [38-41].
El diagnòstic de l’al·lèrgia alimentària es basa en una detallada història clínica
per identificar els aliments responsables, la severitat dels símptomes, la presència de
cofactors, etc.; la detecció de IgE específica (sensibilització) a través de les proves
cutànies o lliure en sèrum; i la prova de provocació oral, especialment realitzada a
doble cec i controlada per placebo, com a eina d’elecció per a confirmar la reactivitat
clínica del pacient [42]. Actualment, no hi ha tractament per l’al·lèrgia alimentària i la
dieta d’exclusió, amb totes les seves dificultats i limitacions, és la única intervenció
possible [49]. El diagnòstic molecular (tan amb el CRD com el mapatge d’epítops)
suposa un notable avenç com a eines pel diagnòstic i desenvolupament d’una teràpia
per l’al·lèrgia alimentària [42].
L’al·lèrgia al marisc és l’al·lèrgia alimentària més comuna en adults a Espanya
després dels aliments vegetals [74]. El patró de símptomes és molt variat, des de lleus
(Síndrome d’Al·lèrgia Oral (SAO) i urticaria), fins a més greus i amb compromís vital
(anafilaxis). La majoria d’espècies de marisc que provoquen reaccions al·lèrgiques són
crustacis, essent la gamba la més freqüent [73]. La tropomiosina es considera la
principal proteïna al·lergènica de la gamba [81], no obstant això en els darrers anys
altres al·lèrgens han estat caracteritzats (arginina-quinasa [82-83], cadena lleugera de
miosina [84] i proteïna sarcoplàsmica [85]) i altres s’han apuntat com a potencialment
rellevants en el diagnòstic i terapèutica de l’al·lèrgia alimentària al marisc
(hemocianina, proteïna d’unió a àcids grassos i troponina C [86]). La tropomiosina és
el principal panal·lergen del món animal i la sensibilització a aquesta proteïna és la
responsable dels fenòmens de reactivitat creuada entre marisc i altres artròpodes
(àcars), paràsits nematodes (anisakis) i mol·luscs [79]. Pocs estudis s’han dedicat a

CHAPTER 8. SUMMARY IN CATALAN
154
estudiar la rellevància clínica de la sensibilització als diversos al·lèrgens del marisc
[88, 89]. L’ús d’al·lèrgens recombinants es considera en aquests moments fonamental
pel desenvolupament de noves aproximacions diagnòstiques i estratègies pel disseny
d’una immunoteràpia al·lergen específica [79].
Les reaccions al·lèrgiques a aliments vegetals són l’al·lèrgia alimentària més
freqüent en adults a Espanya i a tota a l’àrea mediterrània, amb especial rellevància
del préssec [74, 108]. El component al·lergènic majoritari d’aquest fruit és el Pru p 3,
una proteïna de transferència de lípids, de l’anglès Lipid Transfer Protein, LTP [144].
Les LTPs s’han detectat com a proteïnes al·lergèniques en un elevat nombre
d’aliments vegetals, particularment de la família Rosaceae, però també en altres
famílies no taxonòmicament relacionades, pòl·lens i làtex. La distribució ubiqua de les
LTP en el regne vegetal és probablement la responsable de l’elevat nombre de
reactivitats creuades descrites entre diferents aliments vegetals i pòl·lens [110]. La
sensibilització a múltiples aliments és un tret molt comú en els pacients al·lèrgics a les
LTP, els quals poden desenvolupar una àmplia diversitat de símptomes amb múltiples
aliments vegetals de famílies no necessàriament relacionades, de forma que
generalment se’ls diagnostica amb l’anomenat “Síndrome LTP” [113]. Els pacients
poden patir símptomes lleus a nivell d’orofaringe, típics del Síndrome d’Al·lèrgia Oral
(SAO) generalment causat per una sensibilització a al·lèrgens com les profil·lines o les
proteïnes PR-10, o bé reaccions sistèmiques severes, com l’anafilaxis, que fins i tot
poden comprometre la vida del pacient, tradicionalment associades a la sensibilització
a LTPs o a taumatines entre altres [109]. El fet que la sensibilització a les LTPs pugui
presentar-se clínicament d’una forma tant diversa que podria ser associada a diferents
al·lèrgens fa que siguin necessàries eines diagnòstiques acurades per determinar
exactament a nivell molecular la proteïna responsable de la sensibilització.

CHAPTER 8. SUMMARY IN CATALAN
155
2. HIPÒTESI I OBJECTIUS 2.1. Hipòtesi Tot el que s’ha descrit anteriorment anima a utilitzar panels de molècules
al·lergèniques (components) i pèptids sintètics seqüencials per realitzar un anàlisi
molecular elaborat dels patrons de sensibilització dels pacients amb al·lèrgia
alimentària. La hipòtesi d’aquesta tesi és que el diagnòstic basat en components i el
mapatge d’epítops poden millorar la caracterització clínica i molecular de l’al·lèrgia al
marisc i del síndrome LTP.
2.2. Objectius
Per tant, l’objectiu global d’aquesta tesi és la caracterització clínica i molecular de
l’al·lèrgia al marisc i del síndrome LTP aplicant el diagnòstic basat en components i el
mapatge d’epítops.
Objectius específics:
Part 1. Diagnòstic basat en components i reconeixement d’epítops en l’al·lèrgia al
marisc
1. Determinar perfils de sensibilització a al·lèrgens del marisc que resultin en
reactivitat clínica.
Part 2. Síndrome LTP: patró clínic i perfil de sensibilització molecular d’aliments
vegetals i pòl·lens
1. Caracteritzar clínicament el síndrome LTP en els pacients de la nostra àrea.
2. Determinar la utilitat del diagnòstic basat en components en el format de
microarray com a eina pel diagnòstic de pacients amb al·lèrgia a múltiples
aliments vegetals que presenten una àmplia diversitat de símptomes clínics
que no revelen un patró particular de sensibilització

CHAPTER 8. SUMMARY IN CATALAN
156
3. MATERIAL I MÈTODES
3.1. Diagnòstic basat en components i reconeixement d’epítops en l’al·lèrgia al marisc
Un total de 86 pacients van ser inclosos en el present estudi. El criteri d’inclusió
dels pacients va ser un test positiu a extracte de gamba (IgE específica per
ImmunoCAP (Phadia) >0.35 kUA/L i/o prova cutània positiva (Skin Prick Test, SPT)).
Els pacients van ser dividits en dos grups en funció de si referien història de reacció
al·lèrgica posterior a la ingesta de gamba, i a continuació varen ser sotmesos a una
provocació a doble-cec amb gamba (sigles en anglès: DBPCFC) per tal d’avaluar la
seva reactivitat clínica. En funció del resultat de la provocació (positiva o negativa)
varen ser classificats (Grup 1, 2a, 2b; Figura 4.1.). Una elevada proporció dels
pacients sensibilitzats a la gamba, ho estan també als àcars i/o l’escarabat, per tant es
va incloure també un grup control d’individus al·lèrgics als àcars i/o escarabat però no
sensibilitzats a la gamba (Grup Control 1, n=12). També es va incloure un grup
d’individus sans no atòpics com a controls negatius (Grup Control 2, n=5).
Deu proteïnes al·lergèniques recombinants de crustacis varen ser purificades a
partir de clons de cDNA expressats en E. coli (tropomiosina (TM), cadena lleugera de
miosina (Myosin Light Chain, MLC), arginina-quinasa (AK), proteïna sarcoplàsmica
d’unió de calci (Sarcoplasmic calcium-binding protein, SCP)-alfa i -beta, troponina C
(TpC, 3 isoformes diferents: A2, B5 i C10), hemocianina (Hemo) i proteïna d’unió a
àcids grassos (Fatty-Acid Binding Protein, FABP). Per tal d’avaluar la reactivitat IgE
dels individus inclosos en l’estudi per cada un dels al·lèrgens recombinants, aquests
es van imprimir sobre un suport de nitrocel·lulosa utilitzant la tècnica de Dot-Blot
(Figures 3.10 i 3.11). Addicionalment, sobre un subgrup dels pacients de l’estudi, es va
fer un estudi dels llocs d’unió/epítops IgE i IgG4 utilitzant un microarray amb pèptids
sintètics solapats de 5 dels al·lèrgens de la gamba estudiats (TM, SCP, MLC, AK i TpC
(Figura 3.12).
Les variables quantitatives es van descriure amb medianes, rang i rang
interquartil, i les variables qualitatives com a freqüències absolutes en percentatge,
utilitzant el software estadístic GraphPad Prism™ version 4.0c for Macintosh
(GraphPad Software, Inc. ®, La Jolla, CA, USA). L’anàlisi de les diferències en els
nivells IgE entre grups es van analitzar amb el test no paramètric de Kruskal-Wallis. El
test de probabilitat de Fisher es va aplicar per analitzar les diferències de

CHAPTER 8. SUMMARY IN CATALAN
157
reconeixement IgE dels al·lèrgens recombinants i els epítops. L’anàlisi de les dades
del microarray de pèptids es va fer utilitzant l’eina TileMap. Les propietats de les
proteïnes recombinants i els epítops com a tests diagnòstics es van avaluar amb els
paràmetres de sensibilitat, especificitat, valor predictiu positiu, valor predictiu negatiu i
l’eficiència. Els test t no paramètric de Mann Whitney es va utilitzar per la comparació
del nombre de pèptids units per IgE, IgG4 i ambdós. Tots els tests aplicats eren de
doble cua.
3.2. Síndrome LTP: patró clínic i perfil de sensibilització molecular
d’aliments vegetals i pòl·lens
Quaranta-cinc pacients diagnosticats d’al·lèrgia alimentària a múltiples aliments
vegetals (involucrant una diversitat significativa de fruites, fruits secs i altres vegetals
taxonòmicament relacionats i no relacionats) van ser inclosos en el present estudi per
la Unitat d’Al·lèrgia del Servei de Pneumologia i Al·lèrgia de l‘Hospital Clínic, després
d’obtenir el seu consentiment informat. Tots ells van ser sotmesos a SPT amb
extractes comercials dels aliments d’origen vegetal comuns (blat de moro, pell de
préssec, avellana, mostassa, enciam, kiwi i llentia) i dels pòl·lens al·lergènics comuns
(gramínies, artemísia, parietària, olivera, xiprer i plataner), que són testats de forma
rutinària en l’estudi de l’al·lèrgia alimentària a la unitat. A partir de la història clínica, es
van recollir els nivells sèrics de IgE total i específica a préssec (extracte complet), i als
components: Pru p 3, Pru p 1 i Pru p 4 (LTP, PR-10 i profil·lina del préssec,
respectivament) realitzats per ImmunoCAP™ (Phadia®). A tots els individus es va
realitzar una detecció de IgE específica front a un panell de 103 components
al·lergènics, utilitzant l’immunoassaig comercial en suport de microarray, ImmunoCAP
ISAC™ (Phadia®).
Vint-i-quatre pacients amb diagnòstic d’al·lèrgia alimentària al préssec (segons
història clínica i SPT i/o IgE específica a Pru p 3 en sèrum positius) que presentaven
exacerbació clínica amb la ingesta d’AINE van ser seleccionats per aquest estudi
(Grup A). Set pacients també al·lèrgics a préssec, però sense exacerbació clínica amb
AINE (Grup B) i 5 individus sans no al·lèrgics (Grup C) també varen ser inclosos. Tots
els pacients reclutats eren tolerants als AINEs. A tots ells se’ls va realitzar un Test
d’Activació de Basòfils (TAB) a partir de sang fresca utilitzant el kit Flow2CASTTM kit,
seguint el protocol del fabricant (Bühlmann®, Schönenbuch, Switzerland). La resposta
basofílica va ser avaluada a través de l’expressió del marcador d’activació de basòfils

CHAPTER 8. SUMMARY IN CATALAN
158
CD63 per citometria de flux. L’estimulació es va realitzar amb Pru p 3 i L-ASA a
diferents concentracions (3mM,1mM, 0,3mM i 0,1mM).
Les variables quantitatives es van descriure amb medianes, rang, rang
interquartil, utilitzant el software estadístic GraphPad PrismTM version 4.0c for
Macintosh (GraphPad Software, Inc. ®, La Jolla, CA, USA). L’estimació de la proporció
de tests positius a pòl·lens en un individu es va analitzar utilitzant models de regressió
logística. Es va considerar un Error de Tipus I de 0.05. Pel test d’activació de basòfils,
les dades es van analitzar amb el test de Wilcoxon per dades aparellades.
4. RESULTATS
4.1. Diagnòstic basat en components i reconeixement d’epítops en l’al·lèrgia al marisc
4.1.1. Perfil de l’estudi: caracterització dels pacients
Un total de 86 individus amb test positiu a la gamba van ser inclosos a l’estudi.
Setanta-quatre (86%) van referir història de reaccions al·lèrgiques immediates al
marisc després de la ingesta de la gamba i 12 (14%) no ho van fer. D’aquests 74, 58
(78%) van tenir una reacció en ser provocats amb la gamba a doble cec (Grup 1) i 16
(22%) no van reaccionar (Grup 2a). Els 12 (14%) individus amb un test a la gamba
positiu però sense història de reaccions al·lèrgiques amb la gamba, també varen ser
provocats i en tots els casos el resultat va ser negatiu (Grup 2b). Tots els resultats
negatius a la provocació a doble cec varen ser confirmats amb una provocació oral
oberta, que també va ser negativa. Dotze individus sensibilitzats als àcars i/o
l’escarabat sense sensibilització a gamba ni història de reaccions al·lèrgiques a la
gamba també van ser seleccionats per l’estudi i provocats, amb resultat negatiu en tots
els casos (Grup Control 1). Es van incloure cinc individus no-atòpics (Grup Control
2). El perfil de l’estudi es mostra a la Figura 4.1.
Gènere, edat, freqüència de sensibilització a l’àcar (Dermatophagoides
pteronyssinus, DP) i l’escarabat, nivells de IgE específica d’aquests al·lèrgens, així
com la història de reaccions al·lèrgiques a la gamba i el resultat de la provocació es
resumeixen a la Taula 4.1. A la Taula 4.3 es troba una descripció detallada dels
pacients.

CHAPTER 8. SUMMARY IN CATALAN
159
Amb la comparació de les medianes dels nivells específics de IgE per a cada
al·lergen es van mostrar diferencies estadísticament significatives (Taula 4.2). Pel que
fa als nivells de IgE específica de la gamba, el grup 1 va presentar nivells més elevats
que la resta de grups, mentre que les diferències entre els grups amb provació
negativa no van ser significatives. La freqüència de sensibilització a DP fou elevada en
tots els grups (93,8-100%), i els nivells de IgE específica similars. La freqüència de
sensibilització a l’escarabat fou variable entre els grups i els nivells de IgE específica i
les diferències entre grup 1, el 2b i el C1 foren estadísticament significatives.
Remarcablement, 2a i 2b no van diferir de C1 en termes de nivells específics de IgE.
4.1.2. Reconeixement IgE dels al·lèrgens recombinants
Les freqüències de la reactivitat IgE per cada al·lergen recombinant per grup es
mostren a la Figura 4.2 i Taula 4.4. Es va observar un perfil de reconeixement diferent
entre els grups. Els individus del grup 1 mostraren una major diversitat d’al·lèrgens
reconeguts (mediana [rang] pel nombre d’al·lèrgens reconeguts per cada grup i els
valors de p corresponen a la comparació de la mediana del grup 1 amb cada un dels
grups restants; grup 1, 3[0-9]; grup 2a, 1,5 [0-5], p<0,05; grup 2b, 2[0-3], no significatiu;
grup control 1: 1.5 [0-2], p<0,01). Les diferències estadísticament significatives entre
grups es mostren a la Taula 4.4.
Alguns individus no van reconèixer cap de les proteïnes recombinants per dot
blot (3/58 (5.2%) grup 1; 5/16 (31,3%) grup 2a; 2/12 (16,7%) grup 2b i 4/12 (33,3%)
grup control 1). No obstant, alguns d’ells van mostrar reconeixement de proteïnes en
extractes complets de gamba crua i bullida per la tècnica de Western blot. Cap dels
individus no atòpics (Grup Control 2) va reconèixer cap proteïna recombinant ni cap
proteïna dels extractes complets.
4.1.3. Diagnòstic basat en components
4.1.3.1. Al·lèrgens que poden ajudar a diferenciar el resultat de la
provocació oral
El reconeixement IgE dels al·lèrgens recombinants SCP-alfa, SCP-beta i TM va
ser més freqüent en el grup 1 que en els individus sensibilitzats a la gamba però amb
prova de provocació negativa (2a i 2b) (diferència estadísticament significativa). Si es

CHAPTER 8. SUMMARY IN CATALAN
160
consideren junts els grups 2a, 2b i C1 per la seva condició de tolerància a la gamba,
s’observa que la diferència en freqüència de reconeixement IgE de la proteïna MLC
també és estadísticament significativa (Taula 4.4).
Si els grups 2a i 2b es consideren per separat i es comparen amb el grup 1
també s’observen diferències estadísticament significatives. Els grups 2a i 2b només
difereixen de forma estadísticament significativa en el reconeixement de l’Hemo (Taula
4.4).
4.1.3.2. L’arginina quinasa i l’hemocianina com a al·lèrgens de reactivitat
creuada
En el cas que els individus del grup control 1 reconeguessin algun al·lergen/s
recombinant, aquests van ser exclusivament l’Hemo i/o l’AK (6/8 (75%) ambdues
proteïnes). Tots els pacients amb provocació negativa junts (2a i 2b) no van mostrar
cap diferència estadísticament significativa amb el grup control 1 pel que fa al
reconeixement IgE dels al·lèrgens. Considerats per separat, el grup 2b no va presentar
cap diferència estadísticament significativa amb el grup control, mentre que en cas de
2a es van observar diferències amb la TM (p=0,0237) i una tendència per l’Hemo
(p=0,0497) (Taula 4.4).
4.1.3.3. Diferències menors entre població pediàtrica i adulta
En el grup 1, l’única diferència estadísticament significativa entre el perfil de
reconeixement IgE dels nens (n=33) i els adults (n=25) va ser una major freqüència de
reconeixement de la SCP-beta en nens (p=0,0128). El mateix anàlisis sobre tots els
individus amb provocació negativa (grups 2a, 2b i C1, 10 nens/ 30 adults) no va
mostrar cap diferència estadísticament significativa.
4.1.4. Propietats dels al·lèrgens recombinants com a tests
diagnòstics
Les propietats dels al·lèrgens recombinants i del l’extracte complet de gamba
com a tests diagnòstics es van descriure utilitzant sensibilitat, especificitat, valor
predictiu positiu (PPV), valor predictiu negatiu (NPV) i eficiència. Els resultats es
mostren a la Taula 4.5. Només els al·lèrgens que mostren diferències de
CHAPTER 8. SUMMARY IN CATALAN
161
reconeixement IgE estadísticament significatives entre individus de provocació positiva
i negativa (valor p test de Fisher < 0,05: SCP-alfa, -beta, TM, MLC i extracte complet
de gamba) poden ser considerats com a candidats per un test diagnòstic capaç de
diferenciar el resultat d’una provocació.
La TM va mostrar valors elevats pels 5 paràmetres, mentre que les SCPs van
mostrar valors molt elevats per especificitat (~ 95%) i PPV (97.5%), però baixos per
sensibilitat (29-35%) i NPV (~ 50%). De forma similar, per la MLC es van observar
valors alts de especificitat (87.5%) i PPV (81.5%), però baixos de sensibilitat (38%) i
NPV (49%). L’extracte complet de gamba va ser el més sensible (98%) i amb el valor
de NPV més alt (95%), però amb la especificitat més baixa (49%) i PPV (74%).
L’eficiència del les SCPs i la MLC fou entorn del 60%, menor que l’extracte de gamba
(78%) i la TM (87%).
4.1.5. Mapatge d’epítops: llocs d’unió IgE i IgG4
El reconeixement IgE i IgG4 d’un subgrup dels individus inclosos a l’estudi
(grup 1, n=21; grup 2a, n=16, grup 2b, n=12) es va analitzar sobre un panel de pèptids
sintètics solapats que representen tota la seqüència de cinc al·lèrgens de la gamba
(TM, SCP, AK, MLC i TpC) per la tècnica de microarray (Figures 4.3 i 4.4)
4.1.6. Llocs d’unió diferencials entre grups
L’eina d’anàlisi TileMap es va utilitzar per identificar els llocs d’unió IgE i IgG4
amb diferències estadísticament significatives entre grups (1 versus 2(2a+2b), 1
versus 2a, 1 versus 2b, i 2b versus 2a). La Figura 4.5 i la Taula 4.6 resumeixen els
resultats de la comparació.
Breument, s’observa que els llocs d’unió IgE i IgG4 coincideixen de forma
notable al llarg de la seqüència de les proteïnes. Es van observar diferències menors
entre 2b i 2a; per aquest motiu, els individus amb provocació negativa es van agrupar
(grup 2 =2a+2b) per comparar els resultats amb el grup 1 i per posteriors anàlisis. Per
IgE, el nombre més elevat de llocs d’unió diferencials per IgE va ser en el cas de la
TM, mentre que per IgG4, això mateix es va observar per AK. En el cas de la SCP, les
diferències es van observar bàsicament per la IgG4. Pràcticament no es va observar
cap diferència per la TpC.

CHAPTER 8. SUMMARY IN CATALAN
162
4.1.7. Diversitat de pèptids units per IgE i IgG4 El nombre de pèptids units per IgE, IgG4 o ambdós per cada al·lergen fou
comparat entre grups (al·lèrgics (1) versus tolerants (2=2a+2b)) (Taula 4.7). La IgE en
el grup 1 va unir més pèptids que el grup 2 per tots 5 al·lèrgens. El mateix es va
observar pels pèptids units per IgE i IgG4. Per IgG4, la diferència en diversitat d’unió
només va ser estadísticament significativa per la TM, MLC i AK.
En cap dels grups no es va observar cap correlació entre el reconeixement IgE
i IgG4 (Figura 4.6).
4.1.8. Comparació dels resultats actuals amb estudis previs
El llocs d’unió IgE identificats en el present estudi es van comparar amb els
epítops descrits anteriorment [90] i amb els epítops definits com a clínicament
rellevants en una publicació recent del nostre grup [91] (Taula 4.8). L’estudi de la IgG4
no s’havia realitzat anteriorment.
Pràcticament tots els llocs d’unió identificats en el present estudi es
corresponen amb epítops descrits anteriorment, només per l’AK i la SCP, alguns llocs
identificats no corresponen a cap epítop ja descrit.
Un estudi recent del nostre grup va identificar alguns epítops com a clínicament
rellevants (per AK, epítops 6 7; per MLC, epítops 1, 2, 4a, 4b, 5; per SCP, epítop 1; per
TM, epítops 1, 2, 5a, 5b, 5c i 7), realitzant el mateix tipus d’anàlisi TileMap però amb
una mostra més reduïda de pacients, sobretot el grup de provocació negativa o
tolerants (al·lèrgics, n=15; tolerants, n=11). Els epítops/ llocs d’unió amb diferències
estadísticament significatives entre grups en el present estudi es mostren a la Taula
4.8. Les coincidències amb la publicació pilot anterior del nostre grup (Ayuso R et al.
CEA 2011 [91]) es marquen amb asteriscs a la taula.
4.1.9. Propietats dels epítops com a tests diagnòstics
Les freqüències de reconeixement IgE per cada epítop/lloc d’unió per grup i les
propietats dels epítops com a tests diagnòstics (sensibilitat, especificitat, valor predictiu
positiu (PPV), valor predictiu negatiu (NPV) i eficiència) es mostren a la Taula 4.9.
L’anàlisi estadístic de les freqüències de reconeixement IgE de cada grup per als
epítops individuals va mostrar que els individus amb provocació positiva reconeixen de
CHAPTER 8. SUMMARY IN CATALAN
163
forma més freqüent tots els epítops que els de provocació negativa, a excepció de
l’epítop 2 de la MLC (p=0,146) (Taula 4.9). Per tant, aquest epítop va ser exclòs de
l’anàlisi de les propietats dels epítops com a tests diagnòstics.
Els epítops de TM van mostrar una alta especificitat (>90%, epítops 1, 5a, 5b i
6, >75%, epítops 3 i 7). L’epítop n de la SCP també va mostrar una especificitat molt
alta, però per la resta dels epítops el valor d’aquest paràmetre va oscil·lar entre el 57 i
el 71%. De forma similar, els valors més elevats de PPV es van trobar per la TM i la
SCP (>90%, epítops 1 i 5b de TM; >75%, epítops 3, 5a, 5b, 6 i 7 per TM i epítop n per
SCP). La sensibilitat fou molt variable entre els epítops de la TM, mentre que l’epítop 7
va mostrar el valor més elevat de tots, la resta presentaren valors entre 38 i 71%. De
forma similar, la sensibilitat per l’epítop 7 de l’AK va ser del 81%, però pels altres 2
epítops del mateix al·lergen, els valors foren inferiors. L’epítop n de la SCP va mostrar
el valor més baix de sensibilitat (33%). En paral·lel, el valor més elevat de NPV es va
observar per alguns epítops de TM (76-88%) i l’epítop 7 de l’AK (80%). Es va observar
que els epítops de TM tenen valors d’eficiència més elevats (76-82%) que els epítops
de la resta d’al·lèrgens (63-69%). L’epítop 7 de la TM fou l’únic amb valors elevats pels
5 paràmetres.
4.2. Síndrome LTP: patró clínic i perfil de sensibilització molecular d’aliments vegetals i pòl·lens
4.2.1. Demografia i aliments vegetals responsables
Els 45 pacients seleccionats per a l’estudi eren majoritàriament adults (mediana
[rang]: 33 [14-47] anys), 28 dones (62,2%), tots prèviament diagnosticats d’al·lèrgia
alimentària a múltiples aliments vegetals per sensibilització a LTP. Els aliments
responsables de les reaccions (recollits en la història clínica i amb sensibilització
confirmada) eren fruites fresques, vegetals i fruits secs, relacionats o no
taxonòmicament (nombre d’aliments vegetals causants de reacció en cada individu,
mediana [rang]: 4 [2-18]). En alguns casos, un mateix aliment va ser referit com a
responsable de reaccions de variable severitat en diferents episodis (només les
reaccions més severes es descriuen a la Taula 4.10).

CHAPTER 8. SUMMARY IN CATALAN
164
4.2.2. Símptomes clínics
La revisió de les històries clíniques dels pacients va mostrar un patró de
simptomatologia molt heterogeni (Síndrome d’al·lèrgia oral (SAO) (34/45, 75,6%),
urticaria (30/45, 66,7%), urticària de contacte (5/45, 11.1%), trastorns gastrointestinals
(25/45, 55,6%) i anafilaxis (34/45, 75,6%). La majoria dels pacients van reportar
múltiples símptomes en funció de l’aliment implicat. En el nostre grup de pacients no
es van detectar episodis aïllats de SAO. Només un pacient va patir episodis repetits
d’anafilaxi amb diferents elements vegetals implicats. Alguns pacients van referir
episodis aguts d’urticària, trastorns gastrointestinals o anafilaxis suggestiva d’al·lèrgia
alimentària però no van ser capaços d’identificar l’aliment responsable (Taules 4.10 i
4.11).
4.2.3. Efecte cofactor
Dels 34 pacients amb anafilaxis, 17 (50%) no varen descriure un cofactor
(AINE i/o exercici) implicat en la reacció, 6 (17,7%) varen patir l’anafilaxis amb i sense
cofactor, i 11 (32,4%) només en presència del cofactor. En aquests pacients, la
presència del cofactor va representar una exacerbació dels símptomes, des de SAO
i/o trastorns gastrointestinals a anafilaxis (Taula 4.11). En l’anafilaxi depenent de
cofactor fou molt difícil identificar l’aliment responsable a través de la història clínica
(Taula 4.10).
4.2.4. Sensibilització a aliments vegetals
Els pacients van mostrar sensibilització a pràcticament tots els aliments
vegetals inclosos en els SPT (mediana [rang]: 5 [1-7] extractes positius).
Addicionalment es van detectar altres sensibilitzacions quan en les proves cutànies es
van incloure altres aliments vegetals que els pacients referien de forma individual, per
tal de confirmar la sensibilització. A tots els pacients que se’ls va realitzar el SPT
(42/45, 93,3%) van tenir una reacció positiva a la pell de préssec, excepte un (41/42,
97,6%); 35 (83,3%) foren positius per blat de moro, 33 (78,6%) per avellana, 32
(76,2%) per enciam, 29 (69,1%) per mostassa, 18 (42,9%) per kiwi, i 12 (28,6%) per
blat (Taula 4.10).

CHAPTER 8. SUMMARY IN CATALAN
165
La sensibilització detectada per IgE específica en sèrum va ser: 40/40, 100%;
mediana [rang] kUA/L: 3,49 [0,38-43,1] per l’extracte complet de préssec, 44/45
(97,8%) pel Pru p 3 (5,03 [0,11-36,7]), 0 [0-0,11] per Pru p 1 i 0 [0-0,07] per Pru p 4
(ImmunoCAP Phadia). La detecció de IgE específica a rTri a 14 per ELISA també va
ser positiva per tots els pacients analitzats (21/21, 100%) (Taula 4.12). Els resultats del
microarray es mostren a la Figura 4.7. Es va observar sensibilització a totes les LTPs
incloses en el microarray (Pru p 3, Art v 3, Cor a 8 i Par j 2); la distribució de
freqüències es mostra a la Taula 4.13. No es va detectar sensibilització a cap altra
panal·lergen vegetal inclòs en el microarray.
4.2.5. Sensibilització a pòl·lens
Trenta-quatre (75,6%) individus també foren diagnosticats de pol·linosi, mentre
que tots presentaven rinitis, en 14 casos (31,1%) associada amb asma (Taula 4.10).
Les freqüències de sensibilització a pol·len detectades amb cada mètode es
resumeixen a la Taula 4.13. Una descripció detallada de cada individu es mostra a la
Taula 4.14. Per SPT i/o IgE específica en sèrum, la sensibilització a alguns dels
pòl·lens testats que contenen una LTP coneguda (artemisa, parietària, plàtan d‘ombra,
xiprer i olivera) es va detectar en 43 (95,6%) individus. La sensibilització al plàtan
d’ombra es va detectar en 42 (93,3%) pacients, a l’artemísia en 33 (73,3%), a la
parietària en 16 (35,6%), a l’olivera en 14 (31,1%) i al xiprer en 12 (26,7%).
La proporció de pacients positius al plàtan d’ombra (0,91, 95% CI [0,83-0,99]) i
artemísia (0,69, 95% CI [0,55-0,82]) fou superior a la de la resta de pòl·lens analitzats
(xiprer, olivera, parietària i gramínies) i aquesta diferència fou estadísticament
significativa (Figura 4.8).
4.2.6. Efecte dels AINEs en la degranulació del basòfil in vitro En el grup A s’observa un increment estadísticament significatiu de l’activació
dels basòfils quan l’estimulació es realitza conjuntament amb Pru p 3 i L-ASA a tres de
les concentracions testades (3 mM, 0,3 mM i 0,1 mM) comparat amb l’activació
induïda per Pru p 3 sol (Test de Wilcoxon Dades Aparellades: a 3 mM, p<0,0001; a 0,3
mM, p=0,0117 i a 0,1mM p=0,0085). Aquests efectes no van ser observats en el grup
B ni en el control (grup C). Curiosament en els pacients del grup A la combinació de
Pru p 3 i L-ASA a una concentració 1mM no dóna aquest efecte sinèrgic (Figura 4.9).

CHAPTER 8. SUMMARY IN CATALAN
166
5. DISCUSSIÓ
5.1. Diagnòstic basat en components i reconeixement d’epítops en l’al·lèrgia al marisc
Actualment els mètodes diagnòstics per a l’al·lèrgia al marisc no són capaços
de predir la reactivitat clínica dels pacients sensibilitzats [42, 79]. Pocs estudis s’han
dedicat a analitzar el perfil de sensibilització dels pacients amb reactivitat clínica
(al·lèrgics) i els que no la tenen (tolerants) [88, 89]. En el present estudi hem pogut
observar que el reconeixement IgE dels al·lèrgens recombinants tropomiosina (en
especial), proteïna sarcoplàsmica i cadena lleugera de miosina és més freqüent en els
individus al·lèrgics que en els tolerants. Així doncs, podrien ser utilitzats per identificar
els pacients realment al·lèrgics a la gamba entre tots els que tenen una prova
diagnòstica positiva (test cutani i/o IgE específica). A més, semblaria que els
al·lèrgens, arginina quinasa i hemocianina, tindrien un paper important com a
molècules de reactivitat creuada entre els artròpodes estudiats (gamba-
àcars/escarabat), un rol que tradicionalment ha estat atribuït a l’al·lergen tropomiosina
[133]. Addicionalment, la identificació de llocs d’unió o epítops diferencials per IgE i
IgG4 (en especial l’epítop 7 de la tropomiosina), així com la detecció d’una major
diversitat de reconeixement d’epítops per part dels individus al·lèrgics respecte els
tolerants, que coincideixen notablement amb els identificats en un estudi pilot del
nostre grup [91], obre noves vies al desenvolupament de nous candidats per a tests
diagnòstics i estratègies terapèutiques.
Així doncs, la incorporació d’aquests components al·lergènics i alguns dels
seus epítops en les proves diagnòstiques de rutina, actualment només disponible
l’extracte complet de la gamba o la tropomiosina, podria minimitzar la necessitat de
realitzar una provocació oral del pacient per confirmar la seva reactivitat clínica i evitar
els problemes associats a aquesta.
5.2. Síndrome LTP: patró clínic i perfil de sensibilització molecular d’aliments vegetals i pòl·lens
En el nostre grup de pacients s’han detectat múltiples aliments vegetals
responsables de les reaccions a part del préssec, alguns pertanyents a la família
Rosaceae i d’altres no relacionats taxonòmicament amb aquesta família. Sembla que

CHAPTER 8. SUMMARY IN CATALAN
167
la distribució ubiqua de les LTP en el regne vegetal és probablement la responsable de
l’elevat nombre de reactivitats creuades descrites entre diferents aliments vegetals i
pòl·lens [110].
Les manifestacions clíniques presentades pels nostres pacients han sigut molt
variades i de severitat variable en funció de l’episodi o bé de l’aliment implicat.
Remarcablement, la incidència de trastorns gastrointestinals ha sigut elevada. No
s’han pogut observar episodis aïllats de Síndrome d’Al·lèrgia Oral (SAO) amb
símptomes lleus restringits a nivell d’orofaringe, sinó que generalment aquests s’han
acompanyat d’altres manifestacions. Rarament l’anafilaxis s’ha observat com a
manifestació aïllada i habitualment aquesta és precedida per símptomes locals, els
quals s’han de considerar com a factor de risc pel desenvolupament d’un episodi
d’anafilaxis, especialment en presència d’un cofactor. El percentatge elevat de casos
en què els pacients pateixen un episodi d’anafilaxis només en presència del cofactor
(antiinflamatoris no esteroides (AINE) i/o exercici) posa de manifest que aquest
fenomen àmpliament descrit amb altres al·lèrgens com la gliadina, al·lergen del blat,
també s’observa en el síndrome LTP [37]. El model del test d’activació de basòfils
descrit en aquest projecte podria ser utilitzat per demostrar in vitro l’efecte clínic
observat in vivo i poder estudiar els mecanismes implicats que permetrien que l’AINE
moduli la resposta basofílica IgE-mitjançada i explicar l’exacerbació clínica dels
pacients.
El patró complex de manifestacions clíniques i la diversitat d’aliments vegetals
implicats dificulta en un primer moment el diagnòstic del síndrome LTP. Per exemple,
els símptomes a nivell de mucosa oral podrien ser causats per altres al·lèrgens
vegetals de distribució ubiqua en el regne vegetal com les profil·lines o les proteïnes
PR-10; o bé reaccions sistèmiques severes que fins i tot poden comprometre la vida
del pacient, podrien ser donades per al·lèrgens com les taumatines o components
específics dels aliments vegetals [111-113]. Aquest fet fa que siguin necessàries eines
diagnòstiques acurades per determinar exactament a nivell molecular la proteïna
responsable de la sensibilització. El Diagnòstic Molecular o Diagnòstic Basat en
Components (Component-Resolved Diagnostics, CRD) permet identificar l’autèntic
agent responsable de la reacció al·lèrgica (component) i per tant, permet un diagnòstic
molt més precís del pacient [46]. A més, la incorporació de la tecnologia del microarray
en aquest camp, suposa un gran avenç per la detecció en paral·lel de diferents
especificitats IgE [59]. Ens ofereix un panorama de les sensibilitzacions positives i
negatives de l’individu, possibilitant un diagnòstic més acurat que utilitzant les

CHAPTER 8. SUMMARY IN CATALAN
168
tècniques diagnòstiques convencionals (SPT, ImmunoCAP), sempre que els
components estiguin adequadament validats [60]. En el cas particular del Síndrome-
LTP, el CRD en suport de microarray és especialment útil per identificar aquells
pacients que malgrat presentar només una simptomatologia lleu, típica de la
sensibilització a altres panal·lergens dels aliments d’origen vegetal com les profil·lines i
les proteïnes PR-10, estan en realitat sensibilitzats a les LTP i per tant es troben en
risc de que patir una reacció sistèmica severa, com l’anafilàxia, després de la ingesta
d’un aliment vegetal, i en major grau si la ingesta es combina amb un cofactor.
6. CONCLUSIONS De la primera part d’aquesta tesi (publicació en procés) s’han pogut derivar
quatre conclusions principals:
1.- La tropomiosina (en particular), la proteïna sarcoplàsmica i la cadena lleugera de
miosina són al·lèrgens associats a la reactivitat clínica, per tant poden ser bons
candidats a tests diagnòstics de l’al·lèrgia alimentària a la gamba.
2.- L’arginina quinasa i l’hemocianina són importants al·lèrgens de reactivitat creuada
entre la gamba, els àcars i l’escarabat. Tot i això, per a l’arginina quinasa s’han
detectat epítops clínicament rellevants.
3.- S’observen diferències en els llocs d’unió/ epítops IgE i IgG4 entre els individus
al·lèrgics i tolerants a la gamba. Aquests epítops, especialment l’epítop 7 de la
tropomiosina, podrien ser bons candidats per a un panel d’epítops pel diagnòstic de
l’al·lèrgia alimentària a la gamba.
4.- Els individus al·lèrgics a la gamba mostren una major diversitat de reconeixement
IgE i Ig4 de pèptids seqüencials que els individus tolerants.
De la segona part d’aquesta tesi (paper en procés de revisió) hem pogut
obtenir sis conclusions sobre el síndrome LTP:
1.- Una gran diversitat d’aliments vegetals estan implicats a part del préssec, alguns
de la mateixa família Rosaceae i altres no taxonòmicament relacionats.
CHAPTER 8. SUMMARY IN CATALAN
169
2.- Els símptomes clínics són molt diversos. Remarcablement, hi ha una elevada
prevalença de trastorns gastrointestinals, el síndrome d’al·lèrgia oral no es presenta de
forma aïllada i s’observa una elevada freqüència d’anafilàxia depenent de cofactor.
3.- L’anafilàxia com a manifestació clínica aïllada és molt poc freqüent. Normalment
aquesta va precedida de símptomes locals que s’han d’interpretar com a factors de
risc pel seu desenvolupament, especialment en presència d’un cofactor.
4.- L’associació amb pòl·lens existeix, amb un ampli espectre de pòl·lens implicats,
especialment el plàtan d’ombra.
5.- El diagnòstic basat en components, especialment en el suport de microarray, és
una eina útil per desemmascarar el síndrome LTP en pacients amb múltiples
sensibilitzacions a aliments vegetals i/o pòl·lens i un patró complex de símptomes que
coincideixen amb aquells típicament causats per altres al·lèrgens que no són les LTP.
6.- L’observació clínica que els AINEs precipiten o exacerben els símptomes al·lèrgics
en alguns pacients amb al·lèrgia a les LTP s’ha pogut reproduir in vitro en un model de
test d’activació de basòfils. L-ASA afectaria d’alguna forma la resposta IgE mitjançada,
ja que s’observa un increment de la degranulació del basòfil quan l’estimulació es
realitza amb L-ASA i Pru p 3 comparat amb Pru p 3 sol en aquests pacients.

170

171
APPENDIX A. PUBLICATIONS


APPENDIX A. PUBLICATIONS
173
APPENDIX A. PUBLICATIONS
The paper reporting the first part of this work showing the recombinant
allergens and epitopes that are associated with clinical reactivity is currently in
progress.
The second part of this work about the characterization of the clinical pattern
and molecular sensitization profile to plant-foods and pollens in the LTP syndrome is
currently under peer-review by Clinical Experimental Allergy journal.
Lipid Transfer Protein syndrome: clinical pattern and molecular sensitization profile to
plant-foods and pollens
Short Title: LTP syndrome: Clinical pattern and sensitization profile
Pascal M1,2, Muñoz-Cano R2,3,4, Reina Z2, Palacín A5, Vilella R1,2, Picado C2,3,4, Juan M1,2,
Sánchez-López J2,3,4, Salcedo G5, Valero A2,3,4, Yagüe J1,2, Bartra J2,3,4
1Servei d’Immunologia. Centre de Diagnòstic Biomèdic (CDB), Hospital Clínic. Barcelona. Spain
2Institut d'Investigacions Biomèdiques August Pi i Sunyer (IDIBAPS). Barcelona, Spain. 3Unitat d'Al·lèrgia. Servei de Pneumologia. Hospital Clínic. Universitat de Barcelona. Barcelona.
Spain. 4Centro de Investigaciones en Red de Enfermedades Respiratorias (CIBERES).
5Centro de Biotecnología y Genómica de Plantas (UPM-INIA). Madrid. Spain.