
Allen & Betty Abbett
14
IMPORTANT: The illustrations or other information generated by this report regarding the likelihood of various investment outcomes are hypothetical in nature, do not reflect actual investment results and are not guarantees of future results. Sample Plan - TOTAL Cash-Flow-Based Planning Personal Retirement Analysis Allen & Betty Abbett A Registered Investment Advisor 2430 NW Professional Drive Corvallis, OR 97330 www.moneytree.com 877-421-9815 Asset Advisors Example, LLC John Smith Mar 29, 2018
Transcript of Allen & Betty Abbett

IMPORTANT: The illustrations or other information generated by this report regarding the likelihood of various investmentoutcomes are hypothetical in nature, do not reflect actual investment results and are not guarantees of future results.
Sample Plan - TOTAL Cash-Flow-Based Planning
Personal Retirement Analysis
Allen & Betty Abbett
A Registered Investment Advisor2430 NW Professional DriveCorvallis, OR 97330
www.moneytree.com877-421-9815
Asset Advisors Example, LLCJohn Smith
Mar 29, 2018

Table of ContentsCover 1
Cash Flow Planning (text) - A1 2
Net Worth - A3 3
Cash Flow Needed vs Available Graph - B2 4
Cash Flow Illustration - B7 5
Asset Accounts (text) - C1 6
Account Summary - C3 7
Income Tax - Current Year - D3 8
Tax Summary - D6 9
Retirement Estimate Graph - F2 10
Retirement Capital Estimate - F3 11
Monte Carlo - F4 12
Net Worth - F6 13
This report, and its hypothetical illustrations, are intended to form a basis for further discussion with your legal, accounting, and financial advisors.
Actual future investment returns, taxes and inflation are unknown. Do not rely upon this report to predict future investment performance.Page 13/29/2018
Securities offered by Asset Advisors - a Registered Investment Advisor

Sample Plan - TOTAL Cash-Flow-Based Planning
Cash Flow Planning
Cash Flow Planning
This financial analysis has been prepared with the objective of illustrating your present and future cash flows,integrated with your assets and income taxes.
Cash flow planning is designed to account for all sources of income and expense, and to illustrate the impact thatany surpluses or shortages might have on the ability of your assets to last through your life expectancy. Thismethod of planning is sometimes referred to as an "optimized" approach.
A1
Each year your income sources are compared to your annual expenses. Any surplus of spendableincome is automatically added to your savings and investments starting in the first year. If there isa shortage of spendable income, the amount needed to make up the shortage is withdrawn fromyour asset accounts. This approach is intended to reflect what would happen if you are managingyour funds in an optimal manner.
What do we mean by "Optimized" planning?
Cash Flow
Every year your savings and investment accounts will have potential interest, dividends, capitalgains or appreciation. The cash flow analysis makes the assumption that, unless otherwiseindicated, the entire rate of return is reinvested into the account. This approach optimizes thepotential growth of each asset account. Taxes are not charged to the earnings on the account, butinstead are added to your personal expenses.
Assets
Since income and FICA (Social Security) taxes can represent a substantial part of your annualexpenses, the "optimized" planning approach carefully computes your tax burden every year. Theanalysis uses the actual IRS tax rate tables including annual adjustments for "indexing" the ratebreakpoints and standard deductions. For high income taxpayers, itemized deductions andexemptions are phased out. Separate tax treatment is provided for dividends, capital gains,alternate minimum tax, the taxable portion of social security income and other areas wherespecial treatment is required. The result is that, instead of showing a "guesstimate" of your annualtaxes, the analysis provides a more accurate yearly indication of future potential taxes.
Taxes
This report, and its hypothetical illustrations, are intended to form a basis for further discussion with your legal, accounting, and financial advisors.
Actual future investment returns, taxes and inflation are unknown. Do not rely upon this report to predict future investment performance.Page 23/29/2018
Securities offered by Asset Advisors - a Registered Investment Advisor

Net Worth Statement A3
Sample Plan - TOTAL Cash-Flow-Based Planning
ASSETS
Allen Betty Joint / CP Trust/Oth. TotalOrdinary Interest Accounts:
$12,450 $2,850 Insurance Cash Value, Dividends $15,300
Total $12,450 $2,850 $15,300
Equity (Investment) Accounts:
248,800 Mutual Funds 248,800
Total $248,800 $248,800
Retirement Accounts:
213,500 401(k) accounts 213,500 54,000 IRA accounts 54,000
110,250 403(b), SEP, Simple 110,250 62,500 72,800 Roth accounts 135,300
Total $330,000 $183,050 $513,050
Personal Use Assets:
50,000 19,600 Personal property 69,600
Total $50,000 $19,600 $69,600
Real Estate Assets:
447,000 Residence 447,000 200,000 Rental real estate 200,000
Total $447,000 $200,000 $647,000
Total Assets $840,930 $185,900 $468,400 $1,495,230
Allen Betty Joint / CP Trust/Other TotalLIABILITIES($232,000)Residence mortgage ($232,000)
(6,640)Credit Cards (6,640)(2,500)Life insurance loans (2,500)
(118,000)Rental real estate (118,000)
($9,140) ($350,000) ($359,140)Total Liabilities
NET WORTH $831,790 $185,900 $118,400 $1,136,090
Note: Assets held in a Revocable Trust are included in the grantors assets.
This report, and its hypothetical illustrations, are intended to form a basis for further discussion with your legal, accounting, and financial advisors.
Actual future investment returns, taxes and inflation are unknown. Do not rely upon this report to predict future investment performance.Page 33/29/2018
Securities offered by Asset Advisors - a Registered Investment Advisor

Cash FlowSample Plan - TOTAL Cash-Flow-Based Planning
B2
The bars in the above graph represent the amounts available from...
The black outline illustrates the annual expenses including ...
Earned income (wages & self employment)
Pension plans and Social Security
Misc (inheritances, sale of residence, investment account systematic withdrawal plansor interest/dividends taken in cash, scheduled retirement account distributions orrequired minimum distribution amounts.)
If income from various sources exceeds expenses, the excess is reinvested in savings and investmentaccounts. If expenses are greater than income, it is assumed that funds required to meet such excessexpenses will be drawn from savings and investment accounts to make up the shortage.
– Personal living expenses– Life insurance and other premiums– Mortgage and debt repayment– Planned deposits to investments and retirement accounts– Miscellaneous expense items– Taxes
This report, and its hypothetical illustrations, are intended to form a basis for further discussion with your legal, accounting, and financial advisors.
Actual future investment returns, taxes and inflation are unknown. Do not rely upon this report to predict future investment performance.Page 43/29/2018
Securities offered by Asset Advisors - a Registered Investment Advisor

Cash Flow IllustrationSample Plan - TOTAL Cash-Flow-Based Planning
Ages Total Sources
Scheduled Cash flow sources and Required Minimum Distributions
B7
Retire/RothAccounts *
EarnedIncome
Less LivingExpense &
TaxesSurplus
(Shortage)InvestmentAccounts *
Pension/SocSec Other Income
1 2 3 4 5 6 7 8
$166,000 53 51 $6,628 $172,628 ($172,096) $532
169,750 54 52 7,051 176,801 (176,205) 596
183,041 55 53 7,483 190,524 (198,631) (8,107)
187,202 56 54 7,924 195,126 (246,333) (51,207)
191,456 57 55 8,414 199,870 (254,046) (54,176)
195,811 58 56 8,831 204,642 (222,250) (17,608)
200,264 59 57 11,631 211,895 (228,594) (16,699)
210,763 60 58 210,763 (288,808) (78,045)
215,572 61 59 10,262 225,834 (205,851) 19,983
220,494 62 60 10,758 231,252 (211,227) 20,025
225,528 63 61 15,312 240,840 (217,740) 23,100
230,679 64 62 11,780 242,459 (220,956) 21,503
101,459 65 R 63 12,306 113,765 (306,633) (192,868)
66 64 R 12,843 12,843 (188,359) (175,516)
67 65 37,203 13,391 50,593 (267,769) (217,176)
68 66 37,947 13,949 51,896 (238,487) (186,591)
69 67 69,544 14,519 84,063 (240,673) (156,610)
70 4,490 68 70,935 438,244 513,668 (251,126) 262,542
71 24,315 69 72,354 96,669 (188,725) (92,056)
72 51,365 70 73,801 125,166 (200,207) (75,041)
73 54,546 71 75,277 129,823 (206,986) (77,163)
74 57,917 72 76,782 134,699 (225,308) (90,609)
75 59,454 73 78,318 137,772 (213,606) (75,834)
76 59,543 74 79,884 139,427 (220,463) (81,036)
77 59,104 75 81,482 140,586 (227,608) (87,022)
78 58,112 76 83,111 141,223 (235,093) (93,870)
79 56,559 77 84,774 141,333 (242,857) (101,524)
80 54,071 78 86,469 140,540 (250,950) (110,410)
81 50,658 79 88,199 138,857 (210,834) (71,977)
82 49,066 80 89,962 139,028 (218,763) (79,735)
83 46,607 81 91,762 138,369 (227,001) (88,632)
84 43,478 82 93,597 137,075 (235,579) (98,504)
85 39,205 83 95,469 134,674 (244,515) (109,841)
86 33,295 84 97,378 130,673 (253,805) (123,132)
87 25,727 85 99,325 125,052 (263,507) (138,455)
88 16,139 86 101,313 117,452 (273,618) (156,166)
89 4,080 87 103,338 107,418 (251,556) (144,138)
90 L 88 105,406 105,406 (256,615) (151,209)
91 89 59,838 59,838 (235,847) (176,009)
92 90 61,034 61,034 (245,132) (184,098)
93 91 62,255 62,255 (254,826) (192,571)
94 92 63,501 63,501 (264,949) (201,448)
95 93 64,770 64,770 (275,522) (210,752)
96 94 66,066 66,066 (286,568) (220,502)
97 95 L 67,387 67,387 (298,109) (230,722)
98 96
* Scheduled distributions, interest or dividends taken in cash or amounts taken to meet the IRS minimum distribution requirements.
B9 C10..C11a C4..C8 B10 B18, B18a B8
R = Retirement Age, L = Life Expectancy
This report, and its hypothetical illustrations, are intended to form a basis for further discussion with your legal, accounting, and financial advisors.
Actual future investment returns, taxes and inflation are unknown. Do not rely upon this report to predict future investment performance.Page 53/29/2018
Securities offered by Asset Advisors - a Registered Investment Advisor

Asset AccountsSample Plan - TOTAL Cash-Flow-Based Planning
C1
Your assets are illustrated in this plan based on two major groups, Personal Accounts and Tax DeductibleRetirement accounts. Within these groups, the assets are further divided as described below.
This includes any account that is treated by the IRS as qualified for special tax-deferral or deduction.
Personal Accounts:
Fully Taxable:
These are savings and investments that earn interest or dividends which are fully taxable at ordinaryincome rates. Included in this category are savings accounts, certificates of deposit, money marketfunds and accounts, bonds, notes and mortgages, etc.
Tax-Deferred:
Some assets allow you to accumulate money without current taxation on interest or other returns. Themost common are fixed or variable annuities issued by insurance companies. Any illustration of anannuity account is hypothetical, and does not represent any specific product or underlying investmentaccounts and is not intended to project or predict investment results. The variable nature of a variableannuity will affect not only the investment returns, but will also affect the cash value and deathbenefits of the annuity. The annuity could result in zero or negative return, depending on theperformance of the underlying investments and the terms of the annuity contract.
Tax-Free:
Equity and Other:
Tax Deductible Retirement Accounts:
Interest earned on certain bonds issued by federal, state or local municipalities are exempt fromfederal and in some cases state income tax. These are referred to as "tax exempt" securities and maybe purchased individually or as muni bond investment trusts or mutual funds.
Assets which receive part or all of their return in the form of appreciation and qualify for special capitalgains treatment on the profits would be included in this category. Such assets include: stocks, equitymutual funds, real estate, business interest, etc.
Not an Investment Offer:
IMPORTANT:
Individual Retirement Accounts.Corporate thrift or savings plans.Retirement plans for self employed individuals.Tax sheltered annuity plans for employees of 403(b) taxexempt organizations.Employer sponsored plans.Corporate plans for employee profit sharing.(Tax-free growth).Tax-free after-tax personal contributions, pre-tax company additions.
These accounts generally allow for pre-tax contributions and tax deferred earnings. When funds are withdrawnfrom these accounts the entire amount is taxable at the ordinary tax rate. (Roth accounts use after taxcontributions and tax free accumulation and withdrawal.)
This is not an offer to sell or a solicitation of an offer to buy any security. Such offer would be accompanied by aprospectus or other offering materials.
The projections or other information generated by Money Tree regarding the likelihood of various investmentoutcomes are hypothetical in nature, do not reflect actual investment results and are not guarantees of futureresults.
IRA401(k)Keogh or SEPTSA
SIMPLE 401(k) and SIMPLE IRAProfit SharingRoth IRA accountsRoth 401(k)
This report, and its hypothetical illustrations, are intended to form a basis for further discussion with your legal, accounting, and financial advisors.
Actual future investment returns, taxes and inflation are unknown. Do not rely upon this report to predict future investment performance.Page 63/29/2018
Securities offered by Asset Advisors - a Registered Investment Advisor

Account SummarySample Plan - TOTAL Cash-Flow-Based Planning
Ages
C3
TaxableAccount
Equity& Other
TaxFree
1 2 3 4 5 6 7 98
Retirement accounts Roth IRAs
BettyAllen
TaxDeferred
Begin. YearAccount
Totals
BettyAllen5.75% 6.00%7.50%1.65% 7.00% 7.00%7.00% 7.00%
$267,500 $72,800 $761,850 $83,800 53 $165,000 51 $110,250 $62,500
295,158 83,505 850,470 88,313 54 184,068 52 126,942 72,484
324,976 95,072 945,842 92,914 55 204,619 53 144,982 83,279
358,092 107,563 1,040,573 89,291 56 226,215 54 164,468 94,944
393,785 121,045 1,099,431 42,122 57 249,431 55 185,505 107,543
432,242 135,590 1,162,136 58 264,957 56 208,205 121,142
473,664 151,274 1,269,304 59 275,863 57 232,688 135,815
518,264 168,180 1,385,700 60 288,534 58 259,083 151,639
566,890 186,396 1,447,770 61 238,259 59 287,528 168,697
619,228 206,016 1,616,581 7,060 62 279,029 60 318,170 187,078
675,546 227,141 1,797,868 14,244 63 322,892 61 351,168 206,877
736,131 249,879 1,995,670 22,167 64 372,607 62 386,690 228,196
801,289 274,345 2,206,313 29,898 65 424,720 63 424,917 251,144
853,373 299,272 2,164,173 66 280,172 64 463,888 267,468
908,842 318,725 2,121,209 67 114,748 65 494,041 284,853
861,810 339,442 2,030,774 68 66 526,154 303,368
724,535 361,506 1,969,482 69 67 560,354 323,087
609,395 385,004 1,935,264 70 68 596,777 344,088
644,354 410,029 2,324,661 105,958 71 162,298 69 635,568 366,454
661,049 436,681 2,350,929 14,821 72 171,224 70 676,880 390,274
677,268 465,065 2,370,989 73 118,597 71 694,417 415,642
692,886 495,294 2,387,912 74 45,619 72 711,454 442,659
661,159 527,488 2,387,939 75 73 727,860 471,432
595,668 561,775 2,403,008 76 74 743,490 502,075
522,392 598,290 2,413,576 77 75 758,184 534,710
440,675 637,179 2,419,085 78 76 771,765 569,466
349,591 678,596 2,418,886 79 77 784,218 606,481
248,572 722,705 2,412,353 80 78 795,174 645,902
136,584 769,681 2,398,769 81 79 804,618 687,886
62,996 819,710 2,427,650 82 80 812,345 732,599
872,991 2,450,189 83 81 796,980 780,218
929,735 2,469,355 84 82 708,688 830,932
990,168 2,482,783 85 83 607,672 884,943
1,054,529 2,489,765 86 84 492,772 942,464
1,123,073 2,489,554 87 85 362,757 1,003,724
1,196,073 2,481,297 88 86 216,258 1,068,966
1,273,818 2,464,088 89 87 51,821 1,138,449
1,356,616 2,469,206 90 88 1,112,590
1,444,796 2,473,065 91 89 1,028,269
1,538,708 2,451,484 92 90 912,776
1,638,724 2,420,121 93 91 781,397
1,745,241 2,377,942 94 92 632,701
1,858,682 2,323,825 95 93 465,143
1,979,496 2,256,552 96 94 277,056
2,108,163 2,174,807 97 95 66,644
2,075,223 2,075,223 98 96
C4 C5 C7 C8 C10,C10b...e C10a, C10b...e C11 C11a
Note: Rates shown above are for first year only. Refer to account reports for future year rates.
This report, and its hypothetical illustrations, are intended to form a basis for further discussion with your legal, accounting, and financial advisors.
Actual future investment returns, taxes and inflation are unknown. Do not rely upon this report to predict future investment performance.Page 73/29/2018
Securities offered by Asset Advisors - a Registered Investment Advisor

The following calculations give an idea of the amount of taxes you might pay based on the income and assetinformation provided. These amounts are approximations only and the actual tax amounts may be higher orlower than illustrated.
Income Tax - Current Year D3
Sample Plan - TOTAL Cash-Flow-Based Planning
Gross TaxableINCOME:
B9$158,000 $158,000 Salaries and wages
C4..C81,407 1,407 Interest
B98,000 8,000 Schedule C (self employment)
C6 a5,898 5,898 Schedule D (net gain/loss)
D93,281 3,281 Schedule E (passive gain/loss)
$176,587 GROSS INCOME
Adjustments:
C10-C10e($5,160)Retirement plan deposits - Allen
(4,320)Retirement plan deposits - Betty
D15(565)1,130 Self Employment FICA
$166,542 ADJUSTED GROSS INCOME
Gross AllowedItemized Deductions: D10
$9,955 $9,955 Mortgage interest
4,000 4,000 Charitable contributions
4,000 Medical expenses
10,000 21,543 State, Property & Other Tax
$142,542
($24,000)$24,000
TAXABLE INCOME
Itemized deductions $23,955
or Standard deductions
D11
TAX SUMMARY:
Federal Income Tax $22,825
FICA (Social Security) & HI Tax 13,217
Other Taxes or (credits) (2,000)
State Income Tax 14,143
$48,185 TOTAL TAXES
Your combined federal & state marginal tax bracket is 31.00 % .
Your total taxes equal 28.93 % of your Adjusted Gross Income, and 33.80% of your Taxable income.
*Dividend and Capital Gains taxed marginally at 15.00%.
This report, and its hypothetical illustrations, are intended to form a basis for further discussion with your legal, accounting, and financial advisors.
Actual future investment returns, taxes and inflation are unknown. Do not rely upon this report to predict future investment performance.Page 83/29/2018
Securities offered by Asset Advisors - a Registered Investment Advisor

Tax SummarySample Plan - TOTAL Cash-Flow-Based Planning
Ages
D6
FederalIncome Tax
AdditionalAMT Tax
FederalCredits
1 2 3 4 5 6 7 98
Federal Income Tax Amounts
StateTax
Total Fed.Income Tax
Early distr. &other tax
TotalTaxes
FICAand HI
Tax
AdditionalState Tax
or (credits)
$20,826 $13,217 ($2,000) $48,186 $22,826 53 51 $14,503 ($360)
21,576 13,514 (2,000) 49,668 23,576 54 52 14,938 (360)
26,288 14,541 56,739 26,288 55 53 16,180 (270)
27,018 14,870 58,233 27,018 56 54 16,615 (270)
27,914 15,309 60,159 27,914 57 55 17,116 (180)
28,437 15,551 61,269 28,437 58 56 17,461 (180)
29,419 15,903 63,166 29,419 59 57 18,024 (180)
34,469 16,718 71,816 34,469 60 58 20,809 (180)
31,447 17,098 67,582 31,447 61 59 19,217 (180)
32,673 17,487 69,819 32,673 62 60 19,838 (180)
34,873 18,194 73,738 34,873 63 61 20,851 (180)
35,278 18,291 74,548 35,278 64 62 21,159 (180)
9,421 8,419 32,343 9,421 65 63 14,683 (180)
6,423 66 64 6,603 (180)
13,145 27,038 13,145 67 65 14,073 (180)
29,520 47,590 29,520 68 66 18,250 (180)
29,581 45,041 29,581 69 67 15,640 (180)
40,843 2,428 65,678 40,843 70 68 22,587 (180)
2,277 71 69 2,457 (180)
3,708 8,462 3,708 72 70 4,934 (180)
4,613 9,741 4,613 73 71 5,308 (180)
13,085 22,352 13,085 74 72 9,447 (180)
18,950 30,713 18,950 75 73 11,943 (180)
19,995 32,239 19,995 76 74 12,424 (180)
21,092 33,841 21,092 77 75 12,929 (180)
22,278 35,559 22,278 78 76 13,461 (180)
23,488 37,323 23,488 79 77 14,015 (180)
24,757 39,174 24,757 80 78 14,597 (180)
15,602 26,258 15,602 81 79 10,836 (180)
16,207 27,424 16,207 82 80 11,397 (180)
16,818 28,620 16,818 83 81 11,982 (180)
17,452 29,867 17,452 84 82 12,595 (180)
18,110 31,167 18,110 85 83 13,237 (180)
18,776 32,503 18,776 86 84 13,907 (180)
19,487 33,918 19,487 87 85 14,611 (180)
20,225 35,394 20,225 88 86 15,349 (180)
4,332 89 87 4,512 (180)
9 90 88 189 (180)
111 91 89 201 (90)
117 92 90 207 (90)
122 93 91 212 (90)
128 94 92 218 (90)
134 95 93 223 (90)
139 96 94 229 (90)
145 97 95 235 (90)
98 96D8 D12 D13, D14 D17 D17 D15
Note - it is assumed the Tax Cuts and Jobs Act (TCJA) sunsets after 2025. See Income Tax Calculations report for details.
This report, and its hypothetical illustrations, are intended to form a basis for further discussion with your legal, accounting, and financial advisors.
Actual future investment returns, taxes and inflation are unknown. Do not rely upon this report to predict future investment performance.Page 93/29/2018
Securities offered by Asset Advisors - a Registered Investment Advisor

Retirement EstimateSample Plan - TOTAL Cash-Flow-Based Planning
F2
As inflation increases the amount of income needed for your standard of living, there is the potential need to drawincreasing amounts out of savings, investments and retirement accounts.
The graph shows how long your capital might last. The objective is to assure that your capital is properly managedso that it will last at least until your life expectancy.
If the capital is depleted before your need for income has ceased, then you will become dependent on yourpensions, Social Security, relatives or public sources. If there is capital remaining when your need for income stopsthen the remaining capital is available for your heirs.
The line allows you to visualize the annual expenses as compared to your capital accounts.
If the bars dip below the "0" level on the graph, it indicates that you have consumed all your savings, investment,and retirement accounts, and your spending requirements have caused a "deficit" spending situation - a need forfunds where none exists.
This report, and its hypothetical illustrations, are intended to form a basis for further discussion with your legal, accounting, and financial advisors.
Actual future investment returns, taxes and inflation are unknown. Do not rely upon this report to predict future investment performance.Page 103/29/2018
Securities offered by Asset Advisors - a Registered Investment Advisor

Retirement Capital EstimateSample Plan - TOTAL Cash-Flow-Based Planning
Ages *
F3
Begin. Yr.Account
Totals
1 2 3 4 5 76 8
EarnedIncome
** InvestmentAcct Distr.
** RetirementAcct Distr.
Other Inc.& St. Opt.
Pensions/Soc Sec
AnnualSurplus
Ending YearAccount
Totals
Income and Capital DistributionsAnnual
ExpensesIncl. Tax
$166,000 53 $761,850 $6,628 $532 $850,471 ($172,096)51
169,750 54 850,471 7,051 596 945,842 (176,205)52
183,041 55 945,842 7,483 8,107 1,040,573 (198,631)53
187,202 56 1,040,573 7,924 51,207 1,099,431 (246,333)54
191,456 57 1,099,431 8,414 54,176 1,162,136 (254,046)55
195,811 58 1,162,136 8,831 17,608 1,269,304 (222,250)56
200,264 59 1,269,304 11,631 16,699 1,385,701 (228,594)57
210,763 60 1,385,701 78,045 1,447,770 (288,808)58
215,572 61 1,447,770 10,262 19,983 1,616,581 (205,851)59
220,494 62 1,616,581 10,758 20,025 1,797,868 (211,227)60
225,528 63 1,797,868 15,312 23,100 1,995,670 (217,740)61
230,679 64 1,995,670 11,780 21,503 2,206,314 (220,956)62
101,459 65 2,206,314 12,306 192,868 2,164,173 (306,633)63R
66 2,164,173 12,843 175,516 2,121,209 (188,359)64 R
37,203 67 2,121,209 102,428 13,391 114,748 2,030,773 (267,769)65
37,947 68 2,030,773 186,591 13,949 1,969,482 (238,487)66
69,544 69 1,969,482 156,610 14,519 1,935,264 (240,673)67
70,935 70 1,935,264 4,490 438,244 262,542 2,324,661 (251,126)68
72,354 71 2,324,661 24,315 92,056 2,350,929 (188,725)69
73,801 72 2,350,929 51,365 75,041 2,370,988 (200,207)70
75,277 73 2,370,988 54,546 77,163 2,387,911 (206,986)71
76,782 74 2,387,911 102,907 45,619 2,387,939 (225,308)72
78,318 75 2,387,939 135,288 2,403,008 (213,606)73
79,884 76 2,403,008 140,578 2,413,576 (220,463)74
81,482 77 2,413,576 146,125 2,419,085 (227,608)75
83,111 78 2,419,085 151,981 2,418,886 (235,093)76
84,774 79 2,418,886 158,083 2,412,353 (242,857)77
86,469 80 2,412,353 164,480 2,398,769 (250,950)78
88,199 81 2,398,769 122,635 2,427,649 (210,834)79
89,962 82 2,427,649 128,800 2,450,189 (218,763)80
91,762 83 2,450,189 135,238 2,469,355 (227,001)81
93,597 84 2,469,355 141,981 2,482,783 (235,579)82
95,469 85 2,482,783 149,045 2,489,765 (244,515)83
97,378 86 2,489,765 156,427 2,489,554 (253,805)84
99,325 87 2,489,554 164,181 2,481,297 (263,507)85
101,313 88 2,481,297 172,305 2,464,088 (273,618)86
103,338 89 2,464,088 148,217 2,469,206 (251,556)87
105,406 90 2,469,206 151,208 2,473,065 (256,615)88L
59,838 91 2,473,065 176,009 2,451,484 (235,847)89
61,034 92 2,451,484 184,097 2,420,121 (245,132)90
62,255 93 2,420,121 192,570 2,377,942 (254,826)91
63,501 94 2,377,942 201,448 2,323,825 (264,949)92
64,770 95 2,323,825 210,752 2,256,552 (275,522)93
66,066 96 2,256,552 220,501 2,174,807 (286,568)94
67,387 97 2,174,807 230,721 2,075,223 (298,109)95 L
98 2,075,223 2,075,223 96
C3aB18, B18aB10C4...C8C10...C10eB9B8
R = Retirement Age, L = Life Expectancy**Investment and Retirement distributions include withdrawals from account totals to satisfy "Income needed" shortages from Cash Flow report.
This report, and its hypothetical illustrations, are intended to form a basis for further discussion with your legal, accounting, and financial advisors.
Actual future investment returns, taxes and inflation are unknown. Do not rely upon this report to predict future investment performance.Page 113/29/2018
Securities offered by Asset Advisors - a Registered Investment Advisor

F4Monte Carlo Retirement Simulation
Monte Carlo Simulations illustrate possible variations in growth and/or depletion of retirement capital underunpredictable future conditions. Simulation introduces uncertainty by fluctuating annual rates of return on assets. Thegraph and related calculations do not presuppose or analyze any particular investment or investment strategy. Thislong-term hypothetical model is used to help show potential effects of market volatility and possible effects on yourfinancial future. This is not a projection, but an illustration of uncertainty.
The simulations begin in the current year and model potential asset level changes over time. Included are all capitalassets, both tax advantaged and taxable, all expenses, including education funding if applicable, pension benefits andSocial Security benefits. Observing results from these large number of simulations may offer insight into the shape,trends and potential range of future retirement plan outcomes under volatile market conditions.
Results from 10,000 Monte Carlo Simulations:$2,074,952 Percentage of results above zero*
Maximum Monte Carlo result
Average Monte Carlo result Percentage with $ remaining at Allen's age 87
Percentage with $ remaining at Allen's age 92Minimum (worst case) result
Original Retirement Capital estimate
Percentage with $ remaining at Allen's age 82
*Percent of times money is remaining at last life expectancy.
$0
$2,511,736
$23,278,089
89%
97%
100%
72%
The bold line is the estimated retirement capital value over time using fixed rates.
Current after tax rate of return is 6.52% in the original estimate and varies from 5.99% to 7.17%, with portfolio changes.
This simulation used a 4.25% standard deviation to create ten thousand sets of normally distributed random rates of return
based on the annual rates of return in the original estimate (95% of the rates fall between -2.51% and 15.67%).
A standard deviation rate of 2.00% was applied to the inflation rate used on personal expenses.
The Monte Carlo illustration above points out the uncertainty of future retirement capital outcomes.It is important that you return regularly for a review of your goals and financial condition, in order
to assure that appropriate periodic adjustments are made to your financial affairs.
IMPORTANT: The projections or other information generated in this report regarding the likelihood of variousinvestment outcomes are hypothetical in nature, do not reflect actual investment products or results and are notguarantees of future results. Results may vary with each report and over time. Results of this simulation are neitherguarantees nor projections of future results. Information is for illustrative purposes only. Do not rely on this report topredict actual performance of any investment or investment strategy.
Sample Plan - TOTAL Cash-Flow-Based Planning
The original capital estimate indicated a possibility of having $2,074,952 in assets remaining at last life expectancy.Monte Carlo simulation, using 10,000 trials of the same assets, income and expenses, resulted in a 72% probability of
having funds remaining at last life expectancy, and an average amount of $2,511,736 remaining.
This report, and its hypothetical illustrations, are intended to form a basis for further discussion with your legal, accounting, and financial advisors.
Actual future investment returns, taxes and inflation are unknown. Do not rely upon this report to predict future investment performance.Page 123/29/2018
Securities offered by Asset Advisors - a Registered Investment Advisor
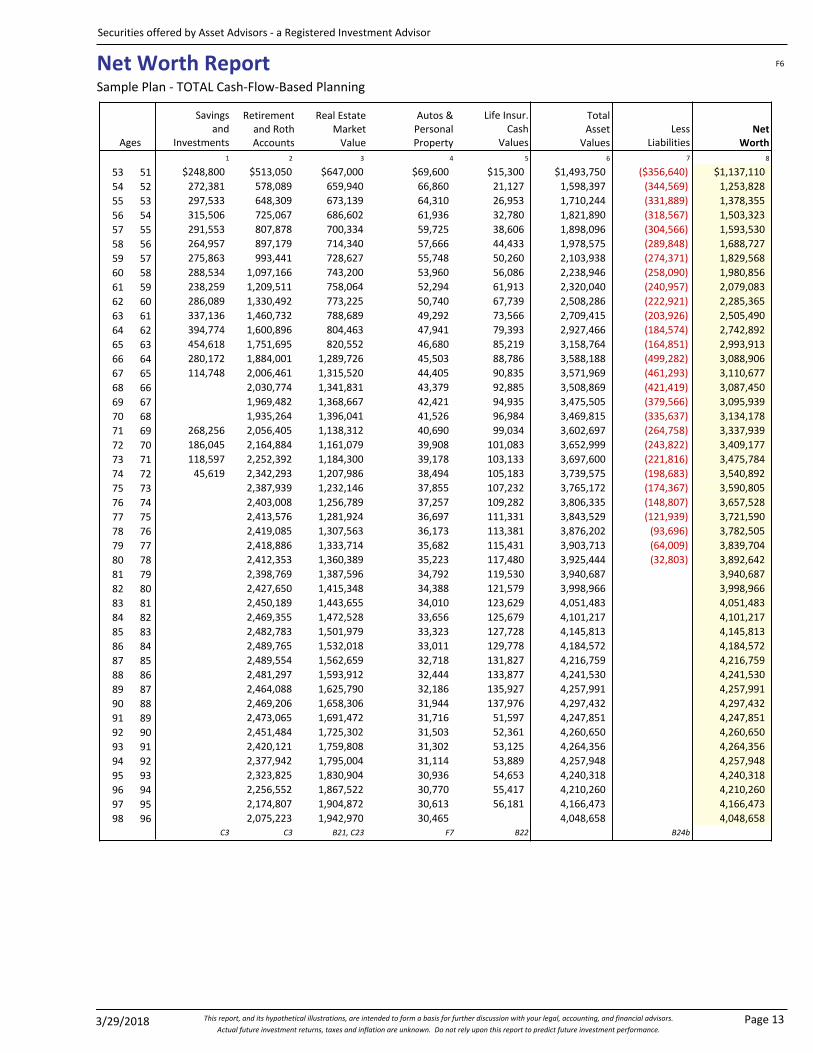
Net Worth ReportSample Plan - TOTAL Cash-Flow-Based Planning
Ages
F6
Savingsand
Investments
Retirementand RothAccounts
Real EstateMarket
Value
1 2 3 4 5 6 7
Autos &PersonalProperty
Life Insur.Cash
ValuesNet
Worth
TotalAsset
ValuesLess
Liabilities
8
$1,137,110 51 $248,800 ($356,640)53 $69,600 $513,050 $647,000 $15,300 $1,493,750
1,253,828 52 272,381 (344,569)54 66,860 578,089 659,940 21,127 1,598,397
1,378,355 53 297,533 (331,889)55 64,310 648,309 673,139 26,953 1,710,244
1,503,323 54 315,506 (318,567)56 61,936 725,067 686,602 32,780 1,821,890
1,593,530 55 291,553 (304,566)57 59,725 807,878 700,334 38,606 1,898,096
1,688,727 56 264,957 (289,848)58 57,666 897,179 714,340 44,433 1,978,575
1,829,568 57 275,863 (274,371)59 55,748 993,441 728,627 50,260 2,103,938
1,980,856 58 288,534 (258,090)60 53,960 1,097,166 743,200 56,086 2,238,946
2,079,083 59 238,259 (240,957)61 52,294 1,209,511 758,064 61,913 2,320,040
2,285,365 60 286,089 (222,921)62 50,740 1,330,492 773,225 67,739 2,508,286
2,505,490 61 337,136 (203,926)63 49,292 1,460,732 788,689 73,566 2,709,415
2,742,892 62 394,774 (184,574)64 47,941 1,600,896 804,463 79,393 2,927,466
2,993,913 63 454,618 (164,851)65 46,680 1,751,695 820,552 85,219 3,158,764
3,088,906 64 280,172 (499,282)66 45,503 1,884,001 1,289,726 88,786 3,588,188
3,110,677 65 114,748 (461,293)67 44,405 2,006,461 1,315,520 90,835 3,571,969
3,087,450 66 (421,419)68 43,379 2,030,774 1,341,831 92,885 3,508,869
3,095,939 67 (379,566)69 42,421 1,969,482 1,368,667 94,935 3,475,505
3,134,178 68 (335,637)70 41,526 1,935,264 1,396,041 96,984 3,469,815
3,337,939 69 268,256 (264,758)71 40,690 2,056,405 1,138,312 99,034 3,602,697
3,409,177 70 186,045 (243,822)72 39,908 2,164,884 1,161,079 101,083 3,652,999
3,475,784 71 118,597 (221,816)73 39,178 2,252,392 1,184,300 103,133 3,697,600
3,540,892 72 45,619 (198,683)74 38,494 2,342,293 1,207,986 105,183 3,739,575
3,590,805 73 (174,367)75 37,855 2,387,939 1,232,146 107,232 3,765,172
3,657,528 74 (148,807)76 37,257 2,403,008 1,256,789 109,282 3,806,335
3,721,590 75 (121,939)77 36,697 2,413,576 1,281,924 111,331 3,843,529
3,782,505 76 (93,696)78 36,173 2,419,085 1,307,563 113,381 3,876,202
3,839,704 77 (64,009)79 35,682 2,418,886 1,333,714 115,431 3,903,713
3,892,642 78 (32,803)80 35,223 2,412,353 1,360,389 117,480 3,925,444
3,940,687 7981 34,792 2,398,769 1,387,596 119,530 3,940,687
3,998,966 8082 34,388 2,427,650 1,415,348 121,579 3,998,966
4,051,483 8183 34,010 2,450,189 1,443,655 123,629 4,051,483
4,101,217 8284 33,656 2,469,355 1,472,528 125,679 4,101,217
4,145,813 8385 33,323 2,482,783 1,501,979 127,728 4,145,813
4,184,572 8486 33,011 2,489,765 1,532,018 129,778 4,184,572
4,216,759 8587 32,718 2,489,554 1,562,659 131,827 4,216,759
4,241,530 8688 32,444 2,481,297 1,593,912 133,877 4,241,530
4,257,991 8789 32,186 2,464,088 1,625,790 135,927 4,257,991
4,297,432 8890 31,944 2,469,206 1,658,306 137,976 4,297,432
4,247,851 8991 31,716 2,473,065 1,691,472 51,597 4,247,851
4,260,650 9092 31,503 2,451,484 1,725,302 52,361 4,260,650
4,264,356 9193 31,302 2,420,121 1,759,808 53,125 4,264,356
4,257,948 9294 31,114 2,377,942 1,795,004 53,889 4,257,948
4,240,318 9395 30,936 2,323,825 1,830,904 54,653 4,240,318
4,210,260 9496 30,770 2,256,552 1,867,522 55,417 4,210,260
4,166,473 9597 30,613 2,174,807 1,904,872 56,181 4,166,473
4,048,658 9698 30,465 2,075,223 1,942,970 4,048,658 C3 B21, C23 F7 B22C3 B24b
This report, and its hypothetical illustrations, are intended to form a basis for further discussion with your legal, accounting, and financial advisors.
Actual future investment returns, taxes and inflation are unknown. Do not rely upon this report to predict future investment performance.Page 133/29/2018
Securities offered by Asset Advisors - a Registered Investment Advisor