Allegany HMP - RA Mtgs PPT Materials/Allegany Co...Bill Begelow, Highway Superintendent, Town of...
17
MEETING NOTES PAGE 1 OF 3 Meeting Allegany County Hazard Mitigation Plan (HMP) Planning Partnership Risk Assessment Meeting #2 Date July 28, 2016 Time 9:00 – 10:30 a.m. Location Allegany County Office of Emergency Services (OES) Attendees Karl Graves, Legislator, Allegany County Jeff Luckey, Director, Allegany County Office of Emergency Management and Fire Bonnie VanHousen, Allegany County OES Michelle Denhoff, Planning and Development Specialist, Allegany County Planning Department James VanDewalker, Clerk, Town of Allen Allan Hennard, Highway Superintendent, Town of Allen Bill Begelow, Highway Superintendent, Town of Amity Brad Schiralli, Superintendent of Highways, Town of Bolivar Randy L. Snyder, Deputy Superintendent of Public Works, Village of Cuba Mike Bidwell, Superintendent, Town of Friendship Kevin Slack, Highway Superintendent, Town of Granger Kenny DeRitter, Councilman, Town of Grove Jon Gorton, Supervisor, Town of Grove Dennis Graves, Highway Superintendent, Town of Independence Chris Santangelo, Highway Superintendent, Town of New Hudson Glenn Nickerson, Jr., Highway Superintendent, Town of Scio Brent Platt, Supervisor, Town of West Almond Shawn Dunmire, Highway Superintendent, Town of Wirt Larry Kaminski, Mobility Management Planner, Ardent Solutions, Inc. Tony Subbio, Project Manager, Tetra Tech, Inc. Purpose The purpose of the meeting was to review the results of the risk assessment update. This was the second of two identical meetings held for this purpose. Discussion Points This section summarizes each discussion point addressed during the meeting. Review Risk Assessment Mr. Subbio reviewed the results of the risk assessment. He informed the attendees that the information presented during the meeting is a high-level overview, and that they could read the hazards profiles on the project website for the detailed analysis. He pointed out that expected impacts are based on Hazards U.S.—Multi-Hazard (HAZUS-MH)
Transcript of Allegany HMP - RA Mtgs PPT Materials/Allegany Co...Bill Begelow, Highway Superintendent, Town of...
MEETING NOTES
PAGE 1 OF 3
Meeting Allegany County Hazard Mitigation Plan (HMP) Planning Partnership Risk Assessment Meeting #2
Date July 28, 2016 Time 9:00 – 10:30 a.m. Location Allegany County Office of Emergency Services (OES)
Attendees
Karl Graves, Legislator, Allegany County Jeff Luckey, Director, Allegany County Office of Emergency Management and Fire Bonnie VanHousen, Allegany County OES Michelle Denhoff, Planning and Development Specialist, Allegany County Planning Department James VanDewalker, Clerk, Town of Allen Allan Hennard, Highway Superintendent, Town of Allen Bill Begelow, Highway Superintendent, Town of Amity Brad Schiralli, Superintendent of Highways, Town of Bolivar Randy L. Snyder, Deputy Superintendent of Public Works, Village of Cuba Mike Bidwell, Superintendent, Town of Friendship Kevin Slack, Highway Superintendent, Town of Granger Kenny DeRitter, Councilman, Town of Grove Jon Gorton, Supervisor, Town of Grove Dennis Graves, Highway Superintendent, Town of Independence Chris Santangelo, Highway Superintendent, Town of New Hudson Glenn Nickerson, Jr., Highway Superintendent, Town of Scio Brent Platt, Supervisor, Town of West Almond Shawn Dunmire, Highway Superintendent, Town of Wirt Larry Kaminski, Mobility Management Planner, Ardent Solutions, Inc. Tony Subbio, Project Manager, Tetra Tech, Inc.
Purpose The purpose of the meeting was to review the results of the risk assessment update. This was the second of two identical meetings held for this purpose.
Discussion Points This section summarizes each discussion point addressed during the meeting.
Review Risk Assessment Mr. Subbio reviewed the results of the risk assessment. He informed the attendees that the information presented during the meeting is a high-level overview, and that they could read the hazards profiles on the project website for the detailed analysis. He pointed out that expected impacts are based on Hazards U.S.—Multi-Hazard (HAZUS-MH)

MEETING NOTES
PAGE 2 OF 3
modeling, and may not reflect the County’s experience with hazard events. The results of the risk assessment are summarized below, according to each hazard:
• Dam Failure – There have been no reported dam failures in Allegany County. The County is home to two high-hazard dams: the Cuba Lake Dam and the Caneadea Dam that could cause catastrophic impacts if they were to fail.
• Drought – The County has been in drought conditions four times since 1988, and has experienced near-drought conditions another 20 times. Approximately $224,000 in crop damages have occurred since 1988. With 784 farms with over 150,000 acres of farmland throughout the County, droughts can have a significant financial impact on the County’s residents.
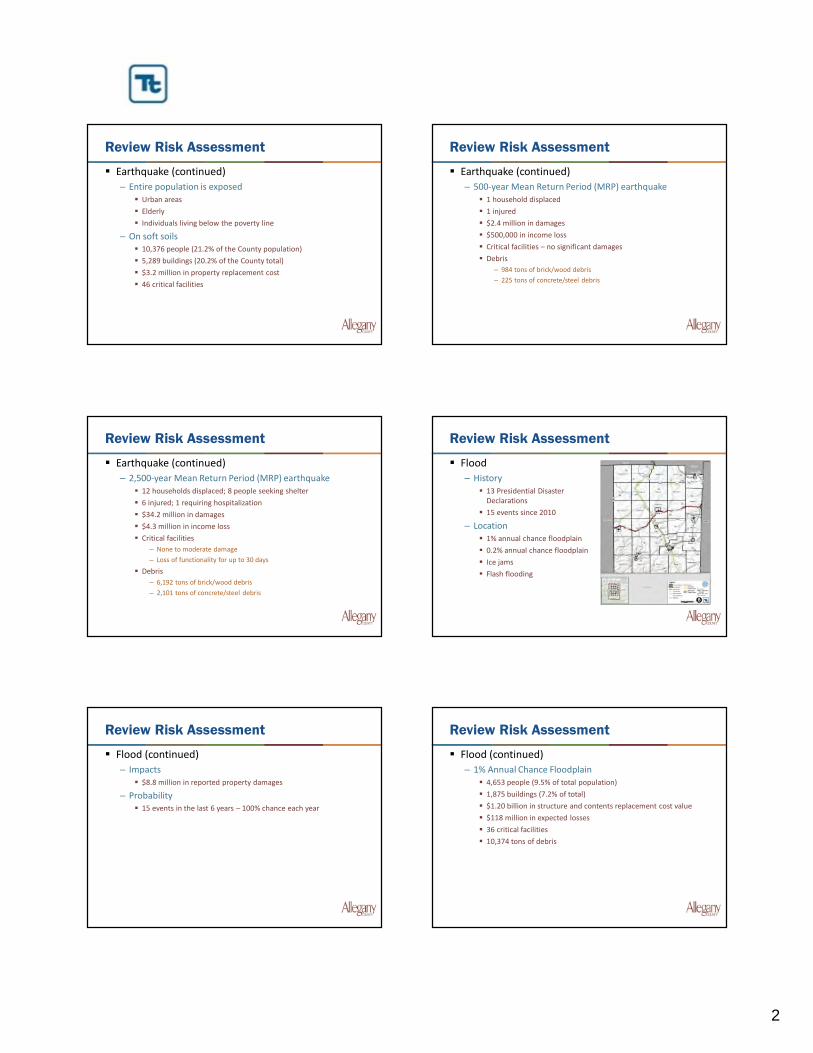
• Earthquake – There have been no earthquakes with an epicenter in the County since at least 1973, though earthquakes in 2010 and 2013 were felt in the County. Earthquake impacts have been relatively minor in the County. The 500-year Mean Return Period (MRP) earthquake would result in $2.4 million in damages and 1,200 tons of debris. No critical facilities would be seriously impacted. The 2,500-year MRP earthquake would displace 12 households, injure six people, cause $34.2 million in property damages and $4.3 million in income loss, and generate over 8,000 tons of debris.
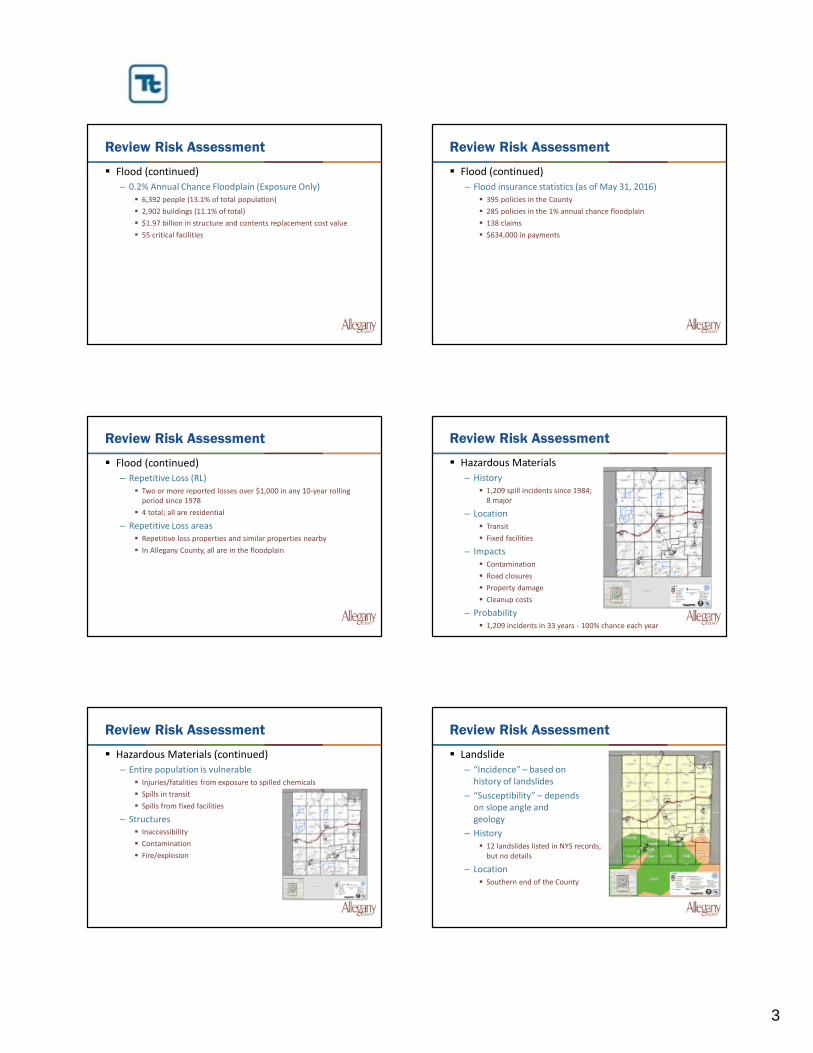
• Flood – The County has been under a Presidential Disaster Declaration 13 times for flood events; 15 significant floods have occurred since 2010 alone. The risk assessment analyzed the 1-percent annual chance flood and the 0.2-percent annual chance flood, though it only analyzed the population and property exposed to the 0.2-percent annual chance flood. The 1-percent annual chance flood would cause $118 million in property damages and generate over 10,000 tons of debris. As of May 2016, 395 flood insurance policies are in force in the County. Of those properties with flood insurance policies, 285 are in the 1-percent annual chance floodplain. There have been 138 flood insurance claims since 1978, with $634,000 in claims paid.
• Hazardous Materials – There have been over 1,200 hazardous materials releases since 1984, mostly small quantities of fuel from traffic accidents. Hazardous materials can be released from fixed facilities or in transit. The impacts from a release will depend on the chemical(s) released and the location of the release. The blue lines on the County map that indicate heavy truck traffic throughout the County will be reviewed for accuracy.
• Landslide – New York State records indicate that there have been 12 landslides reported in Allegany County. Exposed property value in high-risk areas is estimated to be $2.8 billion. Expected losses depend on the nature of the landslide.
• Levee Failure – There are three levee segments in the County, all in the Town or Village of Wellsville. Impacts of a levee failure would be equivalent to the impacts of a flood in the areas protected by the levees.
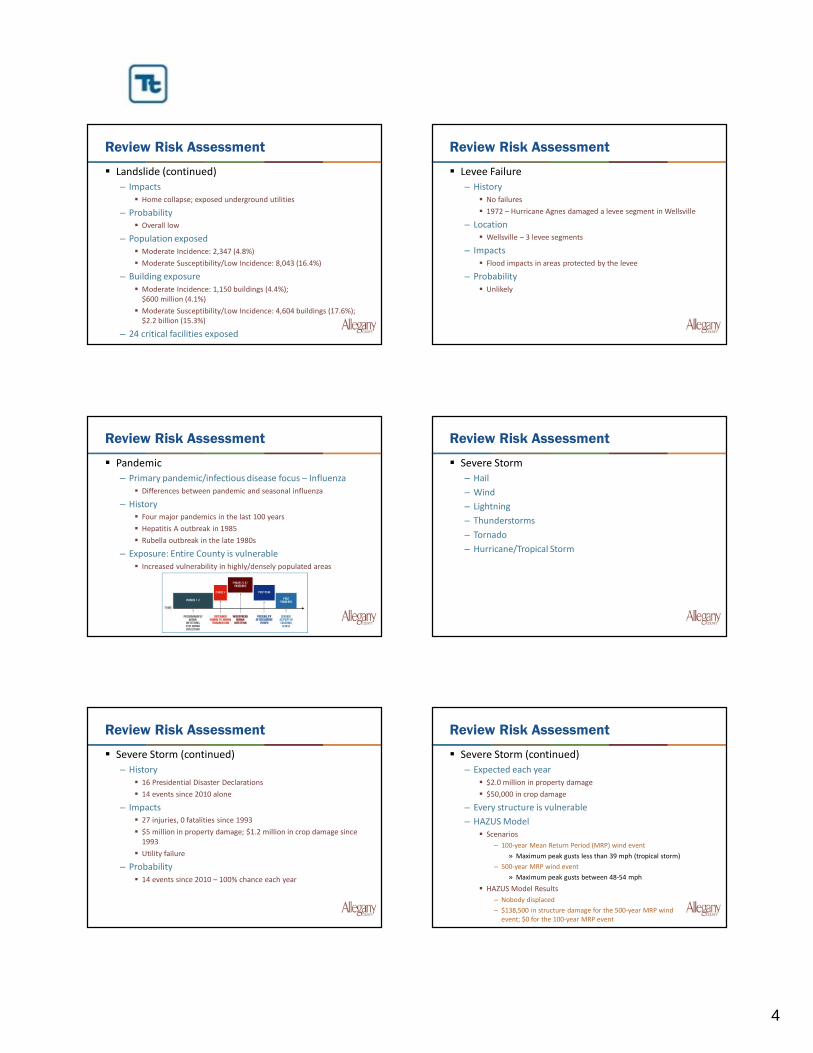
• Pandemic Disease – The County was affected by a Hepatitis A outbreak in 1985, a Rubella outbreak in the late 1980s, and the 2009 Novel Influenza A (H1N1) Pandemic. The County operated several points of dispensing (POD) during the 2009 pandemic. Areas of the County with dense development are more at risk than rural areas.
• Severe Storm – The County was declared a federal disaster area 16 times since 1954 due to severe storms, and has experienced 14 severe storm events since 2010. The 500-year MRP severe storm, a tropical storm, would cause $138,500 in damages.
• Severe Winter Storm – The County was declared a federal disaster area once since 1954 due to winter storms, and has experienced 68 major events since 1960. The entire population and all $9.3 billion in structure value throughout the County are vulnerable.
MEETING NOTES
PAGE 3 OF 3
• Terrorism – There is no history of terrorist events in Allegany County. Public facilities and critical infrastructure are potential targets of terrorists. All individuals and all structures could possibly be impacted by a terrorist event. Impacts will vary, depending on the time, location, and nature of an attack.
• Utility Failure – A total of 22 power outages were reported in the County since 1997, all due to other hazards. Impacts include failure of heating and air conditioning, communications failures, food spoilage, and basement flooding. The entire population is exposed to utility failures.
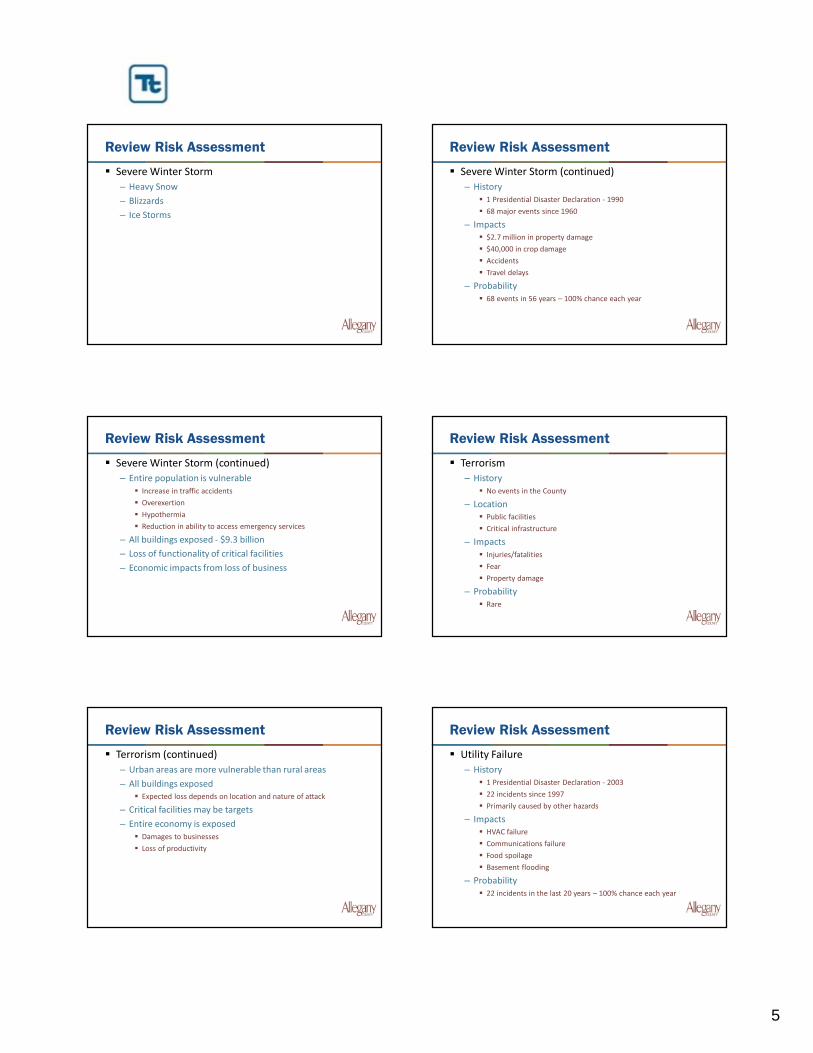
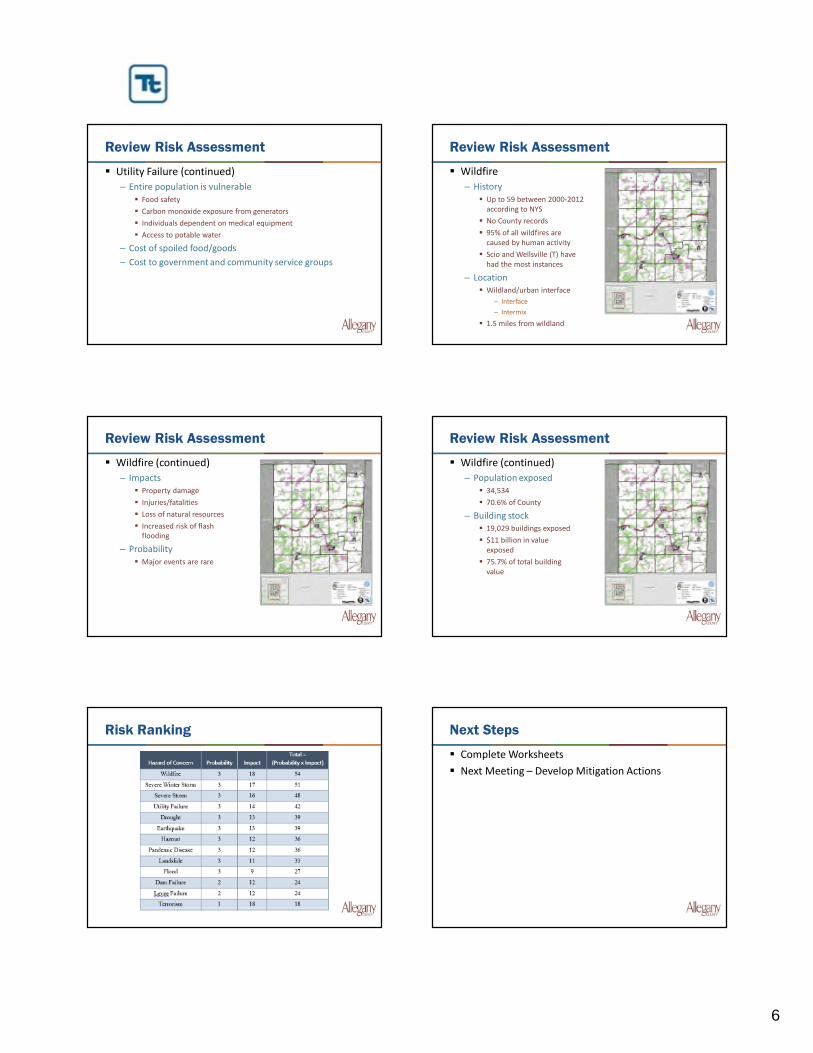
• Wildfire – Up to 59 wildfires have occurred in the County between 2000 and 2012, but the County has no record of any major wildfire events. Any property within 1.5 miles from a wildland (e.g., forest) is exposed to the wildfire hazard. Over 34,000 people and 19,000 buildings ($11 billion in structure and contents value) are in this area.
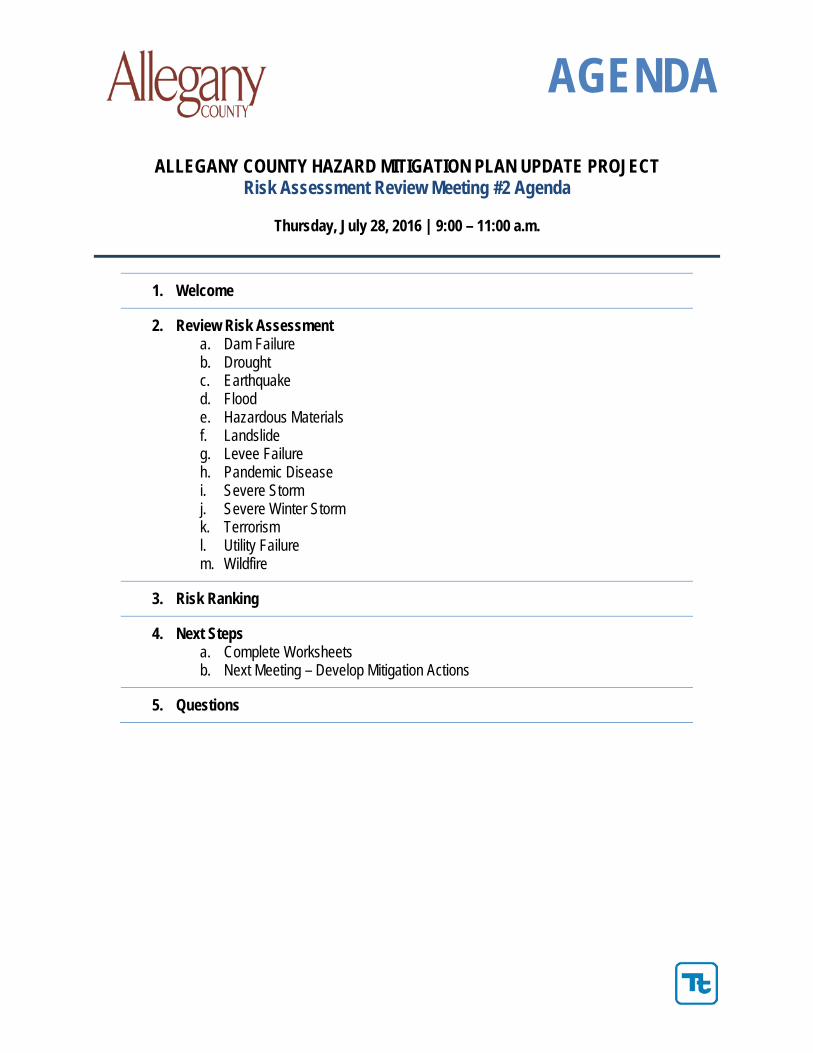
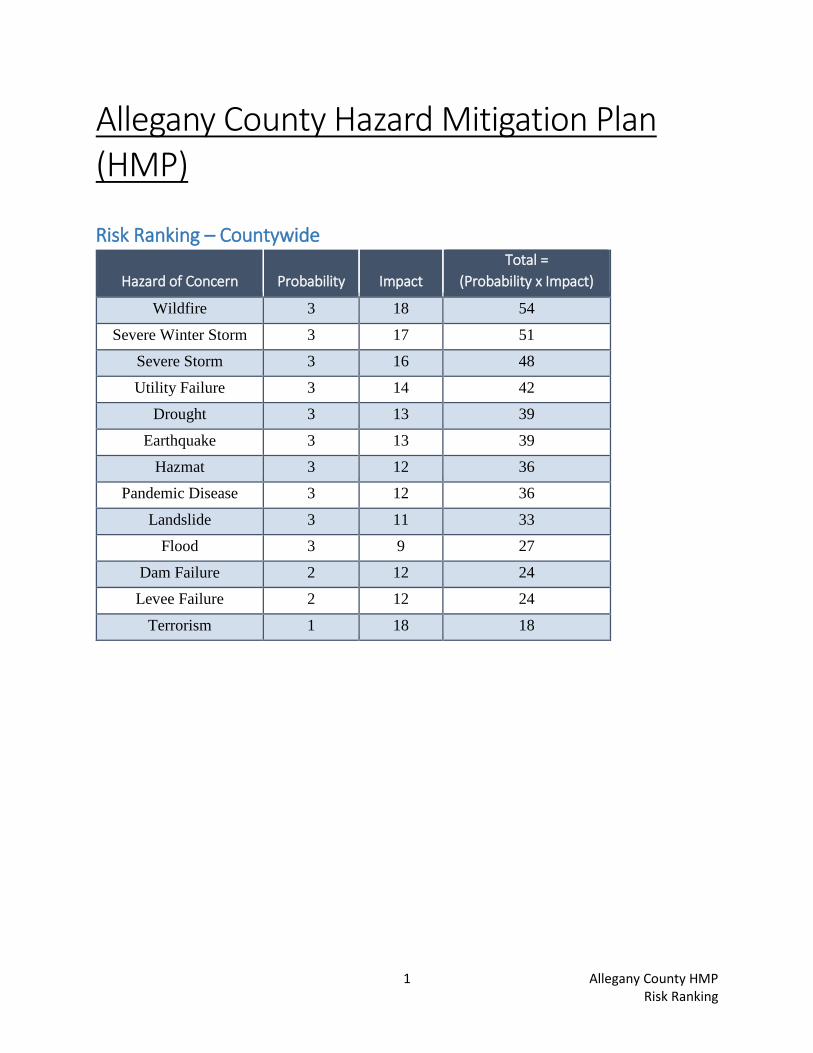
Risk Ranking Mr. Subbio reviewed the hazard ranking. Wildfire, Severe Winter Storm, and Severe Storm pose the most risk to the County. Dam Failure, Levee Failure, and Terrorism pose the least risk. Mr. Subbio described the ranking procedure used to rank the hazards. This process is detailed in Section 5.3 of the HMP.
Next Steps The following next steps were discussed at the meeting:
• Jurisdictions will complete the worksheets and send them to Mr. Luckey and Mr. Subbio. • The next meeting of the Planning Partnership, to identify mitigation actions to include in the updated HMP,
will be scheduled soon.
The meeting adjourned at 10:30 a.m.

1
Allegany CountyHazard Mitigation Plan Update
Risk AssessmentReview Meetings
Agenda
Welcome
Review Risk Assessment
Next Steps
Questions
Review Risk Assessment
Dam Failure
– History No records of dam failures
– Location 156 dams in the County
2 “high hazard”
– Impacts Cuba Lake Dam – catastrophic to
downstream communities
Caneadea Dam/Rushford Lake –90-foot wall of water; $20 million inexpected damages
– Probability - unlikely
Review Risk Assessment
Drought
– History 4 droughts since 1988
Near-drought conditions 20 more times since 1988
– Impacts Approximately $224,000 in crop damages since 1988
– Probability 4 in 29 years – 14% chance each year
Review Risk Assessment
Drought (continued)
– Entire population is vulnerable
– Reduction in firefighting capability
– No direct effects on structures; may increase vulnerabilityto wildfires
– Severe economic impacts on agriculture 784 farms
150,383 acres
Review Risk Assessment
Earthquake
– History None epi-centered in the County since 1973
Earthquakes in 2010 and 2013
may have been felt in the County.
– Location A few known fault lines in the County
– Impacts Shaking
Evacuated buildings
No damages so far
– Probability - unlikely
2
Review Risk Assessment
Earthquake (continued)
– Entire population is exposed Urban areas
Elderly
Individuals living below the poverty line
– On soft soils 10,376 people (21.2% of the County population)
5,289 buildings (20.2% of the County total)
$3.2 million in property replacement cost
46 critical facilities
Review Risk Assessment
Earthquake (continued)
– 500-year Mean Return Period (MRP) earthquake 1 household displaced
1 injured
$2.4 million in damages
$500,000 in income loss
Critical facilities – no significant damages
Debris
– 984 tons of brick/wood debris
– 225 tons of concrete/steel debris
Review Risk Assessment
Earthquake (continued)
– 2,500-year Mean Return Period (MRP) earthquake 12 households displaced; 8 people seeking shelter
6 injured; 1 requiring hospitalization
$34.2 million in damages
$4.3 million in income loss
Critical facilities
– None to moderate damage
– Loss of functionality for up to 30 days
Debris
– 6,192 tons of brick/wood debris
– 2,101 tons of concrete/steel debris
Review Risk Assessment
Flood
– History 13 Presidential Disaster
Declarations
15 events since 2010
– Location 1% annual chance floodplain
0.2% annual chance floodplain
Ice jams
Flash flooding
Review Risk Assessment
Flood (continued)
– Impacts $8.8 million in reported property damages
– Probability 15 events in the last 6 years – 100% chance each year
Review Risk Assessment
Flood (continued)
– 1% Annual Chance Floodplain 4,653 people (9.5% of total population)
1,875 buildings (7.2% of total)
$1.20 billion in structure and contents replacement cost value
$118 million in expected losses
36 critical facilities
10,374 tons of debris
3
Review Risk Assessment
Flood (continued)
– 0.2% Annual Chance Floodplain (Exposure Only) 6,392 people (13.1% of total population)
2,902 buildings (11.1% of total)
$1.97 billion in structure and contents replacement cost value
55 critical facilities
Review Risk Assessment
Flood (continued)
– Flood insurance statistics (as of May 31, 2016) 395 policies in the County
285 policies in the 1% annual chance floodplain
138 claims
$634,000 in payments
Review Risk Assessment
Flood (continued)
– Repetitive Loss (RL) Two or more reported losses over $1,000 in any 10-year rolling
period since 1978
4 total; all are residential
– Repetitive Loss areas Repetitive loss properties and similar properties nearby
In Allegany County, all are in the floodplain
Review Risk Assessment
Hazardous Materials
– History 1,209 spill incidents since 1984;
8 major
– Location Transit
Fixed facilities
– Impacts Contamination
Road closures
Property damage
Cleanup costs
– Probability 1,209 incidents in 33 years - 100% chance each year
Review Risk Assessment
Hazardous Materials (continued)
– Entire population is vulnerable Injuries/fatalities from exposure to spilled chemicals
Spills in transit
Spills from fixed facilities
– Structures Inaccessibility
Contamination
Fire/explosion
Review Risk Assessment
Landslide
– “Incidence” – based onhistory of landslides
– “Susceptibility” – dependson slope angle andgeology
– History 12 landslides listed in NYS records,
but no details
– Location Southern end of the County
4
Review Risk Assessment
Landslide (continued)
– Impacts Home collapse; exposed underground utilities
– Probability Overall low
– Population exposed Moderate Incidence: 2,347 (4.8%)
Moderate Susceptibility/Low Incidence: 8,043 (16.4%)
– Building exposure Moderate Incidence: 1,150 buildings (4.4%);
$600 million (4.1%)
Moderate Susceptibility/Low Incidence: 4,604 buildings (17.6%);$2.2 billion (15.3%)
– 24 critical facilities exposed
Review Risk Assessment
Levee Failure
– History No failures
1972 – Hurricane Agnes damaged a levee segment in Wellsville
– Location Wellsville – 3 levee segments
– Impacts Flood impacts in areas protected by the levee
– Probability Unlikely
Review Risk Assessment
Pandemic
– Primary pandemic/infectious disease focus – Influenza Differences between pandemic and seasonal influenza
– History Four major pandemics in the last 100 years
Hepatitis A outbreak in 1985
Rubella outbreak in the late 1980s
– Exposure: Entire County is vulnerable Increased vulnerability in highly/densely populated areas
Review Risk Assessment
Severe Storm
– Hail
– Wind
– Lightning
– Thunderstorms
– Tornado
– Hurricane/Tropical Storm
Review Risk Assessment
Severe Storm (continued)
– History 16 Presidential Disaster Declarations
14 events since 2010 alone
– Impacts 27 injuries, 0 fatalities since 1993
$5 million in property damage; $1.2 million in crop damage since1993
Utility failure
– Probability 14 events since 2010 – 100% chance each year
Review Risk Assessment
Severe Storm (continued)
– Expected each year $2.0 million in property damage
$50,000 in crop damage
– Every structure is vulnerable
– HAZUS Model Scenarios
– 100-year Mean Return Period (MRP) wind event
» Maximum peak gusts less than 39 mph (tropical storm)
– 500-year MRP wind event
» Maximum peak gusts between 48-54 mph
HAZUS Model Results
– Nobody displaced
– $138,500 in structure damage for the 500-year MRP windevent; $0 for the 100-year MRP event
5
Review Risk Assessment
Severe Winter Storm
– Heavy Snow
– Blizzards
– Ice Storms
Review Risk Assessment
Severe Winter Storm (continued)
– History 1 Presidential Disaster Declaration - 1990
68 major events since 1960
– Impacts $2.7 million in property damage
$40,000 in crop damage
Accidents
Travel delays
– Probability 68 events in 56 years – 100% chance each year
Review Risk Assessment
Severe Winter Storm (continued)
– Entire population is vulnerable Increase in traffic accidents
Overexertion
Hypothermia
Reduction in ability to access emergency services
– All buildings exposed - $9.3 billion
– Loss of functionality of critical facilities
– Economic impacts from loss of business
Review Risk Assessment
Terrorism
– History No events in the County
– Location Public facilities
Critical infrastructure
– Impacts Injuries/fatalities
Fear
Property damage
– Probability Rare
Review Risk Assessment
Terrorism (continued)
– Urban areas are more vulnerable than rural areas
– All buildings exposed Expected loss depends on location and nature of attack
– Critical facilities may be targets
– Entire economy is exposed Damages to businesses
Loss of productivity
Review Risk Assessment
Utility Failure
– History 1 Presidential Disaster Declaration - 2003
22 incidents since 1997
Primarily caused by other hazards
– Impacts HVAC failure
Communications failure
Food spoilage
Basement flooding
– Probability 22 incidents in the last 20 years – 100% chance each year
6
Review Risk Assessment
Utility Failure (continued)
– Entire population is vulnerable Food safety
Carbon monoxide exposure from generators
Individuals dependent on medical equipment
Access to potable water
– Cost of spoiled food/goods
– Cost to government and community service groups
Review Risk Assessment
Wildfire
– History Up to 59 between 2000-2012
according to NYS
No County records
95% of all wildfires arecaused by human activity
Scio and Wellsville (T) havehad the most instances
– Location Wildland/urban interface
– Interface
– Intermix
1.5 miles from wildland
Review Risk Assessment
Wildfire (continued)
– Impacts Property damage
Injuries/fatalities
Loss of natural resources
Increased risk of flashflooding
– Probability Major events are rare
Review Risk Assessment
Wildfire (continued)
– Population exposed 34,534
70.6% of County
– Building stock 19,029 buildings exposed
$11 billion in valueexposed
75.7% of total buildingvalue
Risk Ranking Next Steps
Complete Worksheets
Next Meeting – Develop Mitigation Actions

7
Questions?
Thank you for your time!
Contacts
Jeff Luckey
(585) 268-7658
Tony Subbio
(717) 545-3580
AGENDA
ALLEGANY COUNTY HAZARD MITIGATION PLAN UPDATE PROJECT Risk Assessment Review Meeting #2 Agenda
Thursday, July 28, 2016 | 9:00 – 11:00 a.m.
1. Welcome
2. Review Risk Assessment a. Dam Failure b. Drought c. Earthquake d. Flood e. Hazardous Materials f. Landslide g. Levee Failure h. Pandemic Disease i. Severe Storm j. Severe Winter Storm k. Terrorism l. Utility Failure m. Wildfire
3. Risk Ranking
4. Next Steps a. Complete Worksheets b. Next Meeting – Develop Mitigation Actions
5. Questions
1 Allegany County HMP Risk Ranking
Allegany County Hazard Mitigation Plan (HMP)
Risk Ranking – Countywide
Hazard of Concern Probability Impact Total =
(Probability x Impact)
Wildfire 3 18 54
Severe Winter Storm 3 17 51
Severe Storm 3 16 48
Utility Failure 3 14 42
Drought 3 13 39
Earthquake 3 13 39
Hazmat 3 12 36
Pandemic Disease 3 12 36
Landslide 3 11 33
Flood 3 9 27
Dam Failure 2 12 24
Levee Failure 2 12 24
Terrorism 1 18 18

2 Allegany County HMP Risk Ranking
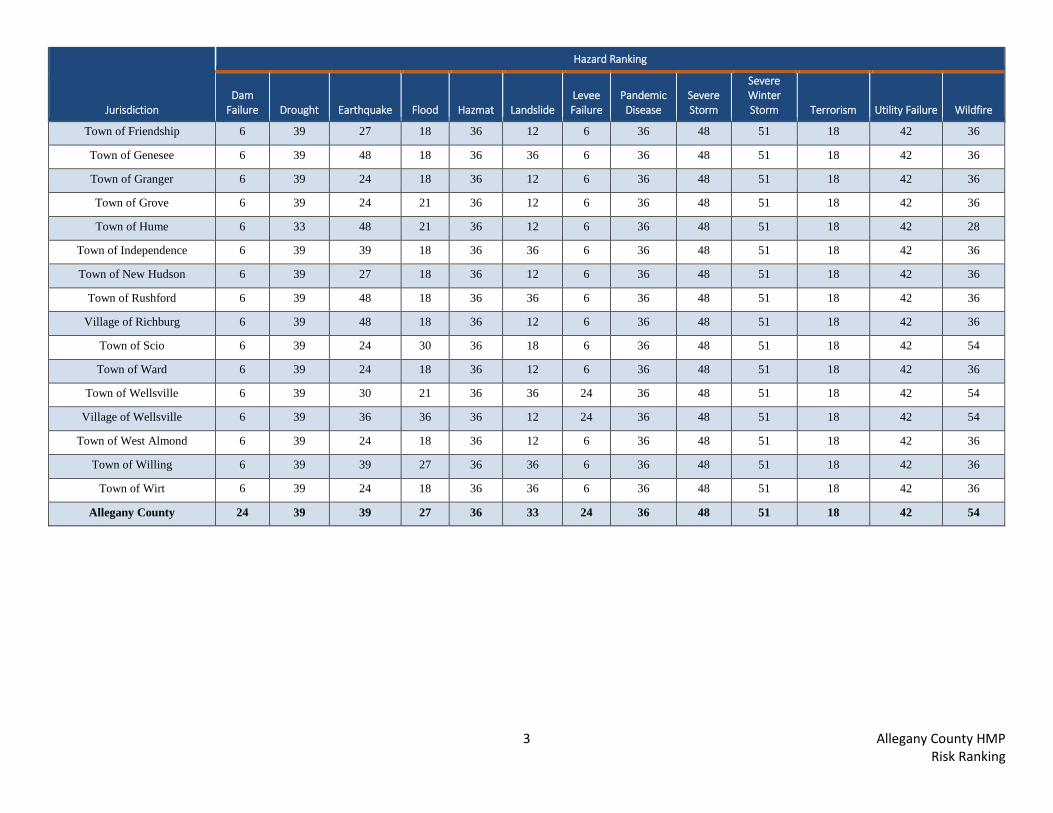
Risk Ranking – By Jurisdiction
Jurisdiction
Hazard Ranking
Dam Failure Drought Earthquake Flood Hazmat Landslide
Levee Failure
Pandemic Disease
Severe Storm
Severe Winter Storm Terrorism Utility Failure Wildfire
Town of Alfred 6 39 24 18 36 12 6 36 48 51 18 42 36
Village of Alfred 6 39 24 18 36 12 6 36 48 51 18 42 36
Town of Allen 6 39 24 18 36 12 6 36 48 51 18 42 36
Town of Alma 6 39 24 18 36 36 6 36 48 51 18 42 36
Town of Almond 6 39 24 27 36 12 6 36 48 51 18 42 36
Village of Almond 6 39 24 54 36 12 6 36 48 51 18 42 36
Town of Amity 6 39 39 27 36 12 6 36 48 51 18 42 36
Town of Andover 6 39 24 18 36 14 6 36 48 51 18 42 36
Village of Andover 6 39 24 54 36 12 6 36 48 51 18 42 36
Town of Angelica 6 39 27 18 36 12 6 36 48 51 18 42 36
Village of Angelica 6 39 33 18 36 12 6 36 48 51 18 42 36
Town of Belfast 6 39 48 18 36 12 6 36 48 51 18 42 36
Village of Belmont 6 39 24 18 36 12 6 36 48 51 18 42 36
Town of Birdsall 6 39 24 27 36 12 6 36 48 51 18 42 36
Town of Bolivar 6 39 33 18 36 36 6 36 48 51 18 42 36
Village of Bolivar 6 39 48 18 36 36 6 36 48 51 18 42 36
Town of Burns 6 39 39 18 36 12 6 36 48 51 18 42 36
Village of Canaseraga 6 39 48 27 36 12 6 36 48 51 18 42 36
Town of Caneadea 24 39 48 18 36 18 6 36 48 51 18 42 36
Town of Centerville 6 39 27 18 36 12 6 36 48 51 18 42 36
Town of Clarksville 6 39 24 18 36 36 6 36 48 51 18 42 36
Town of Cuba 24 39 27 18 36 12 6 36 48 51 18 42 36
Village of Cuba 6 39 24 18 36 12 6 36 48 51 18 42 36
3 Allegany County HMP Risk Ranking
Jurisdiction
Hazard Ranking
Dam Failure Drought Earthquake Flood Hazmat Landslide
Levee Failure
Pandemic Disease
Severe Storm
Severe Winter Storm Terrorism Utility Failure Wildfire
Town of Friendship 6 39 27 18 36 12 6 36 48 51 18 42 36
Town of Genesee 6 39 48 18 36 36 6 36 48 51 18 42 36
Town of Granger 6 39 24 18 36 12 6 36 48 51 18 42 36
Town of Grove 6 39 24 21 36 12 6 36 48 51 18 42 36
Town of Hume 6 33 48 21 36 12 6 36 48 51 18 42 28
Town of Independence 6 39 39 18 36 36 6 36 48 51 18 42 36
Town of New Hudson 6 39 27 18 36 12 6 36 48 51 18 42 36
Town of Rushford 6 39 48 18 36 36 6 36 48 51 18 42 36
Village of Richburg 6 39 48 18 36 12 6 36 48 51 18 42 36
Town of Scio 6 39 24 30 36 18 6 36 48 51 18 42 54
Town of Ward 6 39 24 18 36 12 6 36 48 51 18 42 36
Town of Wellsville 6 39 30 21 36 36 24 36 48 51 18 42 54
Village of Wellsville 6 39 36 36 36 12 24 36 48 51 18 42 54
Town of West Almond 6 39 24 18 36 12 6 36 48 51 18 42 36
Town of Willing 6 39 39 27 36 36 6 36 48 51 18 42 36
Town of Wirt 6 39 24 18 36 36 6 36 48 51 18 42 36
Allegany County 24 39 39 27 36 33 24 36 48 51 18 42 54